the box office2015 - homepage | bfi · the box office2015. ... fury road, spooks: the greater good,...
TRANSCRIPT
Image: SPECTRE © SPECTRE2015 Metro-Goldwyn-Mayer Studios Inc., Danjaq, LLC and Columbia Pictures Industries, Inc. All rights reserved.
BFI R
ES
EA
RC
H A
ND
STA
TIS
TIC
S P
UB
LISH
ED
AP
RIL 2016
THE BOX OFFICE 2015

THE BOX OFFICE 2015UK box office revenues for 2015 exceeded £1.2 billion, the highest total ever recorded, while annual admissions reached 171.9 million, the third highest total of the past decade.
FACTS IN FOCUS UK box office receipts in 2015 were £1,236 million, up 17% on 2014.
UK cinema admissions reached 171.9 million, up 9% on 2014.
A total of 759 films were released in the UK and Republic of Ireland.
UK films, including co-productions, accounted for 28% of releases and around 45% of the market by value.
The box office share of UK independent films was 10.5%, down from 16% in 2014.
The top 100 films earned almost 93% of the gross box office, the highest share since 2008.
A total of 34 3D films were released in 2015, down from 57 in 2014; their 3D takings accounted for 11% of UK and Republic of Ireland box office revenues, down from 12% in 2014.
Sixteen films were released in the 3D IMAX format, grossing £31 million, 2% of total box office.
UK films made with the backing of major US studios spent longer than other films, on average, in UK cinemas in 2015.
BF
I Sta
tistica
l Ye
arb
oo
k 20
16
3
TH
E B
OX
OFFIC
E 2
015
UK CINEMA ADMISSIONS
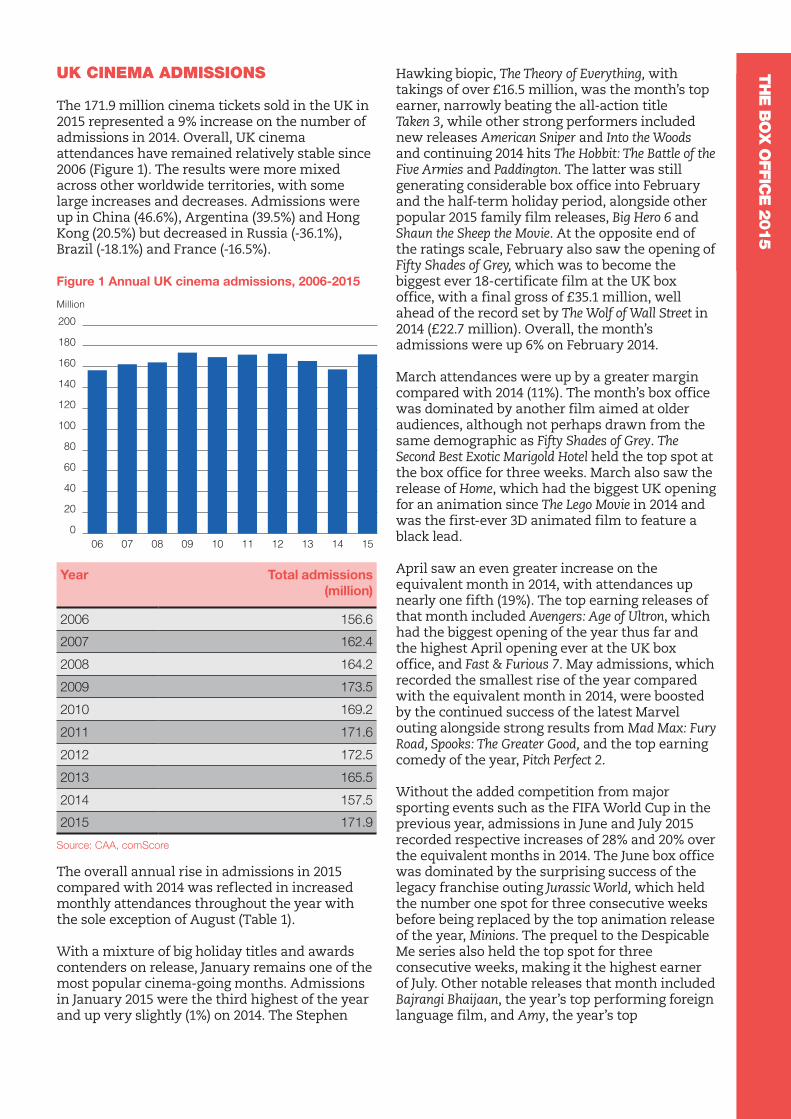
The 171.9 million cinema tickets sold in the UK in 2015 represented a 9% increase on the number of admissions in 2014. Overall, UK cinema attendances have remained relatively stable since 2006 (Figure 1). The results were more mixed across other worldwide territories, with some large increases and decreases. Admissions were up in China (46.6%), Argentina (39.5%) and Hong Kong (20.5%) but decreased in Russia (-36.1%), Brazil (-18.1%) and France (-16.5%).
Figure 1 Annual UK cinema admissions, 2006-2015
Year Total admissions (million)
2006 156.6
2007 162.4
2008 164.2
2009 173.5
2010 169.2
2011 171.6
2012 172.5
2013 165.5
2014 157.5
2015 171.9
Source: CAA, comScore
The overall annual rise in admissions in 2015 compared with 2014 was reflected in increased monthly attendances throughout the year with the sole exception of August (Table 1).
With a mixture of big holiday titles and awards contenders on release, January remains one of the most popular cinema-going months. Admissions in January 2015 were the third highest of the year and up very slightly (1%) on 2014. The Stephen
Hawking biopic, The Theory of Everything, with takings of over £16.5 million, was the month’s top earner, narrowly beating the all-action title Taken 3, while other strong performers included new releases American Sniper and Into the Woods and continuing 2014 hits The Hobbit: The Battle of the Five Armies and Paddington. The latter was still generating considerable box office into February and the half-term holiday period, alongside other popular 2015 family film releases, Big Hero 6 and Shaun the Sheep the Movie. At the opposite end of the ratings scale, February also saw the opening of Fifty Shades of Grey, which was to become the biggest ever 18-certificate film at the UK box office, with a final gross of £35.1 million, well ahead of the record set by The Wolf of Wall Street in 2014 (£22.7 million). Overall, the month’s admissions were up 6% on February 2014.
March attendances were up by a greater margin compared with 2014 (11%). The month’s box office was dominated by another film aimed at older audiences, although not perhaps drawn from the same demographic as Fifty Shades of Grey. The Second Best Exotic Marigold Hotel held the top spot at the box office for three weeks. March also saw the release of Home, which had the biggest UK opening for an animation since The Lego Movie in 2014 and was the first-ever 3D animated film to feature a black lead.
April saw an even greater increase on the equivalent month in 2014, with attendances up nearly one fifth (19%). The top earning releases of that month included Avengers: Age of Ultron, which had the biggest opening of the year thus far and the highest April opening ever at the UK box office, and Fast & Furious 7. May admissions, which recorded the smallest rise of the year compared with the equivalent month in 2014, were boosted by the continued success of the latest Marvel outing alongside strong results from Mad Max: Fury Road, Spooks: The Greater Good, and the top earning comedy of the year, Pitch Perfect 2.
Without the added competition from major sporting events such as the FIFA World Cup in the previous year, admissions in June and July 2015 recorded respective increases of 28% and 20% over the equivalent months in 2014. The June box office was dominated by the surprising success of the legacy franchise outing Jurassic World, which held the number one spot for three consecutive weeks before being replaced by the top animation release of the year, Minions. The prequel to the Despicable Me series also held the top spot for three consecutive weeks, making it the highest earner of July. Other notable releases that month included Bajrangi Bhaijaan, the year’s top performing foreign language film, and Amy, the year’s top
Million
0
20
40
60
80
100
120
140
160
180
200
15141312111009080706

BF
I S
tati
stic
al
Ye
arb
oo
k 2
01
6
4
TH
E B
OX
OFF
ICE 2
015 documentary and currently the all-time fourth
highest grossing factual feature at the UK box office.
The only month to record a drop in attendances compared to its equivalent in 2014 was August, whose top earning films Fantastic Four, Mission: Impossibl e – Rogue Nation and Pixels failed to match the performance of the previous year’s top August titles, Guardians of the Galaxy, The Inbetweeners 2 and Dawn of the Planet of the Apes.
September had the lowest monthly admissions for the fourth year in a row. However, attendances were up 9% on the same month in 2014 in part due to strong performances by UK releases Legend and Everest. Legend was to become the year’s top UK independent film with a final box office gross of £18.4 million.
The top spot at the box office in October was also dominated by UK qualifying films, with The Martian and SPECTRE holding the number one ranking for three out of four weekends. The latest James Bond outing broke UK box office records with an opening take of £41.3 million (albeit over seven days), the largest ever opening for a film in the UK. Its release, on 651 sites, was the second of the year to break the record for widest ever UK release following Jurassic World (619) in June. October also saw the release of the award-winning independent UK film, Suffragette, one of the few films of the year to be both written and directed by women.
SPECTRE continued to head the weekend charts for two weeks in November before losing the top spot for the remainder of the month to The Hunger Games: Mockingjay – Part 2, the year’s top release by an independent distributor. Thanks to the boost from other strong performers such as The Good Dinosaur and Bridge of Spies, November recorded the second biggest rise in admissions of the year, with an increase of over one fifth (21%) on the same month in 2014.
UK box office records were smashed again in December, which saw the eagerly anticipated release of Star Wars: The Force Awakens. Now the all-time highest earning film at the UK box office, the sci-fi saga replaced SPECTRE as the UK’s widest-ever release (676 sites), its Thursday opening generated the biggest ever one-day take at the UK box office (£9.7 million) and its three-day opening weekend generated the UK’s biggest-ever Friday-Sunday gross (£24.2 million). Overall, December admissions were the highest of the year and 8% up on December 2014.
Table 1 Monthly UK cinema admissions, 2014 and 2015
Month 2014 (million)
2015 (million)
% +/- on 2014
January 15.2 15.4 1.3
February 14.3 15.2 5.8
March 10.4 11.5 11.4
April 12.7 15.1 19.3
May 12.6 12.7 0.5
June 10.4 13.3 27.5
July 13.3 15.9 19.5
August 17.1 14.4 -15.8
September 8.5 9.2 8.5
October 13.3 15.4 16.1
November 12.7 15.4 21.4
December 17.1 18.5 8.0
Total 157.5 171.9 9.2
Source: CAA, comScore Note: Figures may not sum to totals due to rounding
Average weekly admissions in 2015 ranged from 2.2 million in September to 4.2 million in December (Table 2). Because of the low cinema attendances in June 2014 due to the FIFA World Cup, the largest increase in weekly admissions occurred in June, up from 2.4 million to 3.1 million, while August saw the only year-on-year decrease, down from 3.9 million to 3.2 million.

BF
I Sta
tistica
l Ye
arb
oo
k 20
16
5
TH
E B
OX
OFFIC
E 2
015
Table 2 Average weekly admissions, 2014 and 2015
Month 2014 (million)
2015 (million)
January 3.4 3.5
February 3.6 3.8
March 2.3 2.6
April 3.0 3.5
May 2.9 2.9
June 2.4 3.1
July 3.0 3.6
August 3.9 3.2
September 2.0 2.2
October 3.0 3.5
November 3.0 3.6
December 3.9 4.2
Source: CAA, comScore
Table 3 shows how the 2015 admissions break down by the television advertising regions used by the Incorporated Society of British Advertisers (ISBA), with London accounting for 25% of UK admissions and the Midlands accounting for 14%. The Border region had the lowest number of admissions, accounting for just under 1% of attendances. The pattern of national and regional admissions has remained largely unchanged over the last decade.
Table 3 Cinema admissions by ISBA TV region, 2015
Region Admissions (million)
%
London 43.1 25.1
Midlands 24.3 14.2
Lancashire 16.6 9.7
Southern 16.2 9.4
Yorkshire 13.7 8.0
East of England 12.4 7.2
Wales and West 12.4 7.2
Central Scotland 11.2 6.5
North East 6.6 3.8
Northern Ireland 5.8 3.4
South West 4.5 2.6
Northern Scotland 3.7 2.2
Border 1.3 0.8
Total 171.9 100.0
Source: CAA, comScore Note: Figures/percentages may not sum to totals due to rounding.
Figure 2 puts UK admissions in a longer term perspective. Along with the USA and other western European countries, cinema-going in the UK declined sharply in the post-war era as incomes rose and new leisure activities became available. The largest competition came from the growth of television which allowed audiences to satisfy their appetite for screen entertainment in the comfort of their own homes. As cinema admissions fell so did the supply of screens, which led to further falling demand and more cinema closures. By the 1980s the number and quality of the remaining cinemas were at an all time low. The introduction of the VCR in the same decade had a further negative impact on admissions and the nadir was reached in 1984 with cinema-going down to an average of one visit per person per year. However, the introduction of multiplex cinemas to the UK from 1985 onwards reversed the trend and ushered in a new period of growth which saw admissions returning to levels last seen in the early 1970s.
Admissions in 2015 were the third highest of the last decade but since the early 2000s the trend has been fairly flat, with most years’ admissions being in the range 165-170 million.

BF
I S
tati
stic
al
Ye
arb
oo
k 2
01
6
6
TH
E B
OX
OFF
ICE 2
015 Figure 2 Annual UK admissions, 1935-2015
Year Admissions (million)
Year Admissions (million)
Year Admissions (million)
1935 912.3 1962 395.0 1989 94.51936 917.0 1963 357.2 1990 97.41937 946.0 1964 342.8 1991 100.31938 987.0 1965 326.6 1992 103.61939 990.0 1966 288.8 1993 114.41940 1,027.0 1967 264.8 1994 123.51941 1,309.0 1968 237.3 1995 114.61942 1,494.0 1969 214.9 1996 123.51943 1,541.0 1970 193.0 1997 138.91944 1,575.0 1971 176.0 1998 135.21945 1,585.0 1972 156.6 1999 139.11946 1,635.0 1973 134.2 2000 142.51947 1,462.0 1974 138.5 2001 155.91948 1,514.0 1975 116.3 2002 175.91949 1,430.0 1976 103.9 2003 167.31950 1,395.8 1977 103.5 2004 171.31951 1,365.0 1978 126.1 2005 164.71952 1,312.1 1979 111.9 2006 156.61953 1,284.5 1980 101.0 2007 162.41954 1,275.8 1981 86.0 2008 164.21955 1,181.8 1982 64.0 2009 173.51956 1,100.8 1983 65.7 2010 169.21957 915.2 1984 54.0 2011 171.61958 754.7 1985 72.0 2012 172.51959 581.0 1986 75.5 2013 165.51960 500.8 1987 78.5 2014 157.51961 449.1 1988 84.0 2015 171.9
Source: BFI, CAA, comScore
Million
0
200
400
600
800
1,000
1,200
1,400
1,600
1,800
20152010200520001995199019851980197519701965196019551950194519401935

BF
I Sta
tistica
l Ye
arb
oo
k 20
16
7
TH
E B
OX
OFFIC
E 2
015
UK BOX OFFICE EARNINGS
According to comScore, the total UK box office for 2015 was £1,236 million, the highest figure since our records began, and up 17% on 2014 (Table 4). This figure covers all box office earnings during the calendar year 2015 for films exhibited in the UK whose box office takings were tracked by comScore. Since 2006 there has been an upward trend in UK box office earnings; the overall gross for 2015 was 62% higher than in 2006.
Table 4 UK box office trends, 2006-2015 Year Box office
gross (£ million)
% +/- Change since
2006 %
2006 762 – –
2007 821 7.7 7.7
2008 850 3.5 11.5
2009 944 11.1 23.9
2010 988 4.7 29.7
2011 1,040 5.3 36.5
2012 1,099 5.7 44.2
2013 1,083 -1.0 42.1
2014 1,058 -2.3 38.8
2015 1,236 16.8 62.1
Source: CAA, Rentrak
FILM RELEASES AND BOX OFFICE REVENUES IN THE UK AND REPUBLIC OF IRELAND
In 2015, 759 films (an average of almost 15 per week) were released for a week or more in the UK and Republic of Ireland, 47 more than in 2014.
The 759 releases in 2015 generated £1,298 million in box office revenues, an increase of 20% on 2014. This figure differs from the £1,236 million in the section on UK box office earnings because it includes revenues generated in 2016 by films released in 2015 and covers the Republic of Ireland as well as the UK, which distributors usually treat as a single distribution territory. The subsequent analysis in this chapter includes all titles released in 2015 and includes revenues generated up to 21 February 2016.
As can be seen in Table 5, the top 100 films took 93% of the box office, the highest share of the period 2008-2015. The remaining 659 films (87% of all releases) accounted for just 7% of gross revenues. A total of 34 films were released in the 3D format, substantially down from 57 in 2014. The 3D takings from these releases (£137 million) accounted for 11% of the total box office in 2015 compared with 12% (£133 million) in 2014. Sixteen films were released in 3D IMAX in 2015, generating a gross of £31 million (just over 2% of overall box office).
Table 5 Summary of results at the UK and Republic of Ireland box office, 2008–2015
2008 2009 2010 2011 2012 2013 2014 2015
Releases 527 503 557 558 647 698 712 759
Combined gross (£ million) 934.5 1,126.7 1,023.6 1,134.5 1,182.4 1,153.7 1,077.8 1,298.4
Top 20 films (% of box office) 49.6 48.6 48.2 47.5 54.8 47.8 47.4 57.4
Top 50 films (% of box office) 72.4 72.9 71.9 73.7 77.3 73.7 74.1 81.4
Top 100 films (% of box office) 90.3 91.1 89.7 90.7 92.1 91.0 90.4 93.0
Source: Rentrak, BFI RSU analysis Note: Table 5 and all subsequent analysis of the theatrical market includes all titles released in 2015. The combined gross reflects the territorial gross (ie including the Republic of Ireland), and includes those titles released in 2015 but also generating revenue into 2016, up to and including 21 February 2016.

BF
I S
tati
stic
al
Ye
arb
oo
k 2
01
6
8
TH
E B
OX
OFF
ICE 2
015 As Figure 3 shows, the market share of the top 50
highest grossing films has been relatively stable since 2006, taking on average 74% of box office revenues. However, in 2012 and 2015 the box office share of the top 50 films reached 77% and 81% respectively, mainly due to the success of some very high earning films in those years such as Skyfall (£103 million) and The Dark Knight Rises (£56 million) in 2012 and Star Wars: The Force Awakens (£122 million) and SPECTRE (£95 million) in 2015. At 57%, the box office share of the top 20 films in 2015 was the highest of the period, while the share of films outside the top 100, at 7%, was the lowest.
Figure 3 Market share of top 20, 21-50, 51-100 and rest of films, 2006-2015
% share of top 20
47.9 51.1 49.6 49.1 48.2 47.5 54.8 48.0 47.4 57.4
% share of 21-50
23.0 24.5 22.7 24.0 23.7 26.2 22.5 26.0 26.7 24.0
% share of 51-100
17.6 15.2 17.9 18.1 17.7 17.0 14.8 17.0 16.3 11.6
% share of rest
11.5 9.2 9.7 8.8 10.3 9.3 7.9 9.0 9.6 7.0
Source: comScore, BFI RSU analysis Note: Percentages may not sum to 100 due to rounding.
Figure 4 shows box office revenue in the UK and Republic of Ireland over the last 10 years. The total box office generated in 2015 was the highest recorded over the period, and was up 52% compared with 2006. The takings of the top 20 film releases, also the highest of the period at £746 million, were up 46% compared with 2014, and up 83% on 2006. The films ranked 21-50 earned £312 million in 2015, an increase on 2014’s total and up 59% since 2006, while those ranked 51-100 earned £150 million, a decrease on the preceding year and the lowest figure since 2007.
The combined box office of all films outside the top 100 was £91 million in 2015, the same low figure as 2008. In that year, the £91 million taken
by films outside the top 100 was shared by 427 individual titles, giving a median box office of £39,017. In 2015, the £91 million taken by films outside the top 100 was shared by 659 titles, giving a median box office of £19,743. This highlights the increasing difficulties faced by independent distributors who are competing for a small market share but also shows their success in achieving theatrical releases for more independent films than in recent years. As Figures 3 and 4 show, while there are variations in the actual takings and box office share for all films outside the top 100, the majority of releases are competing for a seemingly smaller share of the box office.
Figure 4 Gross box office of top 20, 21-50, 51-100 and rest of films, 2006-2015
Gross box office of top 20
408 480 465 559 495 539 648 551 511 746
Gross box office of 21-50
196 230 213 274 243 297 267 299 288 312
Gross box office of 51-100
150 142 168 206 182 193 175 199 176 150
Gross box office of rest
98 86 91 101 106 106 93 104 103 91
Source: comScore, BFI RSU analysis
Table 6 outlines the number of films released in the UK in 2015 by the number of sites at the widest point of release (WPR). A total of 192 releases were shown at 100 sites or more (25% of all films released), while 279 films were shown at fewer than 10 sites (37%). Three quarters of all films released in the UK in 2015 were shown at fewer than 100 sites.
%
0
10
20
30
40
50
60
70
80
90
100
151413121110090807060
200
400
600
800
1,000
1,200
1,400
15141312111009080706
£ million
BF
I Sta
tistica
l Ye
arb
oo
k 20
16
9
TH
E B
OX
OFFIC
E 2
015
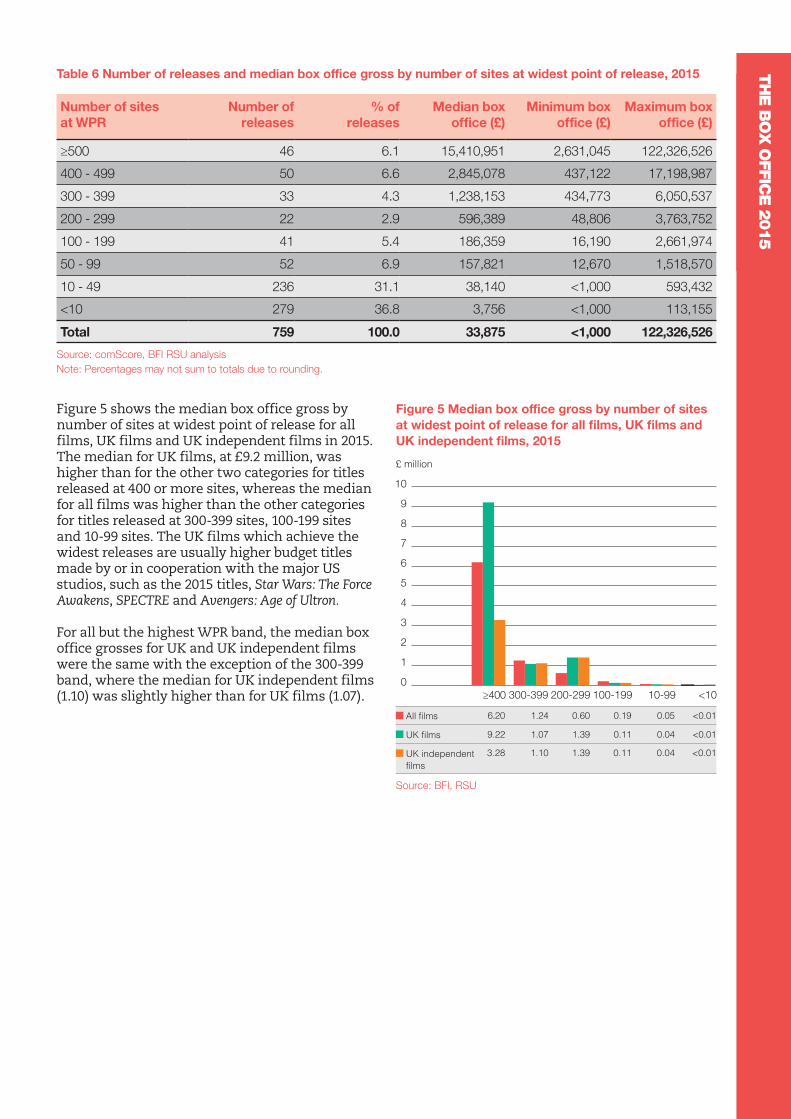
Table 6 Number of releases and median box office gross by number of sites at widest point of release, 2015
Number of sites at WPR
Number of releases
% of releases
Median box office (£)
Minimum box office (£)
Maximum box office (£)
≥500 46 6.1 15,410,951 2,631,045 122,326,526
400 - 499 50 6.6 2,845,078 437,122 17,198,987
300 - 399 33 4.3 1,238,153 434,773 6,050,537
200 - 299 22 2.9 596,389 48,806 3,763,752
100 - 199 41 5.4 186,359 16,190 2,661,974
50 - 99 52 6.9 157,821 12,670 1,518,570
10 - 49 236 31.1 38,140 <1,000 593,432
<10 279 36.8 3,756 <1,000 113,155
Total 759 100.0 33,875 <1,000 122,326,526
Source: comScore, BFI RSU analysis Note: Percentages may not sum to totals due to rounding.
Figure 5 shows the median box office gross by number of sites at widest point of release for all films, UK films and UK independent films in 2015. The median for UK films, at £9.2 million, was higher than for the other two categories for titles released at 400 or more sites, whereas the median for all films was higher than the other categories for titles released at 300-399 sites, 100-199 sites and 10-99 sites. The UK films which achieve the widest releases are usually higher budget titles made by or in cooperation with the major US studios, such as the 2015 titles, Star Wars: The Force Awakens, SPECTRE and Avengers: Age of Ultron.
For all but the highest WPR band, the median box office grosses for UK and UK independent films were the same with the exception of the 300-399 band, where the median for UK independent films (1.10) was slightly higher than for UK films (1.07).
Figure 5 Median box office gross by number of sites at widest point of release for all films, UK films and UK independent films, 2015
All films 6.20 1.24 0.60 0.19 0.05 <0.01
UK films 9.22 1.07 1.39 0.11 0.04 <0.01
UK independent films
3.28 1.10 1.39 0.11 0.04 <0.01
Source: BFI, RSU
£ million
0
1
2
3
4
5
6
7
8
9
10
<1010-99100-199200-299300-399≥400
BF
I S
tati
stic
al
Ye
arb
oo
k 2
01
6
10
TH
E B
OX
OFF
ICE 2
015 COUNTRY OF ORIGIN OF FILM RELEASES
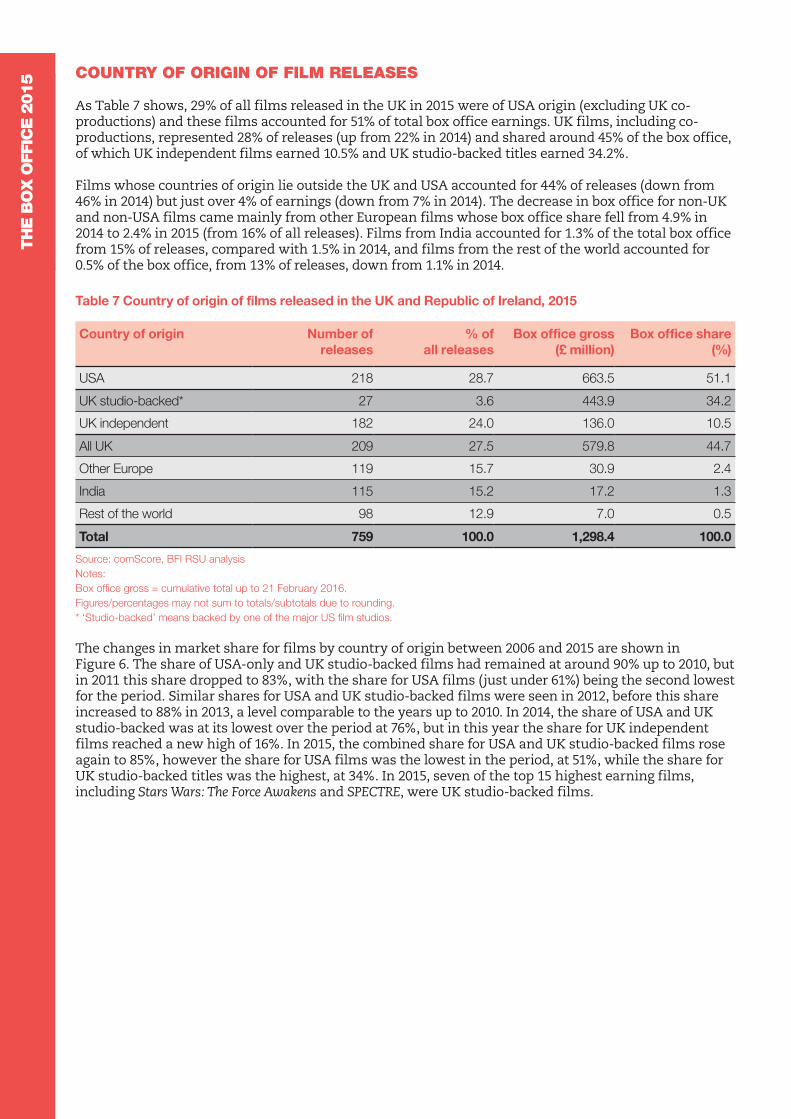
As Table 7 shows, 29% of all films released in the UK in 2015 were of USA origin (excluding UK co-productions) and these films accounted for 51% of total box office earnings. UK films, including co-productions, represented 28% of releases (up from 22% in 2014) and shared around 45% of the box office, of which UK independent films earned 10.5% and UK studio-backed titles earned 34.2%.
Films whose countries of origin lie outside the UK and USA accounted for 44% of releases (down from 46% in 2014) but just over 4% of earnings (down from 7% in 2014). The decrease in box office for non-UK and non-USA films came mainly from other European films whose box office share fell from 4.9% in 2014 to 2.4% in 2015 (from 16% of all releases). Films from India accounted for 1.3% of the total box office from 15% of releases, compared with 1.5% in 2014, and films from the rest of the world accounted for 0.5% of the box office, from 13% of releases, down from 1.1% in 2014.
Table 7 Country of origin of films released in the UK and Republic of Ireland, 2015
Country of origin Number of releases
% of all releases
Box office gross (£ million)
Box office share (%)
USA 218 28.7 663.5 51.1
UK studio-backed* 27 3.6 443.9 34.2
UK independent 182 24.0 136.0 10.5
All UK 209 27.5 579.8 44.7
Other Europe 119 15.7 30.9 2.4
India 115 15.2 17.2 1.3
Rest of the world 98 12.9 7.0 0.5
Total 759 100.0 1,298.4 100.0
Source: comScore, BFI RSU analysis Notes: Box office gross = cumulative total up to 21 February 2016. Figures/percentages may not sum to totals/subtotals due to rounding. * ‘Studio-backed’ means backed by one of the major US film studios.
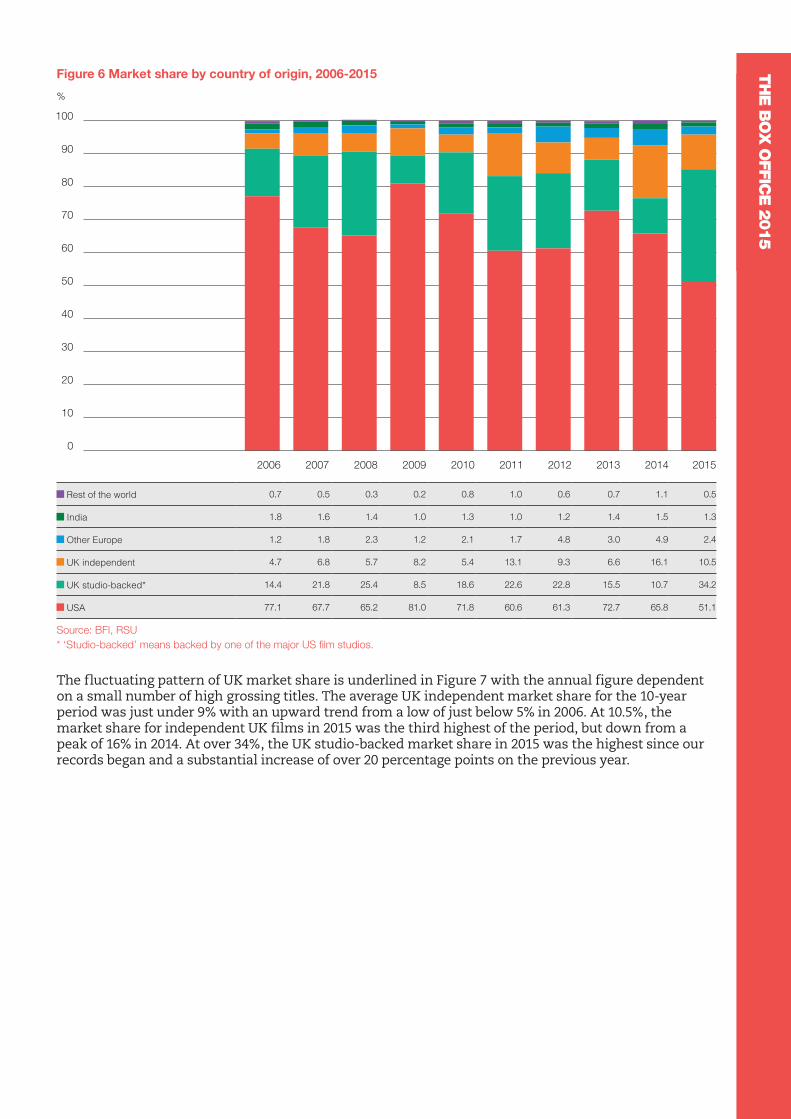
The changes in market share for films by country of origin between 2006 and 2015 are shown in Figure 6. The share of USA-only and UK studio-backed films had remained at around 90% up to 2010, but in 2011 this share dropped to 83%, with the share for USA films (just under 61%) being the second lowest for the period. Similar shares for USA and UK studio-backed films were seen in 2012, before this share increased to 88% in 2013, a level comparable to the years up to 2010. In 2014, the share of USA and UK studio-backed was at its lowest over the period at 76%, but in this year the share for UK independent films reached a new high of 16%. In 2015, the combined share for USA and UK studio-backed films rose again to 85%, however the share for USA films was the lowest in the period, at 51%, while the share for UK studio-backed titles was the highest, at 34%. In 2015, seven of the top 15 highest earning films, including Stars Wars: The Force Awakens and SPECTRE, were UK studio-backed films.
BF
I Sta
tistica
l Ye
arb
oo
k 20
16
11
TH
E B
OX
OFFIC
E 2
015
Figure 6 Market share by country of origin, 2006-2015
Rest of the world 0.7 0.5 0.3 0.2 0.8 1.0 0.6 0.7 1.1 0.5
India 1.8 1.6 1.4 1.0 1.3 1.0 1.2 1.4 1.5 1.3
Other Europe 1.2 1.8 2.3 1.2 2.1 1.7 4.8 3.0 4.9 2.4
UK independent 4.7 6.8 5.7 8.2 5.4 13.1 9.3 6.6 16.1 10.5
UK studio-backed* 14.4 21.8 25.4 8.5 18.6 22.6 22.8 15.5 10.7 34.2
USA 77.1 67.7 65.2 81.0 71.8 60.6 61.3 72.7 65.8 51.1
Source: BFI, RSU * ‘Studio-backed’ means backed by one of the major US film studios.
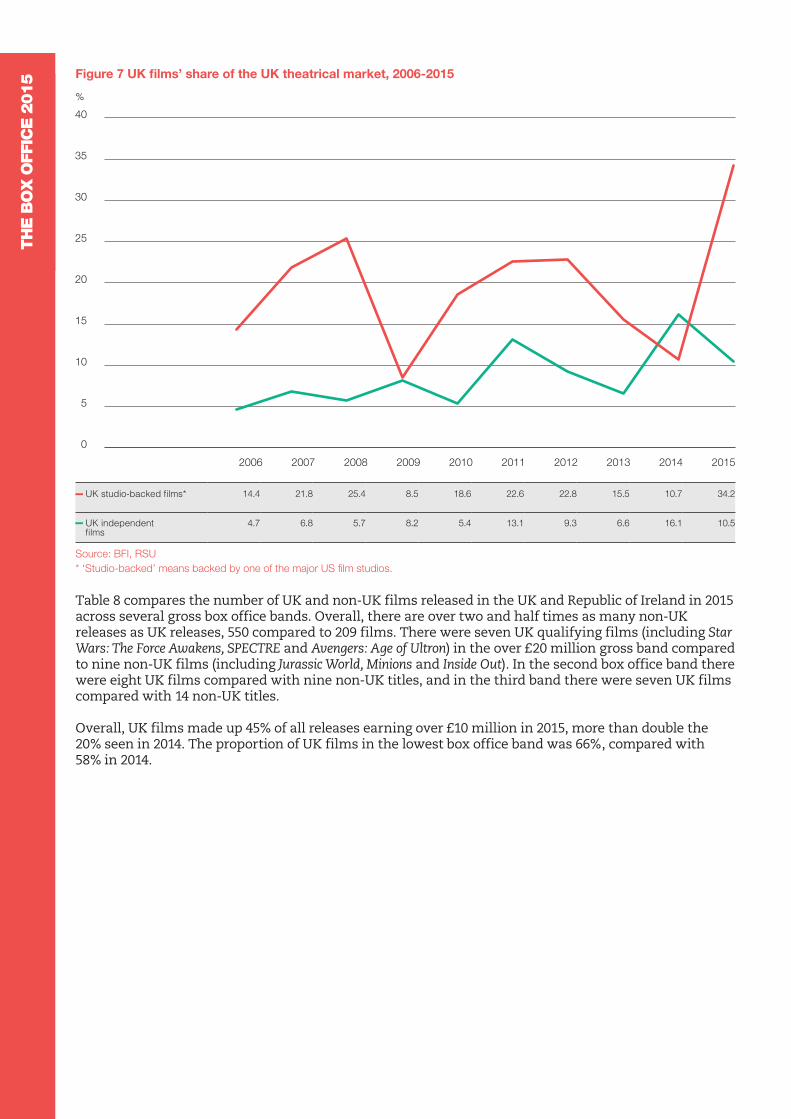
The fluctuating pattern of UK market share is underlined in Figure 7 with the annual figure dependent on a small number of high grossing titles. The average UK independent market share for the 10-year period was just under 9% with an upward trend from a low of just below 5% in 2006. At 10.5%, the market share for independent UK films in 2015 was the third highest of the period, but down from a peak of 16% in 2014. At over 34%, the UK studio-backed market share in 2015 was the highest since our records began and a substantial increase of over 20 percentage points on the previous year.
%
0
10
20
30
40
50
60
70
80
90
100
2015201420132012201120102009200820072006
BF
I S
tati
stic
al
Ye
arb
oo
k 2
01
6
12
TH
E B
OX
OFF
ICE 2
015 Figure 7 UK films’ share of the UK theatrical market, 2006-2015
UK studio-backed films* 14.4 21.8 25.4 8.5 18.6 22.6 22.8 15.5 10.7 34.2
UK independent films
4.7 6.8 5.7 8.2 5.4 13.1 9.3 6.6 16.1 10.5
Source: BFI, RSU * ‘Studio-backed’ means backed by one of the major US film studios.
Table 8 compares the number of UK and non-UK films released in the UK and Republic of Ireland in 2015 across several gross box office bands. Overall, there are over two and half times as many non-UK releases as UK releases, 550 compared to 209 films. There were seven UK qualifying films (including Star Wars: The Force Awakens, SPECTRE and Avengers: Age of Ultron) in the over £20 million gross band compared to nine non-UK films (including Jurassic World, Minions and Inside Out). In the second box office band there were eight UK films compared with nine non-UK titles, and in the third band there were seven UK films compared with 14 non-UK titles.
Overall, UK films made up 45% of all releases earning over £10 million in 2015, more than double the 20% seen in 2014. The proportion of UK films in the lowest box office band was 66%, compared with 58% in 2014.
0
5
10
15
20
25
30
35
40
2015201420132012201120102009200820072006
%

BF
I Sta
tistica
l Ye
arb
oo
k 20
16
13
TH
E B
OX
OFFIC
E 2
015
Table 8 UK and non-UK releases by box office band, 2015
Non-UK releases UK releases
Box office gross (£ million) Number % releases Number % releases
≥20 9 1.6 7 3.3
10 - 19.99 9 1.6 8 3.8
5 - 9.99 14 2.5 7 3.3
1 - 4.99 51 9.3 20 9.6
0.1 - 0.99 108 19.6 28 13.4
<0.1 359 65.3 139 66.5
Total 550 100.0 209 100.0
Source: comScore, BFI RSU analysis Note: Percentages may not sum to 100 due to rounding.
Table 9 shows the percentages of UK film releases by box office band from 2008 to 2015. In 2015, 80% of UK films earned less than £1 million at the box office, the third highest percentage of the time period. The seven UK films which earned £20 million or more in 2015 equate to 3% of all UK releases in that year; this is the second highest proportion of the eight-year period. The percentage of UK films earning between £10 and £20 million in 2015, at 4%, was the second highest percentage of releases in this band of the period, while the 10% of UK films in 2015 earning between £1 and £5 million was the third lowest in the period after 2010 (just over 8%) and 2012 (8%).
Table 9 UK releases by box office band, 2008–2015
2008 2009 2010 2011 2012 2013 2014 2015
Box office gross (£ million)
No. % No. % No. % No. % No. % No. % No. % No %
≥20 3 2.7 3 2.7 3 2.5 7 5.5 5 3.1 4 2.8 3 1.9 7 3.3
10 - 19.99 2 1.8 0 – 6 5.0 4 3.1 3 1.9 3 2.2 3 1.9 8 3.8
5 - 9.99 6 5.4 6 5.3 3 2.5 6 4.7 7 4.3 8 5.8 9 5.8 7 3.3
1 - 4.99 17 15.3 14 12.3 10 8.4 16 12.6 13 8.0 14 10.1 21 13.6 20 9.6
0.1 - 0.99 23 20.7 21 18.4 20 16.8 24 18.9 32 19.8 21 15.1 28 18.2 28 13.4
<0.1 60 54.1 70 61.4 77 64.7 70 55.1 102 63.0 89 64.0 90 58.4 139 66.5
Total 111 100.0 114 100.0 119 100.0 127 100.0 162 100.0 139 100.0 154 100.0 209 100.0
Source: comScore, BFI RSU analysis Notes: Figures for 2014 updated since publication of the 2015 Statistical Yearbook. Percentages may not sum to 100 due to rounding.
BF
I S
tati
stic
al
Ye
arb
oo
k 2
01
6
14
TH
E B
OX
OFF
ICE 2
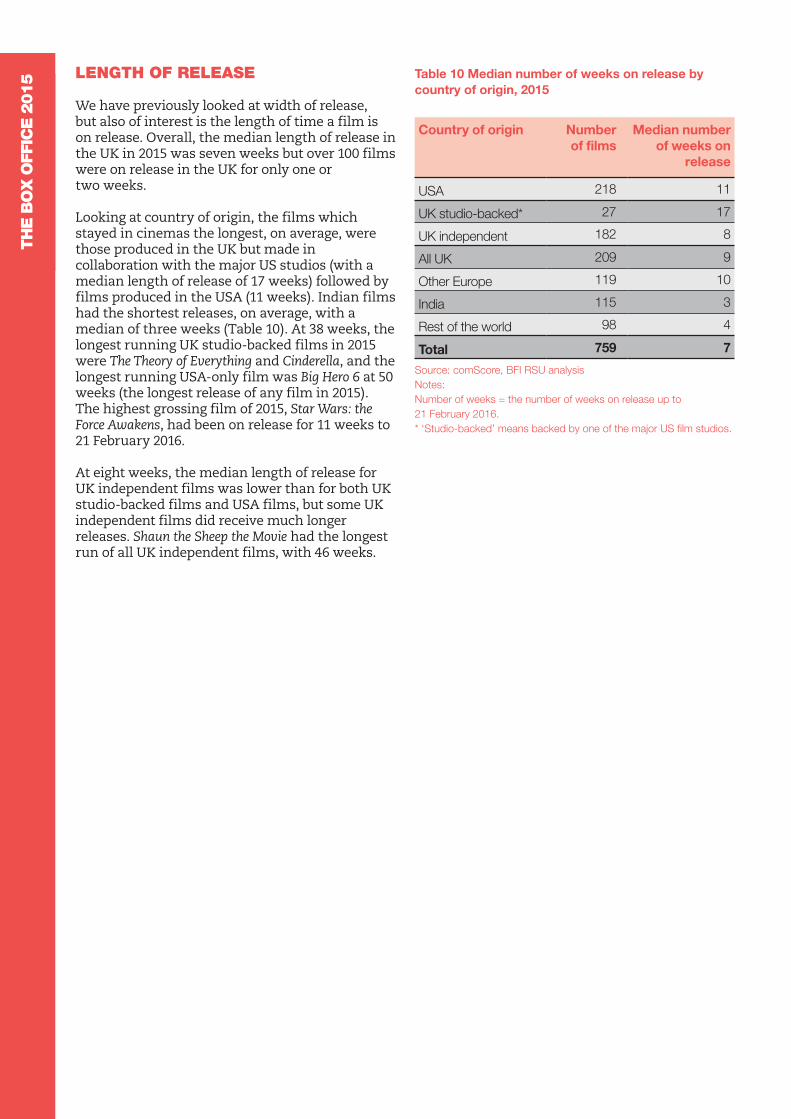
015 LENGTH OF RELEASE
We have previously looked at width of release, but also of interest is the length of time a film is on release. Overall, the median length of release in the UK in 2015 was seven weeks but over 100 films were on release in the UK for only one or two weeks.
Looking at country of origin, the films which stayed in cinemas the longest, on average, were those produced in the UK but made in collaboration with the major US studios (with a median length of release of 17 weeks) followed by films produced in the USA (11 weeks). Indian films had the shortest releases, on average, with a median of three weeks (Table 10). At 38 weeks, the longest running UK studio-backed films in 2015 were The Theory of Everything and Cinderella, and the longest running USA-only film was Big Hero 6 at 50 weeks (the longest release of any film in 2015). The highest grossing film of 2015, Star Wars: the Force Awakens, had been on release for 11 weeks to 21 February 2016.
At eight weeks, the median length of release for UK independent films was lower than for both UK studio-backed films and USA films, but some UK independent films did receive much longer releases. Shaun the Sheep the Movie had the longest run of all UK independent films, with 46 weeks.
Table 10 Median number of weeks on release by country of origin, 2015
Country of origin Number of films
Median number of weeks on
release
USA 218 11
UK studio-backed* 27 17
UK independent 182 8
All UK 209 9
Other Europe 119 10
India 115 3
Rest of the world 98 4
Total 759 7
Source: comScore, BFI RSU analysis Notes: Number of weeks = the number of weeks on release up to 21 February 2016. * ‘Studio-backed’ means backed by one of the major US film studios.

Research & Statistics Unit21 Stephen Street, London W1T 1LN
bfi.org.uk/statistics