the board’s role in finance - community action partnership
TRANSCRIPT

The Board’s Role in Finance 1
© Wipfli LLP 1
The Board’s Role in Finance
Trainer: Denes L. Tobie, CPA, Partner
© Wipfli LLP
© Wipfli LLP
No Recordings of Any Kind
2
All rights reserved. These materials were created and developed by Wipfli LLP. No part may be reproduced, distributed, or transmitted in any form or by any means, including photocopying, recording, or other electronic or mechanical methods, without the prior written permission of Wipfli LLP, except in the case of brief quotations and certain other noncommercial uses permitted by copyright law. For permission requests, contact Amy Almond at Wipfli LLP
This Photo by Unknown Author is licensed under CC BY-NC-SA
This includes any video or audio images on your smart devices.

The Board’s Role in Finance 2
© Wipfli LLP
Materials/Disclaimer
Please note that these materials are incomplete without the accompanying oral comments by the trainer(s).
These materials are informational and educational in nature and represent the speakers' own views. These materials are for the purchasing agency’s use only and not for distribution outside of the agency or publishing on a public website.
3
© Wipfli LLP
Agenda
• Organizational Responsibilities• Internal Controls• Training Your Board• Financial Reporting• Discussing financial information• Case Study Exercise
4

The Board’s Role in Finance 3
© Wipfli LLP
Board Roles and Responsibilities
• Duties of Care, Loyalty, and Obedience• Financial Oversight• Personnel• Board Development• Fund Development• Strategic Planning• Program Performance• Advocacy
5
© Wipfli LLP
Community Action Financial Oversight Resource
6
The Board’s Role in Finance 4
© Wipfli LLP
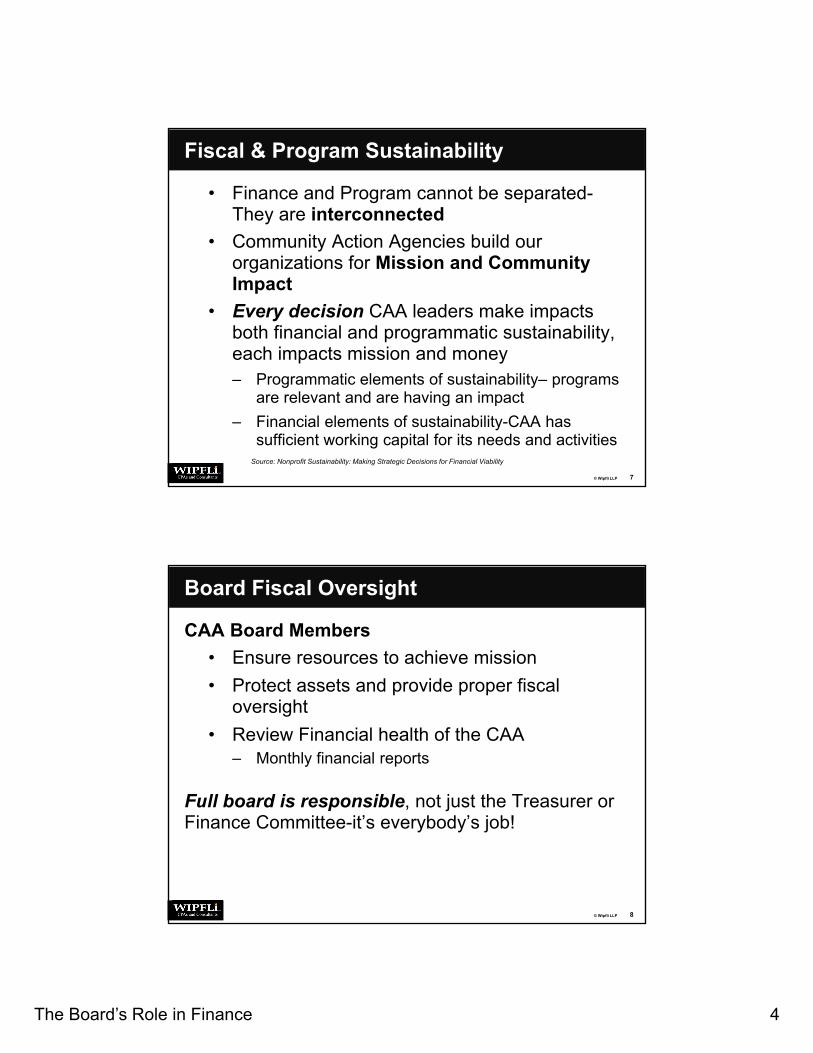
Fiscal & Program Sustainability
• Finance and Program cannot be separated-They are interconnected
• Community Action Agencies build our organizations for Mission and Community Impact
• Every decision CAA leaders make impacts both financial and programmatic sustainability, each impacts mission and money– Programmatic elements of sustainability– programs
are relevant and are having an impact– Financial elements of sustainability-CAA has
sufficient working capital for its needs and activities
7
Source: Nonprofit Sustainability: Making Strategic Decisions for Financial Viability
© Wipfli LLP
Board Fiscal Oversight
CAA Board Members• Ensure resources to achieve mission• Protect assets and provide proper fiscal
oversight• Review Financial health of the CAA
– Monthly financial reports
Full board is responsible, not just the Treasurer or Finance Committee-it’s everybody’s job!
8

The Board’s Role in Finance 5
© Wipfli LLP
Board Fiscal Oversight – Tools of the TradeFinance Committee
• Meets monthly• Strong chair• Engage ED/Fiscal Staff• Include member(s) with stong fiscal expertise
Treasurer• Makes reports to the board of the fiscal status• Works closely with ED/CEO
Significant Documents• Budget• Monthly Financial Reports• Fiscal Policies • Audit• IRS Form 990
Executive Director/Chief Executive OfficerFinance Director/Chief Financial Officer
9
© Wipfli LLP
Fiscal Oversight – Tools of the Trade
Budget• Annual• Work with Finance Committee to prepare • Full board approval prior to the start of your fiscal
year• Agency-wide, not just program budgets• Reflects the priorities of your CAA• Used to help understand agency revenues and
expenditures• Organized in categories that match your monthly
financial report• Avoid Magical Thinking!
10
The Board’s Role in Finance 6
© Wipfli LLP
Fiscal Oversight – Tools of the Trade
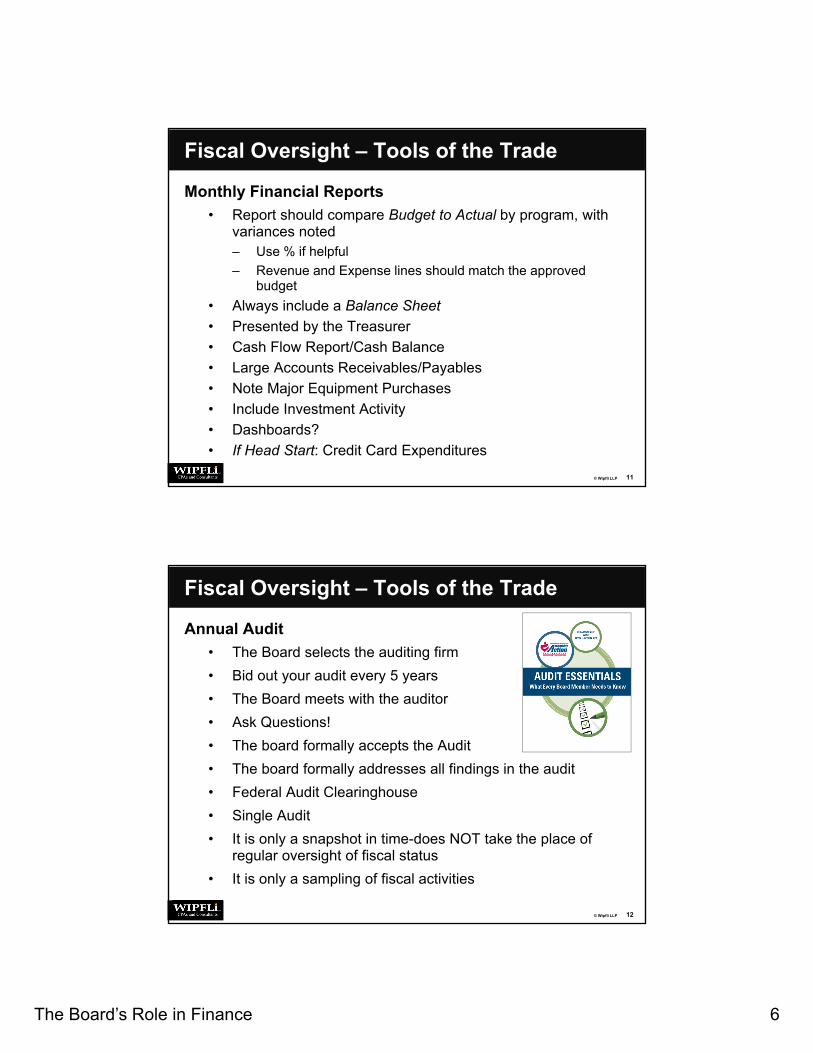
Monthly Financial Reports• Report should compare Budget to Actual by program, with
variances noted– Use % if helpful– Revenue and Expense lines should match the approved
budget• Always include a Balance Sheet• Presented by the Treasurer• Cash Flow Report/Cash Balance• Large Accounts Receivables/Payables• Note Major Equipment Purchases• Include Investment Activity • Dashboards?• If Head Start: Credit Card Expenditures
11
© Wipfli LLP
Annual Audit• The Board selects the auditing firm• Bid out your audit every 5 years• The Board meets with the auditor• Ask Questions!• The board formally accepts the Audit• The board formally addresses all findings in the audit• Federal Audit Clearinghouse• Single Audit• It is only a snapshot in time-does NOT take the place of
regular oversight of fiscal status• It is only a sampling of fiscal activities
12
Fiscal Oversight – Tools of the Trade

The Board’s Role in Finance 7
© Wipfli LLP
Fiscal Oversight – Tools of the Trade
IRS Form 990• Publically available• Board should review
prior to submission to IRS
• Required document• Media and others
use this tool to learn about your CAA
13
© Wipfli LLP
Fiscal Oversight – Tools of the Trade
Committees• Finance• Audit• Investment• Be clear about their role and function• Work to ensure full board received accurate,
timely, and understandable reports• ED/CEO attend all meetings-Fiscal staff attend
at the pleasure of the ED/CEO• Role of Executive Committee
14

The Board’s Role in Finance 8
© Wipfli LLP
Fiscal Oversight
Can you answer these questions at each board meeting?
• Are there any unexpected expenditures/revenues?
• Are any program areas running an unexpected deficit?
• Are we dipping into reserves or a line of credit?• How is our cash flow? Are we paying our bills
on time?• How do we look as we approach year end?
15
© Wipfli LLP 16
Responsibilities and Internal Controls
© Wipfli LLP

The Board’s Role in Finance 9
© Wipfli LLP
How NPOs Differ
• Dedicated to achieving a mission or a vision
• Gather funding and support from the government, the general public and/or membership fees
• Enjoy tax exempt status, IRS section 501(c)
• Carry an obligation to the public and donors to acquire, manage and allocate financial resources to accomplish the mission
17
© Wipfli LLP
Philosophical Mission
The philosophical mission that spurs the establishment of the entity creates:
• An obligation of stewardship of financial resources
• A duty to keep consistent with the mission
18

The Board’s Role in Finance 10
© Wipfli LLP
Effective Boards
• Assure that proper financial management is in place
• Retain and oversee high-quality auditors• Ensure that hiring policies are sound• Keep overzealous executives in proper check
19
© Wipfli LLP
“Duties” of a Board Member
• Care
• Loyalty
• Obedience
20

The Board’s Role in Finance 11
© Wipfli LLP
Legal Responsibilities of the Board of Directors
Duty of Care: A board member has the duty to exercise reasonable care when he or she makes a decision for the organization. Reasonable care is what an "ordinarily prudent" person in a similar situation would do.
Duty of Loyalty: A board member must never use information gained through his/her position for personal gain, and must always act in the best interest of the organization.
21
© Wipfli LLP
Legal Responsibilities of the Board of Directors
Duty of Obedience: A board member must be faithful to the organization's mission. He or she cannot act in a way that is inconsistent with the organization's goals. The board member is trusted by the public to manage donated funds to fulfill the organization's mission.
22

The Board’s Role in Finance 12
© Wipfli LLP
Duty of Care
The care that “an ordinary prudent person would exercise in a like position and under similar circumstances”
• Attending board meetings regularly
• Showing independent judgment
• Being informed about organizational resources
• Delegating only to responsible individuals
• Following up regularly
23
© Wipfli LLP
Duty of Loyalty
• Give undivided allegiance to the organization when making decisions that affect the organization
• Personal, family or business interests cannot be put above the organization’s interests
• Avoid conflicts of interest in fact and in appearance
24

The Board’s Role in Finance 13
© Wipfli LLP
Duty of Obedience
• Ensure that the organization remains obedient to its central purpose
• Establish Accountabilities– Policies– Programs– Performance– Process– Value– Outcomes & Effectiveness– Efficiency & Economy– Planning, Allocating & Managing
25
© Wipfli LLP
Organizational Responsibilities
Board of Directors:– Responsible for overall financial results and
fiscal accountability
Board Treasurer and Finance Committee:– Oversee financial results and are closer to the
fiscal details than the full Board
26

The Board’s Role in Finance 14
© Wipfli LLP
Organizational Responsibilities
Executive Director:– The Executive Director is accountable to the
Board for all organization results, fiscal and programmatic
Chief Financial Officer:– The CFO is responsible for ensuring internal
controls are in place, financial records are accurate and providing financial reports to allow leadership to make decisions.
27
© Wipfli LLP
Internal Controls
Defined:
Internal control is a process overseen by the Board of Directors, and created and implemented by senior and other managers designed to provide reasonable assurance about achievement of the entities objectives.
28

The Board’s Role in Finance 15
© Wipfli LLP
Internal Controls
Objectives of internal controls:• Effectiveness and efficiency of operations;• Reliability of financial reporting; and• Compliance with applicable laws and
regulations.
29
© Wipfli LLP
Internal Controls
Components help achieve the following goals of fraud protection:
• Prevent as much as possible;• Use detective controls to catch what cannot be
prevented;• Ensure against acts that are not prevented or
detected;• Continually update your understanding of fraud
risks and manage those risks; and• Make it everyone’s responsibility to be part of
fraud deterrence.30

The Board’s Role in Finance 16
© Wipfli LLP
Internal Controls
Preventive controls are designed to prevent errors, fraud or illegal acts from being committed. Examples:
• Locks on file cabinets containing sensitive data• Completely blank check stock so all information,
including bank coding, is printed on the checks• Accounting staff has access only to the sections
of the accounting software required for their jobs
31
© Wipfli LLP
Internal Controls
Detective controls are designed to detect errors, fraud or illegal acts and allow for corrective action. Every system must have both preventive and detective controls. Examples
• Timely reconciliation of bank accounts including examining cleared checks for correct amount and payee
• Review of budget-to-actual financial reports by fiscal and program managers, and by the Executive Director and the Board of Directors.
32

The Board’s Role in Finance 17
© Wipfli LLP
Internal ControlsWays to Involve the Governing Board in Internal Control Activities
1. Reviewing & approving of monthly financial reports2. Reviewing & approving of monthly program reports3. Signing of checks4. Reviewing of monthly bank statements & cancelled checks5. Reviewing of monthly credit card statements6. Hiring of auditor7. Meeting with the auditor to discuss the audit8. Attending & being active at board meetings9. Being knowledgeable about the organization & asking questions10. Approving major procurements11. Reviewing & approving written financial procedures12. Approving annual compensation (salary schedule) & any incentive
compensation13. Following up on problems or findings
33
© Wipfli LLP 34
Training Your Board
© Wipfli LLP

The Board’s Role in Finance 18
© Wipfli LLP
Boards fiscal knowledge• Common traits that could reflect fiscally strong Board
member(s):– Holding a CPA license– Working in public accounting– Working for another non-for-profit in their fiscal
department– Extensive years of board service– Some just have that general knack for understanding
money
35
© Wipfli LLP
Board Expertise
Traits we like to see in board members:• Have a passion and commitment to the
organization’s mission
• Willing to do practical work if necessary
• Have ties to the community
• Diversity – age, gender, race, religion, occupation, skills and background
• Willing to help raise money
36

The Board’s Role in Finance 19
© Wipfli LLP
Training the Board
Financial training isn’t a one time thing. On an annual basis training should be supplied to the Board.
This can take the form of an annual meeting or could be done thru 5-10 minutes on the agenda of all Board meetings. If an organization can afford it, an outside contractor could be brought in once a year to lead an on-site training.
37
© Wipfli LLP 38
Financial Reporting
© Wipfli LLP

The Board’s Role in Finance 20
© Wipfli LLP
Financial Reporting
39
© Wipfli LLP
Financial Reporting
What should a board member know by looking at the reports?
• Current financial condition• Are we making or losing money• How we are doing on spending out grants• If our finances are in line with our goals and
objectives, including agency-wide budget
40
The Board’s Role in Finance 21
© Wipfli LLP
Financial Reporting
How do we develop reports that satisfy our objectives?
• Inquire of the Board members to see what reports they would like and why?
• Provide sample reports and discuss with the board
• Some reports may provide little value, tactfully explain why some reports may not be valuable.
• Should be a collaborative decision.• Some may be based on funding source
requirements41
© Wipfli LLP
Financial Reporting
• Evaluate your organization’s needs and objectives to determine reporting as well
• Every organization is different and therefore has different financial reporting needs, reports differ based on:– Number of programs– Size of programs– Amount of non-grant activity– Financial condition– Funding source requirements
42

The Board’s Role in Finance 22
© Wipfli LLP
Evaluating Your Organization
If your organization is facing financial difficulties, consider the following reports:
• Corporate revenue and expense analysis with a comparison to budget
• Analysis of any other grant or activity that has profits or losses
• Accounts payable aging report
For a large organization, probably will not review a check register, but may in a smaller organization
43
© Wipfli LLP
Evaluating Your Organization
If your organization has significant financial assets, consider the following reports:
• Corporate revenue and expense analysis with a comparison to budget
• Investment performance analysis
Yes, you saw the corporate expense twice because it is important
44

The Board’s Role in Finance 23
© Wipfli LLP
Your Accounting System
What do you think of youraccounting software?
45
© Wipfli LLP
Your Accounting System
Does your accounting software generate reports with minimal effort, if not?
• Sometimes it’s the software
• Sometimes is the user (training)
• Sometimes it’s the setup
• And sometimes its all of the above!
46

The Board’s Role in Finance 24
© Wipfli LLP
Your Accounting System
Fixing accounting software issues:• Talk to your provider about the reports you are
looking for• Get trained if the software has the capabilities• May have to do a re-implementation if the setup
is bad• If all else fails, you may want to consider a
software conversion (not always easy)
47
© Wipfli LLP
Reports to Present to the Board
48
Any CAPComparative Statement of Financial PositionDecember 31, 2014 and 2015
2014 2015
Current assets:Cash and cash equivalents 1,021,837$ 351,018$ Grants receivable 671,605 1,054,138 Prepaid expenses and other assets 66,079 52,326
Total current assets 1,759,521 1,457,482
Property and equipment, net 247,898 326,421
TOTAL ASSETS 2,007,419$ 1,783,903$
Current liabilities:Line of credit 0 134,789 Accounts payable 240,419 450,789 Accrued payroll and related expenses 248,246 168,067 Accrued vacation 87,393 82,800 Grant funds received in advance 83,278 57,431
Total current liabilities 659,336 893,876 Long-term liabilities:
Notes payable 213,018 198,444
Total liabilities 872,354 1,092,320
Net assets:Unrestricted 500,818 256,565 Temporarily restricted 634,247 435,018
Total net assets 1,135,065 691,583
TOTAL LIABILITIES AND NET ASSETS 2,007,419$ 1,783,903$
Anything wrong in this picture?

The Board’s Role in Finance 25
© Wipfli LLP
Reports to Present to the Board
49
Any CAPComparative Statement of Financial PositionDecember 31, 2014 and 2015
2014 2015 Change Percent Notes
Current assets:Cash and cash equivalents 1,021,837$ 351,018$ 670,819)( -65.6% Primarily from current year loss and increase in grants receivable
Grants receivable 671,605 1,054,138 382,533 57.0% State is behind on reimbursing for WIC
Prepaid expenses and other assets 66,079 52,326 13,753)( -20.8%
Total current assets 1,759,521 1,457,482
Property and equipment, net 247,898 326,421 78,523 31.7%
TOTAL ASSETS 2,007,419$ 1,783,903$
Current liabilities:Line of credit 0 134,789 134,789 N/A Needed for cash flow
Accounts payable 240,419 450,789 210,370 87.5% Held off on paying WIC vendors
Accrued payroll and related expenses 248,246 168,067 80,179)( -32.3% The previous year included an extra 6 days to accrue
Accrued vacation 87,393 82,800 4,593)( -5.3%Grant funds received in advance 83,278 57,431 25,847)( -31.0%
Total current liabilities 659,336 893,876 Long-term liabilities:
Notes payable 213,018 198,444 14,574)( -6.8%
Total liabilities 872,354 1,092,320
Net assets:Unrestricted 500,818 256,565 244,253)( -48.8% Due to depreciation and overspending on two grants
Temporarily restricted 634,247 435,018 199,229)( -31.4% Net assets used for restricted purposes
Total net assets 1,135,065 691,583
TOTAL LIABILITIES AND NET ASSETS 2,007,419$ 1,783,903$
© Wipfli LLP
Reports to Present to the Board
50
Any CapComparative Statement of Activities
YTD YTD YTD YTD December 2014 December 2014 December 2015 December 2015 Change Percent Notes
Revenue: Grant revenue 894,051$ 10,728,611$ 932,923$ 10,534,864$ 193,747)( -1.8%
Program/other income 18,614 223,373 19,424 442,746 219,373 98.2% $200,000 donation from a rich person
In-kind contributions 26,566 318,795 27,721 154,591 164,204)( -51.5% Loss of donated space at XYZ site
Total revenue and support 939,231 11,270,779 980,068 11,132,201 10,192,970
Expenses:Salaries and wages 260,815 3,129,778 272,155 3,345,079 215,301 6.9%Fringe benefits 79,933 959,191 83,408 1,105,194 146,003 15.2% 14% spike in health insurance costs
Contracted services/consultants 22,067 264,808 23,027 209,738 55,070)( -20.8%Day care provider payments 54,135 649,618 56,489 754,295 104,677 16.1%Energy assistance 235,681 2,828,177 245,928 3,033,728 205,551 7.3% Additional funds awarded
Weatherization contracts 124,772 1,497,269 130,197 1,513,554 16,285 1.1%Food 8,702 104,418 9,080 163,279 58,861 56.4%Insurance 1,845 22,134 1,925 33,127 10,993 49.7%Occupancy 21,666 259,986 22,607 409,246 149,260 57.4% Cost related to additional space from
building expansion
Supplies 39,701 476,407 41,427 384,909 91,498)( -19.2%Depreciation expense 10,326 123,915 10,775 147,895 23,980 19.4%Other 27,481 329,766 28,675 321,048 8,718)( -2.6%In-kind 26,566 318,795 27,721 154,591 164,204)( -51.5% Loss of donated space at XYZ site
Total expenses 913,690 10,964,262 953,414 11,575,683 10,661,993 97.2%
Change in net assets 25,541 306,517 26,654 443,482)( 469,023)( -153.0%

The Board’s Role in Finance 26
© Wipfli LLP
Reports to Present to the Board
51
Any CAPCombining Statement of Revenues and ExpensesYear Ended December 31, 2015
Corporate/ Performance Grant PropertyUnrestricted Based 1 Fundraising and Equipment Program 1 Program 2 Program 3 Program 4 Total
Revenues:Grant Revenue - 380,416 - - 5,565,358 1,127,759 3,000,000 6,018 10,079,551 Contributions 165,461 - 35,118 - - 53,373 - - 253,952 Miscellaneous 31,289 - - - - 2,301 - - 33,590 In-kind revenue - - - - 1,000,000 - - - 1,000,000 Transfers (200,000) - - - - - 200,000 - -
Total revenues (3,250) 380,416 35,118 - 6,565,358 1,183,433 3,200,000 6,018 11,367,093
Expenses:Salaries 40,358 156,374 8,552 - 3,135,786 730,158 50,596 - 4,121,824 Fringe Benefits 21,658 86,789 1,034 - 1,798,140 432,048 13,837 - 2,353,506 Consultants/Contractual - 136,087 - - 58,723 285 5,730 - 200,825 Supplies 60 35,016 - - 1,683 1,039 11,511 - 49,309 Travel and Training 136 - 75 - 1,247 1,212 491 - 3,161 Occupancy - - - - 263,967 7,164 55,555 - 326,686 Equipment Rental/Maintenance - 4,894 - (160,000) 96,503 - 7,158 - (51,445) Communications - 1,598 - - 53,274 2,593 642 - 58,107 Client assistance 6,138 - - - - - 2,908,690 6,018 2,920,846 Other 981 2,024 11,358 30,000 156,035 8,934 145,790 - 355,122 In-kind expense - - - - 1,000,000 - - - 1,000,000
Total expenses 69,331 422,782 21,019 (130,000) 6,565,358 1,183,433 3,200,000 6,018 11,337,941
Revenues over expenditures (72,581) (42,366) 14,099 130,000 - - - - 29,152
How did this organization do financially?
© Wipfli LLP
Reports to Present to the Board
52
September 30, 2015
NOTE: Organization has a December 31, 2015 year-end.
Percent ofGrant Grant Spent to Award Period Percent ofPeriod Award Date Completed Grant Spent
LIHEAP 1/1/15 - 12/31/15 3,500,000 3,200,000 75% 91%
Weatherization 4/1/15 - 3/31/16 1,200,000 325,000 50% 27%
Section 8 1/1/15 - 12/31/15 800,000 600,000 75% 75%
Head Start 11/1/14 - 10/31/15 2,500,000 1,800,000 92% 72%
WIA 7/1/15 - 6/30/16 200,000 100,000 25% 50%

The Board’s Role in Finance 27
© Wipfli LLP
Agency-Wide Budget
Reasons for an agency-wide budget:• Assist in determining use of flexible and
discretionary funds
• Clear identification of programs that lose money
• Allow board members and managers to monitor the organization
The Board has a very high level of responsibility for agency-wide operations
53
© Wipfli LLP
Agency-Wide Budget – Example 1
54
Budget Actual Variance Comments
Revenues:Grant Revenue 11,000,000 10,566,714 (433,286) Contributions 17,000 16,301 (699) Miscellaneous 180,000 186,541 6,541 In-kind revenue 300,000 265,519 (34,481)
Total revenues 11,497,000 11,035,075 (461,925)
Expenses:Salaries 6,500,000 6,377,557 122,443 Fringe Benefits 1,700,000 1,819,626 (119,626) Consultants/Contractual 350,000 136,087 213,913 Supplies 450,000 476,540 (26,540) Travel and Training 300,000 324,018 (24,018) Occupancy 400,000 389,878 10,122 Equipment Rental/Maintenance 250,000 270,000 (20,000) Communications 300,000 285,098 14,902 Client assistance 600,000 511,547 88,453 Other 340,000 321,018 18,982 In-kind expense 300,000 265,519 34,481
Total expenses 11,490,000 11,176,888 313,112
Revenues over expenditures 7,000 (141,813) (775,037)

The Board’s Role in Finance 28
© Wipfli LLP
Agency-Wide Budget – Example 2
55
Fee for Indirect/Weatheri- State Housing Fund-raising Service Admin
Head Start CSBG zation Grant Event Grant Discretionary Expense Pool TotalRevenue:Grant revenue 6,202,931 2,893,182 7,001,533 645,381 - - - - 16,743,027 Program income 98,042 - - 284,789 - - - - 382,831 Other income - - - - 35,408 65,048 860 - 101,316
Total Revenue 6,300,973 2,893,182 7,001,533 930,170 35,408 65,048 860 - 17,227,174
Expenses:Salaries 3,457,895 1,413,978 2,804,387 640,752 18,406 9,204 205 743,945 9,088,772 Fringe benefits 1,469,248 834,801 1,604,789 248,904 8,297 3,004 94 307,823 4,476,960 Supplies 365,087 36,484 930,481 34,057 483 5,804 236 23,841 1,396,473 Occupancy 168,974 46,089 143,657 21,042 102 810 45 209,871 590,590 Travel 56,048 60,787 304,897 10,564 35 724 130 65,412 498,597 Other 190,487 100,291 841,098 18,467 209 2,105 657 80,741 1,234,055 Indirect/admin expenses 593,234 242,581 481,119 109,927 3,158 1,579 35 (1,431,633) -
Total Expenses 6,300,973 2,735,011 7,110,428 1,083,713 30,690 23,230 1,402 - 17,285,447
Profit/(loss) before transfers - 158,171 (108,895) (153,543) 4,718 41,818 (542) - (58,273)
Transfers:CSBG support - 134,084 (106,877) (27,207) - - - - - Indirect/admin support - 24,087 (2,018) (109,927) - - 87,858 - - Discrectionary/corporate support - - - - - - - - -
Net transfers - 158,171 (108,895) (137,134) - - 87,858 - -
Profit/(loss) after transfers - - - (16,409) 4,718 41,818 (88,400) - (58,273)
© Wipfli LLP
Agency-Wide Budget – Example 3
56
Budgeted ActualBudgeted Budgeted Transfers Net Gain/ Actual Net Gain/
Program Revenue Expenses To/ (From) (Loss) Transfers (Loss) Comments
CSBG 600,000 (550,000) (50,000) - (40,000) -
Emergency Solutions 135,000 (140,000) 5,000 - - -
Early Head Start 3,000,000 (3,000,000) - - - -
Head Start 5,000,000 (5,000,000) - - - -
WIC 1,500,000 (1,600,000) 100,000 - - -
Fundraising 20,000 (10,000) - 10,000 - 5,000
Unrestricted/Discretionary 100,000 (80,000) (55,000) (35,000) 40,000 (25,000)
10,355,000 (10,380,000) - (25,000) - (20,000)

The Board’s Role in Finance 29
© Wipfli LLP
Additional Reports to Consider
57
Dewey, Chetum and HoweBudget Projection - 10/31/15
Actual - 10/31/15
Projected November
Projected December
December Accruals
Projected Expenses Award Budget Remaining
Personnel 2,331,696 333,000 333,000 183,150 3,180,846 3,200,000 19,154
FICA/FICA MED 165,464 24,500 24,500 13,475 227,939SUTA 76,204 8,700 8,700 4,785 98,389Worker's Comp 25,352 3,331 3,331 0 32,014Health Insurance 311,328 41,388 41,388 0 394,104Fringe Benefits 578,348 77,919 77,919 18,260 752,446 650,000 (102,446)
Travel-Outside Area Staff 652 66 66 0 784 3,000 2,216
Equipment 18,000 0 0 24,000 42,000 44,000 2,000
Supplies-Classroom 593,336 9,000 9,000 0 611,336Supplies-Office 161,968 3,500 3,500 0 168,968Supplies-Cleaning 10,680 1,305 1,305 0 13,290Supplies-Medical/Dental 5,256 1,325 1,325 0 7,906Printing 6,200 1,150 1,150 0 8,500Supplies 777,440 16,280 16,280 0 810,000 320,000 (490,000)
Phone Service 25,540 5,254 5,254 0 36,048Custodial Services 15,028 4,800 4,800 0 24,628Consultant Fees 123,876 5,255 5,255 0 134,386Contractual 164,444 15,309 15,309 0 195,062 250,000 54,938
Gas 7,896 900 900 0 9,696Rent 66,456 9,200 9,200 0 84,856Staff Training 81,704 6,300 6,300 0 94,304Insurance-General Liability 50,028 6,532 6,532 0 63,092Building Maintenance/Repair 443,888 22,700 22,700 0 489,288Utilit ies 40,020 11,500 11,500 0 63,020Vehicle Licensing/Inspection 20,704 0 0 0 20,704Local Travel - Staff 10,028 600 600 0 11,228Parent Committee 48 200 200 0 448Board Expenses 2,776 200 200 0 3,176Publications/Memberships 6,920 300 300 0 7,520Other 730,468 58,432 58,432 0 847,332 900,000 52,668
Totals 4,022,700 423,087 423,087 207,150 5,076,024 4,717,000 (359,024)
© Wipfli LLP
Additional Reports to ConsiderA schedule of monthly cash: Shows the current reconciled bank balance available for
immediate use Would be presented as of the month end Does not include any restricted cash like tenant deposit
accounts Could be shown as a graph that shows the last 2 years worth
of cash balances
58
050
100150
$ in thousands

The Board’s Role in Finance 30
© Wipfli LLP
Additional Reports to Consider
In-Kind Report Used in organizations that have Head Start
grants
Shows what percentage of the total in-kind has been collected
Shows the grant to date total in-kind collected and compares it to the total required on the grant.
Credit card charges Shows the detail of the credit card charges for
the month59
© Wipfli LLP
Additional Reports to Consider
Analysis of unrestricted/corporate activity Unrestricted net assets are vital to any
organization and should be monitored.
Analysis of for-profit subsidiaries or funds These activities should be closely monitored,
especially for losses.
60

The Board’s Role in Finance 31
© Wipfli LLP
Additional Reports to Consider
61
Unrestricted Net Assets
Head Start Enrollment (funded = 530)
(60,000.00)
(40,000.00)
(20,000.00)
-
20,000.00
40,000.00
60,000.00
J F M A M J J A
CFO Gambling Activity
Current Ratio
1.1
540
$ 365,098
© Wipfli LLP
Forms of presentation
62

The Board’s Role in Finance 32
© Wipfli LLP
RATIOS COMMENTS2013 2014 2015
CURRENT RATIO 2.72 1.83 1.56 This ratio computes CAP's ability to pay off current obligations with currentcurrent assets assets. The benchmark for this ratio is 1:1%. CAP has consistently been
current liabilities above the 1:1% benchmark which means the day to day operations are current assets divided by current liabilities being managed well.
PAY-OFF RATIO 9.3 10.3 4.6 This ratio computes the number of times CAP's existing cash balance can (cash + a/r) can pay off CAP's existing accounts payable balance. The benchmark for
accts payable this ratio is 3. CAP has consistently been above this benchmark which number of times cash + a/r can pay-off a/p overall is good but also may be an indicator that payables are being paid too
quickly.
AVERAGE DAYS CASH ON HAND 29.8 25.0 14.9 This ratio computes the number of days CAP has cash on hand to pay their cash & equivalents average daily expenses. In other words for 2015 assuming no cash collections,avg exp's per day CAP would run out of cash after approx. 15 days. The benchmark for this ratio is
avg number of days expenses in a cash 15-20 days. CAP has consistently averaged over 15-25 days which is positive.
FISCAL YEAR ENDING
Additional Reports to Consider
63
© Wipfli LLP
Additional Reports to Consider
64
RATIOS COMMENTS2013 2014 2015
AVERAGE DAYS IN ACCOUNTS RECEIVABLE 11.2 15.3 13.9 This ratio computes the number of days cash is tied up in accounts receivable.accounts receivable In other words for 2015, we have 13.9 days of revenue tied up in accounts receivableavg revenue per day The benchmark for this varies for most CAP agencies. Some states are better at
avg number of days revenue in account receivable funding grant reimbursement requests in a timely manner. CAP varying between10-16 days is better than average. Most of the time we see agencies in the 20-30day average.
AVERAGE DAYS IN ACCOUNTS PAYABLE 4.4 4.0 6.3 This ratio computes the average number of days it takes CAP to pay itsaccts payable vendors. The average benchmarks for this is 20-30 days. CAP's ratio is extremely
avg exp's per day low which indicates strong cash flow. However, CAP may be missing out onavg number of days exp's in accts payable opportunities by paying vendors too fast. Trend is better for current year but still low.
DEBT TO NET ASSETS RATIO 72.80% 58.62% 45.16% This ratio determines how leveraged the organization is. Anything over 100% total liabilities would be considered leveraged. Anything over 200% would start to be considered
total net assets highly leveraged. CAP has this ratio trending downward which is a positive sign.liabilities as a % of net assets Current year trend downward is due to paying off of long-term debt.
FISCAL YEAR ENDING

The Board’s Role in Finance 33
© Wipfli LLP
Additional Reports to Consider
65
2013 2014 2015
AVERAGE REVENUE PER DAY $49,402 $57,769 $63,267 This ratio computes on average the amount of revenue generated on any given daytotal revenue - in kind within the organization. In-kind is disregarded as this revenue does not involve cash
260 working days transactions. Average revenues vary among CAP agencies.
AVERAGE EXPENSES PER DAY $48,678 $54,513 $60,461 This ratio computes on average the amount of expenses generated on any given daytotal expenses - in kind within the organization. In-kind is disregarded as this revenue does not involve cash
260 working days transactions. Average expenses vary among CAP agencies.
ADMINISTRATIVE EXP'S TO TOTAL EXP'S 8.98% 7.64% 7.11% This ratio computes the percentage of expenses that are paid for management andadministrative + general exp's general activities versus program activities. The benchmark for this ratio is 10%
total expenses or less. CAP has consistently been below 10% and is trending downward. Alladministrative + general exp's as a % of total expenses good signs.
© Wipfli LLP
Additional Reports to Consider
66
RATIOS COMMENTS2013 2014 2015
UNRESTRICTED NET ASSETS RESERVE 1.8 1.8 1.7 This ratio measures the long-term sustainability of the organization. CAP hasunrestricted net assets accumulated unrestricted reserves that is approaching 2 months worth of average
avg total expenses per month monthly expenses. This is a very respectable ratio. Most CAP agencies struggleavg number of months exp's in unrest net assets to obtain even a 1 month reserve. However looking at the 3 year trend, it is very
difficult to build up this reserve when your primary funding comes from cost re-imbursement grants. CAP should continue to look for ways to diversify funding.
REVENUE TO EXPENSE 101.45% 105.85% 104.52% This ratio measures if the organization was profitable or not. The benchmark fortotal revenue this ratio is 100%. CAP has had revenues exceed expenses for the last threetotal expense years. In these economic times, this is a very positive trend.
total revenue as a % of total exp's
FISCAL YEAR ENDING

The Board’s Role in Finance 34
© Wipfli LLP
Nonfinancial Reports
• Funding source monitoring results• Reports of suspected fraud or fraud hotline -
audit committee• Program compliance reporting
67
© Wipfli LLP 68
Discussing financial information
© Wipfli LLP
The Board’s Role in Finance 35
© Wipfli LLP
Discussing Board ReportsGeneral guidelines to remember/include:
1. Board meetings should always include a financial report as an agenda item.
2. The Fiscal Director should be familiar with the financial information in depth enough to discuss it at Board meetings.
3. Be available to meet with the Board members when they inquire.
4. Allow for time for the Board to ask questions after the financial information has been presented.
5. Consider where the financial discussion is on the agenda (beginning, middle, end)
6. Present information in a concise manner.
69
© Wipfli LLP
Discussing Board Reports
General guidelines to remember/include: (cont.)7. Supplement the financial reports with a written report
that is repeatable and simple to read.
8. Don’t swamp the Board with information that isn’t necessary (Keep it simple).
9. Use charts and graphs and colors.
10.Ask the Board questions.
11.Promote a safe environment for open and honest dialogue.
70

The Board’s Role in Finance 36
© Wipfli LLP
Case Study Exercise
Let’s see what we have learned…….
Year 1, let’s begin…….
71
© Wipfli LLP
Conclusion
A nonprofit Board of Directors has many responsibilities; one of the most important is their fiduciary responsibility. In order to fulfill this core responsibility, the Board relies on the financial information provided by the finance department.
The finance department is responsible for providing accurate, reliable, and timely financial information, allowing the board to make their decisions.
At times, the fiscal director is equal parts compiler, teacher, and investigator as he or she prepares financials, explains financial results to the board, and investigates unusual financial information.
72

The Board’s Role in Finance 37
© Wipfli LLP
www.wipfli.com/ngp
73
Regulation questionsAudit
ProcessHuman Resource
TechnologyLeadership
Connect with me:
www.linkedin.com/in/denestobie
www.facebook.com/WipfliNGP
Bring Wipfli to You:Kate D. Atkins, [email protected]
608.270.2944
My Wipfli – Access to our experts:
www.wipfli.com/mywipfli