the births, lives, and deaths of corporations in late imperial...
TRANSCRIPT

The Births, Lives, and Deaths of Corporations in Late Imperial Russia
Preliminary Conference Draft – Comments welcome but please do not cite
September 2017*
Amanda Gregg1 and Steven Nafziger2
* This paper incorporates material from an unpublished working paper entitled “Financial Dynamics: Imperial Russian Corporate Balance Sheets, 1898-1914.” We are incredibly grateful for comments from colleagues and audiences at the World Business History Congress (Bergen), Yale, Queens University, Colby, Harvard, the Washington Area Economic History Seminar, the Central New York Economic History meeting, Middlebury, and Williams. Giulia Filocca, Madeline McFarland, Tamar Matiashvili, and Sanket Vadlamani provided exemplary research assistance. We greatly appreciate the aid with sources provided by librarians at Harvard, Middlebury, Williams, and the National Library of Finland. Financial support was provided by Middlebury and Williams Colleges. 1 Middlebury College, Warner Hall 305F, 303 College Street, Middlebury, VT 05753. Corresponding author: [email protected]. 2 Williams College. [email protected]

Abstract
Understanding the birth, growth, and death of firms in the early stages of industrial development is a relatively unexplored area of economic history, yet these processes are at the heart of transitions to modern economic growth. Our paper investigates the competitiveness and financial development of the Imperial Russian economy by examining patterns of entry and exit into the corporate sector. This analysis relies on a newly developed panel database of detailed annual balance sheet information from every active corporation in the Russian Empire between 1899 and 1914. In our data, firms entered the corporate sector as new firms or partnerships newly transformed into corporations and exited when they shut down. We examine the industrial distribution of firm entry, document how new and newly transformed corporations evolved over their life cycles, and construct a proportional hazard model that includes balance sheet and governance characteristics to predict firm exits.

I. Introduction Firm entry, evolution, and exit are key attributes of a sector’s overall performance, yet very little
is known about how these processes operate in historical economies. While the cross-sectional size
distribution of establishments has been well documented in the United States and other leading economies
over the long 19th centuries, the dynamics of how such variation evolved, especially at the firm level, are
largely unknown outside of a few industries, especially in “late-industrializers.” This is particularly
unfortunate, because any understanding of the early stages of modern economic growth must grapple with
the creation, growth, and destruction of firms adopting or failing to adopt new industrial technologies.
This paper provides an initial foray in this direction by studying the births, deaths, and lives of
corporations in late Imperial Russia, perhaps the quintessential late industrializing economy.
The economic history literature of late Imperial Russia may be broken down into two camps. On
the one hand, writers such as Gregory (1982) and Markevich and Nafziger (2017) have argued that the
late Imperial economy was relatively dynamic, with the last decades of the regime experiencing fairly
high rates of industrial growth. On the other side, Allen (2003), Cheremukhin et al. (2017), and Owen
(1991) have asserted that significant structural impediments impeded Russian economic modernization
right through the Revolution. While the truth is perhaps somewhere in the middle, practically no
empirical work has been done with micro-level data to examine just how institutional and economic
conditions impacted firm behavior and outcomes. Exceptions include the recent work by Gregg (2016)
and Gregg and Nafziger (2017), who find that firms adopting the corporate form of organization
experienced considerable flexibility in their financial strategies, which translated into greater capital
accumulation, investment in new technologies, and growth. Implicitly, and following Owen (1991), a
conclusion from their work is that a more flexible and low-cost process of incorporation would have
improved the level and pace of industrial development.
As industrialization spread over the long 19th century, capital requirements rose, and firms
increasingly adopted corporate or limited liability forms of partnerships to ease access to financing larger
scale investments. Changes to legal and regulatory regimes enabled the rise of more flexible and long-

lived forms of firm organization that, in effect, lowered capital costs, streamlined internal structures,
shielded assets, and embedded limited liability. This was the case in the United States, Britain, Germany,
and other industrial leaders, but it was also true in Imperial Russia. However, much existing historical
work on industry, firm and market dynamics during this period has focused, perhaps appropriately so, on
establishments and on the “real side” of the enterprise: output, employment, capital utilization, and
productivity. There is a literature in financial history that examine the financial dynamics of firms or
industries over time, but such studies have typically involved small and often non-random samples of
firms. Corporations, as perhaps the leading sub-set of all firms, have tended not to receive specific
scholarly attention integrating real and financial outcomes. And practically no quantitative historical
research into firms has focused on an economy as poor as late Imperial Russia. This paper aims to bridge
these gaps by focusing on the entry, exit, and life-cycles of corporations between the years 1900 and 1914
through the analysis of a new panel dataset derived from published balance sheet and available corporate
charter information. To our knowledge, this dataset of over 2500 corporations represents a unique
opportunity to investigate the micro-structure of economic and financial development in a late-
industrializing economy.
Our empirical study considers a series of questions related to the demographics and dynamic
experiences of late Imperial corporations. We define and study entry and exit rates to consider what
characteristics of corporations were important factors behind what were critical processes for a
developing market economy. We also examine the experiences of de novo corporations, corporations with
different governance structures, and corporations in different industries to better understand the role
played by this type of firm in the Russian context. We also document how firms’ profitability and market
shares evolve as they age. In sum, we interpret our evidence as consistent with a relatively positive
assessment of the Imperial corporate sector, and that these leading firms of early Russian industrial
development were able to make fairly flexible and constrained optimal decisions.
The unique features of the Imperial Russian context allow us to make new connections among
economics of institutions, corporate governance, and industrial organization. While classic studies in

industrial organization consider differences between brand new entrants and entry that consists of firms
that diversify into new industries, little research has examined how brand-new firms differ from those that
change enterprise forms, for example from partnerships to corporations. We also are able incorporate an
examination of corporate governance into our study or entry and exit, since Russia’s two corporation
types can serve as a proxy for differently governed corporations. Finally, the barriers to entry into the
Russian corporate sector are relatively well understood, which allows us to consider how such entry
barriers can distort the corporate sector across industries.
In what follows, we move from outlining the historical and economic context, to specifying and
evaluating a set of hypotheses regarding corporate characteristics and outcomes, before concluding with
some remarks on our larger project studying Imperial Russian corporate governance, finance, and
performance. Along the way, we spend considerable time presenting and describing our new dataset, a
central contribution our project.
II. From Economic Context to Empirical Hypotheses
We focus on the Russian economy between the late 1890s and World War I. According to the
national income and business cycle research of Gregory (1982) and Owen (2013), over this period the
Russian economy experienced a mid-decade boom, followed by a slide into a downturn (bottoming out in
1901), growth to 1905, a massive contraction following the 1905 Revolution, and a slow, erratic recovery
leading up to the First World War. While per capita income changed little over the period, and the
economy remained largely agrarian, this period did see critical early stage of growth in Russia’s industrial
sector (Kafengauz, 1994). A long line of scholarship interprets this early Russian industrial development
as a consequence of various state initiatives in the economy (Gatrell, 1986; Gerschenkron, 1965; Von
Laue, 1965).3 The Witte System, a collection of policies designed to encourage industrialization and
3 Some authors question whether there really was much impact from these state initiatives (in terms of replacing the otherwise absent “pre-requisites” for industrial modernization, as Gerschenkron argued) over this period (e.g. Allen, 2003; Kahan, 1989).

overall economic development, included a tariff regime, the formal adoption of the gold standard in 1897,
and investment guarantees and activist state involvement in railroads and other sectors. The abolition of
communal property restrictions after 1905, increased public investment in schooling, and rising
government demand for military-related products all lent further impetus towards at least some industrial
development.
In contrast to important general accounts by Kafengauz (1994) and others, there has been
relatively little work on late Imperial Russian industrial development from the microeconomic perspective
of the firm. Indeed, basic facts about the micro-structure of early Russian industrialization remain largely
unknown. Tugan-Baranovsky (1970) undertook a pioneering investigation of the transition to modern
factory production, which drew upon rich but idiosyncratic data from a very small set of factories in the
Moscow region. Various case studies and contemporary accounts have explored the experiences of
specific industrial plants (e.g. Markevich and Sokolov, 2005), communities (e.g. Vorderer, 1990), firms
(e.g. Grant, 1999), and sectors (e.g. McCaffray, 1996). But only very recently have works such as Gregg
(2016), Gregg and Nafziger (2017), and Kulikov and Kragh (forthcoming) explored larger samples of
firms to better identify the factors underpinning or constraining industrial growth.
The particular value of micro-data on industrial firms is to document patterns and underlying
drivers of entry, exit, and survival. As we detail below, such information helps to clarify market structures
and the nature of competition within leading and flagging sectors, thus sharpening our understanding of
the earlier stages of industrialization. In the context of Imperial Russia, empirical evidence on the ease of
entry, level of market concentration, and dynamics of firm survival is practically non-existent.4 The
emphasis on the role of Imperial policies and financing has framed early Russian industrial development
in a largely macroeconomic light. How firms reacted to the resulting incentives of the institutional
environment regarding entrepreneurship, financing, input, technology adoption, merger and acquisitions,
4 Gregory (1982), Kafengauz (1993), and contemporary sources such as Varzar and Kafengauz, ed. (1929) do document industry sub-sector level growth between the early 1880s and 1913. In future work, we hope to consider specifics patterns in our corporate micro-data in connection with more aggregate trends.

bankruptcy, and other decisions, and the consequences for market structure and sectoral change, has only
been explored in a limited and largely qualitative fashion (e.g. Guroff and Carstensen, eds., 1983; McKay,
1970; Owen, 1991). This paper is a first attempt to rectify this by considering one particular set of
modernizing firms: those that incorporated.
Among other factors, and following on Owen (1991), studies such as Gregg (2016) and Gregg
and Nafziger (2017) have argued that the absence of general incorporation was a critical impediment to
firm expansion and output growth in the late Imperial period. In failing to allow easier entry into
incorporation, Imperial Russian policy raised the costs of financing investment, increased the riskiness of
entrepreneurial activities, and limited the planning horizon for firms. Thus, by making incorporation a
subjective and ultimately politicized process, Imperial commercial law may have raised entry barriers and
reduced competition in Russian industry. This is consistent with the recent work of Cheremukhin et al.
(2017), who assert that late Imperial industrialization was slowed by excessive market power.5 However,
identifying whether this was the case requires a clearer understanding of the dynamic patterns of entry,
exit, and survival experienced by corporations, as they constituted the primary organizational form in the
modernizing sub-sectors of Russian industry (Kulikov and Kragh, forthcoming).6 Before presenting our
new dataset, we describe relevant aspects of the Imperial Russian legal, financial, and industrial setting.
By connecting this context to insights drawn from modern literatures, we generate a set of hypotheses
regarding corporate entry, exit, and survival patterns that we can then bring to the data.
II.1: The Corporation in Imperial Russia
Late Imperial entrepreneurs could select one of a small number of organizational forms: sole
proprietorship, simple partnerships, and joint-stock corporations. However, Russia failed to introduce
5 Imperial Russia’s size, ongoing internal market development, and the timing of its industrialization during the “Second Industrial Revolution” might have raised the optimal scale of production. The associated increase in fixed costs would also imply growing barriers to entry. Such developments would have reinforced the possible advantages of the corporate form. 6 According to Gregg’s (2016) calculations, corporations controlled roughly 5% of all industrial establishments, but these plants generated over 40% of industrial revenue over the period 1894-1908.

either general incorporation or a private (non-corporate) business form that offered complete limited
liability (e.g. the PLLC, as defined by Guinnane et al. 2007). Rather, the process of charter application
and approval generated considerable variation in corporate structures and governance.7 Although the
Ministry of Finance provided some guidelines, the bargaining and idiosyncrasies of the approval process,
perhaps involving bribery and/or political imperatives, meant that the details and overall coverage of the
charters differed between otherwise similar firms. Furthermore, when corporations wished to change
elements of their charter, such as their system of governance or capitalization level, they had to return to
the Ministry and obtain a formal revision. Thus, initial chartering and re-chartering were certainly costly
processes, which likely limited access to incorporation for many Russian firms (Gregg, 2016). However,
the evident variation in the manner in which firms incorporated – whether as de novo entities or as
restructured versions of pre-existing firms – allows us to explore the implications of different governance
structures for financial strategies and other outcomes, including entry and exit (Gregg and Nafziger,
2017).
Chartered corporations in Imperial Russia self-identified into two types that were indicative of
underlying variation in organizational characteristics. When formulating their initial charters, the vast
majority of corporations defined themselves as either “A-corporations” or “share partnerships.” Although
the commercial code did not formally distinguish the two variants, these identifications likely signaled the
nature of corporate enterprises to potential investors.8 New enterprises that sought outside financing from
wider circles of investors tended to define themselves as A-corporations, while existing partnerships that
incorporated (perhaps to add a small number of new investors) tended to choose the share partnership
label.9 As Gregg and Nafziger (2017) document in greater depth, A-corporations also tended to be larger
(in terms of share capital), made less use of short-term credit relative to longer-term bonds, and issued
7 This impression stems from reading a number of charters and largely follows Owen (1991). 8 Share partnerships, though still Russian corporations formed under the concession system, possessed many characteristics of private limited liability companies, including small circles of investors and reliance on internal financing. Rozenberg’s (1912, p. 42) pamphlet on Russia’s absence of limited liability partnerships complained that the partnership was a “not a legal, but merely a practical form.” 9 See Owen (1991, pp. 12-13 and 152) and Gregg and Nafziger (2017).

smaller dividends as a share of profits. Thus, in our analysis below, we focus on these two broad classes
of corporations as a proxy for underlying governance and financing characteristics.
II.2: From Theory and Fact to Empirical Hypotheses10
We now turn to the historical and modern literatures to help derive a set of hypotheses that we
can take to our new dataset, guided by the nature of our data and the specifics of the environment. The
goal of this empirical work is to develop a clearer understanding of the factors underpinning corporate
entry, exit, and survival as a window into the dynamics of industrial and economic development in the
period.
Our analysis is deeply informed by Dunn et al. (1988), who undertook an influential empirical
investigation of firm entry and exit patterns in the United States between 1963 and 1982. Indeed, our
hypotheses largely derive from the patterns they observed in that context, though ours reflect the very
different institutional and economic environment of late Imperial Russia. Although more recent works
have explored similar entry, exit, and “survivorship” outcomes in other developed economies,11 similar
studies that investigate firms in developing countries or before World War II are largely lacking.12 Data
availability has been a critical binding constraint in historical research. Our panel dataset covering
Imperial Russian corporations presents a unique opportunity to examine these dynamic relationships
empirically.
10 This section represents our initial attempt to formulate testable hypotheses. As such, we recognize that we have only scratched the surface of the possible empirical relationships that could be evaluated with our dataset. 11 For examples in the entry/exit literatures, see Baldwin and Gorecki (1991) on Canadian firms, Disney et al. (2003) on UK manufacturers, Bartelsman et al. (2005) for cross-OECD comparisons, and the pioneering early work by McGruckin (1972) on the U.S. This literature is surveyed in Caves (1998). We discuss works on survivorship below. Our current emphasis is on the empirical literatures on firm entry, exit, and survival – there is also a large relevant theoretical literature on these topics. 12 While studies of firm creation / entry before World War II seems relatively limited (two exceptions are Baten, 2003; and Lloyd-Jones and Le Roux, 1982), there is a small literature – largely on the United States – addressing firm survival and the determinants of exit. We touch upon a few select works in this area below. Work on firm “demographics” in modern developing countries also faces considerable data constraints – see Bartelsman et al. (2004) for an early survey of what is a small literature.

With respect to rates of firm entry and exit, Dunn et al.’s (1988) study and subsequent works
suggests a number of testable hypotheses.13 In their analysis of data from a mature industrialized
economy, the U.S. from the 1960s to 1980s, they find that industries with high entry rates also tend to
have high exit rates, although with controls for industry, entry and exit rates are negatively correlated:
years with high entry rates have low exit rates. If barriers to entry are relatively low, entry rates respond
to prior or current period profit levels within a firm’s industry. New entrants tend to be smaller,
conditional on industry, if firms’ sizes as measured by, say, nominal capitalization, total assets, or market
share indicate achieved market power. Selection on firm survival would suggest that such gaps would be
eliminated over time. If firm size was associated with factors that would work to deter entry by rivals, or
was a proxy for the availability of preferential access to external finance, then exit rates would likely be
negatively related to scale. We can easily examine these possibilities within our new dataset. For
example, we examine distortions in entry patterns due to the concession system and map the evolution of
market shares, a way to benchmark the market power distortions described by Cheremukhin et al. (2007).
Given our consideration of corporations in the Imperial Russian context, we can investigate
whether underlying governance or financial characteristics were associated with differences in the rate of
entry or exit. Were barriers to entry different for the two types of corporations? Was one type inherently
more “stable”? Gregg and Nafziger (2017) provide cross-sectional evidence suggesting that, conditional
on size, industry, and other characteristics (such as age or year), the exact choice of organizational form
had little relationship to profitability among Russian corporations. If we condition on a similar set of
characteristics, we might expect to find little relationship between corporation type (A-corporation vs.
share partnership) and entry or exit rates. However, the more dynamic perspective implied with our panel
approach might suggest a residual role for underlying governance or financial differences by corporation
type. For example, the more widely-held A-corporations have may responded less effectively to market
downtowns and may have been more fragile because of governance costs, roughly following the logic of
13 We are explicit about our definitions of entry and exit rates below.

Hilt (2006). Thus, we investigate the relationship between A-corporation status and entry or exit rates.
Because A-corporations were relatively more prevalent within certain industries, we control for sector
when examining corporation type.
Imperial corporations could be founded as de novo entities or established by existing partnerships
or sole proprietorships.14 The literature has suggested that relative to the diversification of existing firms,
de novo entry is generally more common, although this can vary widely by industry (Dunn et al., 1988;
Geroski, 1995). In our case, the alternative to de novo entry is a change in organizational form by
incorporating an existing industrial concern. Thus, by examining whether new entrants were more or less
likely to be de novo firms than the set of incumbent firms, we investigate a related but different question
than the literature has considered. In terms of exit, Baldwin and Gorecki (1991) and other scholars
emphasize that de novo firms, although perhaps armed with more advanced technologies or other
advantages, tend to fail at higher rates as they struggle to establish customer bases and carve out market
shares. However, as selection takes place, such a gap should decline over time. By coupling our balance
sheet data to information from the initial chartering of our corporations, we can examine these different
possible linkages. Additionally, relatively more share partnerships were created from pre-existing firms,
and so we control for de novo status when examining corporation type.
The trajectory of de novo corporations relative to incorporations by pre-existing firms relates to
large literatures on the dynamics firm survival and firms’ life cycles. Although we cannot hope to do
justice to the richness of the theoretical models and empirical evidence on these topics, our context and
data suggest several important hypotheses. One set of potential empirical relationships investigates factors
that would increase or lower the likelihood that a corporation exists to the next period. Such hazard
models are standard in the industrial organization literature and have seen some historical applications
14 One limitation of our data in their current form is that we do not observe merger activity. In many contexts, this can be an important consideration in understanding the levels and underlying determinants of entry and exit rates (i.e. Jovanovic and Rousseau, 2008). While we hope to remedy this gap in our knowledge with additional library and archival research, to our knowledge, the historical literature on Imperial Russia has not generated any definitive work on mergers or acquisitions.

with richer firm panel datasets.15 Given our context and findings in the broader literature, we hypothesize
that de novo status increases the probability of failure (i.e. raises the hazard ratio), size and profitability
would be negatively related to “failure,” and corporation type would have an ambiguous effect given our
comments above. Finally, as we are investigating corporations rather than other organizational forms
potentially easier to dissolve, our baseline hazard may be lower than is standard in the literature.16
Our panel data allow us to investigate a number of other hypotheses regarding the characteristics
of Imperial corporations over their life cycles. As alluded to above, selection effects would lead us to
expect to see convergence of various outcomes between new corporations and incumbents over time.17
This would possibly include market share and firm size (reflecting efficient scale).18 The convergence of
profitability is potentially more complicated, as the rate may depend on the underlying market
fundamentals in a complicated fashion. Regardless, we can evaluate the pace and extent of any
convergence by examining the dynamics within our balance sheet data.
More generally, the literature has posited various channels linking firm age to growth, exit, or the
probability of continued survival (e.g. Kueng et al., 2014). For example, some studies note that “natural
selection” might lead the most productive and resilient firms to persist, thereby generating a negative
relationship (e.g. Bellone et al., 2008). On the other hand, agency theory might suggest that older
corporations would be more likely to get captured by insiders, which could potentially reduce profitability
and the likelihood to survive (e.g. Arikan and Stultz, 2016). Finally, although we do not explore it directly
in this draft, there is a considerable literature examining the financing and capital structure decisions of
firms over their life-cycles. Prominent among this work are studies that investigate a “pecking order”
15 Historical works that model firm exit using a hazard function approach to survival include Klepper (2002), Postel-Vinay (2016 – on banks), and Thompson (2005). For an early application using modern firm micro-data, see Audretsch and Mahmood (1995). 16 The role of dissolution costs in lowering the “exit” rate of corporations relative to other organizational forms is an important point raised (and shown) in the early 20th century Egyptian context by Artunc and Guinnane (2017). 17 This is akin to the “survivor” method pioneered by Atack (1985) in estimating optimal industrial plant size over the last half of the 19th century in the United States. 18 However, Guerts and Van Biesebroeck (2016), among other scholars, point to a much more complicated interaction between entry, firm size, and firm growth, particularly if adjustment costs (in hiring factor services or obtaining additional inputs) are significant but vary across firms.

framework to describe decisions over debt vs. equity and the use of external vs internal funding. We aim
to document and evaluate such dynamics in related future work.19
We take these and closely related hypotheses to our dataset. We consider our results to be
indicative of the nature of market competition in a period when scholars have argued that excessive
concentration undermined Imperial industrial development (Cheremukhin et al., 2017). However, our data
pertain to corporations and not to firms, establishments, or plants. That makes our study a unique
contribution in the broader literatures on firm entry, exit, and life-cycle dynamics, historical or otherwise.
We address concerns that the underlying theories of firm behavior may not apply to corporations in the
same way as to establishments or plants below.
III. Data
This paper presents and analyzes a panel of newly compiled balance sheet data on all Imperial
Russian non-financial corporations active from 1899 onwards.20 We collected data for individual
corporations as reported in the Ministry of Finance Yearbooks published from 1900 through 1915. Then,
we matched companies over time to form a panel and matched companies to the RUSCORP database
(Owen, 1992) to gather the limited corporate charter information included in that source.
The Ministry of Finance compiled the balance sheet information appearing in their yearbooks
from the official commercial periodical Vestnik finansov i torgovli,21 in which corporations published
financial statements required by the commercial code and by their individual charters. Figure 1 presents
an example of such entries for the Martens and Daab Partnership for the 1900-1901 accounting year.
Panel A shows that Martens and Daab had 63,853 rubles in the credit column of their balance sheet
19 The recent study by Hansen and Ziebarth (2017) examines not only business failures (i.e. bankruptcies) in the Great Depression, but it shows the underlying changes in firm finances that brought about such “exits.” Given the Russian economy’s macroeconomic fluctuations of our period, we hope to undertake a similar analysis in future work. More generally, we have yet to investigate commercial bankruptcy practices in the Imperial period. 20 Corporate commercial banks’ balance sheets were reported separately; we have not yet fully compiled this information. 21 Vestnik finansov i torgovli. Otchety torgovlykh i promyshlennykh prepriiatii.
published in the Vestnik, which is the number reported in the “Creditors” column of the compiled
Ministry of Finance Yearbook (1902 volume) balance sheet data in Panel B (and enlarged in Panel C).22
We construct our panel dataset from balance sheet information published in the yearbooks of
1900-1915. These volumes appear to provide complete data for corporations regarding the accounting
years 1899-1914, with a small number of observations from earlier years.23 We matched corporate
observations across time by hand to form the (unbalanced) panel to ensure that different spellings and
marginal changes to corporate names over time could be identified and reconciled.
This process yielded a small number of duplicate observations, which we reconcile as follows.
First, we noted several instances of separate balance sheet entries for subdivisions of a company’s
activities; for example, balance sheet information for the company’s factory in Moscow and for the
headquarters located elsewhere. Such observations begin with the words “Same for…” (Tozhe). We
dropped these subsidiary observations, because it appears that their information is included in the total
balance for the whole company (at the headquarters). Second, some companies’ balance sheets for a given
accounting year are reported in two or more different published volumes. Usually, the entries across
volumes are identical, but in some cases, there are small differences, and in others, only one published
volume includes certain entries. We believe that repeated reporting of balance sheets for the same
accounting year represent revisions and corrections. Thus, when a company’s accounts for the same
accounting year are reported in two or more published volumes, we take the latest observation. Third,
information on some companies is reported several times within the same published volume across
different industries, with identical balance sheet numbers reported in each entry. In such cases, we
consolidate the information into a single entry for what appears to be the primary industry and drop the
22 Gregg and Nafziger (2017) discuss the basics of accounting in published Russian balance sheet data of the period. 23 “Appear to” here means that we have yet to comprehensively investigate which active corporations might be missing from our balance sheet data. Our sense is that the number is small, although see our discussion of the 1905 data below. A key difficulty is that our identification of corporations stems from charter information (derived from Owen, 1992), but firms may not immediately begin operations, if they even operate at all. Moreover, while it appears that the Ministry compiled and published all available balance sheet information issued in Vestnik finansov i torgovli, we have yet to double check the correspondence.

other observations. For companies reporting in different industries with dissimilar balance sheet entries
that are identified as the same firm, we generate a new unique firm id for each one. There are few
corporations (less than 1% of the sample) that fit this category.
The published balance sheets were divided into “active” and “passive” sections, which roughly
correspond to modern definitions of assets and liabilities.24 The active columns included property,
materials, debits, other items, and losses; the passive columns included share capital, reserves,
amortization, other capital, and “creditors.” We consider “property” to be fixed and movable forms of
capital, materials to be intermediate inputs, and “debits” to be comparable to accounts receivable. “Other
capital” includes bonds. “Share capital” is current nominal capital, some of which may not yet be paid in,
and we deem “creditors” to be equivalent to accounts payable. Appendix Table 1 provides the
correspondence between the original Russian and our translations (also see below). Note that we only use
a subset of the balance sheet variables in the present analysis.
Until the 1909 cross-section, the balance sheets also reported total revenue and total expenditure
by the firm. When the difference between revenues and expenditures was positive, it was reported as Net
Profit, because this account could then be used for paying dividends. After 1909, balance sheets ceased to
report total annual revenues and expenditures and instead only reported direct measures of profit, either
the difference between assets and liabilities (“balance profit” – 1910 onwards) or a measure of net profits
for use as dividends (“profits for distribution” – 1911 onwards). We believe that profits for distribution
mostly closely resembles the earlier definition of net profit, so our preferred measure over the whole
panel uses balance profits in 1910 and profits for distribution from 1911 onwards. Because the definition
changes slightly, we are careful to include year controls in our empirical work below.
24 These balance sheets appear to mix concepts related to stocks (assets and liabilities) with flows (of cash), which are typically kept separate in modern accounting practices.

III.1: The Structure and Relevant Moments of the Dataset
In its entirety, our dataset describes 2,865 unique corporations observed in at least one year
(Table 1). From 1700 to 1915, the Russian Ministry of Finance granted corporate charters to only 4,542
firms, of which 345 were finance corporations and hence outside our current database.25 Despite only
covering the last 15 years of Imperial Russia, our dataset covers almost 60% of the total non-financial
corporations established in the Empire.
Table 1 presents an overview of the dataset by industry and accounting year. Overall, our data
include 19,797 balance sheet observations. Textiles, foods, metals, and mining represent the largest
industrial categories (Panel B). Gregg’s (2016) work on incorporation explains this pattern, noting that
both textiles, metals, and mining were capital-intensive industries with high incorporation rates.
Moreover, Imperial Russia possessed a large foods industry, in terms of both incorporated and non-
incorporated enterprises, so it is not surprising that such a large number of our balance sheet observations
document food-related enterprises. Finally, Panel C shows that the implied annual number of corporations
in our database was relatively stable except for some reporting of earlier accounting years in the 1900
Ministry of Finance yearbook. The smallest number of corporations reporting balance sheets between
accounting years 1899 and 1914 was 278, and the maximum was 1,712. Only 278 firms reported accounts
(and had them subsequently compiled and published) for the year 1905, most likely because of
disruptions caused by the 1905 Revolution, Russo-Japanese War, and general social unrest. We control
for year effects in our regression work to (partly) address this disparity, although we are aware that this
does not fully alleviate the selection issues that might arise in reporting (or not reporting) financial data in
a given year.26
25 Our data include corporations headquartered in the Polish provinces of the Empire c. 1900. 26 The breakdown of the accounting years featured in each Ministry of Finance yearbook is reported in Table A2. Most of the accounting years before 1899 appear in the 1900 Ministry of Finance yearbook. In each subsequent yearbook, most observations cover the preceding accounting year, though a small number report information from two or more previous accounting years. Throughout the analysis below, we rely on the accounting year to pin each cross-sectional observation down.

Table 2 provides a breakdown of variables from the published corporate balance sheets and
original charter information (from Owen, 1992) that we utilize in this paper. Share capital is current
nominal capitalization, whether paid in or not (the data do not allow us to distinguish). “Total assets” are
a rough measure of the asset side of the balance sheet. “Property” is the value of movable and immovable
productive capital within Total assets. “Other capital” largely includes bonded debt, and “Creditors”
corresponds to accounts payable, which together we interpret to be indicative of access to credit. Profits is
as described above. As is standard in the corporate finance literature, we scale these last four balance
sheet variables by the value of total assets. Every balance sheet item has a right-skewed distribution, with
the presence of some extreme large values. Aside from these financial variables, we also draw on
information from the RUSCORP database regarding the type of corporation (A-corporation or share
partnership), the age of the corporation, and whether it was a new firm or not when it obtained a charter.
The two key variables of interest in this paper are the exit and entry rates of corporations, which
we define indirectly within our balance sheet data. A corporation is said to enter in a given year when
that year is the first time it is observed in our dataset, using the 1899 cross-section as the baseline. A
corporation is said to exit if it is never observed again after a given accounting year. Following Dunne,
Roberts, and Samuelson (1988, p. 502), we define the entry rate in aggregate for an accounting year or for
a given group as the number of new corporations in year t divided by the total number of corporations in
year t − 1. Similarly, the exit rate in accounting year t − 1 is the number of corporations in year t − 1
that are never observed again in our data, divided by the total number of corporations in year t − 1.
Implicitly, we assume that new corporations in 1900 did not exist before our baseline year of 1899, and
that exiting ones in 1913 did not return after 1914.
Our definitions may miss two other key aspects of broader notions of firm entry or exit. On the
entry side, we do know whether the firm existed before incorporation, but we currently cannot separate
mergers of existing corporations from the observationally equivalent exit of two (or more) firms and the
entry of a new one into corporate status. On the exit side, we assume that disappearance from our data
equates to “exit” in the sense of corporations shutting down. Although we are not aware of specific
empirical evidence, it is not only possible that some of what we are calling exits were parts of mergers or
other restructurings, but that some corporations “went private,” gave up status as a corporation (returning
to sole proprietorship or partnerships forms), and stopped publically reporting financial information to the
Ministry of Finance. In future work, we hope to address these possible sources of measurement error in
our entry/exit data by taking a closer look at the contemporary financial press and using information on
corporate founders to develop genealogies of firms.
Keeping these caveats in mind, we apply our definitions to the balance sheet dataset to determine
entry and exit rates over time and across industries. Table 3 reports the former between 1900 and 1913.
Entry rates were high at the beginning and end of the period with a lull in the middle (although 1906
appears to indicate a rebound from the crisis year of 1905. Exit rates were relatively constant with a small
upward trend, a burst in 1905, and a very high level in 1913. The difference between entry and exit rates
is broadly suggestive of three sub-periods: entry-dominant until 1904, then a two-year period of relatively
more exit, followed by a rebound in entry that lasted until 1913. Given our definitions, we are wary of
attributing too much to the end points of our period, as there may be a mechanical reason for the observed
higher rates.
Table 3 also juxtaposes the annual percentage change in real GDP from Gregory (1982) against
our corporate entry and exit rates. Averaging over the period, corporations were entering and exiting at
higher rates than the economy was growing: 11.5 and 8.9% vs. 3.3%. The correlations of either of these
series with the percentage change in NNP are very small. While this might be because NNP captures
more than just the industrial sectors underpinning our dataset, it may also reflect structural issues
surrounding the incorporation process. We return to related interpretative issues below.
Table 4 documents mean (across years) entry and exit rates across broad industrial classes. While
some of the older or primary sector industries such as textiles, agriculture, paper, etc. saw relatively little
corporate “churning” over the period, some more “modern” sectors such as chemicals, transportation, and
metals (along with “Miscellaneous”) saw higher entry and exit rates, with the former exceeding the latter.
This pattern is suggestive of a shift of productive factors into higher growth sectors, as suggested by the

growth in corporate financial characteristics depicted in Appendix Table A3. Perhaps most striking is the
large (net) entry of corporations engaged in trade. This group included shipping companies, wholesalers,
and companies engaged in foreign trade.
IV. Empirical Exercises and Interpretations
Our new balance sheet dataset covers the universe of corporations in late Imperial Russia. This
dynamic picture of characteristics and outcomes of such entities in a relatively poor historical economy
constitutes a unique opportunity to dig deeper into the forces driving firm creation, destruction, and
survival during the early stages of industrialization. In interpreting the patterns in entry and exit rates
noted above, as well as in the survival of corporations, we draw on the series of hypotheses outlined
above. The subsequent exercises are not exhaustive but do lead us to set of interpretations and further
questions regarding the role of the corporation in early Russian industrialization.
Tables 5 and 6 depict estimates from simple probit models of entry and exit.27 The outcome
variables are whether the observed firm is a new entrant or will exit next period, as described above. We
keep the set of covariates simple, focusing on the factors noted in the hypothesis section. Each
specification in these tables controls for the accounting year and for the industrial classification of the
firm, as denoted in the original corporate charters and noted in Table 1. These specifications are meant to
be purely descriptive and should not be read as indicative of tight causal relationships. The specifications
differ in the number of observations due to missing data. Implicitly, these regressions compare entrants
and “exiters” with themselves when incumbents.
Considering the results on entry as reported in Table 5, a number of the coefficient estimates are
noteworthy. As measured by the (log) share capital, our indicator of firm size (which does evolve over
time) is negative associated with entrant status. Entrants were, on average, smaller than incumbents. Even
conditional on size, entrants were less profitable than incumbents. Both of these findings are consistent
27 Results from similar logistic or linear probability models are similar. The models in Tables 5-8 employ robust standard errors.

with life cycle perspectives on firm characteristics. Finally, entrants were more likely to be A-
corporations and to have existed as concerns prior to incorporation, consistent with prior work on
corporations in the period (Gregg and Nafziger, 2017; Owen, 1991).
As to exit, the findings from simple probit models of Table 6 are less clear cut. Corporate size
shows up negatively, but this is not generally statistically significant, nor does it hold when the age of the
firm is included (Column 5). Profitability appears to hold off exit, but again this association goes away
when the age of the firm is included. The results in Table 6 on the age of the corporation – negatively
related to “exiter” status – are consistent with the hypotheses posed above: the maturity of firms likely
proxied for a variety of unobserved incumbency advantages that grew over a firm’s life. Finally, A-
corporations were not only more likely to be entrants, but they were also more often “exiters.” In part, this
is picking up de novo status, but it also may reflect the greater dependence of such firms on uncertain
external financing from a larger circle of investors (Gregg and Nafziger, 2017).
We can go beyond Tables 5 and 6 to consider the relationship between entry and exit rates,
industry, and mean firm characteristics within those industries. Figure 2 presents such a multi-
dimensional comparison, using mean log revenues in the previous year by industry as the x-variable in
both the top (entry rates) and bottom (exit rates) panels. Although these are gross revenues only, the
figure shows a positive relationship with subsequent entry, and a negative one with the exit the following
year across industries. However, when we consider (log) profits scaled by total assets in the previous year
(Figure 3), we observe a different set of relationships. As simple intuition would suggest, entry rates were
positively associated with prior profits, implying that even corporations (as opposed to firms with lower
entry barriers) were responsive to market opportunities. But at the same time, as the bottom panel would
seem to imply, exit rates were also higher for higher level. This could be consistent with the finding in the
modern literature that entry and exits rates tended to be high in the same industries, perhaps implying a
version of creative destruction. However, the difference between Figures 2 and 3 could be related to the
particular advantages that corporations may have held – financial, legal, and even political – that would

have allowed them to avert exit in the face of low profits. Further work will be necessary to unpack
Figures 2 and 3.28
The simple probit specifications of Table 6 do not take into account the dependence of the
probability of exit in a current period on a firm’s prior history. The more standard way to model such
processes, as we noted above, is in a Cox Proportional Hazard framework. This is what we undertake in
Table 7, where the coefficients are to be interpreted relative to 1: greater than one means an increase in
the likelihood of exit relative to the baseline hazard, less than one means the opposite.29 The results are
largely consistent with the probit models of Table 6. If we consider just Column 6, more profitable and
larger (defined by revenue) corporations were less likely to exit. Although not statistically significant, A-
corporations were more likely than share partnerships to exit, as were firms that existed prior to
incorporation.
We also explore the dynamics of corporate characteristics following entry. We focus on evidence
that surviving firms experienced a process of converge to mean levels for the incumbents in their
industry. The underlying regression is a simple linear one, specified as:
$%&' = )* + ,%' + -% + .' + /& + 0%&'
where Y is the outcome (log (scaled) revenue, log (scaled) profit, or market share in the firm’s industry)
for firm i in year t, gamma is a set of controls for the age of firm, eta is a set of cohort controls for firm i,
mu is a set of accounting year controls, and lambda controls for industry j. Given this specification, the
convergence can be seen by examining what happens to gamma.
Table 8 presents the results from this exercise employing the three different characteristics of
corporations as our dependent variable. As is clear for all three, new Russian corporations experienced a
significant amount of convergence to incumbents within their industry, even controlling for cohort. The
28 Table A3 provides evidence on the underlying growth rates in property, share capital, and revenue across industries for comparative purposes. 29 Standard errors reported in estimates of Cox Proportional Hazard models are exponentiated. Our Table reports the (asymptotic) confidence intervals reported by STATA. One of the advantages of this type of hazard model is that the functional form of baseline hazard is not explicitly assumed.

results are perhaps most striking for market share, which we define as the portion of industry-by-year
revenue that a corporation generates. The pace of convergence in market share is depicted in Figure 4,
which just indicates the evolution of the coefficients on the different age coefficients. Although these
regressions may not imply full convergence to the incumbents (represented as the omitted category of
corporations older than 15 years at any point in time), the dynamics of market share, revenues, and profits
suggest that the life-cycle experience of Russian corporations did follow a logic consistent with standard
theories of market structure.
V. Conclusions and Future Work
The previous section has engaged in a series of empirical exercises that, in sum, suggests that
Imperial Russian corporate behavior was largely consistent with observed and hypothesized patterns of
firm entry, exit, and life-cycle dynamics in modern and historical literatures. Despite Russia’s
macroeconomic backwardness, we were able to link the industry, age, size, profitability, and governance
structure of corporations to the births, deaths, and lives of these firms. While Owen (1991) and others
have argued that the Russian incorporation process was an inefficient and largely politically determined,
our results speak to at least a modicum of flexibility and responsiveness of firms with this particular
organizational form. Of course, becoming or dissolving a corporation were typically more costly and
time-consuming processes than they were for “simpler” types of firms such as partnerships or sole-
proprietorships. The implication is that the entry and exit rates we observe in our data are certainly lower
bounds on the likely demographics of all late Imperial Russian firms.
Some evidence on this possibility is provided in Table 9, which utilizes the data on all Russian
industrial establishments observed in 1894, 1900, and 1908 to document entry and exit rates over these
multi-year periods for corporate and non-corporate entities (Gregg, 2016). Clearly, the overall entry rates
of corporations, which were relatively few in number compared to the thousands of other firms, were an
order of magnitude lower than the corresponding rate for non-corporations. What is especially intriguing;
however, is that corporate exit rates were apparently quite high over this period. This, again, is consistent
with a rather dynamic view of the Russian corporate sector, one that does not quite correspond to the
assertions of market power and inflexibility in works like Cheremukhin et al. (2017).
In future work, we hope to expand our analysis to be more explicitly comparative between the
Russian experience and firm demographics in other historical and modern settings. That will help us
better diagnose whether the entry and exit rates that we observe in our dataset really are relatively low or
high. Moreover, we hope to take additional advantage of the uniqueness of our panel of corporate balance
sheet information to document and evaluate the linkages between governance structures, financial
strategies, and real outcomes like entry, exit, and form growth. Such a project will be an important
contribution towards the understanding of the corporation’s role in the early stages of modern industrial
development, both in Imperial Russia and in other low-income countries.

References Allen, Robert C. From Farm to Factory: A Reinterpretation of the Soviet Industrial Revolution. Princeton, NJ: Princeton University Press, 2003. Arikan, Asil M., and Rene Stultz. “Corporate Acquisitions, Diversification, and the Firm’s Life Cycle.” The Journal of Finance 71.1 (2016): 139-193. Artunc, Cihan, and Timothy W. Guinnane. “Partnership as Experimentation: Business Organization and Survival in Egypt, 1910-1949.” Yale Economic Growth Center Discussion Paper No. 1057. Atack, Jeremy. “Industrial Structure and the Emergence of the Industrial Corporation.” Explorations in Economic History 22 (1985): 29-52. Audretsch, David, and Talat Mahmood. “New Firm Survival: New Results Using a Hazard Function.” The Review of Economics and Statistics 77.1 (1995): 97-103. Baldwin, John, and Paul Gorecki. “Firm Entry and Exit in the Canadian Manufacturing Sector, 1970-1982.” The Canadian Journal of Economics 24.2 (1991): 300-323. Bartelsman, Eric, John Haltiwanger, and Stefano Scarpetta. “Microeconomic Evidence of Creative Destruction in Industrial and Developing Countries.” The World Bank Policy Research Working Paper No. 3464. October 2004. Bartelsman, Eric, Stefano Scarpetta, and Fabiano Schivardi. “Comparative Analysis of Firm Demographics and Survival: Evidence from Micro-Level Sources in OECD Countries.” Industrial and Corporate Change 14.3 (2005): 365-391. Baten, Joerg. “Creating Firms for a New Century: Determinants of Firm Creation Around 1900.” European Review of Economic History 7.3 (2003): 301-329. Bellone, Flora, Patrick Musso, Lionel Nesta, and Michel Quere. “Market Selection Along the Firm Life Cycle.” Industrial and Corporate Change 17.4 (2008): 753-777. Caves, Richard E. “Industrial Organization and New Findings on the Turnover and Mobility of Firms.” Journal of Economic Literature 36 (1998): 1947-1982. Cheremukhin, Anton, Mikhail Golosov, Sergei Guriev, and Aleh Tsyvinsky. “The Industrialization and Economic Development of Russia through the Lens of a Neoclassical Growth Model.” Review of Economic Studies 84.2 (2017): 613-649. Disney, Richard, Jonathan Haskel, and Ylva Heden. “Entry, Exit and Establishment Survival in UK Manufacturing.” The Journal of Industrial Economics 51.1 (2003): 91-112. Dunne, Timothy, Mark J. Roberts, and Larry Samuelson. “Patterns of Firm Entry and Exit in U.S. Manufacturing Industries.” The Rand Journal of Economics 19.4 (1988): 495-515. Gatrell, Peter. The Tsarist Economy 1850-1917. London: B. T. Batsford, 1986. Geroski, Paul. “What Do We Know About Entry?” International Journal of Industrial Organization 13 (1995): 421-440.

Gerschenkron, Alexander. “Agrarian Policies and Industrialization, Russia 1861-1917.” The Cambridge Economic History of Europe (VI). The Industrial Revolutions and After: Incomes, Population and Technological Changes (2). Eds. H.J. Habakkuk and M. Postan. Cambridge: Cambridge University Press, 1965. 706-800. Geurts, Karen, and Johannes Van Biesebroeck. “Firm Creation and Post-Entry Dynamics of De Novo Entrants.” International Journal of Industrial Organization 49 (2016): 59-104. Grant, Jonathan. Big Business in Russia: The Putilov Company in Late Imperial Russia, 1868-1917. Pittsburgh, PA: University of Pittsburgh Press, 1999. Gregg, Amanda G. “Factory Productivity and the Concession System of Incorporation in Late Imperial Russia.” Working paper, 2016. —, and Steven Nafziger, “Capital Structure and Corporate Performance in Late Imperial Russia.” Working paper, 2017. Gregory, Paul. R. Russian National Income, 1885-1913. Cambridge: Cambridge University Press, 1982. Guinnane, Timothy, Ron Harris, Naomi R. Lamoreaux, and Jean-Laurent Rosenthal. “Putting the Corporation in its Place.” Enterprise and Society 8, No. 3 (2007): 687-729. Guroff, Gregory, and Fred Cartensen, eds. Entrepreneurship in Imperial Russia and the Soviet Union. Princeton, NJ: Princeton University Press, 1983. Hansen, Mary, and Nicolas Ziebarth. “Credit Relationships and Business Bankruptcy During the Great Depression.” American Economic Journal: Macroeconomics 9.2 (2017): 228-255. Hilt, Eric. “"Incentives in Corporations: Evidence from the American Whaling Industry.” Journal of Law and Economics 49.1 (2006): 197-227. Jovanovic, Boyan, and Peter Rousseau. “Mergers and Reallocation.” The Review of Economics and Statistics 90.4 (2008): 765-776. Kafengauz, Lev B. Evolutsiia promyshlennogo proizvodstva Rossii. Moscow: Russian Academy of Sciences, 1994. Kahan, Arcadius. Russian Economic History: The Nineteenth Century. Chicago: University of Chicago Press, 1989. Klepper, Steven. “The Capabilities of New Firms and the Evolution of the US Automobile Industry.” Industrial and Corporate Change 11.4 (2002): 645-666. Kueng, Lorenz, Mu-Jeung Yang, and Bryan Hong. “Sources of Firm Life-Cycle Dynamics: Differentiating Size vs. Age Effects.” NBER Working Paper No. 20621. October 2014. Kulikov, Volodymyr, and Martin Kragh. “Big Business in the Russian Empire: A European Perspective.” Business History (forthcoming)

Lloyd-Jones, R., and A. A. Le Roux. “Marshall and the Birth and Death of Firms: The Growth and Size Distribution of Firms in the Early Nineteenth-Century Cotton Industry.” Business History 24.2 (1982): 141-155. Markevich, Andrei, and Steven Nafziger. “State and Market in Russian Industrialization, 1870-2010.” Industrial Growth in the Global Periphery Since 1870. Eds. Kevin H. O’Rourke and Jeffrey Williamson. Oxford: Oxford University Press, 2017. 33 – 62. Markevich, Andrei, and Sokolov, Andrei. ‘Magnitka bliz Sadovogo kol'tsa': stimula k rabote na Moskovskom zavode 'Serp i molot', 1883–2001 gg. Moscow: Rosspen, 2005. McCaffrary, Susan P. The Politics of Industrialization in Tsarist Russia: The Association of Southern Coal and Steel Producers, 1874-1914. DeKalb, IL: Northern Illinois University Press, 1996. McGruckin, Robert. “Entry, Concentration Change, and Stability of Market Shares.” Southern Economic Journal 38.3 (1972): 363-370. McKay, John P. Pioneers for Profit: Foreign Entrepreneurship and Russian Industrialization: 1885-1913. Chicago: University of Chicago Press, 1970. Owen, Thomas C. The Corporation under Russian Law, 1800-1917. Cambridge, 2002. —. “Measuring Business Cycles in the Russian Empire,” Economic History Review 66.3 (2013): 895-916. —. RUSCORP: A Database of Corporations in the Russian Empire, 1700-1914. Third Release. Ann Arbor: Interuniversity Consortium for Political and Social Research, 1992. Postel-Vinay, Natacha. “What Caused Chicago Bank Failures in the Great Depression? A Look at the 1920s.” The Journal of Economic History 76.2 (2016): 478-519. Rozenberg, V.V. Tovarishchestvo s orgranichennoiu otvetstvennost’iu: o neobkhodimosti vvedeniia etoi formy v Rossii. St. Petersburg: Ministry of Finance Publishing, 1912. Thompson, Peter. “Selection and Firm Survival: Evidence from the Shipbuilding Industry, 1825-1914.” The Review of Economics and Statistics 87.1 (2005): 26-36. Tugan-Baranovsky, Mikhail. The Russian Factory in the 19th Century. 3rd ed. Trns. Athur and Cloara Levin. Homewood, IL: Richard T. Irwin, 1970. Varzar, V. E., and Lev Kafengauz. Svod statisticheskikh dannykh po fabrichno-zavodskoi promyshlennosti c 1887 po 1926 god. Chast’ 1: promyshlennost’ 1900 goda. Moscow: 1929. Von Laue, Theodore. Sergei Witte and the Industrialization of Russia. New York: Columbia University Press, 1963. Vorderer, Susan M. “Urbanization and Industrialization in Late Imperial Russia: Ivanovo-Voznesensk, 1880-1914.” Unpublished Ph.D. dissertation, Boston College, 1990.

Original Sources
Russia, Ministry of Finance. Yearbook of the Ministry of Finance. [Ezhegodnik Ministerstva Finansov], 1900-1915.
Vestnik finansov i torgovli. Otchety torgovlykh i promyshlennykh prepriiatii. [Herald of Finance and
Commerce. Reports of commercial and industrial enterprises]. Tables.

Table 1: Numbers of Corporations by Accounting Year and Industry Panel A: Number of Observations and Unique Firms Number Total Observations 19,797 Unique Firms 2,865
Panel B: Number of Corporate Observations by Industry, 1896-1914 Industry Number Percentage Percentage of Total
Share Capital Agriculture 94 0.47 0.15 Animals 296 1.50 1.02 Ceramics 885 4.47 2.60 Chemicals 975 4.93 4.30 Food 3,553 17.95 9.17 Metals 2,408 12.16 16.89 Mining 2,283 11.53 20.13 Miscellaneous 904 4.57 4.38 Municipal Serv. 1,494 7.55 6.38 Paper 726 3.67 1.82 Textiles 3,514 17.75 21.21 Trade 1,387 7.01 5.19 Transportation 818 4.13 5.63 Wood 458 2.31 1.14 Total 19,795 100 100
Panel C: Number of Corporate Observations by Accounting Year, 1896-1914
Accounting Number Percentage Accounting Number Percentage Year Year
1896 1 0.01 1906 1,260 6.37 1897 7 0.04 1907 1,280 6.47 1898 215 1.09 1908 1,370 6.92 1899 947 4.78 1909 1,154 5.83 1900 1,102 5.57 1910 1,454 7.35 1901 1,190 6.01 1911 1,474 7.45 1902 1,249 6.31 1912 1,590 8.03 1903 1,273 6.43 1913 1,712 8.65 1904 1,126 5.69 1914 1,113 5.62 1905 278 1.40 Total 19,795 100
Note: The source of these data is Ezhegodnik ministerstva finansov [Ministry of Finance Yearbook], 1900-1915. See the text for further discussion.
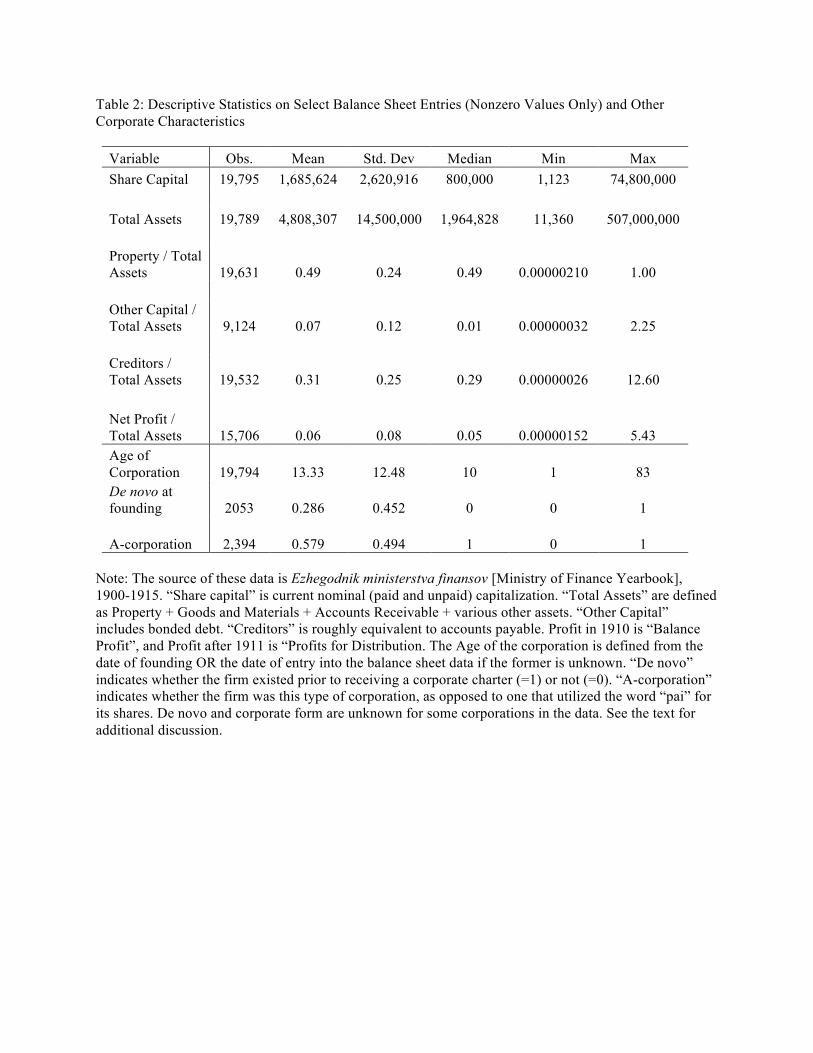
Table 2: Descriptive Statistics on Select Balance Sheet Entries (Nonzero Values Only) and Other Corporate Characteristics
Variable Obs. Mean Std. Dev Median Min Max Share Capital 19,795 1,685,624 2,620,916 800,000 1,123 74,800,000 Total Assets 19,789 4,808,307 14,500,000 1,964,828 11,360 507,000,000 Property / Total Assets 19,631 0.49 0.24 0.49 0.00000210 1.00 Other Capital / Total Assets 9,124 0.07 0.12 0.01 0.00000032 2.25 Creditors / Total Assets 19,532 0.31 0.25 0.29 0.00000026 12.60 Net Profit / Total Assets 15,706 0.06 0.08 0.05 0.00000152 5.43 Age of Corporation 19,794 13.33 12.48 10 1 83 De novo at founding 2053 0.286 0.452 0 0 1
A-corporation 2,394 0.579 0.494 1 0 1
Note: The source of these data is Ezhegodnik ministerstva finansov [Ministry of Finance Yearbook], 1900-1915. “Share capital” is current nominal (paid and unpaid) capitalization. “Total Assets” are defined as Property + Goods and Materials + Accounts Receivable + various other assets. “Other Capital” includes bonded debt. “Creditors” is roughly equivalent to accounts payable. Profit in 1910 is “Balance Profit”, and Profit after 1911 is “Profits for Distribution. The Age of the corporation is defined from the date of founding OR the date of entry into the balance sheet data if the former is unknown. “De novo” indicates whether the firm existed prior to receiving a corporate charter (=1) or not (=0). “A-corporation” indicates whether the firm was this type of corporation, as opposed to one that utilized the word “pai” for its shares. De novo and corporate form are unknown for some corporations in the data. See the text for additional discussion.

Table 3: Number of Corporations, Entry Rates, and Exit Rates by Accounting Year
Year Number of
Corporations
Number of
Entrants
Number of exiting
corporations Entry Rate
Exit Rate
Entry Rate –
Exit Rate
Growth Rate in NNP in
1913 Rubles 1900 1102 211 39 0.223 0.035 0.187 0.001 1901 1190 157 36 0.142 0.030 0.112 0.041 1902 1249 87 53 0.073 0.042 0.031 0.103 1903 1273 100 61 0.080 0.048 0.032 -0.056 1904 1126 97 87 0.076 0.077 -0.001 0.122 1905 278 20 34 0.018 0.122 -0.105 -0.096 1906 1260 83 35 0.299 0.028 0.271 -0.032 1907 1280 42 37 0.033 0.029 0.004 -0.019 1908 1370 95 95 0.074 0.069 0.005 0.110 1909 1154 84 72 0.061 0.062 -0.001 0.076 1910 1454 158 110 0.137 0.076 0.061 0.095 1911 1474 145 99 0.100 0.067 0.033 -0.059 1912 1590 207 139 0.140 0.087 0.053 0.107 1913 1712 242 810 0.152 0.473 -0.321 0.069
Note: The source of these data is Ezhegodnik ministerstva finansov [Ministry of Finance Yearbook], 1900-1915; and Gregory (1982). A corporation is said to enter the data in a given year when that year is the first time the corporation is observed in the dataset, using the 1899 cross-section as the baseline. A corporation is said to exit the data if it is never observed again after a given accounting year. Following Dunne, Roberts, and Samuelson (1988, p. 502), the entry rate for accounting year 1 is the number of new corporations in year 1 divided by the total number of corporations in year 1 − 1. The exit rate in accounting year 1 − 1 is the number of corporations in year 1 − 1 that are never observed again divided by the total number of corporations in year 1 − 1. The growth rate in NNP is simply defined as the percentage change from the previous year – the value for 1900 is the percentage change from 1899 to 1900. The Year here refers to the accounting year.

Table 4: Entry and Exit by Industry Group
Group Entry Rate Exit Rate Difference Agriculture 0.040 0.060 -0.020 Animals 0.134 0.130 0.005 Ceramics 0.126 0.116 0.010 Chemicals 0.165 0.122 0.042 Food 0.074 0.069 0.005 Metals 0.137 0.129 0.008 Mining 0.138 0.104 0.034 Miscellaneous 0.217 0.073 0.144 Mun. Services 0.196 0.148 0.048 Paper 0.110 0.088 0.022 Textiles 0.080 0.070 0.010 Trade 0.255 0.071 0.183 Transportation 0.154 0.128 0.025 Wood 0.148 0.134 0.014 Average 0.133 0.097 0.035
Note: The source of these data is Ezhegodnik ministerstva finansov [Ministry of Finance Yearbook], 1900-1915. These data represent unweighted mean entry and exit rates by industrial group across years (1900 to 1913). The definitions of entry and exit are as in Table 3.

Table 5: Factors associated with the probability of being a new entrant in a given year
Dependent Variable: (1) (2) (3) (4) Prob(Entrant) Probit Probit Probit Probit Log (Share Capital) -0.148*** -0.120*** -0.151*** -0.164***
(0.014) (0.017) (0.020) (0.022) Log (Profit/Total Assets) -0.039** -0.048*** -0.045**
(0.012) (0.014) (0.014) Firm is of the A-Corporation Type 0.350*** 0.340***
(0.039) (0.041) Corporation was Founded as a New Firm -0.198***
(0.049) Constant 0.359 0.079 0.080 0.182
(0.325) (0.361) (0.401) (0.450)
Observations 17,512 13,745 11,315 11,169 Industry Controls YES YES YES YES Year Controls YES YES YES YES Pseudo R-squared 0.0534 0.0482 0.0714 0.0754
Note: *** p<0.001, ** p<0.01, * p<0.05. Robust standard errors in parentheses. These are probit regressions where the dependent variable is whether a firm in period t was a new entrant, compared to t – 1.

Table 6: Factors associated with the probability of corporate exit in a given year
Dependent Variable: (1) (2) (3) (4) (5) Prob (Exit) Log (Share Capital) -0.064*** -0.007 -0.030 -0.022 0.041*
(0.015) (0.019) (0.023) (0.024) (0.020) Log (Profit/Total Assets) -0.070*** -0.094*** -0.091*** -0.002
(0.015) (0.017) (0.017) (0.016) Firm is of the A-Corporation Type 0.261*** 0.254*** 0.267***
(0.050) (0.051) (0.040) Corporation was Founded as a New Firm -0.002 -0.001 (0.055) (0.044) Log Age -0.064**
(0.021) Constant 0.895** 0.381 0.227 0.172 -2.123***
(0.293) (0.363) (0.424) (0.426) (0.267)
Observations 17,512 13,745 11,315 11,169 11,169 Industry Controls YES YES YES YES YES Year Controls YES YES YES YES YES Pseudo R-squared 0.208 0.302 0.286 0.292 0.0149
Note: *** p<0.001, ** p<0.01, * p<0.05. Robust standard errors in parentheses. These are probit regressions where the dependent variable is whether a firm in period t exited by t+1.
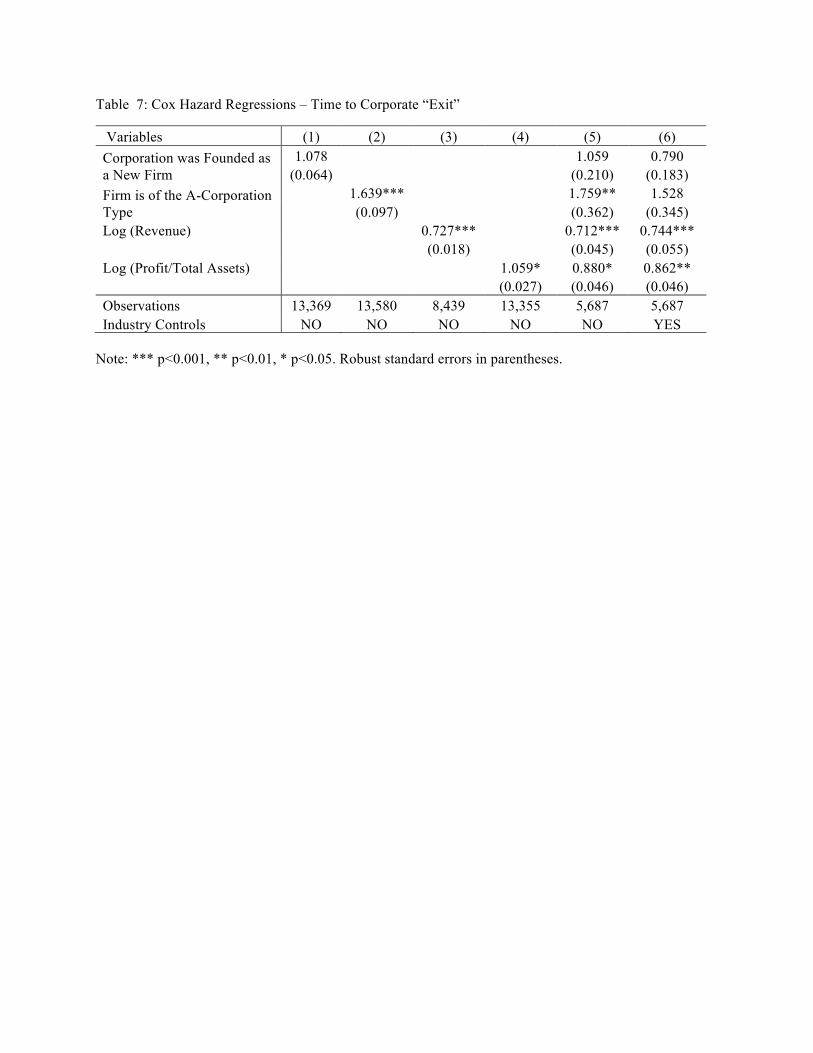
Table 7: Cox Hazard Regressions – Time to Corporate “Exit”
Variables (1) (2) (3) (4) (5) (6) Corporation was Founded as a New Firm
1.078 1.059 0.790 (0.064) (0.210) (0.183)
Firm is of the A-Corporation Type
1.639*** 1.759** 1.528 (0.097) (0.362) (0.345)
Log (Revenue) 0.727*** 0.712*** 0.744*** (0.018) (0.045) (0.055)
Log (Profit/Total Assets) 1.059* 0.880* 0.862** (0.027) (0.046) (0.046)
Observations 13,369 13,580 8,439 13,355 5,687 5,687 Industry Controls NO NO NO NO NO YES
Note: *** p<0.001, ** p<0.01, * p<0.05. Robust standard errors in parentheses.

Table 8: The Change in Corporate Characteristics over the Life Cycle
(1) (2) (3) VARIABLES Log Revenue Log Profit Market Share Firm is 1 year old -1.163*** -0.193** -0.014***
(0.096) (0.065) (0.002) 2 years -0.482*** -0.104*** -0.006*** (0.042) (0.030) (0.001) 3 years -0.291*** -0.061** -0.004***
(0.026) (0.020) (0.001) 4 years -0.190*** -0.054*** -0.003***
(0.018) (0.014) (0.000) 5 years -0.126*** -0.040*** -0.002***
(0.015) (0.012) (0.000) 6 years -0.118*** -0.036*** -0.002***
(0.013) (0.010) (0.000) 7 years -0.075*** -0.031*** -0.001***
(0.011) (0.008) (0.000) 8 years -0.048*** -0.019** -0.001***
(0.010) (0.007) (0.000) 9 years -0.044*** -0.015* -0.001**
(0.009) (0.006) (0.000) 10 years -0.031*** -0.006 -0.000*
(0.009) (0.006) (0.000) 11 years -0.026** 0.004 -0.000
(0.009) (0.005) (0.000) 12 years -0.024** -0.001 -0.000
(0.009) (0.005) (0.000) 13 years -0.009 -0.005 -0.000
(0.009) (0.004) (0.000) 14 years -0.021* -0.004 -0.000
(0.009) (0.004) (0.000) 15 years -0.012 -0.000 -0.000*
(0.009) (0.004) (0.000) Constant 11.108*** -3.689*** 0.137***
(0.190) (0.188) (0.004) Observations 8,853 13,745 8,853 R-squared 0.198 0.041 0.195 Year Controls YES YES YES Industry Controls YES YES YES Cohort Dummies YES YES YES
Note: *** p<0.001, ** p<0.01, * p<0.05. Robust standard errors in parentheses. The dependent variables are denoted above the columns. The row variables are dummies for corporations of that age. The omitted category are corporations older than 15 years.

Table 9: Entry and Exit Rates by Enterprise Form from Gregg’s (2016) Factory Data Panel A: Entry Rates
Year Overall Entry Rate Corporations Non-Corporations 1894 -- -- -- 1900 .4484 .0237 .4383 1908 .3875 .0122 .3870
Panel B: Exit Rates
Year Overall Entry Rate Corporations Non-Corporations 1894 .6774 .4134 .6854 1900 .4749 .3127 .4859 1908 -- -- --
Note: These rates are calculated in the same fashion as Tables 3 and 4, although they pertain to factories (owned by corporations or not) rather than individual firms. Moreover, the rates in the cells refer to aggregations over 6 and 8 years, rather than year to year exits and entries.

Figures Figure 1: Excerpt from Vestnik Finansov i torgovli financial reports and Ministry of Finance Yearbook for the Partnership of Martens and Daab (1900-01 Accounting Year)
Panel A: Vestnik Finansov, Otcheti, 1902, p. 1143

Panel B: Ezhegodnik Ministerstva Finansov, 1902
Panel C: Zoomed in row for Martens and Daab

Figure 2: Entry and Exit Rates for Industry / Year Groups vs. Log Revenue in the Previous Year
Note: These figures indicate the relationship between entry/exit rates by industrial group and mean log revenue in the previous year. The size of the dot indicates the year: smaller is earlier in the period 1900-1913.

Figure 3: Entry and Exit Rates for Industry / Year Groups vs. Log Profits (Scaled by Total Assets) in the Previous Year
Note: These figures indicate the relationship between entry/exit rates by industrial group and mean (log) profits scaled by total assets in the previous year. The size of the dot indicates the year: smaller is earlier in the period 1900-1913.

Figure 4: Evolution of Market Share by the Age of the Corporation
Note: This picture depicts the coefficients estimated on the age-of-the-corporation variables in the model of Table 8 that utilizes corporate market shares (out of total revenues in broad industry) in a given year as the dependent variable. These industries are those noted in Panel B of Table 1. Standard errors can be inferred from the Table.
-0.016
-0.014
-0.012
-0.01
-0.008
-0.006
-0.004
-0.002
01 2 3 4 5 6 7 8 9
Mar
ket S
hare
Corporation Age

Appendix Table A1: Items in the Russian Ministry of Finance Yearbook Balance Sheet Data
Left Hand Page Right Hand Page Счет: Account (Total) Пассив Passive (Liabilities) Прибылей Revenue Основной капитал Share Capital Убытков Expenditures Запасный капитал Capital Reserves Аммортизация (sic) Amortization (and
Depreciation) Актив Active (Assets) Прочие капиталы Other Capital
(Including Bonds) Имущество Property Кредиторы Accounts Payable Товары и материалы
Goods and Materials Прочие статьи Other Items
Дебиторы Accounts Receivable Прочие статьи Other Items Прибыль Profit Убыток Loss Общая Net Profit Дивиденд: Сумма Dividend Sum Дивиденд: % Dividend Percentage
Note: These categories are representative for the entire 1899-1914 period. See the text for additional discussion and some modifications from 1909 onward. “Page” refers to the location on the pages of the published Yearbook volumes.

Table A2: Accounting Years by Ministry of Finance Yearbook Publication Year
Accounting Year Pub Year
1896 1897 1898 1899 1900 1901 1902 1903 1904 1905 1906 1907 1908 1909 1910 1911 1912 1913 1914
1900 1 7 213 757 0 0 0 0 0 0 0 0 0 0 0 0 0 0 0 1901 0 0 0 186 893 0 0 0 0 0 0 0 0 0 0 0 0 0 0 1902 0 0 1 3 206 997 0 0 0 0 0 0 0 0 0 0 0 0 0 1903 0 0 0 0 0 186 1,035 0 0 0 0 0 0 0 0 0 0 0 0 1904 0 0 0 0 0 1 206 1,056 0 0 0 0 0 0 0 0 0 0 0 1905 0 0 0 0 0 0 0 201 1,104 0 0 0 0 0 0 0 0 0 0 1906 0 0 0 1 3 4 5 11 13 253 1,017 0 0 0 0 0 0 0 0 1907 0 0 0 0 0 0 1 0 3 13 227 1,037 0 0 0 0 0 0 0 1909 0 0 1 0 0 0 1 2 3 8 8 226 847 0 0 0 0 0 0 1910 0 0 0 0 0 0 0 0 0 1 3 11 508 837 0 0 0 0 0 1911 0 0 0 0 0 0 0 0 1 1 1 1 8 298 879 0 0 0 0 1912 0 0 0 0 0 0 0 1 1 1 2 2 5 17 564 885 0 0 0 1913 0 0 0 0 0 2 1 0 0 0 1 2 1 2 9 580 947 0 0 1914 0 0 0 0 0 0 0 0 0 0 0 0 0 0 2 7 626 1,019 0 1915 0 0 0 0 0 0 0 2 1 1 1 1 1 0 0 2 17 693 1,113
Note: These are the counts of corporations by publication and accounting year in our balance sheet dataset, as taken from Ezhegodnik ministerstva finansov [Ministry of Finance Yearbook], 1900-1915.

Table A3: Average Annual Growth Rates by Industry, 1900-1914
Group Property Share Capital Revenue Agriculture 0.033075 0.019592 -0.06887 Animals 0.006756 0.049175 0.016083 Ceramics 0.030622 0.027023 -0.00828 Chemicals -0.00956 0.002693 0.061239 Food 0.02903 0.029415 -0.02657 Metals 0.063155 0.048817 0.023008 Mining 0.023828 0.010739 0.023106 Miscellaneous 0.025216 0.017927 0.032949 Municipal Services 0.010269 -0.01006 0.003058 Paper 0.040739 0.028843 0.01016 Textiles 0.026268 0.020498 0.023133 Trade 0.055759 0.074361 0.030745 Transportation 0.056922 0.043262 0.147346 Wood 0.026002 0.036411 -0.00668
Note: These growth rates are calculated for the variables in Table 2 and for “Revenues” (i.e. gross profits), aggregated over these industrial groups between 1900 and 1913.