the birth of a business community: tracing the path to...
TRANSCRIPT

The Birth of a Business Community:
Tracing the Path to Entrepreneurship in a Developing Economy ∗
Kaivan Munshi†
November 2007
Abstract
This paper traces the transition into entrepreneurship in a historically disadvantaged communityover a thirty year period. Empirical support is provided for the role played by a new community-based network in bringing entrepreneurs with increasingly weak family backgrounds into businessover time. Two conditions that contributed to this successful transition are identified: (i) a largeinitial shock set the network on a steep growth trajectory, and (ii) weak outside options favored thegrowth of the network in this historically disadvantaged community. While previous studies on thedeterminants of entrepreneurship in developing countries have focussed on individual attributes, theanalysis in this paper indicates that characteristics and opportunities at the level of the communitymay be especially salient.
Keywords. Entrepreneurship. Growth. Intergenerational mobility. Networks.JEL. D85. J62. L14. L22.
∗This project could not have been completed without the enormous effort put in by the survey team leader SamTaraporevala, department of sociology, St. Xavier’s College, Mumbai. He was assisted in the implementation of thesurvey by a team of interviewers ably supervised by Noor Aboobakar and Delnaz Chinwalla. Among the many individualsin the diamond industry that I wish to thank are Mark Boston, Nehalchand Dhadda, Arun Doshi, Mahesh Gandani,Ghanshyam Dholakia, Kamlesh Jhaveri, Jal Mahimwalla, Bakul Mehta, Rashmin Mehta, Russell Mehta, Vinod Mehta,Arvind Parikh, Bharat Parikh, Milan Parikh, Rashna Press, Ramnik Shah and, especially, Suhrud Jhaveri and RajulJhaveri. The Gem and Jewelry Export Promotion Council (GJEPC) graciously gave me access to their database ofdiamond export firms. I am grateful to Andrew Foster and Ashley Lester for helpful discussions that clarified my thinkingon the theoretical framework and to Ashish Khosla for writing the computer programs that translated the GJEPC datainto a format that was suitable for analysis. Abhijit Banerjee, Asim Khwaja, Nancy Luke, Mark Rosenzweig and seminarparticipants at Beijing University, NBER, UBC, USC, and Yale provided helpful comments on the paper. Karim Ladhaand Jonathan Stricks provided excellent research assistance. Research support from the National Science Foundationthrough grants SES-0431827 and SES-0617847 is gratefully acknowledged. I am responsible for any errors that mayremain.†Brown University and NBER
1 Introduction
Entrepreneurship – the successful establishment and management of new business – plays a critical role
in the development process. However, little is known about the changing patterns of entrepreneurship
or its determinants in developing economies. The dominant view among economists today is that
inefficient credit markets can create substantial barriers to entry among potential entrepreneurs, with
negative consequences for growth and distribution (Galor and Zeira 1993, Banerjee and Newman 1993).
Recent evidence from Thailand is consistent with this view (Paulson, Townsend and Karaivanov 2006),
although other research has provided mixed support for the credit hypothesis (McKenzie and Woodruff
2002). Apart from credit, a family background in business has been identified as a key determinant
of entrepreneurship worldwide (La Porta, Lopez-de-Silanes, and Shleifer 1999, Dunn and Holtz-Eakin
2000, Bennedsen et al. 2006, Bertrand et al. 2004). Business success in a developing economy requires
a knowledge of the system; how to take advantage of legal loopholes and who to bribe. It also requires
connections to buyers, sellers, bank loan officers, and other government officials. In such an economy,
an individual who is born into a business family has a distinct advantage. The wealth that he inherits
makes it easier to secure bank credit, while the experience and training that he receives from his father
teaches him how to make connections and, more generally, how to exploit the business opportunities
that are available in the market.
This paper focuses on a third determinant of entrepreneurship, which has received less attention
in the economics literature; membership in a business community. It is well known that large-scale
business activity in developing countries is dominated by a few small communities and the popular
press often carries articles describing their economic and political influence. For example, a recent
feature in The Economist (October 6-12, 2007) describes the continuing caste-based nature of Indian
business and The Times of India (October 20, 2006) reported that companies promoted by three
traditional business communities, the Gujaratis, Marwaris, and Parsis account for approximately 36
percent of the market capitalization of the Bombay Stock Exchange. Similarly, it has been estimated
that ethnic Chinese own 80 percent of the private stock in Thailand, 75 percent in Indonesia, and 50
percent in the Philippines, while making up just around 5 percent of the population in those countries
(The Central Daily, January 21, 1994).
In economies where inherited wealth and connections are so useful, most first-generation en-
trepreneurs can only compete successfully with their established rivals with the support of fellow
1

entrants from their community. The path to entrepreneurship has consequently been historically char-
acterized by the movement of entire groups into business, with newly formed networks compensating
for weak personal backgrounds and paving the way for the establishment of business communities and
family firms in the generations that followed (Chandravarkar 1985, Rudner 1994). The entry of the
Parsis into trade and industry under British colonial rule (Medhora 1965) and more recently the expan-
sion of the Gounder community from agriculture to textile manufacturing and exports (Cawthorne
1995, Banerjee and Munshi 2004), both with the support of strong community networks, are well
known examples of the transition into entrepreneurship in India. However, such transitions have been
rare, which is surprising given the large rents that are evidently available from business activity in
developing countries. The concentration of business in the hands of a few small communities has
serious economic and social consequences and a major objective of this paper will be to theoretically
and empirically investigate the challenges faced by communities attempting to break into business.
The research strategy adopted in this paper is to take a historical approach and document the
process through which one community – the Kanbi Patels – successfully expanded from agriculture
and industrial labor into the international diamond business over the course of a single generation.
India does not produce rough diamonds. The rough diamonds must first be imported, typically from
Antwerp, and then cut and polished in factories and workshops, most of which are located in the
city of Surat, north of Bombay. The polished diamonds are subsequently sold on the Bombay market
to foreign buyers or shipped directly abroad. A combination of commercial acumen and cheap labor
facilitated the rapid expansion of the diamond industry, which accounts for roughly 14% of India’s
total merchandize exports, and has competed with textiles, and more recently with computer software,
as the country’s top export industry over the course of the past three decades. It is estimated that
approximately one thousand Indian diamond export firms employ over a million workers and that this
industry accounts for as much as 85% of the rough diamonds cut and polished worldwide (60% by
value) today (GJEPC 1998, Purani 2000).
Diamond firms are notoriously secretive, partly due to the high value and hence the security
concerns associated with their product. Diamonds, particularly rough diamonds, are also difficult
to value objectively and can be easily swapped, and so diamond transactions rarely involve written
contracts. Trust plays an important role in this industry, which is not surprisingly associated with a
high degree of community networking, and with it low transparency, world-wide. Ultra-orthodox Jews
historically controlled the Antwerp market and continue to control the New York market (Richman
2

2006), and in India two traditional business communities – Gujarati Jains from the town of Palanpur
(known in the industry as Palanpuris) and Marwaris originally from the state of Rajasthan – have
dominated the industry from its inception in the mid-1960s. The commitment problems that arise
naturally with diamond transactions would suggest that there are enormous barriers to entry for
outsiders in this industry. Nevertheless, the Indian diamond industry has undergone a dramatic
change in its sociological composition – with the entry of a new community into the business – which
we will attempt to understand in this paper.
Historically, the Palanpuris and Marwaris handled the business end of the industry, leaving the
cutting and the polishing to the Kanbi Patels (known in the industry as Kathiawaris). The Kathiawaris
are farmers from Saurashtra in the interior of Gujarat, many of whom migrated to Surat to work as
laborers in the diamond industry when it started to grow in the mid-1960s. Some of these migrants
became manufacturing contractors, in charge of workshops or factories, and these contractors in turn
brought more members of their caste to work in the Surat industry. Commitment problems arise at
the manufacturing stage as well, with swapping of roughs being a common complaint, and so most
Marwari and Palanpuri businessmen built long-term relationships with their Kathiawari contractors.
In the late 1970s, a supply shock hit the industry with the opening of Australia’s Argyle mines. We
will later see that the Palanpuris started to establish branches in Antwerp, and the Kathiawari network
started to take off, just around the time that the Argyle mines opened up. Bank credit has, until
recently, been unavailable to diamond firms due to the particular nature of this business. Thus, the
critical step in the diamond trading process is accessing rough diamonds on credit from abroad. The
story told by knowledgable Indian diamond exporters is that Palanpuri businessmen who had recently
established branches in Antwerp provided excess roughs to their contractors or served as guarantors
for other suppliers. The early Kathiawari entrants took advantage of this opportunity to bring other
members of their community into the business, providing connections to rough suppliers in Antwerp
and other forms of support, and the number of Kathiawari firms subsequently grew rapidly over time.
The historical episode that triggered the entry of the Kathiawaris is distant enough to trace the
transition into entrepreneurship in this community over a thirty-year period, yet is recent enough to
provide data that are amenable to statistical analysis. The analysis in this paper uses two independent
sources of data: (i) a survey of nearly 800 diamond export firms, with offices in the Bombay mar-
ket, conducted in 2004-05, and (ii) firm-level export performance data provided by an administrative
agency, the Gem and Jewelry Export Promotion Council (GJEPC). The survey collected information
3
on the senior partner’s personal and family background, the firm’s history, and its business relation-
ships. Based on this information, the business background of entrants into the industry can be plotted
across communities and over time.
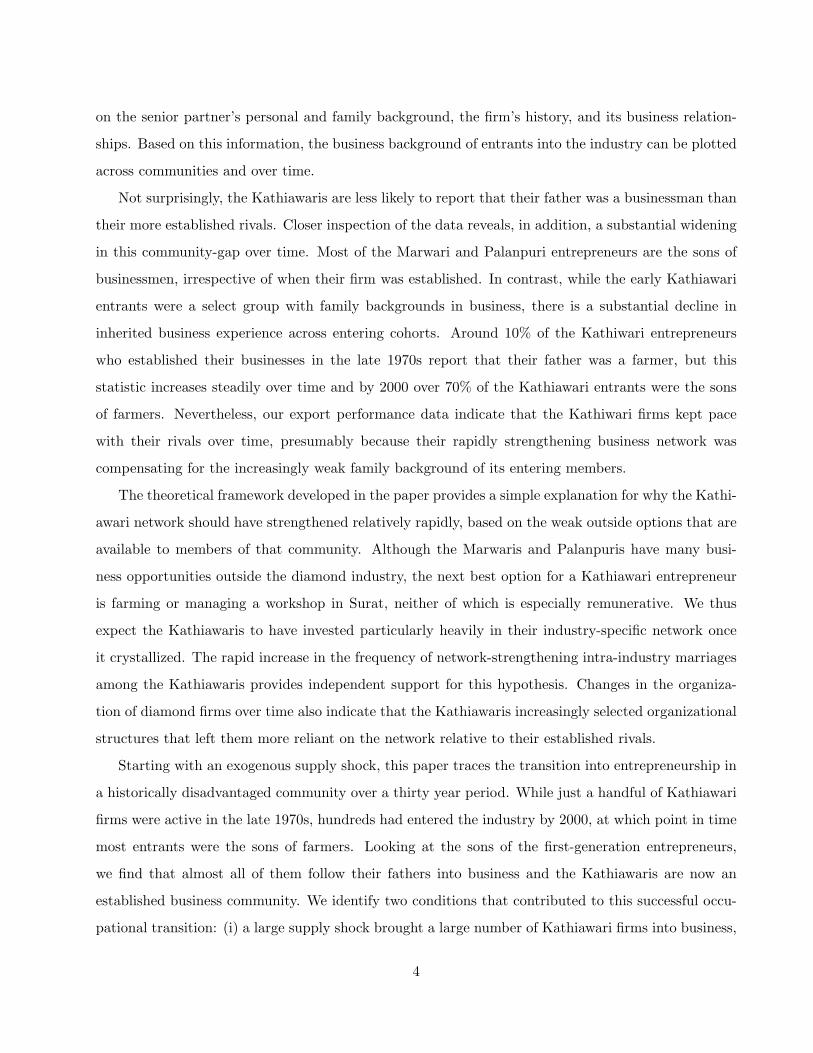
Not surprisingly, the Kathiawaris are less likely to report that their father was a businessman than
their more established rivals. Closer inspection of the data reveals, in addition, a substantial widening
in this community-gap over time. Most of the Marwari and Palanpuri entrepreneurs are the sons of
businessmen, irrespective of when their firm was established. In contrast, while the early Kathiawari
entrants were a select group with family backgrounds in business, there is a substantial decline in
inherited business experience across entering cohorts. Around 10% of the Kathiwari entrepreneurs
who established their businesses in the late 1970s report that their father was a farmer, but this
statistic increases steadily over time and by 2000 over 70% of the Kathiawari entrants were the sons
of farmers. Nevertheless, our export performance data indicate that the Kathiwari firms kept pace
with their rivals over time, presumably because their rapidly strengthening business network was
compensating for the increasingly weak family background of its entering members.
The theoretical framework developed in the paper provides a simple explanation for why the Kathi-
awari network should have strengthened relatively rapidly, based on the weak outside options that are
available to members of that community. Although the Marwaris and Palanpuris have many busi-
ness opportunities outside the diamond industry, the next best option for a Kathiawari entrepreneur
is farming or managing a workshop in Surat, neither of which is especially remunerative. We thus
expect the Kathiawaris to have invested particularly heavily in their industry-specific network once
it crystallized. The rapid increase in the frequency of network-strengthening intra-industry marriages
among the Kathiawaris provides independent support for this hypothesis. Changes in the organiza-
tion of diamond firms over time also indicate that the Kathiawaris increasingly selected organizational
structures that left them more reliant on the network relative to their established rivals.
Starting with an exogenous supply shock, this paper traces the transition into entrepreneurship in
a historically disadvantaged community over a thirty year period. While just a handful of Kathiawari
firms were active in the late 1970s, hundreds had entered the industry by 2000, at which point in time
most entrants were the sons of farmers. Looking at the sons of the first-generation entrepreneurs,
we find that almost all of them follow their fathers into business and the Kathiawaris are now an
established business community. We identify two conditions that contributed to this successful occu-
pational transition: (i) a large supply shock brought a large number of Kathiawari firms into business,
4

setting the network on a steep growth trajectory, and (ii) weak outside options favored the subsequent
growth of the Kathiawari network. While previous studies on the determinants of entrepreneurship in
developing economies have focused on individual attributes, our analysis indicates that characteristics
and opportunities at the level of the community may be especially salient. This insight is also relevant
for the design of programs that attempt to stimulate entrepreneurship, as we discuss in the concluding
section of the paper.
2 The Institutional Setting
2.1 A Brief History of the Indian Diamond Industry
The history of the modern Indian diamond industry begins in the 1880s when two diamond mer-
chants from the town of Palanpur in Northern Gujarat, Surajmal Lallubhai and Amulakh Khubhchand
Parikh, expanded their business to Bombay, Calcutta, and Rangoon.1 Over the next two decades,
many Palanpuri Jains followed these pioneers into the diamond business, and later the pearl trade,
and the Palanpuri network reached as far as Antwerp, where 20-25 families were settled by 1937. The
overseas Palanpuris were forced to return to India during World War II and the industry suffered a
further blow after independence in 1947 when the import of rough diamonds was banned to preserve
scarce foreign exchange. The diamond business was restricted to domestic trade in polished stones,
for the most part, until the mid-1960s, when the Multi-Rate Import Replenishment Scheme allowed
rough diamonds to be imported once again, against the export of rough diamonds.
Workshops were quickly set up in Surat, Navsari, and other inland centers to cut and polish
diamonds and the industry grew extremely rapidly thereafter. Marwari businessmen also entered
the diamond industry at this time. The Marwaris are a community of traders and moneylenders who
made the transition into industry around 1914 and subsequently expanded their trading and industrial
activity throughout the country (Lamb 1955). The Marwari network is more diversified, both spatially
and by business activity, than any other community network in the country (Timberg 1978). Some
of the new Marwari entrants had experience in the colored-stone business, which was traditionally
centered around the city of Jaipur in Rajasthan, but other merchants were attracted by the high rate
of return on investment in the diamond industry.1The discussion on the Palanpuris in this section is based on Chhotalal (1990) and an unpublished interview with the
(former) Nawab of Palanpur conducted by Mark Boston and Sharada Dwivedi. The discussion on the Kathiawaris thatfollows is drawn from Engelshoven (2002).
5

In these early years, the Palanpuris and Marwaris handled the trading end of the diamond business,
while Kathiawaris cut and polished the diamonds. The Kathiawaris are a caste of cultivators who
worked historically as sharecroppers and laborers in Saurashtra, an arid region in Gujarat that is prone
to drought and famine. The Kathiawaris should not be confused with the Patels who control the motel
business in the United States. The Patels are a landowning caste from a different region in Gujarat
(Charottar), whereas the Kathiawaris are Kanbi Patels who were traditionally laborers. The first
Kathiawari migrants came to Surat in the 1960s, just as the diamond industry was starting to grow.
Initially the Kathiawaris worked in factories owned by Palanpuris and local Surtis. However, many
of the early migrants were able to set up their own workshops and factories by the early 1970s, doing
contract work for Palanpuri and Marwari exporters. As discussed earlier, some of these contractors
were encouraged to enter the import-export business in the late-1970s by Palanpuris with whom they
had established close personal ties, and we will see that the Kathiawari network grew at least as fast
as the Palanpuri and Marwari networks in the decades that followed.
2.2 The Survey
Although aggregate diamond statistics are available over many years, detailed firm-level information
could only be obtained by conducting a survey of the industry. Diamond firms are very secretive and
so every effort was made to establish connections within the industry before the survey commenced.
Assisted by a few close personal connections within the industry, I gradually built up a small network
of influential diamond exporters over a two-year period, which in turn later helped the survey team
penetrate each of the community networks. Despite this strong support, it was a challenge to gain
access to the firms, and the implementation of the survey itself provides useful insights into the
workings of this industry.
The population of firms is based on a computerized database maintained by the Gem and Jewelry
Export Promotion Council (GJEPC) of all its members. This database includes the name of the firm,
its address and telephone numbers, the name of a contact individual (typically the senior partner), and
the firm’s export figures, each year from 1995 onwards. Under the Multi-Rate Import Replenishment
Scheme, a firm’s foreign exchange quota, which allowed it to (legally) import roughs, was based on
its previous exports. The GJEPC verified the export figures for its members and then forwarded
them to the Government of India. Most exporters availed of this useful service, and so the GJEPC
database provides us with a comprehensive list of firms that exported polished diamonds, each year,
6

over the past decade. I was able to gain access to this database, covering the 1995-2003 period, at the
beginning of 2004.
For security reasons, diamond markets tend to be spatially concentrated world-wide. In Bombay,
the polished diamond market covers approximately 0.25 square miles in the Opera House area of the
city. Hundreds of the larger firms have offices in two buildings – Panchratna and Prasad Chambers
– and the smaller firms are crowded into buildings in the adjacent lanes and by-lanes. Somewhat
surprisingly, however, a preliminary inspection of the GJEPC database revealed a significant fraction of
firms with addresses outside the Opera House area. Diamond firms often operate under multiple names
to exploit income tax loopholes and many of these “shell” firms are listed in residential areas where the
diamond merchants live. In an economy where foreign exchange was until recently tightly regulated,
the import-export nature of the diamond business also attracted firms, known in the industry as
choprawallas (book-keepers), that were engaged in money laundering rather than legitimate diamond
business. Many of these firms would also be listed outside the Opera House area. My industry contacts
assured me that firms with legitimate activity in the diamond industry would have at least one office
in the Opera House area and so the relevant population of firms for the survey was restricted to the
1,854 firms with addresses in that area, listed in the GJEPC database as exporting in any year over
the 2001-03 period.
To test its ability to gain access to these firms, the survey team sent letters of introduction from
the chairman of the GJEPC and the principal investigator to 40 firms drawn randomly from the list of
1,854 firms operating in the Opera House area. These firms were subsequently contacted by telephone
to arrange an appointment, but only three agreed to be interviewed. It was clear from the outset that
the only way to achieve a reasonable response rate in such a heavily networked industry was to use
our own social connections. A computerized referral system was set up, and each firm in my personal
network provided a list of firms that it was tied closely with. These firms, in turn, provided additional
referrals, and the process continued until all the names on our list had been covered. While the order
of interviews may not have been random, the referral-based approach that we took did not result in a
non-representative sample since all firms were ultimately contacted. Progress was slow to begin with,
and only 63 interviews were completed in December 2004, the first month of the survey. However, the
pace increased thereafter, to six interviews per day, and the survey was ultimately completed in five
months.
Of the 1,854 firms on our list, we were able to ascertain that 480 were multiple-name listings, 288
7

were choprawallas, 102 could not be contacted by phone, 53 had shut down, and 9 had no partners in
town during the survey period, leaving us with 922 eligible firms. We ultimately interviewed 777 firms,
giving us an overall response rate of 84.3%.2 Among the firms that we interviewed, 96.3% belonged to
the three major communities and of these firms, 29% were Kathiawari, 17% were Marwari, and 54%
were Palanpuri. When providing referrals, our contacts were simply asked to list firms that they were
closely tied with, without any prompting from our side. It is worth noting that not a single referral
led us to a firm without at least one office in the Opera House area, justifying the spatial restriction
placed on the population of relevant firms. Moreover, only 5.7% of the sampled firms did not appear
in the GJEPC database, supporting the assumption that this database effectively covers the entire
population of active exporters.3
The sampled firms are all currently active. Much of the analysis in this paper is concerned with
changes in the industry and so we would, in principle, need information on exit as well. Fortunately,
exit rates in the diamond industry are extremely low, consistent with the theoretical framework in
Section 3, which predicts that firms should not exit once they enter this industry. The GJEPC
database lists all exporters, each year, over the 1995-2003 period. I assume that a firm exits in a given
year if it was exporting in that year but fails to show up thereafter. It seems reasonable to assume that
a firm which fails to show up continuously for three years or longer has permanently exited, allowing
me to compute exit rates each year from 1995 to 2000. Restricting attention to firms in the Opera
House area, exit rates are low each year – just around 1.5% – and there is no discernable time trend
in these statistics. Moreover, exit rates do not vary by community.4
The computerized system that we had set up to schedule interviews included data fields to record
the identity of up to five individuals who had provided referrals for each firm. We would speak on2The firms that could not be contacted using the phone number provided by the GJEPC or traced through the
directory enquiry system had either changed their name or shut down. Firms without a partner in town over a fivemonth period are also unlikely to be active in the export market. The response rate across communities was 85.7% forthe Kathiawaris, 89.3% for the Marwaris, and 81.9% for the Palanpuris.
3Towards the end of the survey, respondents were provided with a list of firms from our list that were still to becontacted. The survey team also made 36 appointments in the final month of the survey by telephoning exportersdirectly. While these few deviations from the usual procedure would naturally reduce the number of referrals madeoutside the list, they are unlikely to undermine the basic claim that the GJEPC database effectively covers all activeexporters and that it is appropriate to restrict attention to firms located in the Opera House area.
4The contact names included in the GJEPC database, together with a detailed knowledge of firms in the industry,allowed the exporters that I knew and their employees to assign a community affiliation to each firm in the databasethat was located in the Opera House area. Names are a good indicator of community affiliation, and comparing thisassignment to the actual affiliation, obtained from the survey, just 6.3% of the sampled firms were miscoded. Based onthe assigned community affiliation, annual exit rates over the 1995-2000 period are 1.8% for the Kathiawaris, 1.1% forthe Marwaris, and 1.5% for the Palanpuris.
8

behalf of these individuals when arranging interviews with the firms; in many cases this was sufficient
for the firm to agree to be interviewed, but in other cases the firms did contact the individual who had
provided the referral to verify its authenticity. Although it is well known that community networks
play an important role in this industry, the survey respondents were generally reluctant to report the
support that they received from members of their community or from other close connections in the
diamond industry. The pattern of referrals that was received evidently had research value since it
could be used to provide direct evidence on the importance of community ties and so the survey team
was instructed to continue to fill those data fields even after a firm had been interviewed.
Table 1 lists the major sources of referrals, the number of referrals that they provided, and the
community-wise breakdown of firms that received these referrals. We started with the largest firms in
the industry and gradually moved down the firm-size distribution as we received referrals to smaller
and smaller firms. Because of this non-random sequence of interviews and because the number of
referrals is restricted to five per firm, we clearly do not have a representative sample of referrals. The
statistics in Table 1 should be treated with caution, but the cross-community referral patterns reported
below are nevertheless indicative of the important role that social ties play in this industry. A total of
295 individuals provided referrals; 72% were exporters belonging to the three main communities, 16%
were brokers, and the remaining 12% were exporters from other communities and individuals outside
the industry who had social connections with particular exporters. A total of 1,473 referrals were
provided by these sources; 76% from the exporters, 16% from the brokers, and 8% from other sources.
Although the three communities are represented roughly in proportion to their share in the population
of export firms in Column 1, Marwaris are over-represented, while Kathiawaris are under-represented
in terms of their share of the total referrals provided in Column 2.
Looking across Columns 3-5 it is apparent that exporters from each community disproportionately
provide referrals to members of their own group. Given that Kathiawaris make up just 29% of all
firms, it is quite striking that 74% of the referrals from Kathiawari exporters are to members of their
community. This pattern of within-community referrals matches well with the rapidly strengthening
network ties that we later document for this community. Marwaris and Palanpuris also favor members
of their own community, but not as conspicuously as the Kathiawaris. The Marwaris in particular
make a substantial number of cross-community referrals. We will see that the Marwaris concentrate
on the polished side of the market where community affiliation is less important, which explains why
the Marwari exporters appear to maintain connections across all communities. In contrast with the
9

pattern of referrals made by the exporters, the distribution of referrals made by brokers – who belong
to different communities and must interact with firms of all communities – generally matches the
composition of firms, by community, in the industry.
2.3 The Organization of Production
Most diamond exporters visit Antwerp once every month or every other month for a few days to
acquire rough diamonds, have these diamonds cut and polished in workshops located in Surat, and
then sell the polished diamonds on the Bombay market or directly to foreign buyers. “Much of
the diamond industry revolves around the issue of getting a regular supply of good quality [rough]
diamonds” (Engelshoven 1999: 371). Rough suppliers in Antwerp and the largest exporters receive
parcels directly from the Diamond Trading Corporation (DTC), the trading arm of DeBeers, or from
other primary suppliers of rough diamonds. These parcels will typically comprise stones of various
grades and sizes. Individual exporters, however, will tend to specialize in stones of a particular size,
which implies that they would like to approach different suppliers in Antwerp from one trip to the
next.5 The rough stones are received on credit without a written contract. Substantial commitment
problems could evidently arise in that case.
Based on my conversations with diamond exporters, it appears that three solutions are available
to avoid the commitment problem. First, an exporter could establish long-term bilateral relations
with a very small number of suppliers in Antwerp. Given the variation in allotments received by
suppliers from one month to the next, this strategy is relatively inefficient in the diamond industry. A
second solution takes advantage of the community network, with firms that have established long-term
relations with particular suppliers providing referrals for other members of their community. The set
of firms providing referrals will vary from one period to the next depending on the mix of stones
received by the suppliers in Antwerp. Firms thus draw upon different members of their community to
provide referrals over time, expanding the set of suppliers that is available to them.
Firms providing referrals have long-term relationships at stake and so will ensure that members
of their community receiving the rough stones do not renege on their obligations. Firms receiving5Diamonds are classified by size and shape. In the questionnaire we defined eight categories – seven sizes and a
separate category for “fancy shapes” – and asked the entrepreneurs to report the proportion of their output (by value) ineach category. Despite this fine classification of stones, a substantial fraction of the firm’s output is devoted to a single– most popular – category: 52% for the Kathiawaris, 42% for the Marwaris, and 48% for the Palanpuris. The Marwarisare significantly less specialized, in large part because their business is centered on the polished side of the market, whereflexibility is less costly.
10
referrals will not deviate from cooperative behavior, even if they do not expect to be helped by the
same firm in the future, if a Multilateral Punishment Strategy (MPS) of the sort described by Greif
(1993) is in place. Under the MPS, no exporter provides a referral to anyone who has ever reneged on
his credit payment. To see why this strategy can be sustained in equilibrium, note that an individual
who has failed to honor his commitment in the past and still receives a referral has only one reason
not to deviate again, which is to maintain his reputation with his benefactor. In contrast, a previously
honest individual has two reasons to be honest; to maintain his reputation with his current benefactor
as well as with the network. As long as referrals are rationed, no exporter wants to deviate from the
MPS and provide a referral to someone who has failed to honor his commitment in the past. Given
these serious consequences, no one will deviate from the cooperative equilibrium and fail to repay
his credit. This mechanism is supported by numerous accounts of the severe economic and social
consequences faced by individuals who fail to honor their commitments.
Most exporters follow both approaches described above, building long-term relationships with a few
suppliers in Antwerp, while using the community network to expand their access to rough diamonds.
Despite the availability of a well functioning network, a relatively small number of firms have taken a
different approach to the commitment problem by setting up branches in Antwerp. Exporters who are
based permanently in Antwerp also function as rough suppliers and so will interact frequently with
other suppliers in the Antwerp market. These interactions and their permanent presence in Antwerp
allow them to establish a reputation in the market, which serves as a commitment device and permits
them to access roughs from numerous suppliers without the support of a community network.
Table 2, Panel A describes transactions on the rough side of the market. Firms have 10-12 suppli-
ers per year and 70 percent of the firms have a dominant supplier who provides more than 30 percent
of their roughs. Different firms will have different dominant suppliers, allowing for the cross-referrals
across firms that are needed for the network to function effectively. Much of the rough supply (around
70 percent) comes from Antwerp. The other major alternative source of roughs is the Bombay sec-
ondary market, where the price is substantially higher but the commitment problems less severe since
all firms have a permanent presence in the city. Notice that the Kathiawaris receive a significantly
greater fraction of their roughs from Antwerp than the other two communities, despite the fact that
firms with branches in Antwerp are predominantly drawn from the Palanpuri community. This result
is consistent with our hypothesis that the Kathiawaris have access to a stronger network.6 Despite the6The very largest firms, known as sightholders, receive roughs directly from the DTC. A relatively small number of
11

high value of the rough diamonds and the potential for default, much of the rough supply is obtained
on credit and rarely involves a written contract, across all three communities.
In contrast with rough diamond transactions, where referrals are critical and firms tend to do
business with a limited number of suppliers, the polished side of the industry operates very much like
a spot-market. Firms have as many as 30-50 buyers per year in Panel B, which describes transactions
on the polished side of the market, and relatively few (around 60 percent) of the firms have a single
dominant buyer, despite the fact that a dominant buyer is now defined to account for just 20 percent
of the firm’s product. A substantial fraction of the polished diamonds are also sold on the Bombay
market, typically through brokers, either to merchant exporters or visiting foreign buyers. Merchant
exporters restrict their activity to buying polished diamonds on the Bombay market and selling these
diamonds to established foreign clients.7 Notice that the Marwaris perform particularly well on the
polished side of the market; they have more buyers per year, yet are more likely to report a dominant
buyer (indicative of a balanced client portfolio) and to sell their polished directly abroad. This ob-
servation is consistent with the subsequent analysis, which indicates that the Marwari rough-diamond
network is relatively weak and that diamond firms from this community tend to concentrate on the
polished side of the market.
Polished diamonds are largely sold on credit and these transactions rarely involve a written con-
tract, so commitment problems could potentially arise on this side of the market as well, with buyers
reneging on their obligations. Because firms specialize in particular stone sizes, they tend to build
long-term relationships with a few foreign buyers, channelling the rest of their output abroad through
numerous merchant exporters who have long-term relationships with foreign buyers of their own. All
export firms, including the merchant exporters, have a permanent presence in Bombay and so can
build a personal reputation in the polished market. As with the exporters with branches in Antwerp,
this market reputation serves as a commitment device, expanding business relations across community
lines. We also do not expect community networks to play an active role at the cutting and polishing
stage of the production process either. Entrepreneurs can always establish long-term bilateral rela-
tionships with their manufacturing contractors to avoid the commitment problems, associated with
the swapping of roughs, that arise at this stage. Consistent with this view, the respondents in the
survey reported an average relationship of 16 years with their manufacturing contractors.
firms also buy roughs from Israel. Allowing for all of these possibilities, the Kathiawaris continue to receive a greatershare of their roughs from outside the Bombay market than the other communities.
7These firms are not included when computing the statistics for the rough side of the market in Table 2, Panel A.
12
2.4 The Entry of the Kathiawaris
The entry of the Kathiawaris into business can be traced to the discovery of massive diamond deposits
in Australia’s Kimberley region in 1979. Although the Argyle mines account for as much as one third
of the global production of natural diamonds, these diamonds tend to be small and low quality. The
Indian industry with its low labor costs was particularly suited for the cutting and polishing of these
diamonds, resulting in the entry of new firms at this time and substantial expansion in the decades
that followed.
Figure 1 plots the number of firms by community over the 1965-2004 period, based on the estab-
lishment year of the firms in the sample. The Palanpuris are always the dominant group, growing at
a constant rate over the entire 40-year period. The Marwaris and the Kathiawaris track together at a
slower rate initially, but while the Marwaris continue to grow at that slower rate, the Kathiawaris shift
to a steeper trajectory around 1980. Although this is not visually discernable, if we were to divide
the 1965-2004 period into two equal halves, the Kathiawaris would actually grow significantly faster
than the Palanpuris in the latter period.
Contrary to the popular perception in the industry that the Kathiawaris suddenly entered business
in the late 1970s, we see that a few Kathiawari firms were active as far back as the 1960s. Exceptional
individuals can always enter business, even without the support of a community network. For hundreds
of Kathiwaris to enter as in Figure 1, however, more support is needed. The supply shock in 1979
may have jump-started the Kathiawari network, but how did the first members of the network succeed
in business? The story told in the industry is that the Palanpuris supported the early Kathiawaris.8
A Palanpuri exporter who was reliant on his own network could only provide referrals to a small
number of suppliers in Antwerp with whom he had established long-term relationships. In contrast,
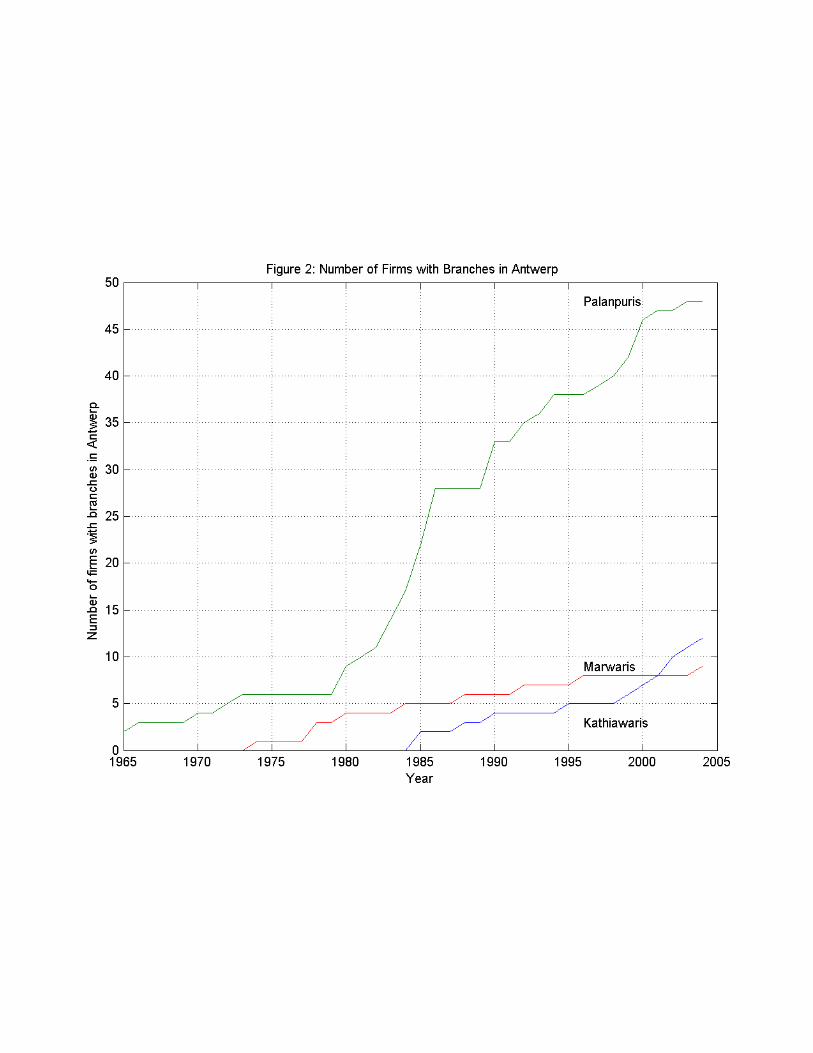
an exporter who had established a branch in Antwerp could provide many more referrals. Figure 2
plots the number of firms with branches in Antwerp and we see a sharp increase in the number of such
firms among the Palanpuris just around 1979.
There is a fixed cost to setting up a branch abroad – apart from the monetary expense, a close
relative must also typically reside there – and so the firm will weigh the returns from procuring roughs8The fact that the early Kathiawari entrants were supported by Palanpuris is not disputed in the diamond industry,
although individual firms are reluctant to admit that they were assisted in this way. Statements such as the following areoften heard: “‘Kathiawadis are here because of the Palanpuris’ admits a Kathiawadi diamond merchant. The Palanpuris,who were the market leaders brought the Kathiawadis into the trade. Help came not only in the form of finance but asinitiation into the import-export sector.” Diamond World (November-December 1999: p.52-53).
13

through the community network with the returns from this substantial investment when choosing
between these options. The returns to setting up a branch will depend to a large extent on how
easy it is for the firm to access rough diamonds on its own, once it is established in Antwerp, and
the additional benefit of being a rough supplier. The discovery of the Australian deposits and the
anticipation of large increases in the supply of rough diamonds many years into the future presumably
provided the impetus for Palanpuri firms to set up branches in Antwerp, which in turn led to the
entry of the Kathiawaris into business.9
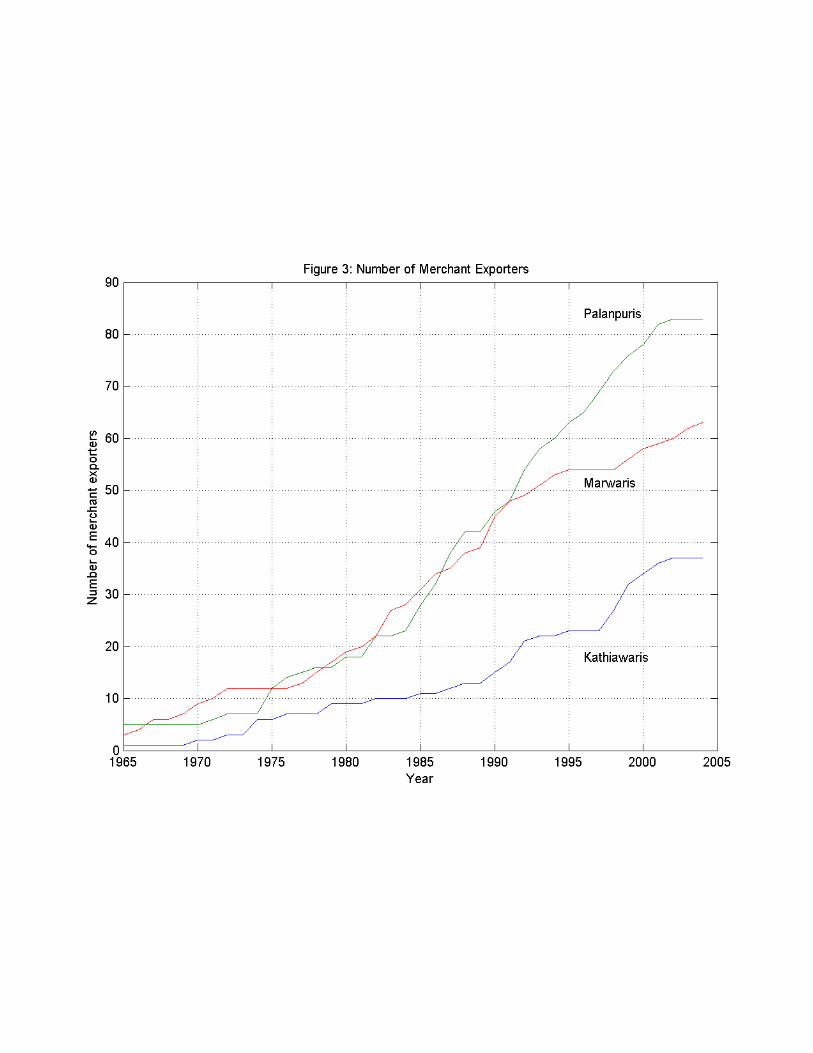
While the Palanpuris may have been able to support the entering Kathiawaris in Antwerp, how
did they sell their polished diamonds in the Bombay market? Figure 3 plots the growth in the
number of merchant exporters across communities and over time. We see that these firms emerged in
the mid-1970s, allowing the initial Kathiawari entrants without established foreign buyers to sell their
polished diamonds. The merchant exporters are drawn predominantly from the Marwari and Palanpuri
communities and it is apparent from the figure that the gap between the number of merchant exporters
belonging to these established business communities and the Kathiawari community has grown over
time. I define a merchant exporter to be a firm that has only been active on the polished side of the
market, both when it started exporting and currently. A number of Palanpuris who were previously
involved in all stages of the import-export process have recently reduced their activities to merchant
exporting. If we accounted for the shift of such firms into merchant exporting in Figure 3, the gap
between the Kathiawaris and the other communities would widen even further over time. Firms with
branches in Antwerp and merchant exporters effectively operate outside their community networks.
Figure 2 and Figure 3, taken together, indicate that firms from the established business communities
are increasingly likely over time to choose organizational structures that leave them less dependent on
their networks. The theoretical model that follows provides a simple explanation for this observation,
based on differences in outside options and accompanying network strength across communities.
3 The Path to Entrepreneurship: Theoretical Framework
The theoretical model developed in this section describes the growth of an industry-specific business
network following the entry of the initial group of entrepreneurs. We will see that weak outside9Notice from Figure 2 that very few Marwari firms establish branches in Antwerp. Marwari business activities are
well diversified across space and industries. Fixed investments in the industry, such as setting up a branch in Antwerp,are consequently particularly costly for the Marwaris and this might explain why they concentrate on the polished sideof the diamond market.
14
options in communities without a business background serve as a powerful force, strengthening the
networks relatively rapidly in these communities and bringing in entrepreneurs with increasingly weak
family backgrounds over time. The model also makes a number of assumptions to simplify the industry
dynamics and clarify the difference between communities. Despite its simplicity, it generates a number
of testable predictions, which we successfully test in the section that follows.
3.1 Production and Network Technology
Each firm in this industry consists of a single entrepreneur who buys inputs on credit at the beginning
of each period, has the inputs processed in his factory, and then sells the output on the competitive
product market. His profits at the end of the period are determined by his sales net of the loan that
he must repay to the supplier. The unit price of inputs and outputs are constant over time. With
constant returns to scale in production, the firm’s profit is a linear function of the amount of inputs
that it can procure, which varies across firms and over time.
Two communities, the H community and the L community are active in this industry. Each
entrepreneur i belonging to community j ∈ {H,L} is characterized by an ability endowment ωji that
reflects his family background and his intrinsic skill. More able entrepreneurs are better positioned to
independently establish connections with suppliers and so the amount of inputs procured is increasing
in ability. Members of the H community are more likely to have a father in business and so will have
higher ability on average. We assume that ability is uniformally distributed and does not vary across
successive cohorts, ωji ∼ U [θj − 1, θj ], with θH > θL.
Apart from his personal connections, the entrepreneur will also receive referrals to suppliers from
members of his community. The individual makes his career choice, deciding whether or not to enter
the industry, at a fixed age. Successive cohorts of individuals make this choice from one period to
the next, with individuals receiving referrals, if they do enter, from the cohort that preceded them.
Once inside the industry, the entrepreneur must decide whether or not to participate in the network.
Participation involves a costly social investment such as marriage within the industry, which restricts
the pool of prospective partners but increases the entrepreneur’s ability to commit to cooperative
behavior. We assume that these costs are increasing in ability, which will be shown to imply that
there exists a threshold ability above which entrepreneurs select out of the network, conditional on
having entered the industry. In the diamond industry, merchant exporters and entrepreneurs with
branches in Antwerp who are self-reliant and can operate independently fall into this category. We
15
will later verify that entrepreneurs in these firms indeed have higher ability on average in equilibrium.
Apart from the ability threshold separating firms inside the industry, we will see that there also
exists an ability threshold above which individuals enter the diamond industry. Payoffs inside the
diamond industry can then be described by the expression:
Xji · h
[ωjt−1 − ω
jt−1
]+ rIω
ji −X
ji cω
ji ,
where Xji equals one if individual i from community j who chose to enter the industry in period t also
participates in the network, Xji equals zero if he does not. ωjt−1 is the ability threshold above which
individuals entered the industry in the preceding cohort and ωjt−1 is the threshold above which they
selected out of the network. Given our distributional assumption, the measure of firms that invest in
the network in period t is ∆ωjt−1 ≡ ωjt−1 − ωjt−1. The benefit to the individual from participating in
the network is a linear function of its size, while the cost of this participation is also increasing linearly
in his ability. rI measures the returns to ability inside the industry.
3.2 Selection into the Industry and the Network
The payoff outside the industry for individual i from community j in any period is described by the
expression uj + rOωji , where uj measures outside options that are common across all members of the
community and rO measures the returns to individual ability outside the industry. Given that the H
community has a stronger business history than the L community, it seems reasonable to assume that
the members of that community have higher payoffs on average outside the industry, uH > uL.
Without individual experience effects, the individual will enter the industry in period t as long as
his payoffs inside the industry exceed the payoffs outside in that period. We will see in a moment
that these payoffs remain constant over the individual’s lifetime in equilibrium. Using the preceding
expression for payoffs inside the diamond industry, individual i in community j will invest in the
network (conditional on having entered the industry) if:
h∆ωjt−1 − cωji ≥ 0.
Using the expression for payoffs outside the industry described above and noting that the marginal
individual who enters the industry also invests in the network, individual i in community j will enter
the industry (and invest in the network) if:
h∆ωjt−1 + (rI − c)ωji ≥ uj + rOω
ji .
16

Based on the entry conditions derived above, the thresholds for selection out of the network and
selection into the industry can be expressed as:
ωjt =h∆ωjt−1
c(1)
ωjt =uj − h∆ωjt−1
rI − rO − c. (2)
Entrepreneurs with ωji ∈ [θj − 1, ωjt ) stay out of the industry, entrepreneurs with ωji ∈ [ωjt , ωjt ]
enter the industry and select into the network, and entrepreneurs with ωji ∈ (ωjt , θj ] enter the industry
but select out of the network.
3.3 Industry Dynamics
Subtracting the expression for ωjt in equation (2) from the expression for ωjt in equation (1),
∆ωjt =−uj
rI − rO − c+
h(rI − rO)c(rI − rO − c)
∆ωjt−1 ≡ −αj + β∆ωjt−1.
To compare network strength, organizational structure, and the business background of entering
entrepreneurs across communities over time, we assume that a measure ∆ω0 of firms exogenously
invest in the network in both communities in period 0. Starting with the first period and moving
forward in time, we solve recursively to obtain
∆ωjt =αj
β − 1+
(∆ω0 −
αj
β − 1
)βt. (3)
Notice from the expression above that parametric restrictions, ∆ω0 − αj
β−1> 0, β > 1 must be
imposed to ensure that network strength is increasing over time. Without a sufficiently large initial
influx of entrepreneurs ∆ω0, the network will not take off. Once it does take off, however, we see
below that it will strengthen more rapidly in the L community, with the gap in network strength
across communities widening over time.10
d∆ωjtdt
=
(∆ω0 −
αj
β − 1
)βtlnβ > 0
d2∆ωjtdαjdt
=−βt
β − 1lnβ < 0.
10β > 1 implies that rI − rO − c > 0. It then follows that uj and αj have the same sign. Because β > 1, thesecomparative statics and the results derived below only apply to periods before the time that the entire entering cohortin the L community invests in the network.
17
The result that the L-community network unambiguously strengthens more rapidly over time is a
consequence of our distributional assumption and the presence of non-network firms at the top of the
ability distribution in this industry. If such firms were absent, ωjt would be replaced by θj to give us
∆ωjt =
[θj − uj
rI − rO − c
]+
h
rI − rO − c∆ωjt−1.
The term in square brackets above corresponds to −αj . Assuming that this term continues to be
negative, it is now no longer obvious that it is larger (in absolute magnitude) for the H community
since θH > θL. If it is not, then the result derived above would be reversed and the network would
strengthen more rapidly in the H community. While the effect of ability and outside options will
generally work in opposite directions, the insight from the model is that weak outside options in
communities without a prior background in business serve as a powerful force, favoring the creation
of strong networks in the first generation. The analysis that follows in the next section will provide
empirical support for this claim.
The changes in network strength derived above have implications for the average ability of entrants
into the industry across communities and over time. In this simple framework, the average entrant’s
ability, W jt = (θj +ωjt )/2. Substituting from equation (3) in equation (2), it is easy to verify that the
average entrant’s ability will decline over time, more steeply in the L community.
dW jt
dt=
−h2(rI − rO − c)
(∆ω0 −
αj
β − 1
)βt−1lnβ < 0
d2W jt
dαjdt=
h
2(rI − rO − c)βt−1
β − 1lnβ > 0.
By allowing firms to select into or out of the network, conditional on having entered the industry, we
can also characterize changes in the organization of firms in the market. The measure of non-network
firms entering in each cohort is (θj − ωjt ). Substituting from equation (3) in equation (1),
d[θj − ωjt
]dt
=−hc
(∆ω0 −
αj
β − 1
)βt−1lnβ < 0
d2[θj − ωjt
]dαjdt
=h
c
βt−1
β − 1lnβ > 0.
With infinitely-lived entrepreneurs, the preceding result implies that the measure of non-network
firms is increasing, but at a declining rate over time. The marginal decline is smaller in the H
18
community, indicating that non-network firms are more likely to be drawn from the H community
and that the community-gap should be widening over time.11 Firms belonging to the H community
are more likely to select out of the network for two reasons: First, they have higher ability on average
than firms from the L community and this ability gap is widening over time. Second, their network is
weakening relative to the L-community network over time and so they have less to lose by selecting
out of it.
With constant returns to scale in production, the firm’s payoff or profit is a linear function of its
exports. In our framework, the firm’s performance, measured by its exports, can then be described
by the expression: λ[h∆ωjt−1 + rIωji ], where λ is a positive constant mapping profits into exports.
If firm-level panel data are available, then once we control for compositional change with firm fixed
effects, the fact that the L-community network is growing relatively strong over time implies that the
export trajectory must be steeper in that community.
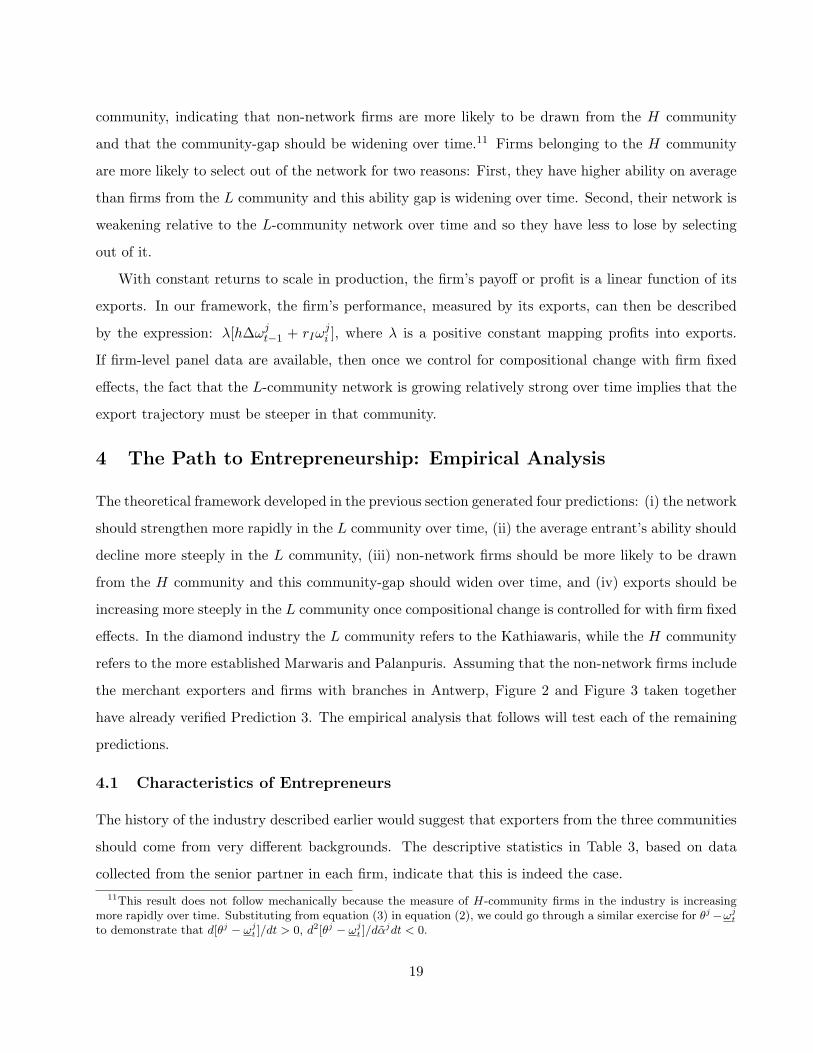
4 The Path to Entrepreneurship: Empirical Analysis
The theoretical framework developed in the previous section generated four predictions: (i) the network
should strengthen more rapidly in the L community over time, (ii) the average entrant’s ability should
decline more steeply in the L community, (iii) non-network firms should be more likely to be drawn
from the H community and this community-gap should widen over time, and (iv) exports should be
increasing more steeply in the L community once compositional change is controlled for with firm fixed
effects. In the diamond industry the L community refers to the Kathiawaris, while the H community
refers to the more established Marwaris and Palanpuris. Assuming that the non-network firms include
the merchant exporters and firms with branches in Antwerp, Figure 2 and Figure 3 taken together
have already verified Prediction 3. The empirical analysis that follows will test each of the remaining
predictions.
4.1 Characteristics of Entrepreneurs
The history of the industry described earlier would suggest that exporters from the three communities
should come from very different backgrounds. The descriptive statistics in Table 3, based on data
collected from the senior partner in each firm, indicate that this is indeed the case.11This result does not follow mechanically because the measure of H-community firms in the industry is increasing
more rapidly over time. Substituting from equation (3) in equation (2), we could go through a similar exercise for θj−ωjt
to demonstrate that d[θj − ωjt ]/dt > 0, d2[θj − ωj
t ]/dαjdt < 0.
19
The entrepreneur’s age is (mechanically) negatively correlated with the year that the firm was
established. Not surprisingly, the Kathiawari respondents are younger than the Marwari respondents,
who in turn are younger than the Palanpuri respondents in our sample. The Kathiawaris also have
significantly lower educational attainment, measured by years of schooling, than the entrepreneurs
from the more established business communities. One important schooling decision that parents must
make in India is whether to send the children to secondary school in English or the local language
(university education is almost always in English, at least in the major metropolitan areas). Munshi
and Rosenzweig (2006) describe how this choice has important implications for the children’s future; in
the diamond industry, fluency in English and the westernization that goes with English schooling allow
entrepreneurs to make contact and establish personal relationships more easily with foreign buyers
and suppliers. The Kathiawaris are less likely to have been schooled in English than the Marwaris
and Palanpuris, and they are further disadvantaged by being less likely to have grown up in Bombay
(as compared with the Palanpuris). This lack of urban experience is potentially a liability when it
comes to establishing branches abroad and interacting with foreign buyers and suppliers.12 Notice
that a relatively low proportion of Marwaris also report having grown up in Bombay, but this simply
reflects the wide scope of their business activities; although not reported, many of them grew up in
urban centers elsewhere in the country and this will become apparent in a moment when we describe
the occupations of their fathers.
Table 3, Panel B describes the entrepreneur’s father’s occupation, which is aggregated into seven
categories: farming, white-collar professional, other business, other jewelry business, diamond cutting
and polishing, diamond broker or trader, and diamond exporting. The most striking observation from
these statistics is that 53% of the Kathiawaris, but just over 2% of the Marwaris and Palanpuris, report
that their fathers were farmers. Looking down the other occupational categories, the Kathiawaris are
significantly less likely to belong to a business family than the other two communities: 35% of the
Kathiawaris versus 82% of the Marwaris and 76% of the Palanpuris report that their father was
engaged in any type of business.12Although the theoretical framework provides one explanation for why the Kathiawaris may be less likely to establish
branches in Antwerp, an alternative explanation is that their rural, less Westernized background makes it difficult forthem to live abroad. However, the Kathiawaris are nearly as likely as the Marwaris and Palanpuris to set up branchesin the United States, Asia and Europe to market polished diamonds, and the increase in the number of these branchesamong the Kathiawaris matches the corresponding increase for the Palanpuris during the 1990s. Recall that communitynetworks are less important and that firms effectively operate independently on the polished side of the market.
20

4.2 Changes in Average Ability
Table 4 subjects the community differences uncovered in Table 3 to greater scrutiny by studying how
the ability of entering entrepreneurs varied across communities and over time. Assuming that ωji is
an additive function of father’s occupation and intrinsic skill, we estimate regressions of the form:
Pr(f ji = 1) = αEY ji + βEY j
i · δj + δj (4)
where f ji = 1 if the entrepreneur’s father was a businessman, f ji = 0 otherwise, EY ji is the year in
which his firm was established, and δj is a vector of community dummies. Treating the Palanpuris as
the reference category, the coefficient on the Kathiawari-establishment year interaction term shoul be
negative if the ability-gap between the Kathiawaris and the more established communities is widening
across entering cohorts, as predicted by the theory.
The dependent variable takes the value one if the entrepreneur’s father was not a farmer, zero if he
was in Table 4, Column 1. Non-business activities are expanded to include white-collar professional
occupations and diamond cutting and polishing in Column 2. Finally, we measure ability by the
entrepreneur’s years of schooling in Column 3. The coefficient on the establishment year variable is
negative in all three columns but only significant in Column 3. More importantly, the coefficient on
the interaction of this variable with the Kathiawari dummy is negative and significant (except with
schooling as the dependent variable). The Marwari-establishment year coefficient, in contrast, is small
in magnitude and imprecisely estimated.13
The explanation put forward in this paper for the widening gap between the Kathiawaris and the
more established communities is that a rapidly strengthening Kathiawari network was able to support
increasingly weak entrants from that community at the margin. An alternative explanation is based
on changing characteristics in the population that the entrepreneurs are drawn from. Suppose that
entrepreneurs are selected randomly from this population. The pattern of coefficients in Columns 1-3
could also be obtained if father’s occupation and the entrepreneur’s educational attainment diverge
across communities over time. To accommodate this feature in the model, θj would be replaced by
θjt , with θHt − θLt widening over time. It is then easy to verify that the ability-gap among the entering
entrepreneurs WHt −WL
t would also be widening over time, even if networks were absent.13For firms that were formed following a separation by partners, the establishment year is measured by the year of
separation. The results in Table 4 are unaffected when the establishment year is measured instead by the year in whichthe original firm was established or the year in which the firm started exporting.
21

To disentangle differential selection into the industry due to changes in the underlying networks
from exogenous variation in population characteristics, we take advantage of the fact that entrepreneurs
establish their firms at different ages. The father’s occupation is inherited at birth (or relatively early
in life if there were career changes in the previous generation). The entrepreneur’s own educational
attainment is strongly correlated with his father’s occupation and, more generally, these population
characteristics will vary across age cohorts in each community. The specifications in Columns 4-6
consequently include the entrepreneur’s age and age-community interaction terms as additional re-
gressors. Conditional on the age variables, the establishment year effect can then be attributed to
differential selection into the industry in response to contemporaneous changes in the underlying com-
munity networks. The Kathiawari-establishment year coefficient becomes even more negative once the
age terms are included and is now significant even with schooling as the dependent variable.14
To demonstrate the economic importance of the community differences reported in Table 4,
I present nonparametric estimates of the relationship between business background, measured by
whether the entrepreneur’s father was a farmer, and the firm’s establishment year (net age effects) in
Figure 4.15 Almost all entrants, regardless of their community, came from non-farming backgrounds
in 1970. While this pattern remains constant over time for the Marwaris and the Palanpuris, starting
from the late 1970s the Kathiawari entrants are increasingly likely to have fathers who were farmers
and by 2000 over 70% of the Kathiawari entrants have farming backgrounds. With the less inclusive
business classification corresponding to Table 4, Column 5, 90% of the Marwaris and Palanpuris that
started their firms in 1970 had fathers in business. This statistic drops to 70% for both communities
by 2000. However, this decline is dwarfed by the corresponding decline for the entering Kathiawaris;
from 70% in 1970 to 20% in 2000.16
14Although the age coefficients are not reported in Table 4, it is worth mentioning that the coefficient on the Kathiawari-age interaction term is negative and significant in all columns. This indicates that schooling levels and business back-grounds in the population are converging across these communities, which is not surprising since the Kathiawaris startedat such a low level. Some of the entrepreneurs in the oldest firms inherited the business from their fathers and it followsthat the age-establishment year correlation will be naturally weaker in such firms. Dropping those firms has no effect onthe establishment year coefficients.
15The nonparametric kernel estimates are constructed in two steps: Estimate the regression corresponding to Table 4,Column 4, separately by community, with EY -squared as an additional regressor. This allows for additional flexibility inthe relationship between father’s occupation and the firm’s establishment year. Compute mean age by community andsubtract this from each entrepreneur’s age. Subtract this differenced variable, multiplied by the estimated age coefficientfrom the regression just described, from the dependent variable. This generates a measure of father’s occupation net ageeffects. Then nonparametrically regress this measure on the firm’s establishment year, separately by community, usingthe Epanechnikov kernel function.
16Schooling levels match these trends in occupational background: The Marwari entrepreneurs maintain roughly 14years of schooling, and the Palanpuris roughly 13 years of schooling, over the 1970-2000 period. The Kathiawaris startwith 13 years of schooling in 1970 and fall below 11 years by 2000.
22

4.3 Investment in the Network
The basic marriage rule in Hindu society is that no individual can match outside the sub-caste or jati.
The dense web of marriage ties that consequently forms over the course of many generations improves
information flows and reduces commitment problems and not surprisingly networks serving different
functions have historically been organized, and continue to be organized, at the level of the sub-caste.
Among business communities, marriage alliances within specific industries are, in addition, commonly
observed (Hazlehurst 1966). Such marriages strengthen industry-specific community networks and
in our sample, 35 percent of the entrepreneurs and 57 percent of their children married within the
diamond industry.
The model predicts that network-strengthening intra-industry marriages should increase most
rapidly across cohorts among the Kathiawaris (the L community). The dependent variable in Table 5,
Column 1 takes the value one if the spouse’s family was in the diamond industry prior to their marriage,
zero otherwise. The regressors include the firm’s establishment year, a full set of community dummies,
and the interaction of the establishment year with the community dummies. The establishment year
coefficient is negative but insignificant. Although the model predicts that intra-industry marriage
should be increasing over time for all communities, this coefficient cannot be interpreted once we allow
for secular changes inside or outside the industry. More importantly, the Kathiawari - establishment
year coefficient is positive and significant, in line with the network strengthening mechanism that has
been proposed.17
Intra-industry marriage will mechanically respond to growth in the number of firms in the industry,
which expands the pool of prospective partners from within the industry and the community. We saw
in Figure 1 that the number of Kathiawari firms did not grow especially fast, at least relative to the
Palanpuris. Nevertheless, we include the number of firms from the entrepreneur’s own community
that were already active when his firm was established, and the squared value of this variable, as
additional regressors in Table 5, Column 2. Not surprisingly, the results reported in Column 1 are17Marriage within the community or sub-caste would seem to be a pre-condition for marriage within the industry, based
on our characterization of the industry-specific community network. As expected, while 92% of the entrepreneurs in thesample married within their community, the corresponding statistic for entrepreneurs who married within the industry isas high as 98%. Although caste networks have been historically very stable, recent evidence from urban India indicatesthat some of these traditional networks may be starting to decay, with an accompanying decline in intra-communitymarriage (Munshi and Rosenzweig 2006). An alternative explanation for the cross-community variation in Table 5,Column 1 would then be that intra-community marriage has declined more rapidly over time among the urbanized andWesternized Marwaris and Palanpuris. However, regressions (not reported) with our sample of entrepreneurs indicate thatintra-community marriage actually increased over time among the Palanpuris (the reference category), while remainingroughly constant for the other two communities.
23
unchanged, with the Kathiawari-establishment year coefficient, in particular, continuing to be positive
and significant.
Apart from his own marriage decision, the entrepreneur could also invest in the network through
the marriage choices he makes for his children. Although the Kathiawari children continue to lag
behind the established communities in educational attainment and the likelihood of being schooled in
English, the community-gap has narrowed substantially across the generations (not reported). The
sons of the respondents who have completed school are almost without exception absorbed into the
diamond industry, whereas almost none of the daughters work outside the home. The corresponding
statistics for the spouses of the (married) children broadly match these occupational patterns, except
that a significant proportion of the daughters marry white-collar professionals or businessmen in other
industries. One-third of the Marwari daughters are married to businessmen operating outside the
diamond industry, consistent with the idea that many outside opportunities are available for members
of that community. Along the same lines, just 16% of the daughter-in-laws and 37% of the son-in-laws
of the Marwari respondents come from families that were already in the diamond business prior to
marriage. These numbers are significantly lower than the corresponding statistics for the Kathiawaris
and Palanpuris. However, 90% of the children from all three communities continue to marry within
their sub-caste, highlighting their continued ties to the broader community networks.
Table 5, Column 3 repeats the regression that we ran for the entrepreneur in Column 1, with
intra-industry marriage for the children as the dependent variable. The child’s gender is now included
as an additional regressor but the specification from Column 1 is otherwise unchanged. Once again,
the Kathiawari-establishment year coefficient is positive and statistically significant. Table 5, Column
4 includes the number of firms from the entrepreneur’s community that were already active in the
industry when his firm was established (linear and quadratic terms) as additional regressors, without
changing any of the results once again.
To provide a sense of the economic importance of these cross-community differences in marriage
patterns, Figure 5 presents nonparametric estimates of the relationship between the entrepreneur’s
marriage choice and the firm’s establishment year, corresponding to the specification in Column 1.
The nonparametric estimates for the Marwaris and Palanpuris are noisy in the tails (pre-1975 and
post-2000), but no time trend is discernable in either community, consistent with the estimates in
Table 5, Column 1. Sample averages indicate that 16% of the Marwaris and 45% of the Palanpuris
married within the industry. The corresponding statistic for the Kathiawaris is 28%, but as in Table 5,
24

Column 1 notice the substantial increase in such network strengthening marriages over time, starting
just above zero in 1970 and reaching 45% by 2004.
The increase in intra-industry marriage among the Kathiawaris contrasts with the decline in intra-
caste marriage in the Maharashtrian community, also in Bombay city, documented by Munshi and
Rosenzweig (2006). Although the Maharashtrians have lived in Bombay, the commercial center of
the country, for generations, they have been conspicuously absent from business, presumably because
they never received a sufficiently large shock to jump-start a business network. The Maharashtrians
historically used their caste networks to secure coveted blue-collar jobs in the mills and the factories,
but as the returns to corporate jobs increased with economic liberalization in the 1990s, they changed
their educational choices and shifted out of these jobs. Caste networks are less relevant in the corporate
sector, which explains why the intra-caste marriages declined over time.
While the preceding analysis focussed on differences in network-strengthening investments across
communities, the model also assumed that entrepreneurs with relatively low ability in their entering
cohort would be more likely to invest in the network. To verify this assumption we include merchant
exporters and firms with branches in Antwerp among the non-network firms, while network firms
include all other exporters. Including the firm’s establishment year, a full set of community dum-
mies, and the interaction of the establishment year with these dummies, as controls we see in Table
6, Columns 1-3 that network firms have lower observed ability as assumed, although the network
coefficient is only significant at the 10 percent level. Further, entrepreneurs and their children from
network firms are significantly more likely to marry within the industry in Columns 4-5, consistent
with the equilibrium correlation between network participation and marriage implied by the model.
4.4 Changes in Firm Performance
Citing confidentiality concerns, the Gem and Jewelry Export Promotion Council (GJEPC) did not
release firm-level export figures when it provided its database to be used to design the survey in 2004.
However, it reversed its decision in 2005 once the survey had been completed and I had established
more credibility in the industry. I was provided with export data over the 1994-2004 period, which
can be matched to the 95% of firms in the sample that appear in the database. To mask firm-specific
figures, the firms in the database were sorted by export level and then divided into 100 groups in
each year by the GJEPC. The average export level in a group was then assigned to all firms in that
group. While this procedure generates some noise in the export data, it does not bias the estimated
25
community coefficients in the export regressions that I describe below.
The prediction from the model is that exports should increase more steeply in the L community
(among the Kathiawaris) once firm fixed effects are included to control for compositional change. This
prediction relies on the assumption that there are constant returns to scale in production, which is a
reasonable description of this industry. Diamond cutting and polishing is a labor intensive activity
that does not require great skill. Firms in the industry employ the same production technology, with
a single worker assigned to a single machine and so must increase their production by hiring new
workers.
Table 7, Column 1 regresses exports on a time trend, the interaction of the time trend with
Kathiawari and Marwari dummies, and a full set of community dummies.18 We see that the coefficient
on the Kathiawari-year interaction term is positive but insignificant; Kathiawari exports do not lag
behind Palanpuri exports despite the fact that entrepreneurs from this community with relatively
weak backgrounds were entering the industry over time. The community-year effects in Column 1
reflect changes in the strength of the network as well as changes in the composition of firms over
time. Controlling for compositional change with firm fixed effects in Column 2, the Kathiawari-year
interaction coefficient increases in size and is now significant at the 5 percent level. The increase
in the steepness of the export trajectory from Column 1 to Column 2 is substantially larger for the
Kathiawaris than for the Marwaris or Palanpuris, indicating that the relatively steep decline in the
background of entering entrepreneurs from that community did indeed have consequences for firm
performance.
When a firm is involved in all stages of the production process, typically three partners, who are
invariably close relatives, are required; one to buy roughs, the second to supervise the cutting and
polishing, and the third to market the polished. In contrast, a merchant exporter could get by with no
additional partners. Many Marwari and Palanpuri firms have restricted their activities to merchant
exporting in recent years, often leading to the termination of existing partnerships. This explains, in
part, why over 17% of Marwari and Palanpuri firms were formed following a separation by partners,
as opposed to only 8% of the Kathiawari firms.19 When two relatives who were partners separate,18For firms with multiple names, we took care to discard the “shell firm,” which typically reports negligible exports in
each year. An additional complication when computing the export figures is that polished diamonds sold to merchantexporters will not appear under the supplying firm’s name. Based on changes in the organization of firms describedabove, this would increasingly underestimate export levels for the Kathiawaris over time and so provide a conservativeestimate of the role of their network in supporting entrepreneurship.
19The Kathiawari firms have significantly more partners than firms from the other communities: The average number
26

one individual will keep the original name while the other starts a new firm under a different name.
Since rough suppliers and polished buyers will be divided among the partners, both firms will be
smaller than the original firm, at least to begin with. To rule out the possibility that the positive
Kathiawari-year coefficient is a consequence of greater separation among Marwari and Palanpuri firms,
Table 7, Columns 3-4 exclude firms that have separated or were formed following a separation from
the sample. The Kathiawari-year coefficient remains stable and continues to be precisely estimated
with this reduced sample of firms.
Notice, in contrast with the positive Kathiawari-year coefficient, that the coefficient on the Marwari-
year term is negative across all specifications in Table 7, consistent with the view that superior outside
options in that community are associated with a weakening industry-specific network. The estimated
coefficients in the fixed effects regressions indicate that the Kathiawari network increased average
sales for its members by approximately 240 thousand dollars per year over and above the Palanpuri
benchmark, which reflects growth in that network as well as secular changes in the industry, effectively
compensating for their increasingly weak business backgrounds. To get a sense of the importance of
this differential network effect, average annual sales for Kathiawari firms were roughly 4.7 million
dollars per year over the 1994-2004 period.20
5 Alternative Explanations for Changes in Average Ability
The alternative explanations for the patterns in Figure 4 and Table 4 that we consider next do
not require networks to be active. They are derived by allowing communities to differ along other
dimensions, specifically by relaxing some of the assumptions that we made in the model.
1. The ability distribution varies across cohorts and communities: Suppose we relax the
assumption that the ability distribution is fixed and allow ability over successive cohorts to decline and
to diverge across communities. With our distributional assumption, this is conveniently implemented
by allowing the right support of the ability distribution to decline across all cohorts, but more steeply
in the L community. Then it is easy to verify that W jt = (θj + ωjt )/2 will decline more steeply in the
of partners, with standard errors in parentheses, is 2.81(0.12), 2.07(0.12), 2.22(0.07) for the Kathiawaris, Marwaris, andPalanpuris, respectively. Moreover, around 40% of the Marwari and Palanpuri firms are proprietary concerns versus 25%of the Kathiawari firms.
20Exports are measured in millions of 1994 Rupees in Table 7 and the exchange rate was 31 Rupees to the dollar inthat year. While the Kathiawaris grow at least as fast as the Marwaris and Palanpuris in Table 7, they do not lag behindin the level of exports either. Average exports over the 1994-2004 period (in millions of dollars per year) are 3.8 for theMarwaris and 5.0 for the Palanpuris.
27
L community even when network effects are absent.
As discussed, the fact that entrepreneurs establish their firms at different ages allows us to control
for differential changes in population characteristics across communities. Recall from Table 4, Columns
4-6 that the Kathiawari-establishment year coefficient grows larger in absolute magnitude when the
age terms are included, indicating that differences in family background and educational attainment
between the Kathiawaris and the more established communities may actually have been narrowing
over time. The age variables control for average changes in population characteristics across cohorts
and it is possible, at least in principle, for the right support of the ability distribution to diverge even
as average ability was converging across communities.
Suppose that the entering Kathiawaris have always consisted of a high proportion of first-generation
businessmen, but that these individuals have a greater propensity to exit. Such selective exit from
the industry could also generate a decline in average ability over time. The trend-break in the late
1970s in Figure 1 would appear to go against this hypothesis and we have already noted that exit
rates are extremely low in this industry. Nevertheless, we will use the results in Table 7 to rule out
this possibility, as well as the hypothesis that the pattern of entry is being driven by changes in the
underlying population distribution.
2. Outside options vary across communities and over time: Looking back at equation (2),
suppose now that uj is declining over time, more steeply in the L community. Once again, W jt will
decline more steeply in the L community, without requiring networks to be active. The intuition for
this result is that if conditions worsen outside, entrepreneurs with low ability will be willing to enter
the industry. This alternative explanation is more difficult to rule out because changes in outside
options occur contemporaneously with entry decisions.
If networks are absent and the relatively steep ability decline in the L community is caused by
changing outside options, ability in the population, or selective exit, then exports should decline more
steeply in the L community. Once we allow for secular shifts in exports over time, the prediction is
that exports in the L community should increasingly lag behind exports in the H community. More
importantly, once we control for compositional change with firm fixed effects, the model predicts that
the export trajectory must certainly be steeper in the L community when networks are active. Under
the alternative hypotheses, exports in the L community and the H community should, instead, track
together when fixed effects are included. The results in Table 7 consequently rule out this alternative
explanation.
28
3. Ability is mis-measured: Once we relax the assumption that each firm consists of a single
entrepreneur, the senior partner could compensate for any personal weakness by matching with capable
partners or hiring well qualified employees. Entrepreneurs could also compensate for their weak
business backgrounds by preparing themselves prior to establishing their firms. The survey collected
information on the entrepreneur’s employment activity prior to entering the diamond industry as well
as his activities within the industry prior to entering the current firm. In general, there is no evidence
that the Kathiawaris make a special effort to prepare themselves prior to entry.21 Nevertheless, we
leave open the possibility that entrepreneurs could compensate for their weak personal backgrounds
along other unobserved dimensions, differentially across communities and over time, in which case the
observed patterns in Figure 4 could be entirely spurious.
To demonstrate that effective ability among the entering Kathiawari entrepreneurs did indeed
decline over time relative to their rivals, we once again take advantage of the results in Table 7. If
the pool of Kathiawari entrepreneurs is indeed worsening over time, then the export trajectory for
that community should grow steeper once fixed effects that control for this compositional change are
included. Moreover, if the ability decline is steeper for the Kathiawaris than for the Marwaris and
Palanpuris, then the impact of the fixed effects on the export trajectory should be larger in that
community. This is indeed what we observed in Table 7.
4. Returns inside the industry vary across communities and over time: Since we are
concerned with cross-community variation in family background and firm exports, we could easily relax
the assumption that prices and the returns to ability in the diamond industry are constant. However,
if Kathiawaris occupy a particular niche in the diamond industry and returns in that niche have
grown disproportionately fast over time, then this could explain the weakening family background of
entering Kathiawaris without an accompanying decline in their relative performance, even if networks
are absent.
Kathiawari firms tend to specialize in small stones; these stones account for 57% of their output21The activities prior to entry into the industry include: did nothing, farming, white-collar professional job, jewelry
business, colored stone or pearl business, and other business. Combining the last three categories, 6% of the Kathiawarisversus 19% of the Marwaris and 9% of the Palanpuris reported that they were engaged in any type of business activitybefore entering the industry. The list of activities within the industry but prior to entering the current firm included: didnothing, cut and polished diamonds, worked as a manufacturing contractor, served as an employee/apprentice, workedas a broker, was involved in rough or polished trading, and was a partner in another firm. Combining the last fourcategories, 52% of the Kathiawaris versus 71% of the Marwaris and 65% of the Palanpuris reported prior activity thatwould have prepared them directly for the diamond export business.
29

by value, versus 44% and 49% for the Marwaris and the Palanpuris, respectively.22 Small stones
make up the most dynamic and competitive segment of the market and, if anything, we would expect
the availability of these stones (per firm) to have declined over time, relative to other sizes. We will
nevertheless include the proportion of small stones in the firm’s output interacted with time as an
additional variable in the export regression (the uninteracted proportion will also be included in the
specification without fixed effects), with the expectation that this should only strengthen the results.
Table 7, Columns 5-6 include the proportion of rough stones in the firm’s output interacted with
time as an additional regressor (the uninteracted variable is also included in Column 5 without fixed
effects). The coefficient on this interaction term is negative and significant (in Column 6), indicating
that the small-stone segment has become relatively less profitable over time, while the Kathiawari-year
coefficient continues to be positive and significant once fixed effects are included.
6 Conclusion
This paper traces the emergence of a new business community. Starting with the first influx of en-
trepreneurs thirty years ago in response to an exogenous supply shock to the diamond industry, I
document the process through which Kathiawari entrepreneurs with increasingly weak family back-
grounds were able to enter business over time. Empirical support is also provided for the role played
by an underlying community network in facilitating this transition. The sons of the Kathiawari owners
are almost without exception absorbed into what is now a second-generation family business. With
hundreds of Kathiawari firms in the industry, this can legitimately be called a business community and
it is possible that the Kathiawaris will move into other areas of business in the future as opportunities
arise.
What lessons can the analysis in this paper provide for efforts to stimulate entrepreneurship in
developing economies? If substantial entry into business takes place through the movement of entire
groups, as I have described it, then community characteristics rather than individual attributes will
determine whether such efforts are successful. This paper highlights the positive role played by weak
outside options in strengthening new community networks. However, members of communities without
a background in business are also likely to have relatively low entrepreneurial ability and we have seen
that this can work against the formation of new business networks. Moreover, while networks may22We classified stones into seven sizes in the survey: -2, stars, mele, +11, pointers, stones, and larger stones. Small
stones are defined to include -2, stars, and mele.
30
serve a useful purpose when markets function imperfectly, these collective arrangements can give rise
to dynamic inefficiencies that constrain the response to new opportunities (Greif 1994, Kranton 1996,
Rauch 2001). Recent evidence from urban India indicates that caste-based labor networks can indeed
restrict mobility (Munshi and Rosenzweig 2006). Whether communities will be able to enter new
occupations and set up new networks will then depend on their pre-existing networks and the social
pressures that they exert on mobility.
To successfully move a large number of individuals into business, it is thus necessary to identify
communities that are positioned to make such a transition successfully. Once such communities have
been identified, the next step would be to initiate the transition. In the diamond industry, a fortuitous
confluence of circumstances set the Kathiawari network on a steep growth trajectory. In other settings,
the challenge would be to target interventions at the appropriate group of individuals to jump-start
community networks. Given the multiplier effects that we observe, there may be large returns to
targeting interventions in this way.
31
References
[1] Banerjee, Abhijit and Kaivan Munshi. 2004. How Efficiently is Capital Allocated? Evidence from
the Knitted Garment Industry in Tirupur, Review of Economic Studies 71(1):19-42.
[2] Banerjee, Abhijit and Andrew Newman. 1993. Occupational Choice and the Process of Develop-
ment, Journal of Political Economy 101(2): 274-298.
[3] Bennedsen, M., K. Nielsen, F. Perez-Gonzalez, D. Wolfenzon. 2007. Inside the Family Firm: The
Role of Families in Succession Decisions and Performance, Quarterly Journal of Economics 122:
647-691.
[4] Bertrand, Marianne, Simon Johnson, Krislert Samphantharak, and Antoinette Schoar. 2004.
Mixing Family with Business: A Study of Thai Business Groups and the Families Behind Them,
typescript.
[5] Cawthorne, Pamela. 1995. Of Networks and Markets: The Rise and Rise of a South Indian Town,
the Example of Tiruppur’s Cotton Knitwear Industry, World Development 23(1):43-56.
[6] Chandavarkar, Rajnarayan. 1994. The Origins of Industrial Capitalism in India: Business strate-
gies and the working classes in Bombay, 1900-1940. Cambridge: Cambridge University Press.
[7] Chhotalal, Kantilal. 1990. Diamonds: From Mines to Markets, The Gem and Jewelry Export
Promotion Council, Bombay.
[8] Diamond World. November-December 1999. Jaipur: Journal House.
[9] Dunn, Thomas and Douglas Holtz-Eakin. 2000. Financial Capital, Human Capital, and the Tran-
sition to Self-Employment: Evidence from Intergenerational Links, Journal of Labor Economics
18(2): 282-305.
[10] Engelshoven, Miranda. 1999. Diamonds and Patels: a report on the diamond industry of Surat,
Contributions to Indian sociology 33(1-2):353-377.
[11] Engelshoven, Miranda. 2002. Rural to Urban Migration and the Significance of Caste: The Case
of the Saurashtra Patels of Surat, in Development and Deprivation in Gujarat, eds. Ghanshyam
Shah, Mario Rutten, and Hein Streefkerk, New Delhi: Sage Publications.
32

[12] Galor, O. and J. Zeira. 1993. Income Distribution and Macroeconomics, Review of Economic
Studies, 60: 35-52.
[13] Gem and Jewelry Export Promotion Council. 1998. Indian Gems and Jewelry Statistical Booklet,
Bombay.
[14] Greif, Avner. 1993. Contract Enforceability and Economic Institutions in Early Trade: the
Maghribi Traders’ Coalition, American Economic Review 83(3)525-48.
[15] Greif, Avner. 1994. Cultural Beliefs and the Organization of Society: A Historical and Theoretical
Reflection on Collectivist and Individualist Societies, Journal of Political Economy, 102(5): 912-
950.
[16] Hazlehurst, Leighton W. 1966. Entrepreneurship and the Merchant Castes in a Punjabi City,
Durham: Duke University Press.
[17] Kranton, Rachel. 1996. Reciprocal Exchange: A Self-Sustaining System, American Economic
Review 86(4):830-851.
[18] Lamb, Helen B. 1955. The Indian Business Communities and the Evolution of an Industrialist
Class, Pacific Affairs, 28(2):101-116.
[19] La Porta, Rafael, Florencio Lopez-de-Silanes, and Andrei Shleifer. 1999. Corporate Ownership
Around the World. Journal of Finance 54: 471-518.
[20] McKenzie, David and Christopher Woodruff. 2003. Do entry costs provide an empirical basis for
poverty traps? Evidence from Mexican microenterprises, BREAD Working Paper No. 020.
[21] Medhora, Phiroze B. 1965. Entrepreneurship in India, Political Science Quarterly, 80(4):558-580.
[22] Munshi, Kaivan and Mark Rosenzweig. 2006. Traditional Institutions Meet the Modern World:
Caste, Gender and Schooling Choice in a Globalizing Economy, American Economic Review,
96(4):1225-1252.
[23] Nafziger, Wayne. 1978. Class, Caste, and Entrepreneurship: A Study of Indian Industrialists,
Honolulu: The University Press of Hawaii.
33
[24] Paulson, Anna, Robert Townsend and Alexander Karaivanov. 2006. Distinguishing Limited Liabil-
ity from Moral Hazard in a Model of Entrepreneurship, Journal of Political Economy, 114(1):100-
145.
[25] Purani, Keyoor. 2000. Gujarat Model of Entrepreneurial Innovation: A Study of Surat Diamond
Industry, SEAKE Center, University of Brighton, Working Paper No. WP/eu-ind/120.
[26] Rauch, James E. 2001. Business and Social Networks in International Trade, Journal of Economic
Literature, 39: 1177-1203.
[27] Rauch, James E. and Vitor Trinidade. 2002. Ethnic Chinese Networks in International Trade,
Review of Economics and Statistics, 84: 116-130.
[28] Richman, Barak. 2006. How Community Institutions Create Economic Advantage: Jewish Dia-
mond Merchants in New York, Law and Social Inquiry 31(2): 383-420.
[29] Rudner, David West. 1994. Caste and Capitalism in Colonial India: The Nattukottai Chettiars,
Berkeley: University of Calfornia Press.
[30] Timberg, Thomas. 1978. The Marwaris: From Traders to Industrialists, New Delhi: Vikas Pub-
lishing House Pvt. Ltd.
34

Table 1: Referral Pattern
Source of referrals:number of individuals that provided referrals
total number of referrals provided
percent of referrals for Kathiawaris
percent of referrals for Marwaris
percent of referrals for Palanpuris
(1) (2) (3) (4) (5)
Kathiawari exporters 60 212 74.06 2.83 20.28Marwari exporters 24 206 12.62 42.72 37.86Palanpuri exporters 128 707 9.19 9.05 78.64Brokers 47 239 31.38 14.23 51.05Other 36 109 18.35 21.10 49.54
Note: Other sources of referrals include personal connections of the survey team and firms belonging to other communities.A total of 295 individuals provided referrals in Column 1.These individuals provided a total of 1,473 referrals in Column 2.Columns 3-5 sum to approximately 95% because some referrals are also made to exporters from other communities.

Table 2: Organization of Production
Community: Kathiawari Marwari Palanpuri(1) (2) (3)
Panel A: Rough transactions
Number of suppliers per year 9.98 11.68 10.76(1.17) (2.71) (1.13)
Percent of firms with a single dominant supplier 70.78 70.83 71.48(3.68) (6.63) (2.83)
Percent of roughs sourced directly from Antwerp 76.31 63.18 67.98(2.37) (4.99) (2.15)
Percent of roughs received on credit 80.78 73.48 75.39(2.27) (4.99) (2.03)
Average repayment period (days) 102.39 98.29 101.44(1.88) (4.78) (1.79)
Percent of transactions involving a written agreement 3.95 9.76 6.28(1.58) (4.69) (1.57)
Panel B: Polished transactions
Number of buyers per year 33.23 49.57 30.11(4.39) (14.11) (2.40)
Percent of firms with a single dominant buyer 52.91 69.03 58.65(3.49) (4.37) (2.56)
Percent of polished sold directly to buyers abroad 59.10 69.42 63.35(2.71) (3.42) (1.89)
Percent of polished sold on credit 77.20 82.95 84.37(1.95) (2.38) (1.25)
Average repayment period (days) 102.11 114.24 113.49(2.55) (3.89) (1.83)
Percent of transactions involving a written agreement 2.99 5.98 5.57(1.20) (2.20) (1.18)
Note: standard errors in parentheses.Dominant supplier is defined as a supplier who provides more than 30% of the firm's roughs.Dominant buyer is defined as a buyer who accounts for more than 20% of the firm's polished.Merchant exporters, who restrict their activity to the polished side of the market, are excluded from Panel A.

Table 3: Characteristics of Entrepreneurs
Community: Kathiawari Marwari Palanpuri(1) (2) (3)
Panel A: Individual characteristics
Age 42.46 46.13 49.05(0.77) (0.92) (0.52)
Years of schooling 10.84 14.41 12.87(0.26) (0.19) (0.12)
Percent schooled in English 11.47 47.20 37.28(2.16) (4.48) (2.41)
Percent that grew up in Mumbai 22.02 26.40 49.38(2.81) (3.96) (2.49)
Panel B: Family background
Father's occupation (%)Farming 53.02 2.46 2.54White-collar professional 5.58 13.93 15.52Other business/store-owner/sales 11.16 27.05 27.23Other jewelry business 5.12 29.51 11.96Diamond cutting & polishing 7.44 1.64 6.62Diamond broker/trader 2.79 3.28 9.92Diamond exporter 14.88 22.13 26.21
Any business 34.56 82.40 75.81(3.24) (3.42) (2.14)
Number of firms 218 125 405
Note: standard errors in parentheses. Any business includes other business/store-owner/sales, other jewelry business, diamond broker/trader, and diamond exporter.
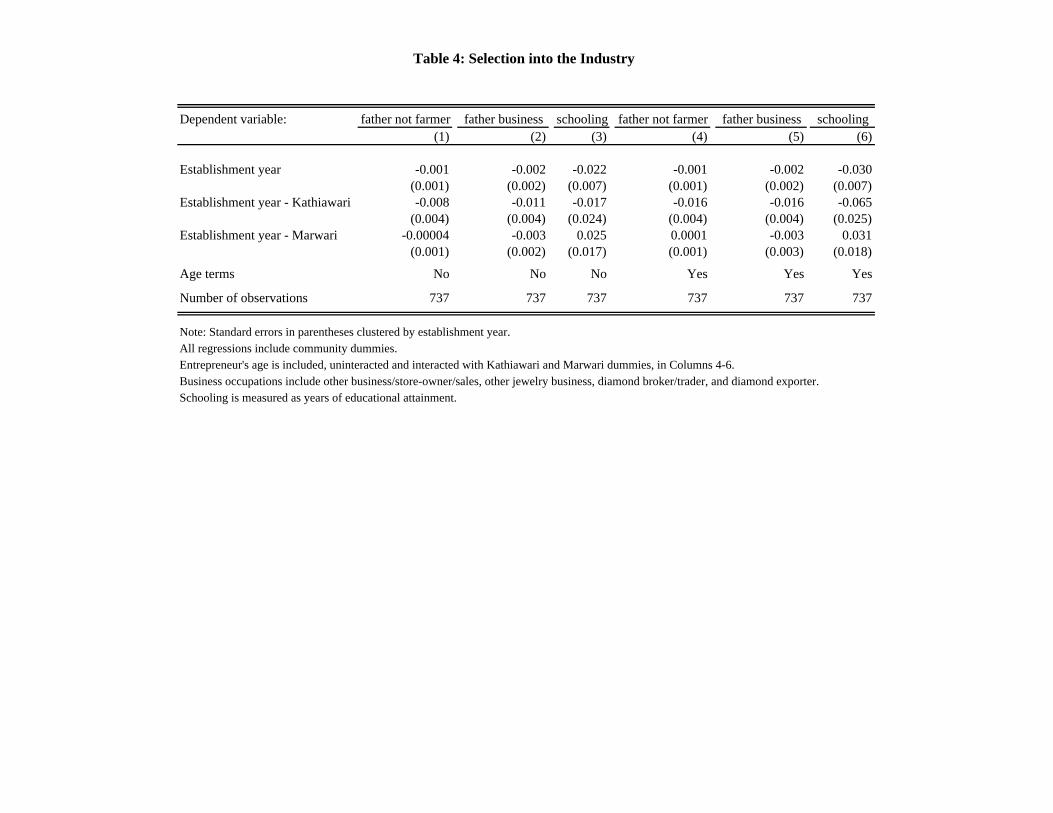
Table 4: Selection into the Industry
Dependent variable: father not farmer father business schooling father not farmer father business schooling(1) (2) (3) (4) (5) (6)
Establishment year -0.001 -0.002 -0.022 -0.001 -0.002 -0.030(0.001) (0.002) (0.007) (0.001) (0.002) (0.007)
Establishment year - Kathiawari -0.008 -0.011 -0.017 -0.016 -0.016 -0.065(0.004) (0.004) (0.024) (0.004) (0.004) (0.025)
Establishment year - Marwari -0.00004 -0.003 0.025 0.0001 -0.003 0.031(0.001) (0.002) (0.017) (0.001) (0.003) (0.018)
Age terms No No No Yes Yes Yes
Number of observations 737 737 737 737 737 737
Note: Standard errors in parentheses clustered by establishment year.All regressions include community dummies.Entrepreneur's age is included, uninteracted and interacted with Kathiawari and Marwari dummies, in Columns 4-6.Business occupations include other business/store-owner/sales, other jewelry business, diamond broker/trader, and diamond exporter.Schooling is measured as years of educational attainment.
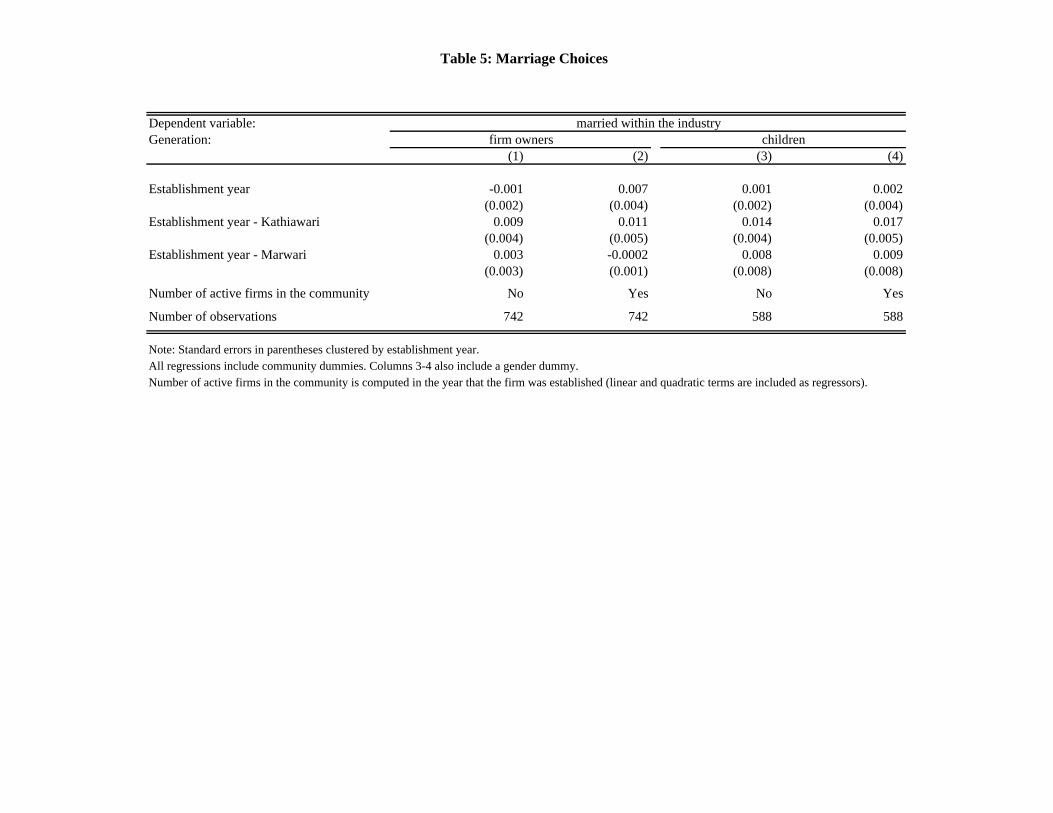
Table 5: Marriage Choices
Dependent variable:Generation:
(1) (2) (3) (4)
Establishment year -0.001 0.007 0.001 0.002(0.002) (0.004) (0.002) (0.004)
Establishment year - Kathiawari 0.009 0.011 0.014 0.017(0.004) (0.005) (0.004) (0.005)
Establishment year - Marwari 0.003 -0.0002 0.008 0.009(0.003) (0.001) (0.008) (0.008)
Number of active firms in the community No Yes No Yes
Number of observations 742 742 588 588
Note: Standard errors in parentheses clustered by establishment year.All regressions include community dummies. Columns 3-4 also include a gender dummy.Number of active firms in the community is computed in the year that the firm was established (linear and quadratic terms are included as regressors).
childrenmarried within the industry
firm owners
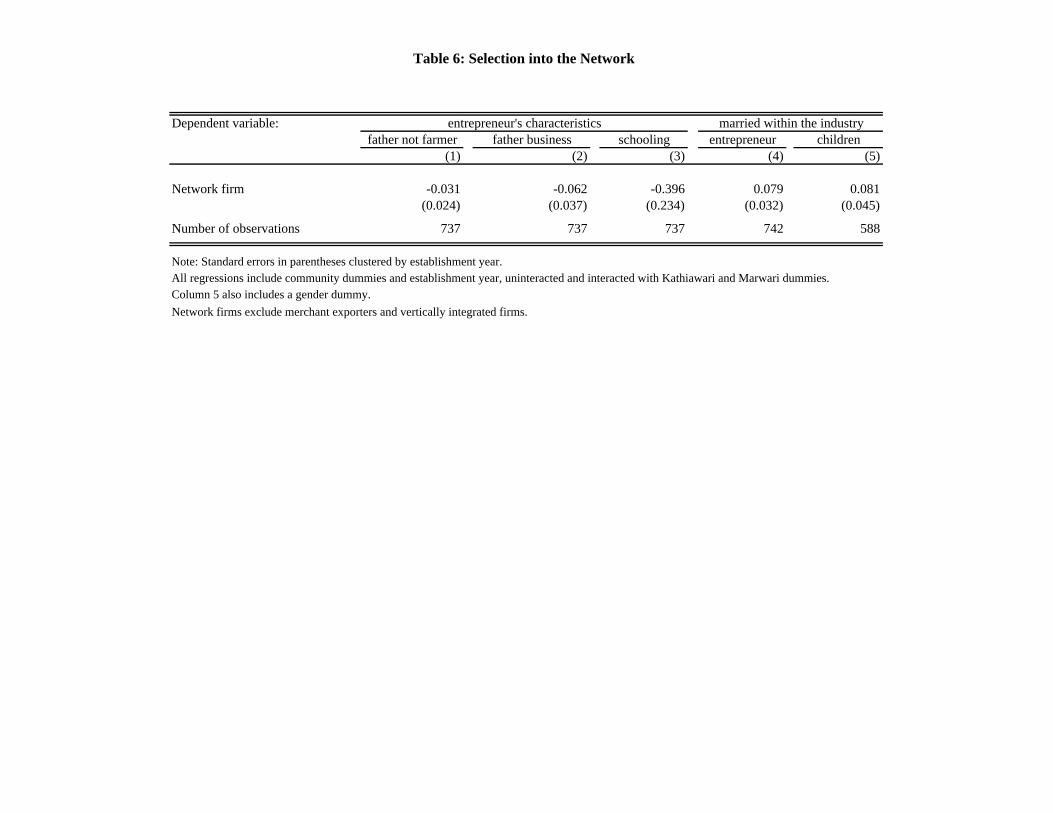
Table 6: Selection into the Network
Dependent variable:father not farmer father business schooling entrepreneur children
(1) (2) (3) (4) (5)
Network firm -0.031 -0.062 -0.396 0.079 0.081(0.024) (0.037) (0.234) (0.032) (0.045)
Number of observations 737 737 737 742 588
Note: Standard errors in parentheses clustered by establishment year.All regressions include community dummies and establishment year, uninteracted and interacted with Kathiawari and Marwari dummies.Column 5 also includes a gender dummy.Network firms exclude merchant exporters and vertically integrated firms.
married within the industryentrepreneur's characteristics

Table 7: Firm Performance
Dependent variable:Sample:
(1) (2) (3) (4) (5) (6)
Year 12.940 14.272 14.114 15.293 17.593 20.585(2.093) (1.906) (2.241) (1.954) (4.440) (3.287)
Year-Kathiawari 1.874 7.419 3.453 8.892 2.744 8.266(3.938) (2.223) (4.054) (2.411) (3.803) (2.362)
Year-Marwari -7.514 -6.626 -7.113 -6.504 -8.214 -7.583(2.332) (2.153) (2.553) (2.298) (2.520) (2.408)
Year-proportion small stones -- -- -- -- -0.100 -0.123(0.056) (0.031)
Firm fixed effects No Yes No Yes No Yes
Number of observations 6,114 6,114 5,233 5,233 5,965 5,965
Note: Standard errors in parentheses clustered by year.Exports are measured in millions of 1994 Rupees.Separated firms are formed following a split among original partners.Proportion small stones measures the proportion of the firm's output that is accounted for by -2, stars, and mele.All regressions without firm fixed effects include community dummies.
exportsexcluding separated firmsall firms all firms