the best- and worst- rated retail apps...
TRANSCRIPT

Browse And Buy With Apps Shoppers Love
igital is disrupting how people shop. Our smartphones and tablets
are constantly in our pockets to research and purchase ... just about
anything. ARC from Applause studies the present and future of
commerce to determine which brands are on the leading edge of the
revolution. In our biannual report on the retail industry, ARC revisited how
U.S. customers rate the quality of the 95 most popular apps. What did we
discover? The retail apps economy is incredibly volatile, with app redesigns,
new features, diverse connected experiences, voracious consumer appetite
and lofty expectations. As retailers gear up for the fast-approaching holiday
season, discover the best-and worst-rated apps so you know ahead of time
the retail brands with which to splurge.
The average app quality score of the 95 most popular retail apps in Google Play and Apple
App Store, on a 100-point scale.
D
1
ARC REPORT • AUG. 2015
THE BEST- AND WORST-RATED RETAIL APPSWe did the math. The mobile quality leaders and laggards of the U.S. retail industry.
By Ben Gray
43

7 Popular Brands Earn High Quality Marks
ARC from Applause authored this report to help retail brands understand
how U.S. customers perceive their flagship Android and iOS app quality.
In all, 95 of the most popular apps qualified for our biannual Applause
Retail App Quality Index, comprised
of the apps that earned more than
200 app store ratings and reviews—
totaling nearly 2 million.
Just seven retailers earned average
app quality scores of 67 or greater with more than 4,000 user reviews:
■ Fanatics (92) [Android | iOS]
■ Domino’s Pizza (85) [Android | iOS]
■ Groupon (82) [Android | iOS]
■ HauteLook (69) [Android | iOS]
■ Overstock.com (68) [Android | iOS]
■ REI (68) [Android | iOS]
■ CVS Health (67) [Android | iOS].
What is the greatest commonality? Loyal
and passionate customers sing the praises of their brand experiences
because their app is optimized for a shopper’s mobile moments (see
Figure 1). The best retail apps showcase dynamic experiences such
as one tap to see the best deals, seamless switching across devices,
content and alerts pushed at the perfect moment and more. Ideal retail
experiences were born from customer-obsessed teams who understand
what mobile users value.
BLOOMBERG BUSINESS
In the past four quarters, Starbucks has
made $146 million on interest alone
[of gift cards and app balances].
2

Retail Apps That Have Room To Improve
On average, the 95 most reviewed retail apps lag the other 30 million
apps globally in quality by 24 points—as compared with ARC’s
calculation of a 67 average app quality score from our analysis of more
than 30 million apps across the world (see Figure 2). The low average
suggests that brands born in the Web era need to rearchitect their digital
strategy given how quickly mobile is influencing buying decisions and
has crossed the 30% share of U.S. eCommerce transactions, according
to Criteo.
Reviews of retail apps also reflect the level of customer experiences.
If a shopper checks the inventory of a local store via the app and
then discovers the product is sold out upon arrival, they will let their
displeasure be known through the app. App stores now serve as a
channel through which users share brand experiences—good and bad.
Six brands received more than 1,000 reviews and were rated by their
customers with average app quality scores of 25 or less:
■ Old Navy (25) [Android | iOS]
■ Macy’s (25) [Android | iOS]
■ Burger King (25) [Android | iOS]
■ Jimmy John’s (19) [Android | iOS]
■ Michaels (19) [Android | iOS]
■ McDonald’s (12) [Android | iOS].
Note that three of the six are quick service restaurants (QSRs). Killer
mobile apps can increase restaurant traffic and drive business growth.
Look no further than Domino’s Pizza, Five Guys, Pizza Hut, Starbucks
and Taco Bell for evidence—and inspiration.3

APPLAUSE RETAIL APP QUALITY INDEX - MINIMUM, AVERAGE & MAXIMUM SCORE
Health and beautyDrug stores
Sporting goodsMass merchants
Electronics and entertainmentHome improvement
RestaurantsApparel
Hobby and craftDepartment stores
SupermarketsHome goods
5954545349444341
40363630
SOURCE: APPLAUSE ANALYTICS, AUGUST 2015
SOURCE: APPLAUSE ANALYTICS, AUGUST 2015
APPLAUSE RETAIL APP QUALITY INDEX - APPAREL
Foot LockerHauteLook
Bath & Body WorksUrban OutfittersVictoria's Secret
H&MExpress
Forever 21Hollister
AbercrombieAmerican Eagle
PaylessGAP
Old NavyBanana Republic
796961574543414039343028262516
N/A+1-24+21+1+1-5-1-1-50-3-4-2-9
3232,266159324
2,8701,763529
1,53677616
1,898455190
1,004122
767,092
671,6891,640367
1,58311,5227593891,982323223
1,532109
figure 1
4
figure 2

APPLAUSE RETAIL APP QUALITY INDEX - DEPARTMENT STORES
NordstromKmartSears
J.C. PenneyBelk
Kohl'sMacy's
72414133292725
2,2852,1082,10815661
1,473919
SOURCE: APPLAUSE ANALYTICS, AUGUST 2015
+23-4-3+11+15+80
212,7252,7211,0112403,1701,826
APPLAUSE RETAIL APP QUALITY INDEX - DRUG STORES
CVS HealthWalgreens
Rite Aid
676333
20,18352,397
499
SOURCE: APPLAUSE ANALYTICS, AUGUST 2015
+15-2-4
22,29018,3871,057
SOURCE: APPLAUSE ANALYTICS, AUGUST 2015
APPLAUSE RETAIL APP QUALITY INDEX - ELECTRONICS & ENTERTAINMENT
Overstock.comNookQVCeBayHSN
NeweggAmazon.com
Best BuyAppleKindle
GameStopVerizon Wireless
AT&T WirelessBarnes & Noble
Toys "R" Us
686362626255545451463935323112
+8-2+21-3-1-1-2+10+1+1+4-3+4-6
1,53313,8182,52658,725
856962
8,87217,6525,00317,4691,7946,10911,0961,373245
3,57630,6295,051
152,4592,0093,93847,92918,639N/A
49,0488,18414,68810,500
N/A562
5

APPLAUSE RETAIL APP QUALITY INDEX - HEALTH & BEAUTY
UltaBath & Body Works
Sephora
666153
1,07567
3,114
SOURCE: APPLAUSE ANALYTICS, AUGUST 2015
-1-24-14
1,296159602
APPLAUSE RETAIL APP QUALITY INDEX - HOBBY & CRAFT
Hobby LobbyJo-Ann
AutoZoneA.C. Moore
Michaels
7343422719
33530861366
1,538
SOURCE: APPLAUSE ANALYTICS, AUGUST 2015
+1-20-2-9+3
75745
3,573167
5,746
APPLAUSE RETAIL APP QUALITY INDEX - HOME GOODS
IKEA CatalogIKEA
HomeGoodsBed Bath & Beyond
45352014
3,809210221409
SOURCE: APPLAUSE ANALYTICS, AUGUST 2015
-2-12-10-4
5,8741,050N/A283
APPLAUSE RETAIL APP QUALITY INDEX - HOME IMPROVEMENT
The Home DepotMenards
Lowe's
524139
5,252431
2,326
SOURCE: APPLAUSE ANALYTICS, AUGUST 2015
+2-6-1
2,662121
1,158
6
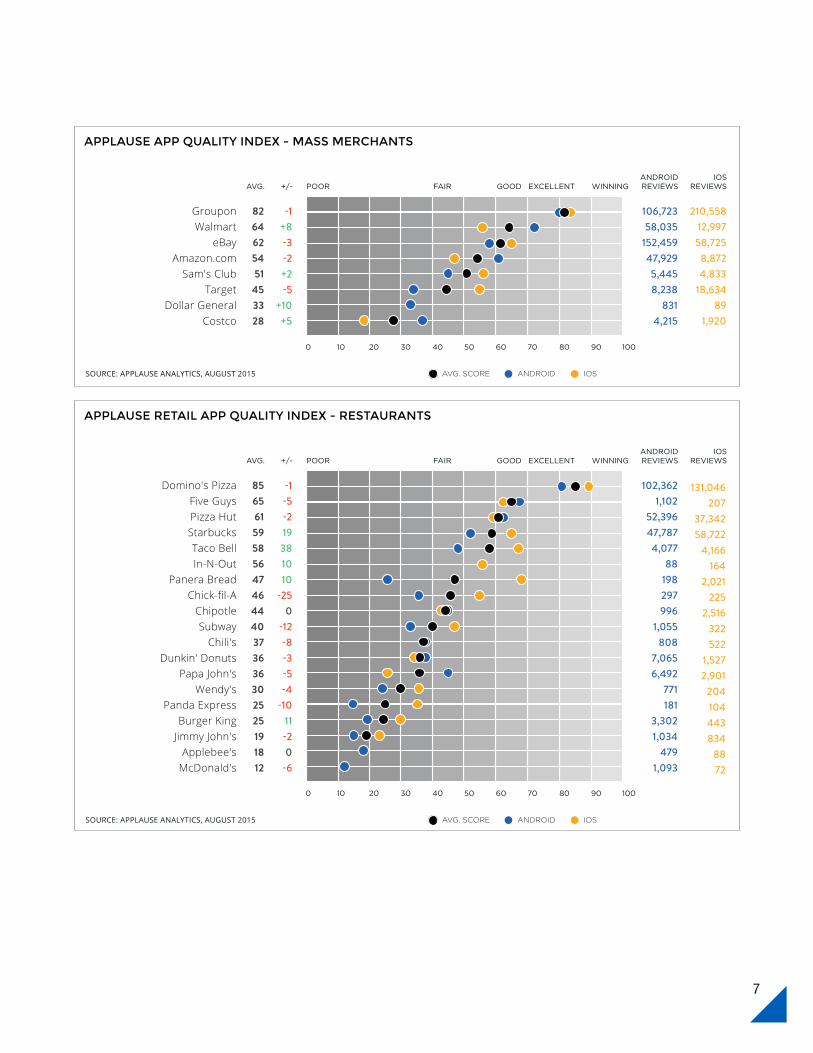
APPLAUSE APP QUALITY INDEX - MASS MERCHANTS
GrouponWalmart
eBayAmazon.com
Sam's ClubTarget
Dollar GeneralCostco
8264625451453328
210,55812,99758,7258,8724,83318,634
891,920
SOURCE: APPLAUSE ANALYTICS, AUGUST 2015
-1+8-3-2+2-5
+10+5
106,72358,035152,45947,9295,4458,238831
4,215
SOURCE: APPLAUSE ANALYTICS, AUGUST 2015
APPLAUSE RETAIL APP QUALITY INDEX - RESTAURANTS
Domino's PizzaFive GuysPizza HutStarbucksTaco BellIn-N-Out
Panera BreadChick-fil-A
ChipotleSubway
Chili'sDunkin' Donuts
Papa John'sWendy's
Panda ExpressBurger King
Jimmy John'sApplebee's
McDonald's
85656159585647464440373636302525191812
-1-5-219381010-250
-12-8-3-5-4-1011-20-6
131,046207
37,34258,7224,166164
2,021225
2,5163225221,5272,9012041044438348872
102,3621,102
52,39647,7874,077
88198297996
1,055808
7,0656,492771181
3,3021,034479
1,093
7

APPLAUSE RETAIL APP QUALITY INDEX - SPORTING GOODS
FanaticsFoot Locker
REIDick's
Cabela's
9279682717
1,68576
3,680313278
SOURCE: APPLAUSE ANALYTICS, AUGUST 2015
-1N/A-1-2-2
2,448323383368439
SOURCE: APPLAUSE ANALYTICS, AUGUST 2015
APPLAUSE RETAIL APP QUALITY INDEX - SUPERMARKETS
Whole FoodsPeapodKrogerH-E-B
AldiWegmans
SafewayShopRite
Trader Joe'sPublix
AlbertsonsSUPERVALU
524844434337363432262020
-2-8-1
N/A+3+1-3-50-6+6-6
1,030172
1,3432551517479491,201215554165106
108402
4,481673626808
4,4871,685N/A1,160412239
The Best- And Worst-Rated Retail Apps
Some retail apps emerged from the crowd with amazing reviews, such
as Fanatics for Android and Domino’s Pizza for iOS. Others stood out
for all the wrong reasons. Eight of the thirteen lowest-rated apps were
on Android while ten of the thirteen highest-rated apps were on iOS
(see Figure 3).
8

Some Brands Had Large Sentiment Swings
Since ARC’s inaugural retail report in November
2014, 20 brands experienced significant volatility
in user sentiment. Most significantly, Taco Bell
introduced iPhone ordering on October 27, 2014.
Today, customers gleefully skip lines and reward
Taco Bell with increased in-store revenues and
stronger app store star ratings (its perceived iOS
app quality has since more than doubled).
With the good, comes the bad. Jo-Ann, Bath & Body
Works and Chick-fil-A earned poor distinctions
with scores that declined 20 points or more, massive
swings in less than a year. These brands have work
to do to stem their user sentiment decline and win
more mobile customers and greater loyalty.
figure 3
HIGHEST- AND LOWEST-RATED RETAIL APPS WITH 1,000+ REVIEWS
Apparel
Department stores
Drug stores
Electronics and entertainment
Health and beauty
Hobby and craft
Home goods
Home improvement
Mass merchants
Restaurants
Sporting goods
Supermarkets
Forever 21
Kohl's
Rite Aid
AT&T Wireless
Ulta
Michaels
IKEA Catalog
Lowe's
Costco
McDonald's
None
Publix
SOURCE: APPLAUSE ANALYTICS, AUGUST 2015
HIGHEST-RATED LOWEST-RATED
HauteLook
Nordstrom
Walgreens
Nook/Overstock.com
Sephora
AutoZone
IKEA Catalog
The Home Depot
Groupon
Domino's Pizza
Fanatics
Kroger
+38
+23
+21
+21
+19
+15
+15
+11
+11
+10
+10
+10
-10
-10
-12
-12
-14
-20
-24
-25
Taco Bell
Nordstrom
Urban Outfitters
QVC
Starbucks
Belk
CVS Health
J.C. Penney
Burger King
Dollar General
In-N-Out
Panera Bread
Panda Express
HomeGoods
Subway
IKEA
Sephora
Jo-Ann
Bath & Body Works
Chick-fil-ASOURCE: APPLAUSE ANALYTICS, AUGUST 2015
9

About ARC
ARC from Applause is a research group dedicated to providing insights
and data on the apps economy. ARC leverages data from a variety of
sources, including proprietary Applause data, to provide a 360º view of
app quality. ARC combines this data, with analysis, into reports to help
brands and app developers understand what is happening in the apps
economy.
Learn more at http://arc.applause.com.
About Applause Analytics
Combing through half a billion star ratings and user reviews submitted
across more than 30 million apps in the Android and iOS app stores
around the world, Applause Analytics closes the gap between mobile
app developers and their customers, generating actionable insights
and quantifiable metrics based on what users are actually saying about
their app experiences.
Learn more at www.applause.com/analytics.
10