the bernstein income tax playbook...maximizing after-tax investment returns within the investor’s...
TRANSCRIPT

Table of Contents
Today’s Tax Challenge ................1
The Investment Life Cycle and Taxes ...................3
Portfolio StrategiesAvoiding Short-Term Gains ............. 5
Loss Harvesting............................. 7
Investing for Tax-Efficient Income ...................... 9
Wealth Forecasting ..................12
Education Savings ....................13
Retirement Overview...............15
Retirement SavingsDC Plans and IRAs ...................... 19
Cash Balance Plans ..................... 21
Roth Conversions ........................ 23
The Roth Do-Over ....................... 26
Variable Annuities ........................ 27
Taxes and Planning ..................30
Charitable DonationsOutright Gifts .............................. 31
Donor-Advised Funds and Private Foundations .............. 33
Charitable Gift Annuities .............. 35
Charitable Remainder Unitrusts .................... 37
Notes on Wealth Forecasting System .................40
Global Wealth ManagementGlobal Wealth Management
The Bernstein Income Tax Playbook

Today’s Tax Challenge
It is well known that taxes began to
take a bigger bite out of income for
the well-off in 2013. Top marginal
tax rates rose, as the display below
shows, and some exemptions and
deductions were phased out.
What is less well known is that
investors spending from their port-
folios—even those investors whose
tax rates didn’t rise—may be facing
higher tax bills, too. Historically low
interest rates continue to depress the
tax-exempt income from municipal
bonds, so many investors spending
from their portfolios have to sell
assets to replace lost income. Given
the stock market’s terrific gains over
the past five years, selling stocks
generally means realizing taxable
capital gains, and most investors
have few or no tax-loss carryforwards
left from 2008 to offset those gains.
We therefore think that smart tax
management is more important than
ever. This playbook includes a range
of actionable strategies that can help
you realize better after-tax outcomes
in today’s challenging environment.
Table of Contents
Today’s Tax Challenge ................1
The Investment Life Cycle and Taxes ...................3
Portfolio StrategiesAvoiding Short-Term Gains ............. 5
Loss Harvesting............................. 7
Investing for Tax-Efficient Income ...................... 9
Wealth Forecasting ..................12
Education Savings ....................13
Retirement Overview...............15
Retirement SavingsDC Plans and IRAs ...................... 19
Cash Balance Plans ..................... 21
Roth Conversions ........................ 23
The Roth Do-Over ....................... 26
Variable Annuities ........................ 27
Taxes and Planning ..................30
Charitable DonationsOutright Gifts .............................. 31
Donor-Advised Funds and Private Foundations .............. 33
Charitable Gift Annuities .............. 35
Charitable Remainder Unitrusts .................... 37
Notes on Wealth Forecasting System .................40
Perc
ent
Perc
ent
0
10
20
30
40
50
91 96 01 06
Top Ordinary Income Tax Rate
Top Capital Gains Tax Rate
0
2
4
6
8
10
91 96 01 06 11 1411 14
10-Year Treasury Yield
Through March 31, 2014Source: Internal Revenue Service (IRS), Treasury and AllianceBernstein
Tax Rates Are Up and Bond Yields Remain Low
Global Wealth ManagementGlobal Wealth Management
The Bernstein Income Tax Playbook

What Can Investors Do?
This playbook explains a number of
strategies for avoiding and deferring
taxes that investors and their tax
advisors can consider. Some are
relatively simple, such as making
a charitable gift or maximizing
retirement savings. Others are more
complex to evaluate, such as convert-
ing an individual retirement account
(IRA) to a Roth IRA, or establishing a
charitable remainder unitrust (CRUT).
In each case, we discuss how the
strategy works, whom it’s likely to
help most, what kind of benefit it
provides, and its drawbacks, risks,
limitations and tax impact.
We also quantify the potential benefit,
using our Wealth Forecasting System,
which takes into account both tax
considerations and our projections of
10,000 plausible scenarios for future
capital-market returns. Sometimes,
we show the median likely outcome;
other times, the range of likely
outcomes. (See “Wealth Forecasting,”
page 12, and “Notes on Wealth
Forecasting System,” page 40.)
Some of these strategies are
governed by complex tax rules; the
discussions herein may not touch
on every aspect relevant to your
situation. Check with your tax advisor
before adopting these strategies.
Animating Principles
We elaborate on some of the key
issues that investors should address
in “The Investment Life Cycle and
Taxes,” page 3, and “Investing for
Tax-Efficient Income,” page 9. But
broadly speaking, our approach rests
on a few key principles:
Don’t let the tax tail wag the investment dog. Maximizing
after-tax investment returns within
the investor’s risk and return
objectives should be the goal, not
minimizing taxes per se. After all, the
best way to minimize taxes is to have
no income. Investors who invest their
entire portfolio in tax-exempt bonds
may pay no tax on their investments,
but they are unlikely to obtain the
long-term growth they need.
Avoiding tax is permanent; deferring tax just kicks the tax can down the road—possibly to a
time when tax rates may be higher.
Tax-loss harvesting, while often
beneficial, just defers tax to a future
year. Sometimes, the transaction costs
or bid-ask spreads may eat up most or
all of the benefit (page 7).
Tax laws change, although not as often as it may seem. It may be
prudent not to rely too much on any
tax-related strategy. Roth conversions
(page 23) and charitable remainder
unitrusts (page 37) are among the
strategies with legislative risk.
Maintaining liquidity is important. Paying tax up front in a
Roth IRA conversion or front-loading
gifts to a 529 account (page 13) may
maximize after-tax wealth, but both
strategies may leave an investor
without easy access to needed funds.
Costs matter, too. Some tax-related
strategies, such as a charitable
remainder unitrust, require up-front
or ongoing legal and accounting fees;
they are generally most economical
when applied to large amounts (page
37). Similarly, private foundations may
maximize control over philanthropic
gifts, but they are generally eco-
nomical only for very large charitable
programs (page 33). And today, high
guarantee fees make some variable
annuities unattractive (page 27).
Different taxes may require different strategies. This playbook
focuses primarily on strategies that
address federal income taxes. Other
taxes, including federal gift, estate
and generation-skipping transfer
taxes, and many types of state and
local taxes, can present related or
entirely distinct hurdles for investors.
Every taxpayer’s goals and circum stances are different. The state you live in, the number
of dependents you have, and your
tax bracket, total wealth, embedded
gains and losses, and time horizon will
determine whether these strategies
are likely to work for you. We suggest
that you use this playbook to identify
strategies that you and your tax
advisors can explore in greater detail.
Bernstein can help you to quantify the
potential benefits for you, to design
and manage a particular strategy, or
both. Working with clients and their
tax advisors is central to the service
that Bernstein offers.
Bernstein does not offer tax, legal or accounting advice. In considering this material, you should discuss your individual circumstances with professionals in those areas before making any decision.
2
The Investment Life Cycle and Taxes
You invest to grow your wealth, but
what are you growing it for? There
can only be two reasons: You need
to spend it during your lifetime, or
you want to give it away to causes or
people you care about.
Either goal must overcome a common
hurdle: taxes. Often, investors focus
on tax strategies from year to year
without taking a step back to look
at the big picture. How you save
or spend money today can have a
profound impact on your after-tax
wealth over the long term and,
ultimately, on your legacy.
During the working years when most
investors accumulate wealth, you
should generally emphasize investing
in assets, such as stocks, that tend
to grow in value, and make smaller
allocations to risk-mitigating assets,
such as bonds. But growth alone does
not guarantee long-term success.
If you do not invest in a tax-aware
manner, federal, state and local taxes
may eat up more than half of your
investment return. It’s what you keep,
not what you make, that matters.
Recognizing that can help build wealth
for future goals.
Your asset allocation may become
less growth-oriented when you retire,
but tax-efficient sources of capital
remain important both in retirement
and when you leave assets to charity
or loved ones.
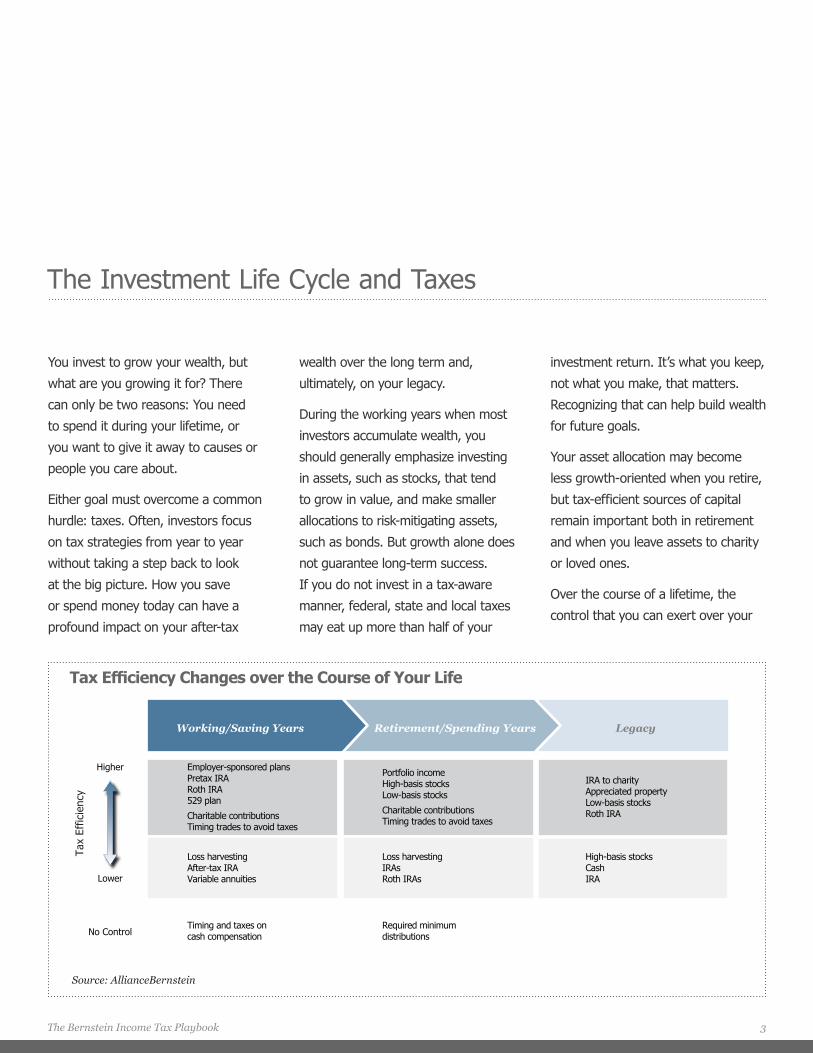
Over the course of a lifetime, the
control that you can exert over your
Tax Efficiency Changes over the Course of Your Life
Employer-sponsored plansPretax IRARoth IRA529 plan
Charitable contributionsTiming trades to avoid taxes
Portfolio incomeHigh-basis stocksLow-basis stocks
Charitable contributionsTiming trades to avoid taxes
Loss harvestingAfter-tax IRAVariable annuities
Loss harvestingIRAsRoth IRAs
Timing and taxes on cash compensation
Required minimum distributions
Higher
Lower
Tax
Effic
ienc
y
No Control
Working/Saving Years
IRA to charityAppreciated propertyLow-basis stocksRoth IRA
High-basis stocksCashIRA
LegacyRetirement/Spending Years
Source: AllianceBernstein
3The Bernstein Income Tax Playbook

tax. (There is no limit on transfers
to charity or spouses who are US
citizens.) In addition, most types of
assets receive a “step-up” in cost
basis at death, erasing any embedded
capital gain.
Highly appreciated property that will
receive a step-up at death is generally
a good candidate for your legacy, and
it should generally be among the last
sources for spending, so that you can
avoid significant tax on capital gains.
Certain kinds of appreciated property,
like collectibles, are subject to higher
tax than the typical long-term capital
gain on stocks. Thus, those assets
should be the last you sell to fund
lifetime spending.
There is no step-up in cost basis for
retirement accounts, so it’s most
efficient to leave a tax-deferred IRA
to a charity that will never pay tax
(as your taxable beneficiaries would).
If you leave a tax-free Roth account
to loved ones, they can stretch the
nontaxable payments over their
expected life span.
The intersection of the estate and
income tax regimes needs thoughtful
and nimble management. The rules
may change over time. These are
matters to discuss carefully with your
tax advisors. Bernstein may be able
to help you and your tax advisors
quantify the benefits and risks of the
various strategies you consider.
If you don’t need the entire RMD to
support your lifestyle, you may want
to consider converting a portion of
your IRA to a Roth IRA. Although
you would have to pay some tax up
front, this could significantly reduce
your annual tax bill going forward and
increase your legacy.
If you need more than the RMD
and Social Security to support your
lifestyle, it is generally most tax-
efficient to withdraw additional funds
from your taxable portfolio rather
than from your retirement portfolio.
Funding your additional spending
from a taxable account allows you
to manage the taxable capital gains
you recognize. It’s generally a good
idea to sell stocks with a high cost
basis (limited capital gains) before
selling stocks with a low cost basis
(substantial capital gains). Harvesting
losses may help offset some of the
gains you recognize.
Sourcing spending dollars in these
ways can keep your overall tax
bill relatively low and allow your
remaining retirement-plan assets to
continue to grow on a tax-deferred
basis.
Your Legacy
You can maximize the assets you
leave as a legacy by paying careful
attention to the intersection of estate
and income taxes. Under current law,
each person can leave up to $5.34
million to non-charitable, non-spouse
beneficiaries free of federal estate
sources of income and taxes will
vary, as the display on the prior page
illustrates. The display also ranks the
tax efficiency of various strategies.
The Working and Saving Years
If you are still working and saving,
you probably have relatively little
control over when to recognize
income. If most of your income
comes from cash compensation, and
that compensation is the only source
of the money you spend, you will
have few opportunities to control the
size of your tax bill.
But you can prioritize saving money
in ways that lower your tax bill
today and for years to come. Saving
through a qualified retirement plan
allows you to defer taxable income
today into your retirement years,
when you may be in a lower tax
bracket. You can also save for your
children’s or grandchildren’s educa-
tions on a tax-free basis through a
529 plan; give to charity to avoid tax
today; and manage your portfolio in a
tax-aware manner.
The Retirement Years
In retirement, you can also prioritize
spending in ways that minimize your
overall tax bill.
Because you can’t control it, a
required minimum distribution (RMD)
from an IRA is often the first source
of an investor’s retirement spending,
along with Social Security. The RMD is
taxed at ordinary tax rates.
4

Investors can reduce taxes on invest-
ment income by being diligent about
timing transactions to take advantage
of favorable rates. Capital gains on
the sale of stocks held for more than
a year are taxed at a lower, long-term
capital gains rate than gains on the
sale of stocks held a year or less.
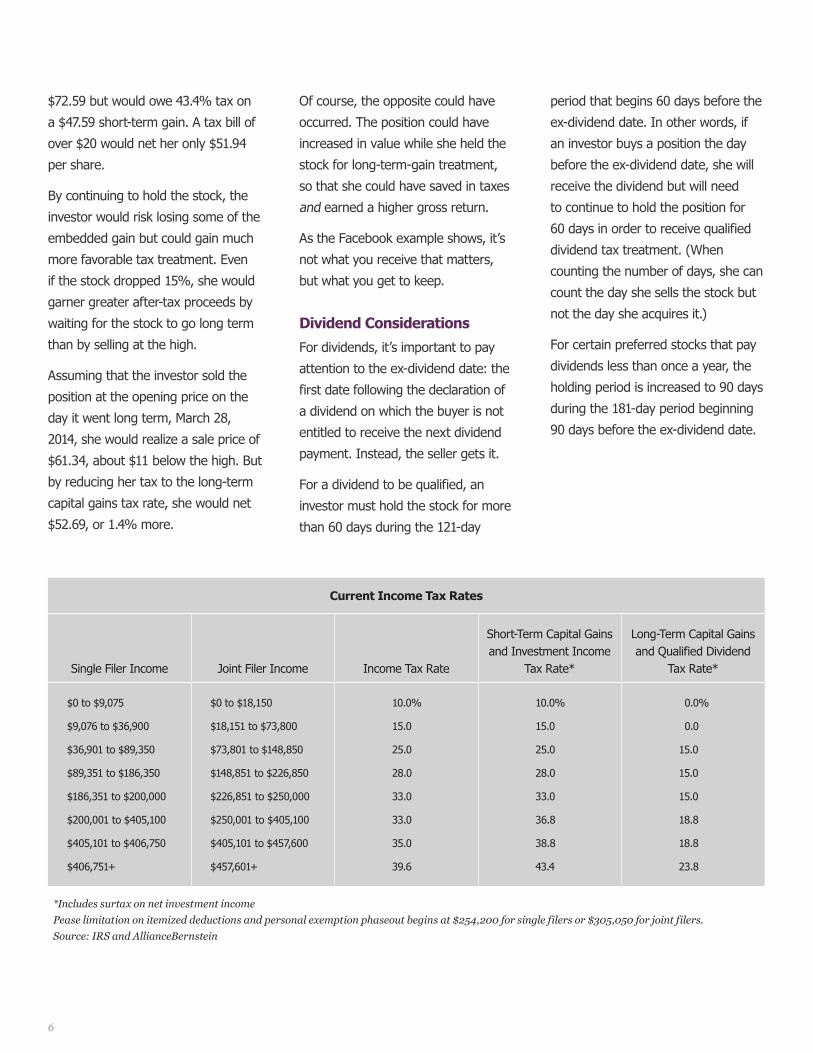
(See the tax-rate table, page 6.)
Dividends from both common
and preferred stock in qualified
corporations are also taxed at the
lower long-term capital gains rates,
if the taxpayer meets certain holding
requirements.
Timing transactions may sound easy,
but it can be complicated, particularly
for investors with large, diversified
portfolios divided among multiple
accounts. Bernstein integrates
efficient tax management into the
investment management of our
taxable portfolios.
How It Works
For a position to be considered long
term, it must be held for more than
one year. By waiting to sell a position
at a gain until it has been held for
more than a year, a top-bracket
taxpayer can reduce the tax bite
substantially—from 43.4% to 23.8%.
Investors in lower tax brackets can
sometimes entirely eliminate the
capital gains tax by waiting.
Quantifying the Benefit
The display below quantifies the
benefit of waiting to sell—even if
the value of the stock falls in the
interim. In this example, an investor
purchased Facebook stock for $25 per
share on March 27, 2013. Almost a
year later, the investor held the stock
at a gain: Facebook hit its 52-week
high on March 11, 2014. The investor
was tempted to sell, but there were
still more than two weeks to go until
the gains realized on the holding
would become subject to long-term,
rather than short-term, capital gains
tax. If the investor sold at the high,
she would realize a sale price of
Portfolio Strategies
Avoiding Short-Term Gains
Best for: Anyone
Benefit: Tax avoidance
Tax Impact:
Limitations: Must meet IRS holding requirements for long-term
gains or qualified dividend treatment
Complexity/Cost: Minimal
Drawbacks: Risk of continuing to hold investment
Purchased Facebook 3/27/2013: $25.00 per Share
52-Week High3/11/2014
Long-Term Gain3/28/2014
Sell Facebook Shares
Even with Facebook’s price falling more than 15%, a high-tax-rate investor is better off
waiting for long-term-gain treatment.
Cost basis $25.00 $25.00
Sale price 72.59 61.34
Short-term gain 47.59 —
Long-term gain — 36.34
Tax rate 43.4% 23.8%
Tax cost $20.65 $8.65
Net proceeds $51.94 $52.69
1
2 3 4 5 6 7 8
9 10 11 12 13 14 15
16 17 18 19 20 21 22
23 24 25 26 27 28 29
30 31
Source: AllianceBernstein; see Disclosure on Security Examples, page 41.
Timing Trades to Avoid Taxes
Low Moderate High
The Bernstein Income Tax Playbook 5
period that begins 60 days before the
ex-dividend date. In other words, if
an investor buys a position the day
before the ex-dividend date, she will
receive the dividend but will need
to continue to hold the position for
60 days in order to receive qualified
dividend tax treatment. (When
counting the number of days, she can
count the day she sells the stock but
not the day she acquires it.)
For certain preferred stocks that pay
dividends less than once a year, the
holding period is increased to 90 days
during the 181-day period beginning
90 days before the ex-dividend date.
Of course, the opposite could have
occurred. The position could have
increased in value while she held the
stock for long-term-gain treatment,
so that she could have saved in taxes
and earned a higher gross return.
As the Facebook example shows, it’s
not what you receive that matters,
but what you get to keep.
Dividend Considerations
For dividends, it’s important to pay
attention to the ex-dividend date: the
first date following the declaration of
a dividend on which the buyer is not
entitled to receive the next dividend
payment. Instead, the seller gets it.
For a dividend to be qualified, an
investor must hold the stock for more
than 60 days during the 121-day
$72.59 but would owe 43.4% tax on
a $47.59 short-term gain. A tax bill of
over $20 would net her only $51.94
per share.
By continuing to hold the stock, the
investor would risk losing some of the
embedded gain but could gain much
more favorable tax treatment. Even
if the stock dropped 15%, she would
garner greater after-tax proceeds by
waiting for the stock to go long term
than by selling at the high.
Assuming that the investor sold the
position at the opening price on the
day it went long term, March 28,
2014, she would realize a sale price of
$61.34, about $11 below the high. But
by reducing her tax to the long-term
capital gains tax rate, she would net
$52.69, or 1.4% more.
Current Income Tax Rates
Single Filer Income Joint Filer Income Income Tax Rate
Short-Term Capital Gains and Investment Income
Tax Rate*
Long-Term Capital Gains and Qualified Dividend
Tax Rate*
$0 to $9,075
$9,076 to $36,900
$36,901 to $89,350
$89,351 to $186,350
$186,351 to $200,000
$200,001 to $405,100
$405,101 to $406,750
$406,751+
$0 to $18,150
$18,151 to $73,800
$73,801 to $148,850
$148,851 to $226,850
$226,851 to $250,000
$250,001 to $405,100
$405,101 to $457,600
$457,601+
10.0%
15.0
25.0
28.0
33.0
33.0
35.0
39.6
10.0%
15.0
25.0
28.0
33.0
36.8
38.8
43.4
0.0%
0.0
15.0
15.0
15.0
18.8
18.8
23.8
*Includes surtax on net investment incomePease limitation on itemized deductions and personal exemption phaseout begins at $254,200 for single filers or $305,050 for joint filers.Source: IRS and AllianceBernstein
6
With the stock market near an all-time
high, most investors will realize gains
when they buy and sell stocks to
manage their portfolios, rebalance
their asset allocation, or withdraw
funds for spending. Loss harvesting
can help minimize the tax impact of
realizing gains in the current year.
How It Works
To harvest a loss, an investor sells
a security that has fallen below its
purchase price (or cost basis), in order
to offset a gain booked elsewhere in
the portfolio, as the display at right
shows.
Let’s suppose that an investor sold
Stock A at a gain of $50, and wants
to offset that gain. The investor also
holds Stock B, with a cost basis of
$100 and a current value of only $50.
He can sell Stock B today for $50 and
generate a $50 loss. The investor
could then reinvest the $50 proceeds
in something else or, if he still
believes in Stock B’s potential, he can
repurchase it after 31 days to avoid a
wash sale, as explained on page 8.
If the investor repurchases Stock B
31 days later for the same $50 sale
price, the investor’s basis in Stock B
goes from $100 to $50. In effect, the
investor has “borrowed” some of the
original cost basis of Stock B to offset
the gain realized on Stock A.
But using losses to offset gains
only defers gains; it does not avoid
them. If, at some future date, the
investor sells Stock B, the capital gain
recognized will be that much larger,
assuming that the stock eventually
recovers.
Portfolio Strategies
Loss Harvesting
Best for: Anyone
Benefit: Primarily tax deferral; tax avoidance at times
Tax Impact:
Limitations: “Wash sale” rule
Complexity/Cost: Minimal; transaction costs
Drawbacks: Only defers gains into future years
Harvesting a $50 loss and repurchasing the stockCombined federal and state long-term capital gains tax rate of 25%
This Year ($) Next Year ($)Stock A: Recognized Gain
Stock B: Harvested Loss
Existing gain 50.00 —
Potential long-term capital gains tax 12.50 —
Cost basis 100.00 50.00
Sale price 50.00 100.00
Repurchase price (new cost basis) 50.00 —
Long-term gain (loss) (50.00) 50.00
Tax deferred 12.50 0.00
Tax paid 0.00 12.50
Data are for illustrative purposes only. We use round numbers to demonstrate how cost basis changes when losses are harvested. There is no expectation that a typical stock would double in price over one year.Source: AllianceBernstein
Loss Harvesting Defers—but Does Not Avoid—Taxes
Low Moderate High
The Bernstein Income Tax Playbook 7

cannot recognize the loss until he sells
the replacement security.
To avoid falling afoul of the wash
sale rules, it often makes sense to
sell a position at a loss and replace
it with a similar security, such as a
stock in another company in the same
industry or sector. This minimizes
the disruption to the portfolio and
potential loss of market upside.
The wash sale rules apply even if
the replacement security is in the
investor’s IRA. Thus, taxpayers and
their advisors have to tax manage a
portfolio across all accounts. This can
be difficult to do if there are different
managers for various portfolios,
because typically, the managers will
not have current information on each
other’s holdings.
This makes integrated investment
management beneficial from a tax
perspective. Bernstein tax manages
across all the accounts that we run for
a client.
purchase and sale prices (bid-ask
spreads). In the Facebook example
on page 5, the trade would erode
value, not add to it, if the costs on the
purchase and sale were greater
than 1%.
Realizing losses can be more valuable
in some circumstances. Investors
can use realized net losses of up to
$3,000 as an above-the-line deduction
against ordinary income to avoid (not
defer) taxes. For investors in the top
tax bracket, that can be worth over
$1,000 in current-year tax savings.
But in periods like the present, when
strong markets have created sizable
portfolio gains, few investors have net
loss positions.
The Wash Sale Rules
To ensure that a loss can be recog-
nized for tax purposes, taxpayers
need to follow the “wash sale” rules:
If an investor sells a position at a loss
and buys the same, or substantially
the same, security within 30 days
before or after the sale closes, he
Quantifying the Benefit
Deferring taxes through effective loss
harvesting allows a portfolio to grow
a bit more. For an investor with a
combined federal and state capital-
gains tax rate of 25%, deferring the
$50 gain on Stock A will put off the
$12.50 tax bill to a future date and
keep $12.50 in the portfolio (see
display on prior page).
If the investor keeps the money in
the portfolio for more than a year
and earns 10% on it, he will have a
$1.25 return. Of course, that return
is taxable when the gain is realized
(again, at 25%), so the after-tax
return from the trade will be $0.94.
In other words, the investor has
sold and repurchased a stock worth
$50—a total trade value of $100—to
earn $0.94.
When the benefit is so small, transac-
tion costs must be taken into account.
Even if an investor does not pay
trading commissions, there are costs
related to the difference between
8
With tax-exempt income from
municipal bond portfolios still near
historic lows, investors spending
from their portfolios have become
desperate for income. As a result,
many investors today are chasing
yield into dangerous territory.
Typically, yield-hungry investors
shift to longer-duration bonds or to
lower-credit-quality (high-yield) bonds,
or both. Such investments may merit
an allocation, but many investors
do not adequately weigh the likely
consequences.
We think that investors seeking tax-
efficient income should weigh three
considerations: after-tax income,
tax-efficient growth, and risk. Below,
we evaluate the trade-offs for several
potential solutions.
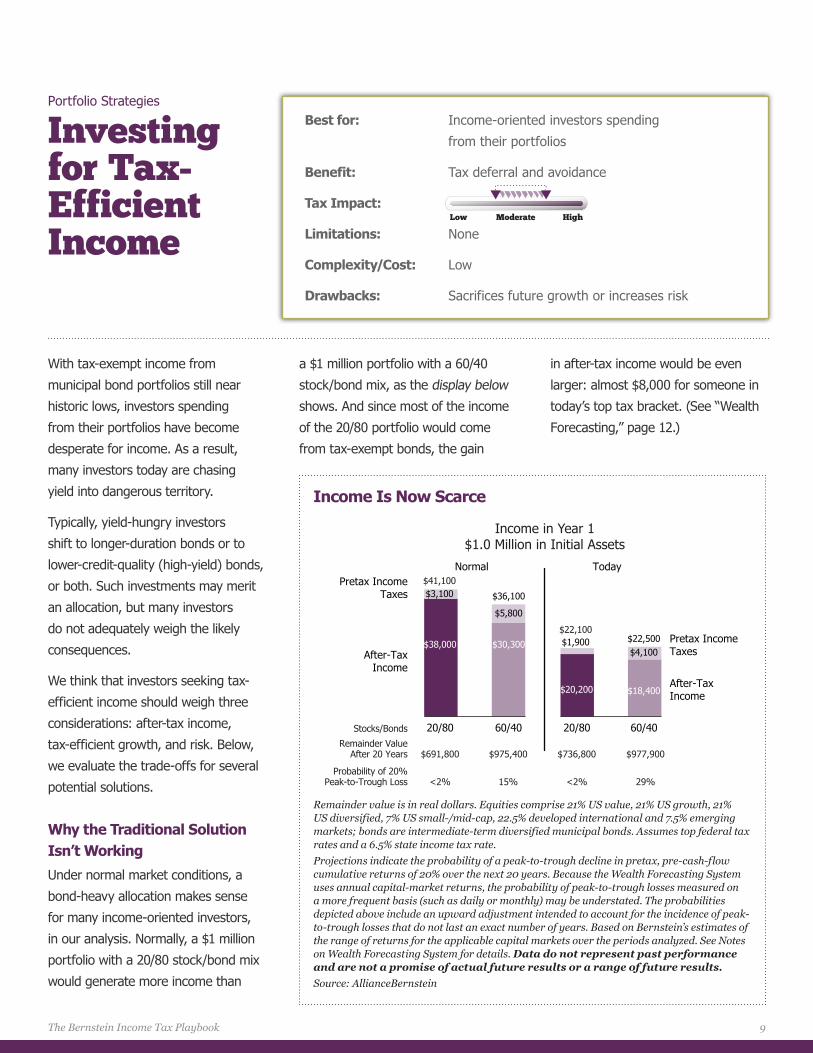
Why the Traditional Solution Isn’t Working
Under normal market conditions, a
bond-heavy allocation makes sense
for many income-oriented investors,
in our analysis. Normally, a $1 million
portfolio with a 20/80 stock/bond mix
would generate more income than
a $1 million portfolio with a 60/40
stock/bond mix, as the display below
shows. And since most of the income
of the 20/80 portfolio would come
from tax-exempt bonds, the gain
in after-tax income would be even
larger: almost $8,000 for someone in
today’s top tax bracket. (See “Wealth
Forecasting,” page 12.)
Portfolio Strategies
Investing for Tax-Efficient Income
Best for: Income-oriented investors spending
from their portfolios
Benefit: Tax deferral and avoidance
Tax Impact:
Limitations: None
Complexity/Cost: Low
Drawbacks: Sacrifices future growth or increases risk
Income in Year 1$1.0 Million in Initial Assets
$22,500
60/4060/40
TodayNormal
$18,400$20,200
$30,300$38,000
$5,800
$4,100
$36,100
20/80 20/80
$22,100$1,900
$3,100$41,100
After-TaxIncome
Pretax Income Taxes
After-TaxIncome
Pretax Income Taxes
Remainder ValueAfter 20 Years
Stocks/Bonds
$975,400$691,800 $977,900$736,800
Probability of 20%Peak-to-Trough Loss 15%<2% 29%<2%
Remainder value is in real dollars. Equities comprise 21% US value, 21% US growth, 21% US diversified, 7% US small-/mid-cap, 22.5% developed international and 7.5% emerging markets; bonds are intermediate-term diversified municipal bonds. Assumes top federal tax rates and a 6.5% state income tax rate.Projections indicate the probability of a peak-to-trough decline in pretax, pre-cash-flow cumulative returns of 20% over the next 20 years. Because the Wealth Forecasting System uses annual capital-market returns, the probability of peak-to-trough losses measured on a more frequent basis (such as daily or monthly) may be understated. The probabilities depicted above include an upward adjustment intended to account for the incidence of peak-to-trough losses that do not last an exact number of years. Based on Bernstein’s estimates of the range of returns for the applicable capital markets over the periods analyzed. See Notes on Wealth Forecasting System for details. Data do not represent past performance and are not a promise of actual future results or a range of future results. Source: AllianceBernstein
Income Is Now Scarce
Low Moderate High
The Bernstein Income Tax Playbook 9

in future wealth similar to a 20/80
portfolio, in the median case, as the
display shows.
In our experience, the risks that each
of these three popular strategies
poses are too high for most income-
oriented investors.
Quantifying the Benefits and Risks of Lower-Risk Solutions
Fortunately, it’s possible to garner
more income without adding as
much risk. The key is to source
the higher-income, but higher-risk,
investments from the stock allocation
of the portfolio, rather than the bond
allocation. You can see this in the
three potential lower-risk variations on
a 60/40 portfolio in the display on the
next page.
The first lower-risk variation replaces
the broad US large-cap stock portion
of the 60/40 portfolio with similar
stocks with higher dividend yields.
This increases the after-tax income
of the portfolio by less than $1,300—
even less than shifting to a 20/80
stock/bond mix. It also decreases the
projected future value of the portfolio
much less than shifting to a 20/80
portfolio.
But the tilt to higher dividends
reduces the risk of a large loss
from 29% to 25%, because higher-
dividend-yielding stocks are typically
less volatile, while offering moderately
lower growth than the broad market.
The second lower-risk variation on
a 60/40 mix adds a 10% allocation
to high-yield municipal bonds,
longer-duration bonds, or both. The
income gains from such shifts are
substantial on both a pretax and
after-tax basis.
The display on the next page shows
that investors can increase the
after-tax annual income on the $1
million portfolio by $8,500 if they
shift their 40% bond allocation from
core fixed income to long-term, high-
quality bonds. They could gain more
than $21,000 of additional income if
they shift it all to high-yield bonds,
and about $15,000 more if they shift
it to an equal mix of the two.
But the magnitude of the risk that
these three popular income strategies
add is not well understood. Today, an
investor in a 60/40 portfolio faces a
29% chance of incurring a 20% peak-
to-trough loss at some point over the
next 20 years, we estimate. Shifting
the bond allocation to long bonds
would increase the risk of a large
loss to 39% because long bonds lose
more value than intermediate-term
bonds when interest rates rise.
The risk of a large loss rises to
55% for the 60/40 portfolio with
high-yield bonds and to 47% for the
60/40 portfolio with an equal mix of
high-yield and long-term bonds.
Because of their greater volatility,
using these three popular income
strategies is likely to lead to less
wealth over time than using a core
bond portfolio. For example, we
project that the 60/40 portfolio with
high-yield bonds, which generates the
most income, would lead to a give-up
But market conditions today are far
from normal. As the display on the
prior page also shows, the pretax
income from a 20/80 portfolio today is
far lower than normal: $22,100 versus
$41,100. And with dividend yields
higher than bond yields today, shifting
to a 60/40 portfolio would actually
add modestly to pretax income.
But for taxable investors, it’s after-tax
income that matters. Because most
of the income comes from tax-free
bonds, today the 20/80 portfolio
provides more after-tax income than
the 60/40 portfolio, but only about
$2,000 more, versus nearly $8,000
under normal conditions.
After 20 years of spending all the
income the portfolio generates but
not selling any securities, the median
inflation-adjusted value of $1 million
invested in a 20/80 portfolio is likely
to be just $736,800, we estimate. For
a 60/40 portfolio, by contrast, the
median value would be $977,900.
In our experience, few investors
would choose a portfolio that provides
less than $2,000 a year in additional
after-tax income, if they understood
that it would reduce their wealth after
20 years by about $240,000.
Quantifying the Benefits and Risks of Popular Solutions
That’s why many income-seeking
investors are now choosing a 60/40
stock/bond allocation but replacing
their core, high-credit-quality,
intermediate-duration bond portfolio
with allocations to high-yield or
10
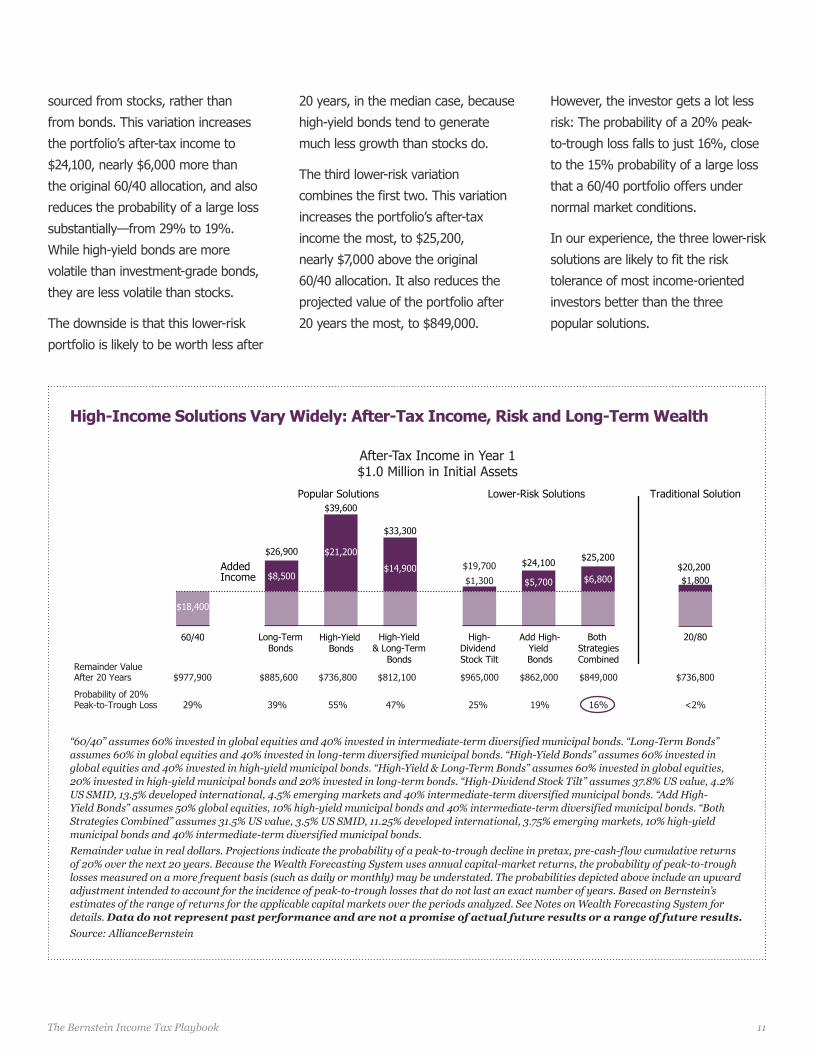
sourced from stocks, rather than
from bonds. This variation increases
the portfolio’s after-tax income to
$24,100, nearly $6,000 more than
the original 60/40 allocation, and also
reduces the probability of a large loss
substantially—from 29% to 19%.
While high-yield bonds are more
volatile than investment-grade bonds,
they are less volatile than stocks.
The downside is that this lower-risk
portfolio is likely to be worth less after
20 years, in the median case, because
high-yield bonds tend to generate
much less growth than stocks do.
The third lower-risk variation
combines the first two. This variation
increases the portfolio’s after-tax
income the most, to $25,200,
nearly $7,000 above the original
60/40 allocation. It also reduces the
projected value of the portfolio after
20 years the most, to $849,000.
However, the investor gets a lot less
risk: The probability of a 20% peak-
to-trough loss falls to just 16%, close
to the 15% probability of a large loss
that a 60/40 portfolio offers under
normal market conditions.
In our experience, the three lower-risk
solutions are likely to fit the risk
tolerance of most income-oriented
investors better than the three
popular solutions.
60/40 Long-Term Bonds
High-Yield Bonds
High-Yield & Long-Term
Bonds
$18,400
20/80
$20,200$1,800
After-Tax Income in Year 1$1.0 Million in Initial Assets
Remainder ValueAfter 20 Years $977,900 $885,600 $736,800 $812,100
Probability of 20%Peak-to-Trough Loss 29% 39% 55% 47%
$965,000 $862,000 $849,000
25% 19% 16%
$736,800
<2%
High-Dividend Stock Tilt
Add High-Yield Bonds
Both StrategiesCombined
Popular Solutions Lower-Risk Solutions Traditional Solution
Added Income
$26,900
$39,600
$33,300
$8,500
$21,200
$14,900 $19,700 $24,100 $25,200
$5,700 $6,800$1,300
“60/40” assumes 60% invested in global equities and 40% invested in intermediate-term diversified municipal bonds. “Long-Term Bonds” assumes 60% in global equities and 40% invested in long-term diversified municipal bonds. “High-Yield Bonds” assumes 60% invested in global equities and 40% invested in high-yield municipal bonds. “High-Yield & Long-Term Bonds” assumes 60% invested in global equities, 20% invested in high-yield municipal bonds and 20% invested in long-term bonds. “High-Dividend Stock Tilt” assumes 37.8% US value, 4.2% US SMID, 13.5% developed international, 4.5% emerging markets and 40% intermediate-term diversified municipal bonds. “Add High-Yield Bonds” assumes 50% global equities, 10% high-yield municipal bonds and 40% intermediate-term diversified municipal bonds. “Both Strategies Combined” assumes 31.5% US value, 3.5% US SMID, 11.25% developed international, 3.75% emerging markets, 10% high-yield municipal bonds and 40% intermediate-term diversified municipal bonds. Remainder value in real dollars. Projections indicate the probability of a peak-to-trough decline in pretax, pre-cash-flow cumulative returns of 20% over the next 20 years. Because the Wealth Forecasting System uses annual capital-market returns, the probability of peak-to-trough losses measured on a more frequent basis (such as daily or monthly) may be understated. The probabilities depicted above include an upward adjustment intended to account for the incidence of peak-to-trough losses that do not last an exact number of years. Based on Bernstein’s estimates of the range of returns for the applicable capital markets over the periods analyzed. See Notes on Wealth Forecasting System for details. Data do not represent past performance and are not a promise of actual future results or a range of future results. Source: AllianceBernstein
High-Income Solutions Vary Widely: After-Tax Income, Risk and Long-Term Wealth
11The Bernstein Income Tax Playbook
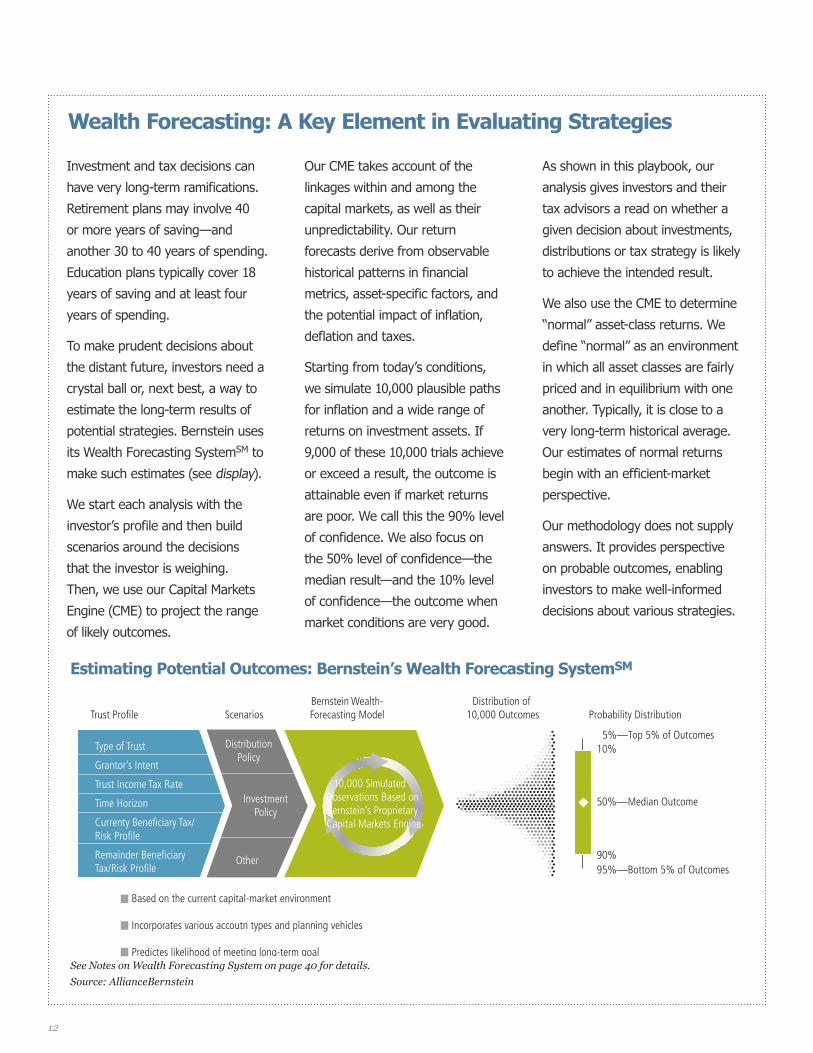
Investment and tax decisions can
have very long-term ramifications.
Retirement plans may involve 40
or more years of saving—and
another 30 to 40 years of spending.
Education plans typically cover 18
years of saving and at least four
years of spending.
To make prudent decisions about
the distant future, investors need a
crystal ball or, next best, a way to
estimate the long-term results of
potential strategies. Bernstein uses
its Wealth Forecasting SystemSM to
make such estimates (see display).
We start each analysis with the
investor’s profile and then build
scenarios around the decisions
that the investor is weighing.
Then, we use our Capital Markets
Engine (CME) to project the range
of likely outcomes.
Our CME takes account of the
linkages within and among the
capital markets, as well as their
unpredictability. Our return
forecasts derive from observable
historical patterns in financial
metrics, asset-specific factors, and
the potential impact of inflation,
deflation and taxes.
Starting from today’s conditions,
we simulate 10,000 plausible paths
for inflation and a wide range of
returns on investment assets. If
9,000 of these 10,000 trials achieve
or exceed a result, the outcome is
attainable even if market returns
are poor. We call this the 90% level
of confidence. We also focus on
the 50% level of confidence—the
median result—and the 10% level
of confidence—the outcome when
market conditions are very good.
As shown in this playbook, our
analysis gives investors and their
tax advisors a read on whether a
given decision about investments,
distributions or tax strategy is likely
to achieve the intended result.
We also use the CME to determine
“normal” asset-class returns. We
define “normal” as an environment
in which all asset classes are fairly
priced and in equilibrium with one
another. Typically, it is close to a
very long-term historical average.
Our estimates of normal returns
begin with an efficient-market
perspective.
Our methodology does not supply
answers. It provides perspective
on probable outcomes, enabling
investors to make well-informed
decisions about various strategies.
Wealth Forecasting: A Key Element in Evaluating Strategies
Trust Profile Scenarios Bernstein Wealth- Forecasting Model Probability Distribution
Distribution of 10,000 Outcomes
10,000 Simulated Observations Based on Bernstein’s Proprietary Capital Markets Engine
10%
50%—Median Outcome
90%
5%—Top 5% of Outcomes
95%—Bottom 5% of Outcomes
Type of Trust
Grantor’s Intent
Trust Income Tax Rate
Time Horizon
Currenty Beneficiary Tax/Risk Profile
Remainder BeneficiaryTax/Risk Profile
DistributionPolicy
InvestmentPolicy
Other
Based on the current capital-market environment
Incorporates various accoutn types and planning vehicles
Predictes likelihood of meeting long-term goalSee Notes on Wealth Forecasting System on page 40 for details.Source: AllianceBernstein
Estimating Potential Outcomes: Bernstein’s Wealth Forecasting SystemSM
12
Saving for a child’s or grandchild’s
college or graduate school tuition
is in some ways a more daunting
challenge than saving for retirement:
The costs are impossible to control,
and the time you have to save is
shorter—typically, just 18 years.
Fortunately, there is a tax-advantaged
way to save: a Section 529 plan.
Contributions to the plan grow free
of federal tax, and earnings can
be withdrawn tax free as long as
the funds are used for “qualified
higher-education expenses.” These
include tuition, fees, books, supplies
and equipment, and special-needs
services required for enrollment or
attendance at an eligible educational
institution, as well as room and board,
for students attending at least half
time.
Another program, called a Coverdell
Education Savings Account, is also
available, but only to couples with less
than $220,000 and individuals with
less than $110,000 in annual income.
It has much lower contribution limits.
How a 529 Plan Works
Contributions to a 529 plan for a
child beneficiary are considered gifts,
but qualify for the gift-tax annual
exclusion, which is now $14,000
per beneficiary and increases with
inflation. Taxpayers can make gifts of
up to $14,000 ($28,000 for a married
couple) per year to a 529 account
for the benefit of any number of
individuals, such as children and
grandchildren.
The 529 program allows taxpayers
to front-load five years of annual
Education Savings
Best for: Parents and grandparents saving for higher education
Benefit: Tax avoidance
Tax Impact:
Limitations: Contributions are considered gifts; see below
Complexity/Cost: Minimal
Drawbacks: 10% tax penalty on earnings not used for education
Inflation-Adjusted 529 Plan Assets After 10 Years (in $ Thousands)
Level of Confidence5%10% (Superior Markets)
50% (Median Markets)
90% (Poor Markets)95%
$337.6$367.2
$428.7
$232.8 $238.4$255.3
$281.5 $296.9$330.1
Regular Contributions for 10 Years*
Regular Contributions for 10 Years*
Front-Loaded Contributions†
Taxable Account 529 Account 529 Account
*$28,000 per year for 10 years†$140,000 in the beginning of year one and $140,000 at the beginning of year six The assets are invested in 70% globally diversified equities and 30% fixed income when the child is age 8, and become more oriented toward bonds over time, until reaching 25% globally diversified equities and 75% fixed income at the child’s college age. Based on Bernstein’s estimates of the range of returns for the applicable capital markets over the next 10 years. See Notes on Wealth Forecasting System for details. Data do not represent past performance and are not a promise of actual future results or a range of future results. Source: AllianceBernstein
Funding a 529 Plan Early Results in More Savings
Low Moderate High
The Bernstein Income Tax Playbook 13
Additional Considerations
When considering a front-loaded
contribution, think about its timing.
Toward the end of the year, it may
make more sense for a taxpayer to
make an annual exclusion gift for the
current year and plan to front-load
five years of contributions in January
of the next year. That way, more
money can begin growing tax free
more quickly.
Some taxpayers may worry about
overfunding the 529 plan for a child
who may not need the funds to pay
for college (because he doesn’t go
to college or gets a scholarship). In
the first case, the funds can also be
used for certain trade schools. In the
second case, the IRS allows taxpayers
to withdraw, without the 10% penalty
tax, amounts equal to the scholarship.
The beneficiary can also be changed
to another family member of the
same generation at a later date.
Some states provide a state income
tax deduction for contributions to a
plan in the taxpayer’s home state.
A home-state plan is not always the
best option. Taxpayers should be
mindful of fees associated with the
home-state plan and limits on the size
of the account.
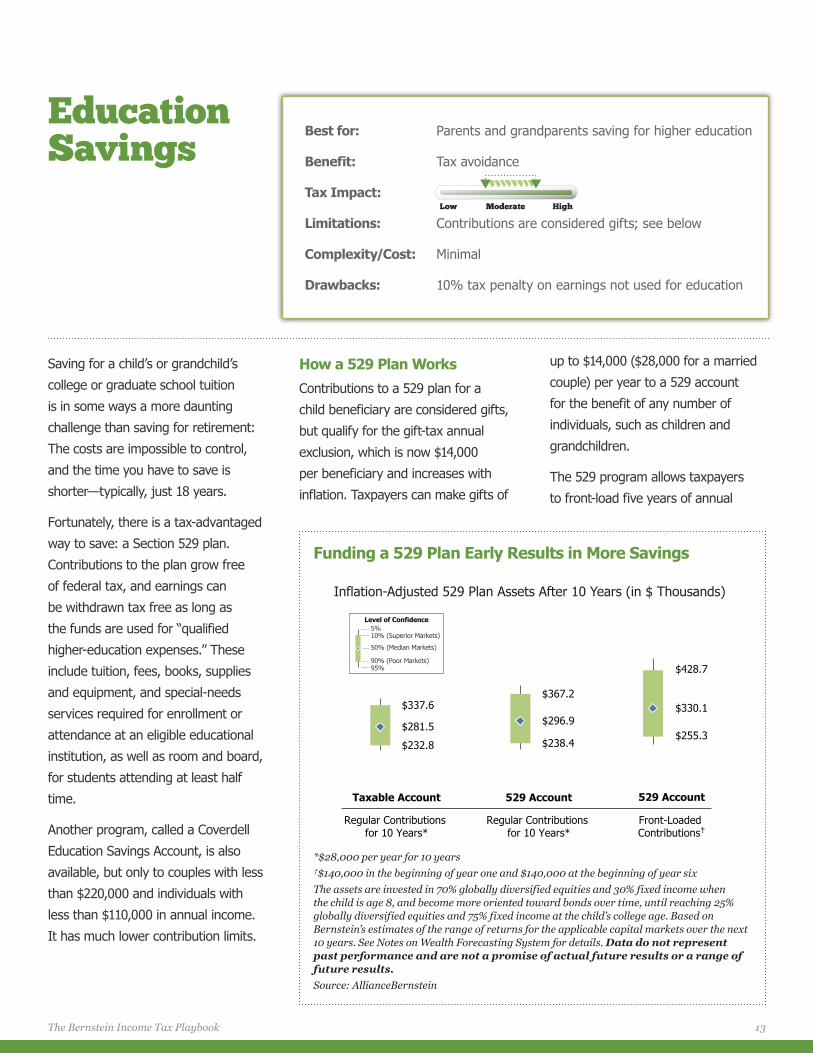
The display on the prior page
illustrates the advantage of the 529
plan. The taxes avoided by saving
each year in a 529 plan increase the
529 plan’s account value to $296,900,
or $15,400 more than the $281,500 in
the taxable account, in today’s dollars
in the median case, represented by
the diamond within each bar.
When the contributions are
front-loaded, the additional years of
tax-free growth bring the median
value of the 529 plan to $330,100
in today’s dollars, or $48,600 more
than in the taxable account. To the
extent that parents or grandparents
begin saving via a 529 plan earlier
in a child’s life, the tax-free growth
potential is even greater.
Many investors fear front-loading their
contributions to a 529 plan. What if
the market plunges in the first year?
they ask. Wouldn’t I be better off
spreading out the contributions so
that I’d be investing at lower prices
after a market drop?
The answer is no. Our worst
projected outcomes for the 529
account with front-loaded contribu-
tions are still higher than the worst
projected outcomes for the 529
account with regular contributions for
10 years, the display shows.
exclusion gifts, and thus give up to
$70,000 in one year ($140,000 for a
married couple) per beneficiary.
The option to front-load funding
makes the 529 plan a great way to
avoid taxes on the future growth of
funds earmarked for higher education
expenses. Bernstein projects that, in
aggregate, the taxes avoided over a
10-year savings horizon could pay for
a full year of college tuition.
Quantifying the Benefits
Let’s assume that a married couple
expects their child, currently in
second grade, to start college in 10
years. They have just begun to save
for her college tuition and want to
look at a few options:
�� Save $28,000 per year for the next
10 years in a taxable account;
�� Save the same amount in a 529
plan over 10 years; or
�� Use $140,000 from a recent bonus
to front-load the 529 plan with five
years of contributions today and
again at the beginning of year six.
These amounts may seem outlandish,
but the cost of attending an elite
private college is now about $65,000
a year and is rising faster than
inflation. The benefits of smaller
contributions are scalable.
14
The US government has made the
tax code a central tool in its policy of
supporting retirement saving for 100
years.
In the early 20th century, it began
to designate employer-sponsored
pension plans as “qualified” in the
new income tax code, if they met
certain rules. Participants in qualified
plans do not have to pay taxes
on the benefits until they receive
pension payments. However, qualified
plans must provide benefits to most
full-time employees, not just those
who are highly compensated.
These employer-sponsored plans,
designed to attract and retain
employees, differ significantly from
commercially available deferred
annuities, or “non-qualified” plans,
that invest after-tax dollars on behalf
of the purchaser.
Since the 1970s, Congress has
invented a multitude of new types
of qualified retirement savings plans,
most of them aimed at segments
of the population not covered by
traditional defined benefit pension
plans. Some are widely used, such as
IRAs (which are not employer-based).
Others are truly niche offerings.
In recent decades, employers have
shifted from providing costly defined
benefit (DB) retirement plans to
offering optional salary-deferral
defined contribution (DC) plans,
such as a 401(k). In DC plans, the
individual, not the employer, has
primary responsibility for contributions
and investment decisions.
Many employers match part of
employee contributions to encourage
employees to contribute. But the
burden of saving for retirement today
rests primarily with the individual, not
the employer.
The challenge for individuals is to
make the best use of the plans
available to them to maximize their
retirement savings, while minimizing
their current and future taxes.
This section seeks to quantify some
of the trade-offs. Our research
identified three key conclusions about
retirement plans:
�� Employer-sponsored plans
that include a salary deferral
component allow taxpayers to earn
investment returns on dollars that
would otherwise have been lost
to taxes.
�� Plans that use after-tax dollars
but only defer taxes, such as
nondeductible IRAs and variable
annuities, should be used with
caution.
�� Sometimes it makes sense to pay
tax now in order to avoid tax later.
That’s the case with Roth IRAs.
The tables on the next three pages
outline the key characteristics of the
more widely used types of retirement
plans. There is no “best” choice for
most individuals. Combining several
plans may help maximize your tax
benefits, while diversifying the risk of
future changes in tax rules.
Retirement Overview
15The Bernstein Income Tax Playbook
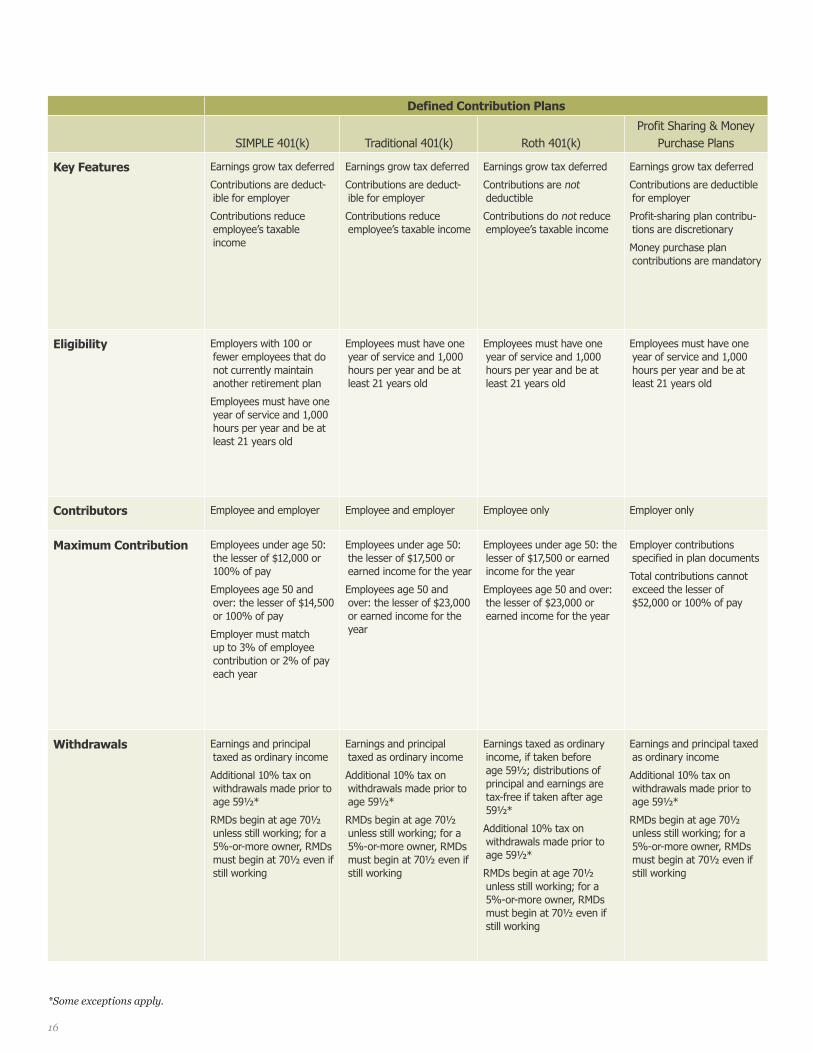
Defined Contribution Plans
SIMPLE 401(k) Traditional 401(k) Roth 401(k)Profit Sharing & Money
Purchase Plans
Key Features Earnings grow tax deferred
Contributions are deduct-ible for employer
Contributions reduce employee’s taxable income
Earnings grow tax deferred
Contributions are deduct-ible for employer
Contributions reduce employee’s taxable income
Earnings grow tax deferred
Contributions are not deductible
Contributions do not reduce employee’s taxable income
Earnings grow tax deferred
Contributions are deductible for employer
Profit-sharing plan contribu-tions are discretionary
Money purchase plan contributions are mandatory
Eligibility Employers with 100 or fewer employees that do not currently maintain another retirement plan
Employees must have one year of service and 1,000 hours per year and be at least 21 years old
Employees must have one year of service and 1,000 hours per year and be at least 21 years old
Employees must have one year of service and 1,000 hours per year and be at least 21 years old
Employees must have one year of service and 1,000 hours per year and be at least 21 years old
Contributors Employee and employer Employee and employer Employee only Employer only
Maximum Contribution Employees under age 50: the lesser of $12,000 or 100% of pay
Employees age 50 and over: the lesser of $14,500 or 100% of pay
Employer must match up to 3% of employee contribution or 2% of pay each year
Employees under age 50: the lesser of $17,500 or earned income for the year
Employees age 50 and over: the lesser of $23,000 or earned income for the year
Employees under age 50: the lesser of $17,500 or earned income for the year
Employees age 50 and over: the lesser of $23,000 or earned income for the year
Employer contributions specified in plan documents
Total contributions cannot exceed the lesser of $52,000 or 100% of pay
Withdrawals Earnings and principal taxed as ordinary income
Additional 10% tax on withdrawals made prior to age 59½*
RMDs begin at age 70½ unless still working; for a 5%-or-more owner, RMDs must begin at 70½ even if still working
Earnings and principal taxed as ordinary income
Additional 10% tax on withdrawals made prior to age 59½*
RMDs begin at age 70½ unless still working; for a 5%-or-more owner, RMDs must begin at 70½ even if still working
Earnings taxed as ordinary income, if taken before age 59½; distributions of principal and earnings are tax-free if taken after age 59½*
Additional 10% tax on withdrawals made prior to age 59½*
RMDs begin at age 70½ unless still working; for a 5%-or-more owner, RMDs must begin at 70½ even if still working
Earnings and principal taxed as ordinary income
Additional 10% tax on withdrawals made prior to age 59½*
RMDs begin at age 70½ unless still working; for a 5%-or-more owner, RMDs must begin at 70½ even if still working
*Some exceptions apply.
16
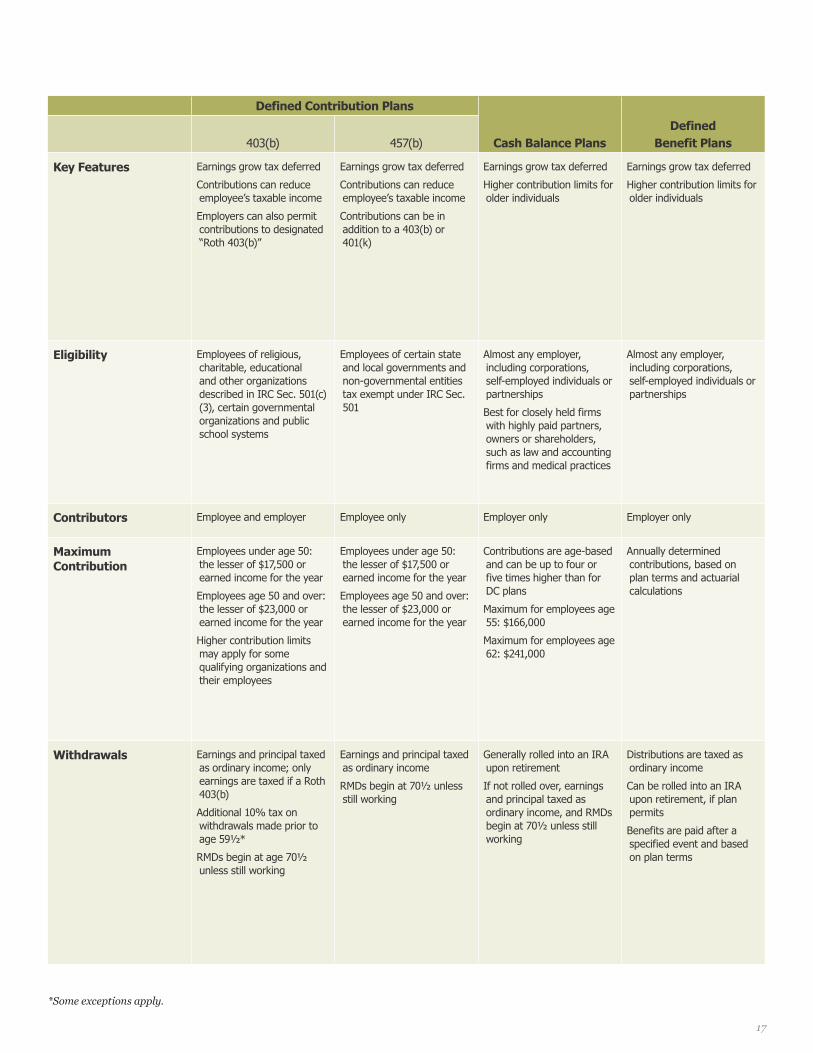
Defined Contribution Plans
Cash Balance PlansDefined
Benefit Plans403(b) 457(b)
Key Features Earnings grow tax deferred
Contributions can reduce employee’s taxable income
Employers can also permit contributions to designated “Roth 403(b)”
Earnings grow tax deferred
Contributions can reduce employee’s taxable income
Contributions can be in addition to a 403(b) or 401(k)
Earnings grow tax deferred
Higher contribution limits for older individuals
Earnings grow tax deferred
Higher contribution limits for older individuals
Eligibility Employees of religious, charitable, educational and other organizations described in IRC Sec. 501(c)(3), certain governmental organizations and public school systems
Employees of certain state and local governments and non-governmental entities tax exempt under IRC Sec. 501
Almost any employer, including corporations, self-employed individuals or partnerships
Best for closely held firms with highly paid partners, owners or shareholders, such as law and accounting firms and medical practices
Almost any employer, including corporations, self-employed individuals or partnerships
Contributors Employee and employer Employee only Employer only Employer only
Maximum Contribution
Employees under age 50: the lesser of $17,500 or earned income for the year
Employees age 50 and over: the lesser of $23,000 or earned income for the year
Higher contribution limits may apply for some qualifying organizations and their employees
Employees under age 50: the lesser of $17,500 or earned income for the year
Employees age 50 and over: the lesser of $23,000 or earned income for the year
Contributions are age-based and can be up to four or five times higher than for DC plans
Maximum for employees age 55: $166,000
Maximum for employees age 62: $241,000
Annually determined contributions, based on plan terms and actuarial calculations
Withdrawals Earnings and principal taxed as ordinary income; only earnings are taxed if a Roth 403(b)
Additional 10% tax on withdrawals made prior to age 59½*
RMDs begin at age 70½ unless still working
Earnings and principal taxed as ordinary income
RMDs begin at 70½ unless still working
Generally rolled into an IRA upon retirement
If not rolled over, earnings and principal taxed as ordinary income, and RMDs begin at 70½ unless still working
Distributions are taxed as ordinary income
Can be rolled into an IRA upon retirement, if plan permits
Benefits are paid after a specified event and based on plan terms
*Some exceptions apply.
17
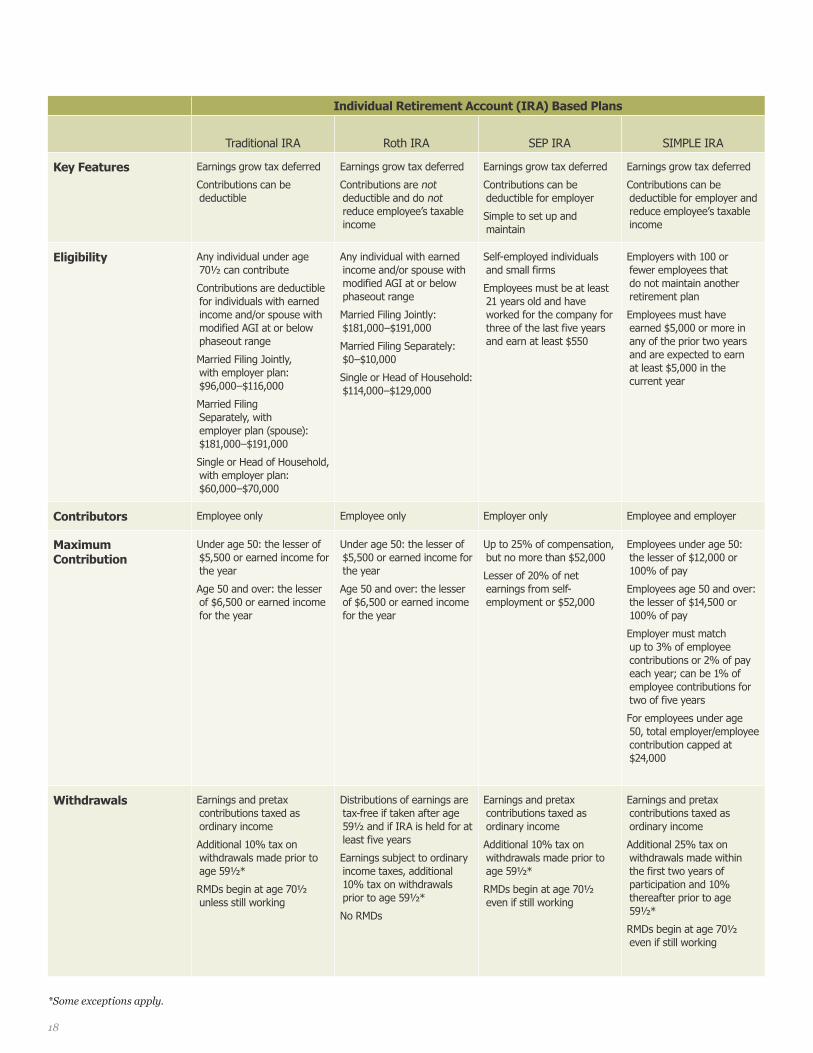
Individual Retirement Account (IRA) Based Plans
Traditional IRA Roth IRA SEP IRA SIMPLE IRA
Key Features Earnings grow tax deferred
Contributions can be deductible
Earnings grow tax deferred
Contributions are not deductible and do not reduce employee’s taxable income
Earnings grow tax deferred
Contributions can be deductible for employer
Simple to set up and maintain
Earnings grow tax deferred
Contributions can be deductible for employer and reduce employee’s taxable income
Eligibility Any individual under age 70½ can contribute
Contributions are deductible for individuals with earned income and/or spouse with modified AGI at or below phaseout range
Married Filing Jointly, with employer plan: $96,000–$116,000
Married Filing Separately, with employer plan (spouse): $181,000–$191,000
Single or Head of Household, with employer plan: $60,000–$70,000
Any individual with earned income and/or spouse with modified AGI at or below phaseout range
Married Filing Jointly: $181,000–$191,000
Married Filing Separately: $0–$10,000
Single or Head of Household: $114,000–$129,000
Self-employed individuals and small firms
Employees must be at least 21 years old and have worked for the company for three of the last five years and earn at least $550
Employers with 100 or fewer employees that do not maintain another retirement plan
Employees must have earned $5,000 or more in any of the prior two years and are expected to earn at least $5,000 in the current year
Contributors Employee only Employee only Employer only Employee and employer
Maximum Contribution
Under age 50: the lesser of $5,500 or earned income for the year
Age 50 and over: the lesser of $6,500 or earned income for the year
Under age 50: the lesser of $5,500 or earned income for the year
Age 50 and over: the lesser of $6,500 or earned income for the year
Up to 25% of compensation, but no more than $52,000
Lesser of 20% of net earnings from self-employment or $52,000
Employees under age 50: the lesser of $12,000 or 100% of pay
Employees age 50 and over: the lesser of $14,500 or 100% of pay
Employer must match up to 3% of employee contributions or 2% of pay each year; can be 1% of employee contributions for two of five years
For employees under age 50, total employer/employee contribution capped at $24,000
Withdrawals Earnings and pretax contributions taxed as ordinary income
Additional 10% tax on withdrawals made prior to age 59½*
RMDs begin at age 70½ unless still working
Distributions of earnings are tax-free if taken after age 59½ and if IRA is held for at least five years
Earnings subject to ordinary income taxes, additional 10% tax on withdrawals prior to age 59½*
No RMDs
Earnings and pretax contributions taxed as ordinary income
Additional 10% tax on withdrawals made prior to age 59½*
RMDs begin at age 70½ even if still working
Earnings and pretax contributions taxed as ordinary income
Additional 25% tax on withdrawals made within the first two years of participation and 10% thereafter prior to age 59½*
RMDs begin at age 70½ even if still working
*Some exceptions apply.
18
One of the easiest ways for taxpayers
to defer income taxes and save
for retirement is to contribute to
a defined contribution (DC) salary
deferral plan, such as a 401(k), or
make tax-deductible contributions
to an IRA. The tax benefit of these
vehicles is powerful because investors
garner investment growth on dollars
that would have been paid in taxes if
they had not invested in the plan.
How It Works
IRAs are set up by individuals; DC
plans are employer sponsored, but
the employee participant decides how
much to contribute. DC plan partici-
pants under age 50 can defer up to
$17,500 of salary into these plans;
participants over 50 can make an
additional $5,500 in contributions for
a total of $23,000. Many employers
also match employee contributions,
typically up to a certain percentage
of salary, in effect doubling the
investment right off the bat. IRAs
have much lower limits. (See tables
on pages 16–18 for details.)
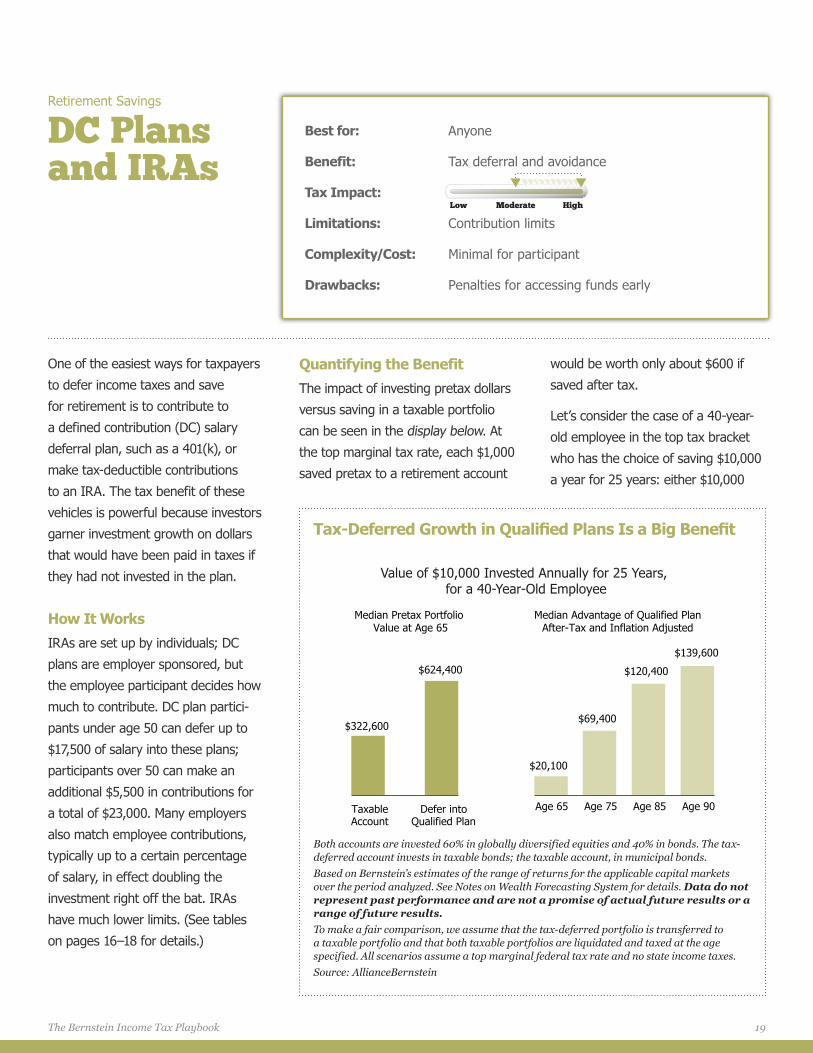
Quantifying the Benefit
The impact of investing pretax dollars
versus saving in a taxable portfolio
can be seen in the display below. At
the top marginal tax rate, each $1,000
saved pretax to a retirement account
would be worth only about $600 if
saved after tax.
Let’s consider the case of a 40-year-
old employee in the top tax bracket
who has the choice of saving $10,000
a year for 25 years: either $10,000
Retirement Savings
DC Plans and IRAs
Best for: Anyone
Benefit: Tax deferral and avoidance
Tax Impact:
Limitations: Contribution limits
Complexity/Cost: Minimal for participant
Drawbacks: Penalties for accessing funds early
Low Moderate High
Value of $10,000 Invested Annually for 25 Years, for a 40-Year-Old Employee
$69,400
$120,400
$139,600
$20,100
Age 65 Age 75 Age 85 Age 90
$322,600
$624,400
TaxableAccount
Defer intoQualified Plan
Median Pretax Portfolio Value at Age 65
Median Advantage of Qualified Plan After-Tax and Inflation Adjusted
Both accounts are invested 60% in globally diversified equities and 40% in bonds. The tax-deferred account invests in taxable bonds; the taxable account, in municipal bonds. Based on Bernstein’s estimates of the range of returns for the applicable capital markets over the period analyzed. See Notes on Wealth Forecasting System for details. Data do not represent past performance and are not a promise of actual future results or a range of future results. To make a fair comparison, we assume that the tax-deferred portfolio is transferred to a taxable portfolio and that both taxable portfolios are liquidated and taxed at the age specified. All scenarios assume a top marginal federal tax rate and no state income taxes. Source: AllianceBernstein
Tax-Deferred Growth in Qualified Plans Is a Big Benefit
19The Bernstein Income Tax Playbook
pretax through his employer’s DC
plan or about $6,000 after tax. In
both cases, 60% of the portfolio is
invested in globally diversified equities
and 40% in fixed income. The tax-
deferred portfolio invests in taxable
bonds; the taxable portfolio invests in
municipal bonds.
We project that by the time the
employee retires at age 65, his 25
years of investments ($250,000
total saved) in the qualified plan
would grow to $624,400, in the
median case, while his 25 years of
after-tax investments in the taxable
account (about $150,000 total saved)
would grow to $322,600. (If he was
considering investments in an IRA, all
these numbers would be about half
as large, because the contribution
limit is lower.)
The employee would owe more tax
on withdrawals from the qualified
plan than on withdrawals from the
taxable account. Because he didn’t
pay tax on the salary deferred into
the plan, he would owe taxes on
every dollar withdrawn in retirement.
In the taxable account, he would only
owe tax on the interest, dividends or
realized capital gains.
But even on an after-tax basis, the
employee would be far better off
investing in the qualified plan, as
the right side of the display on the
prior page shows. (To be fair, we
compare the liquidation values of both
portfolios at various ages and we
adjust the values for inflation.)
We estimate that by the time the
now-retired employee is 75, the
qualified plan account would have a
$69,400 (inflation-adjusted) edge over
the taxable account. That advantage
would grow over time, to $139,600 by
age 90.
We calculate the benefit of tax
deferral to be approximately 1.6% per
year. This is a significant benefit. In
general, employees should invest as
much as possible through a qualified
retirement plan, if available, before
investing in a taxable portfolio. The
earlier in life that employees begin
making contributions, the greater the
benefit they get from tax-deferred
compound growth.
But investors should not put money
in a plan if they think they may
need the money before retirement.
Withdrawals before age 59½ from
a qualified DC plan or an IRA are
subject to a 10% penalty tax, in
addition to ordinary income tax,
except under narrowly defined
circumstances.
State Tax Considerations
Tax-deferred savings into a qualified
plan or an IRA can help participants
avoid (rather than defer) state taxes
under certain circumstances. To the
extent that a plan participant defers
salary in a state with a high income
tax rate and makes withdrawals
during retirement in a state with a
low income tax rate or no income
tax at all, the plan participant should
permanently avoid state income taxes
on the salary deferred.
20

For partners in professional practices
and small business owners who are
already contributing the maximum
to their defined contribution plans,
a cash balance plan can be a great
opportunity for additional tax-deferred
savings. Higher tax rates have
increased the popularity of these
plans—especially among older, high-
earning doctors and lawyers saving
for retirement.
How It Works
A cash balance plan is an employer-
sponsored defined benefit (DB)
plan with some features similar to
a defined contribution (DC) plan.
Contribution limits are based on age
and, for older individuals, can be four
or more times higher than for DC
plans, as the display at right shows.
Each partner/participant can choose
his or her own level of contribution
but should commit to a contribution
level for at least three years.
Participants have a notional individual
account balance that they can roll into
an IRA when they leave the firm.
To establish the plan, the professional
practice or small business engages
an actuary to determine how much
the partners/owners could defer
for a given level of contributions to
the staff. Typically, businesses that
already have an existing 401(k) or
profit-sharing plan and staff-to-owners
ratio of less than 10 to one are good
candidates for cash balance plans.
The plan could significantly increase
the deferral potential for principals
while only modestly increasing firm
contributions on behalf of the staff.
Quantifying the Benefit
As with a DB plan, assets in a cash
balance plan are typically pooled and
invested with the goal of matching
a target rate of return. The target
return can vary by plan design and
demographics, but most cash balance
Retirement Savings
Cash Balance Plans
Best for: Partners in professional practices and small business owners who seek greater tax-deferred savings
Benefit: Tax deferral
Tax Impact:
Limitations: Contribution caps
Complexity/Cost: Slightly higher cost to set up than other retirement plans; company must contribute on behalf of staff
Drawbacks: Partners or owners must commit to at least three years of set contributions
$74
$127
$217
$279
$35 $35 $35 $35$18 $23 $23 $23
40 50 60 70Age
Cash Balance
Profit Sharing
401(k)
Maximum Annual Contribution$ Thousands
Source: IRS and AllianceBernstein
Cash Balance Plans Permit More Tax-Deferred Savings
Low Moderate High
The Bernstein Income Tax Playbook 21

plans have a return goal of 1% to
6%; many plans target a return
of about 4%. Exceeding or falling
short of the target return can cause
over- or underfunding issues that plan
sponsors would rather avoid.
But the chief benefit of these plans is
not the modest return the partners
earn while invested in them—it’s the
ability to defer substantially more
income that can eventually be rolled
into an IRA, or converted to a Roth
IRA, for additional future tax-deferred
or tax-free growth.
Additional Considerations
Historically, most cash balance
plans have invested primarily in
bonds, in order to reliably meet the
target return and avoid the negative
consequences of overfunding or
underfunding in any one year. With
interest rates near historic lows, this
strategy has led to unsatisfactory
results. But increasing the allocation
to stocks and other return-seeking
assets may increase the risk of
overfunding or underfunding in a
given year.
As a result, cash balance plans that
add stocks or other return-seeking
assets need to implement effective
risk controls. Closely monitoring
fund investments and de-risking the
portfolio once it achieves the target
return each year is advisable.
22
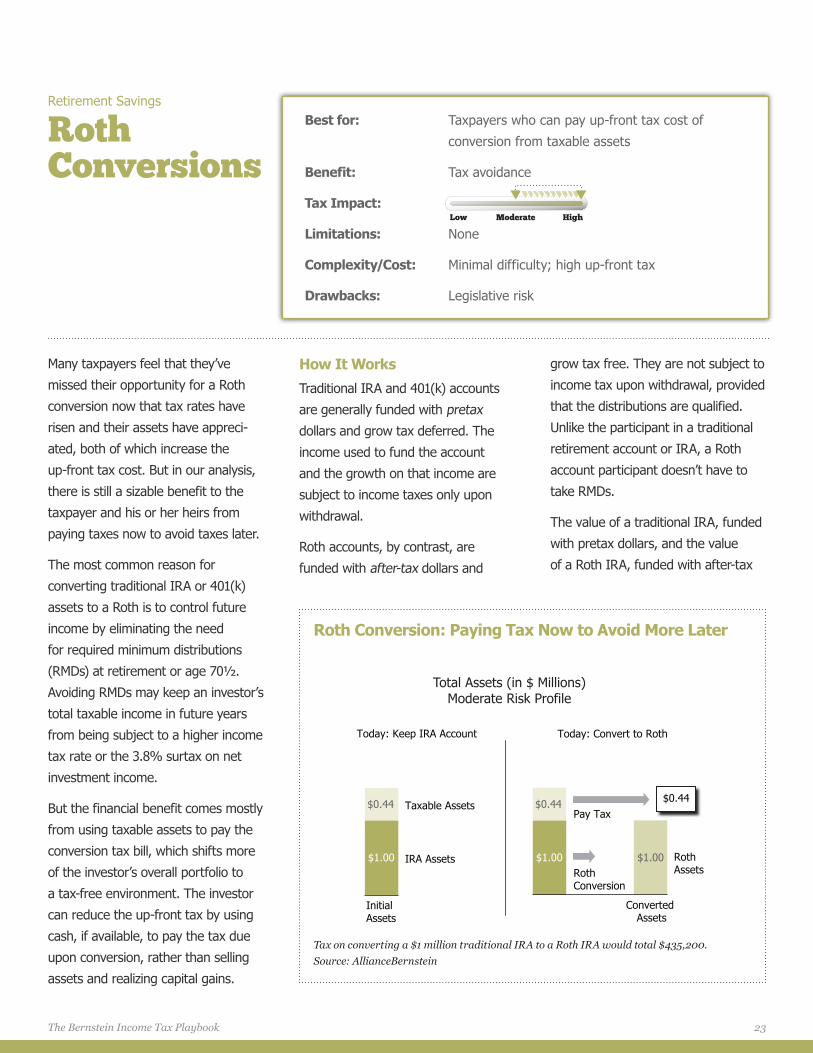
Many taxpayers feel that they’ve
missed their opportunity for a Roth
conversion now that tax rates have
risen and their assets have appreci-
ated, both of which increase the
up-front tax cost. But in our analysis,
there is still a sizable benefit to the
taxpayer and his or her heirs from
paying taxes now to avoid taxes later.
The most common reason for
converting traditional IRA or 401(k)
assets to a Roth is to control future
income by eliminating the need
for required minimum distributions
(RMDs) at retirement or age 70½.
Avoiding RMDs may keep an investor’s
total taxable income in future years
from being subject to a higher income
tax rate or the 3.8% surtax on net
investment income.
But the financial benefit comes mostly
from using taxable assets to pay the
conversion tax bill, which shifts more
of the investor’s overall portfolio to
a tax-free environment. The investor
can reduce the up-front tax by using
cash, if available, to pay the tax due
upon conversion, rather than selling
assets and realizing capital gains.
How It Works
Traditional IRA and 401(k) accounts
are generally funded with pretax
dollars and grow tax deferred. The
income used to fund the account
and the growth on that income are
subject to income taxes only upon
withdrawal.
Roth accounts, by contrast, are
funded with after-tax dollars and
grow tax free. They are not subject to
income tax upon withdrawal, provided
that the distributions are qualified.
Unlike the participant in a traditional
retirement account or IRA, a Roth
account participant doesn’t have to
take RMDs.
The value of a traditional IRA, funded
with pretax dollars, and the value
of a Roth IRA, funded with after-tax
Retirement Savings
Roth Conversions
Best for: Taxpayers who can pay up-front tax cost of
conversion from taxable assets
Benefit: Tax avoidance
Tax Impact:
Limitations: None
Complexity/Cost: Minimal difficulty; high up-front tax
Drawbacks: Legislative risk
Low Moderate High
Total Assets (in $ Millions)Moderate Risk Profile
$1.00 $1.00
$0.44 $0.44Pay Tax
Roth Conversion
$1.00
$0.44
Today: Keep IRA Account Today: Convert to Roth
Initial Assets
Taxable Assets
IRA Assets
Converted Assets
Roth Assets
Tax on converting a $1 million traditional IRA to a Roth IRA would total $435,200. Source: AllianceBernstein
Roth Conversion: Paying Tax Now to Avoid More Later
The Bernstein Income Tax Playbook 23
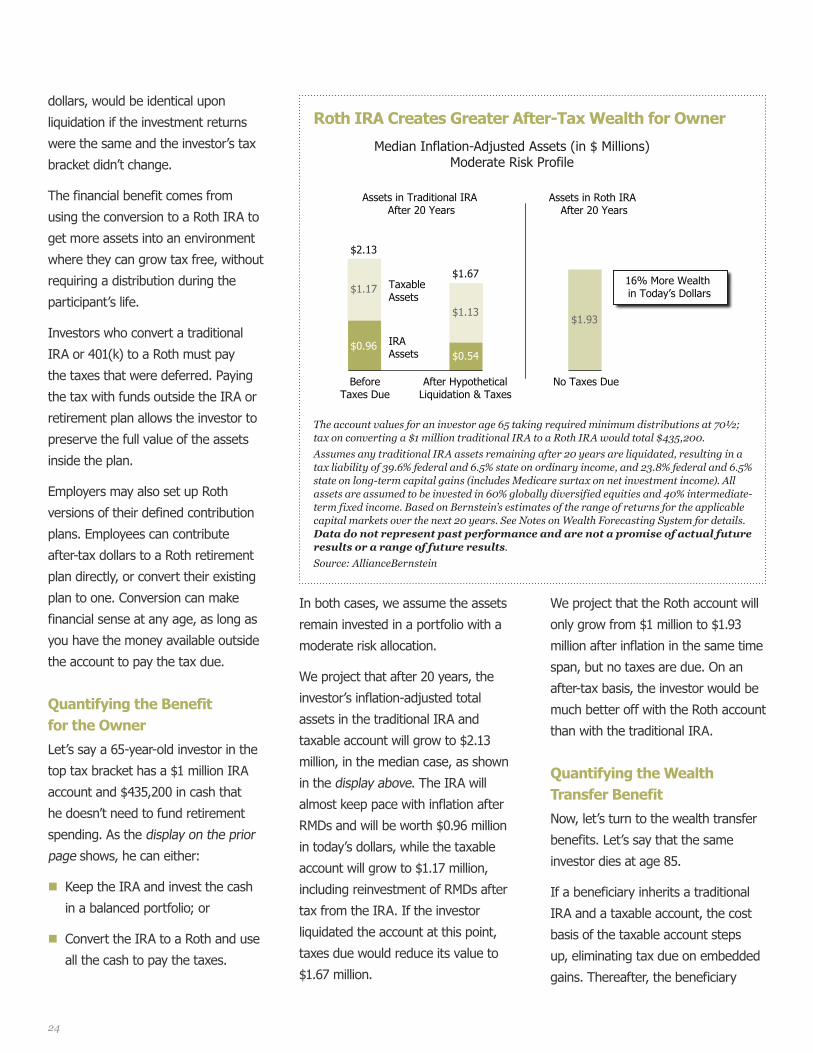
We project that the Roth account will
only grow from $1 million to $1.93
million after inflation in the same time
span, but no taxes are due. On an
after-tax basis, the investor would be
much better off with the Roth account
than with the traditional IRA.
Quantifying the Wealth Transfer Benefit
Now, let’s turn to the wealth transfer
benefits. Let’s say that the same
investor dies at age 85.
If a beneficiary inherits a traditional
IRA and a taxable account, the cost
basis of the taxable account steps
up, eliminating tax due on embedded
gains. Thereafter, the beneficiary
In both cases, we assume the assets
remain invested in a portfolio with a
moderate risk allocation.
We project that after 20 years, the
investor’s inflation-adjusted total
assets in the traditional IRA and
taxable account will grow to $2.13
million, in the median case, as shown
in the display above. The IRA will
almost keep pace with inflation after
RMDs and will be worth $0.96 million
in today’s dollars, while the taxable
account will grow to $1.17 million,
including reinvestment of RMDs after
tax from the IRA. If the investor
liquidated the account at this point,
taxes due would reduce its value to
$1.67 million.
dollars, would be identical upon
liquidation if the investment returns
were the same and the investor’s tax
bracket didn’t change.
The financial benefit comes from
using the conversion to a Roth IRA to
get more assets into an environment
where they can grow tax free, without
requiring a distribution during the
participant’s life.
Investors who convert a traditional
IRA or 401(k) to a Roth must pay
the taxes that were deferred. Paying
the tax with funds outside the IRA or
retirement plan allows the investor to
preserve the full value of the assets
inside the plan.
Employers may also set up Roth
versions of their defined contribution
plans. Employees can contribute
after-tax dollars to a Roth retirement
plan directly, or convert their existing
plan to one. Conversion can make
financial sense at any age, as long as
you have the money available outside
the account to pay the tax due.
Quantifying the Benefit for the Owner
Let’s say a 65-year-old investor in the
top tax bracket has a $1 million IRA
account and $435,200 in cash that
he doesn’t need to fund retirement
spending. As the display on the prior
page shows, he can either:
�� Keep the IRA and invest the cash
in a balanced portfolio; or
�� Convert the IRA to a Roth and use
all the cash to pay the taxes.
Median Inflation-Adjusted Assets (in $ Millions)Moderate Risk Profile
Assets in Traditional IRA After 20 Years
Assets in Roth IRA After 20 Years
$0.96$0.54
$1.17
$1.13
BeforeTaxes Due
After HypotheticalLiquidation & Taxes
Taxable Assets
IRA Assets
$1.93
No Taxes Due
$2.13
$1.6716% More Wealth in Today’s Dollars
The account values for an investor age 65 taking required minimum distributions at 70½; tax on converting a $1 million traditional IRA to a Roth IRA would total $435,200.Assumes any traditional IRA assets remaining after 20 years are liquidated, resulting in a tax liability of 39.6% federal and 6.5% state on ordinary income, and 23.8% federal and 6.5% state on long-term capital gains (includes Medicare surtax on net investment income). All assets are assumed to be invested in 60% globally diversified equities and 40% intermediate-term fixed income. Based on Bernstein’s estimates of the range of returns for the applicable capital markets over the next 20 years. See Notes on Wealth Forecasting System for details. Data do not represent past performance and are not a promise of actual future results or a range of future results. Source: AllianceBernstein
Roth IRA Creates Greater After-Tax Wealth for Owner
24
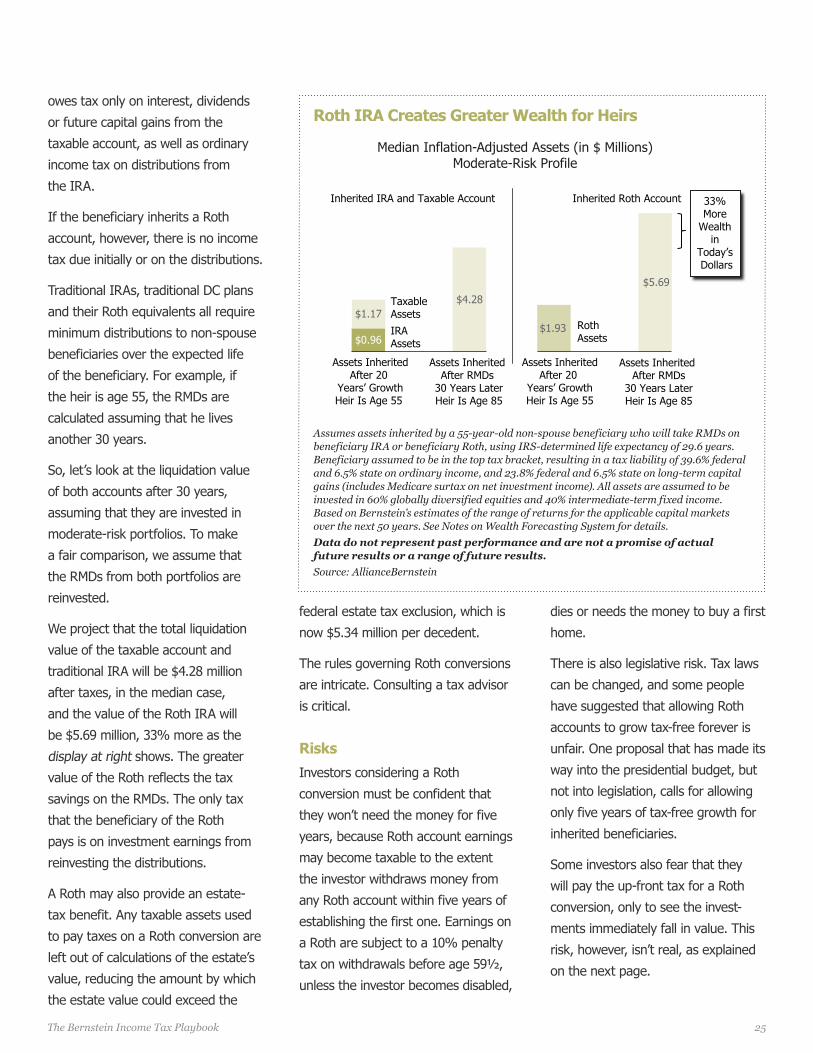
dies or needs the money to buy a first
home.
There is also legislative risk. Tax laws
can be changed, and some people
have suggested that allowing Roth
accounts to grow tax-free forever is
unfair. One proposal that has made its
way into the presidential budget, but
not into legislation, calls for allowing
only five years of tax-free growth for
inherited beneficiaries.
Some investors also fear that they
will pay the up-front tax for a Roth
conversion, only to see the invest-
ments immediately fall in value. This
risk, however, isn’t real, as explained
on the next page.
federal estate tax exclusion, which is
now $5.34 million per decedent.
The rules governing Roth conversions
are intricate. Consulting a tax advisor
is critical.
Risks
Investors considering a Roth
conversion must be confident that
they won’t need the money for five
years, because Roth account earnings
may become taxable to the extent
the investor withdraws money from
any Roth account within five years of
establishing the first one. Earnings on
a Roth are subject to a 10% penalty
tax on withdrawals before age 59½,
unless the investor becomes disabled,
owes tax only on interest, dividends
or future capital gains from the
taxable account, as well as ordinary
income tax on distributions from
the IRA.
If the beneficiary inherits a Roth
account, however, there is no income
tax due initially or on the distributions.
Traditional IRAs, traditional DC plans
and their Roth equivalents all require
minimum distributions to non-spouse
beneficiaries over the expected life
of the beneficiary. For example, if
the heir is age 55, the RMDs are
calculated assuming that he lives
another 30 years.
So, let’s look at the liquidation value
of both accounts after 30 years,
assuming that they are invested in
moderate-risk portfolios. To make
a fair comparison, we assume that
the RMDs from both portfolios are
reinvested.
We project that the total liquidation
value of the taxable account and
traditional IRA will be $4.28 million
after taxes, in the median case,
and the value of the Roth IRA will
be $5.69 million, 33% more as the
display at right shows. The greater
value of the Roth reflects the tax
savings on the RMDs. The only tax
that the beneficiary of the Roth
pays is on investment earnings from
reinvesting the distributions.
A Roth may also provide an estate-
tax benefit. Any taxable assets used
to pay taxes on a Roth conversion are
left out of calculations of the estate’s
value, reducing the amount by which
the estate value could exceed the
Median Inflation-Adjusted Assets (in $ Millions)Moderate-Risk Profile
Inherited IRA and Taxable Account Inherited Roth Account
Taxable Assets
IRA Assets
33% More
Wealth in
Today’s Dollars
$0.96$1.93
$1.17$4.28
$5.69
Roth Assets
Assets InheritedAfter 20
Years’ GrowthHeir Is Age 55
Assets InheritedAfter 20
Years’ GrowthHeir Is Age 55
Assets Inherited After RMDs
30 Years LaterHeir Is Age 85
Assets Inherited After RMDs
30 Years LaterHeir Is Age 85
Assumes assets inherited by a 55-year-old non-spouse beneficiary who will take RMDs on beneficiary IRA or beneficiary Roth, using IRS-determined life expectancy of 29.6 years. Beneficiary assumed to be in the top tax bracket, resulting in a tax liability of 39.6% federal and 6.5% state on ordinary income, and 23.8% federal and 6.5% state on long-term capital gains (includes Medicare surtax on net investment income). All assets are assumed to be invested in 60% globally diversified equities and 40% intermediate-term fixed income. Based on Bernstein’s estimates of the range of returns for the applicable capital markets over the next 50 years. See Notes on Wealth Forecasting System for details. Data do not represent past performance and are not a promise of actual future results or a range of future results. Source: AllianceBernstein
Roth IRA Creates Greater Wealth for Heirs
25The Bernstein Income Tax Playbook

The Roth Do-OverTaxpayers typically cite two fears
that prevent them from converting
their IRAs to Roths. The first is the
fear of a tax law change, discussed
on the prior page. The second is
the fear that the market could drop
right after a conversion.
While we can’t predict short-term
swings in the stock market, there
is no reason for investors to fear
paying tax up front on a conversion
that quickly declines in value.
Why? The tax code offers a rare
“do-over” on Roth conversions,
formally called a recharacterization.
To recharacterize a recently
converted Roth, the taxpayer
simply rolls all or part of the funds
converted from a traditional IRA
to a Roth back into a traditional
IRA. A recharacterization is like
taking a mulligan shot in golf: The
conversion never happened, as
far as the IRS is concerned. If the
taxpayer later wants to convert
the assets back to a Roth, he just
needs to wait 30 days or for a tax
year after the initial conversion,
whichever is later.
A taxpayer can recharacterize a
Roth conversion at any time up
until the last filing deadline of
the tax year: October 15 of the
year after making the conversion.
However, any tax that the taxpayer
owes on the conversion must be
paid by April 15 to avoid penalties.
Savvy taxpayers can use the
recharacterization rules to their
advantage. One strategy is to split
IRA investments into separate Roth
accounts upon conversion, which
allows the taxpayer to segregate
the assets that generate strong
returns from weaker performers
(see display below). Before the tax
is due or before the last tax return
is filed, the taxpayer recharacter-
izes the poor performers to avoid
paying the up-front tax due on
them. If he chooses to convert
those assets back to a Roth later,
he would incur less tax on the
conversion, assuming that the poor
performers remain at lower prices.
Even if a taxpayer is considering
conversion of only some of his IRA
assets, this strategy could make
sense. The taxpayer would convert
the entire IRA to several Roth IRA
accounts, keep the best perform-
ers, and recharacterize the rest.
After converting a portion of the
IRA, the investor may want to
further diversify the remaining IRA
assets, since the accounts will be
subject to RMDs. It’s generally wise
to put growth-oriented investments
into the Roth account, since their
growth won’t be taxed.
Hypothetical 21-Month Return –20% +30% +10% +5% +5% +2%
RecharacterizeReconvert Defer TaxTry Again
Roll Over into One Roth IRA
US Value$192,500
US Growth$192,500
International$137,500
Emerging$27,500
Taxable Bonds$350,000
REITs$100,000
Convert to Six Roth IRAs
$1 Million Traditional IRA55% Stocks/35% Bonds/10% REITs
Returns are for illustrative purposes only. They do not represent past results and are not a promise of future results.Source: AllianceBernstein
Splitting Assets in a Roth Conversion Enables a Do-Over for Lagging Portfolios
26
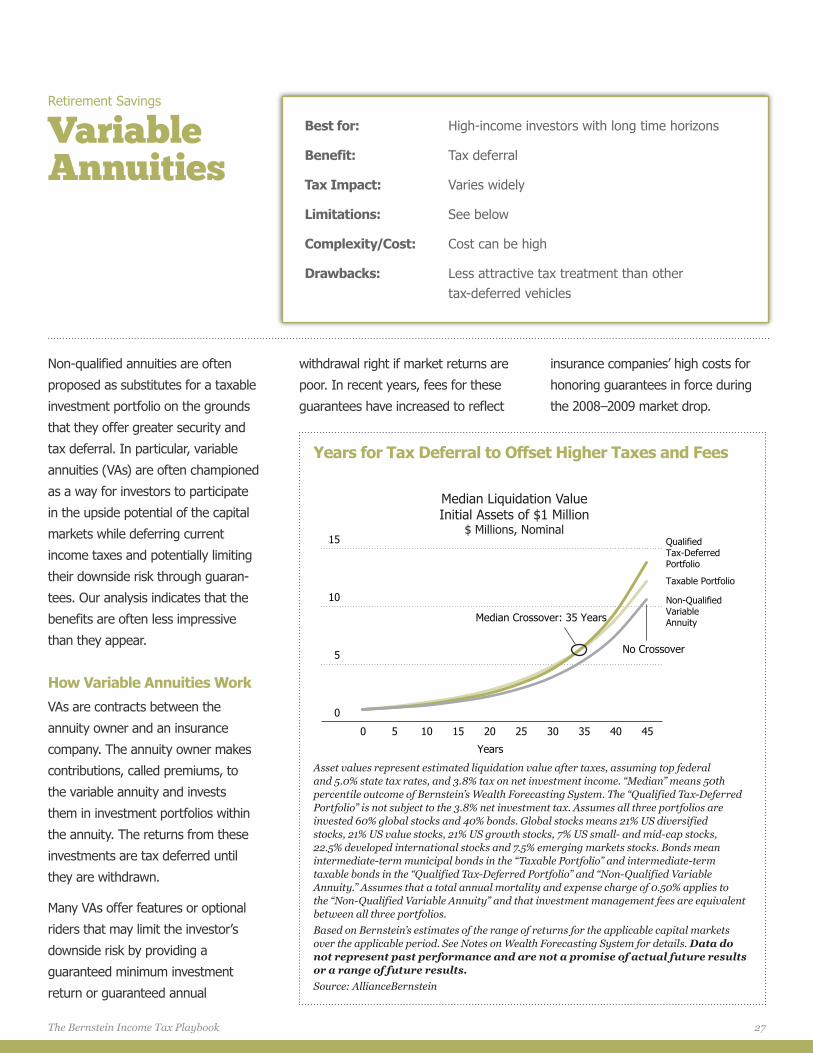
Non-qualified annuities are often
proposed as substitutes for a taxable
investment portfolio on the grounds
that they offer greater security and
tax deferral. In particular, variable
annuities (VAs) are often championed
as a way for investors to participate
in the upside potential of the capital
markets while deferring current
income taxes and potentially limiting
their downside risk through guaran-
tees. Our analysis indicates that the
benefits are often less impressive
than they appear.
How Variable Annuities Work
VAs are contracts between the
annuity owner and an insurance
company. The annuity owner makes
contributions, called premiums, to
the variable annuity and invests
them in investment portfolios within
the annuity. The returns from these
investments are tax deferred until
they are withdrawn.
Many VAs offer features or optional
riders that may limit the investor’s
downside risk by providing a
guaranteed minimum investment
return or guaranteed annual
withdrawal right if market returns are
poor. In recent years, fees for these
guarantees have increased to reflect
insurance companies’ high costs for
honoring guarantees in force during
the 2008–2009 market drop.
Retirement Savings
Variable Annuities
Best for: High-income investors with long time horizons
Benefit: Tax deferral
Tax Impact: Varies widely
Limitations: See below
Complexity/Cost: Cost can be high
Drawbacks: Less attractive tax treatment than other tax-deferred vehicles
Median Liquidation ValueInitial Assets of $1 Million
$ Millions, Nominal
Taxable Portfolio
Qualified Tax-Deferred Portfolio
Non-Qualified Variable Annuity
No Crossover
Median Crossover: 35 Years
0
5
10
15
0 5 10 15 20 25 30 35 40 45
Years
Asset values represent estimated liquidation value after taxes, assuming top federal and 5.0% state tax rates, and 3.8% tax on net investment income. “Median” means 50th percentile outcome of Bernstein’s Wealth Forecasting System. The “Qualified Tax-Deferred Portfolio” is not subject to the 3.8% net investment tax. Assumes all three portfolios are invested 60% global stocks and 40% bonds. Global stocks means 21% US diversified stocks, 21% US value stocks, 21% US growth stocks, 7% US small- and mid-cap stocks, 22.5% developed international stocks and 7.5% emerging markets stocks. Bonds mean intermediate-term municipal bonds in the “Taxable Portfolio” and intermediate-term taxable bonds in the “Qualified Tax-Deferred Portfolio” and “Non-Qualified Variable Annuity.” Assumes that a total annual mortality and expense charge of 0.50% applies to the “Non-Qualified Variable Annuity” and that investment management fees are equivalent between all three portfolios. Based on Bernstein’s estimates of the range of returns for the applicable capital markets over the applicable period. See Notes on Wealth Forecasting System for details. Data do not represent past performance and are not a promise of actual future results or a range of future results.Source: AllianceBernstein
Years for Tax Deferral to Offset Higher Taxes and Fees
27The Bernstein Income Tax Playbook

Investors whose primary interest in
VAs is tax deferral and not downside
protection can significantly lower their
costs by opting for contracts without
guarantees. For these annuities,
the fees typically include a mortality
and expense charge, investment
management fees on the underlying
portfolios, and surrender charges if
the investor exits the annuity within
a certain period of time after signing
the contract.
VAs allow investors to significantly
increase their tax-deferred holdings.
There are no statutory limits on
contributions to VAs, whereas
traditional IRAs have an annual
contribution limit of $5,500 in 2014
($6,500 with catch-up for participants
age 50 or older).
The question facing investors is
whether the tax deferral from
investing through a VA is sufficiently
attractive to offset their unfavorable
tax treatment and fees.
As with an IRA in which an investor
makes nondeductible (or after-tax)
contributions, the premiums on a VA
grow on a tax-deferred basis, and
distributions or withdrawals of gains
are subject to ordinary income tax
rates, rather than the lower rates on
long-term capital gains and qualified
dividends that apply to assets held in
a taxable portfolio.
In contrast with IRAs, the earnings
withdrawn from a VA are considered
net investment income and thus
potentially subject to the 3.8%
surtax. Thus, earnings withdrawn
from a VA could be taxed at a rate
as high as 43.4% at the federal level,
while earnings withdrawn from an
after-tax IRA could be taxed only at a
maximum federal rate of 39.6%.
Also like a traditional IRA funded with
after-tax contributions, VAs generally
do not receive a step-up in cost basis
upon the owner’s death, as a taxable
portfolio does. The gain within the
VA or traditional IRA is treated as
income in respect of a decedent and
is passed on to the beneficiary.
Quantifying the Benefit
To determine whether the tax-deferral
benefit of a VA without guarantees
justifies the extra layer of fees and
relatively unattractive tax treatment
upon withdrawal, we compared how
much after-tax wealth would be
created over time in a VA, a traditional
IRA funded with after-tax contribu-
tions and a taxable portfolio.
In all three cases, we assumed that
60% of the portfolios is invested
in globally diversified stocks that
generate qualified dividends and
long-term capital gains over time.
The other 40% of each portfolio is
invested in bonds. In the taxable
portfolio, the bonds are federally
tax-exempt municipal bonds. In
the after-tax IRA and VA portfolios,
the bonds are a diversified mix of
corporate and government bonds
that create taxable ordinary income.
We assume equivalent investment
management fees.
As the display on the prior page
shows, the liquidation value of both
the after-tax IRA and the VA initially
lags the taxable portfolio because
distributions on the IRA and VA are
taxed as ordinary income, while
distributions from the taxable portfolio
are taxed as capital gains and
qualified dividends.
In the median case, it will take 35
years for the after-tax IRA investment
to catch up to the taxable portfolio,
which we refer to as the “crossover
point.” In the case of the VA, the
crossover does not occur within
the 45 years studied because the
annuitant has to pay the additional
3.8% tax on net investment income
on withdrawals and an annual
contract fee of 0.50%.
The display suggests that the taxable
portfolio is generally the most
effective way to invest after-tax
dollars, and an after-tax IRA is more
effective than a VA. Investors seeking
to make larger annual contributions
than are possible with an after-tax
IRA would generally do better
contributing taxable assets to a
Roth account, which would provide
a significant benefit over a much
shorter horizon.
VAs and Tax-Inefficient Assets
But after-tax IRAs and VAs may
be more attractive than taxable
portfolios as a vehicle for some
investments that are subject to high
taxation—particularly, high-turnover
portfolios, such as hedge funds, that
generate significant short-term capital
gains, and global bond portfolios that
are taxed as ordinary income at both
the federal and state levels.
28

To determine which investments
should make the cut, we calculated
the return required for the invest-
ments to outperform within a VA
versus another investment with
similar risk held in a taxable portfolio
managed on a tax-aware basis. As the
display at right shows, the higher the
expected-return premium versus a
tax-aware investment, the sooner
the portfolio would reach the
crossover point.
The terms of VAs vary widely. No one
example can highlight all the potential
issues that may arise in connection
with a particular VA proposal. Each
such proposal must be evaluated
on its own merits, taking into
consideration the particular investor’s
goals and circumstances.
Median Additional Compound Annual Return RequiredPercent
1.3
0.8
0.4
2.0
1.4
1.0
0.70.5
10 20 30 40 45
Years
Qualified Tax-Deferred Portfolio
Non-Qualified Variable Annuity
Additional compound annual return required for the “Qualified Tax-Deferred Portfolio” or “Non-Qualified Variable Annuity” to have the same after-tax wealth as the taxable portfolio at the given year. Calculation is based on the estimated median liquidation value, after taxes, assuming top federal and 5.0% state tax rates, and a 3.8% tax on net investment income. “Qualified Tax-Deferred Portfolio” is not subject to the 3.8% net investment tax. “Median” means 50th percentile outcome of Bernstein’s Wealth Forecasting System. Assumes portfolios are invested 60% global stocks and 40% bonds. Global stocks means 21% US diversified stocks, 21% US value stocks, 21% US growth stocks, 7% US small- and mid-cap stocks, 22.5% developed international stocks, and 7.5% emerging markets stocks. Bonds mean intermediate-term taxable bonds. Assumes a total annual mortality and expense charge of 0.50% applies to the “Non-Qualified Variable Annuity” and that investment management fees are equivalent between both portfolios. Based on Bernstein’s estimates of the range of returns for the applicable capital markets over the applicable period. See Notes on Wealth Forecasting System for details. Data do not represent past performance and are not a promise of actual future results or a range of future results.Source: AllianceBernstein
Return Needed to Offset Higher Taxes and Fees
29The Bernstein Income Tax Playbook

Taxes are only one critical
component of financial planning;
our work with investors on
tax-related strategies is performed
within the context of their overall
financial plan.
For many clients, the first step
in building a plan is determining
the amount of money needed to
sustain lifetime spending—what
we call “core capital.” We calculate
core capital so that the investor
has a high degree of confidence in
achieving his goals even if markets
are choppy, inflation is high or he
lives an exceptionally long life.
Any money the investor has above
core capital is “surplus capital” that
can go to fund additional spending,
a vacation home, a legacy for the
kids, philanthropy or other goals.
Our core/surplus framework is
central to how we analyze a wide
range of investor questions,
such as:
�� How long must a professional
keep working before he can
prudently retire?
�� How could a retiree adjust her
asset allocation and spending
to maximize the odds that she
won’t outlive her savings?
�� What’s the most tax-efficient
vehicle to provide a legacy?
�� How can business owners
decide whether to sell, and on
what terms?
Each of these questions requires
rigorous analysis, and the more
complex the question the more
detailed the model. Bernstein
can prepare a customized Wealth
Forecasting Analysis to evaluate
all of the above questions and the
strategies discussed in this book.
We can conduct these analyses at a
high level, or with as much detail as
an investor is willing to provide.
Sometimes, providing information
regarding one request may lead to
discussions of other possibilities—
and the need for additional data.
That’s what we think it takes for
investors to make informed choices.
Contact us to learn more.
Taxes and Planning
30
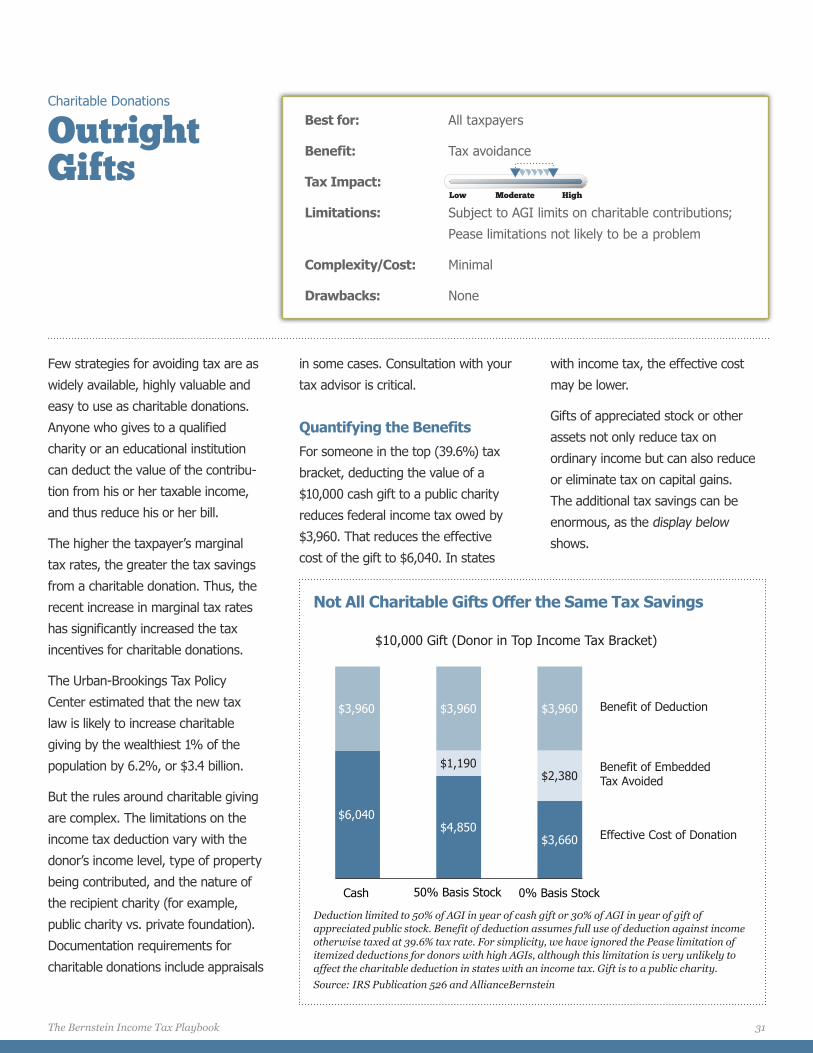
Few strategies for avoiding tax are as
widely available, highly valuable and
easy to use as charitable donations.
Anyone who gives to a qualified
charity or an educational institution
can deduct the value of the contribu-
tion from his or her taxable income,
and thus reduce his or her bill.
The higher the taxpayer’s marginal
tax rates, the greater the tax savings
from a charitable donation. Thus, the
recent increase in marginal tax rates
has significantly increased the tax
incentives for charitable donations.
The Urban-Brookings Tax Policy
Center estimated that the new tax
law is likely to increase charitable
giving by the wealthiest 1% of the
population by 6.2%, or $3.4 billion.
But the rules around charitable giving
are complex. The limitations on the
income tax deduction vary with the
donor’s income level, type of property
being contributed, and the nature of
the recipient charity (for example,
public charity vs. private foundation).
Documentation requirements for
charitable donations include appraisals
in some cases. Consultation with your
tax advisor is critical.
Quantifying the Benefits
For someone in the top (39.6%) tax
bracket, deducting the value of a
$10,000 cash gift to a public charity
reduces federal income tax owed by
$3,960. That reduces the effective
cost of the gift to $6,040. In states
with income tax, the effective cost
may be lower.
Gifts of appreciated stock or other
assets not only reduce tax on
ordinary income but can also reduce
or eliminate tax on capital gains.
The additional tax savings can be
enormous, as the display below
shows.
Charitable Donations
Outright Gifts
Best for: All taxpayers
Benefit: Tax avoidance
Tax Impact:
Limitations: Subject to AGI limits on charitable contributions;
Pease limitations not likely to be a problem
Complexity/Cost: Minimal
Drawbacks: None
$10,000 Gift (Donor in Top Income Tax Bracket)
Benefit of Deduction
Effective Cost of Donation
Benefit of Embedded Tax Avoided
$6,040$4,850
$3,660
$1,190$2,380
$3,960 $3,960 $3,960
Cash 50% Basis Stock 0% Basis Stock
Deduction limited to 50% of AGI in year of cash gift or 30% of AGI in year of gift of appreciated public stock. Benefit of deduction assumes full use of deduction against income otherwise taxed at 39.6% tax rate. For simplicity, we have ignored the Pease limitation of itemized deductions for donors with high AGIs, although this limitation is very unlikely to affect the charitable deduction in states with an income tax. Gift is to a public charity.Source: IRS Publication 526 and AllianceBernstein
Not All Charitable Gifts Offer the Same Tax Savings
Low Moderate High
The Bernstein Income Tax Playbook 31
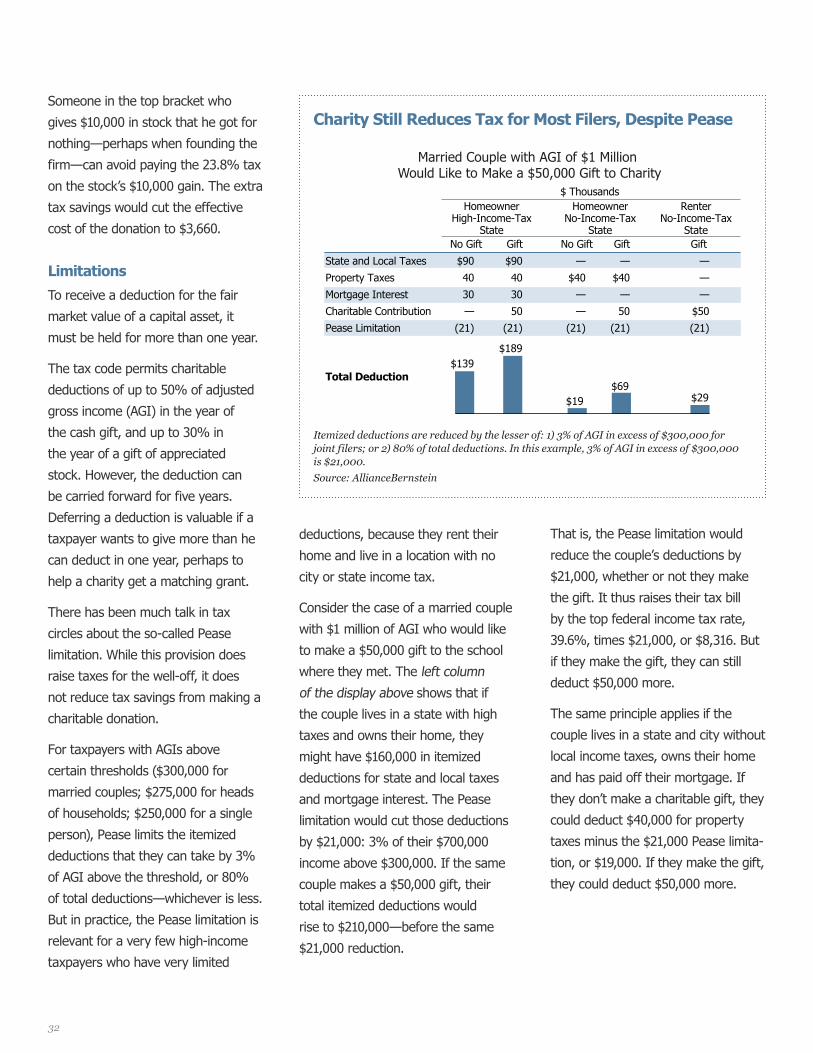
Someone in the top bracket who
gives $10,000 in stock that he got for
nothing—perhaps when founding the
firm—can avoid paying the 23.8% tax
on the stock’s $10,000 gain. The extra
tax savings would cut the effective
cost of the donation to $3,660.
Limitations
To receive a deduction for the fair
market value of a capital asset, it
must be held for more than one year.
The tax code permits charitable
deductions of up to 50% of adjusted
gross income (AGI) in the year of
the cash gift, and up to 30% in
the year of a gift of appreciated
stock. However, the deduction can
be carried forward for five years.
Deferring a deduction is valuable if a
taxpayer wants to give more than he
can deduct in one year, perhaps to
help a charity get a matching grant.
There has been much talk in tax
circles about the so-called Pease
limitation. While this provision does
raise taxes for the well-off, it does
not reduce tax savings from making a
charitable donation.
For taxpayers with AGIs above
certain thresholds ($300,000 for
married couples; $275,000 for heads
of households; $250,000 for a single
person), Pease limits the itemized
deductions that they can take by 3%
of AGI above the threshold, or 80%
of total deductions—whichever is less.
But in practice, the Pease limitation is
relevant for a very few high-income
taxpayers who have very limited
deductions, because they rent their
home and live in a location with no
city or state income tax.
Consider the case of a married couple
with $1 million of AGI who would like
to make a $50,000 gift to the school
where they met. The left column
of the display above shows that if
the couple lives in a state with high
taxes and owns their home, they
might have $160,000 in itemized
deductions for state and local taxes
and mortgage interest. The Pease
limitation would cut those deductions
by $21,000: 3% of their $700,000
income above $300,000. If the same
couple makes a $50,000 gift, their
total itemized deductions would
rise to $210,000—before the same
$21,000 reduction.
That is, the Pease limitation would
reduce the couple’s deductions by
$21,000, whether or not they make
the gift. It thus raises their tax bill
by the top federal income tax rate,
39.6%, times $21,000, or $8,316. But
if they make the gift, they can still
deduct $50,000 more.
The same principle applies if the
couple lives in a state and city without
local income taxes, owns their home
and has paid off their mortgage. If
they don’t make a charitable gift, they
could deduct $40,000 for property
taxes minus the $21,000 Pease limita-
tion, or $19,000. If they make the gift,
they could deduct $50,000 more.
Married Couple with AGI of $1 Million Would Like to Make a $50,000 Gift to Charity
Homeowner High-Income-Tax
State
$ Thousands
No Gift Gift
Homeowner No-Income-Tax
State
Renter No-Income-Tax
State
State and Local Taxes
Property Taxes
Mortgage Interest
Charitable Contribution
Pease Limitation
$90
40
30
—
(21)
$90
40
30
50
(21)
No Gift Gift
—
$40
—
—
(21)
—
$40
—
50
(21)
Gift
—
—
—
$50
(21)
Total Deduction$139
$189
$19$69
$29
Itemized deductions are reduced by the lesser of: 1) 3% of AGI in excess of $300,000 for joint filers; or 2) 80% of total deductions. In this example, 3% of AGI in excess of $300,000 is $21,000. Source: AllianceBernstein
Charity Still Reduces Tax for Most Filers, Despite Pease
32

Individuals who now have more
money or time to devote to philan-
thropy may feel that writing checks
to their favorite charities is no longer
enough. They may want to set longer-
term priorities for giving, involve other
members of the family in decisions or
establish a philanthropic program that
outlives them. If so, it makes sense
to consider channeling donations
through a vehicle such as a donor-
advised fund or a private foundation.
Donors focused on reducing costs
and administrative tasks and retaining
the option to make anonymous gifts
will probably be more comfortable
with a donor-advised fund. Donors
most concerned with control and
perpetuity may well favor a private
foundation. Some donors may choose
to establish both and use each for
specific purposes.
Similarities
With both a donor-advised fund
and a private foundation, the donor
irrevocably commits assets to charity
and receives a charitable income tax
deduction in the year he makes the
commitment. Both provide tax-
advantaged growth for the assets.
They are regulated under Section
501(c)(3) of the tax code. The IRS
may require appraisals for gifts of
assets other than cash and market-
able securities.
A powerful advantage of both vehicles
is that they enable donors to decouple
decisions about asset donation and
grantmaking. For example, donors
can give highly appreciated assets
that the private foundation or donor-
advised fund can sell to reinvest,
without incurring capital gains taxes,
although the foundation will incur
excise taxes. In subsequent months
or years, the donor can use these
funds and their investment earnings
to make grants to charity.
Differences
A donor-advised fund is an account
or a fund that the donor creates at a
sponsoring organization that is itself
a public charity. The donor funds the
account by donating cash or assets,
Charitable Donations
Donor-Advised Funds and Private Foundations
Best for: People who want to make a commitment greater than
annual charitable gifts
Benefit: Tax avoidance; immediate and perpetual philanthropy
Tax Impact:
Limitations: Subject to AGI limits on charitable contributions
Complexity/Cost: Greater for private foundations
Drawbacks: Irrevocable gift; legislative risk
Low Moderate High
Operating costs
Tax deductions for contributions Cash Marketable securities Private securities
Excise tax
Control
Funding
Annual grants
Anonymity
Perpetuity
Compensation of board members
Legislative risk
Low, but sponsor may charge investment and administrative fees ranging from 0.6% to 3%
Deductions limited to: 50% of AGI 30% of AGI Fair market value, at 30% of AGI
None
Contingent on sponsor
Excess business holdings can be a challenge
No minimum or maximum
Achievable if desired
Contingent on sponsor
NoYes
High, but declines as assets rise
Deductions limited to: 30% of AGI 20% of AGI Cost basis, at 20% of AGI
1% or 2% of income
Absolute
Excess business holdings can be a challenge
Required 5% distribution
No
Yes
Yes
Yes
Donor-Advised Fund Private Foundation
Source: IRS and AllianceBernstein
Donor-Advised Funds and Private Foundations: Summary
The Bernstein Income Tax Playbook 33

donor-advised programs will draw
checks in a way that does not disclose
the donor’s identity. Donor-advised
funds can also meet the needs of
donors who want recognition for gifts.
A private foundation cannot withhold
its identity when making a grant.
Indeed, it often provides opportunities
for publicity. Many donors use their
foundations as a bully pulpit to attract
attention to the causes they favor.
Perpetuity
A private foundation is often
described as a perpetual philanthropic
vehicle—one that will last forever. A
foundation could go on for hundreds
of years, affording the family ongoing
control over the assets in its portfolio.
Whether succeeding generations can
participate in a donor-advised fund
program depends on the sponsoring
organization’s rules.
Legislative Risk
Both vehicles could be vulnerable
to changes in the legal code. Some
lawmakers have attempted to reduce
the value of the charitable income
tax deduction to private foundations,
reduce the tax-advantaged growth
in their portfolios and increase the
required minimum spending rate.
There have been parallel efforts to
regulate donor-advised funds and add
to their immediate charitable impact.
In both cases, these efforts have
been unsuccessful, but legislative
risk remains.
This kind of income can arise from
investments in private equity funds,
REITs, and other partnerships or LLCs
that use debt to acquire property.
Operating Costs
Private foundations are generally
more expensive to establish and run
than donor-advised funds. Applying
for 501(c)(3) status is likely to entail
legal fees, and the donor is likely to
need accounting and bookkeeping
help to prepare the foundation’s tax
returns. Typically, a private foundation
is most cost-effective for charitable
programs of $5 million or more.
Donors face none of these costs
if they set up an account with an
existing donor-advised fund program,
but the administrative and investment
fees may run from less than 1% to
nearly 3%. The minimum starting
balance is typically $10,000–$25,000.
Control
Donating assets to a donor-advised
fund means relinquishing legal
control, although in recent years,
many administrators have provided
donors with the look and feel of
greater control to attract new donors
and expand their programs.
At a private foundation, directors or
trustees control investment practices,
grantee selection, grant amounts,
grant timing, and decisions regarding
single- or multiyear commitments.
Anonymity vs. Bully Pulpit
If the donor to a donor-advised fund
prefers to give anonymously, most
and provides advice about invest-
ments and grants. The sponsoring
entity handles check writing, record
keeping and other administrative
tasks.
A private foundation is a freestanding
corporation or trust that the donor
establishes and controls. (We discuss
here private nonoperating founda-
tions, not operating foundations and
supporting organizations.) The donor
or his employees are responsible
for writing checks, corresponding
with grantees, keeping records and
performing all administrative duties.
Tax Issues
Rules regarding the tax deduct-
ibility of donations are typically more
generous for donor-advised funds
than for private foundations, as
detailed in the display on the prior
page. With both vehicles, charitable
income tax deductions above the
stated limits can be carried forward
for as many as five more tax years.
Earnings and income on a donor-
advised fund are generally not subject
to taxation. Donor-advised funds can
give away all or none of their assets
in any year. Private foundations, by
contrast, are subject to an excise
tax of 1% or 2% on the income and
realized capital gains they generate
each year. A private foundation is
required to spend at least 5% of its
asset value each year.
Both vehicles can become subject to
taxation at the corporate rate (35%)
for any unrelated business taxable
income (UBTI) that they receive.
34

Today, many charitable individuals feel
forced to reassess their philanthropic
plans. Shaken by stock market
gyrations, economic uncertainty and
the possibility that they may live
well into their 90s, even people of
substantial means are deferring gifts
out of fear that they could someday
run out of money. Many assume that
retirement funding and charitable
giving are competing goals—that any
dollar given to charity means a dollar
less in their retirement account.
But a charitable gift annuity
(CGA) allows donors to make
charitable gifts while also providing
them with a stream of cash for
retirement expenses. Like the com-
mercial annuities sold by insurance
companies, charitable gift annuities
can be seen as longevity insurance:
They protect donors against the risk
of outliving their assets.
How CGAs Work
Nonprofit organizations establish
CGAs, which allow donors to make
a charitable contribution, get a
tax deduction for a portion of the
contribution now and receive fixed
payments for life (as the display
below shows). After the donor’s
death, any remaining assets pass to
the charity.
CGAs distribute less income than
commercial annuities do; this sacrifice
in yield creates the charitable
contribution. The American Council
on Gift Annuities’ suggested rate for
a single life annuitant age 69 to 76 is
between 5% and 6%. That may be
attractive to donors in a period when
bonds yield 2%–3%.
In the year the annuity is purchased,
the donor is entitled to a charitable
income tax deduction for the amount
contributed minus the present value
of the future annuity payments, based
on the donor’s life expectancy. If the
donor contributes cash, a portion of
Charitable Donations
Charitable Gift Annuities
Best for: Typically donors over age 60 worried about outliving their assets
Benefit: Tax avoidance and deferral
Tax Impact:
Limitations: Only some charities offer them; deduction subject to AGI limits on charitable contributions (see p. 31)
Complexity/Cost: Minimal, but ongoing
Drawbacks: Irrevocable gift; credit risk
Contribution of Assets
Immediate charitable income tax deduction for portion of donation
Donor pays taxes on portion of payouts
Annual Cash Payouts
Donor Charity
Donor
Charitable Gift Annuity
Remainder
Immediate deduction calculated pursuant to Sections 7520 and 664 of the Internal Revenue Code of 1986, as amended, and the Treasury regulations thereunder Source: IRS and AllianceBernstein
Give and Hedge Longevity Risk: Charitable Gift Annuities
Low Moderate High
The Bernstein Income Tax Playbook 35

the annuity payments will be treated
as a tax-free return of principal and a
portion as ordinary income. If a donor
gives low-cost-basis assets, generally
no capital gains tax will be due
immediately, although a portion of the
annual payments will be subject to
capital gains tax and a portion will be
taxed as ordinary income.
Quantifying the Benefit
Let’s consider the case of a
hypothetical retired couple in their
early 70s who would like to donate
to charity $100,000 of stock in a
former employer, with a cost basis of
$50,000. The couple has $1 million in
other investments, including $650,000
in personal savings and $350,000 in
retirement accounts. They receive
Social Security but need to spend
from their portfolio to meet their
$70,000 in annual expenses.
The couple understands the tax
benefits of giving their low-basis
stock to charity during their lives
but fear that if they do, they might
outlive their wealth. And rightly so.
We estimate that if market returns
are poor, this couple would need $1.1
million to maintain their lifestyle for
the additional 25 to 30 years they
may live.
If the couple gives the $100,000 stock
position to charity today, the odds
that they will be able to sustain their
lifestyle would decline to 84% from
91%, the display above shows. That’s
an outcome that many couples would
be unwilling to accept.
If the couple purchases a charitable
gift annuity with the $100,000 stock
position (Option 1 in the display),
the odds that they could maintain
their lifestyle would be 90%, almost
as good as if they bequeathed the
stock at death. They could fulfill their
charitable goal today and claim a
charitable income tax deduction equal
to 31% of their contribution.
The couple could also consider
making a smaller direct gift today in
conjunction with a slightly smaller
charitable gift annuity. Option 2 of
the display shows that the couple
could donate up to 20% of the stock
position today and still have nearly
a 90% probability of maintaining
their lifestyle. This option would also
provide more to the charity up front.
Risk Considerations
A CGA is an irrevocable gift, just like
an outright gift of cash. It’s important
for donors to estimate whether the
annuity stream and other assets will
cover their expenses.
It’s also possible that the charity may
be unable to make the payments
promised if its financial condition
declines. Insurance companies
that sell annuities are regulated
entities, and their financial strength
is evaluated by rating agencies
that examine their procedures and
reserves. Nonprofit organizations
offering CGAs are generally not
subject to the same degree
of scrutiny.
Financial Security:Odds of Meeting Spending Plan*
91%84%
90% 89%
Bequest Give Now Annuity Give 20% +Annuity
Option1
Option2
*Odds of meeting spending plan defined as having assets greater than $0 in year 30. The income tax deduction for the gift annuity is calculated to be 31% of the amount contributed, assuming two 70-year-old current beneficiaries, an annuity equal to 4.6% of the contribution amount and a Section 7520 rate of 2.2%. For the first 20½ payments, the annuity is assumed to be 73% return of principal (50% taxed as a capital gain) and 27% income (taxed as ordinary income). Beginning in year 21, the entire amount is assumed to be taxed as ordinary income. Based on Bernstein’s estimates of the range of returns for the applicable capital markets over the next 30 years. See Notes on Wealth Forecasting System for details. Data do not represent past performance and are not a promise of actual future results or a range of future results. Source: AllianceBernstein
A CGA Reduces Risk of Running Out of Money
36
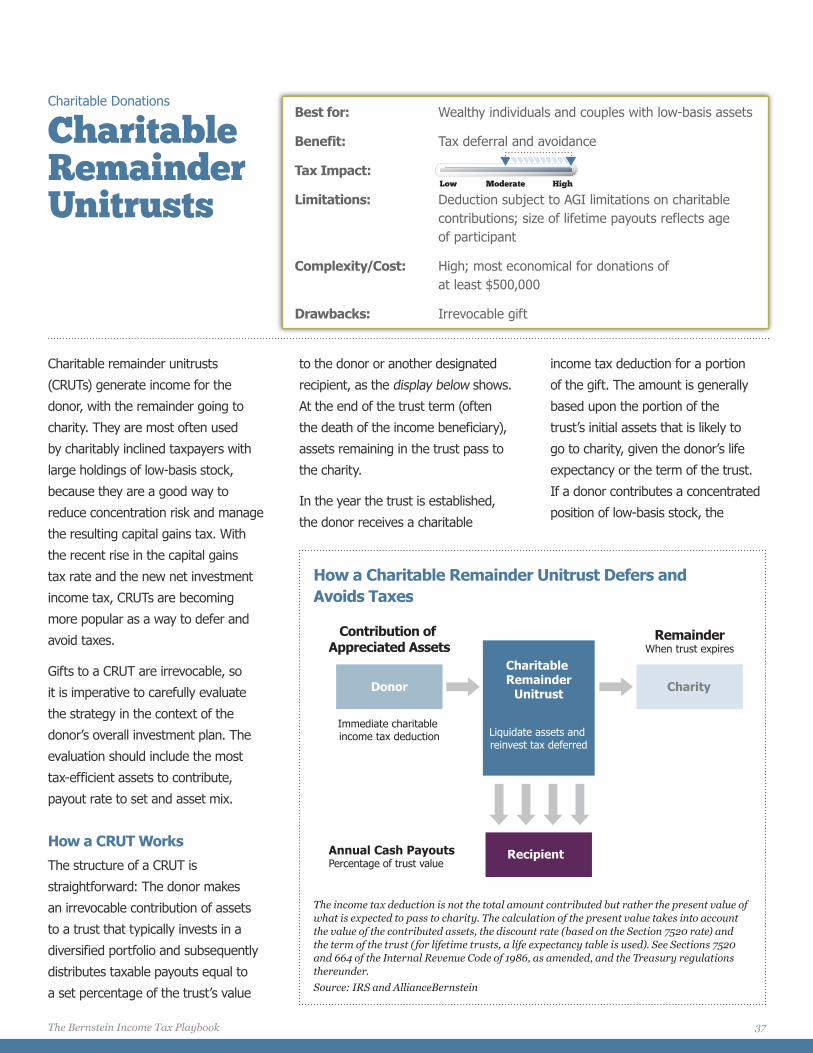
Charitable remainder unitrusts
(CRUTs) generate income for the
donor, with the remainder going to
charity. They are most often used
by charitably inclined taxpayers with
large holdings of low-basis stock,
because they are a good way to
reduce concentration risk and manage
the resulting capital gains tax. With
the recent rise in the capital gains
tax rate and the new net investment
income tax, CRUTs are becoming
more popular as a way to defer and
avoid taxes.
Gifts to a CRUT are irrevocable, so
it is imperative to carefully evaluate
the strategy in the context of the
donor’s overall investment plan. The
evaluation should include the most
tax-efficient assets to contribute,
payout rate to set and asset mix.
How a CRUT Works
The structure of a CRUT is
straightforward: The donor makes
an irrevocable contribution of assets
to a trust that typically invests in a
diversified portfolio and subsequently
distributes taxable payouts equal to
a set percentage of the trust’s value
to the donor or another designated
recipient, as the display below shows.
At the end of the trust term (often
the death of the income beneficiary),
assets remaining in the trust pass to
the charity.
In the year the trust is established,
the donor receives a charitable
income tax deduction for a portion
of the gift. The amount is generally
based upon the portion of the
trust’s initial assets that is likely to
go to charity, given the donor’s life
expectancy or the term of the trust.
If a donor contributes a concentrated
position of low-basis stock, the
Charitable Donations
Charitable Remainder Unitrusts
Best for: Wealthy individuals and couples with low-basis assets
Benefit: Tax deferral and avoidance
Tax Impact:
Limitations: Deduction subject to AGI limitations on charitable contributions; size of lifetime payouts reflects age of participant
Complexity/Cost: High; most economical for donations of at least $500,000
Drawbacks: Irrevocable gift
Contribution of Appreciated Assets
Immediate charitable income tax deduction Liquidate assets and
reinvest tax deferred
Annual Cash PayoutsPercentage of trust value
Donor Charity
Recipient
Charitable Remainder
Unitrust
RemainderWhen trust expires
The income tax deduction is not the total amount contributed but rather the present value of what is expected to pass to charity. The calculation of the present value takes into account the value of the contributed assets, the discount rate (based on the Section 7520 rate) and the term of the trust (for lifetime trusts, a life expectancy table is used). See Sections 7520 and 664 of the Internal Revenue Code of 1986, as amended, and the Treasury regulations thereunder.Source: IRS and AllianceBernstein
How a Charitable Remainder Unitrust Defers and Avoids Taxes
Low Moderate High
The Bernstein Income Tax Playbook 37
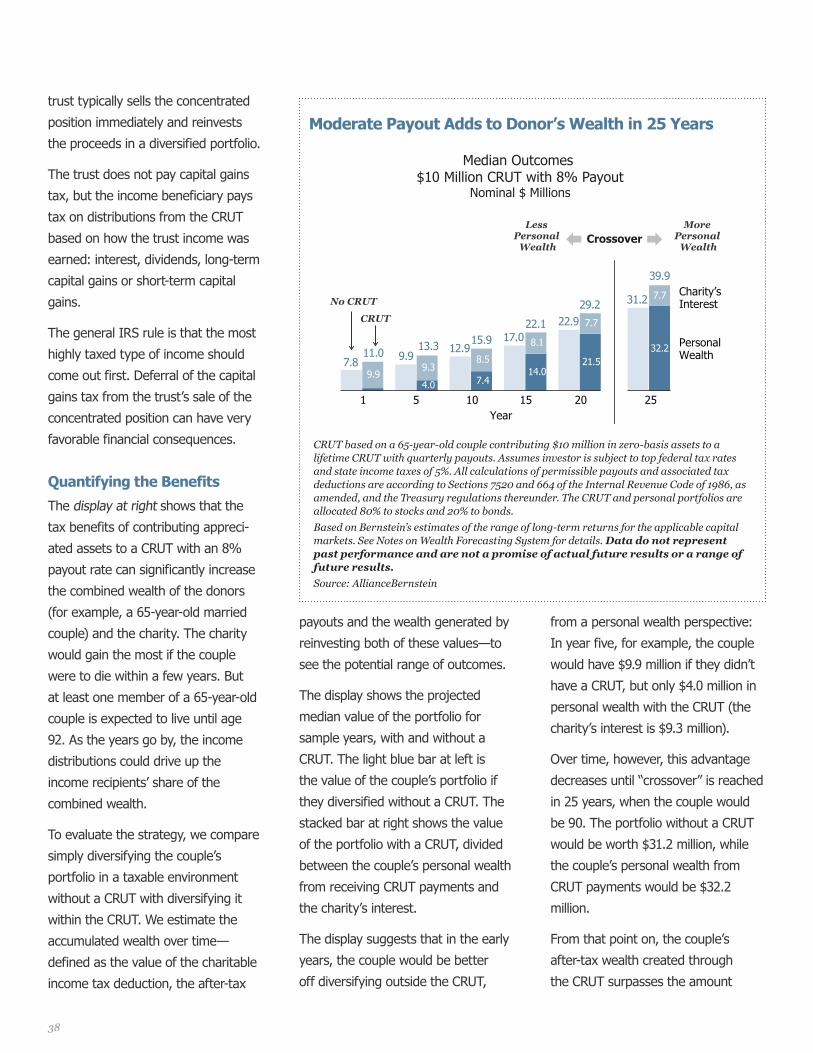
trust typically sells the concentrated
position immediately and reinvests
the proceeds in a diversified portfolio.
The trust does not pay capital gains
tax, but the income beneficiary pays
tax on distributions from the CRUT
based on how the trust income was
earned: interest, dividends, long-term
capital gains or short-term capital
gains.
The general IRS rule is that the most
highly taxed type of income should
come out first. Deferral of the capital
gains tax from the trust’s sale of the
concentrated position can have very
favorable financial consequences.
Quantifying the Benefits
The display at right shows that the
tax benefits of contributing appreci-
ated assets to a CRUT with an 8%
payout rate can significantly increase
the combined wealth of the donors
(for example, a 65-year-old married
couple) and the charity. The charity
would gain the most if the couple
were to die within a few years. But
at least one member of a 65-year-old
couple is expected to live until age
92. As the years go by, the income
distributions could drive up the
income recipients’ share of the
combined wealth.
To evaluate the strategy, we compare
simply diversifying the couple’s
portfolio in a taxable environment
without a CRUT with diversifying it
within the CRUT. We estimate the
accumulated wealth over time—
defined as the value of the charitable
income tax deduction, the after-tax
payouts and the wealth generated by
reinvesting both of these values—to
see the potential range of outcomes.
The display shows the projected
median value of the portfolio for
sample years, with and without a
CRUT. The light blue bar at left is
the value of the couple’s portfolio if
they diversified without a CRUT. The
stacked bar at right shows the value
of the portfolio with a CRUT, divided
between the couple’s personal wealth
from receiving CRUT payments and
the charity’s interest.
The display suggests that in the early
years, the couple would be better
off diversifying outside the CRUT,
from a personal wealth perspective:
In year five, for example, the couple
would have $9.9 million if they didn’t
have a CRUT, but only $4.0 million in
personal wealth with the CRUT (the
charity’s interest is $9.3 million).
Over time, however, this advantage
decreases until “crossover” is reached
in 25 years, when the couple would
be 90. The portfolio without a CRUT
would be worth $31.2 million, while
the couple’s personal wealth from
CRUT payments would be $32.2
million.
From that point on, the couple’s
after-tax wealth created through
the CRUT surpasses the amount
39.9
29.2
22.115.913.311.0
7.8 9.912.9
17.022.9
31.2
4.0 7.414.0
21.532.2
9.99.3
8.5
8.1
7.7
7.7
Median Outcomes $10 Million CRUT with 8% Payout
Nominal $ Millions
No CRUT
Personal Wealth
Charity’s Interest
CRUT
1 5 10 15 20 25Year
Less Personal
WealthCrossover
More Personal
Wealth
CRUT based on a 65-year-old couple contributing $10 million in zero-basis assets to a lifetime CRUT with quarterly payouts. Assumes investor is subject to top federal tax rates and state income taxes of 5%. All calculations of permissible payouts and associated tax deductions are according to Sections 7520 and 664 of the Internal Revenue Code of 1986, as amended, and the Treasury regulations thereunder. The CRUT and personal portfolios are allocated 80% to stocks and 20% to bonds.Based on Bernstein’s estimates of the range of long-term returns for the applicable capital markets. See Notes on Wealth Forecasting System for details. Data do not represent past performance and are not a promise of actual future results or a range of future results. Source: AllianceBernstein
Moderate Payout Adds to Donor’s Wealth in 25 Years
38
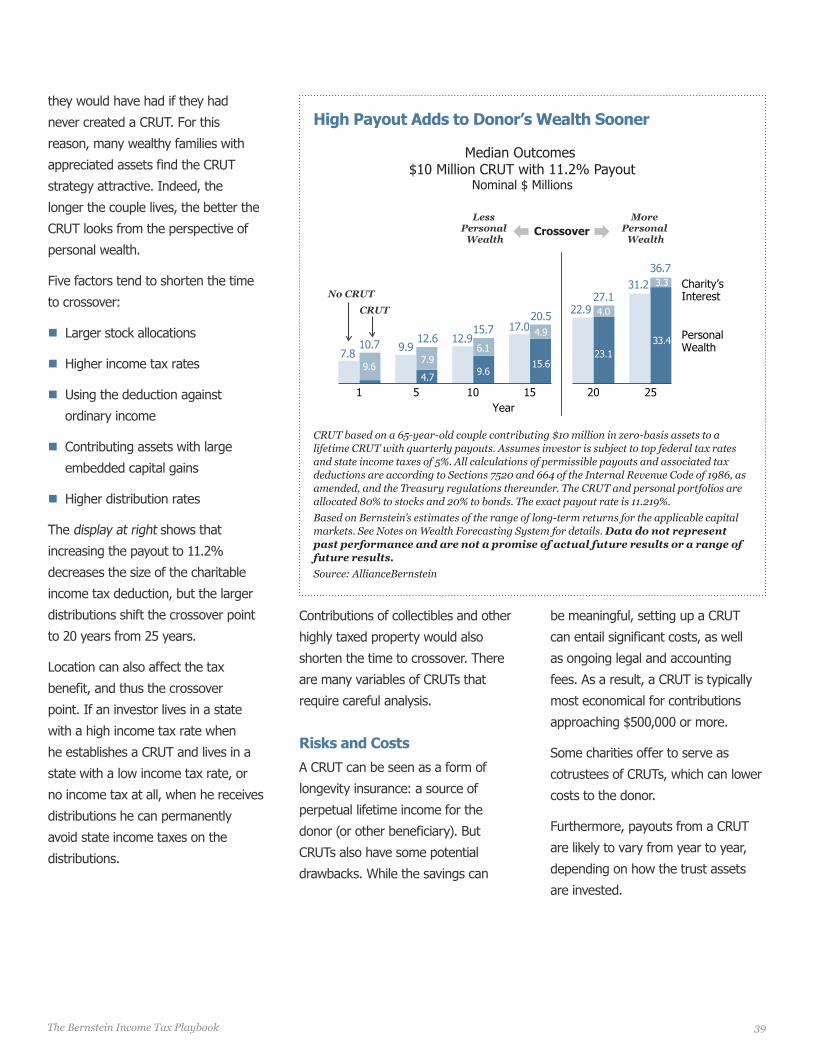
be meaningful, setting up a CRUT
can entail significant costs, as well
as ongoing legal and accounting
fees. As a result, a CRUT is typically
most economical for contributions
approaching $500,000 or more.
Some charities offer to serve as
cotrustees of CRUTs, which can lower
costs to the donor.
Furthermore, payouts from a CRUT
are likely to vary from year to year,
depending on how the trust assets
are invested.
Contributions of collectibles and other
highly taxed property would also
shorten the time to crossover. There
are many variables of CRUTs that
require careful analysis.
Risks and Costs
A CRUT can be seen as a form of
longevity insurance: a source of
perpetual lifetime income for the
donor (or other beneficiary). But
CRUTs also have some potential
drawbacks. While the savings can
they would have had if they had
never created a CRUT. For this
reason, many wealthy families with
appreciated assets find the CRUT
strategy attractive. Indeed, the
longer the couple lives, the better the
CRUT looks from the perspective of
personal wealth.
Five factors tend to shorten the time
to crossover:
�� Larger stock allocations
�� Higher income tax rates
�� Using the deduction against
ordinary income
�� Contributing assets with large
embedded capital gains
�� Higher distribution rates
The display at right shows that
increasing the payout to 11.2%
decreases the size of the charitable
income tax deduction, but the larger
distributions shift the crossover point
to 20 years from 25 years.
Location can also affect the tax
benefit, and thus the crossover
point. If an investor lives in a state
with a high income tax rate when
he establishes a CRUT and lives in a
state with a low income tax rate, or
no income tax at all, when he receives
distributions he can permanently
avoid state income taxes on the
distributions.
Median Outcomes $10 Million CRUT with 11.2% Payout
Nominal $ Millions
No CRUT
Personal Wealth
Charity’s Interest
CRUT
36.7
27.1
20.515.7
12.610.7
1 5 10 15 20 25Year
7.8 9.912.9
17.022.9
31.2
4.7 9.615.6
23.133.4
9.67.9
6.1
4.9
4.0
3.3
Less Personal
WealthCrossover
More Personal
Wealth
CRUT based on a 65-year-old couple contributing $10 million in zero-basis assets to a lifetime CRUT with quarterly payouts. Assumes investor is subject to top federal tax rates and state income taxes of 5%. All calculations of permissible payouts and associated tax deductions are according to Sections 7520 and 664 of the Internal Revenue Code of 1986, as amended, and the Treasury regulations thereunder. The CRUT and personal portfolios are allocated 80% to stocks and 20% to bonds. The exact payout rate is 11.219%.Based on Bernstein’s estimates of the range of long-term returns for the applicable capital markets. See Notes on Wealth Forecasting System for details. Data do not represent past performance and are not a promise of actual future results or a range of future results.Source: AllianceBernstein
High Payout Adds to Donor’s Wealth Sooner
39The Bernstein Income Tax Playbook
Notes on Wealth Forecasting System1. Purpose and Description of Wealth Forecasting SystemBernstein’s Wealth Forecasting SystemSM is designed to assist investors in making long-term investment decisions regarding their allocation of investments among categories of financial assets. Our planning tool consists of a four-step process: 1) Client Profile Input: the client’s asset allocation, income, expenses, cash withdrawals, tax rate, risk-tolerance level, goals, and other factors; 2) Client Scenarios: in effect, questions the client would like our guidance on, which may touch on issues such as when to retire, what his/her cash-flow stream is likely to be, whether his/her portfolio can beat inflation long term, and how different asset allocations might impact his/her long-term security; 3) The Capital Markets Engine: Our proprietary model, which uses our research and his-torical data to create a vast range of market returns, takes into account the linkages within and among the capital markets, as well as their unpredictability; and 4) A Probability Distribution of Outcomes: Based on the assets invested pursuant to the stated asset allocation, 90% of the estimated ranges of returns and asset values the client could expect to experience are represented within the range established by the 5th and 95th percentiles on “box and whiskers” graphs. However, outcomes outside this range are expected to occur 10% of the time; thus, the range does not establish the boundaries for all outcomes.
Expected market returns on bonds are derived taking into account yield and other criteria. An important assumption is that stocks will, over time, outperform long bonds by a reasonable amount, although this is in no way a certainty. Moreover, actual future results may not meet Bernstein’s estimates of the range of market returns, as these results are subject to a variety of economic, market, and other variables. Accordingly, the analysis should not be construed as a promise of actual future results, the actual range of future results, or the actual probability that these results will be realized.
2. Retirement VehiclesEach retirement plan is modeled as one of the following vehicles: traditional IRA, 401(k), 403(b), or Roth IRA/401(k). One of the significant differences among these vehicle types is the date at which mandatory distributions commence. For traditional IRA vehicles, mandatory distributions are assumed to commence during the year in which the investor reaches the age of 70½. For 401(k) and 403(b) vehicles, mandatory distributions are assumed to commence at the later of 1) the year in which the investor reaches the age of 70½ or 2) the year in which the investor retires. In the case of a married couple, these dates are based on the date of birth of the older spouse. The minimum mandatory withdrawal is estimated using the Minimum Distribution Incidental Benefit tables as published on www.irs.gov. For Roth IRA/401(k) vehicles, there are no mandatory distributions. Distributions from Roth IRA/401(k) vehicles that exceed principal will be taxed and/or penalized if the distributed assets are less than five years old and the contributor is less than 59½ years old. All Roth 401(k) plans will be rolled into a Roth IRA plan when the investor turns 59½ years old to avoid minimum distribution requirements.
3. RebalancingAnother important planning assumption is how the asset allocation varies over time. Cash flows and cash generated from portfolio turnover are used to maintain the selected asset allocation between cash, bonds, stocks, REITs, and hedge funds over the period of the analysis. Where this is not sufficient, assets are assumed to be sold to rebalance.
4. Expenses and Spending Plans (Withdrawals)All results are generally shown after applicable taxes and after anticipated withdrawals and/or additions, unless otherwise noted. Liquidations may result in realized gains or losses, which will have capital gains tax implications.
5. Modeled Asset ClassesThe following assets or indexes were used in this analysis to represent the various model classes:
6. VolatilityVolatility is a measure of dispersion of expected returns around the average. The greater the volatility, the more likely it is that returns in any one period will be substantially above or below the expected result. The volatility for each asset class used in this analysis is listed in the Capital Markets Projections section at the end of these Notes. In general, two-thirds of the returns will be within one standard deviation. For example, assuming that stocks are expected to return 8.0% on a compounded basis and the volatility of returns on stocks is 17.0%, in any one year it is likely that two-thirds of the projected returns will be between (8.9)% and 28.8%. With intermediate government bonds, if the expected compound return is assumed to be 5.0% and the volatility is assumed to be 6.0%, two-thirds of the outcomes will typically be between (1.1)% and 11.5%. Bernstein’s forecast of volatility is based on historical data and incorporates Bernstein’s judgment that the volatility of fixed income assets is different for different time periods.
Asset Class Modeled as... Annual Turnover Rate
Cash Equivalents 3-month Treasury bills 100%
Intermediate-Term Diversified Municipals AA-rated diversified municipal bonds of 7-year maturity 30%
Intermediate-Term Taxables Taxable bonds with maturity of 7 years 30%
US Diversified S&P 500 Index 15%
US Value S&P/Barra Value Index 15%
US Growth S&P/Barra Growth Index 15%
Developed International MSCI EAFE Unhedged Index 15%
Emerging Markets MSCI Emerging Markets Index 20%
US SMID Russell 2500 Index 15%
REITs FTSE NAREIT Index 30%
40
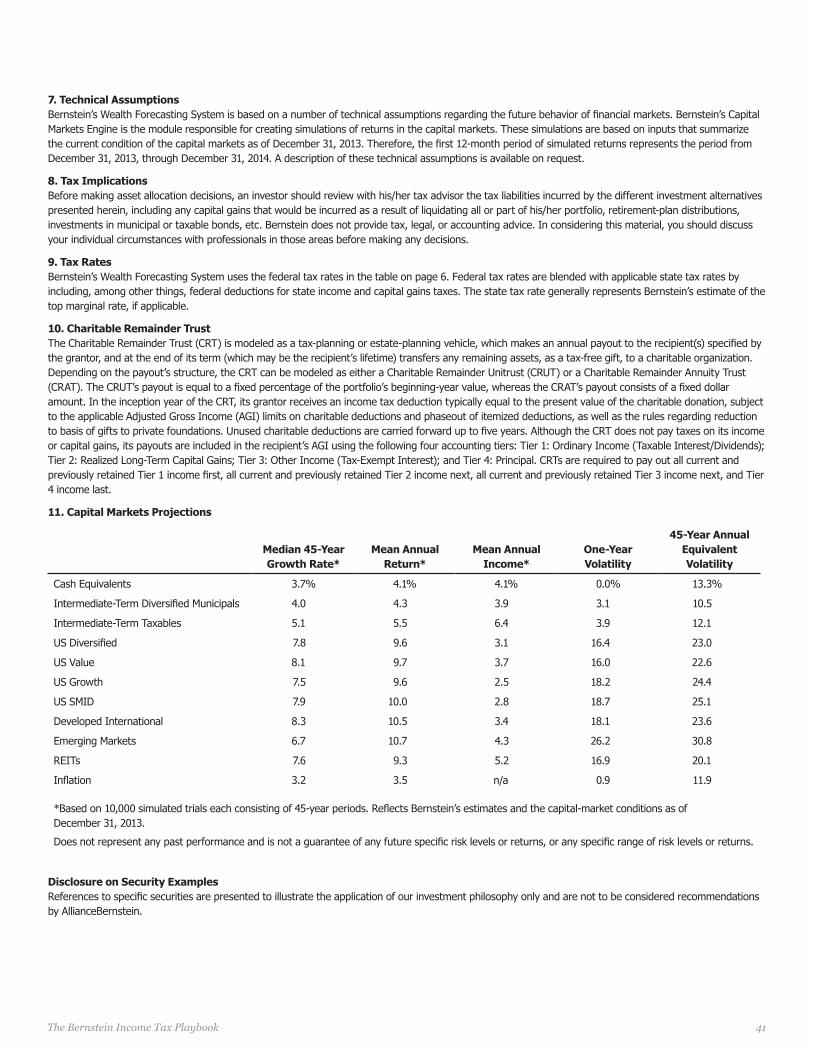
7. Technical AssumptionsBernstein’s Wealth Forecasting System is based on a number of technical assumptions regarding the future behavior of financial markets. Bernstein’s Capital Markets Engine is the module responsible for creating simulations of returns in the capital markets. These simulations are based on inputs that summarize the current condition of the capital markets as of December 31, 2013. Therefore, the first 12-month period of simulated returns represents the period from December 31, 2013, through December 31, 2014. A description of these technical assumptions is available on request.
8. Tax ImplicationsBefore making asset allocation decisions, an investor should review with his/her tax advisor the tax liabilities incurred by the different investment alternatives presented herein, including any capital gains that would be incurred as a result of liquidating all or part of his/her portfolio, retirement-plan distributions, investments in municipal or taxable bonds, etc. Bernstein does not provide tax, legal, or accounting advice. In considering this material, you should discuss your individual circumstances with professionals in those areas before making any decisions.
9. Tax RatesBernstein’s Wealth Forecasting System uses the federal tax rates in the table on page 6. Federal tax rates are blended with applicable state tax rates by including, among other things, federal deductions for state income and capital gains taxes. The state tax rate generally represents Bernstein’s estimate of the top marginal rate, if applicable.
10. Charitable Remainder Trust The Charitable Remainder Trust (CRT) is modeled as a tax-planning or estate-planning vehicle, which makes an annual payout to the recipient(s) specified by the grantor, and at the end of its term (which may be the recipient’s lifetime) transfers any remaining assets, as a tax-free gift, to a charitable organization. Depending on the payout’s structure, the CRT can be modeled as either a Charitable Remainder Unitrust (CRUT) or a Charitable Remainder Annuity Trust (CRAT). The CRUT’s payout is equal to a fixed percentage of the portfolio’s beginning-year value, whereas the CRAT’s payout consists of a fixed dollar amount. In the inception year of the CRT, its grantor receives an income tax deduction typically equal to the present value of the charitable donation, subject to the applicable Adjusted Gross Income (AGI) limits on charitable deductions and phaseout of itemized deductions, as well as the rules regarding reduction to basis of gifts to private foundations. Unused charitable deductions are carried forward up to five years. Although the CRT does not pay taxes on its income or capital gains, its payouts are included in the recipient’s AGI using the following four accounting tiers: Tier 1: Ordinary Income (Taxable Interest/Dividends); Tier 2: Realized Long-Term Capital Gains; Tier 3: Other Income (Tax-Exempt Interest); and Tier 4: Principal. CRTs are required to pay out all current and previously retained Tier 1 income first, all current and previously retained Tier 2 income next, all current and previously retained Tier 3 income next, and Tier 4 income last.
11. Capital Markets Projections
Disclosure on Security ExamplesReferences to specific securities are presented to illustrate the application of our investment philosophy only and are not to be considered recommendations by AllianceBernstein.
Median 45-Year Growth Rate*
Mean Annual Return*
Mean Annual Income*
One-Year Volatility
45-Year Annual Equivalent Volatility
Cash Equivalents 3.7% 4.1% 4.1% 0.0% 13.3%
Intermediate-Term Diversified Municipals 4.0 4.3 3.9 3.1 10.5
Intermediate-Term Taxables 5.1 5.5 6.4 3.9 12.1
US Diversified 7.8 9.6 3.1 16.4 23.0
US Value 8.1 9.7 3.7 16.0 22.6
US Growth 7.5 9.6 2.5 18.2 24.4
US SMID 7.9 10.0 2.8 18.7 25.1
Developed International 8.3 10.5 3.4 18.1 23.6
Emerging Markets 6.7 10.7 4.3 26.2 30.8
REITs 7.6 9.3 5.2 16.9 20.1
Inflation 3.2 3.5 n/a 0.9 11.9
*Based on 10,000 simulated trials each consisting of 45-year periods. Reflects Bernstein’s estimates and the capital-market conditions as of December 31, 2013.
Does not represent any past performance and is not a guarantee of any future specific risk levels or returns, or any specific range of risk levels or returns.
41The Bernstein Income Tax Playbook

© 2014 AllianceBernstein L.P.
Note to All Readers:The information contained herein reflects the views of AllianceBernstein L.P. or its affiliates and sources it believes are reliable as of the date of this publication. AllianceBernstein L.P. makes no representations or warranties concerning the accuracy of any data. There is no guarantee that any projection, forecast, or opinion in this material will be realized. Past performance does not guarantee future results. The views expressed herein may change at any time after the date of this publication. This document is for informational purposes only and does not constitute investment advice. It does not take an investor’s personal investment objectives or financial situation into account. This information should not be construed as sales or marketing material or an offer or solicitation for the purchase or sale of any financial instrument, product, or service sponsored by AllianceBernstein or its affiliates.
Bernstein Global Wealth Management is a unit of AllianceBernstein L.P.
Bernstein works with investors and their tax advisors to quantify the potential impact on after-tax wealth and income of strategies like those discussed in this playbook. We take the investor’s unique circumstances and goals into account. We design and implement strategies, too.
Call your Bernstein Advisor. Or e-mail [email protected].
Global Wealth Management 1345 Avenue of the Americas, New York, NY 10105 1.212.486.5800 www.bernstein.com
BER–1108–0414