the benefits of fdi: is foreign investment in bolivia’s …...it costs.5 this topic is not only...
TRANSCRIPT

The benefits of FDI: is foreign investment in Bolivia’s oil and gas delivering?
Claire McGuigan

1
TABLE OF CONTENTS
EXECUTIVE SUMMARY........................................................................................................... 3
INTRODUCTION ....................................................................................................................... 6
OIL AND GAS INVESTMENT................................................................................................... 9
INDUSTRY TRENDS ................................................................................................................... 9 SUCCESS STORIES................................................................................................................... 9 OIL AND POVERTY.................................................................................................................. 10 OIL AND GAS FISCAL REGIMES ................................................................................................ 10
OVERVIEW OF THE OIL AND GAS SECTOR IN BOLIVIA.................................................. 14
ECONOMIC SIGNIFICANCE....................................................................................................... 14 THE IMPACT OF THE SECTOR ON BOLIVIA’S BALANCE OF PAYMENTS .......................................... 16 HYDROCARBONS AND POVERTY.............................................................................................. 18 BOLIVIAN’S ACCESS TO FUEL PRODUCTS ................................................................................. 19
PRIVATISING BOLIVIA’S OIL AND GAS SECTOR.............................................................. 21
YPFB BEFORE PRIVATISATION................................................................................................ 21 PREPARING FOR PRIVATISATION ............................................................................................. 21 THE SALE OF YPFB ............................................................................................................... 22 MANAGING THE SECTOR......................................................................................................... 24 BOLIVIA’S NEW FISCAL REGIME FOR OIL AND GAS ..................................................................... 25
Royalties ......................................................................................................................... 26 Taxes .............................................................................................................................. 27 Sales taxes...................................................................................................................... 27 Analysis of post-privatisation fiscal regime ..................................................................... 28
OPERATING IN BOLIVIA........................................................................................................... 28
BENEFITS ............................................................................................................................... 30
INTRODUCTION ...................................................................................................................... 30 EMPLOYMENT ........................................................................................................................ 31 ROYALTIES AND TAXES........................................................................................................... 32 PAYMENTS TO THE CAPITALISATION FUND ............................................................................... 36 DEVELOPMENT OF LINKAGES WITH LOCAL BUSINESSES ............................................................ 36 CONCLUSION......................................................................................................................... 37
COSTS .................................................................................................................................... 38
INTRODUCTION ...................................................................................................................... 38 COSTS OF ADMINISTERING REFORM ........................................................................................ 38 FOREGONE REVENUE BECAUSE OF INCENTIVES OFFERED TO ATTRACT INVESTMENT .................. 38
Initial investment incentives ............................................................................................ 38 Tax incentives ................................................................................................................. 39
COST OF FUEL SUBSIDIES....................................................................................................... 39 LOST REVENUE DUE TO COMPANIES AVOIDING TAX .................................................................. 40 CONCLUSION......................................................................................................................... 42
NON-QUANTIFIED COSTS .................................................................................................... 43
INTRODUCTION ...................................................................................................................... 43 LOST REVENUE THROUGH CONTRACT ABUSE BY COMPANIES .................................................... 43 ENVIRONMENTAL COSTS ........................................................................................................ 43
Pipelines and exploration................................................................................................ 44 Damages payments ........................................................................................................ 46 Oil spills........................................................................................................................... 47
ANALYSING THE ECONOMIC CONTRIBUTION OF THE OIL AND GAS SECTOR TO BOLIVIA .................................................................................................................................. 50
INTRODUCTION ...................................................................................................................... 50 ANALYSIS .............................................................................................................................. 50 COMPARISON OF THE PRE AND POST PRIVATISATION PERIOD.................................................... 51

2
SHIFTING THE TAX BURDEN..................................................................................................... 52
RECENT CHANGES TO THE OIL AND GAS SECTOR........................................................ 54
CONCLUSION......................................................................................................................... 56
ANNEX A: COMPANIES’ TURNOVER AND CONTRIBUTIONS TO THE STATE............... 59

3
Executive summary
Developing countries have long been told that foreign investment will transform their economies, bringing capital, jobs and economic growth. As a result, developing countries are strongly encouraged to privatise state-owned industries and to prioritise attracting foreign investment over any other measure that might promote their domestic private sector. The international financial institutions have actively promoted this approach, often making loans conditional on privatisation and investment liberalisation. While the positive benefits of foreign investment are widely promoted, there is also a growing recognition both that benefits are not automatic and that foreign investment can also bring costs with it. This report analyses the costs and benefits associated with foreign investment in the oil and gas sector in Bolivia, and quantifies the real contribution that the sector has made to the Bolivian economy since privatisation at the end of 1996. The benefits that Bolivia is receiving from its oil and gas sector are of course an issue of huge importance to the country, given the extremely high levels of poverty – with 63 per cent of people living on less than US$2 a day, jumping to a staggering 91 per cent in rural areas.1 The World Bank has declared that Bolivia urgently needs to increase its tax level to reduce poverty, and of all Latin American countries Bolivia needs to make the largest increase in its tax rates if it hopes to meet poverty-reduction goals.2 It is, therefore, critical that the central government ensures that the highest possible revenue is extracted from the oil and gas sector, and that these funds are channelled to poverty-reduction and development programmes. The oil and gas sector is of course doing extremely well, with oil prices hitting record highs this year and multinational companies announcing record profits. For many developed countries oil and gas exploration has brought wealth and provided funds for generous social policies and the development of a diversified private sector. Unfortunately for developing countries, oil and gas production is more often commonly associated with continuing high levels of poverty and increasing conflict and corruption. There is also now a growing concern about the fairness of the terms negotiated between developing countries and companies involved in natural-resource extraction, a negotiation which has often taken place under the auspices of a World Bank-sponsored privatisation reform. There should be no assumption that developing countries are getting a good deal and Christian Aid’s new research has found that in countries as diverse as Zambia and the Philippines lax fiscal regimes for mineral extraction have effectively deprived governments of much-needed revenue.3 This study has found that although on the face of it Bolivia designed a fairly good fiscal regime for its privatised oil and gas extraction, in practice it is not receiving a fair share of the wealth generated by the sector. In this context it is unsurprising that the new government chose to renegotiate contracts with the oil and gas companies this year. This move has generally been received with disapproval, if not hostility, by companies, the IMF and some western governments, and the process has been extremely challenging for the new government. This study, however, shows that a renegotiation of terms was necessary. We have analysed the benefits that Bolivia received after privatisation - the main benefits coming in the form of wages and taxes and royalties paid to the state. Unsurprisingly wages were found to benefit a very small number of highly skilled workers. It is only royalties and taxes which have the potential to contribute to development and poverty reduction. Unfortunately as this study shows the contributions made by companies to the state post privatisation are not particularly impressive. Firstly, these payments are significantly smaller than the contributions made by Yacimientos Petrolíferos Fiscales Bolivianos (YPFB) – the state owned enterprise – to the

4
Treasury before privatisation. Secondly, we have shown that as companies’ turnover and profits have increased the state received an ever-decreasing share in the wealth generated. Perhaps this is not surprising, given that under the World Bank’s influence the reform was designed in such a way as to be as attractive as possible to foreign investors, with little analysis going into how Bolivia could maximise its gain from the oil and gas sector. What is particularly damning, though, is the realisation that YPFB’s greater contribution came without the costs of the reform, without profit remittance and without any of the losses caused by the presence of foreign investors that this study documents. This report quantifies the incentives provided – including the initial incentive of selling YPFB to foreign investors who did not actually pay for the assets they were receiving. We also track how lowering the fiscal burden on companies has gone hand in hand with an increase in consumer taxes on the sale of fuel products. While this has made up for the shortfall in revenue for the government it means multinational companies are paying less of their share, and the mainly poor Bolivian consumers are shouldering the tax burden. This policy choice was explicitly promoted by the World Bank and it has contributed to Bolivia’s highly regressive tax regime. This study also provides a more complete picture of the losses Bolivia has experienced from the presence of foreign investors. As well as quantifying the incentives provided to investors, this study also analyses the tax take and the existing taxation rules. While industry representatives in Bolivia have continually insisted that the low royalties are combined with a high-tax burden, our research shows this is far from the truth. Royalties make up the bulk of the benefit the state receives while tax payments amount to a small proportion of companies’ contribution to the state. While Bolivia is losing out in its share in the wealth generated by the sector, the country has also assumed a variety of costs in attracting and hosting foreign investors in the country. This study has quantified the direct costs –such as the cost of YPFB’s privatisation and fuel subsidy costs – as well as the revenue foregone by the Bolivian government in the hope of generating large benefits for the country. This study has found that in a six-year period post privatisation the costs and revenue foregone by the Bolivian government are actually larger than the benefits received. Presumably there are still many who would argue that such large and costly incentives were necessary to attract this level of investment. However, there is a growing academic consensus that tax and investment incentives are not the determining factor of the locational decisions of multinational companies. While this is true of foreign investment generally it must be especially true for companies engaged in natural resource extraction who have no choice but to go where the resources are located. This study also highlights the need for us to look beyond the figures of investment flows and export earnings when analysing the contribution of foreign investment. To judge the success of policies we must look for the actual benefits that flow to local workers, businesses and the state. There are also, of course, costs to Bolivia related to the oil and gas sector which this study could not quantify – the biggest being the environmental costs. Deforestation, land, water and air pollution, oil spills and gas flaring, have all had a negative impact on human health, livestock, fisheries and on rural communities’ livelihoods. Bolivia’s vast biodiversity is suffering huge losses. It is also true that YPFB’s operations were on a significantly smaller scale before privatisation. This means that while the Bolivian Treasury has received less revenue post privatization, Bolivian communities have also been suffering much higher levels of environmental damage.
Finally it is important to remember that this reduction in benefits, and the ever decreasing share in the generated wealth, is occurring in the context of a huge increase in investment, production, exports and prices. It is not surprising that Bolivians are extremely sceptical of the benefits that foreign companies are bringing to the country. Hopefully, the recent reforms

5
instituted by the MAS (Movement Towards Socialism) government have provided a foundation for the state to share more equitably in the wealth created and for the Bolivian people to truly benefit from their oil and gas reserves.
6
Introduction Developing countries have long been told that foreign investment will transform their economies, bringing much-needed capital, generating jobs and leading to economic growth. These countries are strongly encouraged to prioritise attracting foreign investment over any other measure which might promote industrialisation and develop their domestic private sector. This is a position widely endorsed by the British government with the secretary of state for international development saying recently that ‘the single most important thing a developing country can do to benefit from the trade and investment opportunities thrown up by globalisation, is to get their investment climate right’.4 Strategies to attract foreign investors normally emphasise a strong protection of investors’ rights (including the right to international arbitration), ensuring foreign companies can freely remit profits, abolishing preferential treatment for local businesses, applying a ‘light’ regulatory approach and providing incentives such as keeping wages low and maintaining low tax rates. While the positive benefits of foreign investment are widely promoted, there is also a growing recognition both that benefits are not automatic and that foreign investment can also bring with it costs.5 This topic is not only relevant for developing countries – it is also one which is of interest to developed countries. In the UK, for example, local authorities regularly compete for foreign investment, offering various incentives to attract companies to their area. One recent study in London found that the value of the incentives was higher than the actual benefits brought by the company.6 This story is not as unusual as it sounds. In 1996 the state of Alabama paid a subsidy of US$200,000 per employee to Mercedes Benz and Germany paid a staggering US$3,400,000 subsidy per employee to Dow Chemicals.7 Lessons from east Asia vividly demonstrate that for countries to truly benefit from foreign direct investment (FDI), it must be managed strategically, with explicit efforts made to create links between foreign companies and the local economy.8 However, such lessons are rarely applied in practice and developing countries are still encouraged to adopt a liberal investment framework. As a result it is now normal practice for developing countries to strive to attract any type of FDI and their attempts to manage or regulate it are discouraged. Bolivia is no exception. Since structural adjustment the country has adopted a very liberal approach to investment, adopting the main principles outlined above in their attempt to attract foreign investment to the country. Bolivia is a model of an open market economy. The country has closely adhered to the International Monetary Fund’s (IMF) reform policies. Given its disappointing growth and poverty reduction results it has been described by the IMF as ‘the Bolivian puzzle’. 9 Bolivia has privatised five of its main state-owned enterprises as part of its strategy to attract foreign investment. Amongst these the most important is the oil and gas industry which is now the most dynamic sector of the Bolivian economy and receives by far the most foreign investment (40 per cent between 1990 and 2000).10 The size of natural gas reserves is now certified at 48.7 trillion cubic feet11 and Bolivia is second only to Venezuela in the region in its hydrocarbon resources. There is no question that since privatisation in 1997 Bolivia has made important advances in extracting its oil and gas. The presence of foreign investment has led to a large increase in exploration and the certification of significant new reserves. The construction of the Bolivia-Brazil pipeline has also helped to consolidate Bolivia’s important position as an energy provider to the region. On the face of it, the increasing foreign investment and production levels of the industry may seem a straightforward – and positive – story. However, the management and development of oil and gas in Bolivia is mired in controversy. The privatisation of Bolivia’s national oil and gas enterprise – Yacimientos Petrolíferos Fiscales de Bolivia (YPFB) – has never been a happy

7
story for the Bolivian people, and pressures for the re-nationalisation of this resource reached a high point between 2003 and 2005. After a series of and protests over the energy question – the so-called ‘gas war’ demonstrations led to two presidential resignations in October 2003 and June 2005. Both presidents had continued to resist calls for a major reform of the industry. As a result of this pressure the Bolivian Congress passed a law in May 2005 which provided – among other things – for a new royalties and tax structure on oil and gas extraction, increasing the state’s share of the revenue. Since coming to power in January 2006, President Evo Morales has revised the fiscal regime for the oil and gas sector and forced a renegotiation of contracts with the industry, revising the terms under which foreign companies operate.
While there were many negative reactions to Bolivia’s moves to regain more control over its oil and gas resources, it is also often observed that the country has not been able to take advantage of the wealth provided by its natural resources or to use them for the benefit of the majority poor population.12 This is not only a Bolivian story. It is common to hear of developing countries’ failure to convert huge natural resource wealth into a successful reduction of their citizens’ poverty, and Christian Aid has documented some of these failures in Angola, Sudan and Kazakhstan.13 Bolivia, however, is in a much better position than many developing countries with large oil and gas resources. It has not witnessed civil war and there is no suggestion that oil is fuelling serious conflict or military abuses. It is a country that has seen relative stability over the last 25 years. Even the ousting of presidents has been achieved with mainly peaceful public protest. As mentioned above, Bolivia has also been repeatedly praised for its economic reforms, particularly the framework it has adopted on foreign investment. This report will investigate the level of benefits a stable developing country applying the ‘right’ economic framework can obtain from its oil and gas reserves. It will analyse the contribution that foreign investment in the oil and gas sector has made to the Bolivian economy, looking particularly at investment in upstream (exploration and production) activities. The report compares a six-year period following privatisation with the six years preceding it. The period of 1999 to 2004 is used as the post-privatisation reference period, both because it excludes the first years of privatisation when new investment was just beginning to flow into the country and when benefits can be presumed to be more limited, and because we have more complete data for this period. The report then compares these benefits with the quantifiable costs of Bolivia’s privatisation policy. These costs will include direct costs (for example, subsidies paid) as well as the revenue that Bolivia has foregone (for example by providing tax incentives) in order to attract foreign investment to the country. Comparing the benefits that flow to the Bolivian government, workers and local businesses with the costs and revenue foregone in implementing privatisation and attracting foreign investors is a useful way to judge the success of the policies implemented. To assess what might have happened in the absence of the reform policies the economic benefits received by Bolivia in this period will also be compared to the six-year period pre-privatisation when the state company managed oil and gas extraction. Data has been gathered by Christian Aid’s long term partner CEDLA, (the Centre for Labour and Agrarian Development Research) in Bolivia. This economic policy think tank, based in La Paz, has worked for many years on a variety of themes related to Bolivian economic policy, including employment and labour rights, debt and tax. CEDLA has also monitored the development of the oil and gas industry over the past eight years.
As oil and gas resources are non-renewable time will run out on making the best use of them for the benefit of the country. At the current rate of extraction14 – and presuming no new reserves are found – Bolivia’s natural gas reserves will last for another 110 years and its oil reserves for only 71 years. It is therefore critical that Bolivia addresses this issue immediately

8
to ensure that it harnesses oil and gas wealth for the benefit of the poor.

9
Oil and gas investment
Industry trends
The oil industry certainly seems to be doing very well. Oil prices have hit record highs recently and demand continues to grow. Oil companies can afford to invest strongly in new exploration projects and shareholders are happy with the large dividends they are receiving, thanks to growing demand and high prices. At the same time, however, there are a variety of new challenges facing the industry. The major oil companies are having problems replacing their reserves, and there has been much media attention lately on the fact that oil is running out and finding new fields is getting much more difficult.15 Globally, reserves are shrinking and some big oil companies (Royal Dutch Shell and Repsol-YPF) have even had to announce that their reserves have been overstated – most unwelcome news for shareholders.16 New competition from India and China in securing new oil and gas reserves is increasing and many new potential sources of oil and gas are either in hard to reach locations or countries which are politically unstable (eg Iraq, which has the third largest oil reserves in the world).17 In addition, state-owned companies are expanding rapidly and competing, often successfully, with big oil companies for contracts. These factors have led to it being described as an ‘era of unprecedented change’ for the industry.18
Success stories
Exploration and production of oil and gas can obviously bring countries huge wealth. Norway, famously number 1 on the UNDP’s Human Development Index, has been producing offshore oil and gas since the 1970s with production increasing significantly since 1995. Norway is the world’s third largest exporter of oil. While oil and gas are the most significant exports, the country also has a diversified economy in which manufacturing (machinery, transport equipment, chemicals) and shipping are important.19 Norway is also known for its progressive tax structure and the substantial share the state has taken from its oil sector. Generated revenue has been reinvested in the economy and in efficient and generous social services, at the same time as being transferred into the state’s Petroleum Fund and invested in foreign stocks and bonds to provide the government with an income stream in the future.20 An example of successful use of oil revenue, on a much smaller scale, is that of the Shetland Isles. There the council created a development strategy around the oil industry in the 1970s. This was essentially a ‘contain-and-insulate’ strategy which involved taking measures to geographically contain the oil and gas industry and clearly prescribe what they could and couldn’t do. The rest of the economy was effectively insulated from the sector and the revenue was used to set up a long-term development fund. This well thought-out strategy in the Shetlands very clearly put the interests of the community before those of industry.21 The impact observed since then has mainly been positive. While there have been tensions about pollution and clashes with local fishing interests, infrastructure has much improved and local industries have been supported to become more competitive. As a result, local industry has diversified and grown, and oil production has now declined in importance to the economy. There is no doubt that the reinvestment of oil funds to support local industry has been achieved successfully and has brought significant benefits to the islands. There are also examples in western countries where successful revenue generation and revenue use are less straightforward issues. In Alaska the government established the Alaska Permanent Fund (APF) – a public trust fund from which the interest is used to give citizens individual dividend payments each year. In 2003 payments were US$1,107 each.22 This is an important source of income for poor – and particularly poor rural – families. However, for a

10
while it did have the unintended effect of encouraging inward migration. It is also notable that as Alaska has no sales tax or income tax, the APF only receives 25 per cent of oil revenue, the rest going into the state budget. This restricts citizens’ dividends and has led to much public discussion on the level of the APF, as well as the Alaskan state’s share of oil profits.
Oil and poverty
Unfortunately in developing countries oil and gas production is much more closely associated with poverty and corruption. A wide body of research – including Christian Aid’s own – has shown that for developing countries oil exporting is closely associated with high rates of corruption, poverty, authoritarian government, government ineffectiveness, military spending and civil war, while at the same time having a negative effect on growth performance.23 This was clearly demonstrated by the Extractive Industries Review (EIR), a review of the World Bank’s funding of fossil fuel extraction in developing countries. It was unable to find a single example of where the World Bank’s funding for oil, gas and coal extraction had alleviated poverty. The Nigerian example is perhaps one of the best known. Nigeria is estimated to have generated around US$350 billion in oil revenue since 1965.24 However, GDP per capita in 2004 was actually lower than in 1970. There is no question that Nigeria’s oil wealth is not benefiting its majority poor population at all. Christian Aid research has also looked at Angola and Sudan and Kazakhstan, finding that poor countries dependent on oil revenue have a higher incidence of poverty, and that in two cases oil has fuelled ongoing civil war. In all three cases, corruption and a lack of transparency in the use of oil revenues are major stumbling blocks. Christian Aid has repeatedly called for regulations requiring oil companies to publish what they pay to oil-producing countries. Of course, transparency and corruption are not the only issues developing countries are grappling with. It is also necessary that developing countries engage with foreign oil and gas companies on equitable terms and that concession contracts stipulate a fair share of the gains for developing countries for the extraction of their resources. The terms of engagement between companies and state are a growing area of concern, particularly in Iraq, Russia and central Asia, where extremely one-sided contracts are being proposed and implemented.25 This issue is of equal relevance to Bolivia, where there is already a perception that the country is not receiving its fair share of the wealth generated. Given the lack of positive examples in the developing world, there can certainly be no assumption that the extraction of oil and gas reserves will translate into development and poverty reduction. Action is urgently required to reverse this trend, given that any reliance on oil and gas is of course time-bound and resources will eventually run out. From the governments’ perspective, particularly those of developing country governments, it is critical that they focus on transforming a non-renewable source of wealth into productive investment for the future, to help diversify and develop domestic industries.
Oil and gas fiscal regimes
There are many different ways in which governments across the world extract revenue from their oil and gas sectors. Some governments extract revenue by controlling exploration and production themselves through state-owned enterprises. Although it is often assumed that oil and gas extraction is mainly carried out by private companies – particularly the oil majors that we are familiar with – state ownership and control of oil and gas extraction is actually the predominant model. Eighty per cent of the world’s oil and gas reserves are in the hands of state-owned enterprises,26 mainly in the Middle East, with only the remaining 20 per cent of reserves managed by private companies under concession or production-sharing contracts. Other governments ensure that state-owned companies participate as commercial partners in

11
a consortium alongside private companies. The state company provides a percentage of the investment capital as well as directly receiving a percentage of the profits. Where governments grant licenses to private companies to extract oil and gas, they generally demand royalty payments. Royalties are the simplest measure within the sector’s fiscal regime. A company will pay the government a fixed percentage of the total value of oil or gas extracted. Knowing the number of barrels produced and the oil price, this is a simple calculation. It is based on the fact that the country owns the natural (and non-renewable) resource and the company is essentially paying the state for it. Governments will also collect taxes from oil and gas companies. These can include special oil and gas revenue taxes, as well as standard corporation taxes which are paid by all businesses, based on their profits. Companies prefer paying tax to royalties as every tax system will include the ability to take into account the depreciation of assets and the ability to deduct costs. As tax rules in the oil and gas sector are generally extremely complex, companies will also have more scope to use their accountancy expertise to reduce the amount of tax they pay. While some countries prefer to keep royalties high to reflect the country’s share of ownership, this is not always the case, and others rely more on high corporate tax rates to generate revenue (eg Norway) and often include special, supplementary hydrocarbons tax payments. It is also possible to put mechanisms in place that allow for the tax rate to rise if the profitability of production increases. If such a mechanism is not in place it is not unusual for governments to bring in new windfall taxes when oil prices soar. In every country there is one constant – fiscal regimes for the industry often come under review. Any increase in royalties and taxes are of course viewed with much hostility by oil and gas companies, who face significant risk in exploration projects and are subject to oil-price fluctuations. Consequently, companies generally exercise their significant influence to ensure that tax regimes stay stable. UK oil and gas fiscal regime The UK has adapted its oil and gas fiscal regime significantly over the years. These changes have been facilitated by the fact that the UK does not sign long-term contracts with companies and so is able to revise terms, unlike a country like Bolivia. There are no state- owned enterprises involved in joint-venture contracts, so the UK has relied on royalty and tax payments to generate revenue from North Sea oil extraction. The following is a description of the changes to the regime:27 Pre 1982: Companies paid 12.5 per cent royalties, 75 per cent petroleum revenue tax and 33
per cent corporation tax. 1982: The Conservative government abolished royalties on new fields developed after
1982, but royalties continued to be paid on fields developed before 1982. Petroleum revenue tax and the standard corporation tax remained.
1993: The Conservative government cut petroleum revenue tax on existing oilfields
(those developed up to 1993) from 75 per cent to 50 per cent and abolished it completely for fields developed after that date. For new fields after this date there were now no royalty payments and no special petroleum revenue tax. This effectively means that oil companies developing fields after 1993 were able to extract the oil for free, without paying the British state for the extraction of their natural resources. Oil companies would pay only the normal rate of corporation tax that any UK business is obliged to pay. (This rate was 33 per cent but was later reduced from per cent to 30 per cent under the Labour government).
2002: The Labour government introduced a supplementary corporation tax of 10 per cent
on North Sea oil production. Corporation tax on oil and gas production therefore
12
became 40 per cent. At the same time, Labour abolished royalty payments which were still being paid on fields developed pre-1982, so companies that had developed fields early that were still in operation, were actually able to gain from this change.
2005: After a year of crude oil prices averaging US$55 a barrel, in December 2005 the
Labour government doubled the supplementary corporation tax on North Sea oil production. Now, together with the standard corporate tax of 30 per cent , companies pay 20 per cent supplementary tax, a total tax rate of 50 per cent.
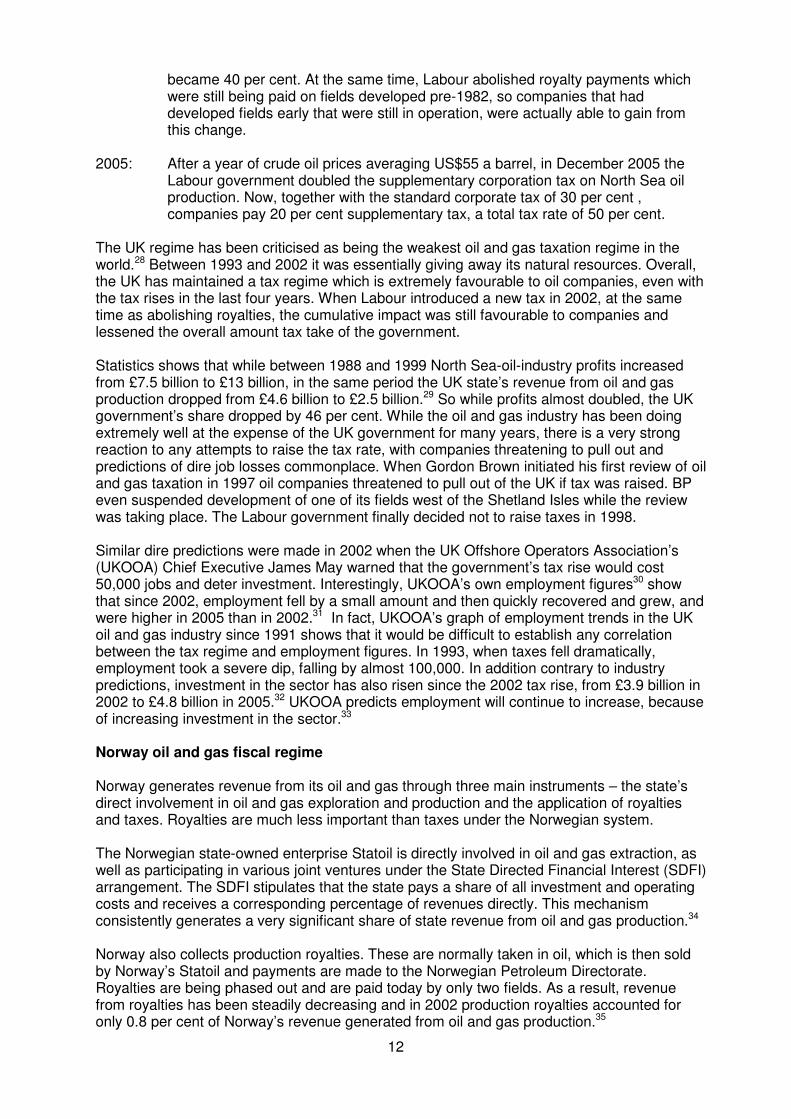
The UK regime has been criticised as being the weakest oil and gas taxation regime in the world.28 Between 1993 and 2002 it was essentially giving away its natural resources. Overall, the UK has maintained a tax regime which is extremely favourable to oil companies, even with the tax rises in the last four years. When Labour introduced a new tax in 2002, at the same time as abolishing royalties, the cumulative impact was still favourable to companies and lessened the overall amount tax take of the government. Statistics shows that while between 1988 and 1999 North Sea-oil-industry profits increased from £7.5 billion to £13 billion, in the same period the UK state’s revenue from oil and gas production dropped from £4.6 billion to £2.5 billion.29 So while profits almost doubled, the UK government’s share dropped by 46 per cent. While the oil and gas industry has been doing extremely well at the expense of the UK government for many years, there is a very strong reaction to any attempts to raise the tax rate, with companies threatening to pull out and predictions of dire job losses commonplace. When Gordon Brown initiated his first review of oil and gas taxation in 1997 oil companies threatened to pull out of the UK if tax was raised. BP even suspended development of one of its fields west of the Shetland Isles while the review was taking place. The Labour government finally decided not to raise taxes in 1998. Similar dire predictions were made in 2002 when the UK Offshore Operators Association’s (UKOOA) Chief Executive James May warned that the government’s tax rise would cost 50,000 jobs and deter investment. Interestingly, UKOOA’s own employment figures30 show that since 2002, employment fell by a small amount and then quickly recovered and grew, and were higher in 2005 than in 2002.31 In fact, UKOOA’s graph of employment trends in the UK oil and gas industry since 1991 shows that it would be difficult to establish any correlation between the tax regime and employment figures. In 1993, when taxes fell dramatically, employment took a severe dip, falling by almost 100,000. In addition contrary to industry predictions, investment in the sector has also risen since the 2002 tax rise, from £3.9 billion in 2002 to £4.8 billion in 2005.32 UKOOA predicts employment will continue to increase, because of increasing investment in the sector.33 Norway oil and gas fiscal regime Norway generates revenue from its oil and gas through three main instruments – the state’s direct involvement in oil and gas exploration and production and the application of royalties and taxes. Royalties are much less important than taxes under the Norwegian system. The Norwegian state-owned enterprise Statoil is directly involved in oil and gas extraction, as well as participating in various joint ventures under the State Directed Financial Interest (SDFI) arrangement. The SDFI stipulates that the state pays a share of all investment and operating costs and receives a corresponding percentage of revenues directly. This mechanism consistently generates a very significant share of state revenue from oil and gas production.34 Norway also collects production royalties. These are normally taken in oil, which is then sold by Norway’s Statoil and payments are made to the Norwegian Petroleum Directorate. Royalties are being phased out and are paid today by only two fields. As a result, revenue from royalties has been steadily decreasing and in 2002 production royalties accounted for only 0.8 per cent of Norway’s revenue generated from oil and gas production.35

13
Norway’s main source of revenue is, therefore, from taxes. Taxes include a corporate income tax of 28 per cent and a special petroleum tax of 50 per cent, as well as a new carbon dioxide tax levied at a rate per cubic metre of gas burned. Taken together these three taxes accounted for 52 per cent of revenue generated for Norway from oil and gas in 2002.36 Chart 1 Share of revenue from oil and gas production Norway 2002
44.0%
2.9%
0.8%
1.7%
19.4%
31.2%
SDFI
Statoil
Royalities
Carbon dioxide tax
Corporate tax
Special petroleum tax
Source: The Pembina Institute37
Conclusion There can be great differences in fiscal regimes for the oil and gas industry and comparisons between alternative oil and gas fiscal regimes are extremely relevant. This is especially true for a developing country like Bolivia which is exporting oil and gas as a primary commodity and getting little benefit from higher value added activities. It has been normal practice for a long time in developed countries to apply a standard business/corporation tax on profits, to include a royalty payment and to also have a high supplementary petroleum tax. Modern petroleum fiscal regimes, however, are changing as companies are seeking to get (and to lock in) better terms.38 Every state must ensure that they find the right balance and that the interests of their population in gaining strong revenue from oil and gas are not neglected.

14
Overview of the oil and gas sector in Bolivia
Economic significance
Bolivia has the second largest (after Venezuela) oil and gas reserves in South America. For Bolivia – unlike Venezuela – natural gas is the most abundant resource and Bolivia’s natural gas reserves are much superior to oil reserves. Since privatisation in 1997 there have been significant discoveries of new reserves – between 1997 and 2003 gas reserves grew at an average annual rhythm of 55.8 per cent.39 Given this quantity, Bolivia has around five times more natural gas than is needed to meet all current domestic and export demands over the next 20 years, and so has substantial capacity to increase its future exports.40
Bolivia’s oil and gas sector benefits from its location in the heart of South America, bordering countries such as Brazil and Argentina, that have large markets for natural gas. In addition, the gas pipelines between Bolivia and Brazil and Argentina makes this region of the continent attractive to investors.
The oil and gas sector is of growing importance to Bolivia’s national economy. In 1998 it contributed 1.91 per cent of the country’s GDP. This had grown to 5.92 per cent by 2004.41 The growth rate of the oil and gas industry (23.76 per cent) also far exceeded the growth rate for Bolivia’s GDP in 2004 (3.58 per cent).42 Bolivia has also seen significant increases in its oil and gas exports. Natural gas is particularly sought after as the world searches for cleaner and cheaper alternatives to oil, and Bolivia has established a fruitful export relationship with Argentina and Brazil. The country signed its first contract to sell natural gas to Argentina in 1968, with sales taking place between 1972 and 1999 and resuming in 2004.43 Brazil, however, is currently Bolivia’s most important export market for natural gas. Negotiations between the two countries have taken several decades and developing the necessary infrastructure has been a key challenge. However, decisions were finally taken before privatisation took place and contracts were signed in 1996. Graph 1 Exports of natural gas
Value of natural gas exports
0
200
400
600
800
1,000
1,200
1999
2000
2001
2002
2003
2004
2005
Mil
lio
ns o
f U
S$
Value
Source: YPFB
As this graph demonstrates, total exports of natural gas have experienced a steady growth rate. Exports have increased 2,762 per cent in value and 854 per cent in volume between 1999 and 2005.

15
Prices for natural gas have been an area of difficulty, as Bolivia has historically been providing gas to its richer neighbours at very low prices. A renegotiation of price has already taken place with Argentina and negotiations with the Brazilian government are underway. Prices for natural gas have been steadily increasing, linked to the general trend of rising oil prices, but mainly driven by the surging demand for alternatives to oil as a source of energy. However, the growth of Bolivia’s gas exports continues to be challenged by the general difficulties surrounding gas sales. As gas is not a commodity and cannot be sold in the same way as oil (straight out of the well, in the future, from the ship, etc) its prices cannot be subjected to the same highs. In addition, the trade in gas is much more long term. Export deals are often in the region of 15-20 years, given the huge investment in infrastructure to pipe the gas to the export market, or the costs to construct the alternative (a liquefied natural gas (LNG) plant).
In terms of volumes, oil exports are much smaller than those of gas, as almost all crude oil produced in Bolivia is used domestically. Bolivia produces ‘light oil’, with chemical characteristics which means little diesel can be produced from it. The small amount of oil exports is therefore off-set by diesel imports. Oil exports, however, are growing, as oil production is a by-product of gas extraction in Bolivia. Oil exports are expected to continue growing if gas production expands. The main export destinations are the US, Brazil and Argentina, with Chile figuring intermittently and Paraguay also buying small volumes. The US was the lead importer of Bolivian oil in 1999, though Brazil has since emerged as the key export market: Graph 2 Value of oil exports
Value of oil exports
0
20,000
40,000
60,000
80,000
100,000
120,000
140,000
160,000
180,000
200,000
1999 2000 2001 2002 2003 2004
Th
ou
sa
nd
s o
f U
S$
Value of oil exports
Source: YPFB
As this graph shows, oil exports have grown by 528 per cent (in value) between 1999 and 2004, mainly driven by the increasing demand from Brazil. In 2004, oil and gas exports generated over one-half of total export earnings.44 Although the volumes of oil extracted are small, given the high prices, the Bolivian government often makes more from royalties on oil than it does on natural gas. Though oil and gas production is growing significantly it is also recognised that Bolivia faces a range of key challenges, the main one being its gas-marketing opportunities. Currently, Brazil and Argentina are Bolivia’s only markets for natural gas exports. Increasing exports of natural gas depends on the construction of new pipelines or liquefied natural gas (LNG) terminals to ship bottled gas to distant markets. In the past, moves to do so have been opposed by the population,– with whom Bolivia has historic disputes. There is also a general perception that Bolivia has not benefited from the extraction of its natural resources. However, negotiations continue with Venezuela to provide Brazil, Argentina and other countries in the southern cone with gas and oil over the next decades and an agreement to increase sales to Argentina has

16
been reached. An agreement has already been signed to build a pipeline, with Venezuelan finance, to supply both Paraguay and Uruguay with Bolivian gas.
The leading companies involved in oil and gas extraction in Bolivia include the Brazilian state-owned enterprise Petrobras which increased its share of natural gas reserves from 33 per cent in 2000 to 45 per cent in 2005. It is followed by Total Exploration and then by Maxus (Repsol).45 According to 2005 figures, the same three companies dominate in oil, with Petrobras leading, followed by Maxus (Repsol) and Total Exploration.46 British companies BP and BG Group have smaller shares of the market, with BP having a three per cent share of natural gas production and five per cent of oil production in 2005 and BG Group with a share of seven per cent of gas production and eight per cent of oil production.47
The impact of the sector on Bolivia’s balance of payments
A large presence of foreign investors will have a notable impact on a developing country’s balance of payments. Foreign investors in oil and gas are no exception. Although they will bring in significant export earnings, they also have a high-import propensity and will remit their profits, both of which imply significant capital outflows from Bolivia. Although these drawbacks are well recognised there have been few attempts to quantify the impact foreign investment has had on developing countries’ national accounts. It is still common practice to quote export earnings as an indicator of success and to ignore capital outflows. However, it is possible to estimate this impact if data is collected on exports, imports and profit remittance. As mentioned above, exports of oil and gas from Bolivia have increased significantly since privatisation. The table below shows the value of oil, gas and liquid petroleum gas (LPG) exports for our period of reference: Table 1 Export earnings 1999-2004
Oil volume In thousandsof barrels
Oil value In US$ Millions
Gas volume MMPC
Gas value In US$ Millions
LPG volume In metric Tonnes
LPG value In US$ Millions
1999 1,730 27.5 36,676 33.5 18,330.2 2.79 2000 1,200 36.4 74,829 120.4 24,227.5 5.71 2001 1,605 47.3 131,463 227.5 20,063.8 5.06 2002 2,546 65.2 136,607 209.7 2003 2,907 95.8 181,286 363.2 2004 3,828 172.5 279,597 (p) 591.4 Total 444.7 1,545.7 13.56
Source: YPFB and Bolivian Central Bank
The total value to the country of export earnings from oil and gas in this period is US$2,003.96 million. As a capital-intensive industry that needs access to a variety of high-tech equipment, oil and gas companies have no alternative but to import much of the machinery and equipment they use. We were unable to access the complete import data for the oil and gas sector. However, Bolivia’s national statistics institute (INE) did provide us with figures for the imports of some of the inputs used by the oil and gas industry, though unfortunately we only have this limited data for the years 2001 to 2005.

17
Table 2 Value of imports 2001-2005 US$ dollars
2001 2002 2003 2004 2005 Pipes, tubes for pipelines
26,493,767 16,828,331 14,679,506 18,547,761
Machinery and tools for drilling
4,956,341 10.536,509 9,109,486 6,034,888
Steel and iron products
127,282,743
Total 31,450,108 127,282,743 27,364,840 23,788,992 24,582,649
The total of these imports in this period is therefore US$234,469,332. This is likely to be a significant under estimation as we can’t include several product groups and this estimate corresponds to only five years. In addition, profit remittance is recognised as a drawback of foreign investment, as it also contributes to the outflow of foreign exchange from developing countries. We can estimate the total annual profit remittance of the oil and gas industry (upstream and downstream) in Bolivia, using the figures gathered by the National Tax Service (SIN) for the taxes paid on the remittance of profit, given we know the remittance tax is 12.5 per cent: Table 3 Profit remittance from Bolivia’s oil and gas sector Bolivianos and US dollars 1999 2000 2001 2002 2003 2004 Remittance tax (bolivianos)
25,464,745 35,144,644 54,902,943 45,786,453 100,764,433 165,457,815
Remittance tax (dollars)
4,244,124 5,491,351 8,038,498 6,104,860 13,120,369 20,812,304
Remittances (dollars)
33,952,992 43,930,808 64,307,984 48,838,880 104,962,952 166,498,432
Source: National Tax Service (SIN); Bolivian Central Bank for average annual exchange rates
Using these annual estimates the total profit remitted from Bolivia by companies in the oil and gas sector was US$462,492,048 over our six year reference period – an average of US$77 million per year.48 Therefore, taking into account both the inflows and outflows that are linked to the oil and gas sector, the positive impact on Bolivia’s national account of export earnings of US$2003.96 million are reduced by $696.96 million. The real benefit for Bolivia’s balance of payments is actually US$1,307 million. These findings help us to put into perspective the real benefit the oil and gas sector has for Bolivia’s national account. However, these calculations will not be taken into account in the cost-benefit analysis which this report later presents. This is because the cost-benefit analysis is looking at the real contribution and impact on the Bolivian economy, investigating the direct economic benefits to workers and to the Bolivian Treasury, and the costs, such as subsidies, that the government is paying. Although profit remittance is often classified as a ‘cost’ of

18
foreign direct investment – because it implies money flowing out of developing countries – under our methodology we cannot classify it as a direct cost nor as revenue foregone to the government, workers or local businesses. What it does represent, however, is a form of opportunity cost to the country. While it is unrealistic to think that companies don’t need to remit a certain percentage of their profit, it is strongly in Bolivia’s interest to keep as much money in the country’s banks as possible. As is typical of all developing countries, Bolivia’s savings rate is very low. High (and growing) rates of profit remittance therefore aggravate Bolivia’s ability to build up banks’ reserves, and provide much-needed investment and working capital to local businesses.
Hydrocarbons and poverty
Bolivia’s poverty levels are extremely high and the country stands out in South America as one with the greatest need. Bolivia’s GDP per capita in 2004 was US$974, while in Peru this figure was US$2,483 and in Brazil US$3,375.49 Of Bolivia’s 9.2 million population 63 per cent live in poverty.50 Poverty levels are much higher in rural areas where around 91 per cent are estimated to live in poverty.51 Bolivia is also marked by high ethnic diversity and high-income inequality. The mainly indigenous, rural population depends to a large extent on small-scale agriculture. Agriculture employs 60 per cent of Bolivia’s workforce in mainly low value-added activities on small farms in the highlands and valleys. More dynamic sectors, such as manufacturing, industrial agriculture concentrated in the lowlands and oil and gas, employ only a small fraction of the workforce, while they contribute heavily to the GDP and to the country’s exports.52
Within Bolivia there are four departments that have significant oil and gas reserves – Tarija, Santa Cruz, Cochabamba and Chuquisaca. For natural gas before 1999, Santa Cruz was the most important department, but in 2005 Tarija became the leading location, thanks to new operations carried out in the Sabalo, San Alberto and Margarita fields. Tarija also now leads in oil production.53 The following are the percentages of the population with unsatisfied basic needs, with oil- and gas-producing zones highlighted: Table 4 Percentage of population with unsatisfied basic needs (2001)
Region 2001 Potosí 79.1 Beni 76.0 Pando 72.4 Chuquisaca 70.0 Oruro 67.8 La Paz 66.2 Cochabamba 55.0 Tarija 50.8 Santa Cruz 38.0
Source: INE-UDAPE (2002) In six out of nine departments in Bolivia more than 65 per cent of the population are unable to satisfy even their basic needs. Santa Cruz, Tarija and Cochabamba are the three least-poor departments in Bolivia. Of the four departments with significant reserves, Chuquisaca is the poorest. Given the widespread poverty and inequality in Bolivia, it is imperative for central government to ensure oil and gas revenue is not channelled primarily to the departments where they are produced, but that they are used instead to benefit the predominantly poor communities throughout the country.

19
Bolivian’s access to fuel products
Although Bolivia is an energy-rich country there can of course be no assumption that it is fulfilling its own energy needs cheaply, or that poor communities have access to cheap energy. Often developing countries export oil in its raw form and don’t have the capacity to refine and then sell it locally. So although they are resource-rich they have to import their fuel. Bolivia’s case is different in that it has two oil refineries, through which most of its oil is sold onto the domestic market. Diesel, however, is imported, as Bolivian oil cannot produce diesel. LPG is also a key product, as gas is the local population’s main fuel for cooking. As there are very few homes connected to a domestic gas-distribution network families have to buy LPG which is bottled in Bolivia. The cost of fuel is a major concern for many Bolivians. Domestic fuel prices in Bolivia are set in accordance with international prices, and so bear no relationship to the local cost of production, refining or bottling in Bolivia. The final price of fuel products sold in the country, depends on the international reference price, the margins for all the businesses involved in the supply chain and the special hydrocarbons consumer tax (the IEHD), which was brought in with privatisation. This formula, of course, means that fuel is not at all cheap in Bolivia, and as a result of the inability of consumers to pay high prices, a regulatory body sets a ceiling for consumer prices. This means the Bolivian government has to step in to provide a subsidy. The government firstly ensures that companies are paid for the energy they sell locally, in line with the international market price. Then the government provides a subsidy to ensure that consumers are not charged above the ceiling price set. Up until 2000 this was implemented through a system whereby the final price charged was fixed, the consumer tax was fixed and as international prices rose and fell the government took on debt with the companies, which it would pay back on a rolling basis. In 2000 this changed and the government no longer took on debt with the companies but adjusted the level of the tax charged (IEHD) to ensure the fuel price did not pass the agreed ceiling for consumers. Under either of these systems it is clear is that the Bolivian government is paying a subsidy on the sale of fuel in Bolivia to ensure two outcomes – firstly that foreign companies are paid in line with international market prices and secondly that poor Bolivians have access to energy. The interests of the companies and Bolivian consumers are diametrically opposed, and the government has to pay for this contradiction. The cost of paying the fuel subsidy is therefore taken into account in this study as a direct cost of the privatisation policy. Graph 3 Fuel prices on the local market
Fuel prices on the local market
0
1
2
3
4
5
6
1998
1999
2000
2001
2002
2003
2004
2005
2006
Pri
ce i
n b
oli
via
no
s
Gasolina especial
Gasolina premium
Diesel
LPG
Source: Superintendencia de Hidrocarburos (Prices of gasoline and diesel are per litre and per kilo for LPG)

20
As this graph shows, fuel prices are going up in Bolivia. Diesel went up by 58 per cent between 1998 and 2006 and LPG by 56 per cent. Although these are steep rises, the government did freeze the price of these products for three years. As energy prices rise worldwide prices in Bolivia are inevitably pushed up. The Bolivian government’s capacity to subsidise fuel costs is limited, so rising costs are inevitable. This of course impacts most negatively upon the poor and rising prices have led to civic unrest in the past. Apart from the issue of prices and government subsidies for fuel, a key issue for Bolivia is the availability of fuel. Since privatisation there have been various periods of scarcity of fuel on the local market. In June 2005, there were reports of the closing off of the pipelines to La Paz, preventing natural gas, diesel and gasoline from being delivered to La Paz, El Alto and surrounding areas.54 In September of the same year, LPG production was insufficient for internal market demand and this fuel was in short supply for several weeks. In this case, the companies’ responses were suitably vague, with Repsol announcing to the press that ‘it is impossible to produce more than we are currently doing, because we are not in a position to do so’.55 It has not gone unnoticed by Bolivians that periods of scarcity tend to coincide with periods of political unrest and change.

21
Privatising Bolivia’s oil and gas sector
YPFB before privatisation
Bolivia began its first oil and gas explorations in the late 1800s in the departments of Cochabamba, Tarija and Santa Cruz. In 1922 Standard Oil Company of New Jersey was involved in drilling, but in 1936 the Bolivian government revoked its concessions. At the same time the state created the Bolivian National Petroleum Company, known in Bolivia as YPFB to manage the country’s oil and gas reserves. For 60 years, up until privatisation in 1996, YPFB was a fundamental pillar of the Bolivian economy and the country. YPFB’s activities included exploration and production of natural gas, oil and LPG, refining, transport, storage and distribution, including export. Where necessary, YPFB would enter into contracts with foreign companies who would provide technical services As YPFB was the principal productive company in Bolivia it generated important resources for the Bolivian Treasury. When Bolivia entered its period of financial crisis and hyperinflation a policy was introduced to ensure that YPFB transferred 65 per cent of its income to the treasury. Between 1985 and 1996 YPFB’s revenue constituted the primary source of income for the state.56 This was seen as a temporary measure but it did of course take its toll on YPFB which was unable to use its own capital to invest in exploration, increased production or improving transport and distribution of oil and gas products to new markets. Pre-privatisation YPFB was routinely described as an inefficient enterprise. However, while YPFB might have had less capacity than western multinationals, it is also clear that its problems in the late 80s and early 90s were closely linked to Bolivia’s financial crisis and the need to support the public budget. This meant YPFB’s hands were tied and the company was not able to use its income in a productive way to increase and improve gas and oil exploration and production.
Preparing for privatisation
Privatisation laws were passed in Bolivia as part of its ongoing structural adjustment reforms, which imposed conditions on aid and debt. Before the main state enterprises were privatised under the Sanchez de Lozada government, a range of smaller public enterprises (hotel businesses, dairy firms etc) had already been privatised under the preceding government of Jaime Paz Zamora. Those were of course the days when a raft of privatisations were sweeping Latin America, Bolivia included. One of the central reasons given for privatisation in Bolivia was that state-owned enterprises were inefficient and represented a significant burden on state budgets.57 YPFB was often presented as a company on the verge of bankruptcy, producing losses on a consistent basis.58 However, it is clear that any problems YPFB had were mainly linked to the demands of a cash-strapped Treasury and the charge of inefficiency was disputed. The Economist described YPFB as a company ‘firmly in the black’.and questioned the merits of the reform, noting that the Treasury would lose a major source of revenue.59 The World Bank described the need to ‘improve the efficiency of monopolistic public enterprises’ and to ‘unbind the productive and export potential’ of the hydrocarbons sector.60 Deregulation and restructuring of the sector was designed to make it attractive to potential investors. One of the key initiatives proposed was a new hydrocarbons law which would provide ‘internationally-competitive fiscal terms’.61 It was assumed that these measures would attract more investment and expand the industry’s contribution to the national economy. The World Bank and the IMF closely followed the process of preparing for privatisation. The Bank provided the bulk of the loans to facilitate the reforms and evaluated progress every step

22
of the way.62 During 1996 delays occurred in the privatisation schedule, given the public scrutiny the process was coming under. At this point the IMF declared Bolivia non-compliant under its agreement, and disbursements under the Enhanced Structural Adjustment Facility (ESAF) were stopped.63 Similarly, the World Bank froze its disbursements to support Bolivia’s balance of payments. While privatisation was certainly a condition that Bolivia had to comply with, it is also true that the Sanchez de Lozada government welcomed these reforms without a hint of complaint. A Ministry of Capitalisation was created to manage the process, and there was no objection from the Bolivian government at the time (though the same cannot be said of opposition political parties). The government was convinced that privatisation would bring investment, technology and a significant increase in production, and that this would ensure that their new sales contract with Brazil was honoured.
While the Bolivian government was very clearly pro-privatisation, the Bolivian people were not immediately convinced. The word privatisation was not used publicly in Bolivia, and instead the reform was described as ‘capitalisation’. This was presented as a new model of privatisation and was promoted as ‘something completely new in the world, something that Bolivia would lead the way on and which other countries would follow’.64 The new model proposed that Bolivia’s public enterprises (oil and gas, electricity, railways, telecommunications, aviation) would be split into two parts with 50 per cent of the shares being sold to private companies, who thereafter gained management control. The other 50 per cent went into a capitalisation fund to be invested and used to provide dividends to Bolivians on retirement. The Bolivian public were told of the ample benefits that privatisation would bring. ‘The government told us that instead of one YPFB, we would have 2 or 3 or more, and that privatisation would create at least 100,000 jobs. They assured us that Bolivia would still be in charge but we would have new partners who would bring with them millions of dollars and new technology’.65 The capitalisation process was given significant press coverage in Bolivia and evoked huge national debate. The privatisation of YPFB, particularly, became a controversial issue, given the enormous sensitivities evoked by the sale of this strategic sector. Resistance to the process came particularly from the national unions and public sector workers, but also from universities, the national indigenous people’s confederation and some opposition parties.66 The national workers’ union organised some protest marches67 and some YPFB workers went on hunger strike.68 However, the business community backed the measures and there was never any doubt that the government was going to go ahead. In the end the privatisation of YPFB proved to be the most difficult. It was delayed several times, but the reform was finally completed in December 1996, and foreign oil and gas companies began operations in 1997. Of course privatisation needed a new set of laws to support the new framework. The previous government had already passed an investment law stipulating the legal framework for foreign investment.69 This included the principle of national treatment – that is foreign investors would receive the same treatment as national investors, operating under the same conditions, with no specific restrictions or targets or performance standards. The free movement of capital is also enshrined in this law and therefore there can be no restrictions on capital flowing into or out of the country.
The sale of YPFB
In the case of YPFB, its operations were split into three companies (Chaco, Andina and Transredes) which were to be sold off. The essence of the ‘capitalisation’ in Bolivia – as opposed to privatisation – is that only 50 per cent of the companies were sold off to private investors, the idea being that Bolivia retained a direct interest in the companies’ activities and profits. Therefore, 50 per cent of each of these three entities was offered for sale and YPFB

23
transferred the other 50 per cent to a capitalisation fund which was created especially to receive dividends from the ‘capitalised’ companies. These dividends were then intended to be invested and administered as pension funds for all Bolivians aged 21 by 31 December 1995. The interesting aspect of the deal, however, is that the investors did not have to pay 50 per cent of the market value of the company they purchased to the Bolivian Treasury. Instead, companies were allowed to use the amounts as investments into oil and gas exploration and production. The diagram below illustrates these aspects of the sale:
The value of the three companies was an issue of much debate in Bolivia and there were various suggestions that YPFB was under valued, both from the perspective of the reserves it had proven and the potential reserves and market opportunities in the region.70 There was certainly little faith in the government’s management of this issue in Bolivia. The popular phrase applied at the time was that the government was selling off its assets for the price of una gallina muerta – a dead chicken.71 Regardless of the public debate, investors finally ‘purchased’ their 50 per cent of the three new companies created from YPFB at the prices listed in the table below:72 Table 5 The value of YPFB - In US$
Company Investor Value of asset Empresa Petrolera Chaco Amoco
US (Later taken over by BP)
US$306,667,001
Empresa Petrolera Andina YPF-Perez – Pluspetrol Argentina (Later take over by Repsol)
US$364,777,021
Transredes (transport) Enron – Shell US – Netherlands
US$263,500,000
TOTAL US$834,944,022
Investment into companies
50 per cent of market
value
50 per cent of share
value
Trust fund
Pension fund administrators
Transfer to Bolivians

24
It is impossible to say by how much YPFB was undervalued. However, privatisation of Argentina’s state oil company, YPF, which began in June 1993 and ended with a sale to Repsol in 1999, shows very different results. The Argentinean state raised US$3.04 billion in 1993 and US$15.4 billion in 1999.73 The terms of the deal between the Bolivian government and the investors were not particularly advantageous for the Bolivian government, as the companies were not required to pay for the assets they were acquiring. They gained complete management control and although they were obliged to pay 50 per cent of profits into the capitalisation fund, they were at liberty to decide what level of profits to reinvest and what level to declare as dividends each year. While it is not that uncommon for governments to sell off state assets on the cheap, it is rare that deals actually result in the Treasury receiving no payment whatsoever, especially for an asset as important as a state oil and gas company.
Managing the sector
A new institutional framework was needed in Bolivia to implement privatisation, one which would define the rules for private investors, and specify the role of the State as regulator. In October 1994 a law established the regulatory institutions that would supervise the activity in each privatised sector. In oil and gas this is the Superintendencia de Energia e Hidrocarburos (SIRESE).74 This regulates downstream activity and the supply of fuel products to the local market.
In April 1996 a hydrocarbons law was approved, which created a general framework for exploration and production, dealing with the method of classification and management of concessions, the contracts investors would sign and how the sector would be regulated.75 It stipulated that YPFB could only be involved in exploration and extraction through signing concession contracts with companies, thereby expressly prohibiting the state taking an active role in production. The concession contracts signed with foreign companies made clear that they are free to extract, transport, refine and sell hydrocarbons, while stipulating the royalties and taxes the Bolivian government would take. Companies were simply obliged to register with the regulator to operate in Bolivia. YPFB’s role was therefore strictly limited and constrained its ability to develop the sector in line with national economic development (or industrialisation) objectives. One of the most controversial issues following the creation of this new hydrocarbons law was the classification of oil and gas fields in Bolivia, which are defined as either ‘existing’ or ‘new’. This classification is outside the usual technical terminology used in the oil and gas sector (which refers to proven, probable and potential reserves). A hydrocarbons law approved in June 1996 made some amendments to the framework April law, stipulating that to be classified as ‘existing’ the reserves had to be officially certified. Certification is a procedure which has to be carried out by one of only three specialist firms in the world - a service for which Bolivia pays a high cost. It is often claimed that the reserves actually discovered by YPFB were much higher than the reserves which were classified, at the point of privatisation, as ‘existing’.76 It is an issue which has never been fully resolved. The certified reserves of YPFB at the point of privatisation are officially quoted as being 5.69 TCF.77 What is clear is that this classification was created to offer an additional incentive to investors to encourage the exploration and development of new reserves. The main implication of the classification was that it significantly lowered the level of royalties payable by companies on new reserves. This decision would have a huge impact on the state’s take in the future as by 2002 only three per cent of Bolivian reserves were classified as ‘existing’ and most production occurred under a fiscal regime which was much more favourable to companies.78

25
The private management of the oil and gas industry became a reality in April 1997 when the first two privatised companies – Chaco S.A. and Andina S.A – began their operations. YPFB was no longer an operator and was limited to the supervision and administration of contracts with investors. The Bolivian government then pursued signing concession contracts with a variety of oil and gas companies, with the result that the majority of foreign companies now operating in Bolivia are exploring and producing new reserves. Before privatisation, YPFB was making large transfers to the Bolivian Treasury and its investment levels were constrained. However, there was still some investment going on, averaging around US$102 million per year between 1990 and 1996.79 Following privatisation in the sector, investment levels significantly increased, reaching an annual average of US$374 million over the nine years after privatisation: Chart 2 Foreign investment in the exploration and production of oil and gas
Foreign investment in exploration
and production
0
100
200
300
400
500
600
700
1997
1999
2001
2003
2005
Millio
ns
of
US
$
Production
Exploration
Source: YPFB
Investment has been decreasing steadily since 2000. This is likely to be due to a mixture of factors, including the lack of expansion of natural gas export markets, particularly due to the failure of the proposed LNG project which would have allowed export to the US and Mexico, but also linked to the uncertainty in the tax regime and management of the sector.
Bolivia’s new fiscal regime for oil and gas
Bolivia operates a royalties and taxes fiscal regime for its oil and gas sector. Before privatisation YPFB was mandated to pay 31 per cent of its production value in royalties to the Bolivian Treasury. However, as a state company, the Treasury was also able to take a higher value than 31 per cent and generally also requested a sum based on YPFB’s higher-than-normal profits. During Bolivia’s economic crisis in the 1980s this transfer from YPFB was critical to sustaining the Treasury. Between 1985 and 1996 the state received the equivalent of a 65 per cent of YPFB’s resources and between 1990 and 1996 the average annual transfer to the Treasury was US$366 million.80 Private companies active in Bolivia pre-privatisation – working in association with YPFB – were subject to a 50 per cent royalty on the value of their production and to a corporate tax rate of 40 per cent. The royalties and taxes regime for the oil and gas sector was revised by the Sanchez de Lozada government with privatisation. The most important element of the new regime was the classification of reserves as either existing or new. Existing reserves were defined as those that are already in production by the 30 April 1996. Reserves classified as ‘new’ were subject to much lower taxes than existing reserves.
26
Royalties
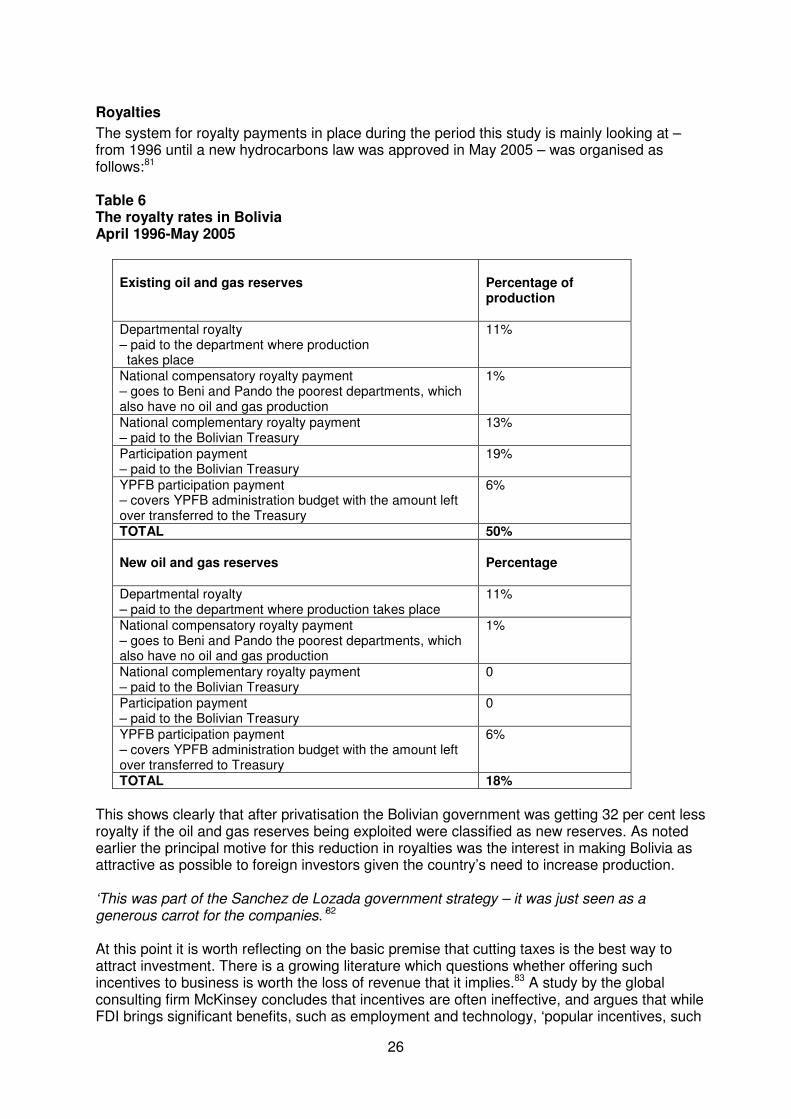
The system for royalty payments in place during the period this study is mainly looking at – from 1996 until a new hydrocarbons law was approved in May 2005 – was organised as follows:81
Table 6 The royalty rates in Bolivia April 1996-May 2005
Existing oil and gas reserves
Percentage of production
Departmental royalty – paid to the department where production takes place
11%
National compensatory royalty payment – goes to Beni and Pando the poorest departments, which also have no oil and gas production
1%
National complementary royalty payment – paid to the Bolivian Treasury
13%
Participation payment – paid to the Bolivian Treasury
19%
YPFB participation payment – covers YPFB administration budget with the amount left over transferred to the Treasury
6%
TOTAL 50% New oil and gas reserves
Percentage
Departmental royalty – paid to the department where production takes place
11%
National compensatory royalty payment – goes to Beni and Pando the poorest departments, which also have no oil and gas production
1%
National complementary royalty payment – paid to the Bolivian Treasury
0
Participation payment – paid to the Bolivian Treasury
0
YPFB participation payment – covers YPFB administration budget with the amount left over transferred to Treasury
6%
TOTAL 18%
This shows clearly that after privatisation the Bolivian government was getting 32 per cent less royalty if the oil and gas reserves being exploited were classified as new reserves. As noted earlier the principal motive for this reduction in royalties was the interest in making Bolivia as attractive as possible to foreign investors given the country’s need to increase production. ‘This was part of the Sanchez de Lozada government strategy – it was just seen as a generous carrot for the companies.’82 At this point it is worth reflecting on the basic premise that cutting taxes is the best way to attract investment. There is a growing literature which questions whether offering such incentives to business is worth the loss of revenue that it implies.83 A study by the global consulting firm McKinsey concludes that incentives are often ineffective, and argues that while FDI brings significant benefits, such as employment and technology, ‘popular incentives, such

27
as tax holidays, subsidised financing or free land, serve only to detract value from those investments that would likely be made in any case’.84 Certainly, some developing countries that do not offer incentives do not suffer a shortage of investment. Botswana, for example is regarded as a prime African mining investment country though it does not have a particularly favourable tax regime. The decision to lower the fiscal burden in Bolivia of course meant that the revenue generated was much lower overall. However, it was also the case that the percentages paid on existing reserves that went directly to the Bolivian Treasury were the ones that were not included for new reserves. This point is important, given that to even minimally meet poverty and inequality reduction goals, the Bolivian Treasury needs to be in control of resources centrally, rather than seeing the majority of natural resource earnings going directly to the richest departments of the country. Given the percentage of reserves produced that are classified as existing has been decreasing, the reliance the Treasury had on oil and gas royalties – and the potential for poverty reduction and development across the nation – suffered a setback with this change in the classification of existing and new reserves.
Taxes
Oil and gas companies also pay various forms of direct taxes. The following table is a list of the most important taxes that are levied on oil and gas companies. It should be noted that the first two affect all businesses operating in Bolivia, while the third tax is a special oil and gas tax: Table 7 Overview of taxes
Type of tax Explanation Rate IUE Corporation tax
This is equivalent to a standard corporation tax and is levied on the companies’ net profits. Net profits are arrived at when companies have deducted their operating costs, their royalty payments, as well as other taxes they have paid locally (eg local land taxes). They can also of course take into account the depreciation of their assets.
25%
IURE Tax on profit remittance
This is also a tax on profits, additional to the standard corporation tax described above. It is designed to discourage companies from sending profits overseas and the rate was set based on the assumption that companies would remit half of their profit and so seeks to double the corporation tax in cases where profits do not stay in the Bolivian economy.
12.5%
Surtax This is a special supplementary tax particularly for the oil and gas industry. This was to be applied to extraordinary profit levels which can occur if prices are high and/or where production volumes rise significantly. It was expected that oil and gas companies might make these ‘extraordinary profits’ in the San Alberto, San Antonio, Margarita and Itau fields. This higher tax rate was intended to compensate the Treasury for losing 32 per cent of its royalty payments under the classification of new reserves.
25%
There are also some local taxes in Bolivia, such as property taxes and municipal taxes. These taxes are not specific to the oil and gas industry and are also generally very small so will not be considered here.
Sales taxes
In Bolivia there is both a value-added tax (IVA) of 13 per cent and a transaction tax (IT) of three per cent which is a tax on all purchases. These are not specific to the oil and gas sector

28
but apply to all purchases in the country. These taxes are paid by companies and consumers alike, but companies are able to deduct these taxes from their total revenue, reporting them as costs. Therefore IVA and IT are sales taxes on consumers only. There is also a sales tax which is only applied in the oil and gas industry. It is the Impuesto Especial a los Hidrocarburos y sus Derivados (IEHD) which was brought in by the new tax law in 1994 as part of Bolivia’s structural reforms. It is paid on the consumption of fuel. It is, therefore, not paid by the oil companies but by Bolivians when they buy fuel or when they buy a bus or air ticket. The importance of the sales tax on fuel products in Bolivia should not be underestimated. The law imposed this new tax with the intention that it would substitute for the loss of earnings to the Treasury by the privatisation of YPFB. Before privatisation the World Bank made very clear that a stable tax regime for upstream activities (companies involved in oil and gas extraction) was paramount, while changes could be made freely to the sales taxes borne by consumers.85 In addition, in the same report, the World Bank makes clear that the fiscal regime is being designed so that the sales taxes on fuel products become the major earner for the Bolivian Treasury. It makes very clear its preference for high-sales taxes and a lighter tax and royalty burden on companies. Consideration of a higher tax on companies’ production is quickly dismissed as a measure that would be likely to ‘make Bolivia less attractive to potential private investors’. On the other hand, the bank expressed approval for increasing the VAT rate as the most efficient way of increasing revenue from the sector, with the second-best alternative being to increase the special sales taxes on diesel and gasoline. Such thinking is of course in line with the positions which both the World Bank and IMF have consistently taken promoting VAT as an alternative to other tax handles, such as tariffs applied to imports. Such moves are inherently regressive in nature hitting low income households hardest.
Analysis of post-privatisation fiscal regime
At this point it is worth reflecting on how Bolivia’s tax and royalty regime compare to other oil and gas fiscal regimes. The above analysis shows that following privatisation Bolivian royalty rates were not particularly high compared to other fiscal regimes. Bolivia also had a fairly average corporation tax and a special petroleum tax – the Surtax – which would be charged on top of normal business taxes. In Norway, and formerly in the UK, this special tax was a major source of revenue to the state. However, in comparison to Norway’s 50 per cent and the UK’s 75 per cent (charged in the 1970s and 80s), Bolivia’s 25 per cent Surtax is fairly modest. This could immediately have been a cause for concern, as the royalty rate of 18 per cent on new reserves would mean a fall in revenue for the state, which had to be compensated for. However, Bolivia’s fiscal regime – on paper – did not appear to be terribly weak in 1996. It would not have been unreasonable to assume that the country was in a position to receive a sufficient level of revenue, relative to the value of its natural resources.
Operating in Bolivia
Apart from the fiscal regime, it is also important to assess Bolivia’s attraction for foreign investors, from an operational standpoint. The level of return that a company can expect on its investment will, to a large extent, depend on the operating costs in the host country. There are two cost elements of costs. Firstly, the company will incur a unit cost of production. This is the cost incurred to produce a barrel of oil, and includes operating costs, maintenance costs, machinery and equipment costs. Companies will also incur exploration and development costs. These are the costs incurred in prospecting and drilling to find new reserves, an exercise which can, of course, be unsuccessful if dry wells result. These costs are traditionally higher than production costs.
Production costs in the oil and gas sector vary greatly across the world, and oil companies are generally secretive about how they are determined. Companies may handle them through off-shore transactions, where there is plenty of opportunity for costs to be manipulated and

29
transfer pricing to occur. As such, there is no general global agreement on the cost of production in different countries and the following summary only provides estimates based on the minimal data available. Iraq, Kuwait, Saudi Arabia and Venezuela are all known for their low production costs (between US$1.5 and US$2 a barrel), while China is known for its high production costs (around US$6.9 a barrel).86 Unit costs of production in Latin America are generally fairly low (excluding Brazil’s offshore production). For Mexico it is US$2 a barrel, for Ecuador US$2.5 and for Argentina US$2.6 a barrel.87 Taking into account production, exploration and development costs, the Middle East has the lowest total costs. For most companies production costs are almost always lower than international prices, unless the oil price falls to around US$10 a barrel. With the current high prices revenues are of course extremely high. An analysis of production costs in Bolivia was completed in 2003 by Juan Carlos Virreira Mendez, the Presidential delegate charged with reviewing the privatisation process.88 The average unit cost of production in Bolivia was found to be US$3.63 per barrel. Costs ranged from US$0.97 to the most expensive being US$5.54. The four companies with the lowest production costs were Chaco at US$0.97, Andina at US$1.00, BG Group at US$1.55 and Repsol at US$2.10. Virreira compared these costs to the production costs of 200 companies worldwide. The average of these companies was found to be US$5.60 per barrel. There is no doubt, therefore, that Bolivia has low production costs for this sector globally, though it is by no means startling in the Latin American context. Virreira presents similar findings for the cost of exploration and development. The average cost of exploration and development in Bolivia was found to be US$6.94 per barrel. Andina’s exploration and development costs were found to be US$0.4, BG’s US$3.2, Repsol’s US$3.7 and Chaco’s US$3.7. Virreira compared exploration and development costs in Bolivia with 200 firms worldwide. He found the global average cost to be US$8.58. Both of these indicators mean that Bolivia presents a positive operating environment for companies and that it is possible to have a significant return on Bolivian oil and gas production.

30
Benefits
Introduction
Foreign investment is generally widely promoted on the basis that it can bring a variety of benefits to developing countries. Firstly, it can provide capital to countries severely lacking in resources. By establishing operations in developing countries foreign firms create jobs for the local population. They also pay taxes. Foreign investors who establish new businesses, or expand existing businesses that they have acquired, can significantly increase the tax- take of developing country governments. Foreign firms also bring with them the technology, know-how and market knowledge to enable developing countries to acquire new export markets and increase export earnings. Most importantly perhaps, foreign firms also bring other new opportunities for local businesses, or competition with foreign firms can inspire a new level of entrepreneurship and upgrading within local firms. The domestic private sector can benefit by entering into business relationships supplying inputs to these new market entrants (backward linkages) or processing a foreign investor’s products (forward linkages). Local firms can, particularly, benefit if their partnerships with foreign investors include support to improve their skills and technology. This can vastly improve local businesses’ efficiency and productivity, which will have numerous knock-on effects throughout the local economy. This growth of the domestic private sector is perhaps the most important benefit foreign investment can provide, given the domestic private sector will be the source of the majority of jobs and local businesses will both spend and reinvest their income locally, providing valuable multiplier effects in a developing country’s economy. These effects are likely to stimulate long term growth, job creation and poverty reduction. Foreign investors may bring with them new, cleaner technologies which can also mean more effective environmental management. This would be particularly beneficial to developing countries receiving foreign investment in highly polluting sectors, such as natural resource extraction. But equally, foreign investors may find it easier and cheaper to pollute in developing countries where there are often weak or poorly enforced environmental regulations. As mentioned earlier, the benefits of foreign investment and how it can positively boost the domestic private sector are vividly demonstrated by the experience in east Asia. It should, of course, be noted that east Asian countries applied a diversity of strategies to manage foreign investment in their economies, to ensure they reaped the benefits listed above, and many countries continue to apply active industrial policies to ensure the successful development of their domestic private sectors (for example Singapore’s Local Industry Upgrading Programme).89
In the case of Bolivia, as already noted in this report, the amount of foreign capital entering the country to invest in the oil and gas sector underwent a dramatic increase after privatisation. The export earnings that flow into the country as a result are an important support to Bolivia’s national account. Following privatisation both export and domestic sales have contributed to increasing company turnover in the sector. Export earnings and turnover figures are useful indicators of how the sector is growing, but they mainly indicate the progress of the multinational companies themselves. What Bolivia is really interested in are the benefits that leave the hands of these companies and flow into the local economy. This section of the report will investigate those benefits, looking particularly at:
o employment o fiscal revenue

31
o and the stimulation of local businesses.
It will also include a calculation of the dividend payments made by the three capitalised companies to the capitalisation fund that provides pension payments to Bolivians.
Employment
Although foreign oil and gas companies account for most of the foreign investment in Bolivia, the industry – unsurprisingly – employs a fairly small number of workers. These tend to be highly skilled – and are either technical (engineers) or professional (accountants, lawyers, general managers).90 The most recent study available puts the figure for skilled workers employed by the industry in the year 2000 at 6,000 – that is 1.4 per cent of employment in the country.91
Although the sector is not a high employer, it pays the highest wages in the country. Accessing reliable wage data per sector in Bolivia is difficult. According to the Bolivian Chamber of Hydrocarbons (the industry association), wages for professional staff are likely to be between US$480 and US$2,800 a month, depending on whether they are working as a technical engineer in a small national company providing services to the industry or in a senior position for a multinational company.92 This range tallies with the wage figures supplied by the national statistics institute (INE) for the industry. These figures are presented below in local currency (bolivianos) with the average figure also given in US dollars: Table 8 Monthly wages, oil and gas industry Bolivianos and dollars
1999 2000 2001 2002 2003 2004 Managers 11,833 13,397 14,220 17,701 19,570 24,740 Professionals 6,588 7,958 8,412 9,174 10,313 9,780 Other Professionals2,707
6,865 7,320 8,385 9,951 10,530 10,205
Employees 4,060 4,583 5,070 4,432 4,869 5,365 Average (bolivianos)
7,337 8,315 9,022 10,315 11,321 12,523
Average (dollars)
1,223 1,299 1,321 1,375 1,474 1,575
Source: INE: Statistics from the Hydrocarbons Industry 1994-2004 and exchange rates according to the Bolivian Central Bank
Using these figures, we can calculate the average annual wage in the industry. This is done according to Bolivian labour law which stipulates that workers are paid 14 monthly salaries plus the employer’s contribution (13.7 per cent of 12 salaries). Using this formula the average annual wages of the industry can be calculated as follows:
Table 9 Calculation of wage benefits from oil and gas industry US$ dollars
1999 2000 2001 2002 2003 2004 Total
1999- 2004
Monthly average wage US$
1,223 1,299 1,321 1,375 1,474 1,575
Yearly average wage US$
19,133 20,322 20,666 21,511 23,059 24,639 129,330

32
Using the figure above for the numbers employed by the industry – 6,000 – the total wage benefits for skilled workers over these six years is US$775,980,000. The high wages in the sector are of course a positive aspect of the industry. Workers in capital-intensive sectors, such as oil and gas, have seen a revival of their wages in Bolivia since privatisation. These workers are of course the most educated and most highly skilled in the country. At the same time, foreign investment in Bolivia has also been associated with an increase in wage inequality.93 While employment in the oil and gas sector benefits skilled workers who already earn the highest incomes, unfortunately workers in other sectors of the economy (agriculture, manufacturing) have seen their wages either fall or stagnate, and as a result income-distribution has deteriorated in Bolivia. Benefits from the oil and gas industry in Bolivia do not include either widespread job creation or jobs for the poor, unskilled sectors of the population. This limitation is generally well recognised by the industry as a whole, in their operations in developing countries. One of the first comments made by the general manager of the Bolivian Chamber of Hydrocarbons when interviewed, was that ‘the industry does not create jobs, it creates wealth’.94 It is important that this limitation is publicly recognised in Bolivia, and other developing countries, as it underscores the importance that the state does its utmost to maximise other benefits from the sector – such as the tax-take, the industry’s links with local firms and the possibility of adding value to oil and gas products in country.
Royalties and taxes
As discussed throughout this study, one of the central benefits from promoting investment in the oil and gas industry are the royalties and taxes that this investment generates. For a developing country like Bolivia, that has 63 per cent of its population living in poverty – and which, like the rest of Latin America, is collecting less tax than would be expected for their level of development95 – the importance of their tax-take cannot be underestimated. The following is a calculation of the royalties paid between 1999 and 2004.
Table 10 Breakdown of royalties paid post privatisation 1999-2004 In millions of US$ Royalties 1999 2000 2001 2002 2003 2004 Oil 69.16 116.45 98.78 88.61 103.82 127.58 Gas 26.48 56.84 80.95 76.43 107.05 150.04 LPG 4.07 6.80 8.23 7.62 8.81 9.70 Total 99.71 180.09 187.96 172.66 219.68 287.32
Source: Figures compiled by CEDLA from the Vice Ministry of Energy and Hydrocarbons (VMEH)
While royalties are the most important contribution from companies to the state, oil and gas companies also pay taxes. The figures below are provided by the National Tax Service (SIN). The table presents taxes paid by upstream companies only. It does not include sales taxes (VAT, transaction taxes and special fuel taxes) that are retained by companies and transferred to the Treasury, as these taxes constitute a contribution from consumers not a contribution from companies. (This report will analyse the contribution of consumers later).

33
Table 11 Breakdown of taxes paid, 1999-2004 In bolivianos and millions of US$ 1999 2000 2001 2002 2003 2004 IUE Corporation Tax
22,901,649 25,782,959 112,047,053 42,930,489 31,575,234 120,029,665
IURE Remittance tax
18,774,127 30,433,772 45,569,743 23,600,717 63,065,138 122,887,378
Various other Taxes
17,850 1,000 2,187,478 600,873 379,578 1,317,314
Total taxes (bolivianos)
41,693,626 56,217,731 159,804,274 67,132,079 95,019,950 244,234,357
Total taxes (millions of $US)
6.95 8.78 23.40 8.95 12.37 30.72
Source: National Tax Service (SIN) and exchange rates according to the Bolivian Central Bank
Graph 4 Comparing royalties and taxes
Comparing royalty and tax payments
0
50
100
150
200
250
300
350
1999 2000 2001 2002 2003 2004
Millio
ns o
f U
S$
Royalties
Taxes
Clearly both royalties and taxes are increasing. However, the difference between the royalty payments and taxes is striking. While US$6.9 million was paid in taxes in 1999, US$99 million was paid in royalties. Taxes were seven per cent of the contribution from royalties. Clearly Bolivia is a country that is relying very little on taxing the oil and gas industry’s profits. The second notable feature is that the Surtax – Bolivia’s equivalent of a special petroleum tax – was not paid by a single company between 1999 and 2004. (Apparently one payment of Surtax was made by one company this year, though information on this has not yet been provided by the National Tax Service). Analysts in Bolivia describe the Surtax as a tax that is poorly regulated in terms of administrative procedures, one that the Bolivian state has so far not had the capacity to implement, and one that companies can easily avoid paying by choosing to reinvest their profits.96 This is of course very serious, given the Surtax was supposed to save the Treasury’s contributions from a serious decline after a decrease in royalty rates. While the Surtax has not brought in any income, it is also notable that corporate taxes bring in so little for the state. In 1999 the corporation tax (IUE) payments amounted to US$3.8 million.
34
This was in a year when the sector’s turnover can be estimated at US$290.8 million. (For turnover figures see Annex A, which presents a full analysis of production, prices, turnover and the contributions to the state between 1999 and 2004.) In 1999, therefore, corporate taxes amounted to one per cent of turnover. By 2004 this picture had not changed, with corporate taxes of US$15.1 million and sector turnover of US$1,172 million – taxes again amounting to one per cent of the sector’s turnover. This can be compared, for example, to the UK, where corporate tax was 15 per cent of company income in the oil and gas sector in 2002 and 26.5 per cent of income in 2005 (when a supplementary corporate tax was added).97
It is common practice in Bolivia for oil and gas companies and the Bolivian Chamber of Hydrocarbons to point out that while a royalty of 18 per cent might seem low, in reality companies pay a wide variety of taxes and that the tax burden is high.
‘The idea that 18 per cent goes to the state and 82 per cent goes to company is not true. There are operational costs and then there is a whole list of other taxes. There is the corporation tax, the remittances tax and the surtax. These taxes bring up the 18 per cent royalty to around 60 per cent’98 It is certainly true that the state does not just receive an 18 per cent royalty. It actually receives a mix of 50 per cent and 18 per cent royalties, depending on the classification of the reserves. But it would also be unfair to say that the tax burden in Bolivia is high (and particularly with reference to the Surtax in any justification of this fact). In reality, figures from the National Tax Service show that taxes paid are barely significant, given the turnover of the sector, and extremely low, compared to the royalties being paid. There are some simple explanations as to why Bolivian corporate tax payments are so insignificant. According to Bolivian investment law, the investor can recuperate his investment against profits, against which corporation tax payments are calculated. So if you invest US$150 million and your profit is US$100 million, for fiscal purposes your earnings can be reported as minus US$50 million. This will give you fiscal credit and the next year if you earn US$100 million, you can apply this US$50 million credit and only pay taxes on the US$50 million remaining. This demonstrates the critical difference between accounting profits and profits for tax purposes. In Bolivia the law allows investors to recuperate their whole investment from year one of their investment, making the effective tax rate much lower than might otherwise have been expected. This is often presented in Bolivia as normal practice within fiscal regimes and something which is obligatory to attract investment. But of course such practices are not a global reality. In the UK, North Sea oil and gas companies are subject to a first-year capital allowance of 40 per cent so they can deduct only 40 per cent of their capital investment. In this case, the Bolivian law offers another carrot aimed at attracting investment to the sector.
At this point we can calculate the total contribution of companies to the state between our period of reference, 1999 and 2004. The following table shows that the average annual contribution by companies is US$206 million per year and the total contribution in six years was US$1,238.59 million:

35
Table 12 Total company contribution to the Bolivian state Royalties and taxes 1999-2004 In millions of US$ 1999 2000 2001 2002 2003 2004 Total Royalties 99.71 180.09 187.96 172.66 219.68 287.32 1,147,42 Taxes 6.95 8.78 23.40 8.95 12.37 30.72 91.17 Total 106.66 188.87 211.36 181.61 232.05 318.04 1,238.59
What is perhaps more interesting than presenting the overall contributions by the companies is to analyse the trends in turnover generated by them, and their contribution to the state over time. This allows us to determine if the government is capturing relatively more or less revenue over time. Using the figures presented in the table in Annex A, we can work out the percentage contribution the state is receiving in royalties and taxes each year. While the Bolivian government – through royalties and taxes - was receiving 37 per cent of turnover in 1999 it only received 27 per cent in 2004. The following chart shows the downward trend in the state’s share of total company turnover: Chart 3 Comparing the companies and the state’s share
Trends in companies and state's share
0
10
20
30
40
50
60
70
80
90
100
1999 2000 2001 2002 2003 2004
Perc
en
tag
es
Companies gross share
Royalties
Taxes
The decline is easily explained by the fact that companies are producing a mixture of ‘existing’ and ‘new’ reserves, therefore paying a mix of 50 per cent and 18 per cent royalty rates. As the percentage is declining, the production of new reserves is increasing, and the production of existing reserves is declining. The percentage paid to the state through taxes is not growing to compensate that loss. Taking a closer look at the figures provided in Annex A, we see that gas production has gone up by 376 per cent, oil production by 44 per cent and gas prices have risen by 80 per cent and oil prices by 78 per cent. In all, the sector’s turnover has risen by 303 per cent. However, while these trends are overwhelmingly positive, as the table above shows, the share that the state is receiving each year has been consistently declining. Although the value of revenue generated in royalties and taxes for the state is going up – it increased by 198 per cent between 1999 and 2004 – the state’s share in the companies’ turnover is actually going down. The Bolivian government has captured a significantly lower proportion of benefits in 2004 than it did in 1999.

36
Payments to the capitalisation fund
As explained earlier, YPFB transferred 50 per cent of the three companies created to a capitalisation fund that would receive dividends. These dividends would then be invested and administered as pension funds. The dividends paid by the three capitalised companies – Andina, Chaco and Transredes – are detailed below. This information was gathered directly from the pension fund management companies. Table 13 Summary of payments by oil and gas companies to Bolivia’s capitalization fund US$ dollars 1999-2004 AFP Futuro 1999 2000 2001 2002 2003 2004 Andina 2,284,552 1,079,769 0 1,527,170 4,253,765 0 Chaco 0 2,446,808 3,180,900 6,117,021 7,711,342 13,327,483 Transredes 0 0 0 5,061,000 13,294,962 4,963,995 BBVA Andina 2,292,905 1,079,144 0 1,527,171 4,253,766 0 Chaco 0 2,446,808 3,180,900 6,134,155 7,711,342 13,337,483 Transredes 0 0 0 5,070,924 13,284,535 4,960,102 TOTAL 4,577,457 7,052,529 6,361,800 25,437,441 50,509,712 36,589,063
Source: AFP Futuro and BBVA
Bolivia received a total of US$130,528,002 in this six-year period from dividend payments from the three capitalised enterprises.
Development of linkages with local businesses
The links that can be forged between foreign investors and local businesses are considered by many to be the most important benefits of foreign direct investment. Foreign investors can provide new markets for local businesses by entering into joint ventures with local firms, or simply by taking them on as suppliers. They can, therefore, work with local firms, helping them to address their challenges in production and finance, upgrading their technology and passing on skills to their staff. This of course ultimately improves the overall competitiveness of local businesses, thereby facilitating further market access in the future. Foreign investors working together with local businesses, can have long-term impacts on the development of the private sector in developing countries. Unfortunately, in Latin America and the Caribbean, it is much more common for foreign investors to work in isolation from local businesses rather than together with them. This is commonly seen in the apparel sector in Mexico, Central America, Haiti and the Dominican Republic. Estimates from the Dominican Republic show that only seven per cent of the value added is by local firms in the apparel sector.99 In this sector, foreign investors rely on local employees for simple assembly operations only, importing the majority of their inputs and purchasing little from local suppliers. In Costa Rica, the same problems are observed in more high-tech sectors, such as computers and pharmaceuticals.100 The lack of linkages between foreign investment and the domestic economy has been identified as one of the key limitations of the current foreign investment model in Latin America. It is also a limitation that is very much a characteristic of the oil and gas industry, which is capital intensive and requires specialist technical services, many of which are provided by other multinationals.

37
In the case of Bolivia, a small number of national firms work directly with foreign oil and gas companies. They provide mainly technical services, such as pipeline and road construction, fitting out platforms, pipeline maintenance and equipment repair. All of these firms are members of the Bolivian Chamber of Hydrocarbons – the industry association. According to the Chamber, 75 per cent of the 105 business members (79 firms) are Bolivian.101 Drilling services are all contracted to multinationals, as only a handful of companies in the world have the specialised equipment to drill and cement the wells. Some of the biggest Bolivian companies operating in this sector are Serpetbol, Kaiser Servicios, Bolinter, Intergas, IST and Conpropet. Many of these companies are now selling their services to multinational oil and gas companies in other Latin American countries. A number of small- and medium-sized firms are also operating. One of the most notable supplier success stories is of a small Bolivian firm which has developed sophisticated software called ‘Gas to Market’ among other software packages for upstream companies.
The Bolivian Chamber of Hydrocarbons has also promoted the creation of an on-line marketplace where oil and gas firms can set up relationships and buy from local suppliers. There are 1,800 suppliers listed on the service. These include the more specialised technical service-providers described above and a large variety of the suppliers that oil and gas firms use regularly (such as those providing stationery products, tyres, lubricants, security and cleaning services). Most of these firms have developed since privatisation, as YPFB operated as an integrated company with the great majority of the work kept in house.
Conclusion
Unfortunately, there was no data available on the domestic business linkages and the turnover of national firms. However, it is generally recognised that the linkages are limited and in the case of Bolivia, it is mainly the 79 national firms that are affiliated to the Chamber that reap substantial benefits from the oil and gas sector. It is also true, of course, that it would be extremely hard to put a numerical value on this type of benefit. The wages and taxes paid by these companies are – in the main – already covered. Their more indirect value – in terms of their contribution to the development of the domestic private sector and Bolivia’s industrialisation – is impossible to evaluate. The main benefit, therefore, taken into account in this study, is the contribution companies make to Bolivia, through their royalties and tax payments, and the wage benefits that are generated.

38
Costs
Introduction
This section will look at the costs which Bolivia has incurred in attracting and hosting foreign investors in the oil and gas sector. This analysis will firstly include the direct costs borne by the government – such as the cost of administering the privatisation of YPFB and any subsidies provided by the government. It will also take into account the revenue which the government has foregone as this represents an additional cost of this policy choice for the country. Foregone revenue will include the value of tax incentives applied by Bolivia, in the hope that lower tax rates would attract higher investment and increase the benefits to the country. Another type of foregone revenue common to all kinds of foreign investment is the revenue that countries can lose through multinationals’ tax avoidance or evasion practices. This is, of course, extremely difficult to quantify, but this section attempts to gather some data on this issue.
In addition to the above, a large hydrocarbon exporting sector can lead to the common side effect of Dutch disease. This refers to a situation when a large portion of oil and gas exports cause the exchange rate to be over valued, which in turn leads to export prices increasing and import prices decreasing. This will result in exports in sectors other than oil and gas falling. At the same time, imports are likely to increase, widening the country’s trade gap and, thereby, also negatively affecting the balance of payments. This issue will not, however, be addressed in this study, as although Bolivia should have a freely floating exchange rate, the country in practice maintains a managed rate and therefore guards against this impact of the hydrocarbons sector.
Costs of administering reform
The privatisation process in Bolivia carried with it huge costs to the country, which were mainly covered by international loans. The Presidential Delegate, Juan Carlos Virreira, in his review of the privatisation process presents information on the costs to the country.102 The whole process cost Bolivia US$188,961,300 between 1993 and 2001. This figure was to cover the costs of privatising six firms. In the end only five were privatised – the airline, the railways, electricity, telecommunications and YPFB. In all, ten private firms were created from five state enterprises, three of which were in the oil and gas sector. This means an estimate for the costs of privatising oil and gas is three-tenths of the total cost to the country – US$56,688,390. World Bank loans covered 57 per cent of this cost, with the IDB being the second-largest donor, covering 38 per cent. Many of these loans were used to pay consultants’ bills, many of which were from foreign firms brought in to advise Bolivia during the process.
Foregone revenue because of incentives offered to attract investment
Depending on the country context there can be various kinds of incentives offered to attract investors. The two most relevant in Bolivia that this report looks at here are: • the incentive provided by the State foregoing payment for its asset • the incentive provided by the preferential tax rates that were revised downwards at the
moment of privatisation.
Initial investment incentives
There was a significant incentive offered to the companies in the form of exemption from paying for the assets they received from YPFB. Companies were allowed instead to use the
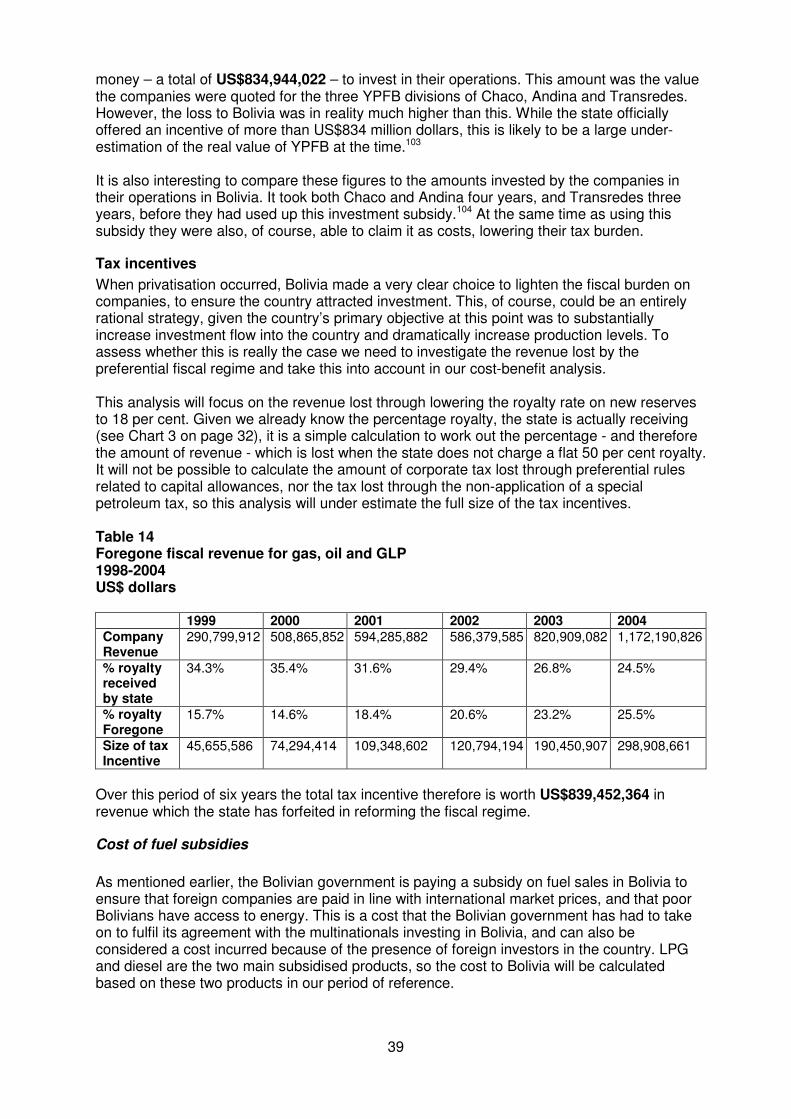
39
money – a total of US$834,944,022 – to invest in their operations. This amount was the value the companies were quoted for the three YPFB divisions of Chaco, Andina and Transredes. However, the loss to Bolivia was in reality much higher than this. While the state officially offered an incentive of more than US$834 million dollars, this is likely to be a large under-estimation of the real value of YPFB at the time.103 It is also interesting to compare these figures to the amounts invested by the companies in their operations in Bolivia. It took both Chaco and Andina four years, and Transredes three years, before they had used up this investment subsidy.104 At the same time as using this subsidy they were also, of course, able to claim it as costs, lowering their tax burden.
Tax incentives
When privatisation occurred, Bolivia made a very clear choice to lighten the fiscal burden on companies, to ensure the country attracted investment. This, of course, could be an entirely rational strategy, given the country’s primary objective at this point was to substantially increase investment flow into the country and dramatically increase production levels. To assess whether this is really the case we need to investigate the revenue lost by the preferential fiscal regime and take this into account in our cost-benefit analysis. This analysis will focus on the revenue lost through lowering the royalty rate on new reserves to 18 per cent. Given we already know the percentage royalty, the state is actually receiving (see Chart 3 on page 32), it is a simple calculation to work out the percentage - and therefore the amount of revenue - which is lost when the state does not charge a flat 50 per cent royalty. It will not be possible to calculate the amount of corporate tax lost through preferential rules related to capital allowances, nor the tax lost through the non-application of a special petroleum tax, so this analysis will under estimate the full size of the tax incentives. Table 14 Foregone fiscal revenue for gas, oil and GLP 1998-2004 US$ dollars
1999 2000 2001 2002 2003 2004 Company Revenue
290,799,912 508,865,852 594,285,882 586,379,585 820,909,082 1,172,190,826
% royalty received by state
34.3% 35.4% 31.6% 29.4% 26.8% 24.5%
% royalty Foregone
15.7% 14.6% 18.4% 20.6% 23.2% 25.5%
Size of tax Incentive
45,655,586 74,294,414 109,348,602 120,794,194 190,450,907 298,908,661
Over this period of six years the total tax incentive therefore is worth US$839,452,364 in revenue which the state has forfeited in reforming the fiscal regime.
Cost of fuel subsidies
As mentioned earlier, the Bolivian government is paying a subsidy on fuel sales in Bolivia to ensure that foreign companies are paid in line with international market prices, and that poor Bolivians have access to energy. This is a cost that the Bolivian government has had to take on to fulfil its agreement with the multinationals investing in Bolivia, and can also be considered a cost incurred because of the presence of foreign investors in the country. LPG and diesel are the two main subsidised products, so the cost to Bolivia will be calculated based on these two products in our period of reference.
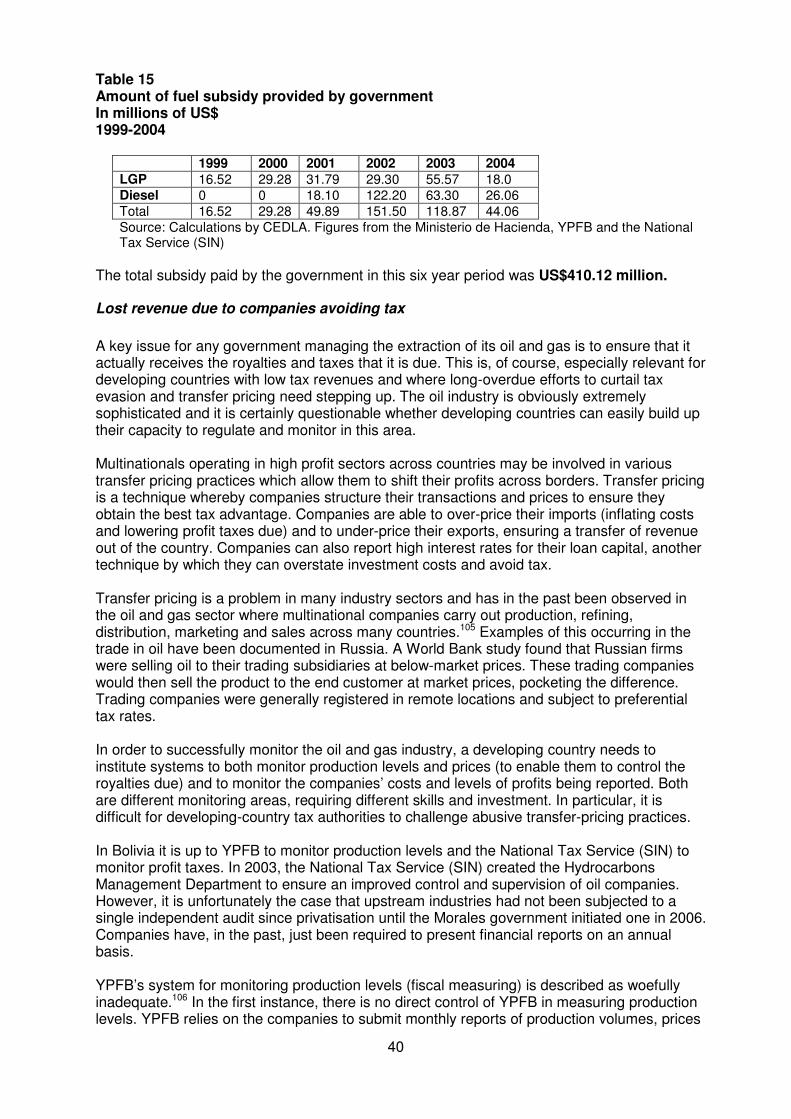
40
Table 15 Amount of fuel subsidy provided by government In millions of US$ 1999-2004
1999 2000 2001 2002 2003 2004 LGP 16.52 29.28 31.79 29.30 55.57 18.0 Diesel 0 0 18.10 122.20 63.30 26.06 Total 16.52 29.28 49.89 151.50 118.87 44.06 Source: Calculations by CEDLA. Figures from the Ministerio de Hacienda, YPFB and the National Tax Service (SIN)
The total subsidy paid by the government in this six year period was US$410.12 million.
Lost revenue due to companies avoiding tax
A key issue for any government managing the extraction of its oil and gas is to ensure that it actually receives the royalties and taxes that it is due. This is, of course, especially relevant for developing countries with low tax revenues and where long-overdue efforts to curtail tax evasion and transfer pricing need stepping up. The oil industry is obviously extremely sophisticated and it is certainly questionable whether developing countries can easily build up their capacity to regulate and monitor in this area. Multinationals operating in high profit sectors across countries may be involved in various transfer pricing practices which allow them to shift their profits across borders. Transfer pricing is a technique whereby companies structure their transactions and prices to ensure they obtain the best tax advantage. Companies are able to over-price their imports (inflating costs and lowering profit taxes due) and to under-price their exports, ensuring a transfer of revenue out of the country. Companies can also report high interest rates for their loan capital, another technique by which they can overstate investment costs and avoid tax. Transfer pricing is a problem in many industry sectors and has in the past been observed in the oil and gas sector where multinational companies carry out production, refining, distribution, marketing and sales across many countries.105 Examples of this occurring in the trade in oil have been documented in Russia. A World Bank study found that Russian firms were selling oil to their trading subsidiaries at below-market prices. These trading companies would then sell the product to the end customer at market prices, pocketing the difference. Trading companies were generally registered in remote locations and subject to preferential tax rates. In order to successfully monitor the oil and gas industry, a developing country needs to institute systems to both monitor production levels and prices (to enable them to control the royalties due) and to monitor the companies’ costs and levels of profits being reported. Both are different monitoring areas, requiring different skills and investment. In particular, it is difficult for developing-country tax authorities to challenge abusive transfer-pricing practices. In Bolivia it is up to YPFB to monitor production levels and the National Tax Service (SIN) to monitor profit taxes. In 2003, the National Tax Service (SIN) created the Hydrocarbons Management Department to ensure an improved control and supervision of oil companies. However, it is unfortunately the case that upstream industries had not been subjected to a single independent audit since privatisation until the Morales government initiated one in 2006. Companies have, in the past, just been required to present financial reports on an annual basis. YPFB’s system for monitoring production levels (fiscal measuring) is described as woefully inadequate.106 In the first instance, there is no direct control of YPFB in measuring production levels. YPFB relies on the companies to submit monthly reports of production volumes, prices

41
and royalties due. YPFB also relies on Transredes – the company in charge of the pipelines which transport oil and gas – to submit reports of the volumes being transported. In most countries there is a central monitoring unit which would receive information on volumes directly from fiscal measuring points on platforms and from pipelines where specialised staff would be physically present to do spot checks. For example, in Norway the Norwegian Petroleum Directorate employs a team dedicated to fiscal measuring. They carry out audits, testing companies’ measuring equipment and monitoring the operation of the equipment on the production facilities and in land terminals.107 In Bolivia YPFB has no adequate, independent method of verifying production volumes and one of the most important tasks for YPFB under the current government is to build an effective fiscal measuring system, given that even a small deviation in measurement can mean a significant loss of revenue to the State.
According to the National Tax Service, it seems that tax evasion in Bolivia is a serious problem. ‘There is a lot going on under the table. There is a high level of corruption in the form of tax evasion in Bolivia’108 Although the National Tax Service may feel many practices can be classified as evasive, there are likely to be many examples where Bolivia is not receiving revenue due to sophisticated tax avoidance practices. Where the National Tax Service does suspect evasion it is of course urgent that they try to address this problem. There has been no comprehensive effort to date in Bolivia to investigate whether practices such as under pricing exports (or even direct smuggling) have been going on. Such practices are unlikely to occur when natural gas is being exported, using the main gas pipelines and under the state’s gas sale agreements with Brazil and Argentina. There is, however, less control over the sales of oil and LPG. CEDLA reports in 2006109 that supply of LPG on the local market is often barely enough to meet demand, even though production figures for 2005 were actually double the internal consumption figures. As storage of LPG is limited and SIRESE, the regulatory body, didn’t authorise any LPG exports in 2005, there is a contradiction in the figures in Bolivia. This suggests the need to investigate whether there is an under representation of sales or whether smuggling is occurring. As so little investigation has taken place the only sources of information are from press reports. Chaco (owned by BP and Bridas) got into trouble in 2004 over the exporting of light oils. The company had a permit to export 1.5 million barrels of heavy oil a year through Arica in Chile, and was accused of exporting 26,000 barrels of light oil under this permit. Light oils have high gasoline content and are therefore more valuable than the normal heavy oil that Bolivia exports. The Bolivian authorities opened a case against Chaco, as they suspected this product was exported without the correct permit and sold at a lower price than it was worth. The response of Chaco was to pay $1,063,680 to the state, though without making an admission of liability.110
A similar case was opened against Andina (owned by Repsol). According to press reports, in 2006 Andina was accused of not reporting the export of 230,399 barrels oil which was valued at US$9.2 million by the Bolivian customs authority.111 On the 10 March 2006, the press also reported searches of Andina offices as the general manager and operations manager failed to show up for the case proceedings.112 Both executives were later detained for the offence of smuggling, though they were released when a higher court overruled their detention.113 Andina have vigorously denied the allegations. The case is ongoing. It is impossible to know the scale of practices of under-reporting exports. The National Tax Service has not presented any consolidated information on this issue. However, the Bolivian press did report in 2004 that the National Tax Service records showed that around 600 million bolivianos (US$75 million) were in dispute between the tax office and the oil and gas

42
companies for alleged tax evasion.114 As this is the only data we have it is the only figure we can use to estimate the costs to the state because of tax evasion, however, it is likely to be a serious under estimation. The new hydrocarbons law passed in 2005 attempts to curtail any transfer-pricing practices which might be going on. The law states that if any price under the international market price is quoted on a contract, the royalties for the state will be calculated with reference to the international market price. This goes some way towards correcting the problem, but it does not help in cases where the company is under-reporting the volume of production while quoting the correct price, as in such cases transfer-pricing also occurs. However, this problem should also be dealt with, thanks to the latest move by the new MAS government. Under the renegotiation YPFB will now take control of all sales, physically handling the product, and therefore involving much greater monitoring of export volumes.
Conclusion
This section demonstrates the costs of the oil and gas sector to Bolivia and the revenue that the government has foregone, in the hope that more investment will provide dynamic and increasing benefits. The costs that are easiest to evaluate include those of privatising the sector, and the incentives and subsidies offered to make Bolivia more attractive to foreign investors. However, there are also serious costs that are much harder to get information on, particularly multinationals’ transfer-pricing practices. Such costs cannot be effectively reflected here.

43
Non-quantified costs
Introduction
There is, of course, a limitation to the methodology we have used here, which relies on putting figures on each aspect to allow an analysis of the net economic contribution to Bolivia. However, there are other costs that are directly related to the presence and practices of the oil and gas companies. The two major non-quantifiable costs that were identified during this study are environmental costs and revenue which the government loses as a result of contract abuse by companies. These issues are presented in this section, with an explanation of the types of costs incurred.
Lost revenue through contract abuse by companies
As mentioned earlier, one of the characteristics of the way Bolivia manages its oil and gas sector is that it has agreed to pay oil and gas companies in line with international prices for the fuel it consumes locally. Given this agreement, the government is very keen to ensure that Bolivian oil, gas and LPG is not sold more cheaply on external markets than the price the Bolivian government is paying for it. For this reason it has instituted the principle of ‘export parity’ in its contracts with foreign investors. SIRESE – the regulatory body – is charged with ensuring both the regularity of supply to the local market and that export parity is respected. SIRESE has documented a large number of cases of oil and gas companies selling oil, gas and LPG more cheaply on the export market than locally. In Bolivia this is classed as ‘anti-competitive activity’ and is an abuse of the contract between the government and the companies. SIRESE has no power to fine companies for such abusive practices but is able to emit a resolution calling on the company to lower the price it is charging on the local market. Given such cases amount to an abuse of contract and require the Bolivian government to pay a higher subsidy on fuel and ordinary Bolivians to pay more for their fuel, instances of over charging in Bolivia can also be classed as a cost to the country. The cases documented by SIRESE cover a variety of different periods between 1999 and 2005 and involve a long list of companies.115 We requested details from SIRESE regarding the volumes sold more cheaply on export markets and the price differentials during these periods. With this information it would have been possible to quantify the cost to the country. SIRESE told us that this information was confidential, as it relates to the issue of competition – a fairly unusual response given this behaviour is classed as an anti-competitive practice.
Environmental costs
Oil and gas extraction can have a number of harmful effects on the environment, and by extension on human health. Onshore projects – such as in Bolivia – can have serious negative impacts on water sources, fisheries and livestock, thereby harming the livelihoods and health of rural communities. An exhaustive study is not possible here as it would merit a much longer discussion. It is also difficult to quantify the effects of operations, given the variety of materials used and the different environments and depths. However, broadly, the main effects from exploration, drilling, extraction and transportation can be summarised as follows:116 • Deforestation as a result of bringing in exploration equipment, the construction of air strips,
new roads and drilling wells, and when platform construction begins. • Routine discharge of drill cuttings and mud when drilling occurs during the exploration and
extraction stages. These have toxins and pollutants that have chronic effects on the
44
environment, contaminating soils and water supplies. This can also negatively impact the health of livestock, who are exposed through contaminated feed and water.
• Spills, explosions and fires which occur fairly frequently during drilling and extraction. • Gas flaring at the point of extraction which causes significant air pollution. • Spills and leaks that routinely occur during the transportation of oil and oil by-products,
causing contamination of groundwater, killing vegetation and exposing livestock to crude oil. which can cause sudden death.
Water contamination is a particularly widespread problem. Water contaminated during extraction (known as ‘produced water’ in the industry) generally contains varying quantities of ‘heavy metals, volatile aromatic hydrocarbons (such as benzene) and a vast array of other potentially toxic compounds’.117 While this water can be treated, it is an expensive process and generally one that oil companies employ selectively. Developing countries with weaker environmental regulations are unlikely to enforce the industry to employ best practice in connection with water contamination. Similarly, many leaks and spills occur in developing countries where safety regulations for pipelines are often inadequately enforced. While large oil spills, such as from the Exxon Valdez in Alaska, grab media headlines, smaller, more frequent spills are occurring all the time. These receive little attention, but the quantity of oil released from smaller leaks is actually greater than the amount released from the large spills.118 Pipeline maintenance is often neglected, particularly in developing countries. These countries are also further disadvantaged by the fact that pipelines are often laid above ground as this is less expensive than burying pipes. In Bolivia, gas pipelines are generally laid underground but oil pipelines are mostly above ground. Leaks from these pipes can easily directly affect local livestock and farmland, contaminating groundwater and soils, making the land unsuitable for cultivation. This, of course, can have negative affects on a community’s income and can also mean a poor community has less access to food and drinking water. Obviously, those who suffer most from the presence of oil and gas companies in Bolivia are the rural, indigenous communities. Often one community’s territory (known as ‘territorio comunitario de origin’ (TCO) in Bolivia) is criss-crossed by many different concessions and pipelines, dividing people from their water sources, crops and causing problems between communities. On top of the physical and social divisions, the environmental damage caused by the oil and gas industry activities – as described above – are significant. Given that Bolivia has an extremely high level of biodiversity with the country being one of the world’s top ten countries for this – environmental damage caused by oil and gas companies will naturally carry much higher costs.
Pipelines and exploration
The construction of gas pipelines in Bolivia has caused major incursions into indigenous lands. To lay pipelines companies have to clear wide strips in the forest. One of the results of this is, of course, large-scale deforestation and degradation of the forest itself, as well as soil degradation and pollution of water sources. But opening up the forest also makes access to it much easier. This leads to an increase in illegal logging, hunting and fishing on indigenous lands, in areas where access was previously much more difficult. Indigenous communities end up losing the sources of their livelihood and food insecurity can increase as a result.
The construction of the main Bolivia-Brazil pipeline was a huge engineering project running through several protected areas, including the Gran Chaco in Bolivia. It evoked a raft of protests from the areas the pipeline would cross. As a result, communities and NGOs became involved in negotiations with the companies and in advocacy with the financial institutions funding the project (World Bank, Inter-American development Bank (IDB) and others) when the project began in 1997. As is often the case, the companies and financiers were reluctant to share information transparently with communities or to listen to their demands.119 While environmental impact assessments were completed, these were not presented to the

45
communities in any digestible format. It became the task of the NGOs to translate the weighty assessments into the likely impacts that could affect local communities which could be discussed and evaluated by the communities themselves. The impacts that the communities suffered as a result have been documented as the following:120 • The camps were established in El Carmen Rivero Tórrez – in violation of the
environmental management plans – bringing a huge influx of workers and vehicles into this small, rural town.
• This resulted in a housing shortage, as workers took over family homes instead of building their own shelter in camps. Workers also took over the local health post and the town’s medical team had to be relocated in the school, bringing an increased risk of the transmission of infectious diseases to local children.
• This put pressure on water sources, leaving the population with water shortages, as well as contaminated water. Sanitation infrastructure was damaged
• There was an increase in noise pollution and waste, as rubbish was not properly disposed of.
• The one telephone in the village became unavailable for use to the local communities. • There was an increase in sexual assaults on women. • A shortage resulted in many basic goods and prices increased, including the prices of
medicines. • Local businesses reported losses, as workers refused to pay for the goods and services
they consumed. • Deforestation also resulted, as did the destruction of roads and other local infrastructure
(such as telephone and electricity cables). Many of these impacts could have been avoided if the environmental management plan – which requires camps to be established 6km from towns – had been respected. As a result of the difficulties that arose immediately from the presence of construction workers, ‘fiscalisation’ committees were created to monitor the construction and company practice. The compensation offered to El Carmen was originally US$85,000. The amounts finally paid were US$1,056,069 to the six municipalities affected – with El Carmen receiving US$365,000. The indigenous communities received US$3,716,039.121 The investment in the construction of the whole pipeline was in the region of US$2,037 million, with US$437 million being spent on the Bolivian side. Another major case of environmental damage by the industry was in the construction of the Ciuabá pipeline (an offshoot of the main Bolivia-Brazil pipeline). It was built through the Bolivian Pantanal. This is a huge area of wetlands in parts of Bolivia, Paraguay and Brazil, that are one of the world’s most immense and rich ecosystems, with a huge wealth of biodiversity. The pipeline was constructed between Rio Grande station near Santa Cruz and Sao Paolo and Porto Alegre. The Bolivia portion is 557km long and runs through the Otuquis Pantanal, the majority of which is listed as a national protected area and is home to the Chiquitanos and Ayoreos indigenous groups. While the pipeline could have been constructed around this forest, the companies saved at least tens of millions of dollars by going through it. The construction of this pipeline is cited as one of the clearest examples of state-company complicity in ignoring international environmental norms, and is a good example of the weakness of Bolivia’s environmental regulation.
The construction of pipelines has evoked major protests, started long processes of negotiation between companies and communities and stimulated the creation of local monitoring committees. Exploration and production projects by oil and gas companies have evoked similar responses though often on a smaller scale. Some examples documented by the Bolivian NGO Fobomade include:122

46
• The explosion and fire in a well in Madrejones, operated by Pluspetrol (Argentina), that started in October 1998 and that burned for five months. In this case, the government did not do an environmental audit, even though the law states one should be done within 15 days of the problem occurring.
• The non-compliance by Chaco (BP and Bridas) of its Environmental Impact Assessment in Ipa in the municipality of Villamontes in 1999. The company did not dig pits for the disposal of contaminated mud, polluted the river Ipa, leading to the deaths of livestock and used the community’s water sources – which were vital for agricultural irrigation – instead of digging their own wells.
• Gas flaring which occurred in the Margarita field in a Maxus well where the company was granted permission to burn 30,000 m3 a day for more than three months. (In most western countries gas flaring is only permitted under certain circumstances – such as offshore operations– because of its significant air pollution. It also of course has an impact on climate change through methane and carbon dioxide emission).
Damages payments
The most common form of payment for damages by companies to communities is through a compensation plan negotiated up front. This is in line with policies promoted by actors, such as the World Bank, which encourage companies to provide compensation for damages in the form of funding community development activities. It is a process that has been managed in a haphazard way in Bolivia. To begin with, the companies would often write the plans themselves. This would of course mean that few useful development criteria were applied, there was no local ownership whatsoever and the company was able to unilaterally fix the amount paid, without this being based on any real, transparent evaluation of the community’s loss. This has led to complaints that compensation paid to communities has been minimal. It is also the case that compensation plans are generally negotiated as if the company is making a ‘donation’ to support the development of local, poor communities, rather than as the payment for damages. It is also of course the case that the damage payments by companies will vary depending on the negotiating capacity of the communities their activities are affecting. This has also contributed to a very uneven application of compensation.
It is fair to say that since privatisation, and given the huge increase in the presence of foreign oil and gas companies operating in Bolivia, the capacity of local communities in Bolivia to monitor company practices and negotiate compensation deals has been forced to develop rapidly. A strong consensus has now developed from this experience that the whole model of negotiation and compensation is flawed. ‘Now our position is that you cannot put a cost on a forest. The biodiversity you lose is invaluable and cannot be compensated. It is not like one piece of damage, you pay and move on. It is permanent and ongoing loss.’123
The cost of losing biodiversity? There are around 90 million sufferers from the disease chagas in the world. This originated in Latin America but has now spread. As it is firmly a developing country (and poor person’s) disease no multinational drug companies have invested in finding a cure or developing prevention strategies. Currently, it is estimated that half the Bolivian population suffer from chagas. As it is known that chagas causes lower productivity, the high incidence of this disease carries a huge economic cost to the country. The Bolivian government is trying to deal with the problem, applying chemicals to houses as part of its chagas-prevention programme. However, these chemicals are banned internationally as they are known to cause cancer, and are also thought
47
to be mainly ineffective. The population also often tries to avoid their houses being sprayed, as their livestock may die afterwards. At the same time Probioma – a Bolivian NGO – has discovered a micro organism in a forest which can control chagas. This can prevent the spread of the disease by killing the insects that carry it. This, of course, is thanks to the biodiversity in Bolivia and Probioma’s study and use of the country’s genetic resources. It would be impossible to put a value on these resources and it is completely impossible to talk of compensation if this micro organism were lost.
With a greater understanding of the loss inflicted by oil and gas companies on biodiversity, the thinking in Bolivia has evolved. Communities now talk of requiring that companies pay a usufructo for their use of the land. This means that communities would not receive one compensation payment, but would instead get a yearly payment for the use of their territory. This would more closely reflect the value of the land and its biodiversity which is negatively impacted by the company’s activity. This concept has now been adopted into the new hydrocarbons law passed in 2005. This law includes a ‘local royalty’ which is formulated as a yearly payment to communities whose land is occupied by the companies. Bolivians feel it better reflects the value of the ongoing loss to biodiversity in the country.
Oil spills
On 30 January 2000 there was a major oil spill from a Transredes (Enron-Shell) pipeline which affected the Desaguadero river which runs from Lake Titicaca to Lake Poopó. A mixture of crude oil and petrol flowed for 32 hours in the river. While Transredes originally claimed 5,000 barrels had been spilled, it was later established that the equivalent of at least 29,000 barrels had leaked from the pipe. One of the most damaging findings from the investigation which took place later was that the pipeline which had been constructed by YPFB in 1965 was in grave need of repair. Part of the rationale for privatisation was of course that increased investment would flow, bringing up to date technology and better equipment and maintenance. This should also include cleaner and better environmental management. In this case the regulatory body, SIRESE – which monitors the downstream industry including the transport infrastructure – had inspected the pipelines in 1999, and asked Transredes to undertake urgent maintenance on various sections, including the place where the rupture occurred. However, no action was taken by Transredes. (As a result after the oil spill SIRESE fined the company US$110,000 for this breach). Of even more concern was the fact that after the rupture happened it took 32 hours to turn off the valves. Transredes had no idea the oil was leaking and there was absolutely no monitoring system in place to detect leaks. This issue is one which many environmental NGOs criticised the most. ‘The most shocking thing was that their technology was completely obsolete’124 The oil spill contaminated the river for 160km and contaminated water flowed into irrigation channels, affecting farmland and the flood plains, when the river also overflowed as a result of heavy rains. In all 127 communities (between 7,000 and 8,000 families) in seven municipalities in the departments of La Paz and Oruro were affected.125 The oil split was highly toxic and the contamination was over a large area, which had serious implications for people living in the highlands along the river. However, the official environmental audit126 found that Transredes did not provide any information to the affected communities until a week after the spill. Given the dangers posed by the toxic waste and contaminated water which is routinely used directly for human and animal consumption, this response to the emergency was totally inadequate. The audit also found that insufficient clean water was supplied and that medical attention was completely inadequate in the context of an oil spill. While Transredes undertook some work in schools, providing immunisation and treatment for parasites for children, their medical interventions completely ignored any side effects the communities would have suffered from their exposure to the contamination in the

48
air, water and possibly in their food. As no attention was given to the issue of contamination levels, no tests were undertaken and no registers created, making any future health monitoring extremely difficult. As the highlands are not a high productivity zone for agriculture, the river and the area beside it are both critical for livestock-raising and crop production, with the river providing drinking water and irrigation. Of the affected communities all but four depended principally on livestock to make their living.127 Crop production was mainly to provide animal feed or for the families own consumption. Products provided by their livestock (cheese, milk etc) were sold in local markets and the money would cover only the families’ most basic needs. The area is extremely poor, with the auditors calculating that 90 per cent of the population could be classified as poor. There is no doubt, therefore, that the communities were highly vulnerable to any emergency. The impacts of the oil spill on livestock were very serious, with a significant number of deaths, illnesses and genetic deformities in their young. Livestock feed was affected, because cropland was contaminated, as was the animals’ drinking water source. The communities’ production of dairy products, meat and wool-based items were therefore negatively affected and fish stocks also declined. All of this, of course, had a dramatic impact on families’ main source of income. However, they also found that their own sources of food were affected, so the spill also meant a reduction in the food available to them. Local health clinics registered an increase in cases of conjunctivitis, migraines, abdominal pain, skin lesions and diarrhoea. As their income was decreasing rapidly, families were finding they had to spend a lot more on their health. Little is known – or was investigated – about the long-term impact on the ecosystem in the region. The audit found that the vets hired by Transredes had tried to minimise their findings about the impact of the oil spill on animal health, and that Transredes had repeatedly refused to compensate villagers for livestock deaths and illnesses. While Transredes claimed that only 258 animals had died as a result of the spill, communities claimed that the figure was in fact 35,904 – an astonishing contradiction.128 The clean-up was supposed to be completed in two months but actually went on until the end of December 2000. Villagers were hired by Transredes and paid around US$6 a day to collect the oil in plastic bags. These bags were later transferred to a pit lined with plastic in Sicasica in the highlands. This was supposed to provide a temporary home before proper disposal, but the material remains there to this day. The environmental audit by the US firm found that none of the conventional analysis or separation of the waste occurred. It was also reported in the press that Transredes did not have the proper permit for this disposal129 and that the presence of oil was still noted in the area in January 2001.130 Transredes started a process of negotiating compensation with the affected communities. It appointed evaluators who were to talk to families and to fill in forms detailing losses. Transredes then decided how much to pay each community, according to the losses reported, sometimes offering much less than the amounts requested. To receive the money the community had to sign a framework agreement which included a commitment to forego any civil claims against the company. The agreement also stated that the company was not accepting responsibility for the oil spill and that it was voluntarily assuming responsibility to pay damages.131 It was presented to the communities as the quickest and most effective way to receive any payment and 125 out of 127 communities signed. In the context of extreme poverty, without government assistance, having to travel to Transredes’ office month after month, without work and having lost their agricultural income, it is not surprising that the company’s strategy worked. This was, of course, a process of private negotiation between the company and communities, excluding a role for the environmental authorities. It effectively ensured that communities would receive a bad deal, pitting poor families against the resources of multinational

49
corporations. The total compensation paid as a result of this process was less than US$1.2 million.132 ‘There was lots of manipulation by Transredes of the communities – the process created lots of divisions.’133 As this was such a large oil spill, an official environmental audit was required and a US firm was hired. The audit report was finally completed and presented on 2 April 2001. It stated that Transredes should pay US$3.7 million for the immediate damage to private property (loss of livestock, crops, reduced income etc) and US$2.2 million for damage to public property (flora, fauna, biodiversity). This sum is, of course, higher than the sums Transredes had paid out in 2000 and the company was obliged to pay the difference. It was agreed between the Bolivian authorities and Transredes that the US$2.2 million would be spent according to programmes approved by the Ministry or Agriculture, and the US NGO Care was to implement these funds in development projects. This, of course, means that what should be damages payments are treated as benign development funding. It is worth comparing the compensation figures paid in other cases. Bolivian NGOs are quick to point out that for a similar spill in Brazil, Petrobras paid US$90 million.134 A year after the spill, the Bolivian environmental authorities applied a fine of US$1.9 million for Transredes’ late remediation measures.135 Transredes appealed this fine and stated that, given its high clean-up costs, the fine is unfair. It is still refusing to pay, and it seems Transredes still feels it is appropriate to contest the fines imposed by the Bolivian government for poor environmental management.136 This is not the only case of oil spills from Transredes’ pipes, and smaller spills have been reported. Later in the same year there was a spill of 600 barrels into the river Parapeto, and indigenous communities were affected by a significant loss of fish stocks and contaminated water, which was used for drinking, washing and cooking.137 In this case, no fine was applied. In May 1999 there was a spill from one of Transredes’ plants which contaminated water in Cuchiri in the municipality of Santa Cruz. The company was fined US$2,000. The most recent case where a problem has occurred with Transredes’ pipelines is that of a gas explosion that occurred from an above-ground pipeline. It caused a huge fire and affected 200 families in a community. While no-one died, many were badly burned and had to be treated in Argentina. The suit being brought against Transredes is for US$30 million. It is likely this case will drag on for several years, and it is not clear what the company will eventually pay. Given the company’s track record on paying damages, it is highly unlikely this sum will be paid. Lax environmental enforcement has been a recurring theme in Bolivia. This omission on the part of the state – in not monitoring the sector effectively and not enforcing environmental laws and agreements made in environmental-impact assessments and agreements with communities – has of course had numerous negative impacts. In many cases, damages payments have been made, but there is a general consensus that many are inadequate. They are also mostly one-off payments that do not reflect the extent of the damage nor the ongoing loss to biodiversity. It would be completely impossible to put a figure on the loss to biodiversity in Bolivia and – given the position that is developing – it is probably also inappropriate to try to do so in this study.
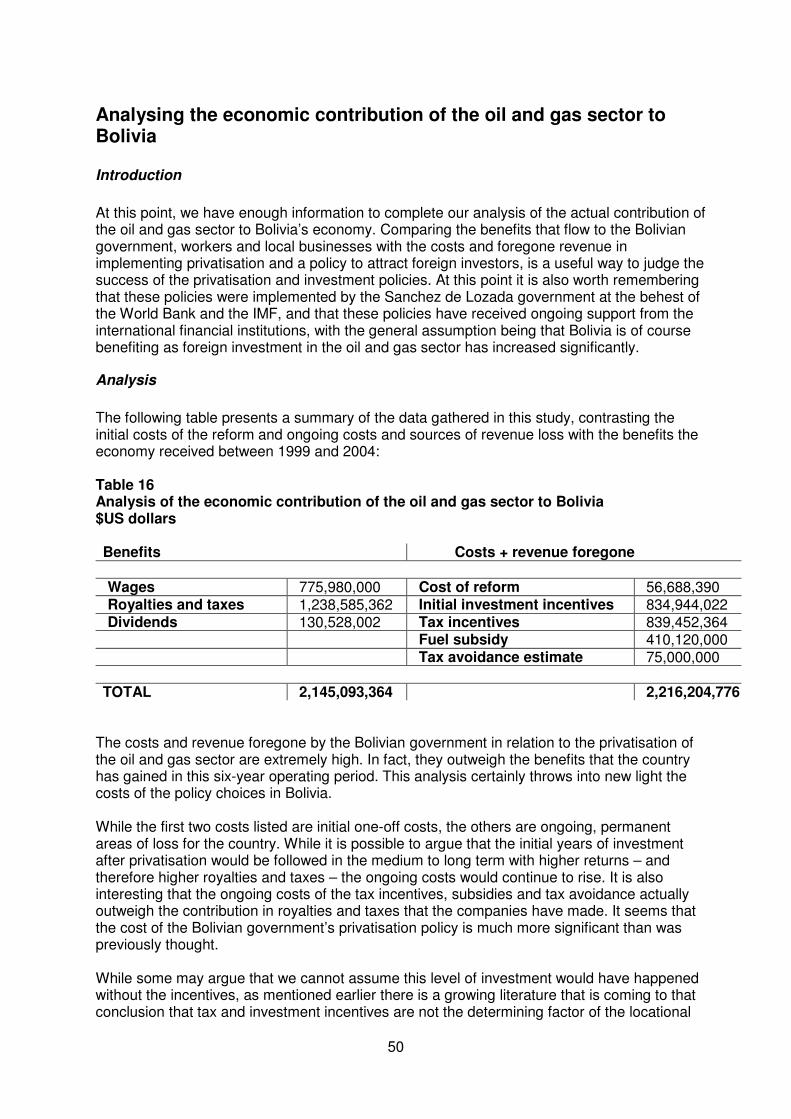
50
Analysing the economic contribution of the oil and gas sector to Bolivia
Introduction
At this point, we have enough information to complete our analysis of the actual contribution of the oil and gas sector to Bolivia’s economy. Comparing the benefits that flow to the Bolivian government, workers and local businesses with the costs and foregone revenue in implementing privatisation and a policy to attract foreign investors, is a useful way to judge the success of the privatisation and investment policies. At this point it is also worth remembering that these policies were implemented by the Sanchez de Lozada government at the behest of the World Bank and the IMF, and that these policies have received ongoing support from the international financial institutions, with the general assumption being that Bolivia is of course benefiting as foreign investment in the oil and gas sector has increased significantly.
Analysis
The following table presents a summary of the data gathered in this study, contrasting the initial costs of the reform and ongoing costs and sources of revenue loss with the benefits the economy received between 1999 and 2004: Table 16 Analysis of the economic contribution of the oil and gas sector to Bolivia $US dollars
Benefits Costs + revenue foregone
Wages 775,980,000 Cost of reform 56,688,390 Royalties and taxes 1,238,585,362 Initial investment incentives 834,944,022 Dividends 130,528,002 Tax incentives 839,452,364
Fuel subsidy 410,120,000 Tax avoidance estimate 75,000,000
TOTAL 2,145,093,364 2,216,204,776 The costs and revenue foregone by the Bolivian government in relation to the privatisation of the oil and gas sector are extremely high. In fact, they outweigh the benefits that the country has gained in this six-year operating period. This analysis certainly throws into new light the costs of the policy choices in Bolivia. While the first two costs listed are initial one-off costs, the others are ongoing, permanent areas of loss for the country. While it is possible to argue that the initial years of investment after privatisation would be followed in the medium to long term with higher returns – and therefore higher royalties and taxes – the ongoing costs would continue to rise. It is also interesting that the ongoing costs of the tax incentives, subsidies and tax avoidance actually outweigh the contribution in royalties and taxes that the companies have made. It seems that the cost of the Bolivian government’s privatisation policy is much more significant than was previously thought. While some may argue that we cannot assume this level of investment would have happened without the incentives, as mentioned earlier there is a growing literature that is coming to that conclusion that tax and investment incentives are not the determining factor of the locational

51
decisions of multinational companies. This is true of foreign investment generally, but it must be especially true for companies engaged in natural-resource extraction. After all, they have no choice but to go where the resources are located. By the very nature of the sector, locational decisions are driven by geography and not fiscal regimes, and oil and gas companies are operating in many other countries and paying much higher contributions to states. It is also important to remember that the World Bank has found that Bolivia is under-collecting tax, given the level of its development. Both corporate tax and personal income tax collection are below the levels expected for Bolivia’s income levels (while taxes collected on goods and services are higher than the norm).138 This means there is an urgent need to increase taxes, a measure which would enable the government to finance much-needed-poverty-reduction initiatives. It is also of course a moment to reflect on the issue of environmental costs. There is a growing awareness in Bolivia that if the real contribution to the economy is minimal, the huge environmental costs are thrown into a whole new light. ‘The key issue is that the environment is always subordinate to the economic but although the energy sector is important it is not the panacea to this country and if there is little income, little control of the sector, few benefits and huge environmental costs why are we following this path? We need to remember we are losing other resources as a result’.139 We already know that poor communities are bearing the brunt of the environmental costs but the impact on biodiversity is also a huge loss to the country. While the economic potential of biodiversity is a relatively unexplored area, and one that is continually undervalued by economists, there are certainly many new opportunities in the development of genetic resources and in biotechnology,140 particularly in the pharmaceutical, cosmetics and genetics industries. Given Bolivia’s huge biodiversity, it is in a special position to develop this area, and public policies relating to this are much more likely to be pro-poor, to involve local communities and – if done right - to ensure that revenue generated stays within the local economy. The International Convention on Biological Diversity also proposes an international access and benefit-sharing regime for genetic resources, which is a useful starting point for developing countries. While little thinking has been done along these lines it is a policy option that does not deserve to go unexplored.
Comparison of the pre and post privatisation period
What is, of course, important for many Bolivians is that there should be a clear understanding of how the situation has changed since privatisation. As discussed earlier, there was a large national debate about the privatisation of YPFB and many interest groups who were not in favour. It is, therefore, important to compare the benefit from the oil and gas industry to Bolivia before and after privatisation. At the time of privatisation the capitalisation minister in 1996 assured the Bolivian people that there would be no loss in fiscal revenue whatsoever, and that the Treasury would remain in the same favourable position.141 This was also one of the guarantees presented by the president to union leaders in the process of negotiation.142 However, as the following table shows, the contribution that YPFB made in the six years previous to privatisation to the Bolivian Treasury was superior to that of the privatisation period. This table includes the total payments, the sales taxes included in that calculation and YPFB’s contribution without the consumer contribution. (This is necessary to ensure a fair comparison of the pre- and post-privatisation given in the above sub-section on royalties and taxes - beginning on page 33 - we looked purely at companies’ contributions).

52
Table 17 Payments to the Treasury by YPFB before privatisation Millions of US$
Year Total income YPFB
Payments to Treasury
Sales taxes YPFB contribution without sales taxes
1991 641.1 416.7 56.1 360.6 1992 562.5 365.6 68.3 297.3 1993 610.8 397.0 66.8 330.2 1994 500.0 325.0 70.2 254.8 1995 529.1 343.9 75.8 268.1 1996 562.8 365.8 86.2 279.6 Total 3,406.3 2,214 423.4 1,790.6
Source: Carlos Villegas143
For the six years prior to privatisation US$298.43 million was the annual average transfer to the state. For the six years post-privatisation that we studied, US$206.43 million was the annual average transfer to the state. Excluding all consumers’ contributions the total contribution of YPFB in the six years prior to privatisation was US$1,790.6 million. In the six years we looked at post-privatisation, the companies contributed US$1,238.6 million. This is a reduction in US$552 million and 31 per cent from YPFB’s operations. So by simply comparing royalties and taxes (excluding sales taxes), we see that YPFB was a higher contributor to the Treasury than the companies are post-privatisation. But it is also critical to remember that YPFB’s contribution came without the costs of the reform, subsidies, profit remittance or any risks of tax-avoidance or contract-abuse. As YPFB’s operations were significantly smaller-scale, Bolivia was also receiving higher benefits without communities having to bear the same level of environmental costs. This reduction in benefits to Bolivia is occurring in the context of a huge increase in investment, production, and exports, as well as increasing prices. In parallel to this ‘privatisation success story’ we have also shown (in Chart 3 on page 36) that the state is receiving a smaller and smaller share of the benefits, as companies’ activity and turnover increases. The country has assumed large costs in privatising its oil and gas sector, with the expectation that under privatisation investment, production and state revenue would be much higher. This analysis instead points to a significant failure. It is not surprising that Bolivians are extremely sceptical of the benefits that foreign companies are bringing to the country.
Shifting the tax burden
It is also true that since privatisation sales taxes on fuel products have grown in importance as a source of revenue for the Bolivian Treasury from the oil and gas sector. This was a key element in the design of the privatisation process, in recognition of the fact that the royalty rates were being lowered. Table 18 Income to the Treasury from sales taxes in the oil and gas sector In bolivianos and US dollars
Sales tax 1999 2000 2001 2002 2003 2004 IEHD 72,563,186 1,141,136,265 1,096,883,114 1,130,382,359 1,009,026,371 1,106,392,164 IVA 99,123,864 151,802,713 217,240,705 140,962,012 254,205,211 240,289,933 IT 16,106,563 95,354,505 99,336,556 119,250,809 151,326,045 267,087,414 Total (bolivianos)
187,793,613 1,388,293,483 1,413,460,375 1,390,595,180 1,414,557,627 1,613,769,511
Total (dollars)
31,298,935 216,920,857 206,948,810 185,412,691 184,187,191 202,989,876
Source: National Tax Service (SIN)

53
The total take for the state in consumer taxes in this six-year period was US$1,027,758,360. This certainly rivals the royalty and tax-take from the companies after privatisation in the same period, being only 17 per cent less than the company contribution. The consumer taxes in this six-year period are greater than the revenue that the Bolivian government lost when it lowered royalty rates. This means the state was in fact able to reduce the impact the lower royalties might have had. It has ensured that the Bolivian people are sustaining tax revenue while multinational companies are paying less of their share. With privatisation the tax burden was deliberately shifted from the companies extracting oil and gas over to (the mainly poor) Bolivians who are purchasing fuel products on the local market. This, as presented by the World Bank in 1994, was an explicit choice that has directly contributed to Bolivia’s highly regressive tax regime. As regressive tax systems undoubtedly contribute to income inequality, it is unsurprising that Bolivia has witnessed an increase in income inequality since privatisation.

54
Recent changes to the oil and gas sector In May 2005, the Bolivian government – under serious public pressure – brought in a new hydrocarbons law. This essentially sought to return to the situation pre-privatisation when the fiscal regime was much stronger. It also allowed YPFB to participate in the whole supply chain, so that it could now explore, undertake production, refine and sell oil and gas directly. The new law also has new provisions about indigenous peoples’ rights and companies’ impacts on the environment. The main fiscal reform brought in, in 2005, was the abolition of the differentiation between existing and new reserves. All reserves became subject to the 18 per cent royalty rate that had been applied formerly only to new reserves. The law then introduced a new tax (the Impuesto Directo en los Hidrocarburos – IDH) which stands at 32 per cent. This is a direct tax on the value of all oil and gas production. It essentially operates like a royalty payment but is formulated as a tax, because the Bolivian government, under its contracts with foreign investors, is forbidden from changing the royalty payments due. This new tax has increased the government’s revenue as it is applicable to all oil and gas production, whereas before the higher royalty that took its place was only payable on the small percentage of existing reserves being produced.144 The initial payment due on the value of production is now 50 per cent (18 per cent royalty plus 32 per cent IDH). The application of the IDH since May 2005 has brought in US$278.8 million from upstream industries, representing a huge increase in the US$30.7 million tax-take of the state from upstream companies in 2004.145 However, it should also be noted that the IDH does not actually increase the Treasury’s share as much as might be expected. Given the structure of Bolivian law, the IDH has to be distributed between the Treasury and the prefectures, municipalities and universities. Payments of the IDH also depend on the department where the oil and gas are produced. Given these rules, Tarija, being the biggest producing department, is the biggest winner from the introduction of the IDH and unfortunately the Treasury gains the least. The non-producing (and poorest) departments get much less and no criteria of population size or need has instructed the manner of dividing up the new tax revenue.146 As mentioned earlier, three of the four producing departments are the richest in Bolivia. Given the widespread poverty and inequality in the country, it is imperative for central government to be able to channel oil and gas revenue to the poorer departments. Increasing royalties – not taxes – would be the best mechanism to do this, but unfortunately Bolivia felt tied by its contracts with foreign investors (and the bilateral investment treaties it had signed) so the government was unable to make this reform in the most appropriate manner. This move by Bolivia to increase the taxes on oil and gas companies was, of course, closely monitored and generally not well received. While the law was under discussion the country was under pressure from various sources. As early as June 2004 the IMF was already warning Bolivia that IMF cooperation – and international aid – depended on the implementation of a viable strategy for hydrocarbons and a ‘positive’ result from the national energy referendum which the country was planning.147 According to the IMF any move that was seen to potentially effect investment and the level of exports would compromise Bolivia’s position with the IMF, and given the IMF’s role as gatekeeper with other financial institutions and bilateral donors, this would therefore severely restrict the financing available to the country.148 One of the reasons the government of Carlos Mesa was so reluctant to approve the new law was precisely because it felt it would compromise Bolivia’s position with the IMF. Bolivia had signed up to certain guarantees under the fifth revision of its Stand By programme with the

55
IMF in early 2005.149 These guarantees include a general commitment to maintain an attractive framework for foreign investors, as well as a specific commitment to respect the contracts signed with foreign investors, and maintain the current regulations established in the law that govern their investment. In January 2006 the IMF also made it clear that for it to sign a new Stand By agreement with Bolivia, thereby giving the green light to other creditors to lend to the country, the Morales government would have to ‘adjust’ the law passed in May 2005, particularly addressing the new tax (IDH) which the companies are not in agreement with.150 The IMF is of course not the only source of pressure. The US also expressed its concern about the passing of the new hydrocarbons law in 2005, with a US Treasury representative saying that it would be likely to inhibit foreign investment.151 The former US ambassador to Bolivia David Greenlee also made clear that a revision of the hydrocarbons regime – particularly moves towards nationalisation – would carry ‘serious problems’ for the country and would ‘have consequences’.152 Bolivia’s revision of its management of the oil and gas sector is the main reason that Bolivia has not been allowed to enter into trade negotiations with the US alongside Peru, Colombia and Ecuador. The intervention of the US is all the more notable, given its oil and gas interests in the country are minimal compared to those of European Union countries. The companies operating in Bolivia were also, of course, extremely active in their opposition to the new law in 2005, sending reports to the Bolivian Congress and meeting with ministers. The position which they put to Congress, was that the law was confiscatory, that it would discourage new investment, that they would halt their own investments, and that they would be forced to go to the international commercial courts for dispute resolution.153 Their position in the press in Bolivia was fairly discreet, but several papers reported that the companies had said they would suspend their investment in the country unless a more viable proposal was enacted.154 Once the new hydrocarbons law was passed in May 2005, the companies did begin paying the increased tax but they included a declaration with each payment, stating that they felt this payment was illegal and were expecting reparations in the future. At least seven of the oil and gas companies presented the Bolivian government with letters questioning the new law in the framework of the bilateral investment treaties which Bolivia has signed, providing various forms of protection for the interests of foreign investors. These companies were BG Group (UK), Total (France), Repsol-YPF (Spain), Pan American Energy (in which BP has an interest), Vintage (USA), Exxon Mobil (US) and Pluspetrol (Argentina). At this point the IMF publicly supported the idea of compensation for the companies.155 The controversy of course did not end there. When the Morales government started the most recent reform to the sector on 1 May 2006, a renegotiation of contracts became inevitable. The government brought in a further change to the fiscal regime, applying a temporary supplementary tax of 32 per cent to be paid on the two largest fields, San Antonio and San Alberto. This was paid for 180 days while the government carried out audits and restructured the management of the sector. New contracts were signed in November 2006. Under the new agreements, YPFB is directly involved in the supply chain receiving the goods and selling them on. From the proceeds of sale 50% goes directly to the government (as was the situation since May 2005). From the remaining 50% companies are able to claim a maximum of 30% as costs and the remaining 20% profits are then split between companies and the state. The profit split is variable depending on the volume and value of sale. This means the government is likely to take around a 60% share of the wealth generated by the oil and gas sector under the new contracts – a significant rise from their 27% royalties and taxes share in 2004. Their share should also go up in time as investment costs are recouped and profits increase.

56
Conclusion The aim of this study was to assess whether a stable developing country applying the ‘right’ economic framework and the reforms mandated by the international financial institutions could effectively benefit from foreign investment in its oil and gas sector. Unfortunately, as this analysis shows, the privatisation of Bolivia’s oil and gas sector did not deliver the benefits the country expected to receive. The initial costs of the reform and the ongoing costs and revenue lost by the government, before the recent reforms, show that privatising oil and gas has indeed been a costly policy in Bolivia. There has been an extremely limited benefit (if not non-existent benefit) to the economy under privatization and up until 2005. It is also notable that the royalties and tax revenue provided in the 6 year period analysed after privatisation are significantly less that that provided by YPFB before privatisation. This is extremely surprising as the industry’s production, exports and earnings have all grown enormously. The design of the fiscal regime instituted since privatisation – which according to the World Bank was to be ‘internationally competitive’ – actually led to the state receiving an ever-decreasing share in the wealth generated by the sector. This also means we can assume the outlook for the country would have continued to deteriorate if Bolivia had not instituted the recent reforms. In addition, as companies saw their royalty payments fall with privatisation, the tax burden was purposefully shifted from companies to consumers. This made Bolivia’s tax system more regressive – a measure highly inappropriate in a poor country, and one which has negatively affected income inequality – lowering the income of poor communities. We should also remember that this shift has taken place in the context of record levels of profit recorded by the industry. Exxon Mobil announced at the end of July 2006 global profits of US$10.4 billion for the second quarter of 2006 – the second-highest profits recorded in corporate history. BP’s second quarter profits in 2006 were US$6.1 billion and Shell’s were US$7.3 billion.156 One of the biggest conclusions that can be drawn from this study is that it is inappropriate to cite the level of foreign investment and export earnings as a key indicator of success for any country. Firstly, such an analysis is short-sighted as it focuses on the inflow of capital while ignoring the outflows. But it also fails to analyse the range of costs involved in both attracting that capital and hosting a foreign investor. Increasing foreign investment and exports can go hand and hand with a decreasing and even negative contribution to the local economy, depending on the investment framework in place. By continually focusing on attracting investment rather than thinking about – and evaluating – what that investment actually achieves, we continue to ask the wrong questions, and to make it extremely difficult for policymakers to make the right decisions. This study also demonstrates that the key issue is the fairness of terms agreed between companies and developing countries. Tax revenues are of crucial importance to developing countries, and it is right that these are scrutinised in the extractive sectors which provide few other benefits and carry significant environmental costs. Reliable tax revenue will help create stable governments who can meet the needs of their population and provide an environment for the local private sector to develop. However, tax policy is still a relatively neglected area and donors prefer to focus on increasing inflows to developing countries (through aid, debt relief and the promotion of investment), while ignoring the great strides that could be made if there was a focus on preventing resource outflows. When donors do get involved in tax policy reform it is all too often to promote the adoption of regressive tax policies. This is evidenced by the World Bank and IMF position in Bolivia in the 1990s, but similar mistakes are being repeated today as DFID’s technical support programme for tax reform in east Africa attests to.

57
High-level tax policy officials from east African countries have expressed concerns that DFID is promoting highly regressive tax reform.157 All developing countries are tasked with creating a progressive, effective taxation structure. Those with natural resources have the additional task of ensuring that a fair share of the benefits is negotiated with foreign companies. Unfortunately, significant investigation into alternative taxation structures, which would be suitable for developing countries is practically non-existent. Although the process has been extremely challenging for the country Bolivia is in the fortunate position of having successfully revised its oil and gas fiscal policy. However, the country’s tax capacity also needs to be further developed, so that the state can effectively monitor production levels, costs and profits, and in order to address problems of transfer pricing and tax avoidance. This, of course, is a need for many developing countries. It is interesting to reflect on the role of the international financial institutions in Bolivia’s reform. Obviously, privatisation was a reform which both the World Bank and the IMF pushed for, supported financially and technically and evaluated in glowing terms. We can only assume the World Bank has altered its position on Bolivia’s fiscal policy since the 1990s. In its 2006 report on poverty reduction in Latin America, the World Bank stated that Bolivia would need to increase its tax level by 18 per cent to cut poverty in half over a ten-year period (with a per capita growth rate of three per cent a year).158 According to the report’s finding, this is the highest tax increase needed in Latin America to halve poverty rates. Presumably, given the urgent need of fiscal policy reform and the dramatic (and probably unrealistic) increase in tax rates required to reduce poverty significantly, the World Bank will approve of Bolivia’s recent attempts to address tax shortfalls in the oil and gas sector. The IMF, however, was wary – if not hostile – to the idea of reforming the fiscal regime and adopting new management models in the sector. As the IMF’s primary interest in Bolivia is that the country should reduce its fiscal deficit, it is difficult to understand a position in which tax cuts for companies are the preferred option, tax increases are resisted and companies encouraged to sue Bolivia for loss. Such a position is of course a contradiction, with little thought going into the impact on the Bolivian Treasury, and a disappointing analysis of the role that tax plays in development. Such poor policy choices can of course lead to social conflict, as the Bolivia experience – and particularly the ‘gas wars’ demonstrate. Conflict is likely to lead to calls for change and an unstable business environment. This in turn can compromise a company’s long-term commercial interest in the country. From this enlightened perspective it is obvious that such an investment model, while not bringing a fair share of benefits to Bolivia, is also not in the long-term interest of the companies. Reform is therefore beneficial, both to Bolivia and to the companies over the long term. But the reform process did present huge challenges to the fledging Bolivian government and there have been no shortage of competing interests putting pressure on the government. ‘There are financial pressures as firms say they will no longer invest. There is insecurity that the internal market will get enough fuel. Opinion formers in newspapers talk of foreign investors leaving. The IMF says it will not lend to us if we touch the hydrocarbons sector. Concessional credit options are blocked. The challenge in the Bolivian courts to the constitutionality of bilateral investment agreements has been denied. Everyone can see that things are getting harder and the more we try to change the harder it becomes. Certainly this is the perception in Bolivia right now… The worst thing is that the game is now to tell us that Bolivia is not a viable country, that business here would not be viable if managed in any other way. This is the worst manipulation of people’s fears’.159 The current perspective from some within the industry is that Bolivia has lost its strategic position in the region as an energy supplier and that this position is unrecoverable. Neighbouring Peru has lowered its oil and gas royalties to 14 per cent and has given a 20-

58
year guarantee of legal security and fiscal stability to investors. Petro Peru also has an LNG project, which means Peru could end up supplying gas to the US and Mexican markets. Some have said that Bolivia’s reform of the management of the sector has created instability for investors and effectively ruined the country’s credibility for the foreseeable future.160 ‘Bolivia’s biggest mistake was to take on the oil and gas industry. In doing so it has taken on the world – global capital. The oil majors care about their shares and if you are affecting their share value then they will not be happy. Evo is fighting against the whole world when he takes on the interests of the companies – he has taken on global interests’.161 However, all the companies in Bolivia have signed up to the new contracts, agreed to the new terms with not a single company pulling out. Presumably all of the companies feel they can make sufficient profit under the new terms. However, it is still not possible to predict the amount of new investment Bolivia will receive in the future from current or new investors. The BG Group has stated: ‘It remains to be seen whether further investment BG, or indeed other investors, will be possible in the future in Bolivia’162. At the moment, though, it does seem as if other companies are interested. There were visits in September 2006 from two Russian companies interested in investing in upstream activities and in petrochemicals163 as well as interest and proposals from China and England.164 It remains to be seen how the current changes will affect the future level of investment and how much revenue will be generated for the state in the future. However, these reforms have provided a foundation for the state to share more equitably in the wealth created. Hopefully, this is a new opportunity that will ensure the Bolivian people have a chance to truly benefit from the wealth created from their oil and gas reserves.
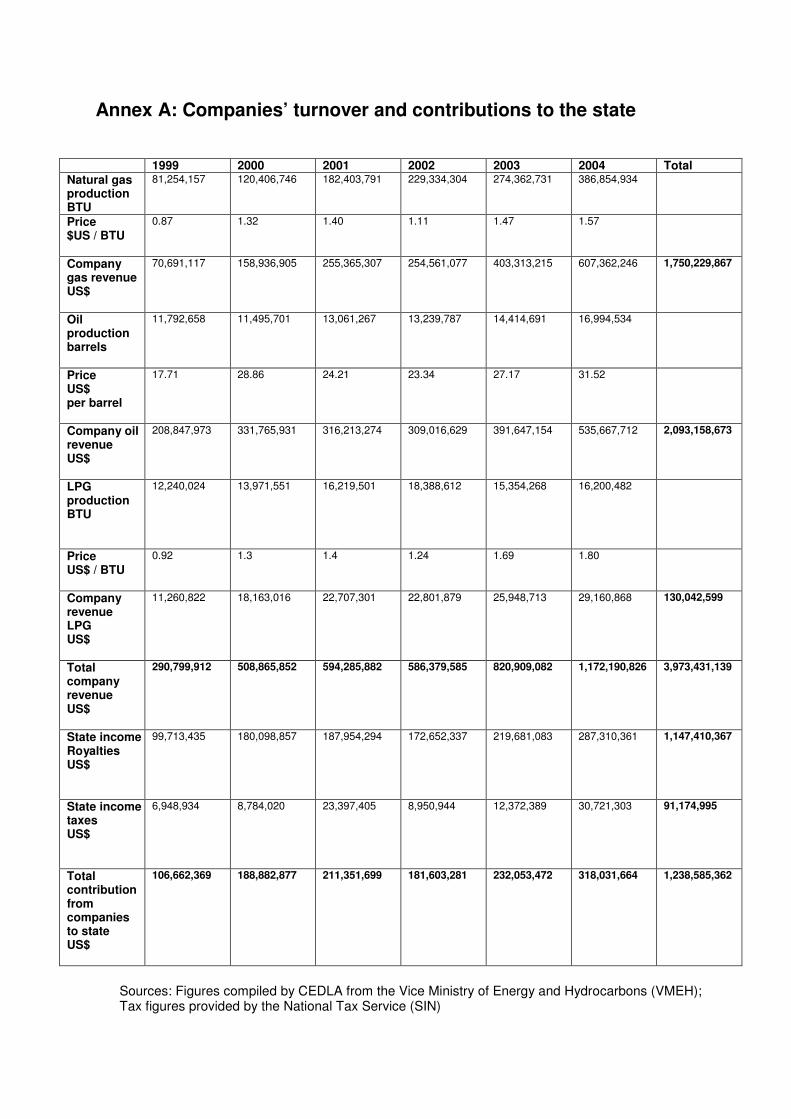
Annex A: Companies’ turnover and contributions to the state
1999 2000 2001 2002 2003 2004 Total Natural gas production BTU
81,254,157 120,406,746 182,403,791 229,334,304 274,362,731 386,854,934
Price $US / BTU
0.87 1.32 1.40 1.11 1.47 1.57
Company gas revenue US$
70,691,117 158,936,905 255,365,307 254,561,077 403,313,215 607,362,246 1,750,229,867
Oil production barrels
11,792,658 11,495,701 13,061,267 13,239,787 14,414,691 16,994,534
Price US$ per barrel
17.71 28.86 24.21 23.34 27.17 31.52
Company oil revenue US$
208,847,973 331,765,931 316,213,274 309,016,629 391,647,154 535,667,712 2,093,158,673
LPG production BTU
12,240,024 13,971,551 16,219,501 18,388,612 15,354,268 16,200,482
Price US$ / BTU
0.92 1.3 1.4 1.24 1.69 1.80
Company revenue LPG US$
11,260,822 18,163,016 22,707,301 22,801,879 25,948,713 29,160,868 130,042,599
Total company revenue US$
290,799,912 508,865,852 594,285,882 586,379,585 820,909,082 1,172,190,826 3,973,431,139
State income Royalties US$
99,713,435 180,098,857 187,954,294 172,652,337 219,681,083 287,310,361 1,147,410,367
State income taxes US$
6,948,934 8,784,020 23,397,405 8,950,944 12,372,389 30,721,303 91,174,995
Total contribution from companies to state US$
106,662,369 188,882,877 211,351,699 181,603,281 232,053,472 318,031,664 1,238,585,362
Sources: Figures compiled by CEDLA from the Vice Ministry of Energy and Hydrocarbons (VMEH); Tax figures provided by the National Tax Service (SIN)

1 World Bank figures for 2004 and Alvaro Garcia Hurtado, The Social Dimensions of Globalization in Latin America: Lessons from Bolivia and Chile, ILO Working Paper No. 23, May 2004. 2 G Perry, O Arias, J Humberto López, W Mahoney, L Servén, Poverty Reduction and Growth: Virtuous and Vicious Circles, World Bank, 2006. 3 See Christian Aid, The Rich Seam: Who is really benefiting from the commodity price boom?, 2007 4 Hilary Benn’s first White Paper speech, ‘Growth and poverty reduction – creating more and better jobs in poor countries’, delivered at the New Economics Foundation, 19 January 2006. 5 See Daniel Chudnovsky and Andres Lopez, FDI, Development and the New Global Economic Order – a Policy Brief for the South, South Centre, 1999; Globalization and Developing Countries: Foreign Direct Investment and Growth and Sustainable Human Development, CENIT, March 1999. 6 Cited in Bernie Ward and Julie Lewis, ‘Plugging the Leaks: Making the most of every pound that enters your local economy’, New Economics Foundations, 2002. 7 World Bank, ‘Tax Incentives: Using tax incentives to attract foreign direct investment’, Viewpoint, Private Sector and Infrastructure Network, January 2003. 8 Sanjaya Lal, Learning From the Asian Tigers: Studies in Technology and Industrial Policy, Macmillan, 1997; Alice Amsden. Asia’s Next Giant: South Korea and Late Industralisation, New York, Oxford University Press, 1989; Alice Amsden, The Rise of the Rest: Challenges ToTthe West From Late Industrialising Economies’, Oxford University Press, October 2000; Ha-Joon Change, Kicking Away the Ladder: Development Strategy In Historical Perspective, Anthem Press, 2002. 9 IMF, Bolivia: Ex Post Assessment of Longer Term Program Engagement – Staff Report and Public Information Notice on the Executive Board Discussion, Country Report No. 05/139, IMF, April 2005. 10 Lykke Andersen, Osvaldo Nina, Dirk Willem te Velde, Trade, FDI, Growth and Poverty in Bolivia, Grupo Integral, July 2004. 11 Economist Intelligence Unit, Bolivia Country Profile 2006, 2006. The figure cited is for 2005. 12 For example, see editorial, ‘Unnatural disaster’, Los Angeles Times, 6 May 6 2006, which argues that Morales’ decision to nationalise the Bolivian energy sector will be disastrous, while at the same time recognising that the countries resources have ‘long been exploited by foreigners with little benefit to the indigenous population’. 13 Andrew Pendleton, Judith Melby, Liz Stuart, John Davison and Sue Bishop, Fuelling Poverty: Oil, war and corruption, Christian Aid, 2003. 14 The rate of extraction from 2000-2005. 15 The Economist, ‘Oil companies: Improving their Fieldcraft’, Main report, 15 April 2006. 16 Ibid. 17 Greg Muttitt, Crude Designs: The rip off of Iraq’s oil wealth, Platform, November 2005. 18 Ivo Bozon, Stephen Hall, Svein Harald Oygard, ‘What’s next for big oil?’, p 6. The McKinsey Quarterly, Number 2, 2005. 19 WTO, Trade Policy Review Norway, Secretariat Report, September 2004. 20 Alanna Hortzok, Citizen Dividends and Oil Resource Rents: A focus on Alaska, Norway and Nigeria, Earthrights, 2004. 21 Menas Associates Limted and Frooskaparsetur Foroya, ‘Study of the Impact of the Development of Hydrocarbon Resources in the Faroe Islands’ December 2001. 22 Alanna Hortzok, Citizen Dividends and Oil Resource Rents: A focus on Alaska, Norway and Nigeria, Earthrights, 2004. 23 See Andrew Pendleton, Judith Melby, Liz Stuart, John Davison and Sue Bishop, Fuelling Poverty: Oil, war and corruption, Christian Aid, 2003; Jeffrey Sachs, Andrew Warner, Natural Resource Abundance and Economic Growth, Harvard Institute for International Development, 1995; Michael Ross, Extractive Industries and the Poor, Oxfam America, October 2001. 24 Stephen Kretzmann and Irfan Nooruddin, Drilling into Debt: An investigation into the relationship between debt and oil, Oil Change International, 2005 25 See, for example, Greg Muttitt, Crude Designs: The rip off of Iraq’s oil wealth, Platform, November 2005 and Ian Rutledge, The Sakhalin II PSA: A production non sharing agreement – an analysis of revenue distribution, Platform, CEE Bankwatch Network, Friends of the Earth, Pacific Environment, WWF, Sakhalin Environment Watch, November 2004. 26 ECLAC, ‘Foreign Investment in Latin America and the Caribbean’,. Chapter IV, Hydrocarbons: Investments and corporate strategies in Latin America and the Caribbean, 2001.

61
27 For a fuller description of the changes see Gregg Muttitt and James Mariott, ‘The tale of Neutron John: BP’s successful efforts to reduce its tax payments’, Platform, June 2003. 28 Ian Rutledge and Philip Wright, The Windfall That Got Away: Profitability and taxation in the north sea oil and gas industry, University of Sheffield Energy Studies Programme, June 1997. 29 The Scottish Parliament Information Centre, ‘Oil and Gas’, Spice Briefing, May 2002. 30 UKOOA’s employment figures include direct, indirect and induced jobs. Induced jobs are described as those supported by activity induced by oil and gas employees spending their disposable income throughout the wider economy. 31 See UKOOA, UKCS Economic Estimates, May 2006. 32 These figures were supplied by the Department of Trade and Industry and relate to upstream activities only. 33 See UKOOA, UKCS Economic Estimates, May 2006. 34 Amy Taylor, Chris Severson Baker, Mark Winfield, Dan Woynillowicz and Mary Griffiths, When the Government is Landlord: Economic Rent, Non-renewable Permanent Funds and Environmental Impacts Related to Oil and Gas Developments in Canada, The Pembina Institute, July 2004. 35 Ibid. 36 Ibid. 37 Ibid. 38 The terms of the production sharing agreement in the Sakhalin II oil and gas project in Russia’s far east is an example of this. See Ian Rutledge, The Sakhalin II PSA: A production non sharing agreement – an analysis of revenue distribution, Platform, CEE Bankwatch Network, Friends of the Earth, Pacific Environment, WWF, Sakhalin Environment Watch, November 2004. 39 Carlos Villegas Quiroga, Privatización de la industria petrolera en Bolivia: Trayectoria y efectos tributarios, Cides-Umsa, Cedla, Fobomade, Diakonia, Plural, 2004. 40 Economist Intelligence Unit, Bolivia Country Profile 2006, 2006. 41 INE 42 Ibid. 43 YPFB. 44 Economist Intelligence Unit, Bolivia Country Profile 2006, 2006. 45 YPFB. 46 Ibid. 47 Ibid. 48 It is worth noting that these figures tally with the World Bank figures on profit remittance from Bolivia. Their figures show that a total of US$1,181 million was remitted in this period. As it is likely – given the amount of foreign investment in the oil and gas sector – that 40-50 per cent of profit remittance is linked to oil and gas activity, we would expect to see between US$470 million and US$590 million of profit remittance from the oil and gas industry presence. Our estimate of US$462,492,048 is therefore reasonably solid. 49 Economist Intelligence Unit, Bolivia Country Profile 2006, 2006. 50 World Bank figures for 2004 which are related to the national poverty line. 51 Alvaro Garcia Hurtado, The Social Dimensions of Globalization in Latin America: Lessons from Bolivia and Chile, ILO Working Paper No. 23, May 2004. 52 See Stephan Klasen, Macroeconomic Policy and Pro-Poor Growth in Bolivia, Ibero-America Institute for Economic Research, June 2006, for a fuller discussion of Bolivia’s economy and the situation of the poor. 53 YPFB. 54 La Prensa, ‘Cierre de válvulas deja sin ningún carburante a La Paz’, 9 June 2005 55 La Prensa, ‘Repsol no subirá la producción de GLP las refinerias analizan’, 12
October
2005. 56 Around US$3.8 billion was transferred to the Treasury between 1985 and 1996. See Carlos Villegas Quiroga, Privatización de la industria petrolera en Bolivia: Trayectoria y efectos tributarios, Cides-Umsa, Cedla, Fobomade, Diakonia, Plural, 2004. 57 Presencia, ‘No a la expropriación de empresas estatales’, 26 March 1995. 58 Ultima Hora, ‘Hay opciones a la capitalización de YPFB’, 5 February 1996. 59 The Economist, ‘Bolivia: Share out’, 26
March 1994.
60 World Bank, Bolivia Structural Reforms, Fiscal Impacts and Economic Growth, Report No 13067-BO, October 1994.

62
61 ESMAP, Bolivia: Preparation of capitalization of the hydrocarbon sector, Volume 1, Report No 191/96, 1996. 62 Opinión, ‘Capitalización marcha según lo previsto dice el Banco Mundial’, 16 February 1996. 63 Ultima Hora, ‘Gobierno: Aún no son necesarios los desembolsos del Banco Mundial’, 26 October 1996. 64 Interview with Jorge Tellez, former YPFB engineer and former sales director of SIRESE (Superintendencia de Hidrocarburos), La Paz,13 September 2006. 65 Ibid. 66 Primera Plana, ‘Frente amplio contra la privatización’, 3 March 1996. 67 Los Tiempos, ‘Movilización de trabajadores criticó política de Gobierno’, 2 March 1996. 68 El Mundo, ‘Empresarios cruceños a favor de capitalización’, 21 March 1996. 69 Ley de Inversiones, No 1182, 17 September 1990. 70 El Diario, ‘Plantea capitalización solo algunas áreas de YPFB’, 20 June 1995. 71 Primera Plana, ‘Gobierno asegura que críticas a plan de capitalización caerán por su propio peso’, 22 June 1995. 72 Carlos Villegas Quiroga, Privatización de la industria petrolera en Bolivia: Trayectoria y efectos tributarios, Cides-Umsa, Cedla, Fobomade, Diakonia, Plural, 2004. 73 See the World Bank privatisation database. 74 Ley del Sistema de Regulacion Sectorial (SIRESE) No.1600, 28 October 1994. 75 Ley de Hidrocarburos, No.1689, 30 April 1996. 76 See Enrique Mariaca, ‘Evolución de la politica energética en el país y el rol de YPFB’ in Foboade, Política de Hidrocarburos en Bolivia y observaciones al proyecto de venta de gas a Mexico-Estado Unidos, August 2002. 77 Pablo Poveda Avila and Alvaro Rodríguez, El Gas de los Monopolios’: Análisis de la política de hidrocarburos en Bolivia, Cedla, August 2006. 78 YPFB, Monthly Report, December 2002. 79 Carlos Villegas Quiroga, Privatización de la industria petrolera en Bolivia: Trayectoria y efectos tributarios, Cides-Umsa, Cedla, Fobomade, Diakonia, Plural, 2004. 80 Pablo Poveda Avila and Alvaro Rodríguez, El Gas de los Monopolios: Análisis de la política de hidrocarburos en Bolivia, Cedla, August 2006. This amount includes sales taxes. 81 In Bolivia the term regalias y participaciones is used to describe the royalty system. This is because under the Bolivian system royalties go to the department where production takes place, and ‘participation’ payments are made to the Treasury or to national YPFB accounts. All of these payments together can be considered as making up the full royalty payment on oil and gas production. 82 Telephone interview with Humberto Vacaflor Ganan, journalist, 13 September 2006. 83 See Viewpoint, ‘Tax Incentives: Using tax incentives to attract foreign direct investment’, The World Bank Group Private Sector and Infrastructure Network, January 2003. 84 McKinsey Quarterly, 2004-1. 85 World Bank, Bolivia Structural Reforms, Fiscal Impacts and Economic Growth, Report No 13067-BO, October 1994. 86 ECLAC, Foreign Investment in Latin America and the Caribbean, 2001. See Chapter IV, Hydrocarbons: Investments and corporate strategies in Latin America and the Caribbean. 87 Ibid. 88 Juan Carlos Virreira Mendez, ‘Las Capitalizadas en Cifras: Sector Hidrocarburos – datos comparativos’, Cuaderno No 4, Oficina del Delegado Presidencial para la Revisión y Mejora de la Capitalización, November 2003. 89 W Huff, The Economic Growth of Singapore. Trade and development in the twentieth century, Cambridge University Press, 1994. 90 Interview with Raúl Kieffer, General Manager, Bolivian Chamber of Hydrocarbons, 15 September 2006, Santa Cruz. 91 Lykke Andersen, Osvaldo Nina, Dirk Willem te Velde, Trade, FDI, Growth and Poverty in Bolivia, Grupo Integral, July 2004. 92 Interview with Raúl Kieffer, Bolivian Chamber of Hydrocarbons, 15 September 2006, Santa Cruz. 93 Lykke Andersen, Osvaldo Nina, Dirk Willem te Velde, Trade, FDI, Growth and Poverty in Bolivia, Grupo Integral, July 2004. 94 Interview with Raúl Kieffer, General Manager, Bolivian Chamber of Hydrocarbons, 15 September 2006, Santa Cruz.

63
95 G Perry, O Arias, J Humberto López, W Mahoney, L Servén, Poverty Reduction and Growth: Virtuous and Vicious Circles, World Bank, 2006 96 See Carlos Villegas, ‘Capitalización y privatización del sector hidrocarburos – trayectoria y efectos tributarios’ in Fobomade, Política de Hidrocarburos en Bolivia y observaciones al proyecto de venta de gas a México y Estados Unidos, August 2002. 97 See DTI income and expenditure figures for the industry, and HMRC for government revenue figures. Also note this calculation is based purely on the corporation tax, excluding royalties and any payments under the special petroleum revenue tax which might still be due after 2002. 98 Interview with Raúl Kieffer, General Manager, Bolivian Chamber of Hydrocarbons, 15 September 2006, Santa Cruz. 99 Diego Sanchez-Ancochea, ‘Advantages: Costa Rica and the Dominican Republic under Globalization’, World Development, June 2006. 100 Ibid. 101 Interview with Raúl Kieffer, General Manager, Bolivian Chamber of Hydrocarbons, 15 September 2006, Santa Cruz. 102 Juan Carlos Virreira Mendez, ‘Cuánto Costó la Capitalización’, Cuaderno No 5, Oficina del Delegado Presidencial para la Revisión y Mejora de la Capitalización, February 2004. 103 See Enrique Mariaca, ‘Evolución de la política energética en el país y el rol de YPFB’ in Fobomade, Política de Hidrocarburos en Bolivia y observaciones al proyecto de venta de gas a Mexico-Estado Unidos, August 2002; and Pablo Poveda Avila and Alvaro Rodríguez, El Gas de los Monopolios: Análisis de la política de hidrocarburos en Bolivia, Cedla, August 2006. 104 Juan Carlos Virreira Mendez, ‘Las Capitalizadas en Cifras: Ejecución de Inversión’, Cuaderno No. 3, Oficina del Delegado Presidencial para la Revisión y Mejora de la Capitalización, August 2003. 105 Prem Sikka and Colin Haslam, Transfer Pricing and its Role in Tax Avoidance and the Flight of Capital: Some theory and evidence, University of Essex and University of Hertfordshire, 2006 (unpublished). 106 Interview with Jorge Alvarado, ex-president of YPFB, 17 September 2006, La Paz. 107 See ‘Measurement worth billions’, Norwegian Petroleum Directorate, 1 November 2005, at www.npd.no
108 Tara Rangarajan, ‘EITI Implementation in Bolivia: A Feasibility Study’, DFID Bolivia, Consultancy Study, 24 January, 2005. 109 Pablo Poveda Avila and Alvaro Rodriguez, El Gas de los Monopolios: Análisis de la política de hidrocarburos en Bolivia, Cedla, August 2006. 110 See La Prensa, ‘Chaco desiste de recuperar dinero que la liberó de multa’, 22 February 2006 for information on this case. 111 La Prensa, ‘Tribunal anula detención de ejecutivos de Repsol YPF’, 10 May 2006. 112 La Prensa, ‘Allanan oficinas de Andina’, 10 March 2006. 113 La Prensa, ‘Tribunal anula detención de ejecutivos de Repsol YPF’, 10 May 2006. 114 World News Connection, ‘Highlights Bolivia Press, 27
August 2004’, 27 August 2004,
citing an article in La Razon. 115 See www.superhid.gov.bo/Antimonopolicas.html 116 Paul Epstein and Jesse Selber, Oil: A life cycle analysis of its health and environmental impacts’, The Centre for Health and the Global Environment, Harvard Medical School, March 2002. 117 Ibid. 118 Ibid. 119 Rosa Virginia Suárez, Miguel Angel Crespo, Henry Guardia, Problematica Socioambiental del Gasoducto Bolivia-Brasil: La experiencia boliviana, Probioma-Olca, September 2000. 120 Ibid. 121 Ibid. 122 Taken from Fobomade Boletín No 20, April 2000. 123 Interview with Miguel Crespo, Probioma, 15 September 2006, Santa Cruz. 124 Interview with Patricia Molina, Fobomade, 19 September 2006, La Paz. 125 See Gabriel Herbas, ‘Derrame de Transredes en el Río Desaguadero’, in Fobomade, Explotación de Hidrocarburos y el Medio Ambiente en un Escenario Neoliberal, 2002.

64
126 ENSR Internacional, ‘Auditoria Ambiental del Derrame de Hidrocarburos en el Río Desaguadero’, April 2001. 127 Ibid. 128 Ibid. 129 La Prensa, ‘Derrame: Transredes es multada por la apertura de fosas en Sica Sica’, 13 September 2001. 130 Presencia, ‘Transredes no entregó información a ENSR’, 22 January 2001. 131 Fobomade, ‘Análisis y evaluación del proceso y los conflictos socioambientales derivados de la contaminación por el derrame de petroleo en el rio Desaguadero: Un año después del desastre ambiental’, Oruro, January 2001. 132 For a list of the compensation payments per community see Fobomade, ‘Sanción a la contaminación por el derrame de petroleo’, Oruro, February 2001. 133 Interview with Henry Tito, Ceades, 14 September 2006, La Paz. 134 See Gabriel Herbas, ‘Derrame de Transredes en el Río Desaguadero’, in Fobomade, Explotación de Hidrocarburos y el Medio Ambiente en un Escenario Neoliberal, 2002. 135 Ibid. 136 La Prensa, ‘Transredes no quiere pagar multa por daño ambiental’, 21 April 2006. 137 Fobomade Boletín No 22, August 2000. 138 G Perry, O Arias, J Humberto López, W Mahoney, L Servén, Poverty Reduction and Growth: Virtuous and Vicious Circles, World Bank, 2006. 139 Interview with Miguel Crespo, Probioma, 15 September 2006, Santa Cruz. 140 Biotechnology is any technological application that uses biological systems, living organisms, or derivatives of these, to make or modify products or processes for specific use. 141 See comments of Alfonso Revollo, capitalization minister quoted in Los Tiempos, ‘Proceso de capitalización de YPFB no sufrió cambios estructurales’, 4 February 1996. 142 Ultima Hora, ‘Banco Mundial interviene en diálogo COB-Gobierno’, 5 April 1996. 143 Carlos Villegas Quiroga, Privatización de la industria petrolera en Bolivia: Trayectoria y efectos tributarios, Cides-Umsa, Cedla, Fobomade, Diakonia, Plural, May 2004. 144 This law also changed how tax is paid. Before May 2005 companies paid based on their overall production and costs in Bolivia, but now they pay royalties and taxes per field. 145 Figures provided by the National Tax Service (SIN). 146 For a fuller discusión of the drawbacks of the IDH see Pablo Poveda Avila and Alvaro Rodriguez, El Gas de los Monopolios: Análisis de la política de hidrocarburos en Bolivia, Cedla, August 2006. 147 La Razon, ‘El FMI condiciona su ayuda económica a la venta del gas’, 14 June 2004. 148 World News Connection, ‘Highlights: Bolivia Press, 8
th October 2004’, 8 October 2004,
citing La Razon article. 149 La Razon, ‘Un acuerdo con el FMI complica la promulgación de la ley del gas’, 9 May 2005. 150 La Prensa, ‘Ajustes a la ley de hidrocarburos, condición para el acuerdo con FMI’, 11 January 2006. 151 La Razon, ‘Un acuerdo con el FMI complica la promulgación de la ley del gas’, 9 May 2005. 152 La Prensa, ‘EEUU advierte a Bolivia si nacionaliza hidrocarburos’, 21 June 2005. 153 Interview with Jorge Alvarado (former MAS representative and president of YPFB from January to August 2006), 17 September 2006, La Paz. 154 La Razon, ‘Un acuerdo con el FMI complica la promulgación de la ley del gas’, 9 May 2005. 155 La Prensa, ‘El FMI pide compensación para las petroleras’, 19 May 2006. 156 Platform, Carbon Web, Issue No. 5. 157 Interview with John Christenson, Tax Justice Network, 7 November 2006. 158 G Perry, O Arias, J Humberto López, W Mahoney, L Servén, Poverty Reduction and Growth: Virtuous and Vicious Circles, World Bank, 2006. 159 Interview with Mirko Orgaz, journalist, 14 September 2006, La Paz. 160 Interview with Raúl Kieffer, General Manager, Bolivian Chamber of Hydrocarbons, 15 September 2006, Santa Cruz. 161 Ibid. 162 Presentation by Kit Bethell, International Government and Public Affairs, BG Group at a conference ‘Latin America: New Challenges, New Responses’, organised by Chatham House,

65
the Institute for the Study of the Americas, the University of London and the Inter-American Development Bank, 14 November 2006. 163 Interview with Jorge Alvarado, ex-president of YPFB, 17 September 2006, La Paz. 164 Interview with Hugo Vaca de la Torre, YPFB Board member, 18
September 2006, La
Paz.
© Christian Aid January 2007 Christian Aid London: PO Box 100, SE1 7RT Belfast: PO Box 150, BT9 6AE Cardiff: PO Box 6055, CF15 5AA Edinburgh: PO Box 11, EH1 1EL Dublin: 17 Clanwilliam Terrace, Dublin 2 Websites: WWW.christianaid.org.uk www.christian-aid.ie UK registered charity number 1105851 Company number 5171525 Republic of Ireland charity number CHY 6998