the benefits and costs of the section 8 housing subsidy ... benefits and costs of the section 8...
TRANSCRIPT

Institute for Research on Poverty Discussion Paper no. 1380-10
The Benefits and Costs of the Section 8 Housing Subsidy Program: A Framework and First-Year Estimates
Deven Carlson Institute for Research on Poverty
University of Wisconsin–Madison E-mail: [email protected]
Robert Haveman
Department of Economics and La Follette School of Public Affairs University of Wisconsin–Madison
E-mail: [email protected]
Thomas Kaplan Institute for Research on Poverty
University of Wisconsin–Madison E-mail: [email protected]
Barbara Wolfe
La Follette School of Public Affairs, Department of Economics, and Population Health Sciences Institute for Research on Poverty
University of Wisconsin–Madison E-mail: [email protected]
May 2010 The research presented in this paper was generously supported by a grant from the John D. and Catherine T. MacArthur Foundation. We gratefully acknowledge that support. Helpful comments on an earlier draft by David Weimer and Jens Ludwig are appreciated. IRP Publications (discussion papers, special reports, Fast Focus, and the newsletter Focus) are available on the Internet. The IRP Web site can be accessed at the following address: http://www.irp.wisc.edu.

Abstract
The Section 8 housing voucher program serves nearly 2 million low-income families in the
United States. The purpose of the program is to enable low-income families to improve the quality of
their housing and to move to better neighborhoods. Voucher recipients seek housing in the private rental
market, and use the voucher to subsidize their rent. In this paper, the authors provide estimates of the
social benefits and costs of the Section 8 housing subsidy program. The authors find that the Section 8
program meets the efficiency standard of positive net benefits. For society as a whole, total benefits
(measured in annual, per recipient units) range from about $7,700 to $9,600, while total costs are about
$7,000; net benefits range from about $650 to $2,800 per recipient case per year. The social benefit-cost
ratio ranges from 1.1 to 1.37. The bulk of the benefits are experienced by voucher recipients, while other
members of society bear the bulk of the costs. The authors conclude that the program meets the efficiency
standard of welfare economics.
Keywords: Section 8; housing voucher; low-income families; subsidies; cost-benefit analysis

The Benefits and Costs of the Section 8 Housing Subsidy Program: A Framework and First-Year Estimates
I. INTRODUCTION
The Section 8 housing voucher program serves nearly 2 million low-income families in the
United States.1
Research on the social costs and benefits of the Section 8 voucher program goes back to the early
1980s, when Weinberg (1982) described the direct benefits of the program and presented estimates of
some of them. Reeder (1985) also estimated the direct benefits and costs of the Section 8 Existing
program, and he extends earlier work by estimating the changes in consumption patterns induced by the
program as well as the distribution of benefits under the program. About two decades later, Johnson et al.
(2002) provided an outline of a benefit-cost analysis of housing mobility programs that allow low-income
families living in public housing to move to higher-income neighborhoods.
The purpose of the program is to enable low-income families to improve the quality of
their housing and to move to better neighborhoods. Voucher recipients seek housing in the private rental
market, and use the voucher to subsidize their rent. The specific amount of the subsidy—the share of the
rental charge covered by the voucher—is dependent upon the family’s income. In this paper, we provide
estimates of the social benefits and costs of the Section 8 housing subsidy program. We present our
estimates on an annual, per-recipient basis, and our estimates primarily reflect changes that are observed
in the initial year of voucher receipt.
2
1The “Section 8” designation refers to the program’s statutory authorization under Section 8 of the United States Housing Act of 1937, as amended by the Housing and Community Development Act of 1974. Although the official title of Section 8 tenant-based assistance is now the Housing Choice Voucher Program, most researchers and administrators still refer to it as the “Section 8 voucher” program. We use the “Section 8” designation in this paper.
These authors review the
empirical evidence on each of the potential effects they identify, but they do not provide a dollar estimate
of the net societal value of the program.
2Johnson et al (2002) discuss a full set of possible effects of the program and conclude that only a short-run partial benefit cost analysis of housing mobility programs is currently possible.

2
To our knowledge, there are no quantitative estimates of the social gains and losses associated
with the Section 8 program beyond these. Like previous studies, this analysis provides estimates of the
direct benefits and costs associated with the Section 8 voucher program. However, we extend prior work
by providing monetary estimates of a number of indirect benefits and costs of the program as well. Our
benefit and cost estimates rest largely on a series of studies in which we estimate the effects of voucher
receipt on a variety of recipient living unit behaviors, including movement to new neighborhoods,
employment, earnings, and the receipt of a variety of public benefits: child care subsidies, medical care
assistance (Medicaid and the state Children’s Health Insurance program), and welfare (TANF)
assistance.3
In our analysis, we rely on the basic principles of welfare economic theory, and adopt a
comprehensive accounting framework that distinguishes impacts on voucher recipients, other citizens,
and society as a whole. We attempt to provide monetary estimates of benefits and costs, but in one case
we are only able to describe the potential effects.
For outcomes we have not explicitly studied, we draw on available literature to construct
benefit and cost estimates.
II. THE SECTION 8 VOUCHER PROGRAM
The U.S. government currently provides housing assistance to low-income renters through three
primary programs: Section 8 tenant-based subsidies (since 1999 officially known as the Housing Choice
Voucher Program); Section 8 unit-based assistance, under which building owners receive government
3See Carlson et al. (2009), which summarizes our estimates of the effects of voucher receipt on a variety of outcomes. In these studies, we use detailed information available in administrative records from the State of Wisconsin, and supplement this information with data from the U.S. Census Bureau. Our sample begins with all cases that applied for or received welfare-type transfers between 2001 and 2003, yielding three separate calendar year cohorts. Within each cohort, we form two unique groups, one composed of cases that first received a public rental subsidy in that year, and the other made up of cases that did not. We then pool these three calendar year cohorts to create our final estimation sample. To obtain a balanced comparison group that allows for valid inference regarding the effect of voucher receipt on the outcomes of interest, we employ a propensity score matching procedure. Then, using this balanced sample, we isolate the effect of voucher receipt on the neighborhood quality and household composition outcomes using a difference-in-differences regression adjustment. All of these studies are available from the authors, on request.
3
subsidies to reduce rents; and publicly owned housing units. All three forms of assistance are
administered by over 3,000 local public housing authorities (PHAs). Each of these programs represents an
important policy lever, but this analysis focuses on the social costs and benefits of the Section 8 tenant-
based subsidy program.
Section 8 tenant-based vouchers currently serve about 1.9 million families nationally, including
more than 850,000 families with minor children (U.S. Department of Housing and Urban Development
2007). The primary objective of the program is to enable “very low-income families to choose and lease
or purchase safe, decent, and affordable privately owned rental housing.”4 Voucher recipients, whose
income must be below 50 percent of the median income of the county or metropolitan area in which they
live, choose rental housing available in the private market and contribute 30 percent of their incomes
toward rent.5 The Section 8 program then pays the difference between the tenant contribution and actual
rent, up to a locally defined “fair market rent” payment standard.6 A main motivation undergirding the
Section 8 program is to “deconcentrate” the poor by making it possible for voucher recipients to leave
public housing projects and move to better neighborhoods near better jobs (U.S. Department of Housing
and Urban Development 2000).7
4
http://www.hud.gov/offices/pih/programs/hcv/about/index.cfm 5A PHA must provide 75 percent of its vouchers to applicants whose incomes do not exceed 30 percent of
the area median income. 6This standard is set by the Department of Housing and Urban Development (HUD) at the 40th percentile
of the local rental market, as calculated by the monetary value of leases commenced in the previous year. The payment standard is typically between 90 percent and 110 percent of area “fair market rent.”
7As the program has expanded over time, a number of constraints have partially interfered with the goal of geographic mobility for recipients of tenant-based assistance. One constraint has been the limited geographic span of many local PHAs that serve only parts of metropolitan areas, reducing the possibility for recipients to move to neighborhoods with a smaller concentration of poor families. While some PHAs allow recipients to find housing in other jurisdictions, administrative burdens and the need to transfer supporting funds constrains this practice.

4
III. BENEFITS AND COSTS OF PUBLIC HOUSING SUBSIDIES
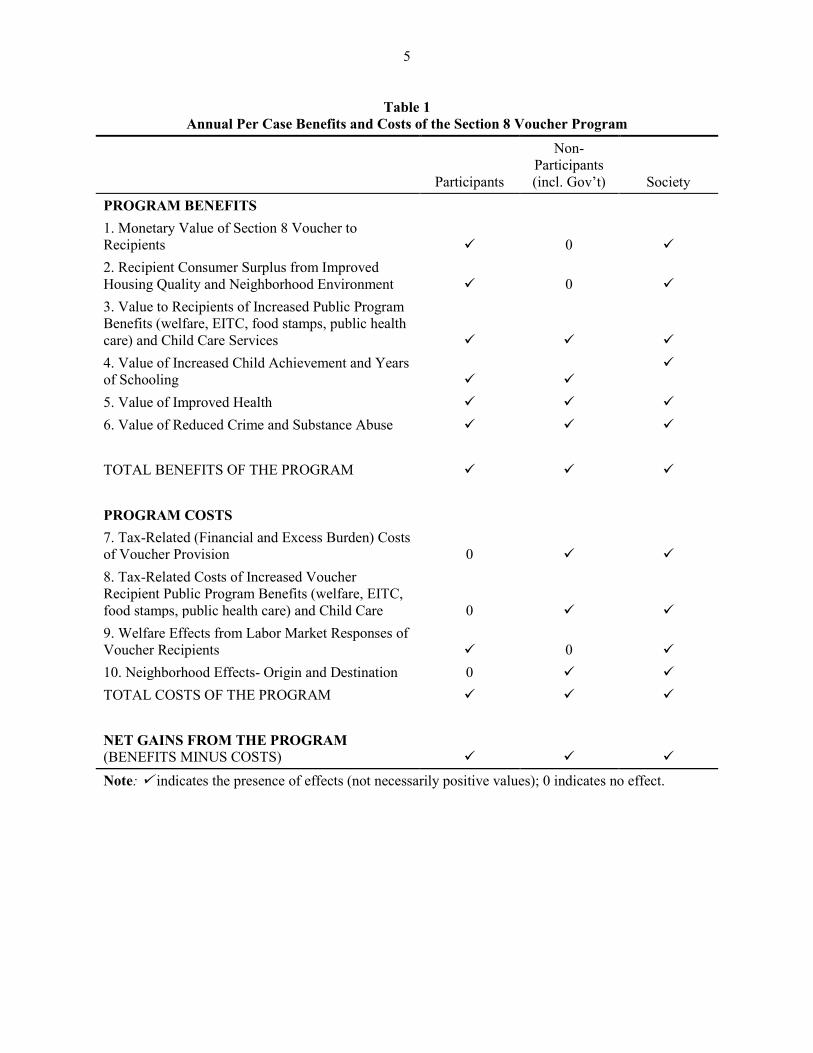
Table 1 presents an accounting overview of the components of annual social benefits and costs
that are potentially attributable to public provision of Section 8 housing subsidies to low-income families.
The categories identified are designed to be comprehensive, although there may be other effects that we
have not considered. In the table, we distinguish benefits and costs accruing to program participants,
nonparticipants (including taxpayers), and society as a whole. The following sections discuss each of
these benefit and cost categories.
A. Recipient Value of Section 8 Vouchers (Items 1. and 2. in Table 1)
The annual value of the Section 8 rental subsidy to recipient families consists of two components.
First, there is the monetary value of the voucher, which corresponds to the reduction in the rental payment
for the housing unit in which recipients use the voucher. The second is the increase in consumer surplus
on the additional housing services obtained because of the voucher.
Conceptually, we calculate the first component as the market rental rate on the unit occupied
minus the actual rental payment made by the household. This subsidy benefits participants, and because
they are members of society, it is also a welfare gain to society as a whole.8
The consumer surplus component of program benefits reflects the recipients’ willingness to pay
for the increase in housing services (housing and neighborhood quality) that they experience as a result of
8The costs of supporting the subsidy are indicated in the cost part of the table, as Item 7. In addition, in our primary analysis, we do not include an estimate of the potential deadweight loss associated with the distortion in the level of housing consumption. However, in our Monte Carlo sensitivity analysis we vary the value of the subsidy to acknowledge the potential for deadweight loss stemming from the distortion of housing consumption decisions caused by the in-kind nature of the program (see below). Prior empirical research into the size of potential deadweight loss is extensive. Citing Slesnick (1996), Currie and Gahvari (2008) conclude that “the deadweight losses associated with in-kind transfers of food stamps and housing programs … are small.” Reeder (1985) concludes that the deadweight loss attributable to the distortion of housing consumption is about 17 cents to the dollar. As a result, in our Monte Carlo analysis we vary the value of the subsidy from 83 to 100 cents on the dollar.
5
Table 1 Annual Per Case Benefits and Costs of the Section 8 Voucher Program
Participants
Non-Participants (incl. Gov’t) Society
PROGRAM BENEFITS 1. Monetary Value of Section 8 Voucher to Recipients 0 2. Recipient Consumer Surplus from Improved Housing Quality and Neighborhood Environment 0 3. Value to Recipients of Increased Public Program Benefits (welfare, EITC, food stamps, public health care) and Child Care Services 4. Value of Increased Child Achievement and Years of Schooling
5. Value of Improved Health 6. Value of Reduced Crime and Substance Abuse TOTAL BENEFITS OF THE PROGRAM PROGRAM COSTS 7. Tax-Related (Financial and Excess Burden) Costs of Voucher Provision 0 8. Tax-Related Costs of Increased Voucher Recipient Public Program Benefits (welfare, EITC, food stamps, public health care) and Child Care 0 9. Welfare Effects from Labor Market Responses of Voucher Recipients 0 10. Neighborhood Effects- Origin and Destination 0 TOTAL COSTS OF THE PROGRAM NET GAINS FROM THE PROGRAM (BENEFITS MINUS COSTS) Note: indicates the presence of effects (not necessarily positive values); 0 indicates no effect.

6
the subsidy.9
B. Value to Recipients of Increased Public Program Benefits (welfare, EITC, food stamps, public health care) and Child Care Services (Item 3. in Table 1)
This welfare gain, separate from the monetary value of the voucher, is not recorded in
markets and can be assessed only through information regarding the willingness of recipients to pay for
these increases in housing services. Appendix A discusses the consumer surplus associated with receipt of
a rental subsidy in greater detail.
Because of the receipt of program benefits and the associated housing changes, participants may
experience an increase in the public benefits that they receive. Part of this gain may come from
counseling associated with housing voucher receipt; administrators may direct voucher recipients toward
other public program benefits for which they may be eligible. A second part may come from greater
accessibility of program providers in the new location. For example, recipients of Section 8 vouchers may
become better positioned to secure quality child care services, given the potential change in neighborhood
and the distribution of child care centers.
These increased benefits and services increase the well-being of participants, and hence of society
as a whole. For both participants and society, this gain can be conceived of as the market value of the
additional services, plus the consumer surplus associated with this increased use, minus the dollar amount
that is required to provide these benefits.10
9Empirical research on the effects of low-income housing vouchers is extensive, and many studies show that Section 8 voucher recipients tend to move to better neighborhoods (Kling, Liebman, and Katz 2007; Mills et al. 2006); estimates from our studies confirm this.
10The costs of providing these benefits that are not paid for by program participants are reflected in the cost section of the table, as Item 8.

7
C. Benefits of Increased Child Achievement and Years of Schooling (Item 4. in Table 1)
The increase in public benefits, child care services, and children’s attendance at better schools
(because of program-induced changes in residential location and neighborhood) may lead to increased
child achievement and years of schooling.
Information on these effects is difficult to attain; data are on the relationship between
participation in the Section 8 program and children’s school achievements are very limited, and the
children’s ultimate educational attainments are generally not observable until well after the receipt of the
housing subsidy. Note that, while the gains in this category accrue to recipient families, there may be
beneficial effects beyond these private gains that accrue to society as a whole. Hence, the value recorded
for participants is likely to be less than the value indicated for society.11
D. Benefits of Improved Health (Item 5. in Table 1)
Many social interventions are credited with improving the health status of benefit recipients; the
Section 8 program is no exception. Vouchers have the potential to enable recipients to relocate to higher
quality housing stock in a more desirable neighborhood. Such relocations may ameliorate conditions that
had been negatively affecting both physical and mental health, and provide improved access to health care
facilities and providers.
Empirical work has demonstrated such an effect. Using data from the Boston site of the Moving
to Opportunity (MTO) experiment, Katz et al. (2001a) find that children of families who relocated to low-
poverty areas exhibited many health improvements—including a decline in the probability of suffering an
asthma attack, lower levels of “injuries and accidents”, and fewer behavior problems. Katz et al. (2001b)
also report that 58 percent of the control group responded to a survey question that their health was good
11There is an extensive body of research suggesting that the nonmarketed private benefits and the public goods benefits of incremental schooling are very large. Wolfe and Haveman (2001) suggest that these benefits may be equal in magnitude to the earnings returns from additional schooling. Any additional costs of schooling for the children of program participants are recorded in the cost section of the table.

8
or better, whereas 76 percent of the Section 8 comparison group gave that response to the survey question
(a difference that was statistically significant at p < 0.05). Similarly, Leventhal and Brooks-Gunn (2000;
2003) employ data from the New York City site of MTO and report improvements in both adult and
children’s health stemming from using a housing voucher to move to a low-poverty neighborhood.
Overall, as Johnson et al. (2002) note, it seems clear that any comprehensive assessment of the social
value of the Section 8 program must consider its impacts on mental and physical health.
E. Value of Reduced Crime and Substance Abuse (Item 6. in Table 1)
Another potential benefit from housing voucher receipt is the changed behavior of children living
in recipient families, in particular, a reduction in drug use and illegal activities. A substantial literature has
studied the effects of housing support on youth problem behavior and crime-related activities. Much of
this literature relies on MTO evidence from Katz et al. (2001), Leventhal and Brooks-Gunn (2000), and
Ludwig et al. (2001b). Katz et al. conclude that Section 8 groups in MTO-Boston have values on a
criminal offense index that are about one-third smaller than the control group and Ludwig et al. (2001b)
conclude that MTO-Baltimore youths in the Section 8 group have a number of violent arrests that is from
one-fourth to one-half smaller than youths in the control group; however, the number of property arrest
crimes for Section 8 youths is about double that of the control group. Leventhal and Brooks-Gunn (2000)
show no effect in MTO-New York on overall delinquency.
F. Tax-Related (Financial and Excess Burden) Costs of Voucher Provision (Item 7. in Table 1)
The full taxpayer and social cost of voucher provision includes two main components: 1.) the
financial costs associated with the operation of the Section 8 program and 2.) the potential welfare loss
associated with the distortionary behavior induced by the taxation that provides the revenue used to fund
the provision of vouchers—the ‘excess welfare burden’ of taxation. Assuming that this excess burden is
independent of the form of taxation used to support the Section 8 program, we rely on estimates in the
literature for this value.

9
G. Tax-Related Costs of Increased Voucher Recipient Public Program Benefits (welfare, EITC, food stamps, public health care) and Child Care (Item 8. in Table 1)
Similar to the increased taxpayer costs directly associated with the Section 8 program are
taxpayer costs associated with any increase in the utilization of public benefits, including Food Stamps,
TANF, child care services, and government provided health insurance programs such as Medicaid. This
cost also includes the ‘excess welfare burden’ associated with the increased taxpayer costs.
H. Welfare Effects from Labor Market Responses of Voucher Recipients (Item 9. in Table 1)
Recipients of Section 8 vouchers face altered labor market incentives related to the income-
conditioned nature of the benefit structure in the program, described above. These changed incentives are
likely to affect choices on work time and earnings. To the extent that these choices are altered, there will
be specific and measureable effects of the program operating through the labor market. These welfare
effects accrue to participants and therefore to society.
H. Community Effects on Origin and Destination Neighborhoods (Item 10. in Table 1)
A number of scholars, including Galster et al (1999), Lee, Culhane, and Wachter (1999), Santiago
et al. (2001), Johnson et al. (2002) and Susin (2002, 2005), note possible ‘externalities’ in the form of
community effects from the Section 8 program, distinguishing destination from origin neighborhoods.12
12Galster et al (1999) find that, in “vulnerable” neighborhoods, the presence of Section 8 units has a negative effect on the value of properties located in within about a half-mile of the units; in more affluent neighborhoods, Section 8 units are not found to have any effect on property values. Santiago et al. (2001) report similar results in a Denver-based study; subsidized housing units negatively are only found to negatively affect property values in “vulnerable” neighborhoods. Lee, Culhane, and Wachter (1999) report a slight negative effect of the presence of Section 8 rental units on surrounding property values. Susin (2002) concludes that the introduction of the voucher program has increased rents for low-income households in the 90 largest metropolitan areas by an average of 16 percent. In a contrary perspective, Ludwig notes that Freeman and Botein (2002) find that subsidized housing improves surrounding property values.
On these external effects, Deng (2005, page 475–6) notes: “Government housing subsidy programs, whether supply or demand based, are by their very nature interventions in the private housing market. Thus the market responses to these interventions can generate some second-round costs or benefits. … [D]depending on households’ consumption decisions and developers’ production decisions, demand-side subsidy programs may push
10
These authors suggest that the departure of Section 8 families may leave the origin communities worse off
(assuming that the departing families have better behavioral characteristics than average) and the
destination communities worse off (for similar reasons).
Taken together, existing research suggests that the Section 8 program may impose a cost on the
residents of destination neighborhoods, especially if the neighborhood is “vulnerable”; there is less
empirical work on the effects of the Section 8 program on origin neighborhoods. While the effects
described above must be considered in a comprehensive evaluation of the social value of the Section 8
program, For the purpose of our benefit-cost analysis, we treat these increased rental costs as fully offset
by the increased rents received by property owners. Hence, we do not include them in Table 2.
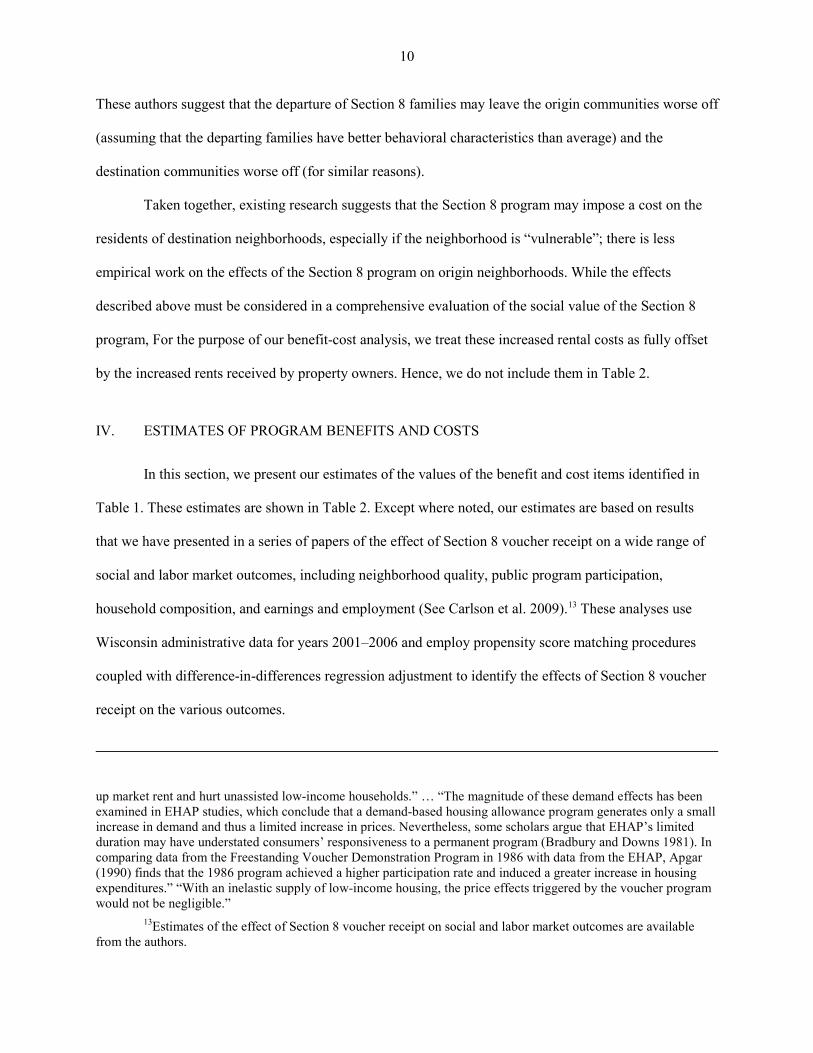
IV. ESTIMATES OF PROGRAM BENEFITS AND COSTS
In this section, we present our estimates of the values of the benefit and cost items identified in
Table 1. These estimates are shown in Table 2. Except where noted, our estimates are based on results
that we have presented in a series of papers of the effect of Section 8 voucher receipt on a wide range of
social and labor market outcomes, including neighborhood quality, public program participation,
household composition, and earnings and employment (See Carlson et al. 2009).13
up market rent and hurt unassisted low-income households.” … “The magnitude of these demand effects has been examined in EHAP studies, which conclude that a demand-based housing allowance program generates only a small increase in demand and thus a limited increase in prices. Nevertheless, some scholars argue that EHAP’s limited duration may have understated consumers’ responsiveness to a permanent program (Bradbury and Downs 1981). In comparing data from the Freestanding Voucher Demonstration Program in 1986 with data from the EHAP, Apgar (1990) finds that the 1986 program achieved a higher participation rate and induced a greater increase in housing expenditures.” “With an inelastic supply of low-income housing, the price effects triggered by the voucher program would not be negligible.”
These analyses use
Wisconsin administrative data for years 2001–2006 and employ propensity score matching procedures
coupled with difference-in-differences regression adjustment to identify the effects of Section 8 voucher
receipt on the various outcomes.
13Estimates of the effect of Section 8 voucher receipt on social and labor market outcomes are available from the authors.

11
Table 2 First Year Per Case Benefits and Costs of the Section 8 Voucher Program
Participants
Non-Participants (incl. Gov’t) Society
PROGRAM BENEFITS 1. Monetary value of Section 8 Voucher to Recipients
$4,264 0 $4,264
2. Recipient Consumer Surplus from Improved Housing Quality and Neighborhood Environment
$853–$2132 0 $853–$2132
3. Value to Recipients of Increased Public Program Benefits (welfare, EITC, food stamps, public health care) and Child Care Services
$622–$1285* $200 $822–$1485**
4. Benefits of Increased Child Achievement and Years of Schooling
$300 $100 $400
5. Value of Improved Health $963 $0 $963 6. Value of Reduced Crime and Substance Abuse
$199 $199 $398
TOTAL BENEFITS OF THE PROGRAM $7201–$9143 $499 $7700–$9642 PROGRAM COSTS 7. Tax-Related (Financial and Excess Burden) Costs of Voucher Provision
0 $5686 (=$4,738 +
$948)
$5686 (=$4,738 +
$948) 8. Tax-Related Costs of Increased Voucher Recipient Public Program Benefits (welfare, EITC, food stamps, public health care) and Child Care Services
0 $1076 (= $897 + $179)
$1076 (= $897 + $179)
9. Welfare Effects from Labor Market Responses of Voucher Recipients
$50–$290 0 $50–$290
10. Origin/Destination Neighborhood Effects
— — —
TOTAL COSTS OF THE PROGRAM $50–$290 $6762 $6812–$7052 NET GAINS FROM THE PROGRAM (BENEFITS MINUS COSTS)
$6,911–$9,093 -$6,263 $648– $2,830
Note: 0 indicates no effect. + indicates that the effect is likely positive, but we have been unable to develop a reliable estimate. – indicates that the effect is likely negative, but we have been unable to develop a reliable estimate. *This is the sum of W-2, Food Stamps, and Child Care benefits. **This is the sum of W-2, Food Stamps, and Child Care benefits, plus $200 of assigned public goods benefits.

12
A. Tax-Related (Financial and Excess Burden) Costs of Voucher Provision (Item 7. in Table 2)
Based on data and calculations from the Center for Budget and Policy Priorities (CBPP), we
estimate the average taxpayer cost per authorized voucher for Wisconsin in 2008 to be $4,738 (Center for
Budget and Policy Priorities 2008). This number is a weighted average of the estimated cost per voucher
calculated by CBPP for each housing authority in Wisconsin, including the Wisconsin Housing and
Economic Development Authority (WHEDA).14
Parameter estimates of the marginal excess tax burden vary somewhat in the economics literature,
but for the personal income tax they generally range from .10 to .35. Several studies present estimates that
fall within this range.
15 We use a parameter estimate of .2, which is approximately in the middle of this
range, in this analysis.16
B. Value of Section 8 Voucher to Recipients (Items 1. and 2. in Table 1)
Hence, in Table 2, we report an estimate of $948 as the welfare cost associated
with the increased taxation required to finance the Section 8 program. Adding this figure to the estimated
average taxpayer cost per authorized voucher of $4,738 yields an estimate of $5,686 as the total tax-
related cost of providing a Section 8 voucher. This total is assigned to both taxpayers and society.
The recipient value of a housing voucher is the sum of the reduction in the rental payment for the
housing unit to which they move after receipt of the voucher plus the increase in consumer surplus on the
additional housing services obtained because of the voucher.
14CBPP estimated the 2008 cost per voucher for each housing authority by calculating the average cost per voucher in 2007 and then inflating that figure by the applicable 2008 HUD annual adjustment factor. CBPP used Voucher Management System (VMS) data to calculate the 2007 cost per voucher. The statewide estimate is obtained by weighting the estimated cost per voucher for each housing authority by that authority’s proportion of total vouchers in the state.
15These include Fullerton and Henderson (1989), Ballard (1990), Ballard et al. (1985), Browning (1987), Feldstein (1999), Judd (1987), Ng (2000), Snow and Warren (1996), Parry (2002), Stuart (1984), and Boardman et al. (2006).
16We account for the uncertainty in the marginal excess tax burden in our Monte Carlo simulation presented in Appendix C.

13
Consider first the reduction in the rental payment for voucher recipients (Item 1. in Table 2). If
we assume that the administrative costs of the program are equal to 10 percent of the total costs of the
program, our estimate of the taxpayer portion of the rent (and hence the reduction in rental payments to
voucher recipients) is equal to $4,264 (= .9 * $4,738). The administrative cost of the program—$474—is
a social cost of the program and is reflected in the difference between Item 7 and Item 1.17
Note that the total rent on the housing unit into which the recipient moves reflects both the quality
(and size) of the unit itself, and the quality of the neighborhood environment in which the unit is located.
In addition to the value of the Section 8 voucher to recipients (the reduction in rental payments),
there is a consumer surplus benefit experienced by voucher recipients.18
17Deng (2005) provides an alternative framework for estimating the benefits and costs of housing vouchers. (See also Deng, 2009.) He notes: “Earlier studies commonly used cost-benefit analysis. For each housing program, these studies compare the government’s cost with the estimated market rent for subsidized housing units ….” (page 473). In his paper, Deng calculates the subsidy value to Section 8 recipients using this approach; see page 487. This procedure is summarized in an appendix on page 506. Essentially, Deng subtracts the rent paid by the tenant from the fair market rent of the unit, to find the subsidy to the recipient. Our data do not contain an estimate of either the rent paid by the tenant or the fair market rent of the unit. Deng also states (page 492): “In addition to the voucher subsidy paid to individual families, the federal government pays local PHAs a monthly fee to administer the program. This fee, which is published annually by HUD for each PHA, is higher for the first 600 units and then falls for the remainder.” On page 507, he states: “The monthly administrative fee for the voucher program in Miami in 2000 was $61 per unit.” We assume that this fee is a part of the overall administrative costs of the program that we estimate.
Consistent with welfare
economic theory, the improved neighborhood characteristics would provide recipients with well-being
beyond that reflected in the value of the housing subsidy that they receive. This gain is attributable to the
following logic: Assume that a recipient family was living in some housing unit prior to receiving the
subsidy, and the recipient would have had a total willingness to pay for that unit. That willingness to pay
would consist of the rent the person actually paid, plus the consumer surplus on that unit. Now, a voucher
is received, and the recipient moves, presumably into a better unit in a superior neighborhood. There is a
market rent for that unit, and that rent is shared in some proportion by the recipient and the government
18In Carlson et al. (2009) we provide evidence that Section 8 voucher recipients lived in neighborhoods with more desirable characteristics than did equivalent families who did not receive a voucher. In particular, we found that voucher recipients in the first year after receipt were living in neighborhoods with lower unemployment rates.

14
(the Section 8 subsidy). Because the new unit is better than the old one, presumably the consumer surplus
of the new unit would exceed that of the old unit. The change in consumer surplus is a gain to participants
and a gain to society. Appendix A addresses the issue of consumer surplus associated with receipt of a
rental subsidy in greater detail.
In the absence of knowledge regarding the elasticity of demand of voucher recipients for
improved housing and neighborhood quality—and hence their willingness to pay—we assume that the
consumer surplus benefit ranges from .2 to.5 of the financial benefit. With this assumption, consumer
surplus benefit ranges from $853 to $2,132, and the total value of the voucher to recipients ranges from
$5,117 to $6,396.
C. Value to Recipients of Increased Public Program Benefits (welfare, EITC, food stamps, public health care) and Child Care Services (Item 3. in Table 2)
1. Benefits from Increased Receipt of Welfare Benefits
In the year of first receiving a housing voucher, those who received the subsidy were 3 percent
more likely to receive benefits from Wisconsin’s welfare plan (Wisconsin Works, or W-2) than matched
comparisons who did not receive a housing subsidy. In calendar year 2004, about 27,000 housing
vouchers were in use in Wisconsin. If 3 percent more of these housing voucher participants participated in
W-2 than would have done so if they did not have a housing voucher, there would be 810 more W-2
participants than would have been the case without the housing subsidy program.
Our analysis of Wisconsin administrative data finds that the average W-2 funds spent monthly on
W-2 recipients who were receiving a housing subsidy is $424. The annual additional W-2 cost attributable
to housing subsidies is thus about $4.1 million (810 more participants x $424 in monthly costs x 12
months = $4,121,280). If administrative costs account for 10 percent of total costs, then the total
monetary value of W-2 benefits is about $3,709,152, and the annual value of W-2 benefits per voucher
recipient is about $132 ($3,709,152/27,000).

15
In addition to this value of W-2 benefits per voucher recipient, there is the consumer surplus
generated for W-2 beneficiaries, to the extent that these benefits are received ‘in-kind’ (e.g., job training
services, counseling services). Following the earlier convention of assigning a rough value of consumer
surplus benefits equal to .2 to .5 of the financial value of the services received, and assuming that one-half
of the W-2 services are in-kind, we add a value of from $13 to $33 to the financial value of $132, for a
total value of from $145 to $165.19
2. Benefits from Increased Food Stamp Use.
Because our analytic sample is derived from cases that applied for or received Food Stamps, we
cannot use Wisconsin administrative data to estimate the effect of housing subsidy receipt on Food Stamp
receipt. Housing authority staff are likely to have more incentive to encourage voucher recipients to apply
for W-2 than Food Stamps, since W-2 benefits increase the countable income of housing assistance
recipients, thereby reducing the value of their housing assistance and allowing the housing authority to
serve more people. Based on the likelihood that housing authority staff have little incentive to encourage
continuous enrollment or reenrollment in Food Stamps, we arbitrarily assume a very small 2 percent
increase in the likelihood of receiving Food Stamps, being careful to use a smaller percentage increase
than that for W-2 even though all of those on housing vouchers are eligible for Food Stamps while only a
subset are eligible for W-2.20
The 2 percent increase in likelihood suggests that 540 more cases would receive Food Stamp
benefits. The average annual benefit level in 2004 for Food Stamp recipient assistance groups in
19It could be argued that, in addition to the benefits themselves, the work experience that is required by the program, the complementary job training efforts, and the counseling are likely to lead to higher future productivity and earnings.
20This increase is consistent with Harkness and Newman (2003), who find that housing assistance in private rental housing increases the likelihood of Food Stamp receipt nationally.

16
Wisconsin was $2,100,21
3. Benefits from Increased Use of Health Care Assistance.
which suggests increased annual benefits of $1,134,000 (540 x $2,100).
Ignoring marginal administrative costs yields an annual average per case benefit of $44. Again, assigning
a rough value of consumer surplus benefits equal to .2 to .5 of the financial value of the services received,
we calculate the total annual per case benefits of the increased Food Stamps to be from $53 to $66.
Our estimates of the impacts of Section 8 voucher receipt (Carlson et al. 2009) find that housing
assistance recipients with a minor child in the house are about 1 percentage point more likely to
participate in Medicaid and BadgerCare (the Wisconsin Children’s Health Insurance Program) than their
matched comparisons who did not receive housing assistance. Housing assistance recipients without a
minor child are about 7 percentage points more likely to participate in Medicaid than their matched
comparisons. Some 36 percent of our sample receiving rent subsidies had no minor children, and 64
percent had children. Assuming that these percentages apply to the overall population of cases receiving a
rental subsidy in Wisconsin in 2004, we estimate that there were 9,720 rent subsidy cases with no minor
child (27,000 X .36) and 17,280 cases with minor children.
Because enrollment in the Wisconsin Medicaid/BadgerCare program is by individual, not by
case, it is necessary to estimate the number of people likely to be receiving Medicaid in these cases.
Relying on case composition patterns, we conclude that there are 10,109 people (9,720 X 1.04) in the
cases without children and 47,693 people (17,280 X 2.76) in the cases with children.22
21Average monthly Food Stamp benefits in Wisconsin in 2004 equaled $23,549,668; the average monthly number of assistance groups was 134,616. $23,549,668/134,616 X 12 = $2,100. The data are at http://dhs.wisconsin.gov/em/rsdata/index.htm.
Of the 10,109
estimated adults with no child, a 7 percent increased likelihood of participating in Medicaid implies an
increased Medicaid enrollment of 708 individuals (10,109 X .07). Of the estimated 47,693 people in cases
22We multiply the number of cases times the average number of people in Medicaid cases (2.76 for cases with children and 1.04 for cases without children).

17
with a child, a 1 percent increase in the likelihood of participating in Medicaid/BadgerCare implies
increased enrollment in the program of 477 people (47,693 X .01).
We estimate the benefits of Medicaid/BadgerCare coverage to be equal to the state costs of
providing these benefits; we use actual annual costs from 2004. In that year, annual Medicaid
expenditures for noninstitutionalized elderly and disabled people was $8,592 (Wisconsin Legislative
Fiscal Bureau 2005b). For families with children, the mean annual cost per recipient was $1,989
(Wisconsin Legislative Fiscal Bureau 2005a, Table 32). Assuming that all the individuals without
children were elderly/disabled (a very plausible assumption because that is the only reason they would
qualify for Medicaid), the 708 additional participants implies an annual benefit of $6,083,100 ($8,592 X
708 people).23
4. Benefits from the Earned Income Tax Credit (EITC)
If we assume the cases with children contained no disabled individuals (not as likely,
which makes this a lower-bound estimate of costs) we estimate the annual, total benefit value for the
additional 477 people with children to be $948,800 ($1,989 X 477). Across all 27,000 Section 8 voucher
recipients, then, the annual, per case benefit value is $260 ($7.031 million/27,000). Assuming
administrative costs of 10 percent yields an annual per case benefit of $234. Adding in the consumer
surplus associated with these gains, and again using a ratio of from .2 to .5 of the financial value of the
services received, we calculate the annual per case benefits of the additional medical care benefits to be
from $281 to $351.
In the first year after receiving a housing subsidy, we estimate a decline in annual earnings of the
casehead of about $600. The effect of such an earnings decline on EITC benefits would depend on the
casehead’s level of earnings before the housing subsidy began. Because of the way the EITC is structured,
23This estimate may be somewhat upward biased as the weighted average Medicaid costs for the elderly and disabled includes people in nursing homes. An alternative would be to use the average costs for people in Milwaukee and Dane County programs who get SSI (both elderly and disabled) and are served by care management organizations (largely long-term and acute care HMOs for the elderly and disabled); the annual cost for this population is $8,592 annually, compared to the annual cost of $11,590). The lower cost figure reflects a 5–6 percent discount that the state attempts to generate, and hence may be too low.

18
those with the lowest earnings would receive a lower EITC benefit if their earnings declined, those with
the highest earnings (but still eligible for an EITC benefit) would realize a higher EITC benefit if their
earnings declined, and those in the middle of that range would experience no change in EITC benefits if
their earnings dropped. If we assume that housing subsidy recipients were positioned evenly across that
continuum before they received a subsidy, then their net change in EITC benefits would be approximately
zero.
5. Benefits from Increased Child Care Services
Our empirical analyses indicate that Section 8 voucher receipt leads to increased benefits from
child care services in two distinct ways. First, Section 8 voucher receipt induces some households that
previously did not participate in the public child care program to apply for and receive state-subsidized
child care. Second, Section 8 voucher receipt results in greater subsidy amounts for households already
participating in the state-subsidized child care program. In both of these scenarios, a primary benefit is the
financial value of the improved child care services. A lower bound to this value is the total financial value
of the improved services minus the amount the families actually pay for these services (the co-payment)
and the costs of administering the program. In addition, any comprehensive accounting of benefits must
include the consumer surplus that families experience because of the new or improved child care services.
For the estimated 1,242 cases that received child care benefits because of their participation in the
Section 8 voucher program, we calculate a total benefit receipt of about $8.3 million.24
24We estimate (Carlson et al. 2009) that, in the year of first receiving a housing subsidy, those who received a Section 8 voucher were about 4.6 percentage points more likely to receive state-subsidized child care benefits, a program referred to as Wisconsin Shares, than matched comparisons who did not receive a housing subsidy. In calendar year 2004, about 27,000 housing vouchers were in use in Wisconsin. If 4.6 percent more of these housing voucher participants participated in Wisconsin Shares than would have done so if they did not have a housing voucher, that would suggest that there were 1,242 more Wisconsin Shares participants than would have been the case without the housing subsidy program. In our sample, the average Wisconsin Shares funds spent annually on child care benefits for Section 8 voucher recipients is $7,462. The annual additional Wisconsin Shares cost attributable to housing subsidies is thus about $9.3 million (1,242 more participants x $7,462 in annual costs = $9.268 million). If administrative costs account for 10 percent of total costs, then the total monetary value of Wisconsin Shares benefits is $8.341 million. Hence, the value of child care benefits per voucher recipient is about $309 ($8.341 million/27,000).
Dividing this

19
number by the 27,000 voucher recipients in Wisconsin yields a per case value of about $309. For the
estimated 13,500 Section 8 voucher recipients that already received child care benefits, we calculate that
their participation in the Section 8 program increased the value of benefits received by about $2.8 million.
Dividing this number by the 27,000 voucher recipients in Wisconsin yields a per-case value of about
$103. 25
In addition to this value of child care benefits per voucher recipient, there is the consumer surplus
generated for Wisconsin Shares beneficiaries. Following the earlier convention of assigning a rough value
of consumer surplus benefits equal to from .2 to .5 of the financial value of the services received, and
assuming that none of the Wisconsin Shares services are in-kind, we add a value of from $82 to $206 to
the financial value of $412, for a total value of $494 to $618 per case.
Hence, we estimate the total value of the per voucher recipient annual child services to be $412
(= $309 + $103).
26
Extensive research on the benefits and costs of early child care interventions suggests that the
total present value of the benefits of these programs is 3–4 times the cost. In addition to the value of the
direct child care services to parents, these benefit estimates include the parents’ and societies assessment
of the value of increased child achievement and years of schooling (or the reduced costs of remedial
schooling), parents’ and society’s assessment of the decreased probability of children’s engaging in drug
use and illegal activities as they mature, increased parental productivity due to the reduction in child care
needs, and parental avoidance of the stigma of children’s needs for special education or grade repetition.
In our analysis, the parental productivity effect is included elsewhere. Hence, we include an arbitrary
25The increase in the annual subsidy value is estimated to be $229 in the year of receipt. In our sample, 50 percent of voucher recipients participated in the program. As a result, the annual additional value of subsidies received from the Wisconsin Shares program is about $3.1 million (13,500 recipients x $229 in increased annual subsidies). If administrative costs account for 10 percent of total costs, then the total monetary value of the increased Wisconsin Shares subsidy is $2.782 million. Dividing this value by the total number of voucher recipients indicates that the value of the increased child care subsidy attributable to the Section 8 program is about $103 ($2.782 million/27,000).
26This consumer surplus gain reflects the parental wellbeing gained by knowing that their child is being cared for in a safe and possibly educational environment where they have the opportunity to learn from and socialize with other children. It also reflects the parental well-being gain from the added continuity of care from having a child in organized child care.

20
annual per recipient value of $200, about one-third of the voucher recipients’ private benefits, in Table 2.
Other aspects of parental gains are included in items 4. and 6., discussed below.27
D. Benefits of Increased Child Achievement and Years of Schooling (Item 4. in Table 2)
If receipt of a Section 8 housing voucher leads to attendance at better quality schools and
improved behavioral and school performance of the children of recipient families (either directly or
because of the improved child care experience), these children are likely to ultimately complete more
years of schooling, and these gains are attributable to the program.28
Johnson et al (2002) discuss this effect, and present results from the Gautreaux and MtO
experiments that relate to it. They conclude that one of the effects of voucher receipt is an increase in
achievement scores of recipient’s children. For example, the Baltimore MtO site indicates an increase in
the achievement score of young children of 0.25 of a standard deviation (Ludwig et al. 2001a). Using
results from Krueger (1999), they suggest that a test score improvement of this magnitude implies an
increase in the present value of these children’s lifetime earnings of about $8,500. Johnson et al. indicate
that if an increase of this magnitude is assumed to hold as well for teenagers, then (given the age
27A rough calculation assumes that, excluding the increased parental work and productivity, the benefit-cost ratios of 3–4 noted above would decrease to 2. We calculate that the annual per voucher recipient value of these additional values (for children’s future attainments and reduced illegal activity) is, therefore, approximately equal to the direct annual per voucher recipient benefits of $412. This value is a component of our overall estimate of the benefits in item 4., discussed below. A roughly equivalent annual per recipient value is a component of our overall estimate of the benefits in item 7. discussed below. Lynn Karoly in her work reports that, the returns to society for each dollar invested (in early childhood programs) extend from $1.80 to $17.07.
28To some extent, this benefit may be reflected in Items 1. and 2. It is possible that the value families place on the improved neighborhood into which they move reflects the belief that the schools in the neighborhood are superior, and that this will result in better school performance and an increase in the number of completed years of schooling. However, if (as seems likely) parents fail to recognize this long-term effect of voucher receipt, then a separate value for this outcome must be reflected in the analysis. If the quality of the neighborhood school is reflected in market rental rates, the value of the schools would be attributed to both the childless Section 8 recipients and those recipients with children. However, the 'school quality effect' reflected in the higher neighborhood rents reflects the tastes of both residents with and residents without children. If the recipients with children place a somewhat higher value on the schools than those without children, the values of the subsidy in Items 1. and 2. should be adjusted to reflect this difference.

21
distribution of the average MtO family), the present value of the lifetime gain to families with children is
$15,300. This is equivalent to an annual, per case value of $624 for cases with children.29
However, other evidence from MTO has shown the intervention to have little effect on student
achievement. One study, based on data from all five MTO sites, found that students in the experimental
group performed no differently on reading and math tests than students in the control group
(Sanbonmatsu et al. 2006). Similarly, an analysis of data on 168 children from the New York City MTO
site found positive test score effects for a subsample of male youth, but no effects for the full sample
(Leventhal and Brooks-Gunn 2004).
Given the varying evidence, we assume an annual per-case value of $325 for cases with children,
about half of what Johnson et al. (2002) present. In Wisconsin, 17,280 Section 8 cases were families with
children (64 percent of the 27,000 Section 8 cases), implying an annual, per case benefit of $208. We use
$200 as the annual parental benefit from improved children’s educational attainments.
In addition to these private dollar-valued benefits from improved school achievement there are a
variety of nonmonetary private and public benefits of increased schooling (Haveman and Wolfe 1984;
Wolfe and Haveman 2001). These have been documented and studied, and a reasonable estimate is that
the nonmonetary private and public benefits are at least equal to the private monetary benefits in the form
of income gains. Assuming that the benefits beyond the private monetary benefits are equally divided
between the nonmonetary private and public benefits, we add $100 to the annual recipient benefit
estimate of $200 (above) for a total annual recipient benefit of $300, and assign $100 as annual
nonrecipient benefits.
29This estimate assumes that the children will experience a constant annual increment to earnings for 45 working years, beginning in the year of the present value estimate; a discount rate of 3 percent is used. This value is probably upward biased, as the youths will not begin working and earning until some years after the date of the present value estimate.

22
E. Benefits of Improved Health (Item 5. in Table 2)
The empirical evidence reviewed in Section III indicates that voucher receipt induces
improvements in health. To value this benefit, we start with the assumption that the value of a year lived
in optimal health is $100,000. This assumption is based on estimates presented in Dow and Schoeni
(2008), and is conservative in nature. Then, based on the evidence from MTO discussed above (see also
Katz et al., 2001b), we estimate that 18 percent of recipients will experience an increase in health as a
result of voucher receipt.30
30The Wisconsin sample upon which we base many of our estimates experienced an intervention that was in some respects different from the intervention experienced by MTO families. To qualify for MTO, families had to live in a public housing project in one of the 5 large cities studied by MTO at the time of random assignment. As a result, the MTO families who received a housing voucher moved from public housing projects to independent apartments. The families did not, however, experience a large change in effective income from the housing voucher itself, since housing projects and the Section 8 rental assistance program impose similar rental costs. In contrast, none of our Wisconsin sample lived in public housing at the time of their first participation in a rental subsidy program. As a result, most people in the Wisconsin families likely moved from one apartment to another, probably experiencing less environmental change than did the MTO treatment groups. However, the Wisconsin sample also realized a sizable boost in effective income from their vouchers, since they previously had received no housing assistance at all. Some of the health improvement induced by housing vouchers is likely to stem from environmental change, which the MTO experienced more of than did the Wisconsin sample. However, some of the health improvement induced by housing vouchers is also likely to derive from the fact that, for households that had not previously received housing assistance, the voucher can free up financial resources that can be used for more nutritious food and for health care. Our sample realized much more of this income effect.
Stated another way, each recipient has a 0.18 probability of experiencing
increased health due to receipt of a voucher. To estimate the average value of the increase in health, we
assume that the average value of individuals’ health prior to voucher receipt was 0.5 of optimal health.
Such an assumption is consistent with the MTO findings that only 58 percent of the control group said
that they were at least in “Good” health. We then assume that voucher receipt improves individuals’
health by 5 percent. Hence, for individuals that experience health improvements, voucher receipt moves
them from 0.5 to 0.525 of optimal health. Combining this estimate with our assumption that a year lived
in optimal health has a value of $100,000 results in health improvements that are valued at $2,500 per
person. Adjusting this estimate for the fact that 18 percent of the sample experiences a health increase
yields a per person estimate of $450 for the value of increased health. Because we present our results in a

23
per case metric, we multiple this estimate by 2.15, which is the average number of individuals within a
case. This yields a per case estimate of $963, which we present in item 5 of table 2.31
Our per case benefit estimate of $963 includes the $281–$351 in estimated benefits from
increased use of publicly provided health care discussed above. To avoid a double counting of benefits,
the value of increased use of public health care is not included in the table entry that presents the
estimated value from increased use of public programs (item 3 in table 2).
F. Value of Reduced Crime and Substance Abuse (Item 6. in Table 2)
Another potential benefit from housing voucher receipt is the changed behavior of children living
in recipient families, in particular, a reduction in drug use and illegal activities. A substantial literature has
studied the effects of housing support on youth problem behavior and crime related activities. Johnson et
al. (2002) draw on MtO-Baltimore data (from Ludwig et al. 2001b) and costs per crime estimates (from
Cohen 1998) to suggest that the present value of the benefit from reduced violent criminal offending and
problem behavior (comparing experimental to control families) ranges from about $5300 to $7600 per
family (depending on the experimental group). Using the lower of these two estimates, we calculate that
the annual value of this societal benefit is $621 per recipient family with children. When averaged over all
Section 8 families in Wisconsin, the value is $398. We assume that this benefit is equally divided between
voucher recipients and other citizens.
31A separate logic results in a similar estimate of the value of health improvement. This line of reasoning again starts with the assumption that a year lived in optimal health has a value of $100,000 (Dow and Schoeni, 2008). We also again assume that 18 percent of recipients will experience an increase in health as a result of voucher receipt. To value the improvement in health, we assume that the increase in health attributable to voucher receipt is similar in magnitude to the increase in health caused by graduating from high school, as opposed to dropping out of high school. Dow and Schoeni (2008) value the average difference in health between a high school dropout and a high school graduate at $3,000; we assume this to be the average value of health improvements attributable to voucher receipt. Adjusting this estimate for the fact that 18 percent of the sample experiences a health increase yields a per person estimate of $540 for the value of increased health. Because we present our results in a per case metric, we multiple this estimate by 2.15, which is the average number of individuals within a case. This yields a per case estimate of $1,161, which is very similar to the estimate of $963 that we present in item 5 of table 2.

24
G. Tax-Related Costs of Increased Voucher Recipient Public Program Benefits (welfare, EITC, food stamps, public health care) and Child Care (Item 8. in Table 2)
As we describe in section C. (above) the annual total taxpayer funds required to pay for benefits
from these programs that are attributable to these programs is $897 per case.32
H. Welfare Effects from Labor Market Responses of Voucher Recipients (Item 9. in Table 2)
Using the .2 parameter
estimate described above (see Section IV. A.), we estimate the welfare cost of financing the other benefit
programs related to the receipt of a housing subsidy to be $179, yielding a total per-case tax-related cost
of these expenditures of $1,076.
In our analysis of the impacts of the Section 8 program (see Carlson et al. 2009), we have
estimated the labor market response in the form of employment and earnings changes that result from
voucher receipt. At least in the year after voucher receipt, voucher receipt results in a decrease in both
employment and earnings. The estimated decrease in earnings reflects the sum of the income effect (as the
'income' of recipients rises due to the value of the voucher, more leisure time may be chosen) and the
substitution effect (as the price of leisure falls because of the benefit reduction rate implicit in the
structure of the program, recipients choose more of it).
The income effect of voucher receipt entails no change in social welfare for either voucher
recipients or other citizens; hence, there is no aggregate effect on social welfare.33
32This includes the costs of W-2 ($147), Food Stamps ($44), Medicaid/BadgerCare ($294), and child care ($412).
The substitution effect
does reflect a distortion-induced change in labor supply; this program-induced distortion carries with it a
33Consider, first, recipients of the voucher. From a voucher recipient's point of view, the total increase in leisure (nonwork) time attributable to the income effect is worth at least as much as the loss of earnings; the recipient voluntarily chooses the increase in leisure (reflected in decreased earnings). So, for that part of the change in earnings attributable to the income effect, the value of the leisure time is at least as great as the loss of earnings. For citizens who do not receive a voucher, there is also no welfare change due to the reduction in labor supply (earnings) of program participants due to the income effect. At the margin, nonrecipients lose the value of the lost output attributable to reduced recipient work effort (reflected in decreased recipient earnings). However, this loss is compensated by the increased value of the other items in the consumption bundle to which the income not spent on these forgone goods and services is allocated.
25
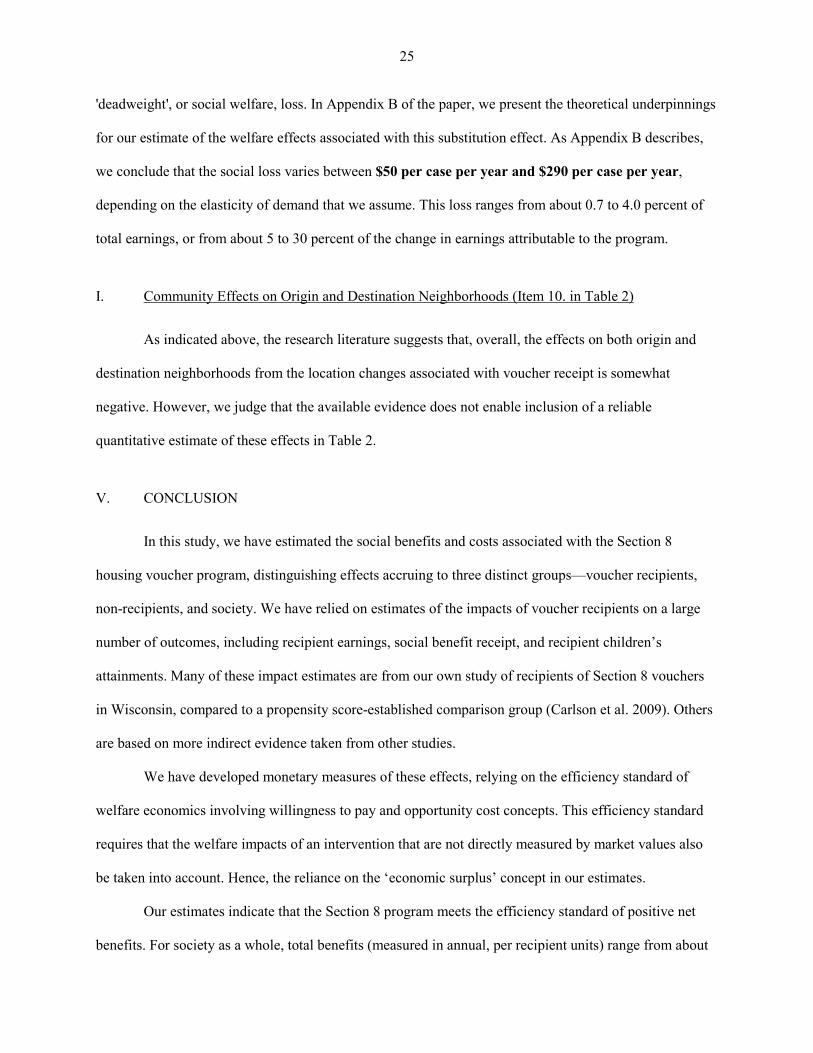
'deadweight', or social welfare, loss. In Appendix B of the paper, we present the theoretical underpinnings
for our estimate of the welfare effects associated with this substitution effect. As Appendix B describes,
we conclude that the social loss varies between $50 per case per year and $290 per case per year,
depending on the elasticity of demand that we assume. This loss ranges from about 0.7 to 4.0 percent of
total earnings, or from about 5 to 30 percent of the change in earnings attributable to the program.
I. Community Effects on Origin and Destination Neighborhoods (Item 10. in Table 2)
As indicated above, the research literature suggests that, overall, the effects on both origin and
destination neighborhoods from the location changes associated with voucher receipt is somewhat
negative. However, we judge that the available evidence does not enable inclusion of a reliable
quantitative estimate of these effects in Table 2.
V. CONCLUSION
In this study, we have estimated the social benefits and costs associated with the Section 8
housing voucher program, distinguishing effects accruing to three distinct groups—voucher recipients,
non-recipients, and society. We have relied on estimates of the impacts of voucher recipients on a large
number of outcomes, including recipient earnings, social benefit receipt, and recipient children’s
attainments. Many of these impact estimates are from our own study of recipients of Section 8 vouchers
in Wisconsin, compared to a propensity score-established comparison group (Carlson et al. 2009). Others
are based on more indirect evidence taken from other studies.
We have developed monetary measures of these effects, relying on the efficiency standard of
welfare economics involving willingness to pay and opportunity cost concepts. This efficiency standard
requires that the welfare impacts of an intervention that are not directly measured by market values also
be taken into account. Hence, the reliance on the ‘economic surplus’ concept in our estimates.
Our estimates indicate that the Section 8 program meets the efficiency standard of positive net
benefits. For society as a whole, total benefits (measured in annual, per recipient units) range from about

26
$7,700 to $9,600, while total costs are about $7,000; net benefits range from about $650 to $2,800 per
recipient case per year. The social benefit-cost ratio ranges from 1.1 to 1.37. The bulk of the benefits are
experienced by voucher recipients, while other members of society bear the bulk of the costs. We
conclude that the program meets the efficiency standard of welfare economics. And, although we do not
measure it, given the characteristics of the recipients of vouchers, the program also has pro-poor
distributional effects.
By necessity, this analysis has used a variety of sources for our estimates and it is possible that
our estimates overstate certain benefits and costs and underestimate others. While our estimates are the
most comprehensive welfare impacts available, there are impacts for which we have not been able to
generate a monetary estimate, as we have noted. Specifically, we were unable to value the effects on the
immediate community to which voucher recipients move and on the community from which they left.
As described earlier, these community effects may include increased demand for housing and
hence changes in rental prices, changes in the psychological well-being of existing residents if they
believe the socio-economic composition of their community is declining, and some decrease in
availability of certain services such as medical care and childcare due to the increase in demand for these
services from voucher recipients.
Alternatively, we may have also omitted the benefit of the prevention of a decline to the value of
housing as demand is reinforced though the voucher program, and the attraction of childcare and other
service providers to the community associated with gains in the effective demand for these services. In
general, we view the net value of these non-valued effects to be negative, but they would have to be very
large to alter our conclusion that the Section 8 program has a net positive impact on society.
Finally, we note again that this is a benefit cost analysis for an annual period. The earnings are
based on the first year of receipt while the additional benefits are annual values but calculated over a
longer period.

27
Appendix A Theoretical Illustration of Consumer Surplus Associated with Housing Voucher Receipt
In this analysis, a non-negligible portion of the benefits associated with the Section 8 Voucher
program accrue in the form of consumer surplus. This appendix provides a theoretical illustration of the
consumer surplus associated with improved housing and neighborhood quality caused by the receipt of a
housing voucher.
The theoretical analysis starts with a standard budget constraint, where the recipient’s income is
on the Y axis and housing services are on the X axis in the figure below. Given tastes and preferences,
which are reflected in U1, the individual chooses the optimal level of housing services to consume. This
optimization is represented by the tangency between U1 and the budget constraint. The level of housing
services that the individual chooses to consume is indicated by point H on the X axis.
Now, consider the budget constraint under the Section 8 program, which is effectively a price
subsidy for housing services.34
The movement from H to H’’ can be decomposed into a substitution effect and an income effect.
The move from H to H’ is attributable to the substitution effect while the move from H’ to H’’ is
attributable to the income effect.
The budget constraint under the Section 8 program is represented by the
red line in the illustration below. Under the program-imposed constraint, the individual again chooses the
optimal level of housing services to consume. This optimization is represented by the tangency between
U2 and the program-imposed constraint. The level of housing services that the individual chooses to
consume under the Section 8 program is indicated by point H’ on the X axis.
From this series of choices, we can uncover the individual’s compensated demand curve, and thus
identify the consumer surplus attributable to the Section 8 program. In this illustration, h1 represents the
amount of housing that the individual will purchase at price Ph in the absence of the Section 8 program. In
34Because the Section 8 program acts as a price subsidy for housing services, the budget constraint with the program intersects the y axis at the same income level as that without the program. The effect of the program is to expand the budget constraint outward for positive amounts of housing services.

28
the presence of the program, the individual will purchase h3 units of housing at price Ph’. The distance
between h1 and h2 is the increase in housing consumption due to the substitution effect. We uncover the
individual’s compensated demand curve for housing by connecting the points at (h1, Ph) and (h2, Ph’); this
is curve d1 in the illustration below. Because the shift from consumption level h2 to consumption level h3
is due to the income effect, we can infer the individual’s compensated demand curve with the program in
effect (d2 in the illustration below).
Given this analysis, we can identify the value of the voucher, as well as the consumer surplus
induced by the Section 8 program. In this illustration, the value of the voucher is represented by the area
A+B+C+D+E (the amount of the subsidy multiplied by the amount of housing services consumed). The
individual’s consumer surplus is represented by the area F+G-A. Areas F and G represent the individual’s
willingness to pay in excess of the value of the voucher for the expanded opportunities provided by the
program; area A represents the social welfare loss associated with the distortion in housing consumption
caused by the program, and thus must be subtracted from the consumer surplus.

29
Income
Housing Services
U1 U2
Housing Services
Price of Housing
h1
d2
A B C D E
F
G
d1
h3
H H’’ H’
h2
Ph
Ph’

30
Appendix B Welfare Effects Due to Substitution Effect on Labor Supply
To understand the welfare impact caused by the substitution effect on labor supply, consider a
market demand curve for units of labor of the sort supplied by a Section 8 recipient. Given the (income
compensated) supply curve of labor, an equilibrium wage rate is observed. Because of the incentives in
the program, the recipient faces a lower effective wage rate than the market wage rate; the value of the
voucher is reduced as work and earnings increase, and this reduced voucher value is equivalent to a
reduction in the market wage rate. Because of the perceived lower wage rate, voucher recipients will
supply fewer units of work.
The area under the supply curve from the without-program level of work hours to the with-
program level equals the gain in leisure from the decrease in work. It is equal to the change in work time
times the wage rates at which leisure is valued. The area under the demand curve, however, reflects the
change in the value of the output that would have been produced. It is equal to the change in work hours
times the marginal output from the work change valued at the prices at which that output is valued. The
relevant area under the demand curve exceeds that below the supply curve. This area is known as the
deadweight loss triangle. It is this deadweight loss, then, that equals the social loss attributable to the
program-induced distortion.
The value of this loss clearly depends on the elasticity of demand, the elasticity of compensated
supply, and on the resulting change in the effective wage rate because of the program.
In the following analysis, we present estimates of the value of this loss making use of elasticity
estimates that bound the reasonable range of values in the literature. Our loss estimates are for the initial
year after receipt of the voucher. A more complete analysis would take account of earnings effects that
extend beyond the first year after the receipt of a benefit. In presenting these estimates, we make the
following assumptions:
1) Wage rate in the year prior to receipt Y(p) is the same as the wage rate in the year of receipt Y(r).
2) Estimates are only for the difference between year prior to receipt and year of receipt.
31
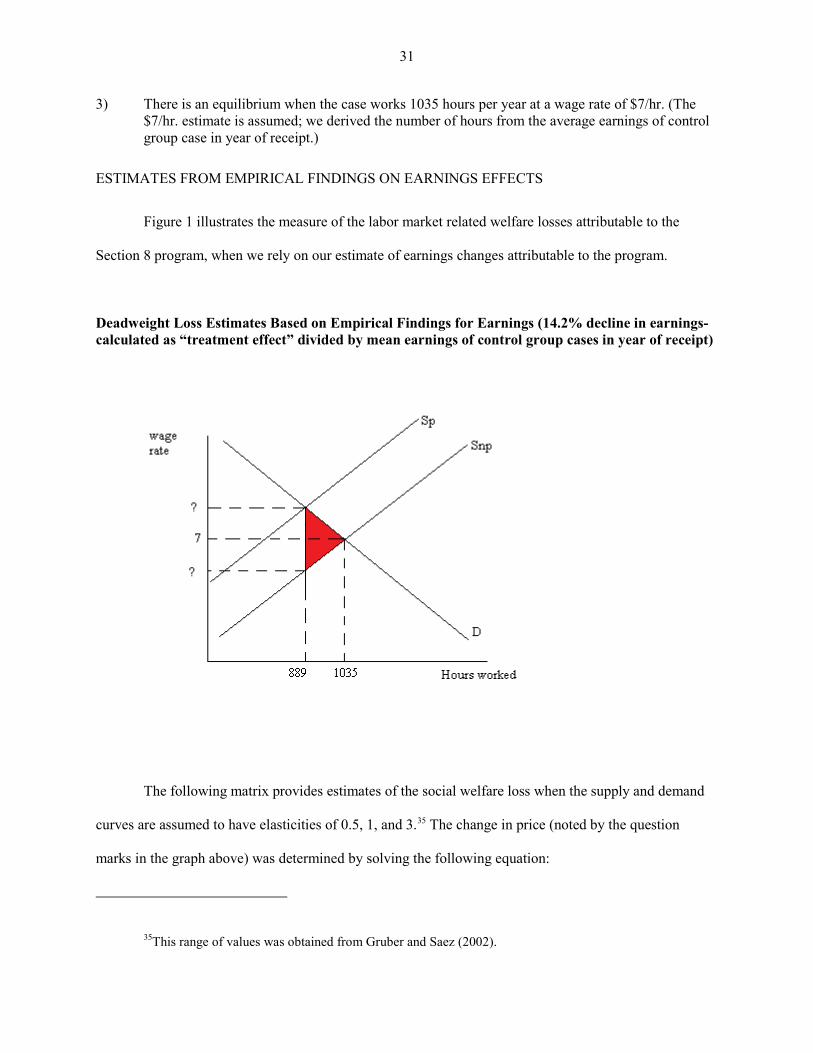
3) There is an equilibrium when the case works 1035 hours per year at a wage rate of $7/hr. (The $7/hr. estimate is assumed; we derived the number of hours from the average earnings of control group case in year of receipt.)
ESTIMATES FROM EMPIRICAL FINDINGS ON EARNINGS EFFECTS
Figure 1 illustrates the measure of the labor market related welfare losses attributable to the
Section 8 program, when we rely on our estimate of earnings changes attributable to the program.
Deadweight Loss Estimates Based on Empirical Findings for Earnings (14.2% decline in earnings- calculated as “treatment effect” divided by mean earnings of control group cases in year of receipt)
The following matrix provides estimates of the social welfare loss when the supply and demand
curves are assumed to have elasticities of 0.5, 1, and 3.35
35This range of values was obtained from Gruber and Saez (2002).
The change in price (noted by the question
marks in the graph above) was determined by solving the following equation:

32
(Change in quantity/change in price) * (price/quantity) = E
In the above equation, the change in quantity is 146, the change in price is unknown, and the
original price and quantity supplied are 7 and 1035, respectively. The elasticity (E) is either 0.5, 1, or 3.
Solving the equation provides us with the change in price, which can then be used to estimate the social
welfare loss. For reference, the change in price for each elasticity is as follows:
When E=0.5, the change in price is 1.975
When E=1, the change in price is 0.987
When E=3, the change in price is 0.329
These figures were used to calculate the social welfare loss estimates from the area of the DWL
triangle; they are presented in the matrix below.
Estimated Dollar Value of Social Welfare Loss
Elasticity of Demand
0.5 1 3
Elas
ticity
of S
uppl
y 0.5 288.35 216.23 168.19
1 216.23 144.10 96.07
3 168.19 96.07 48.03

33
Estimated social welfare loss as a percent of mean control group case head earnings (top number in each cell) and as a percentage of the treatment effect in the year of receipt (bottom number in each cell)
Elasticity of Demand
0.5 1 3
Ela
stic
ity o
f Sup
ply 0.5 3.98%
28.13% 2.98%
21.10% 2.32%
16.41%
1 2.98% 21.10%
1.99% 14.06%
1.33% 9.37%
3 2.32% 16.41%
1.33% 9.37%
0.66% 4.69%
Using this basis for estimating the labor market related welfare effects of benefit receipt, we
conclude that the social loss varies between $50 per case per year and $290 per case per year,
depending on the assumed elasticity of demand. This loss is about 0.7–4.0 percent of total earnings or
from about 5–30 percent of the change in earnings attributable to the program.
If the elasticities of supply and demand are both equal to unity, this loss is shared equally by the
worker (voucher recipient) and by the rest of society. We reflect this assumption in the entries in Figure 2.

34
Appendix C Monte Carlo Sensitivity Analysis-Net Value to Society
This appendix presents the results of a Monte Carlo simulation in which the benefit and cost
parameters are assigned probability distributions and allowed to vary within those distributions over the
course of repeated samples. This simulation helps account for the uncertainty underlying many of our
benefit and cost parameters, and illustrates the sampling distribution of net benefits, given this
uncertainty. We begin by describing the distributions assigned to the benefit parameters.
In the main body of the paper, we assigned the value of a Section 8 voucher to recipients, and
thus society, to be $4,264. This value ignores the potential deadweight loss associated with the distortion
in the level of housing consumption. Indeed, prior empirical research has estimated that the value of a
Section 8 housing voucher to recipients may be as low as 83 cents to the dollar (Reeder 1985). As a result,
in our Monte Carlo analysis we allow the value of a voucher to recipients to vary uniformly from $3,539
(83 percent of the assigned value) to $4,264.
Because of our inability to know the elasticity of the demand for housing, our estimate of the
consumer surplus associated with the improved housing and neighborhood quality that the Section 8
program provides is uncertain. To account for this uncertainty, we assign this benefit category a normal
distribution with a mean of $1,492 and a standard deviation of $172.
We assigned a similar distribution to the benefits stemming from increased use of other public
programs, such as TANF, food stamps, public health care, and child care services. This benefit category
was assigned a normal distribution with a mean of $1,470 and a standard deviation of $132. Again, the
uncertainty in this category stems from our inability to precisely estimate the consumer surplus associated
with receipt of these benefits.
We allowed the benefits associated with increased student achievement and attainment to vary
normally with a mean of $400 and a standard deviation of $99 while the benefits from reduced crime and
substance abuse were assigned a normal distribution with a mean of $398 and a standard deviation of
$199.

35
Finally, we assume the benefits associated with increased health to have a mean of $963 and a
standard deviation of $200; we assign a normal distribution to this parameter. A summary of the
distributions assigned to each benefit category can be found in table C1 below.
The main costs associated with the Section 8 voucher program are the 1.) tax-related costs of
voucher provision and 2.) tax-related costs of increased public program benefits. Each of these categories
has two components: the financial cost of provision and the excess welfare burden associated with
taxation. Most of the uncertainty in the estimates of these cost parameters stems from our inability to
identify the excess tax burden. To account for this uncertainty, we assign each of these cost parameters to
vary normally. The cost of voucher provision varies normally with a mean of $5,685 and a standard
deviation of $317 while the cost of the provision of additional public programs varies normally with a
mean of $1,076 and a standard deviation of $60.
Appendix B illustrates the distorted labor market choices induced by the Section 8 program. The
precise magnitude of these costs depends upon the elasticities of the supply and demand curves, and we
allow these cost estimates to vary uniformly from a low of $50 to a high of $290. A summary of the
distributions assigned to each cost category can be found in table C1 below.
Table C1. Summary of Distributions Assigned to Benefit and Cost Parameters
Parameter Mean Std. Dev. Min Max Distribution Benefits Value of S8 Voucher $3,902 $209 $3,539 $4,264 Uniform Value of Increased Neighborhood quality $1,492 $172 $728 $2,248 Normal Value Public Program Use $1,470 $132 $852 $2,045 Normal Value of Increased Achievement $400 $99 -$60 $865 Normal Value of Reduced Crime and Substance Abuse $400 $99 -$33 $888 Normal Value of Improved Health $963 $200 $93 $1,872 Normal Costs Voucher provision $5,685 $317 $4,309 $7,251 Normal Provision of additional public programs $1,076 $60 $815 $1,349 Normal Labor mkt. response $170 $69 $50 $290 Uniform

36
Using the benefit and cost parameters identified above, we ran a Monte Carlo simulation with
100,000 trials. The results of this simulation are presented visually in figure C1 and in numerical format
in table C2. These results illustrate that, given our benefit and cost estimates, the Section 8 program is
highly likely to have a positive net social value. Over the course of 100,000 trials, over 99,900 returned a
positive estimate of the net social value of the program. The mean value in this simulation was $1,691
while the minimum and maximum were -$624 and $4,194, respectively.
While this Monte Carlo simulation supports our conclusion that the Section 8 program is likely to
have a positive net social value, we again note the omitted effects on the origin and destination
communities. However, this simulation illustrates that these effects would have to be substantial to result
in negative social benefits.
0.0
2.0
4.0
6.0
8Fr
actio
n of
Tria
ls
-1000 0 1000 2000 3000 4000Present Value of Net Benefits to Society (Dollars)
Monte Carlo Simulation: 100,000 TrialsFigure C1. Distribution of Net Social Benefits from Section 8 Program

37
Table C2. Monte Carlo Summary Statistics for Net Social Value of Section 8 Program
Trials Mean Std. Dev. Min. Max. Proportion > 0
100,000 $1,691.11 $507.88 -$624.41 $4,193.97 09996


39
References
Ballard, Charles L. 1990. “Marginal Welfare Cost Calculations: Differential Analysis vs. Balanced Budget Analysis.” Journal of Public Economics 41(2): 263–76.
Ballard, Charles L., John B. Shoven, and John Walley. 1985. “General Equilibrium Computations of the Marginal Welfare Costs of Taxes in the United States.” American Economic Review 75(1): 128–38.
Boardman, Anthony E., David H. Greenberg, Aidan R. Vining, and David L. Weimer. 2006. Cost-Benefit Analysis: Concepts and Practice 3rd edition. Upper Saddle River, NJ: Pearson Prentice Hall.
Bradbury, Katharine L., and Anthony Downs. 1981. Do Housing Allowances Work? Washington, DC: Brookings Institution Press.
Browning, Edgar K. 1987. “On the Marginal Welfare Cost of Taxation.” American Economic Review 77(1): 11–23.
Carlson, Deven, Robert Haveman, Thomas Kaplan, and Barbara Wolfe. 2009. “Long-Term Effects of Public Low-Income Housing Vouchers on Neighborhood Quality, Labor Market, and Social Outcomes.” IRP Discussion Paper no. 1363-09. Madison, WI: Institute for Research on Poverty, University of Wisconsin–Madison.
Center for Budget and Policy Priorities. 2008. National and State Voucher Utilization Data, 2004–2008. Retrieved October 11, 2009 from http://www.cbpp.org/cms/index.cfm?fa=view&id=2710.
Currie, Janet, and Firouz Gahvari. 2008. “Transfers in Cash and In-Kind: Theory Meets the Data.” Journal of Economic Literature 46(2): 333–83.
Deng, Lan. 2005. “The Cost-Effectiveness of the Low-Income Housing Tax Credits Relative to Vouchers: Evidence from Six U.S. Metropolitan Areas.” Housing Policy Debate 16(3&4): 469–511.
Deng. Lan. 2009. “Assessing Changes in Neighborhoods Hosting the Low-Income Housing Tax Credit Projects.” http://www.closup.umich.edu/research/workingpapers/papers/closup-wp-8-lihtc.pdf.
Dow, W., and R. Schoeni. 2008. “Economic Value of Improving the Health of Disadvantaged Americans.” Technical Report for Overcoming Obstacles to Health: Report from the Robert Wood Johnson Foundation to the Commission to Build a Healthier America. Retrieved February 6, 2010 from http://www.commissiononhealth.org/PDF/7626470d-e944-4dfe-9f8c-3fd2dad98472/Technical%20Report-Economic%20Value%20of%20Improving%20Health.pdf.
Feldstein, Martin. 1999. “Tax Avoidance and the Deadweight Loss of the Income Tax.” Review of Economics and Statistics 81(4): 674–80.
Freeman, Lance, and Hilary Botein. 2002. “Subsidized Housing and Neighborhood Impacts: A Theoretical Discussion and Review of the Evidence.” Journal of Planning Literature 16(3): 359–78.
Fullerton, Don, and Yolanda K. Henderson. 1989. “The Marginal Excess Burden of Different Capital Tax Instruments.” Review of Economics and Statistics 71(3): 435–42.

40
Galster, George, Peter Tatian, and Robin Smith. 1999. “The Impact of Neighbors Who Use Section 8 Certificates on Property Values.” Housing Policy Debate 10(4): 879–917.
Gruber, Jon, and Emmanuel Saez. 2002. “The Elasticity of Taxable Income: Evidence and Implications.” Journal of Public Economics 84(1): 1–32.
Harkness, Joseph, and Sandra Newman. 2003. “The Interactive Effects of Housing Assistance and Food Stamps on Food Spending.” Journal of Housing Economics 12(3): 224–49.
Haveman, Robert, and Barbara Wolfe. 1984. “Schooling and Economic Well-Being: The Role of Nonmarket Effects.” The Journal of Human Resources 19(3): 377–407.
Johnson, Michael P., Helen F. Ladd, and Jens Ludwig. 2002. “The Benefits and Costs of Residential Mobility Programmes for the Poor.” Housing Studies 17(1): 125–38.
Judd, Kenneth L. 1987. “The Welfare Cost of Factor Taxation in a Perfect-Foresight Model.” Journal of Political Economy 95(4): 675–709.
Karoly, Lynn, M. Rebecca Kilburn, and Jill S. Cannon. 2005 “Proven Benefits of Early Childhood Interventions.” Rand Labor and Population Research Brief. Accessed on 10/19/2009. http://www.rc.rand.org/pubs/research_briefs/RB9145/.
Katz, Lawrence F., Jeffrey R. Kling, and Jeffrey B. Liebman. 2001a. “Moving to Opportunity in Boston: Early Results of a Randomized Mobility Experiment.” Quarterly Journal of Economics 116(2): 607–54.
Katz, Lawrence F., Jeffrey R. Kling, and Jeffrey B. Liebman. 2001b. “Boston Site Findings: The Early Impacts of Moving to Opportunity. In Choosing a Better Life? Evaluating the Moving to Opportunity Social Experiment, edited by John Goering and Judith D. Feins. Washington, DC: Urban Institute Press, pp. 177–211.
Kling, Jeffrey R., Jeffrey B. Liebman, and Lawrence F. Katz. 2007. “Experimental Analysis of Neighborhood Effects.” Econometrica 75(1): 83–119.
Krueger, Alan B. 1999. “Experimental Estimates of Education Production Functions.” Quarterly Journal of Economics 114(2): 497–532.
Lee, Chang-Moo, Dennis P. Culhane, and Susan M. Wachter. 1999. “The Differential Impacts of Federally Assisted Housing Programs on Nearby Property Values: A Philadelphia Case Study. Housing Policy Debate 10(1): 75–93.
Leventhal, Tama, and Jeanne Brooks-Gunn. 2001. Moving to Opportunity: What About the Kids? New York: Center for Children and Families, Teachers College, Columbia University.
Leventhal, Tama, and Jeanne Brooks-Gunn. 2003. Moving to Opportunity: An Experimental Study of Neighborhood Effects on Mental Health. American Journal of Public Health 93(9): 1576–82.
Leventhal, Tama, and Jeanne Brooks-Gunn. 2004 “A Randomized Study of Neighborhood Effects on Low-Income Children’s Educational Outcomes.” Developmental Psychology 40(4): 488–507.

41
Ludwig, Jens, Helen Ladd, and Greg J. Duncan. 2001a. “The Effects of Urban Poverty on Educational Outcomes: Evidence from a Randomized Experiment.” In Brookings-Wharton Papers on Urban Affairs, Vol. 2, edited by W. G. Gale and Janet Pack. Washington, DC: Brookings Institution Press.
Ludwig, Jens, Greg J. Duncan, and P. Hirschfield. 2001b. “Urban Poverty and Juvenile Crime: Evidence from a Randomized Housing-Mobility Experiment.” Quarterly Journal of Economics 116(2): 655–80.
Mills, Gregory, Daniel Gubits, Larry Orr, David Long, Judie Feins, Balbul Kaul, and Michelle Wood. 2006. “Effects of Housing Vouchers on Welfare Families.” Report U.S. Department of Housing and Urban Development. http://www.huduser.org/publications/commdevl/hsgvouchers.html.
Ng, Yew-Kwang. 2000. “The Optimal Size of Public Spending and the Distortionary Cost of Taxation.” National Tax Journal
Parry, Ian W. H. 2002. “Tax Deductions and the Marginal Welfare Cost of Taxation.” International Tax and Public Finance 9(5): 531–52.
. 53(2): 253–72.
Reeder, William J. 1985. “The Benefits and Costs of the Section 8 Existing Housing Program.” Journal of Public Economics 26(3): 349–77.
Santiago, Anna M., George C. Galster, and Peter Tatian. 2001. “Assessing the Property Value Impacts of the Dispersed Housing Subsidy Program in Denver.” Journal of Policy Analysis and Management 20(1): 65–88.
Slesnick, Daniel T. 1996. “Consumption and Poverty: How Effective Are In-Kind Transfers?” Economic Journal 106(439): 1527–45.
Snow, Arthur, and Ronald S. Warren, Jr. 1996. “The Marginal Welfare Cost of Public Funds: Theory and Estimates.” Journal of Public Economics 61(2): 289–305.
Sanbonmatsu, Lisa, Jeffrey R. Kling, Greg J. Duncan, and Jeanne Brooks-Gunn. 2006. “Neighborhoods and Academic Achievement: Results from the Moving to Opportunity Experiment.” Journal of Human Resources 41(4): 649–91.
Stuart, Charles. 1984. “Welfare Costs per Dollar of Additional Tax Revenue in the US.” American Economic Review
Susin, Scott. 2002. “Rent Vouchers and the Price of Low-Income Housing.” Journal of Public Economics
74(3): 352–62.
83(1): 109–52.
Susin, Scott. 2005. “Longitudinal Outcomes of Subsidized Housing Recipients in Matched Survey and Administrative Data.” Cityscape 8: 189–218.
U.S. Department of Housing and Urban Development. 2000. “Section 8 Tenant-Based Housing Assistance: A Look Back after 30 Years.” Washington, DC: U.S. Department of Housing and Urban Development.

42
U.S. Department of Housing and Urban Development. 2007. Public Information Center: Resident Characteristics Report. Retrieved October 13, 2007 from https://pic.hud.gov/pic/RCRPublic/rcrmain.asp.
Weinberg, Daniel H. 1982. “Housing Benefits From the Section 8 Housing Program.” Evaluation Review 6(1): 5–24.
Wisconsin Legislative Fiscal Bureau. 2005a. “Medical Assistance, BadgerCare, SeniorCare, and Related Programs.” Madison, WI: Wisconsin Legislative Fiscal Bureau. January.
Wisconsin Legislative Fiscal Bureau. 2005b. “SSI Managed Care Expansion.” Madison, WI: Wisconsin Legislative Fiscal Bureau. May 25.
Wolfe, Barbara, and Robert Haveman. 2001. “Accounting for the Social and Non-Market Benefits of Education.” In The Contribution of Human and Social Capital to Sustained Economic Growth and Well Being, edited by John F. Helliwell. Vancouver, BC: University of British Columbia Press, 221–50.