the behaviour, survival and production of atlantic …...discharge of western brook pond, and the...
TRANSCRIPT

The Behaviour, Survival and Production of Atlantic Salmon (Salmo salar L.) Smolts in the Western Brook River System
by
Jason P. Dietrich
Hon. B. Sc. Biology, Env. Sci. Opt. Wilfrid Laurier University, 1998
A Thesis Submitted in Partial Fulfillment of
the Requirements for the Degree of
Masters of Science
In the Graduate Academic Unit of Biology Supervisor: R. A. Cunjak, Ph. D., Biology Examining Board: G. J. Forbes, Ph. D., Biology (Chair) J. Watmough, Ph. D., Mathematics and Statistics
This thesis is accepted.
________________________________
Dean of Graduate Studies
UNIVERSITY OF NEW BRUNSWICK
September, 2001
© Jason Dietrich, 2001

Abstract:
During spring/summer over a three-year period in the Western Brook river
system, Newfoundland, studies were conducted to gain general knowledge of the biology,
ecology, and behaviour of juvenile anadromous Atlantic salmon for future use in
management and research of this species in the system. More specifically, several
sampling techniques, including mark-recapture experiments, were used to study fish size,
age structure, population size, timing of migration, and migratory behaviour of juveniles
in the system. Special attention was given to the effects of the fjord lake (Western Brook
Pond) on migration and growth. The potential impacts of marking juveniles for recapture
was also studied in the hatchery and in the field and found to be small. Atlantic salmon
smolt production for the Western Brook system was estimated at 7 500 – 11 000 smolts
per year, with the majority of emigrants being aged 3 years. Delayed migration in the
lake was accompanied by increased growth and a lack of schooling behaviour. The
contribution by the lake to the overall rearing and production of juveniles in the system is
large (30 – 50 %).
ii

Acknowledgements:
The author would like to extend his deepest thanks to the staff of the Mactaquac
Fish Culture station for the use of their facility, supply of juvenile salmon, and
demonstrating the technique of Carlin tagging. Dr. T. J. Benfey supplied the Panjet
inocculator and provided helpful criticism throughout the course of this project. My
sincerest thanks to Dr. R.A. Cunjak for his helpful criticism, guidance, and belief in me
as a graduate student.
I am especially grateful to Valérie Bujold for her invaluable effort,
encouragement, and advice in the field and lab. However, I am most grateful for her
friendship through difficulty. I would also like to thank Dan Cartwright for his
enthusiasm, input and camaraderie while in the field. Special thanks to Brigitte
Rothernel, David Courtemanche, Kirk Pilgrim, Ryan Delong, Cory Kennedy, Steve
Currie, Brendon Galloway, and Jason Flanagan who volunteered their time and energy to
facilitate data collection in the field and hatchery. Brian Dempson provided helpful
advice and criticisms pertaining to population estimation.
Thank you to Gros Morne National Park administration and staff, most especially
Stephen Flemming and Chris McCarthy, who were instrumental in the completion of this
project. Further expertise, equipment and support were supplied by Conrad Mullins, Pat
Caines and Don Caines the Department of Fisheries and Oceans Corner Brook, NF.
I wish like to extend my deepest gratitude to the people of the town of Cow Head,
NF, for their incredible hospitality. You became a home away from home.
iii

Table of Contents Page
Abstract ii Acknowledgments iii Table of Contents iv List of Tables vii List of Figures ix Chapter 1 – The juvenile Atlantic salmon (Salmo salar L.) of the Western Brook Pond system: Introduction and overview 1
References 4
Chapter 2 – The survival, healing, fin regeneration and recapture success of Carlin tagged, fin clipped and dye injected juvenile Atlantic salmon (Salmo salar L.) 6
Abstract 6 Introduction 8 Methods
Hatchery Study 13 Statistical Analyses 16 Field Study Study Site 17 Upstream Marking Site – Stag Brook 18 Downstream Recapture Site – Western Brook 19 Statistical Analyses 20 Results Hatchery Study Mortalities due to Tagging 21 Fork-Length and Condition Factors 21 Tag Condition 24 Fin Regeneration 26 Temperature Regime 27 Field Study Survival of Marking Treatment Groups 29 Panjet Tattooed VS. Carlin Tagged Recapture Success 29 Discussion 30 Conclusions 35 References 36
iv

Chapter 3 – Migratory behaviour of Atlantic salmon (Salmo salar L.) smolts in a Newfoundland fjord lake 39
Abstract 39 Introduction 40 Study Site 43 Methods
1998 (sampling year 1) Stag Brook 45
Western Brook Pond 48 Western Brook 49
1999 (sampling year 2) Stag Brook 49 Western Brook Pond 50 Western Brook 51
2000 (sampling year 3) Stag Brook 51 Western Brook Pond 52 Western Brook 53
Temperature Regimes 54 Aging of Scale Samples 54 Statistical Analyses 55
Results Fish Movement 1998 57
1999 60 2000 64 Fork-Lengths and Condition Factors 68 Scale Aging Analysis 70
Temperature Regimes During Smolt Movement 73 Mark-Recapture Results
1998 (sampling year 1) 75 1999 (sampling year 2) 76 2000 (sampling year 3) 78
Lacustrine Growth of Recaptured Emigrants (2000) 80 Discussion 84 Conclusions 92
References 93 Chapter 4 – Estimates of Atlantic smolt production by the Western Brook Pond river system, Newfoundland 97 Abstract 97 Introduction 98
v
Methods Electrofishing 101 Counting Fence Operations 103 Mark – Recapture Upstream Marking Site – Stag Brook 104 Downstream Recapture Site – Western Brook 105 Statistical Analyses 105 Results
a) Estimate of Stag Brook and Western Brook smolt production using parr densities calculated from electrofishing data 106
b) Estimate of Western Brook Pond smolt production using fyke trap efficiency data 109 c) Estimate of 1997 Western Brook system smolt production using the number of migrating adult salmon captured in 1998 110 d) Estimate of 1998 Western Brook Pond system smolt production using the number of migrating adult salmon captured in 1999 112 e) Estimate of total smolt production using the total count of smolts exiting the system in 1999 through the fish fence 112 f) Estimate of smolts produced in Western Brook Pond in 1999 using the total count of smolts exiting the system in 1999 and 1998 parr densities of Stag Brook and Western Brook 112 g) Petersen estimate using mark-recapture data for the 2000 field season 113 Discussion 113 Conclusions 119 References 120 Chapter 5 – Summary and Conclusions 123
References 127
vi

List of Tables
Chapter 2: Page Table 2.1: Mean fork-length (cm) at the initiation (T0), termination (T4) of the marking experiment and the specific growth rate (% • day-1) calculated at the end of the experiment (146 days) for each treatment group. 21 Table 2.2: Number of individuals showing partial fin regeneration for each treatment group (n = 28), for each time period. 26 Chapter 3: Table 3.1: Table showing the start of sampling, the start, peak, and end of the smolt run, the termination date of sampling, and the number of smolts and parr captured at each site on the Western Brook system (1998 – 2000). 48 Table 3.2: Table showing the start of sampling, the first and last captured, peak, the termination date of sampling, and the total number of parr captured and < and ≥ 9 cm size categories where applicable at each site on the Western Brook system (1998 – 2000). 59 Table 3.3: Mean fork-lengths (± 1 SD), mean condition factors (± 1 SD), for Atlantic salmon smolts caught at each sampling site on the Western Brook system over 3 years (1998 – 2000). 68 Table 3.4: Average, minimum, and maximum daily mean temperatures for Stag Brook, Western Brook Pond and Western Brook from May 26 – July 27 (duration of Western Brook system smolt migration), 1998 – 2000. 73 Table 3.5: Number of smolts captured, marked and recaptured during migration in Stag Brook (STB), Western Brook Pond (WBP) and Western Brook (WB), 1998 – 2000. 75 Table 3.6: Fork-length, migration time, distance traveled, and trip speed of emigrant Atlantic salmon smolts from time of marking in Stag Brook until the time of recapture at the outflow of Western Brook Pond for 1999 and 2000. 77
vii

Table 3.7: Differences in fork-length, number of plus growth circuli and ratio of plus growth circuli length to total scale length L+ : L tot, migration time, and growth per day, between the time of marking in Stag Brook and the time of recapture at the outflow of Western Brook Pond, 2000. 81 Table 3.8: Differences in number of circuli, radius length of plus growth circuli, and circulus width for Atlantic salmon smolts between the time of marking in Stag Brook until recapture at the discharge of Western Brook Pond, 2000. 83 Chapter 4: Table 4.1: Estimated Atlantic salmon smolt production derived from parr densities estimated from electrofishing Stag Brook and Western Brook from 1998 – 2000. 108 Table 4.2: Estimates of yearly smolt production created by electrofishing, enumeration and mark-recapture data for Stag Brook, Western Brook Pond, Western Brook, and the system as a whole. 111
viii

List of Figures
Chapter 2: Page Figure 2.1: Map showing the marking sites and the recapture site set on the Western Brook Pond river system in 2000. 18 Figure 2.2: Mean condition factor (+ 1 SD) for each treatment group at the initiation (T0) and termination (T4) of the marking experiment. 22 Figure 2.3: Difference in mean condition factor (+ 1 SD) for each treatment group between the initiation (T0) and the termination (T4) of the marking experiment. 23 Figure 2.4: Percentage of juvenile Atlantic salmon individuals with partially healed, totally healed, and worse or irritated Carlin tag wounds for each time period. 24 Figure 2.5: Fluctuations in daily mean water temperature and the number of degree-days during each time period for the duration of the marking experiment (336.7 degree-days). 28 Chapter 3: Figure 3.1: Map showing the location of the Western Brook system including Stag Brook, Western Brook Pond and Western Brook. 44 Figure 3.2: Maps showing location of sampling sites in Stag Brook, Western Brook Pond and Western Brook (1998 – 2000). 46 Figure 3.3: Daily counts of Atlantic salmon smolts captured emigrating from Stag Brook, Western Brook Pond, and Western Brook with daily mean water temperatures, 1998. 58 Figure 3.4: Daily counts of Atlantic salmon smolts captured emigrating from Stag Brook, Western Brook Pond, and Western Brook with daily mean water temperatures, 1999. 61 Figure 3.5: Daily counts of Atlantic salmon parr captured at the discharge of Western Brook Pond, and the mouth of Western Brook with daily mean water temperatures, 1999. 63 Figure 3.6: Daily counts of Atlantic salmon smolts captured emigrating from Stag Brook, Western Brook Pond, and Western Brook with daily mean water temperatures, 2000. 65
ix

Figure 3.7: Daily counts of Atlantic salmon parr captured at Stag Brook (for size classes < 9 cm and ≥ 9 cm) and at the discharge of Western Brook Pond (all size classes), with daily mean water temperatures, 2000. 66 Figure 3.8: Frequency of smolts captured by age class for Stag Brook, Western Brook Pond and Western Brook from 1998 – 2000. 71 Figure 3.9: Percent of Atlantic salmon smolts captured at each sampling site during both halves of the smolt run that showed plus growth (1998 – 2000). 72 Figure 3.10: Daily mean water temperature readings taken from May 26 to July 28, 2000 at Western Brook Pond near the inflow of Stag Brook (WBPS),Western Brook Pond near its drainage by Western Brook (WBPD), and Stag Brook and the start (S), peak (P) and end (E) of smolt migration from Stag Brook. 74 Figure 3.11: Relationship between lake residence time and the day of the smolt run which and individual was marked in Stag Brook in 2000 showing y-intercept (a), slope (b) and adjusted R2 value. 80 Chapter 4: Figure 4.1: Map showing the Western Brook Pond river system and the location of fyke trap sampling sites, fish-counting fence, and electrofishing sites for 1999 – 2000. 101 Figure 4.2: Yearly changes in the density (number of fish per 100 m2
+ 1 SD) of Atlantic salmon parr aged ≥ 2 + years at electrofished sites on Stag Brook and Western Brook. 107
x

1
Chapter 1 – The juvenile Atlantic salmon (Salmo salar L.) of the
Western Brook system: Introduction and overview
The Atlantic salmon (Salmo salar L.) is one of the most sought after species of
fish in the world. This beautiful animal is desired both for its food quality and for the
experience it gives to anglers. Atlantic salmon stocks have been reduced and put under
stress due to industrial encroachment on spawning, nursery and rearing habitat in tandem
with stresses caused by commercial fisheries. Consequently, the conservation of this
species has become paramount. Atlantic Region National Parks are likely among the few
refugia left where Atlantic salmon exist with limited anthropogenic effects and where
genetically pure populations may still occur (Anonymous 1990).
The juvenile life stages of the anadromous Atlantic salmon are extremely
important to the overall survival of the stock. The smolt stage is the last stage in the life
cycle that can be censused or surveyed prior to exploitation by fishing. Quantifying the
changes in smolt abundance and understanding the behaviour of this life stage can aid in
management of the stock as a whole (Power 1985).
In May of 1998 the M. Sc. research project detailed herein was initiated to gain an
understanding of the production, behaviour, and general biological characteristics of
juvenile Atlantic salmon, most especially smolts, in the Western Brook system, Gros
Morne National Park, Newfoundland.
The Western Brook system located in the north end of the National Park has been
closed to angling since 1984. The mandate of the National Park is for conservation and

2
protection of species (Anonymous 1990). Conversely, provision of a complete outdoor
experience is strived for by the park. Such an experience has included angling in the
past, and therefore calls for the promotion of angling as an acceptable activity
(Anonymous 1990).
Stag Brook and Western Brook have supported important recreational fisheries to
the communities in their vicinity, especially Sally’s Cove, St. Paul’s and Cow Head.
Recent pressures to reassess the closure of this system to fishing have surfaced. The
results of this project may be instrumental in the building of management guidelines for
this river system in the future.
During spring and summer from 1998 – 2000, a research program was initiated to
gather data pertaining to the production, general biological characteristics, and migration
of the Atlantic salmon of the Western Brook system. The general objective of this thesis
project was to quantify and describe the general biology and migratory patterns of
Atlantic salmon smolts of the Western Brook system. The more specific objectives of
this study were: (1) to gain an understanding of the general biological characteristics and
timing of migration for the Atlantic salmon smolts of the Western Brook system; (2) to
ascertain if Atlantic salmon smolts from the upper reaches of this system travel to the sea
in one migratory season; (3) to study the effects of the fjord lake, Western Brook Pond,
on the migratory behaviour of the salmon smolts; and (4) to estimate the annual smolt
production of the Western Brook system and decipher the separate contributions of Stag
Brook, Western Brook, and Western Brook Pond.
Because of the use of mark-recapture techniques in the study, it was necessary to
further assess utility of fin clips and the rates of fin regeneration (Armstrong 1947, Coble
3
1967, Johnsen and Unegal 1988), as well as the retention, and effect, of Carlin tags
(Hansen 1988, Coombs et al. 1990) and Panjet tattoos (Kelly 1967, Hart and Pitcher
1969, Coombs 1990, Herbinger et al. 1990) to juvenile Atlantic salmon. As a result,
experiments were preformed to investigate fin regeneration and tagging mortality in a
hatchery setting. The Panjet tattoo was used as an alternative mark to Carlin tagging
during the 2000 field season. The relative survival and recapture success of Carlin
tagged versus dye injected wild Atlantic salmon smolts was tested in the field. Chapter 2
presents and discusses the results from both complementary experiments, conducted in
the hatchery and in the field, to assess the use of Carlin tagging, fin clipping and Panjet
tattooing on Atlantic salmon smolts during their migration.
Chapter 3 presents results and conclusions pertaining to a mark-recapture
experiment in which Carlin tags were used to gain information pertaining to the
behaviour of Atlantic salmon smolts as they migrate through a large fjord lake, Western
Brook Pond. The rate of growth in relation to lower temperatures experienced by
Atlantic salmon smolts in the pond is also presented and compared to rates of growth in
both estuarine and riverine environments. This chapter also reports on the general
biological characteristics of Atlantic salmon parr and smolts in the system, such as timing
of movement, size distributions, and age classes.
The intent of Chapter 4 was to estimate the number of smolts within the Western
Brook system. Using several methods for estimating population size, the smolt
production for the Western Brook system was predicted. The contributions to smolt
production of the two tributaries and the large fjord lake of the system were also
estimated. Estimates of smolt production provided by this study are intended as a starting

4
point for discussion pertaining to the viability of a recreational fishery on this system and
the proposed increase in anthropogenic activity on Western Brook Pond.
References:
Anions, M. F. E. 1994. The freshwater fish of Gros Morne National Park, resource
description and analysis. Gros Morne National Park. 69 p.
Anonymous. 1990. Gros Morne National Park Salmonid Management Plan. Canadian Service, Atlantic Region. Armstrong, G. C. 1947. Mortality, rate of growth and fin regeneration of marked and unmarked lake trout fingerlings at the provincial hatchery, Port Arthur, Ontario. Transactions of the American Fisheries Society 77:129 – 131. Ball, B. 1991. Salmonid management study, Gros Morne National Park, 1987 –
1990 field program activity report. 35 p.
Coble, D. W. 1967. Effects of fin-clipping on mortality and growth of yellow perch with a review of similar investigations. Journal of Wildlife Management, 31: 173 – 180.
Coombs, K. A., J. K. Baile, C. M. Herbinger, and G. W. Friars. 1990. Evaluation of
various external marking techniques for Atlantic salmon. In: Parker et al. (eds.) Fish-marking techniques, American Fisheries Society Symposium 7:9 – 29.
Hansen, L. P. 1988. Effects of Carlin tagging and fin clipping on survival of Atlantic salmon (Salmo salar L.) released as smolts. Aquaculture, 70: 391 – 394.
Hart, P. J. B. and T. J. Pitcher. 1969. Field trials of fish marking using a jet inoculator. Journal of Fish Biology 1: 383 – 385.
Herbinger, C. M., G. F. Newkirk, and S.T. Lanes. 1990. Individual marking of Atlantic salmon: evaluation of cold branding and jet injection of Alcian Blue in several fin locations. Journal of Fish Biology 36: 99 – 101.

5
Johnsen, B. O., and Unegal O. 1988. Effects of different kinds of fin-clipping on over- winter survival and growth of fingerling brown trout Salmo trutta L., stocked in small streams in Norway. Aquaculture and Fisheries Management 19: 305 – 311.
Kerekes, J. J. 1994. Western Brook Pond. Pp. 284 – 293. In: Allan, R.J. et al. (eds.).
The book of Canadian Lakes. Canadian Association on the Water Quality, Monograph No. 3. Canada Centre for Inland Waters, Burlington, Ont. 598p.
Kelly, W. H. 1967. Marking freshwater and marine fish by injecting dyes. Transactions of the American Fisheries society 96: 163 – 175. Power, G. 1985. Estimating and understanding smolt output from Atlantic salmon rivers.
Pages 108 – 124 in 1985 Northeast Atlantic salmon workshop. Atlantic Salmon Federation Montreal, and New Brunswick Wildlife Federation, Moncton.

6
Chapter 2 – The survival, healing, fin regeneration and recapture success
of Carlin tagged, fin clipped and dye injected juvenile
Atlantic salmon (Salmo salar L.)
Abstract:
To ascertain the potential impact of a mark-recapture technique on juvenile
Atlantic salmon (Salmo salar L.) in the wild, survival, healing, and fin regeneration
associated with Carlin tagging and fin clipping were assessed in the hatchery
environment. Wild Carlin tagged and Panjet tattooed Atlantic salmon smolts of the
Western Brook river system, NW Newfoundland, were also compared for survival and
incidence of recapture. Hatchery reared juveniles ranging from 12.0 – 20.8 cm (mean =
17.4 ± 1.5 cm) were marked with Carlin tags and anal, pelvic or caudal fin-clips. No
mortality or tag loss was found and there was no significant difference in condition factor
between marked and unmarked salmon, or among fish of different mark groups. In
general, Carlin tag wounds began healing soon after being inflicted (within 28 days).
However, this was followed by a period where the majority of wounds became irritated
or showed a slowing of the healing process. Following this was a period of increased
healing, which continued until the end of the experiment. Fin regeneration increased as
the study progressed: caudal fins showed the first signs of regeneration; pelvic fins
showed the greatest amount of regeneration by the end of the experiment (approximately
340 degree-days). Atlantic salmon juveniles with anal fin clips showed significantly less
fin regeneration than those with pelvic or caudal fin clips. 185 Panjet tattooed (mean

7
fork-length = 12.0 ± 1.20 cm) and 167 Carlin tagged smolts (mean fork-length = 12.7 ±
1.17 cm) were held for 24 hours in the field to assess initial mortality that may have been
caused by marking. A comparison of mark retention and the percent of smolts
recaptured, for each mark type, was assessed at downstream recapture sites. Survival
after marking was 97 % overall. Retention was 100 % for smolts marked and held for 24
hrs; none of the smolts captured showed evidence of tag loss. Recapture success was
6.0 % for Panjet tattooed smolts and 5.9 % for Carlin tagged individuals. The high
survival and mark retention of all individuals, both in the hatchery and in the wild,
coupled with the observed rate of fin regeneration, indicated that these marking
techniques could be used safely in the field. The insignificant difference in recapture
success of Carlin tagged and Panjet tattooed Atlantic salmon smolts may indicate the
comparability of these marking techniques when used in the wild.

8
Introduction:
The use of external marks and tags has been important for the study of movement,
abundance, age, growth, mortality and behaviour of aquatic organisms (McFarlane et al.
1990). In fact, the mutilation of fins and other bony parts for these purposes has been
practiced for well over a hundred years (McFarlane et al. 1990). Each type of tag or
mark has its inherent limitations. Important considerations to be made when deciding on
the use of a particular type of mark or tag are the following: (1) length of time the mark
must remain on the organism, (2) availability and experience of personnel for tagging and
recovery, (3) life history information about the species, (4) methods used to capture the
organism and the handling techniques which minimize stress, and (5) whether it will be
necessary to coordinate the marking program with other scientists or organizations
(Wydowski et al. 1983).
Carlin tags are typically classified as “dangling tags”, i.e., they dangle freely at
the end of some form of attachment (McFarlane et al. 1990). Carlin tags have been used
since the 1950’s for marking fish. The original tags were made out of steel and were
fastened to the fish by passing steel wire through the body (Carlin 1955). Materials such
as plastic and polyethethylene monofilament have enabled this type of tag to become
lighter and less invasive to the fish tagged. The unique number printed on each
individual Carlin tag allows for the collection of life history data pertaining to each
individual. The retention time of such tags has been shown to be as much as two years
(Saunders et al. 1967, Hansen 1988). The relatively low loss rate (as low as 0 %, Hansen
1988, Kennedy et al. 1991) of these tags is offset by a large time commitment to mark

9
large numbers of fish. A second disadvantage is the risk of chronic wound problems
associated with tags that protrude from the body (McFarlane et al. 1990).
Fin-clipping fish is a form of mutilation. Earlier studies indicated that little
difference in growth and mortality were caused by fin mutilation (Armstrong 1947, Coble
1967). It does not appear to affect the sustained swimming ability of fish, but is not
advisable to remove fins important in stabilization and propulsion, such as pectorals or
caudals. The adipose fin is not known to regenerate whereas other fins do regenerate
after mutilated. As a result, fin clipping is often used in short term (one field season)
mark-recapture experiments (Wydowski et al. 1983). Coombs et al. (1990) clipped both
adipose and pelvic fins of hatchery reared Atlantic salmon parr. The parr were held for
three months (August – October) in outdoor holding tanks. Only 0.2 % of adipose fins
showed signs of regeneration; conversely, 46.4 % of the individuals with left pelvic fin
clips showed almost complete regeneration.
The fins of teleost fish (adipose fin excluded) are composed of structural units
called rays. These rays are made segmented dermal bones called lepidotrichia. Rays are
tapered distally by a group of actinotrichia, which are long rigid rods of a collagen-like
protein called elasodin. Each lepidotrichial segment is made up of two hemisegments,
which are joined by ligaments in a parenthesis-like structure. The whole structure is
covered by a typical epidermis (Becerra et al. 1983). After clipping the fin, the stump of
each ray regenerates by an epimorphic process. Restoration of the epidermis occurs first
followed by blastema formation, cell proliferation and differentiation (Becerra et al.
1996).

10
There is evidence that the use of Carlin tags and fin clips on migrating smolts has
a negative effect on survival for both wild and hatchery reared fish. Saunders et al. (1967)
presented evidence that the percent of Atlantic salmon returning to the Miramichi River,
New Brunswick, was lower for previously Carlin tagged or fin clipped smolts than non-
marked individuals. The Carlin tags used in their study were tied with stainless steel wire
and the fin clips used were adipose and left pelvic fin clips. The percentage of fin-
clipped adults caught returning to the system was significantly higher than for tagged
fish. In contrast, Hansen (1988) found that the rate of return of adults to the River Imsa,
Norway, was similar for adipose fin clipped and Carlin tagged Atlantic salmon smolts.
Some indication of a reduced growth rate between the smolt and grilse stages for tagged
and fin-clipped was also presented. Hansen (1988) indicated that the higher mortality of
Carlin tagged and fin-clipped individuals likely comes as a result of handling, anaesthesia
and tagging. Kennedy et al. (1991) showed that wild migrating Atlantic salmon smolts
fitted with modified Carlin tags were recaptured downstream with 83.6 % efficiency.
The authors describe a river system that is sampled at 100 % efficiency at lower water
levels (which was said to persist over the duration of their experiment). Therefore, the
16.4 % of smolts that were unaccounted for were assumed to have lost their tags, been
misidentified, or died due to predation or handling stress.
Studies done in the hatchery environment have shown that tagging of smolts can
increase mortality (Bergeron 1959). Furthermore, the size of smolts at the time of
tagging has been positively correlated to survival (Isaksson and Bergman 1978).
However, little difference in growth has been observed between Carlin tagged and non-

11
marked Atlantic salmon juveniles while in a hatchery environment (Bergeron 1959, Mills
1958).
A less intrusive method of marking fish is by injecting dyes into skin and fin rays.
Kelly (1967) described the ideal dye marking technique as long lasting, permanent on
every fish, non-toxic, non-irritating, and having no effect on normal growth. It should
require little or no extra formulation, allow rapid marking, and be inexpensive. The ideal
marking dye should also be non-encumbering (not interfere with normal swimming of
feeding), easily observable to an untrained viewer, provide numerous combinations, and
require a minimum of specialized equipment. Dyes are most often injected using a dental
inoculator, which allows for a large number of fish to be marked in a relatively short
period of time (Phinney et al. 1967), and often without anesthetizing the fish. The
number of combinations possible using this type of marking technique is great. Many
substances have been tested for Panjet tattoos, but Alcian Blue dye has been the most
successful (Pitcher et al. 1977, Thedinga et al. 1995). This type of dye can persist for as
long as 6 months in juvenile Atlantic salmon in hatchery conditions (Coombs et al. 1990).
In the wild marks may be lost after as little as 2 months, yet retention can be as long as a
year (Herbinger et al. 1990, Dussault et al. 1997). As with Carlin tags, jet-injected tattoos
have been used extensively with salmonids (Coombs et al. 1990, Herbinger, 1990, Laufle
et al. 1990, Thedinga et al. 1995, Dussault et al. 1997). The survival and recapture of
Atlantic salmon smolts marked by Panjet tattoo has not been well discussed in the
literature. However, parr of the same species have shown good survival and recapture
rates (Dussault et al. 1997).

12
In 1999, a mark-recapture experiment was initiated on the Western Brook system
of Gros Morne National Park. One of the goals of the project was to track and estimate
the number of Atlantic salmon smolts in the different portions of the system. Taking into
consideration the information outlined above, it was decided to evaluate modified Carlin
tags and fin clips. Carlin tags were easy to use, available at a relatively low cost, and
provided a means for uniquely identifying individual salmon smolts. Fin clips were used
in tandem with the Carlin tags as a check for tag retention, because of the ease of
application, and the short duration of the study (< 6 months). Panjet tattoos were
administered in the field to assess if Carlin tagging was comparable to the technique of
dye injection in the wild. Consequently, it was important that an experiment be initiated
to assess the impact of Carlin tagging and fin clipping may have on the survival of
Atlantic salmon smolts.
Specifically the purposes of the study were to:
1) Quantify mortality of salmon smolts due to tagging in the hatchery.
2) Quantify differences in growth between tagged and untagged individuals.
3) Record the rate of fin regeneration for the four different types of fin clips: anal,
pelvic, and upper and lower caudal fin.
4) Quantify differences in growth among groups with different fin clips, and
determine which fin clip would be the most recognizable in the field for the
longest period of time.
5) Compare and assess short-term (24 h) mortality due to marking for the techniques
of Carlin tagging and Panjet tattooing in the field.

13
6) Compare the recapture success of migrating smolts marked by either Carlin tag
or Panjet tattoo over 3 months in the field.
7) Determine if Carlin tags were an acceptable mark for work in the wild.
Methods:
Hatchery Study:
The initial portion of the experiment was conducted at the Maqtaquac fish culture
station, approximately 20 km north of Fredericton, New Brunswick. Atlantic salmon pre-
smolts used in the study were 1 year old and supplied by the hatchery.
A tank with a volume of 5.4 m3 was prepared for holding the pre-smolts for the
experiment. River water was fed into the tank from the Saint John River with enough
pressure to create a counter-clockwise current in the tank. The depth of water in the tank
was approximately 1.05 m. Pebbles and rocks of a variety of sizes were collected from
the nearby riverbank and put into the holding tank to simulate riverbed conditions. A
thermograph suspended in the tank logged temperatures every hour for the duration of the
experiment.
On November 23, 1999, 140 Atlantic salmon parr ranging from 12.0 – 20.8 cm
(mean = 17.4 ± 1.5 cm) were randomly picked out of a large rearing tank (approximately
25 at a time) and placed into a temporary holding tub (volume = 0.12 m3). They were
then anesthetized in a 40 parts per million clove oil bath. Each individual was measured
for fork-length (cm) and weight (g), and 112 individuals were fitted with an individually
numbered (7 mm) Carlin tag. This was accomplished by passing two syringe needles

14
through the dorsal musculature of the fish just ventral to the dorsal fin so as to pass
between the internal fin rays. Monofilament line was then threaded though the needles
and out the other side of the body of the fish. The line was then tied with surgical knots
and excess line was clipped off with scissors. Each of the 112 Carlin tagged fish was also
given a fin clip with scissors. The remaining 28 parr were not marked for later
comparison to marked individuals. The type of fin clip that was administered produced
five treatment groups, each with 28 salmon parr, as follows:
1) Control group – no marks were given to these fish, however they were
anesthetized and measured.
2) Tag + AFC – each fish was Carlin tagged and given an anal fin clip (AFC).
3) Tag + LPFC – each fish was Carlin tagged and given a left pelvic fin clip
(LPFC).
4) Tag + UCFC – these fish were Carlin tagged and given upper caudal fin clips
(UCFC)
5) Tag + LCFC – these fish were Carlin tagged and given a lower caudal fin clip
(LCFC).
All individuals were placed into a recovery tank (volume = 1.8 m3) directly after
marking. Once recovered (after 5 – 7 minutes), parr were transferred to the empty
holding tank with river substrate. After all 140 fish were in the holding tank, it was
covered with wood and steel grating to prevent fish from jumping out. This date
(Nov. 23 / 99) was recorded as the starting time (To). The salmon were then left in

15
their new environment. They were manually fed standard pellet food four times daily
at an amount of 5 % of their body weight per day.
Twenty-one days later on December 22 (T1) fish were sampled to observe
occurrences of mortality and determine the condition of the marked salmon. The
experimental fish were transferred from their holding tank to a temporary holding tub
(volume = 0.12 m3). Each tagging wound and fin clip was examined for healing and
regeneration, respectively. All fish were then place into a recovery tank (volume =
1.8 m3) until the experimental holding tank (with substrate) was cleaned, after which
fish were returned to the larger cleaned tank.
An index system was used to quantify the state of the tagging wound and the
percent of regeneration associated with the fins, as follows:
Tag Condition (relative to initial tagging):
0 = no visible change to the wound
1 = tag intact and the wound partially healed
2 = tag intact and the wound totally healed
3 = tag intact, but the wound is worse or irritated
4 = tag missing, and the wound is partially healed
5 = tag missing, and the wound is totally healed

16
Fin Regeneration:
0 = none
1 = ≤ 10 % of total fin regenerated
2 = > 10 % and ≤ 25 % of total fin regenerated
3 = > 25 % regeneration
This same protocol was followed to assess tag condition and percent fin
regeneration at T1 (21 days post tagging), T2 (day 54), T3 (day 90), and T4 (day 146).
At day 146, all individuals were again measured for fork-length and weight as
well as observed for tag and fin condition. Once this information was recorded the
Atlantic salmon, now fully developed smolts, were freed into the Saint John River
system. The thermograph was recovered and the daily mean water temperatures were
used to calculate degree-days.
Statistical Analyses:
A comparison of initial mean fork-length for each treatment group was done by
one-way analysis of variance (ANOVA) and followed by Duncan’s multiple range test.
The same type of statistical test was used to compare the relative change in length of the
juvenile Atlantic salmon from the start to the end of the experiment for each fin clip
group. The specific growth rate of each individual was calculated after 146 days. The
mean specific growth rate (% • d-1) was compared for each treatment group by one-way
ANOVA. Initial (T0) condition factors as well as condition factors after 146 days (T4)

17
were calculated for each individual using the formula: Cf = [Weight / (Length)3] • 100
(Lundqvist et al. 1988). A one-way ANOVA was also used to compare the mean
condition factors of each treatment group at the start and the end of the study, and also
the difference in mean condition factor between T0 and T4 for each group.
A Chi-square test was used to test for differences between treatment groups in
respect to the amount of fin regeneration, for each time period. Differences in tag wound
condition were analyzed with a Chi-square test. The frequency of fish showing a
particular degree of tag wound healing versus time period was analyzed.
Field Study:
Study Site:
The Western Brook system (49o 44’ N, 57o 46’ W) has a catchment area of 171.2
km2. Western Brook Pond is an ultraoligotrophic fjord lake that has a mean depth of 72.5
m and a maximum depth of 165 m (Kerekes 1994). Stag Brook, located at the
southwestern end of the lake, is the largest tributary entering the lake and is the only
tributary accessible to anadromous salmon upstream of the lake. Western Brook Pond is
drained by Western Brook at its northwestern end. Western Brook flows for
approximately 9 km before emptying into the Gulf of St. Lawrence (Figure 2.1).

Figure 2.1: Map showing the marking sites and the recapture site set on the Western
Brook Pond river system in 2000.
Upstream Marking Site – Stag Brook:
Two fyke traps with 18 mm mesh size were set in Stag brook approximately 2 km
upstream of where the brook empties into Western Brook Pond on May 26, 2000
(Figure 2.1). The traps were fitted with wooden boxes at their cod ends. The smolt-
boxes were constructed of plywood and were 60 cm X 120 cm X 30 cm. A square funnel
(15 cm X 15 cm X 90 cm) was fitted through the front of the rectangular box and created
a passage from the fyke trap’s cod end into the box. The boxes were submerged by the
flow so that the top, which bore a door, was at the surface. Boxes reduced mortality by
creating an area less penetrable by outside predators, and more especially by acting as a
sanctuary from high velocities that can lead to fatigue and death for smolts crowded into
the cod end of a fyke trap. Smolts caught in the traps were anesthetized using a 40 ppm
18
19
clove oil bath (Anderson et al. 1997, Keene et al. 1998) and measured for fork-length and
weight.
Using a Panjet dental inoculator, a number of smolts were given 2 % Alcian Blue
tattoos (Hart & Pitcher 1969). The tattoos were applied to the ventral surface, just
anterior to the pelvic girdle. This location was picked due to its lack of pigmentation so
that the mark was easily discernible. The marks appeared as a blue dot on the white
belly.
The alternate mark was an individually numbered Carlin tag. The green plastic,
7 mm tags were attached just anterior of the dorsal fin with double polyethylene
monofilament thread.
All individuals were marked with an anal fin clip (AFC) to create a check on tag
or tattoo loss. Individuals that were marked were put in a 85 cm X 110 cm rectangular
wood and plastic screen live trap that was sunk and anchored close to the centre of a
flat/pool about 50 m downstream of the Stag Brook capture site. The trap was covered
with plywood for cover from predators and exposure to the sun. The marked smolts were
held for 24 hours to observe mortalities due to marking.
Downstream Recapture Site – Western Brook:
Four fyke traps were placed in the river on June 14, 2000. On June 21 a fifth
fyke trap was added to increase the volume of flow sampled. The fyke traps were
positioned approximately 440 m downstream from Western Brook Pond at a widening of
the river. Approximately 5 km were traveled by smolts marked in Stag Brook and
recaptured at the drainage of Western Brook Pond (Figure 2.1). Water velocities were

20
taken at this site on July 15 to ascertain the percent discharge sampled by the fyke trap
sampling regime at this site. A 6th fyke trap was set approximately 300 m upstream from
the main recapture site on Western Brook. Smolts were captured and marked there for the
assessment of trap efficiency at the recapture site 300 m downstream (Figure 2.1).
Efficiency trap recaptures were anesthetized with 40 ppm clove oil (Anderson et al. 1997,
Keene et al. 1998) and re-measured for length and weight.
Statistical Analyses:
The mean fork-length (cm) of Panjet tattooed and Carlin tagged smolts that were
held for 24 hrs was compared by student t-test. The same test was used to analyze
differences in fork-length (cm) of tattooed versus tagged smolts that were recaptured at
Western Brook. Chi-square analysis was used to compare the frequency of individuals
that were recaptured at Western Brook for each of the two mark types administered in
Stag Brook.

21
Results:
Hatchery Study:
Mortalities due to Tagging:
All fish that were anesthetized, handled, and tagged (n = 112) recovered and
survived for the duration of the experiment (146 days).
Fork-Length and Condition Factors:
The Duncan’s multiple-range test indicated that the mean fork-length of salmon
pre-smolts at the beginning of the experiment (T0) was significantly different among
treatment groups. The mean fork-length of the lower caudal fin clip (LCFC) and control
(CONT) treatment groups were significantly greater than for the anal fin clip (AFC)
treatment group P < 0.05](Table 2.1).
Table 2.1: Mean fork-length (cm) at the initiation (T0), termination (T4) of the marking
experiment and the specific growth rate (% • day-1) calculated at the end of the
experiment (146 days) for each treatment group.
Length at T0 Length at T4 Specific Growth Rate Group N (cm) (cm) (% • day-1) CONT 28 17.6 ± 1.3 19.4 ± 1.3 0.67 ± 0.02 LCFC 28 17.9 ± 1.3 19.6 ± 1.3 0.69 ± 0.02 LPFC 28 16.9 ± 1.9 18.5 ± 2.1 0.68 ± 0.02 AFC 28 17.3 ± 1.2 18.9 ± 1.2 0.69 ± 0.02
UCFC 28 17.5 ± 1.2 19.1 ± 1.0 0.69 ± 0.02

The specific growth rate was not significantly different between treatment groups
(P > 0.05). All treatment groups showed a similar percent increase in length
(approximately 0.7 % • day-1) during the experiment (Table 2.1).
Figure 2.2 shows the mean condition factors by treatment group at the start (T0)
and end (T4) of the experiment. Although slight differences were observed among
treatment groups within one period, there was no statistical significance at either T0 or T4
(P > 0.05). Furthermore, the mean difference in condition factor between the initiation
and termination of the experiment (Cf at T0 – Cf at T4) was not significant among
treatment groups (P > 0.05)(Figure 2.3).
0.00
0.20
0.40
0.60
0.80
1.00
1.20
1.40
1.60
LCFC UCFC LPFC AFC CONT LCFC UCFC LPFC AFC CONT
Treatment Group
Mea
n co
nditi
on fa
ctor
T4T0
Figure 2.2: Mean condition factor (+ 1 SD) for each treatment group at the initiation (T0)
and termination (T4) of the marking experiment.
22
0.00
0.05
0.10
0.15
0.20
0.25
0.30
0.35
LCFC UCFC LPFC AFC CONT
Treatment Group
Diff
eren
ce in
Mea
n C
ondt
ion
Fact
or
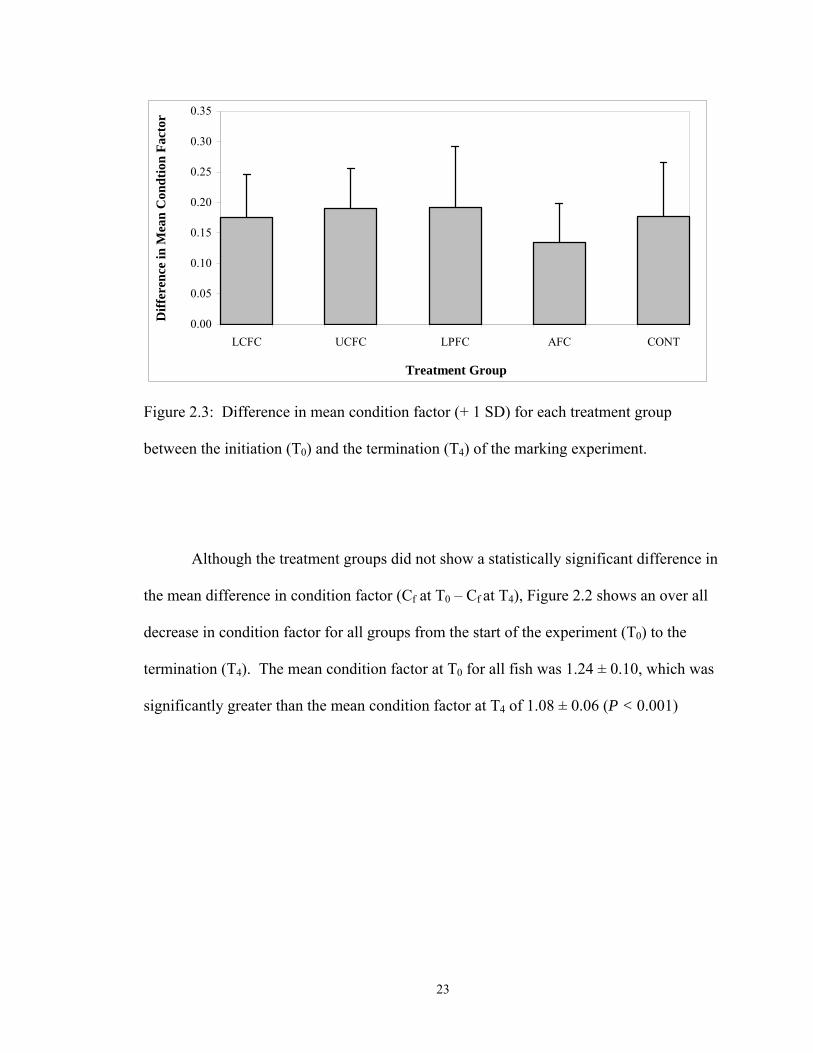
Figure 2.3: Difference in mean condition factor (+ 1 SD) for each treatment group
between the initiation (T0) and the termination (T4) of the marking experiment.
Although the treatment groups did not show a statistically significant difference in
the mean difference in condition factor (Cf at T0 – Cf at T4), Figure 2.2 shows an over all
decrease in condition factor for all groups from the start of the experiment (T0) to the
termination (T4). The mean condition factor at T0 for all fish was 1.24 ± 0.10, which was
significantly greater than the mean condition factor at T4 of 1.08 ± 0.06 (P < 0.001)
23

Tag Condition:
Chi-square analysis showed a significant difference in the frequency of juvenile
Atlantic salmon with a particular degree of tag wound healing over time.
After 21 days (T1), the majority (61.6 %) of juvenile Atlantic salmon showed
partial healing of their Carlin tag wounds. A smaller percentage (24 %) of individuals
showed almost total healing of their tag wounds. A small percentage (13.4 %) had
wounds that appeared more irritated than when initially caused through tagging (Figure
2.4). These fish most often displayed wounds that were chaffed by rubbing of the
monofilament line on the body, or inflammation of the needle puncture wounds.
0
10
20
30
40
50
60
70
T1 (21 days) T2 (54 days) T3 (90 days) T4 (146 days)
Time period (days)
% o
f juv
enile
Atla
ntic
salm
on in
divi
dual
s
Partially healedTotally healedWorse or irritated
Figure 2.4: Percentage of juvenile Atlantic salmon individuals with partially healed,
totally healed, and worse or irritated Carlin tag wounds for each time period.
24

25
After 54 days (T2), many of the individuals that had showed partial to full healing
of tagging wounds at T1 now had wounds that were worse or irritated. Fish with worse or
irritated wounds accounted for 45.5 % of all tagged individuals. The percentage of
tagged juvenile Atlantic salmon showing full healing increased slightly from T1 to T2
(24 % to 28.6 %). The percentage of individuals with partial healing of tagging wound
decreased to 25.9 % after 54 days, down 35.7 % from T1 (Figure 2.4).
After 90 days (T3), 50 % of the Carlin tagged salmon had wounds that were worse
or irritated compared to when initially tagged. This number increased from T2 as the
number of juveniles showing total healing decreased by 5.4 % from T2 (28.6 % to 23.2
%). The number of salmon pre-smolts with partially healed tag wounds increased
slightly (from 25.9 % in T2 to 26.8 % in T3)(Figure 2.4).
After 146 days (T4) the majority (45.5 %) of Atlantic salmon juveniles had totally
healed tag wounds. The percentage of fish with worse or irritated wounds dropped by
11.6 % (from 50 % in T3 to 38.4 % in T4) and the percent of fish with partially healed
wounds dropped by 10.7 % (from 26.8 % in T3 to 16.1 % in T4) (Figure 2.4). These fish
with irritated or partially healed wounds in T3 experienced an increase in tag healing
during the 56 days between their inspection at T3 and the termination of the experiment.

26
Fin Regeneration:
Virtually no fin regeneration had occurred by day 54 (T2). Only two individuals in
the upper caudal fin clip group and two individuals in the lower caudal fin clip group
showed fin regeneration after 54 days. Fin regeneration was evident by day 90 (T3) in all
treatment groups (Table 2.2).
Table 2.2: Number of individuals showing partial fin regeneration for each
treatment group (n = 28 per group), for each time period.
Number of individuals Group % Regeneration T1 (day 21) T2 (day 54) T3 (day 90) T4 (day 146) LCFC 0 28 26 3 0
≤ 10 0 2 25 15 > 10 and ≤ 25 0 0 0 13
UCFC 0 28 26 1 1 ≤ 10 0 2 27 15
> 10 and ≤ 25 0 0 0 12
LPFC 0 28 28 0 1 ≤ 10 0 0 28 10
> 10 and ≤ 25 0 0 0 17
AFC 0 28 28 18 12 ≤ 10 0 0 10 14
> 10 and ≤ 25 0 0 0 2
The number of individuals showing ≤ 10 % fin regeneration was significantly
lower for the anal fin clipped group than all other groups (P < 0.001). Approximately
two-thirds of the anal fin clipped individuals continue to show no fin regeneration (Table
2.2).

27
By the end of the experiment (146 days), the anal fin clip group showed a
statistically significant difference in the number of individuals with a more advanced
degree of fin regeneration (P < 0.001). Only 2 individuals (7 %) show > 10 and ≤ 25 %
regeneration and 50 % (14 individuals) show ≤ 10 % regeneration. However, a large
proportion (43 %) of individuals in the anal fin clip treatment group showed no fin
regeneration (Table 2.2), more so than any other group.
The upper and lower caudal fin clip groups showed approximately 45 % of
individuals with > 10 and ≤ 25 % fin regeneration. The group with the greatest degree of
fin regeneration was the left pelvic fin clip group. 17 of 28 juvenile salmon showed close
to 25 % fin regeneration by the end of the experiment (Table 2.2).
Temperature Regime:
The daily mean water temperature in the holding tank decreased from T1 to the
end of T3. The daily mean temperature reached its low (0.6 oC) during T4 (March 2 – 8),
after which it increased at a relatively rapid rate for the remainder of this time period
(Figure 2.5).

0.00.51.01.5
2.02.53.03.54.04.5
5.05.56.0
19-Nov
29-Nov
09-Dec
19-Dec
29-Dec
08-Jan
18-Jan
28-Jan
07-Feb
17-Feb
27-Feb
08-Mar
18-Mar
28-Mar
07-Apr
17-Apr
Date
Dai
ly M
ean
Tem
pera
ture
(o C)
T1 T2 T3 T4
(100.2 degree-days)
(64.7 degree-days)
(61.9degree-days)
(109.9degree-days)
Figure 2.5: Fluctuations in daily mean water temperature and the number of degree-days
during each time period for the duration of the marking experiment (336.7 degree-days).
As the daily mean temperature, and therefore degree-days, increased during T3
and T4 the number of juvenile Atlantic salmon with >10 % fin regeneration also
increased. The greatest number of individuals with >10 % fin regeneration was observed
at T4 during which temperatures significantly increased compared to the previous time
periods
28
As the daily mean temperature decreased during T1, the partial healing of tag
wounds was high. However, as lower water temperatures persisted over T2 and T3 an
increase in individuals with wounds that were worse or irritated, and a reduction in the
number of partially or totally healed wounds occurred. As the temperature increased
during T4, the number of fish with irritated wounds decreased and those with totally
healed wound increased (Figures 2.4, 2.5).

29
ield Study:
urvival of Marking Treatment Groups:
lantic salmon smolts were marked with Panjet or Carlin tag at Stag Brook
of tag applied at the main marking site in
s
S. Carlin Tagged Recapture Success:
Before describing the mark-recapture data, it would be prudent to discuss the
nts were taken at the Western
om
rook
capture site (12 %).
F
S
352 At
and held for 24 hr. As stated earlier, the type
Stag Brook was random. The size of fish was not a deciding factor on the type of mark
used. The mean fork-length of smolts marked with Carlin tags and held for 24 hrs was
12.7 ± 1.4 cm, while the mean fork-length of tattooed smolts was significantly smaller (P
< 0.05) at 12.0 ± 1.2 cm. The total number of mortalities after handling and marking wa
9 smolts (2.6 %). The number of smolts that were marked with Carlin tags was 167; 6
(3.6 %) of these died, all before being placed in the live trap. The number of smolts
marked with Panjet tattoo was 185; 3 (1.6 %) of these died, all after spending some time
in the live trap.
Panjet tattooed V
efficiency of recapture at the trap site. Velocity measureme
Brook Pond recapture site on July 15. The total instantaneous discharge calculated fr
these measurements was 7.48 m3/s. The five traps in the brook at this site sampled
4.31 m3/s for 57.6 % of the discharge sampled by the nets. Of the 33 smolts marked at
the efficiency fyke trap, only 4 were recaptured 300 m downstream at the Western B

30
e Panjet tattoos, 11 were recaptured at the Western Brook Pond
ecaptu n
All of the juvenile Atlantic salmon that were tagged in the hatchery survived the
gging procedure and went on to survive and retain their tags for the duration of the
ndicating that the technique of Carlin tagging can be successful in terms of
tag rete
is
hort-
term in
e classified as parr. However, as the
experiment progressed the fish assumed smolt characteristics such as darkening of fins
In total, 469 migrating Atlantic salmon smolts were caught and marked in Stag
Brook. The total number of recaptures was 28, giving an overall recapture rate of 6.0 %.
Of the 182 smolts giv n
r re site for a recapture percentage of 6.0 %. 17 of the 287 individuals given Carli
tags were recovered for a recapture percentage of 5.9 %.
Discussion:
ta
experiment, i
ntion and the survival of those marked in hatchery conditions. The lack of a
significant difference between treatment groups in terms of increased fork-length in th
study corroborated previous evidence that indicated that Carling tagging and fin-clipping
have a small effect on growth (Mills 1958, Armstrong 1947, and Cobble 1967).
The rate of survival for the first 24 hrs after marking was high (96.4 %) for wild
Atlantic salmon smolts of the Western Brook system. Such a survival rate indicates that
Carlin tagging, if executed by experienced markers, can be as successful on the s
the field as in the hatchery environment.
The reduction in mean condition factor observed from the start of the hatchery
experiment to the end was likely due to the smoltification of the juveniles and not an
effect of marking. Initially, the salmon tagged wer

31
and bod 0
l.
,
ion, and the left pelvic fin clip treatment group
showed ation
. This
s.
y silvering (Wedemeyer et al. 1980). Condition factors ranging from 1.20 to 1.4
are expected for hatchery-reared parr/pre-smolts (Saunders et al. 1998, Handeland et a
2001). The mean condition factor of the parr used in this study was 1.24 ± 0.10 which is
well within the range described by previous studies. Atlantic salmon smolts may have
condition factors < 1.00 and as great as 1.25. The reduction in condition factor in
Atlantic salmon juveniles is accompanied by an increase in Na+-K+ ATPase activity, and
as a result is considered a good indication of smoltification (Saunders et al. 1998, Specker
et al. 2000, Handeland et al. 2001).
The fin regeneration data suggest that fin regeneration is slow in cold water
which was expected. Regeneration was directed towards fins that were used for
propulsion and stability in swimming. Both the upper and lower caudal fin clip groups
showed the earliest signs of regenerat
the greatest percent of individuals (60.7 %) with >10 and ≤ 25 % fin regener
at T4. The anal fin clip treatment group showed significantly less fin regeneration
fin is of less functional importance as it does not supply stability or propulsive force
(Webb 1975). Therefore, the anal fin appears to be most suitable for clipping purpose
This does not agree with findings by Johnsen & Ugedal (1988) who concluded that anal
fin clips were not good for long-term studies with brown trout (Salmo trutta L.) due to
faster regeneration of anal fins compared to various other clipped fins.
The adipose fin of salmonids has been shown to regenerate slower than other fins and
therefore provides a desirable method of marking (Johnsen & Ugedal 1988, Stuart 1958).
Adipose clips were not used in the field during this study in an effort to reduce the

32
low
Brook
ere
healing
This is
hat friction between tag and tank, or
more im
Carlin tagged wild smolts died soon after tagging. Hansen (1988) concluded
that mo ality associated with Carlin tagged smolts released for subsequent recapture was
due to the handling and anesthetizing associated with marking. The findings of this study
probability of misidentifying marked individuals. The hatchery experiment did not
include an adipose fin clipped treatment group since this mark was not used in the field.
The duration of the hatchery experiment was 146 days and a total of 336.7
degree-days. The low temperatures in the hatchery over the winter likely created a s
growth period. On the Western Brook Pond river system smolts were marked at Stag
between May 23 and May 27 (1998-2000). Recapture efforts on the system
terminated on July 31 in each year. The mean number of days that could have elapsed
between marking and the termination of recapture sampling was 68 days. The mean
number of degree-days for this time is 937. Approximately 600 more degree-days w
experienced in the wild during sampling compared to the duration of the hatchery
experiment. However, it seems unlikely that in the Western Brook system fin
regeneration would occur at a rate fast enough to make marked individuals
unrecognizable over the 2 month field season.
During T0 – T1 tag wound healing began for most individuals, as partial
was diagnosed for many. However, as time progressed, irritation increased.
likely due to an increase in the duration of time t
portantly the monofilament and the external body surface of the fish, was
endured.
All
rt

33
agree, h
he
r et al. (1990) and Laufle et al. (1990) recommended that ink-jet
tattoos
ed
0
s
ns in the handling,
anesthe
r a 24 hr
capture success
indicate than
owever the mortality rate of Carling tagged individuals after one day was not
directly assessed.
Three Panjet tattooed smolts died during some point in the 24 hr holding period
(98.4 % rate of survival). No individual marked this way died before being placed in t
live trap. Herbinge
be applied to the base of pectoral and pelvic fins only on fish with fork-lengths
longer than 100 mm. Cases of piercing the ventral surface of smaller juvenile Atlantic
salmon were described by Dussault et al. (1997). Although Panjet tattoos were appli
on the ventral surface of the smolts in this study, most fish marked were greater than 10
mm in fork-length and no piercing was observed. The white “bellies” of the smolts
created good visual relief for the Alcian Blue tattoos. Ink tattoos placed on fins of smolt
may be difficult to see since during smoltification the fins of juvenile Atlantic salmon
may become quite darkened (Wedemeyer et al. 1980).
No significant difference in initial (24 hr) mortality was found between Atlantic
salmon smolts marked by Carlin tag or Panjet tattoo in the field. The stress associated
with Panjet tattooing smolts is likely less due to reductio
tization, and marking times compared to Carlin tagging.
The success of recapture for both Carlin tagged and Panjet tattooed smolts
provided a means to compare the survival of smolts with each mark type afte
holding period in the wild. The lack of significant difference in re
s that survival of smolts marked by Panjet tattoo is not significantly greater
that of Carlin tagged individuals. Therefore, Carlin tagging does not seem inferior as a
marking technique to dye injection on the short-term in the field. However, Carlin

34
lmon
iving
of marks
onclusions:
Carlin tagging presented a relatively low threat of initial mortality both in
atchery conditions and in the wild. Short-term survival (5 months) of Carlin tagged
tagging with individually numbered tags allows for the accumulation of data on
individuals smolts. This advantage was important in the research carried out on the
Western Brook river system when the individual migratory behaviour of Atlantic sa
smolts was observed (Chapter 3). Individuals can be identified using tattoos by g
each smolt a unique tattoo configuration. However, this is tedious and requires
substantial planning. Dussault et al. (1997) reported as much as a 11 % loss of dye
injected marks after four weeks and an increase in mortality with an increase in the
number of marks applied. Over two months (the duration of this study) the loss
would result in the significant loss of data pertaining to individual smolts.
C
h

35
% in the hatchery, and was likely similar to that of Panjet tattooed smolts
in the w
ng
marked
in
eferences:
rmstrong, G. C. 1947. Mortality, rate of growth and fin regeneration of marked and unmarked lake trout fingerlings at the provincial hatchery, Port Arthur, Ontario. Transactions of the American Fisheries Society 77:129 – 131.
smolts was 100
ild, as represented by similar recapture success for the two mark types.
Tagged hatchery individuals showed no tag loss and do not seem to suffer any
reductions in growth or condition factor compared to non-tagged salmon juveniles. The
type of fin clip does not affect growth or condition factor. However, for monitori
individuals past 340 degree-days, anal fin clipped juvenile Atlantic salmon may
be more successfully (or with less subjectivity) classified as marked due to a slower rate
of fin regeneration compared to other fins. The results of this study indicate that Carl
tagging is a suitable technique for marking juvenile Atlantic salmon both in the hatchery
environment and in the wild, and just as successful as dye injection.
R
A

36
W. , R. S. McKinley, and M. Colavecchia. 1997. The use of clove oil as an anesthetic for rainbow trout and its effects on swimming performance.
Becerra 3. Structure of the
il fin in teleosts. Cell and Tissue Research 230, 127 – 137.
of fin ral study.
Archives of Histology and Cytology 59, 15 – 35.
Bergero Pech., uebec, 3(3): 25 – 26.
Carlin, 4.
perch with stigations. Journal of Wildlife Management,
1: 173 – 180.
oomb s. 1990. Evaluation of various external marking techniques for Atlantic salmon. In: Parker et al. (eds.)
Dussault, C., and M.A. Rodríguez. 1997. Field trials of marking stream salmonids by dye jection and coded-wire-tagging. North American Journal of Fisheries
Handel ody ze on off-season parr-smolt transformation and post-smolt growth. Aquaculture
ansen Downstream migration of hatchery-reared smolts of Atlantic salmon (Salmo salar L.) in the River Imsa, Norway. Aquaculture 45:
ansen cts of Carlin tagging and fin clipping on survival of Atlantic salmon (Salmo salar L.) released as smolts. Aquaculture, 70: 391 – 394.
Hart, Pish Biology 1: 383 – 385.
veral fin cations. Journal of Fish Biology 36: 99 – 101.
Anderson, G.
North American Journal of Fisheries Management 17: 301 – 307.
, J., G. S. Montes, S. R. R. Bexiga, and L. C. U. Junqueira. 198ta
Becerra, J., L. C. U. Junqueira, I. J. Bechara, and G. S. Montes. 1986. Regenerationrays in teleosts: a histochemical, radioautographic, and ultrastructu
n, J. 1959. Etiquetage du Saumon. Actualites Marines. Dept.Q B. 1955. Tagging of salmon smolts in the River Lagan. Inst. Freshwater Res.,Drottningholm, Ann. Rept. 1954, No. 36. p. 57 – 7
Coble, D. W. 1967. Effects of fin-clipping on mortality and growth of yellowa review of similar inve3
C s, K. A., J. K. Baile, C. M. Herbinger, and G. W. Friar
Fish-marking techniques, American Fisheries Society Symposium 7:9 – 29.
in Management 17: 451 – 456.
and, S. O., and S. O. Stefansson. 2001. Photoperiod control and influence of bsi
192: 291 – 307. H , L. P., and B. Jonsson. 1985.
237 – 248. H , L. P. 1988. Effe
. J. B. and T. J. Pitcher. 1969. Field trials of fish marking using a jet inoculator. Journal of F
Herbinger, C. M., G. F. Newkirk, and S.T. Lanes. 1990. Individual marking of Atlanticsalmon: evaluation of cold branding and jet injection of Alcian Blue in selo

37
Isaksso luation of two tagging methods and rvival rates of different age and treatment groups of hatchery reared Atlantic
kinds of fin-clipping on over- inter survival and growth of fingerling brown trout Salmo trutta L., stocked in
311.
Keene, of clove oil as an anaesthetic for rainbow trout Oncorhynchus mykiss (Walbaum).
Kelly, W f the American Fisheries society 96: 163 – 175.
Kenned corbo Irish river. Aquaculture and Fisheries
Management 19: 159 – 170.
1. Evaluation of Carlin tagging as a mark-recapture technique for estimating total river runs of salmon smolts,
ohansson, 1988. The influence of precocious sexual maturation on survival to adulthood of river stocked Baltic salmon, Salmo salar,
Laufle, r batch-
entification of fish. Pages 38 – 41 in N. C. Parker and five coeditors. Fish-
cFarlane, G. A., R. S. Wydowski, and E. D. Prince. 1990. Historical review of the
Mills, D. H. 1958. Salmon tagging experiments in Invergarry salmon hatchery. Rappt. roces Verbaux Reunions Conseil Exploration Mer, 148: 8 – 10.
Phinne ids ies Society 96: 57 – 162.
Pitcher n marks made ith a jet inoculator. Fisheries Management 8: 16 – 18.
n, A. and P. K. Bergman. 1978. An evasusalmon smolts. Journal of Agricultural Research in Iceland, 10: 74 – 99.
Johnsen, B. O., and Unegal O. 1988. Effects of different
wsmall streams in Norway. Aquaculture and Fisheries Management 19: 305 – J. L., D. L. G. Noakes, R. D. Moccia, and C. G. Soto. 1998. The efficacy
Aquaculture Research 29: 89 – 101.
. H. 1967. Marking freshwater and marine fish by injecting dyes. Transactions o
y, G. J. A., and J. E. Greer. 1988. Predation by cormorants, PhalacrocoraxL., on the salmonid populations of an
Kennedy, G. J. A., C. D. Strange, and P. M. Johnston. 199
Salmo salar L. Aquaculture and Fisheries Management 22: 363 – 368.
Lundqvist, H., W. C. Clarke and H. J smolts, Holarctic Ecology 11: 60-69.
J. C., L. Johnson, and C. L. Monk. 1990. Tattoo-ink marking method foidmarking techniques. American Fisheries Society Symposium 7, Bethesda, Maryland.
Mdevelopment of external tags and marks. In: Parker et al. (eds.) Fish-marking techniques, American Fisheries Society Symposium 7:9 – 29.
P y, D. E., D. M. Miller, and M. L. Dahlberg. 1967. Mass-marking young salmonwith fluorescent pigment. Transactions of the American Fisher1
, T. J., and G. J. A. Kennedy. 1977. The longevity and quality of fiw

38
al of Atlantic salmon between smolt and adult stages.Journal of
Fisheries Research Board of Canada, Vol. 24(12): 2595 – 2611.
elopment in growth ormone transgenic Atlantic salmon. Aquaculture 168: 177 – 193.
Specke mation
orrelates of change in rheotactic behaviour. Canadian Journal of Zoology, Vol.
tuart, T. A. 1958. Marking and regeneration of fins. Freshwater Salm. Fish. Res.,
Thedig n. Transactions of the American Fisheries Society 124: 782 – 785.
Webb, P. W. 1975. Hydrodynamics and energetics of fish propulsion. Ottawa: Department of the Environment, Fisheries and Marine Services. p. 33-47, 90-91.
edemoltification and early marine survival of anadromous salmon.
Marine Fisheries Review 42(6): 1-4.
and D. L. Johnson (eds.) Fisheries techniques, American Fisheries Society.
Chapter 3 – Migratory behaviour of Atlantic salmon (Salmo salar L.)
smolts in a Newfoundland fjord lake
Saunders, R. L. and Allen, K. R. 1967. Effects of tagging and fin-clipping on the surviv
and growth
Saunders, R. L., G. L. Fletcher, and C. L. Hew. 1998. Smolt dev
h
r, J. L., J. G. Eales, M. Tagawa, and W. A. Tyler. 2000. Parr-smolt transforin Atlantic salmon: thyroid hormone deiodination in liver and brain and endocrine c78(5): 696 – 705.
S22: 1 – 4.
a, J. F., and S. W. Johnson. 1995. Retention of jet-injected marks on juvenile cohoand sockeye salmo
W eyer, G. A., R. L. Saunders, and W. C. Clarke, 1980. Environmental factors
affecting sm
Wydowski, R., and L. Emery. 1983. Tagging and Marking (chapter 11). In: Nielsen, L.A.

39
Abstract:
Spring and summer migratory patterns of Atlantic salmon smolts through a fjord
ke in the Western Brook system, Newfoundland, were studied over three years using
ture experiments. It was hypothesized that the change in physical conditions
encoun
all
ed
tlantic
almon smolts were based on the amount of fluvial habitat available for the rearing of
la
mark-recap
tered by smolts upon entering the lake, from the nursery (inlet) stream (Stag
Brook), would delay migration. Differences of up to 8 οC between the stream and the
lake were observed during the period of peak migratory activity. The peak in migration
was 3- 4 weeks later for smolts exiting the lake than those leaving the inlet stream. In
three years, smolts exiting the lake were significantly larger and appeared more advanc
in smoltification (i.e., silver, darker fins, loss of parr marks) than smolts entering the lake
from the nursery stream. Age analysis indicated the modal age of smolts captured in both
locations was 3 years with a slightly higher percentage of age 4 smolts captured exiting
the fiord lake. Smolts marked in Stag Brook were recaptured in the outlet stream in the
same year, thereby proving the successful navigation of the fjord lake by smolts. A delay
in migration of 3 weeks on average was found for these smolts. However, variability in
time spent navigating the lake suggested the differences were individual-based rather
than a function of group responses (i.e., schooling behavior). Scale analyses indicated an
increased growth rate (0.35 mm • day-1) during movement through the pond.
Introduction:
In the past, estimations of the potential for a river system to produce A
s

40
arr rearing habitat was described as riffles, runs, and pools where cobble,
rubble,
ts (Birt
Cunjak et al. 1989, 1990). Parr that moved into the estuary remained there,
ften fo
upstream to access lacustrine habitats (Erkinaro
tant
tlantic
parr
parr. Typical p
boulders and bedrock substrates dominate (Allen 1969). However, Huntsman
(1945) described rearing of Atlantic salmon parr in the slower flow portions of a river
system. Parr were observed to populate both lakes and fresh or brackish parts of
estuaries.
More recent studies have shown that Atlantic salmon parr may accompany, or
precede, the downstream migration of smolts from a river to estuarine environmen
et al. 1990;
o r the duration of the summer months. Larger parr smoltified and continued to
sea, while smaller parr moved back to the fluvial environment. However, parr that did
reside in the estuary showed increased growth rates compared with parr that remained in
fresh water (Cunjak et al. 1989, 1990).
Lakes and steadies have also been shown to be important rearing habitat for
juvenile Atlantic salmon (Chadwick and Green 1985; Pepper 1976). Parr have been
observed migrating both downstream and
and Gibson 1997; Erkinaro et al. 1998a; Erkinaro et al. 1998b; Hutchings 1986).
Residence in lakes resulted in increased growth rates for parr and also provided impor
overwintering habitat (Hutchings 1986; O’Connell et al. 1989; Erkinaro and Gibson
1997). Consequently, lacustrine habitat is considered important in the rearing of A
salmon parr and in the production of smolts (Hutchings 1986; Pepper 1976, 1985).
Parr undergo various behavioural and physiological changes to facilitate their
seaward emigration. Parr abandon a territorial behaviour for one of schooling as a smolt
(Kallberg 1958; Thorpe and Morgan 1978; Wedemeyer et al 1980). Atlantic salmon

41
that mi
e
orpe et al. 1981; Thorpe
1984; T nal
nt
rface
ch
eeds
grate into lakes likely smoltify there and then move to the sea (Hutchings 1986).
Smolts produced in a lacustrine environment are often larger than those produced in the
river environment (Erkinaro and Gibson 1997) and may therefore realize a survival
advantage at sea (Lundqvist et al. 1988). River-produced smolts that have not
experienced the characteristics of a lentic environment may have a different response
than smolts produced in a lake. What are the effects of encountering a deep, cool lak
environment during smolt migration in a natural situation?
Previous studies have concluded that the movement of wild Atlantic salmon
through lakes is by means of passive displacement, and directed active migration is not
significant (Hansen et al. 1984; Thorpe and Morgan 1978; Th
ytler et al. 1978). Thorpe et al. (1981) found surface flow along the longitudi
axis of Loch Tummel, Scotland (maximum depth of 45 m) to be influenced by the curre
speeds from inlet to outlet. It was only slowed by winds in the opposite direction,
however, a hydroelectric generating station at the outlet also influenced water movement.
In Loch Voil, Scotland, another lake studied by Thorpe et al. (1981), it was found that
smolt movement was significantly and positively correlated with the direction of su
water movements. A study by Berry (1933) (referenced by Thorpe et al. 1981) found that
winds blowing in the direction of the outlet influenced the number of smolts leaving Lo
Ness, Scotland. Therefore, in a situation of weak surface currents smolts may have
difficulty finding their way out of the lake and therefore delay migration. Hansen et al.
(1984) showed that smolt migration by both hatchery reared and wild smolts can be
delayed when released above lakes. This delay was attributed to the slow current sp
in the lakes studied.

42
olts
uestions was whether salmon smolts successfully migrate through
Red Ind
tion.
y
e
n
morpho
ts in
salmon migrating through such an ecosystem
offers a
Bourgeois and O’Connell (1988) studied the migration of Atlantic salmon sm
moving through the Exploits River, Newfoundland, using radiotelemetry and Carlin
tagging. One of their q
ian Lake, a large lake (180.4 km2) with a maximum depth of 146.3 m, when
transported to a location upstream of the lake. Approximately 1800 smolts captured
downstream of the lake were tagged and released upstream of Red Indian Lake.
Recaptured smolts successfully navigated the lake using some degree of active migra
Juvenile sockeye salmon (Oncorhynchus nerka (Walbaum)) are predominantl
reared in lakes and smolts of this species have been shown to exhibit directed activ
migration through large lakes (Brett et al. 1958; Johnson and Groot 1963; Groot 1965).
What are the consequences for Atlantic salmon smolts that begin smoltification i
wild fluvial conditions only to emigrate into a large lacustrine environment with
relatively colder temperatures? Temperature may affect the physiological and
logical status of a smolt. It has been suggested that warm water temperatures in
the winter may be detrimental to the subsequent survival of Atlantic salmon smol
colder sea water (Dickoff et al. 1989).
The present paper reports on the migration of wild Atlantic salmon juveniles from
an upstream fluvial environment through the cooler lentic environment of a fjord lake.
The observation of wild juvenile Atlantic
unique test of smolt migratory behaviour. It was hypothesized that the change in
physical conditions encountered by smolts upon entering the fjord lake, from the nursery
(inlet) stream, would delay migration. Specifically, it was predicted that: (1) smolts
emigrating out of the lake would be older and larger due to a delay in migration of one

43
The Western Brook system is located in Gros Morne National Park of
orthwestern Newfoundland (49o 44’ N, 57o 46’ W) and has a catchment area of 171.2
n Brook Pond is an ultraoligotrophic fjord lake that was separated from the
ocean a p igneous
e
f
lders (at higher
gradients). The estimated instantaneous discharge during average summer flows was
year, and (2) the rate of movement through the lake would be significantly reduced
relative to the movement in running water.
Study Site:
n
km2. Wester
fter the retreat of glacial ice and isostatic rebound (Kerekes 1994). Stee
rock faces that reach elevations of 600 m contain the narrow eastern end of the lake. Th
western end of the lake widens since relatively flat, low-lying lands surround it. The lake
has a surface area of 22.8 km2, a mean depth of 72.5 m, a maximum depth of 165 m, and
a turnover rate of > 15 years (Kerekes 1994). The lake receives drainage from more than
20 streams; all but one (Stag Brook) cascade off the steep cliffs of the fjord. The lake has
been described as extremely low in productivity, as demonstrated by a very high oxygen
concentration throughout the water column (Kerekes 1994). Wind action on the pond is
variable and often violent. During the months of May and June, the predominant winds
are southerly to southwesterly (Environment Canada, 1996). The pond has become a
world-renowned tourist destination due to its unparalleled natural beauty.
Stag Brook, located at the southwestern end of the lake (Figure 3.1) is the largest
tributary entering the lake. It is approximately 8 km in length, with an average width o
9 m. Stag Brook has a substrate consisting of gravel, cobble and large bou

44
.36 m
1 3/s. Stag Brook has been identified as an important spawning and nursery habitat
for Atlantic salmon and other salmonid species that inhabit the system (Ball 1991, Anions
1994).
Figure 3.1: Map showing the location of the Western Brook system including Stag
Brook, Western Brook Pond and Western Brook.
Western Brook Pond is drained by Western Brook at its northwestern end. Western
rook flows for approximately 9 km before emptying into the Gulf of St. Lawrence
d
B
(Figure 3.1). It has a mean width of 35 m and has substrate ranging from bedrock an

45
of
us (Wilson)), brook charr (Salvelinus fontinalis
Juvenile Atlantic salmon emigration was monitored using mark-recapture
xperiments during the spring and summer for three years, beginning in 1998 and ending
k:
On May 26 of 1998 a marking/tagging site was chosen in Stag Brook. This site
upstream of where it discharges into Western Brook Pond
boulders to gravel and cobble. Steadies along the length of this brook have substrate
sand and mud with scattered boulders.
Other fish species present in the Western Book Pond river system are threespine
stickleback (Gasterosteus aculeatus (Linnaeus)), American eel (Anguilla rostrata
(Lesuer)), alewife (Alosa pseudohareng
(Mitchill)), rainbow smelt (Osmerus mordax (Mitchill)), and Arctic charr (Salvelinus
alpinus (Linnaeus)).
Methods:
e
in 2000.
1998 (sampling year 1)
Stag Broo
was approximately 2 km
(Figure 3.2).

8
Figure 3.2: Maps showing location of sampling sites in Stag Brook, Weste
Pond and Western Brook (1998 – 2000).
46
199
9
199 2000rn Brook

47
A fyke trap with 18 mm mesh size was used to capture downstream migrating
fish. Two wings, each 2 m in length, extended for 85 - 95 % of the width of the brook.
All fyke traps were modified with smolt-boxes at their cod ends. The smolt-boxes were
constructed of plywood and were 60 cm X 120 cm X 30 cm. A square funnel (15 cm X
15 cm X 90 cm) was fitted through the front of the rectangular box and created a passage
from the fyke trap’s cod end into the box. The boxes were submerged by the flow so that
the top, which bore a door, was at the surface. Boxes reduced mortality by reducing
predation risk, but especially by acting as a flow refuge from fast currents that can cause
fatigue and death for smolts crowded into the cod end of a fyke trap.
Emigrating juvenile Atlantic salmon caught in the trap were anesthetized using
CO2 (ENO)®, and then identified for life stage and measured for fork-length (mm) and
weight (g). The life stage of an emigrant was based on the classification described by
Wedemeyer et al. (1980). Parr were classified as such when bearing distinct parr marks,
and the small red dots along the lateral line, no darkening of fins, and no signs of
silvering; smolts were classified as such only if they had darkening of fins, complete
body silvering and absence of parr marks. Scale samples were taken from all fish and
each juvenile ≥ 9 cm was marked with a caudal fin clip for the purpose of monitoring
movements of older parr through recapture. Water temperature was monitored daily with
a hand-held thermometer, and hourly by a thermistor placed in the stream. A water level
benchmark was also measured daily and recorded. Sampling at this site continued until
July 3 (Table 3.1).

48
Table 3.1: Table showing the start of sampling, the start, peak, and end of the smolt run,
the termination date of sampling, and the number of smolts and parr captured at
each site on the Western Brook system (1998 – 2000).
First Last End Total Start of Smolt Peak in Smolt Of Smolts
Year Site Sampling Caught Captures Caught Sampling Captured 1998 Stag Brook May-26 May-27 May 27, 31, Jun 5, 13 Jun-29 Jul-03 178
Western Brook Pond May-20 May-21 Jun-21, Jul-2,7 Jun-27 Jul-30 153 Western Brook May-20 May-22 Jun 12-13 Jun-29 Jul-03 181
1999 Stag Brook May-21 May-23 May 25-27, Jun-2 Jun-16 Jul-02 252 Western Brook Pond May-31 Jun-01 Jun 25-28 Jul-25 Aug-02 482
Western Brook Jun-03 Jun-03 Jun-25 Jul-30 Sep-08 1707
2000 Stag Brook May-26 May-28 Jun-1, 7, 18 Jun-30 Jul-27 470 Western Brook Pond Jun-14 Jun-17 Jul 3-7 Jul-28 Jul-28 916
Western Brook Pond:
The first downstream recapture site was established on May 20, 1998, in
Western Brook, approximately 60 m downstream from the outflow of Western Brook
Pond (Figure 3.2). A fyke trap with 18 mm mesh size and two 2 m wings sampled
approximately 7 % of the river width. All juveniles caught were subjected to the same
protocol as in Stag Brook to obtain measurements of fork-length and weight, and to
identify life stage. Each smolt caught was carefully checked for marks given in Stag
Brook. After handling, smolts were released approximately 50 m downstream of the
recapture site. Sampling extended until July 30 (Table 3.1).

49
Western Brook (mouth):
On May 20, 1998, a third capture site was established approximately 500 m
upstream from the mouth of Western Brook where it discharges into the Gulf of St.
Lawrence (Figure 3.2). One fyke trap (18 mm mesh and 2 m wings) was installed that
extended 15 - 25 % of the river width. Emigrants captured at this site were treated in the
same manner in which they were at the site near Western Brook Pond. Each smolt
caught was scrutinized for any caudal fin clip marks that would denote a fish from Stag
Brook. Sampling extended until July 3 (Table 3.1).
1999 (sampling year 2)
Stag Brook:
In 1999, a fyke trap with 18 mm mesh size and two 2 m wings was placed in Stag
Brook on May 21 in the same location as in 1998 (Figure 3.2). This trap was estimated to
cut off over 85 % of the flow at this site as low water conditions persisted over much of
the sampling period (May 21 – July 2)(Table 3.1). Protocol for temperature and water
level measurements followed that of 1998. Unlike the previous year, all emigrants with a
fork-length ≥ 9 cm were anesthetized using a 40 ppm clove oil bath (Anderson et al.
1997, Keene et al. 1998), and marked with 7 mm Carlin tags. Tagging procedures
followed that of Saunders (1968). The individually numbered tags were fastened with
polyethylene monofilament, just anterior of the dorsal fin. All individuals that were fitted
with a Carlin tag were also given an anal fin clip (AFC) as a check for tag retention in
downstream recaptured individuals. All individuals marked were also sampled for scales
from the left side of the body, dorsal to the lateral line and just posterior to the dorsal fin.

50
Tagged individuals were allowed to recover for 20 minutes before they were released into
Stag Brook approximately 50 m downstream of the capture site.
Western Brook Pond:
Between May 31 and June15, 1999, two fyke traps with 10 mm mesh size and
two 3.75 m wings were secured in Western Brook approximately 60 m downstream from
the outflow of Western Brook Pond, the same site as in 1998 (Figure 3.2). Due to high
water events at this site in the spring of 1999, difficulty was experienced in keeping these
traps intact. The sampling regime was changed on June 16 to two fyke traps with 1.5 m
wings and 18 mm mesh size set up side by side closer to the true left side of the river; a
single fyke trap with 3.75 m wings and 10 mm mesh size was used on the right side of the
river. This configuration was used until sampling terminated on August 2. Smolt-boxes
were again used to reduce smolt mortality. All emigrating smolts and pre-smolts that
were captured in these traps were sampled for scales and given left pelvic fin clips
(LPFC) to indicate they were marked at this site if later recaptured.
The two fyke traps, initially installed, spanned approximately 65 % of the river
width. The second net configuration spanned 50 % of the river width. Water velocities
were measured on July 15, approximately 5 m upstream from the nets, to estimate the
river discharge during the period of summer low flow. Water depth and velocity were
measured every meter along a single transect of river width. Water temperature was
monitored both daily with a thermometer and hourly by a thermistor placed in the water
column.

51
Western Brook:
A fish counting fence with both an adult upstream trap and a downstream smolt
trap similar to that described by Anderson and McDonald (1978) was constructed at the
head of tide on Western Brook (Figure 3.2). The fence and adult trap consisted of
aluminum conduit spaced 6 mm apart. The smolt trap was constructed for the recapture
of emigrants marked upriver at Western Brook Pond or Stag Brook. It was a wood trap
with screen panels (< 1 cm mesh). The smolt trap was operational from June 3 -
September 8,1999 (Table 3.1). Water temperature was monitored both daily with a
thermometer and hourly by a thermistor placed in the water column. A group of
individuals were marked approximately 500 m upstream of the fence to test its efficiency.
2000 (sampling year 3)
Stag Brook:
A fyke trap with 18 mm mesh size and 2 m wings was set in the brook on May 26
in the same location as in the previous two field seasons (Figure 3.2, Table 3.1). A
second fyke trap of the same size was then added at this site on May 30 due to higher
water levels than in the previous two years. Velocities were measured on May 31 to
ascertain percent discharge sampled by the two traps. Temperature and water level were
measured using the same protocol as in 1998 and 1999. As in the previous two field
seasons, all juvenile salmon ≥ 9 cm caught migrating in a downstream direction were
marked. All individuals were marked with an anal fin clip (AFC). In addition,
approximately half of the emigrants were given a 2 % Alcian blue panjet tattoo; the other
half was given 8 mm Carlin tags. The position of tattoo administration was ventral and

52
just anterior to the pelvic girdle. This location was picked due to the lack of
pigmentation and the subsequent ease of identifying recaptures with a blue dot on a white
belly. Individually numbered Carlin tags were fitted just anterior of the dorsal fin. This
type of mark was administered following the same procedures as outlined for the 1999
captures at this site. The type of mark (Carlin tag vs. panjet tattoo) given to an individual
was random. At each trap-check half the fish were given one mark and half the other.
Initial survival and rate of recapture for the Carlin tag and panjet tattoo mark were
compared (See Chapter 2). All captured individuals had scales taken for analysis.
All individuals that were marked were put in a 85 cm X 110 cm rectangular wood
framed, plastic screened (12 mm mesh), live-trap anchored close to the centre of a
flat/pool about 50 m downstream of the Stag Brook capture site. The trap was covered
with plywood for cover from predators and sun. The marked individuals were held for 24
hours to observe mortalities that may be due to marking. Sub-samples of smolts and parr
were also marked approximately 500 m upstream of the capture site in Stag Brook to
assess the capture efficiency of that site. Sampling terminated on July 27 at this site in
2000 (Table 3.1).
Western Brook Pond:
A number of high water events near the end of May in 2000 made it unsafe to
work in Western Brook until June. Four fyke traps were placed in the river on June 14.
On June 21 a fifth fyke trap was added. The location of these nets was different from that
of the previous two years. The fyke traps were positioned approximately 65 m upstream
of Long Steady, and about 330 m downstream from Western Brook Pond (Figure 3.2).

53
The fyke traps had 18 mm mesh size and were positioned to sample both sides and the
middle of the river. Water velocities and depths were taken at this site on July 15 to
estimate discharge and ascertain the percent of stream flow sampled by the fyke traps at
this site.
Emigrants at this site were checked carefully for any marks from Stag Brook in
2000 or from previous years. Recaptures were anesthetized with a 40 ppm clove oil bath
(Anderson et al. 1997, Keene et al. 1998), re-measured for length and weight, and scale
samples were taken for a second time. On a daily basis, a sub sample of ten unmarked
smolts were randomly selected and anesthetized with 40 ppm clove oil bath, and
measured for length, weighed and sampled for scales. All captures at this site were then
released downstream into Long Steady (Figure 3.2). Sampling terminated on July 28 at
this site in 2000 (Table 3.1).
Temperature and relative water height were recorded through the duration of the
sampling period at this site.
Western Brook:
Due to the scarcity of recaptures at this site in 1999 it was decided that the focus
of the study be the migration of Atlantic salmon smolts from Stag Brook through Western
Brook Pond. As a result, the time and energy needed to operate a downstream smolt-
counting fence was diverted into increased fishing effort at Western Brook Pond
(Figure 3.2).

54
Temperature Regimes:
The temperature regime of Stag Brook, Western Brook Pond and Western Brook
at Long Steady was logged using thermistors to relate movement patterns with
temperatures encountered by downstream migrating salmon smolts. Temperatures were
recorded at two locations in Western Brook Pond. The first location was situated near the
mouth of Stag Brook in approximately 8 m of water. The thermistor was suspended
approximately 4 m from the substrate. This setup was duplicated at a site near the
outflow of Western Brook Pond (Figure 3.2). This was done to record the temperatures
that may be encountered by emigrants as they reach the lake and pass through it back into
a riverine environment.
Aging of Scale Samples:
All scales samples collected from all three sites and all years were later mounted
on glass slides and examined using a microfiche viewer. Aging was carried out using the
protocol and nomenclature set out by the International Council for the Exploration of the
Sea (ICES) in their Report of the Atlantic Salmon Scale Reading Workshop (1984). A
sub-sample of scale samples was re-aged, and then sent to a second identifier at the
Department of Fisheries and Oceans, Moncton, NB. No discrepancies were found with
respect to age designation for scale samples. Scales were examined using a Canon®
360T microfiche reader with a 1:2.8 magnification. The percent of captured smolts of
each age class was calculated for each site for all three years. Scales were closely
examined for the presence of “plus” growth (thick circuli created by increased growth
rates typically associated with spring/summer). Calculation of the percentage of

55
individuals showing plus growth during each half of the smolt run, at each site sampled
for each year was also done. The incidence of “plus” growth was especially examined
for those scale samples from recaptured individuals. Year 2000 scale samples from
recaptured individuals were measured for length from focus to scale margin along the
360o axis and from the first edge of plus growth circulus of the current year to the tip
margin of the scale. These measurements were taken for calculation of a plus growth to
scale length ratio (L+ : L tot) to compare the relative increase in growth for an individual
at its time of capture and marking and at its time of recapture having traversed the lake.
The widths of individual plus growth ciculi were also calculated from these
measurements. These measurements were then repeated on the matching scale samples
for the same individual at its time of marking in Stag Brook.
Statistical Analyses:
Mean fork-length of captured smolts was compared between sites for each year
using one-way ANOVA. Condition factors (Cf) were calculated using the formula:
Cf = (weight / (length)3) • 100 (Lundqvist et al. 1988). A one-way ANOVA was used to
compare mean condition factor of captured smolts between sites for 1999 and 2000.
One-way ANOVA was used to compare mean water temperature at each site (from May
26 – July 27) and between years for individual sites.
Recaptured smolts marked in Stag Brook allowed for a calculation of migration
speed (km • day-1). Regression analysis was used to test if there was a linear relationship

56
between the date a smolt was marked in Stag Brook and lake residence time or migratory
speed.
Student’s t-test was used to compare mean fork-length of tagged smolts when
marked versus when recaptured. The same analysis was used to test for significant
differences in the ratio of L+ : L tot for tagged smolts when marked compared to when
recaptured in 2000. A student’s t-test was also used to analyze the difference in the mean
number of plus growth circuli present on tagged smolt scales when marked compared to
when recaptured. This test was used again to test for difference in the mean plus growth
circulus width for tagged smolts when marked versus when recaptured in 2000.

57
Results:
Fish Movement:
Smolt emigration in the Western Brook system occurred from mid to late May
until late July. In all three years of sampling, emigration from Stag Brook occurred in
pulses and generally coincided with fluctuations in water temperature as opposed to the
other two sites where smolts migration was generally more continuous.
1998:
Sampling at Stag Brook began on May 26 in 1998 and a pulse in migration
occurred the next day (May 27). Therefore, the smolt run was well underway before
sampling commenced in 1998. Three more peaks or pulses in emigration occurred at
Stag Brook when temperatures were > 10oC (Figure 3.3).

0
5
10
15
20
25
30
May
-20
May
-25
May
-30
Jun-
4
Jun-
9
Jun-
14
Jun-
19
Jun-
24
Jun-
29
Jul-4
Jul-9
Jul-1
4
Jul-1
9
Jul-2
4
Jul-2
9
Date
# of
indi
vidu
als c
aptu
red
02468101214161820
Dai
ly m
ean
tem
p. (o C
)
Stag Brook
n = 178
0
5
10
15
20
25
May
-20
May
-25
May
-30
Jun-
4
Jun-
9
Jun-
14
Jun-
19
Jun-
24
Jun-
29
Jul-4
Jul-9
Jul-1
4
Jul-1
9
Jul-2
4
Jul-2
9Date
# of
indi
vidu
als c
aptu
red
0
2
4
6
8
10
12
14
16
18
Dai
ly m
ean
tem
p. (o C
)
Western Brook Pond
n = 153
0
5
10
15
20
25
30
May
-20
May
-25
May
-30
Jun-
4
Jun-
9
Jun-
14
Jun-
19
Jun-
24
Jun-
29
Jul-4
Jul-9
Jul-1
4
Jul-1
9
Jul-2
4
Jul-2
9
Date
# of
indi
vidu
als c
aptu
red
0
2
4
6
8
10
12
14
16
18D
aily
mea
n te
mp.
(o C)
Western Brook
n = 181
Figure 3.3: Daily counts of Atlantic salmon smolts captured emigrating from Stag Brook,
Western Brook Pond, and Western Brook with daily mean water temperatures, 1998.
58

59
The run was finished by June 29, by which time 178 smolts had been captured
(Table 3.1). 58 Atlantic salmon parr were caught at Stag Brook in 1998 (Table 3.2), 27
of which were ≥ 9 cm and marked with upper caudal fin clips. None of these individuals
was recaptured during the 3 years of the study.
Table 3.2: Table showing the start of sampling, the first and last captured, peak, the
termination date of sampling, and the total number of parr captured and < and ≥ 9 cm size
categories where applicable at each site on the Western Brook system (1998 – 2000).
Start First Peak Last End Total Parr Parr of Parr in Parr of Parr Caught Caught
Year Site Sampling Caught Captures Caught Sampling Captured < 9 cm > 9 cm1998 Stag Brook May-26 May-29 __ Jun-29 Jul-03 58 31 27
Western Brook Pond May-20 May-21 __ Jun-29 Jul-30 42 __ __
Western Brook May-20 May-25 __ Jun-26 Jul-03 27 __ __
1999 Stag Brook May-21 May-26 __ Jun-25 Jul-02 21 10 11
Western Brook Pond May-31 Jun-01 Jul-11, Jul-21 Jun-28 Aug-02 118 __ __
Western Brook Jun-03 Jun-03 Jun-20 Sep-06 Sep-11 370 __ __
2000 Stag Brook May-26 May-27 Jun-24 Jul-02 Jul-27 679 546 113
Western Brook Pond Jun-14 Jun-14 Jul-02 Jul-21 Jul-28 114 __ __
Western Brook __ __ __ __ __ __
The smolt run began later and lasted longer at the outflow of Western Brook Pond
than at the other two sites sampled in 1998 (Figure 3.3). Sampling at this site
commenced on May 20 and the first smolt was captured the next day (May 21)(Figure
3.3). Peak smolt migration occurred when the water temperature reached 11oC on June
21, July 2 and 7 (Table 3.1). A short break in migration occurred when the water

60
temperature dropped below 10oC from June 28 – July 1 (Figure 3.3). The run was
finished by July 28 at which time 153 smolt had been caught. A small number of parr
(42) were caught (Table 3.2) and no trend in movement was observed. They were not
divided into size classes as in Stag Brook and no parr were marked at this site.
At the mouth of Western Brook sampling commenced on May 20 in 1998 with
the first smolt caught two days later (May 22). A peak in movement occurred from June
12 – 13 (Table 3.1) and the run was over by June 29 by which time 181 smolts had been
caught. As at the outflow of Western Brook Pond, very few parr (27) were captured at
the mouth of Western Brook in 1998 (Table 3.2).
1999:
In 1999 sampling at Stag Brook started earlier than in 1998 (Table 3.1) on May
21. The first smolt was caught two days later (May 23). Two peaks in migration
occurred: the first was over May 25 – 27, when daily mean water temperatures reached
10oC and the second occurred when the water temperature reached 14 oC on June 2
(Figure 3.4). The run finished by June 16 in 1999 and by this time 252 smolts were
caught at Stag Brook, a larger number than in 1998 (Table 3.1). 21 Atlantic salmon parr
were caught at this site in 1999, 11 of which were ≥ 9 cm and fitted with Carlin tags.
None of these marked parr were recaptured in 1999 or 2000. Although more smolts were
caught in 1999 at Stag Brook, a decrease in parr movement was observed compared to
1998 (Table 3.2).

0
10
20
30
40
50
May
-20
May
-25
May
-30
Jun-
4
Jun-
9
Jun-
14
Jun-
19
Jun-
24
Jun-
29
Jul-4
Jul-9
Jul-1
4
Jul-1
9
Jul-2
4
Jul-2
9
Date
# o
f ind
ivid
uals
cap
ture
d
02468101214161820
Dai
ly m
ean
tem
p. (o C
)
Stag Brook
n = 252
0
10
20
30
40
50
May
-20
May
-25
May
-30
Jun-
4
Jun-
9
Jun-
14
Jun-
19
Jun-
24
Jun-
29
Jul-4
Jul-9
Jul-1
4
Jul-1
9
Jul-2
4
Jul-2
9
Date
# of
indi
vidu
als c
aptu
red
024681012141618
Dai
ly m
ean
tem
p. (o C
)
Western Brook Pond
n = 482
0
20
40
60
80
100
120
140
160
May
-20
May
-25
May
-30
Jun-
4
Jun-
9
Jun-
14
Jun-
19
Jun-
24
Jun-
29
Jul-4
Jul-9
Jul-1
4
Jul-1
9
Jul-2
4
Jul-2
9
Date
# of
indi
vidu
als c
aptu
red
0
2
4
6
8
10
12
14
16
18
Dai
ly m
ean
tem
p. (o C
)
n = 1707
Western Brook
Figure 3.4: Daily counts of Atlantic salmon smolts captured emigrating from Stag Brook,
Western Brook Pond, and Western Brook with daily mean water temperatures, 1999.
61

62
Sampling began later (May 31) at the outflow of Western Brook Pond in 1999
than in 1998. The first smolt was caught the day after sampling commenced (June 1)
(Table 3.1) indicating a later date of initial movement out of the lake than out of Stag
Brook (Figure 3.4). The peak in smolt migration at this site occurred from June 25 – 28,
when water temperature was 10 to 12oC (Figure 3.4). The run was finished by July 25 by
which time 482 smolts were caught, which was a much larger number of captures for this
site as compared to 1998 (Table 3.1). This increase was due to an increase in fishing
effort in 1999 over 1998. 118 salmon parr were captured from June 1 – 28, with a peak
in movement occurring on June 11. All parr movement occurred before the smolts began
migration out of the lake in 1999. The greatest amount of parr movement occurred in the
two weeks leading up to the peak in smolt captures (Figures 3.4, 3.5).

0
1
2
3
4
5
6
7
8
May
-20
May
-27
Jun-
3
Jun-
10
Jun-
17
Jun-
24
Jul-1
Jul-8
Jul-1
5
Jul-2
2
Jul-2
9
Aug
-5
Aug
-12
Aug
-19
Aug
-26
Sep-
2
Date
# of
indi
vidu
als c
aptu
red
0
2
4
6
8
10
12
14
16
18
Dai
ly m
ean
tem
p. (o C
)
Western Brook Pond
n = 118
0
5
10
15
20
25
30
May
-20
May
-27
Jun-
3
Jun-
10
Jun-
17
Jun-
24
Jul-1
Jul-8
Jul-1
5
Jul-2
2
Jul-2
9
Aug
-5
Aug
-12
Aug
-19
Aug
-26
Sep-
2
Date
# of
indi
vidu
als c
aptu
red
0
2
4
6
8
10
12
14
16
18
Dai
ly m
ean
tem
p. (o C
)
Western Brook
n = 370
Figure 3.5: Daily counts of Atlantic salmon parr captured at the discharge of Western
Brook Pond, and the mouth of Western Brook with daily mean water temperatures, 1999.
63

64
Sampling began on June 3 at the mouth of Western Brook in 1999 and the first
smolt was caught on this date (Table 3.1). Therefore smolt movement commenced only a
few days apart at mouth of Western Brook and at the outflow of Western Brook Pond
1999 (Figures 3.4). The peak in smolt emigration occurred on June 25 at the mouth of
Western Brook, and the run was finished by July 30 by which time 1707 smolts had been
caught by the fish-counting fence. The number of Atlantic salmon parr captured in the
downstream trap of the counting fence was 370, the first being caught on June 3 (Table
3.2). The majority of parr caught were < 9cm, however, parr were not divided into size
classes as no parr were marked at this site. The peak in parr movement at this site
occurred on June 20. The peak, and in fact the majority, of parr movement occurred
before the peak in smolt migration at this site (Figures 3.4, 3.5), similar to the pattern
observed at the outflow of the lake.
2000:
Sampling began on May 26 at Stag Brook in 2000, and the first smolt was caught
on May 28 (Table 3.1). Two peaks in smolt migration occurred when the water
temperature was near 7 oC. The first occurred on June 1 and the second on June 7. A
third peak in migration occurred on June 18 when the water temperature reached 14.7 oC
(Figure 3.6).

0
5
10
15
20
25
30
35
40
45
50
May
-20
May
-25
May
-30
Jun-
4
Jun-
9
Jun-
14
Jun-
19
Jun-
24
Jun-
29
Jul-4
Jul-9
Jul-1
4
Jul-1
9
Jul-2
4
Jul-2
9
Date
# of
indi
vidu
als c
aptu
red
0
2
4
6
8
10
12
14
16
18
Dai
ly m
ean
tem
p. (o C
)
Stag Brook
n = 470
0
10
20
30
40
50
60
70
80
90
100
May
-20
May
-25
May
-30
Jun-
4
Jun-
9
Jun-
14
Jun-
19
Jun-
24
Jun-
29
Jul-4
Jul-9
Jul-1
4
Jul-1
9
Jul-2
4
Jul-2
9
Date
# of
indi
vidu
als c
aptu
red
0
2
4
6
8
10
12
14
16
18
Dai
ly m
ean
tem
p. (o C
)
Western Brook Pond
n = 916
Figure 3.6: Daily counts of Atlantic salmon smolts captured emigrating from Stag Brook
and Western Brook Pond with daily mean water temperatures, 2000.
470 smolts were caught by the time the run ended on June 30. A considerably
greater number of Atlantic salmon parr were caught in Stag Brook in 2000 compared to
1998 or 1999 (Table 3.1). This likely reflects the increase in fishing effort. 679 parr
were captured at this site in 2000 (Table 3.2). 546 of these were < 9 cm and scale
analysis showed them to be age 1 +. The first parr was caught on May 27 and the peak in
65

movement occurred on June 24. The peak in parr movement occurred after the peak in
smolt migration yet the majority of parr were caught during the smolt run. Parr ≥ 9 cm
moved earlier than those < 9 cm. Parr movement stopped when the smolt run ended on
July 2 (Figure 3.7).
0
10
20
30
40
50
60
70
80
May
-20
May
-25
May
-30
Jun-
4
Jun-
9
Jun-
14
Jun-
19
Jun-
24
Jun-
29
Jul-4
Jul-9
Jul-1
4
Jul-1
9
Jul-2
4
Jul-2
9
Date
# of
indi
vidu
als c
aptu
red
0
2
4
6
8
10
12
14
16
18
Dai
ly m
ean
tem
p. (o C
)
parr < 9 cm
parr > 9 cm
Stag Brook
n = 679
0
1
2
3
4
5
6
7
8
9
10
May
-20
May
-25
May
-30
Jun-
4
Jun-
9
Jun-
14
Jun-
19
Jun-
24
Jun-
29
Jul-4
Jul-9
Jul-1
4
Jul-1
9
Jul-2
4
Jul-2
9
Date
# of
indi
vidu
als c
aptu
red
0
2
4
6
8
10
12
14
16
18
Dai
ly m
ean
tem
p. (o C
)
Western Brook Pond
n = 114
Figure 3.7: Daily counts of Atlantic salmon parr captured at Stag Brook (for size classes
< 9 cm and ≥ 9 cm) and at the discharge of Western Brook Pond (all size classes), with
daily mean water temperatures, 2000.
66

67
317 parr < 9 cm were captured and given upper caudal fin clips at the efficiency
trap, 500 m upstream from the main capture site in Stag Brook. Only 2 parr marked in
this fashion were recaptured at the downstream capture site indicating that many parr < 9
cm are mobile but they likely tend to stay in Stag Brook.
26 parr ≥ 9 cm were marked with Carlin tags at the efficiency trap. 9 of these
individuals were recaptured at the downstream capture site. The rate of recapture
between the efficiency site and main capture site in Stag Brook was much less for parr
(35 %) than for smolts (60 %) indicating less downstream movement by parr than smolts.
Sampling began on June 14 at the outflow of Western Brook Pond in 2000, which
was later than in 1998 or 1999. The late start of sampling was due to the persistence of
higher water levels in 2000 compared to 1998 and 1999. The first smolt was caught on
June 17 (Table 3.1). The peak in migration out of Western Brook Pond occurred from
July 3 – 7 when the water temperature reached 11 oC. Sampling ended on July 28 by
which time a total of 916 smolts had been captured (Figure 3.6, Table 3.1). A greater
number of smolts was caught at this site in 2000 than in the previous field seasons as a
result of increased fishing effort and a more efficient site of capture due to lower flows.
114 parr were caught at this site in 2000 with the first caught on June 14. Parr
movement generally occurred during the same time as smolt migration, but the peak in
parr movement occurred on July 2, the day before the peak in smolt migration (Figure
3.6, 3.7).

68
Fork-Lengths and Condition Factors:
In all three years sampled, the mean fork-length of smolts captured at the outflow
of Western Brook Pond was significantly greater than the mean fork-length of smolts
captured at Stag Brook (P < 0.001). The difference in mean fork-length between Stag
Brook and Western Brook Pond smolts was 2.7 cm in 1998, 3.6 cm in 1999 and 3.1 cm in
2000 (Table 3.3).
Table 3.3: Mean fork-lengths (± 1 SD) and mean condition factors (± 1 SD) for Atlantic
salmon smolts caught at each sampling site on the Western Brook system over 3 years
(1998 – 2000).
Year Sampling Site n FL (cm) Cf
1998 Stag Brook 178 13.1 ± 1.4 __
Western Brook Pond 153 15.8 ± 2.1 __
Western Brook 181 13.8 ± 1.6 __
1999 Stag Brook 252 12.8 ± 1.1 0.91 ± 0.07
Western Brook Pond 482 16.4 ± 1.7 0.90 ± 0.07 Western Brook (June 3 - June 18) 137 14.6 ± 1.8 0.95 ± 0.20 Western Brook (June 18 - July 22) 265 17.1 ± 1.7 0.90 ± 0.09
2000 Stag Brook 470 12.9 ± 1.0 0.93 ± 0.07 Western Brook Pond 916 16.0 ± 1.7 0.87 ± 0.10
In 1998, the smolts caught at the outflow of the lake were significantly larger then
smolts caught at the mouth of Western Brook (P < 0.001). The difference in mean fork-
length between the two sites was 2 cm (Table 3.3).

69
In 1999, the smolt run at the mouth of Western Brook lasted from June 3 – July
22 (Table 3.1). However, substantial smolt movement at the outflow of the lake did not
begin until June 17 in 1999 (Figure 3.4). Therefore, the smolts caught at the mouth of
Western Brook before June 18 were likely produced in Western Brook and the steadies
along its course. The mean fork-length of these smolts was significantly smaller (by
approximately 2 cm) than the mean fork-length of smolts caught at the outflow of the
lake and at the mouth of Western Brook after June 18 (P < 0.001)(Table 3.3). The mean
fork-length of smolts caught at the mouth of Western Brook after June 18 was slightly
(0.6 cm) yet significantly greater than the mean fork-length of smolts caught at the
outflow of Western Brook Pond in 1999 (P < 0.001). This may indicate that the fish
caught at the mouth of Western Brook after June 18 and the fish caught at the outflow of
the lake may have been produced in the same area, Western Brook Pond. The slight
increase in the mean length may be a function of time.
Data for comparisons of mean condition factor were only available for 1999 and
2000. No significant difference (P > 0.05) in condition factor was seen for Atlantic
salmon smolts captured in the Western Brook system in 1999. However, in 2000, smolts
caught in Stag Brook had a significantly greater condition factor (P < 0.001) when
compared to smolts captured at the outflow of Western Brook Pond. No significant
reduction in condition factor was evident between years for a given site (Table 3.3).

70
Scale Aging Analysis:
Scale analysis revealed that in all three sampling years the dominant age class of
Atlantic salmon smolts captured at each site in the Western Brook system was 3 years
(Figure 3.8).
The percentage of captured smolts showing plus growth significantly increased
(P < 0.05) from the first to the second half of the smolt run at all sites during each year
sampled. The exception was in 1998 at the outflow of Western Brook Pond where there
was no significant increase in the percentage of captured individuals showing plus growth
from the first to second half of the run (Figure 3.9). 1999 had the largest percent of
individuals captured throughout the smolt run showing plus growth for all sites in
comparison to 1998 and 2000. Almost all of the Atlantic salmon smolts caught in the
second half of the smolt run at each site in 1999 showed some plus growth. The
percentage of individuals caught at Stag Brook showing plus growth was the lowest
during 1998 when compared to both 1999 and 2000 (Figure 3.9).

020406080
100120140160180
2 3 4 2 3 4 2 3 4
Age (years)
Num
ber
1998
Stag Brookn = 178
Western Brook Pondn = 153
Western Brookn = 181
0
50
100
150
200
250
300
350
400
2 3 4 2 3 4 2 3 4
Age (years)
Num
ber
1999
Stag Brookn = 252
Western Brook Pondn = 482
Western Brookn = 404
0
50
100
150
200
250
300
350
400
2 3 4 2 3 4
Age (years)
Num
ber
2000
Stag Brookn = 470
Western Brook Pondn = 345
71
Figure 3.8: Number of smolts captured by age class for Stag Brook, Western Brook Pond
and Western Brook from 1998 – 2000.

0102030405060708090
100
Stag Brook Western Brook Pond Western Brook
Sampling Site
% o
f ind
ivid
uals
show
ing
plus
gro
wth
1st half of smolt run 2nd half of smolt run
1998
n = 178 n = 153 n = 181
0102030405060708090
100
Stag Brook Western Brook Pond Western Brook
Sampling Site
% o
f ind
ivid
uals
show
ing
plus
gro
wth
1999
n = 252 n = 482 n = 404
0102030405060708090
100
Stag Brook Western Brook Pond
Sampling Site
% o
f ind
ivid
uals
show
ing
plus
gro
wth
2000
n = 470 n = 345
Figure 3.9: Percent of Atlantic salmon smolts captured at each sampling site during both
halves of the smolt run that showed plus growth (1998 – 2000).
72

73
or each year by site for
The temperature readings compared
n
Stag Brook,
estern Brook Pond and Western Brook from May 26 – July 27 (duration of Western
ean
Temperature Regimes During Smolt Movement:
Average daily mean water temperatures were compared f
comparison to the percent plus growth in each year.
by one-way ANOVA were those from May 26 to July 27, the maximum duration of
juvenile salmon emigration in the system. Stag Brook was significantly cooler in 2000
than in either 1998 or 1999 (P < 0.0002). There was no significant difference in mea
temperature between 1998 and 1999 at Stag Brook (P > 0.05) (Table 3.4).
Table 3.4: Average, minimum, and maximum daily mean temperatures for
W
Brook system smolt migration), 1998 – 2000.
Avg. Daily Mean Min. Daily Mean Max. Daily MYear Sampling Site Temperature (oC) Temperature (oC) Temperature (oC)
6.0 19.0 1998 Stag Brook 14.0 ± 3.5 Western Brook Pond 9.9 ± 3.5 4.7 15.6
Western B k (mouth)
roo 13.7 ± 4.0 6.0 20.2
1999 Stag Brook 14.8 ± 3.1 6.4 19.5 Western Brook Pond 10.7 ± 2.8 4.9 15.7 Western Brook (mouth) 8.9 ± 2.8 4.1 13.7
2000 Stag Brook 12.3 ± 3.6 5.5 18.4 Western Brook Pond 8.4 ± 2.9 3.9 13.2 Western Brook (mouth) 11.3 ± 3.8 4.8 17.9
utflow of Western Brook Pond, mean water temperature was significantly
ifferent (P < 0.0002) each year with 2000 being the coolest (8.4 oC) compared with
1998 and 2000 (Table 3.4).
At the o
d

74
to
.4).
nd occurred throughout the early portion of the smolt
At the mouth of Western Brook each year showed significantly different mean
temperatures (P < 0.0002) with 1999 having the coolest water temperature compared
both 1998 and 1999 (Table 3
Daily mean water temperatures encountered by Stag Brook emigrants in 2000
upon entering the lake are shown in Figure 3.10. A difference of at least 2 oC between
Stag Brook and Western Brook Po
run out of Stag Brook. The difference in water temperature between the brook and the
lake increased as the smolt run continued. The difference in temperature between Stag
Brook and Western Brook Pond, near the inflow of Stag Brook, was as large as 9 oC on
the same day (June 21, 2000)(Figure 3.10).
0
2
4
6
8
10
12
14
16
18
20
C)
Date
Dai
ly m
ean
tem
p. (o
May June July
S P E
WBPD WBPS
Stag Brook
Figure 3.10: Daily mean water temperature readings taken from May 26 to July 28,
2000, at Western Brook Pond near the inflow of Stag Brook (WBPS), Western Brook
Pond near its drainage by Western Brook (WBPD), and Stag Brook and the
start (S), peak (P) and end (E) of smolt migration from Stag Brook.

75
ptured at downstream
capture sites in 1998. No individuals marked in Stag Brook in 1998 were captured in
easons (Table 3.5).
Table 3.5: Number of smolts captured, marked and recaptured during migration in Stag
Brook (STB), Western Brook Pond (WBP) and Western Brook (WB), 1998 – 2000.
Duration of Site of Recapture
Mark-Recapture Results:
1998 (sampling year 1):
None of the 144 individuals marked at Stag Brook were reca
re
either of the following field s
Year Site Smolt Migration Captured Marked STB WBP WB 1998 Stag Brook May 27 - June 29 178 144 __ 0 0
Western Brook Pond May 21 - July 27 153 0 __ 0 0 Western Brook May 22 - June 29 181 0 0 0 0
1999 Stag Brook May 23 - June 16 252 236 16 4 4 Western B ok Pond Jun 5 48 40 __ __ __
Western
2000 4 ond
ro e 1 - July 2 2 Brook June 3 - July 30 1707 0 __ __ __
__ Stag Brook May 28 – June 30 470 70 __ 28
Western Brook P June 17 - July 28 916 42 __ 5 __

76
999 (sampling year 2):
Of the 252 emigrants captured at Stag Brook in 1999, 236 were fitted with Carlin
gs and given anal fin clips. 16 smolts were recaptured at this same site; 4 smolts tagged
Stag Brook were recaptured at the outflow of Western Brook Pond. The fish fence at
ok recaptured 4 fish marked in Stag Brook. None of the
captu
tance
e ranged from 9 – 36 days. Emigrants marked earlier in the
s,
1
ta
in
the mouth of Western Bro
re red smolts were caught more than once in 1999. No individuals marked in 1999
were recaptured in 2000.
The majority of individuals recaptured after navigating the pond were 3 years of
age and showed plus growth when caught and marked in Stag Brook. The linear dis
between the mouth of Stag Brook and the pond outflow was approximately 5 km. The
time to migrate this distanc
season took longer to migrate through the Pond. For example, a smolt marked on May 27
took 36 days to reach the outflow of Western Brook Pond, indicating a trip speed of
0.14 km • day-1. However, a smolt marked on June 2 reached the same location in 9 day
moving at a pace of 0.56 km • day-1 (Table 3.6).

77
able 3.6: Fork-length, migration time, distance traveled, and trip speed of emigrant
tlantic salmon smolts from time of marking in Stag Brook until the time of recapture at
e outflow of Western Brook Pond for 1999 and 2000.
Mark Date Site of Recap. Migration Trip
T
A
th
Date Length of Of Length Time Distance Speed -
Year Marked (cm) Recapture Recapture (cm) (days) (km) (km • day
1) May-27 12.9 Jul-02 Western Brook Pond __ 36 5.0 0.14
1999 May-30 11.7 Jun-23 Western Brook Pond __ 24 5.0 0.21 Jun-02 14.3 Jun-11 Western Brook Pond Jun-02 15.5 Jun-15 Western Brook Pond
__ 9 5.0 0.56 __ 13 5.0 0.38
Mean 13.6 20.5 5.0 0.32 Std ev.
Weste W W
WMean
Std
2000 Jun-01 11.9 Jun-21 Western Brook Pond 12.5 20 5.4 0.27
. D 1.6 12 0.2
1999 May-27 13.9 Jun-12 rn Brook (mouth) __ 16 14.0 0.88 May-30 13.1 Jun-20 estern Brook (mouth) __ 21 14.0 0.67 Jun-02 13.6 Jun-12 estern Brook (mouth) __ 10 14.0 1.40
Jun-11 14.5 Jul-07 estern Brook (mouth) __ 26 14.0 0.54 13.8 18.3 14.0 0.87
. Dev. 0.8 6.8 0.40
Jun-05 11.4 Jul-05 Western Brook Pond 13.1 12.4 14.6 14.2
Jun-11 Jul-03 Western Brook Pond 1 Jun-14 Jun-27 Western Brook Pond 5
Jun-14 12.7 Jul-04 Western Brook Pond 13.5 20 5.4 0.27
Std. v.
30 5.4 0.18 Jun-05 12.0 Jun-30 Western Brook Pond 25 5.4 0.22 Jun-07 13.8 Jul-05 Western Brook Pond 31 5.4 0.17 Jun-07 13.5 Jun-30 Western Brook Pond 23 5.4 0.23
12.7 3.7 22 5.4 0.25 13.4 __ 13 .4 0.42
Jun-14 14.0 Jun-15
Jul-04 Jul-23
Western Brook Pond Western Brook Pond
14.2 14.3
20 38
5.4 5.4
0.27 0.14 11.8
Jun-18 12.2 Jul-06 Western Brook Pond 12.6 18 5.4 0.30 Jun-20 10.7 Jul-07 Western Brook Pond 11.5 17 5.4 0.32 Jun-23 14.4 Jul-08 Western Brook Pond 15.0 15 5.4 0.36 Jun-24 12.2 Jul-07 Western Brook Pond 12.8 13 5.4 0.42 Jun-24 12.2 Jun-30 Western Brook Pond 12.3 6 5.4 0.90 Jun-24 12.8 Jul-07 Western Brook Pond __ 14 5.4 0.39 Jun-26 13.1 Jul-09 Western Brook Pond 13.5 13 5.4 0.42 Mean De
12.6 19.9 5.4 0.32 1.7 8.5 0.17

78
e 4 indiv ls reca tured at the mouth of Western Brook migrat
4 km. The time to migrate this distance ranged from 10 – 26 days.
espite the added distance to migrate down Western Brook, the smolts caught at the
outh of the river migrated at a speed more than twice as fast as those smolts caught at
ng the lake
he
of
is
stern Brook Pond was 28 (Table 3.5). Out of this number 17 had been
arked with Carlin tags and 11 with panjet tattoos. The individuals recaptured after
ranged from 2 – 4 years old with 10 of 17 individuals being age
ow
Th idua p ed
approximately 1
D
m
the outflow of the lake. This indicates an increased migratory speed once exiti
and entering Western Brook. Unfortunately, none of the 40 smolts Carlin tagged at t
discharge of Western Brook Pond were recaptured at the counting fence at the mouth
Western Brook in 1999. Therefore, actual speed of migration through this portion of the
system is only a guess. Emigrants marked earlier in the season did not show faster
migration times. A smolt marked on June 2 was recaptured 10 days later on June 12 at
the mouth of Western Brook. The pace of migration was approximately 1.40 km • day-1.
The slowest rate of migration for a recapture at the mouth of Western Brook pond was
0.54 km • day-1 (Table 3.6). Scale samples were not taken from recaptures during th
field season.
2000 (sampling year 3):
470 smolts were marked in Stag Brook in 2000. The number recaptured at the
outflow of We
m
having navigated the lake
3. The majority of individuals showed plus growth when marked in Stag Brook. The
distance migrated from the marking site in Stag Brook to the recapture site at the outfl

79
h
n
f
tag
erence in migration time was observed for three smolts marked on June
.
of Western Brook Pond was approximately 5.4 km. The number of days taken to reac
the recapture site ranged from 6 – 38, with the average being 20. An emigrant marked on
June 24 was recaptured 6 days later on the other side of the pond. The pace of migratio
for this fish was 0.9 km • day-1. However, the other end of the range is represented by a
smolt marked on June 15, which took 38 days to navigate the lake for a migratory pace o
0.14 km • day-1 (Table 3.6). All recaptured individuals showed a greater degree of
smoltification than when tagged, showing complete body silvering, darkening of fins, and
loss of scales.
Smolts that were marked on the same day and released at the same time showed
variance in the time it took to navigate the pond. Two smolts marked on June 5 in S
Brook differed in their migration time to the outflow of Western Brook Pond by 5 days.
Seven days diff
14. Three individuals marked on June 24 also showed a 8-day difference in migration
time. Therefore, “temporal cohorts” did not move together through the pond (Table 3.6)
Correlation between the day of the smolt run that an individual was tagged to lake
residence time was marginal, with a small negative slope. Only 11 % of the variation in
lake residence time could be accounted for by the day of marking (Figure 3.11).

0
5
10
15
20
25
30
35
40
0 5 10 15 20 25 30 35
Day of smolt run
Lak
e re
side
nce
time
(day
s) R2 = 0.11a = 25.13b = - 0.33
Figure 3.11: Relationship between lake residence time and the day of the smolt run on
which an individual was marked in Stag Brook in 1999 and 2000 showing y-intercept (a),
slope (b) and adjusted R2 value.
Lacustrine Growth of Recaptured Emigrants (2000):
The average fork-length of individuals captured after migrating through the lake
(13.3 cm ± 0.9) was significantly greater than for the same individuals when caught in
Stag Brook (12.6 cm ± 0.9)(P < 0.05) (Table 3.7). The average increase in fork-length
was 7.7 mm. The increase in length of individuals migrating through the lake ranged
from 0.1 mm • day-1 to 0.66 mm • day-1, the mean being 0.35 mm • day-1. One individual
that took 38 days to migrate from the marking site to the recapture site on the other side
of the pond also increased its length by 25 mm. (Table 3.7).
80

81
Table 3.7: Differences in fork-length, number of plus growth circuli and ratio of plus
growth circuli length to total scale length L+ : L tot, migration time, and growth per day,
between the time of marking in Stag Brook and the time of recapture at the
outflow of Western Brook Pond, 2000.
Date Mark Numb. Date Mig. Recap. Numb. Diff. Diff. of FL of of Time FL of in in Growth/Day
Mark (mm) Age circuli L+:L tot Recapt. (days) (mm) circuli L+:L tot L+:L tot FL (mm) (mm/day) Jun-01 119 2.5 2 0.087 Jun-21 20 125 __ __ __ 6 0.30 Jun-05 114 3.0 0 0.000 Jul-05 30 131 4 0.146 0.146 17 0.57 Jun-05 120 3.0 0 0.000 Jun-30 25 124 3 0.122 0.122 4 0.16 Jun-07 138 4.5 1 0.031 Jul-05 31 146 4 0.156 0.125 8 0.26 Jun-07 135 3.5 2 0.077 Jun-30 23 142 3 0.122 0.045 7 0.30 Jun-11 127 3.5 2 0.143 Jul-03 22 137 4 0.180 0.037 10 0.45 Jun-14 134 3.5 2 0.065 Jun-27 13 __ __ __ __ __ __
Jun-14 127 3.5 2 0.095 Jul-04 20 135 4 0.140 0.045 8 0.40 Jun-14 140 4.5 2 0.056 Jul-04 20 142 3 0.081 0.025 2 0.10 Jun-15 118 3.5 2 0.074 Jul-23 38 143 6 0.231 0.157 25 0.66 Jun-18 122 3.5 2 0.067 Jul-06 18 126 3 0.125 0.058 4 0.22 Jun-20 107 3.5 5 0.152 Jul-07 17 115 6 0.250 0.098 8 0.47 Jun-23 144 4.5 3 0.081 Jul-08 15 150 4 0.136 0.055 6 0.40 Jun-24 122 3.5 3 0.116 Jul-07 13 128 4 0.150 0.034 6 0.46 Jun-24 122 3.5 3 0.100 Jun-30 6 123 3 0.100 0.000 1 0.17 Jun-24 128 3.5 5 0.216 Jul-07 14 __ __ __ __ __ __
Jun-26 131 3.5 2 0.053 Jul-09 13 135 3 0.098 0.045 4 0.31 Mean 126 2.2 0.083 19.9 133 3.9 0.146 0.071 7.73 0.35
Std. Dev. 10 1.3 0.054 7.9 10 1.0 0.048 0.049 6.09 0.16

82
The ratio of plus growth circuli length to total scale length (L+ : Ltot) indicates the
degree of growth and allows for comparison of this parameter between scales collected at
the time of marking and at the time of recapture. The average ratio of L+ : Ltot was
significantly greater for recaptured smolts at the outflow of Western Brook Pond (0.15 ±
0.05) compared with scales from the same individuals at time of marking in Stag Brook
(0.08 ± 0.05) (P < 0.0005). In fact the mean L+ : Ltot ratio was more than doubled for the
group when recaptured compared to when marked (Table 3.7). The mean number of plus
growth circuli present per scale was significantly higher for individuals at time of
recapture compared to time of marking. The mean number of circuli at the time of
marking was 2.2 ± 1.3, while at time of recapture the same individuals had a mean circuli
number of 3.9 ± 1.0 (P < 0.0014). The individual that increased its length by 25 mm
displayed a large increase in the number of plus growth circuli. At time of marking this
emigrant showed 2 plus growth circuli, but at time of recapture had 6 (Table 3.7).
Using the radius length of the plus growth circuli a calculation of individual
circulus width was done to quantify the addition of scale material relative to the increase
in fork-length. All but two individuals showed a significant increase in the mean width
of plus growth circuli from their time of marking in Stag Brook (0.021 ± 0.010 mm) until
their recapture at Western Brook Pond (0.029 ± 0.005 mm)(P < 0.05). The mean
increase in circulus width was 0.008 mm (Table 3.8).

83
Table 3.8: Differences in number of circuli, radius length of plus growth circuli, and
circulus width for Atlantic salmon smolts between the time of marking in Stag Brook
until recapture at the discharge of Western Brook Pond, 2000.
Date # of L+ circulus Date # of L+ circulus Diff. In Diff. circulusMarked circuli (mm) width (mm) Recap. circuli (mm) width (mm) L+ (mm) width (mm)Jun-01 2 0.040 0.020 Jun-21 __ __ __ __ __
Jun-05 0 0.000 0.000 Jul-05 4 0.120 0.030 0.120 0.030 Jun-05 0 0.000 0.000 Jun-30 3 0.090 0.030 0.090 0.030 Jun-07 1 0.020 0.020 Jul-05 4 0.120 0.030 0.100 0.010 Jun-07 2 0.060 0.030 Jun-30 3 0.100 0.033 0.040 0.003 Jun-11 2 0.080 0.035 Jul-03 4 0.140 0.040 0.060 0.005 Jun-14 2 0.040 0.020 Jun-27 __ __ __ __ __
Jun-14 2 0.070 0.030 Jul-04 4 0.120 0.035 0.050 0.005 Jun-14 2 0.040 0.020 Jul-04 3 0.060 0.020 0.020 0.000 Jun-15 2 0.040 0.020 Jul-23 6 0.180 0.030 0.140 0.010 Jun-18 2 0.040 0.020 Jul-06 3 0.080 0.027 0.040 0.007 Jun-20 5 0.100 0.020 Jul-07 6 0.150 0.025 0.050 0.005 Jun-23 3 0.070 0.023 Jul-08 4 0.106 0.027 0.036 0.003 Jun-24 3 0.080 0.027 Jul-07 4 0.120 0.030 0.040 0.003 Jun-24 3 0.080 0.027 Jun-30 3 0.080 0.027 0.000 0.000 Jun-24 5 0.160 0.032 Jul-07 __ __ __ __ __
Jun-26 2 0.040 0.020 Jul-09 3 0.080 0.027 0.040 0.007
Mean 2.2 0.056 0.021 3.9 0.110 0.029 0.059 0.008 Std. Dev. 1.4 0.039 0.010 1.0 0.032 0.005 0.039 0.010
84
Discussion:
The prediction that Atlantic salmon smolts from Stag Brook were delayed during
their passage through Western Brook Pond was supported. Further, the delay was
generally in the order of weeks and not ≥ 1 year. Emigrating juveniles from Stag Brook
were successfully recaptured both at the outflow of Western Brook Pond and at the
mouth of Western Brook in the same year of marking. Therefore, smolts do navigate the
fjord lake and make it to the ocean in one migratory period.
The timing of migration in this system points to a delay in the emigration of
individuals moving through Western Brook Pond. Stag Brook smolts were captured
moving downstream during May and June, with the peak in the run as early as late May,
and never later than the first two weeks of June. In contrast, the peak in emigration at the
outflow of Western Brook Pond occurred in late June to early July in all three years
sampled. Therefore, up to 3 weeks passed from the time that a large number of smolts
entered the pond and a large number of individuals were caught exiting the lake where it
is drained by Western Brook. Based on the recapture of marked Stag Brook smolts, the
average time to navigate the pond was approximately 20 days for both 1999 and 2000.
This time lag (three weeks) coincides with the difference in timing of general smolt
movements that occurred at the two sites.
The trip speed of smolts through the pond was 0.32 km • day-1 for both years. In
comparison, Carlin tagged smolts moved at a pace of 1.8 to 15.6 km • day-1 through Red
Indian Lake of the Exploits River system (Bourgeois et al., 1986) and speeds of 0.59 to
2.84 cm/s (0.51 – 2.45 km • day-1) were observed by Thorpe et al. (1981) for smolts
carrying radio transmitters through Loch Voil, Scotland. Both studies describe speeds of

85
migration greater than smolt migration from Stag Brook to the outflow of Western Brook
Pond. Unlike Bourgeois et al. (1986), the individuals used in the present study were not
translocated.
The cause of this delay in migration is likely not linked to the distance to be
traveled (about 5.4 km). Much larger distances of migration were accomplished by
smolts through Red Indian Lake and Loch Voil (Bourgeois et al. 1986; Thorpe et al.
1981). Previous studies have predicted that smolt migration through lakes is passive and
controlled by surface water currents that are created by wind and flow through dynamics
(Hansen et al. 1984; Thorpe et al. 1981). The slow rate of turnover for Western Brook
Pond is directly related to the lack of flow through dynamics there (Kerekes 1994). The
regular wind action on the pond is variable and often violent. The prevailing wind
direction in May and June is southerly to southwesterly (Environment Canada 1996).
However, the steep fjord walls create a funneling effect when winds blow from an
easterly or southeasterly direction, which was also common during the juvenile migratory
period from 1998 – 2000. It seems highly unlikely that emigrant salmon moving through
the lake would use surface currents as a mechanism for orientation during these periods
of intense wave action. If surface water currents did assist smolt movement in Western
Brook Pond, then migration times would likely be faster than those observed in this study
since winds blowing in the direction of Western Brook occur often and with force during
May and June. Therefore, the results of this study further solidify the theory of a
significant directed active component to the movement of salmon smolts in lakes (Brett et
al. 1958; Bourgeois et al. 1986; Johnson and Groot 1963; Groot 1965).
The cause of the delay can more likely be related to the decrease in water

86
temperature encountered by smolts when entering Western Brook Pond from Stag Brook.
Österdahl (1969) observed that salmon smolt runs in a Swedish river normally started
when the water temperature reached 10 oC and Solomon (1978) concluded that few
Atlantic salmon smolts move below a threshold temperature determined by the prevailing
temperature of the preceding weeks. The descent of Atlantic salmon smolts in the River
Imsa (Norway) was not considered to be triggered by a specific water temperature or a
specific number of degree days, but was controlled by a combination of actual
temperature and temperature increases in the water during spring (Jonsson et al. 1985).
Water temperatures between 8 and 10 oC were reached in Stag Brook in early June while
during the same time period, temperatures in the lake were between 4 and 6 oC. This
decrease in the temperature encountered by smolts likely lead to a delay in migration as
smolt movement out of the lake did not occur until late June and early July, when the
water temperature of the pond reached 8 – 10 oC.
Loss of smolt characteristics has been observed for Atlantic salmon juveniles at
higher water temperatures (Duston et al. 1991; McCormick et al. 1999). However, a
delay in acquiring smolt characteristics does not seem substantial in cool water
conditions. Although some mortality occurs, those that survive continue smolting after
entering cold sea water (Arneson et al. 1998; Dickoff et al. 1989). The results of this
study indicate that Atlantic salmon smolts that enter a cooler lentic environment from a
warmer fluvial one do not suffer a delay in smoltification. Juveniles marked in Stag
Brook and recaptured on the other side of the lake all appeared further smoltified. In fact,
the mean condition factor of smolts recaptured at Western Brook Pond was significantly
lower than for smolts marked in Stag Brook in 2000. The reduction in condition factor by

87
Atlantic salmon juveniles is accompanied by an increase in Na+-K+ ATPase activity, and
as a result is a considered a good indication of smoltification (Saunders et al. 1998,
Specker et al. 2000, Handeland et al. 2001). Furthermore, the smolts caught at the
outflow of the lake showed a higher degree of smoltification than those caught in Stag
Brook in all years sampled.
Despite a general increase in smoltification, a small correlation between lake
residence time and the day of the smolt run that an individual was marked was observed.
An important behavioural change involved in smoltification is the movement away from
a territorial strategy of parr to one of schooling in smolts (Kallberg 1958; Wedemeyer
1980). As much as 7 days difference in migration time to the outflow of Western Brook
Pond was recorded for individuals marked in Stag Brook on the same day. These results
indicate that “temporal cohorts” created in the nursery stream may not be adhered to once
entering a lake, and behaviour of an individual nature rather than one of schooling occurs.
None of the smolts marked at the discharge of Western Brook Pond and very few
of the smolts marked in Stag Brook were recaptured at the counting fence in 1999. This
is likely due to the low number of individuals marked and the low efficiency related to
the counting fence. The occurrence of three shallow steadies on Western Brook may
have also increased the possibility of predation on these marked smolts. Jepsen et al.
(1998) observed significantly increased mortality rates for smolts migrating through a
shallow reservoir on the River Gudenå (Denmark) due to predation.
In all three years a significant increase in mean fork-length was measured in
smolts moving from Stag Brook to the outflow of Western Brook Pond. The age of
smolts exiting the lake was not significantly different from the age that smolts emigrate

88
from Stag Brook. These results indicate significant growth in the pond. The earliest
running smolts at the counting fence in 1999 were assumed to have reared in Western
Brook and its steadies because few smolts had begun emigrating from Western Brook
Pond before June 18. These “riverine” smolts (of the same age) were significantly
smaller than smolts caught exiting the lake, and smolts caught at the counting fence after
June 18. Therefore, the fjord lake appears to produce smolts larger than both Stag Brook
and Western Brook, which is in agreement with previous studies documenting increased
size of juvenile Atlantic salmon reared in lakes (Hutchings 1986; O’Connell et al. 1989;
Erkinaro and Gibson 1997).
Despite cooler water temperatures throughout the spring and summer at the
outflow of Western Brook Pond, the percentage of smolts showing plus growth was
greatest there when compared to Stag Brook in all years sampled.
The percent of captured individuals showing plus growth at each site fluctuated
between years. The difference in the percentage can be directly related to the average
daily mean temperature for that field season. 1999 had the highest spring/summer
temperatures at both Stag Brook and the outflow of Western Brook Pond, and 1999
showed the largest proportion of juveniles with plus growth relative to 1998 and 2000.
The proportion of individuals showing plus growth in Stag Brook during the first
half of the smolt run in 1998 and 2000 indicates that, even in relatively cooler years,
some growth did take place during early spring in the nursery stream. In warmer years
such as 1999, the amount of spring growth that is accomplished early in the migratory
period and in the fluvial environment was substantial.

89
This increased potential for growth in Western Brook Pond is more distinctively
defined by results of the mark-recapture experiment. These results show a significant
increase in the mean fork-length of smolt marked in Stag Brook and recaptured as smolts
at Western Brook Pond. On average 7.7 mm of length was added while migrating
through the lake. The average growth per day was 0.35 ± 0.16 mm • day-1 for smolts in
the act of migrating through Western Brook Pond, which has been described as having a
low productivity (Kerekes 1994). Cunjak (1992) described growth rates of 0.23 ± 0.42
mm • day-1 observed for Atlantic salmon parr / pre-smolts captured in the estuary of
Western Arm Brook, Newfoundland. The rate of growth was greater in the estuary than
in the river (mean growth rate = 0.12 ± 0.13 mm • day-1) for juveniles (parr). Western
Arm Brook was described as having relatively low growth in comparison with other
rivers, yet the low productivity of Western Brook Pond managed to facilitate the growth
of migrating smolts at a faster rate than for estuarine parr / pre-smolts of Western Arm
Brook.
This increase in growth was also noticed in a significantly greater number of plus
growth circuli being present on scales of recaptured individuals than on marked
individuals. In fact, the mean number of plus growth circuli was almost doubled during
the time spent in Western Brook Pond. Comparing the ratio of plus growth radius length
to total scale radius length gives a good indication of growth between the two capture
events. The significant difference in the proportion of the scale that plus growth makes
up after time spent in the pond indicates an increased growth rate.
To more precisely compare if there is a difference in growth rate between the
fluvial and lacustrine environments, the width of single plus growth circulus was

90
measured. The circuli that were added during migration through the pond were on
average 0.007 mm wider than those laid down in Stag Brook, which provided further
evidence for the higher potential for growth in Western Brook Pond. These results
corroborate previous findings of increased growth potential by Atlantic salmon juveniles
in a lacustrine environment (Erkinaro and Gibson 1997; Hutchings 1986; Pepper et al.
1985). However, this study is the first to report the increased growth potential for
smoltifying Atlantic salmon migrating through a lake.
Western Brook Pond has been described as extremely low in production
(Kerekes 1994) yet growth rates increased there. Reduced tendencies for interspecific
and intraspecific competition, decreased predation, and a lowering of energy
requirements needed to maintain position have been presented as possible reasons for
increased growth potentials of lakes (Birt et al. 1990; Hutchings 1986; O’Connell and
Ash 1989). However, lake-reared Atlantic salmon smolts that migrated down the River
Imsa (Norway) in late spring and throughout the summer had reduced survival compared
to stream-reared fish that migrated primarily in May (Hansen 1987). Similar migratory
timing occurs in the Western Brook system for lacustrine and riverine rearers. However,
Lundqvist et al. (1988) concluded that larger sized descending smolts have better survival
at sea. For this reason Western Brook Pond may be an important environment for parr
and migrating smolts to rear and increase their growth before entering the ocean.
The capture of a large number of smolts exiting Western Brook Pond that had not
been marked in Stag Brook suggests some migration of parr into the lake that
subsequently smoltify and emigrate. Parr migration into the fjord pond could occur from
Stag Brook (downstream) or as an upstream movement from Western Brook. Both

91
modes of movement have been described for Atlantic salmon parr (Huntsman 1945;
Hutchings 1986; Ryan 1986; Erkinaro and Gibson 1997; Erkinaro et al. 1998a, 1998b).
The small number of parr captured in 1998 and in 1999 in Stag Brook provided little
evidence of significant parr movement to the lake. However, in 1999 the capture of parr
at the outflow of Western Brook Pond and at the mouth of Western Brook indicated
possible downstream movements at these locations. Since the parr were not marked at
these sites it is not known if they were resident and captured repeatedly. The parr
captured at the counting fence in 1999 may have been moving into the estuary to take
advantage of increased growth potentials (Cunjak et al. 1989, Cunjak 1992).
In Stag Brook, in 2000, a peak in parr movement occurred on June 25, a week
after a peak in smolt migration. These parr were 5 – 8 cm and were 1 year old. Parr have
been shown to precede or accompany the smolt run (Hutchings et al. 1986). Although
parr were captured during the smolt run at Stag Brook in 2000, it appears that movement
may increase after the peak in smolt migration. Only 2 of the marked parr < 9 cm were
subsequently recaptured downstream, and as a result no affirmation of downstream
movement to the lake could be reached. The lack of recaptures may be due to low water
conditions at this time, which may have caused a decrease in the fyke trap efficiency at
the recapture site. Parr ≥ 9 cm were recaptured with 35 % success, which is significantly
lower than the efficiency of smolt recapture of 60 % at the same time. These results
indicate that larger parr (2 – 3 years old) are less likely to migrate downstream to the
pond, yet show more mobility that younger parr.

92
Conclusions:
In summary, Atlantic salmon emigrants from Stag Brook do migrate to the sea in
one spring/summer. Migration was delayed by the fjord pond due to its relatively cool
lentic environment compared to the nursery stream. The observations of this study
support the theory of a large directed active component to migration (Bourgeois et al.
1986). Despite the cooler temperatures of Western Brook Pond, an increase in growth
and more advanced levels of smoltification were observed for individuals that are likely
reared there and those that simply migrate through the pond. Differences in migration
times for individuals marked and released on the same day indicate a lack of cohesion to
temporal migratory groups when moving through a fjord lake. Parr movement into
Western Brook Pond and the estuary of Western Brook are highly likely yet not proven.

93
References: Allen, K. R. 1969. Limitations on production in salmonid populations in streams. H.R.
MacMillan Lectures in Fisheries. University of British Columbia. 3 – 18. Anderson, T. C., and B. P. McDonald. 1978. A portable weir for counting migrating
fishes in rivers. Fish. Mar. Sev. Tech. Rep. 733: 13p. Anderson, W. G., R. S. McKinley, and M. Colavecchia. 1997. The use of clove oil as an
anesthetic for rainbow trout and its effects on swimming performance. North American Journal of Fisheries Management 17: 301 – 307.
Anions, M. F. E. 1994. The freshwater fish of Gros Morne National Park, resource
description and analysis. Gros Morne National Park. 69 p.
Arnesen, A. M., H. K. Johnsen, A. Mortensen, and M. Jobling. 1998. Acclimation of Atlantic salmon (Salmo salar L.) smolts to ‘cold’ sea water following direct transfer from fresh water. Aquaculture 168: 351 – 367.
Ball, B. 1991. Salmonid management study, Gros Morne National Park, 1987 –
1990 field program activity report. 35 p.
Birt, T. P., J. M. Green and, W. S. Davidson. 1990. Smolting status of downstream migrating Atlantic salmon (Salmo salar) parr. Canadian Journal of Fisheries and Aquatic Sciences 47: 1136 – 1139.
Bourgeois, C. E. and M. F. O’Connell. 1986. Observations on the seaward migration of Atlantic salmon smolts through a large lake as determined by radiotelemetry and Carlin tagging studies. Canadian. Journal of Zoology 66: 685 – 691.
Brett, J. R., M. Hollands, and D. F. Alderdice. 1958. The effect of temperature on the
cruising speed of young sockeye and coho salmon. Journal of the Fisheries Research Board of Canada 15: 587 – 605.
Cunjak, R. A., E. M. P. Chadwick, and M. Shears. 1989. Downstream movements and
estuarine residence by Atlantic salmon (Salmo salar). Canadian Journal of Fisheries and Aquatic Sciences. 46: 1466 – 1471.
Cunjak, R. A., R. L. Saunders, and E. M. P. Chadwick. 1990. Seasonal variations in the
smolt characteristics of juvenile Atlantic salmon (Salmo salar) from estuarine and riverine environments. Canadian Journal of Fisheries and Aquatic Sciences 47: 813 – 820.
Cunjak, R.A. 1992. Comparative feeding, growth and movement of Atlantic salmon parr from riverine and estuarine environments. Ecology of Freshwater Fish. 1: 26 – 34.

94
Dickoff, W. W., C. V. W. Mahnken, W. S. Zaugg, F. W. Waknitz, M. G. Bernard, and C. V. Sullivan. 1989. Effects of Temperature and feeding on smolting and seawater survival of Atlantic salmon (Salmo salar). Aquaculture 82: 93 – 102.
Duston, J., R. L. Saunders, and D. E. Knox. 1991. Effects of increases in freshwater
temperature on loss of smolt characteristics in Atlantic salmon (Salmo salar). Canadian Journal of Fisheries and Aquatic Sciences 48: 164 – 169.
Environment Canada. 1996. The Canadian climate and water information and data site
[online] Available: http://www.cmc.ec.gc.ca/climate/normals/NFLD001.htm (04/12/00)
Erkinaro, J., and R. J. Gibson. 1997. Interhabitat migration of juvenile Atlantic salmon in a Newfoundland river system Canadian Journal of Fish Biology 51: 373 – 388.
Erkinaro, J., M. Julkunen, and E. Niemela. 1998a. Migration of juvenile Atlantic salmon
Salmo salar in small tributaries of the subarctic River Teno, northern Finland. Aquaculture 168: 105 – 119.
Erkinaro, J., E. Niemela, A. Saari, Y. Shustov, and L. Jorgensen. 1998b. Timing of
habitat shift by Atlantic salmon parr form fluvial to lacustrine habitat: analysis of age, distribution, growth, and scale characteristics. Canadian Journal of Fisheries and Aquatic Science 55: 2266 – 2273.
Groot, C. 1965. On the orientation of young sockeye salmon (Oncorhynchus nerka)
during their seaward migration out of lakes. Behaviour, Suppl. No. 14. Hansen, L. P., B. Jonsson, and K. B. Doving. 1984. Migration of wild and hatchery
reared smolts of Atlantic salmon, Salmo salar L., through lakes. Journal of Fish Biology 25: 617 – 623.
Hansen, L. P., 1987. Growth, migration and survival of lake reared juvenile anadromous Atlantic salmon (Salmo salar L.) Fauna norv. Ser. A 8: 29 – 34.
Huntsman, A.G. 1945. Migration of salmon parr. Journal of the Fisheries Research Board of Canada 6 (5): 399 - 402.
Hutchings, J. A. 1986. Lakeward migrations by juvenile Atlantic salmon, Salmo salar. Canadian Journal of Fisheries and Aquatic Science 43: 732 – 741.
I.C.E.S. 1984. Atlantic salmon scale reading: report of the Atlantic scale reading
workshop, Aberdeen Scotland, April 23 – 28. Jepsen, N., K. Aarestrup, F. Ǿkland, and G. Rasmussen. 1998. Survival of radio-tagged
Atlantic salmon (Salmo salar L.) and trout (Salmo trutta L.) smolts passing a reservoir during seaward migration. Hydrobiologia 371/372: 347 – 353.

95
Johnson, W. E., and C. Groot. 1963. Observations on the migration of young sockeye
salmon (Oncorhynchus nerka) through a large complex lake system. Journal of the Fisheries Research Board of Canada 20: 919 – 938.
Jonsson, B., and J. Ruud-Hansen. 1985. Water temperature as the primary influence on
timing of seaward migrations of Atlantic salmon (Salmo salar ) smolts. Canadian Journal of Fisheries and Aquatic Sciences 42: 593 – 595.
Kallberg, H. 1958. Observations in a stream tank of territoriality and competition in
juvenile salmon and trout (Salmo salar L. and S. trutta L.). Institute of Freshwater Research, Drottningholm 39: 55 – 98.
Keene, J. L., D. L. G. Noakes, R. D. Moccia, and C. G. Soto. 1998. The efficacy of clove
oil as an anaesthetic for rainbow trout, Oncorhynchus mykiss (Walbaum). Aquaculture Research 29: 89 – 101.
Kerekes, J. J. 1994. Western Brook Pond. Pp. 284 – 293. In: Allan, R.J. et al. (eds.).
The book of Canadian Lakes. Canadian Association on the Water Quality, Monograph No. 3. Canada Centre for Inland Waters, Burlington, Ont. 598p.
Lundqvist, H., W. C. Clarke, and H. Johansson. 1988. The influence of precocious sexual
maturation on survival to adulthood of river stocked Baltic salmon, Salmo salar, smolts. Holarctic Ecology 11: 60 – 69.
McCormick, S. D., R. A. Cunjak, B. Dempson, M. F. O’Dea, and B. Carey. 1999.
Temperature-related loss of smolt characteristics in Atlantic salmon (Salmo salar) in the wild. Canadian Journal of Fisheries and Aquatic Science Vol. 56: 1649 – 1658.
O’Connell, M. F., and E. G. M. Ash. 1989. Atlantic salmon (Salmo salar) smolt
production in a Newfoundland river system characterized by lacustrine habitat. Int. Revue ges. Hydrobio. 74 (1): 73 – 82.
Pepper, V. A. 1976. Lacustrine nursery areas for Atlantic salmon in insular
Newfoundland. Fish. Mar. Serv. Tech. Rep. 671: 61 pp. Pepper, V. A., N. P. Oliver, and R. Blundon. 1985. Evaluation of an experiment in
lacustrine rearing of juvenile anadromous Atlantic salmon. North American Journal of Fisheries Management 5: 507 – 525.
Ryan, P. M. 1986. Lake use by wild anadromous Atlantic salmon, Salmo salar, as an
index of subsequent adult abundance. Canadian Journal of Fisheries and Aquatic Science 43: 2 – 11.

96
Saunders, R. L. 1968. An evaluation of two methods of attaching tags to Atlantic salmon smolts. Progressive Fish-Culturist 30: 104 – 109.
Solomon, D. J. 1978. Some observations on salmon smolt migration in a chalkstream.
Journal of Fish Biology 12: 571 – 574.
Thorpe, J. E., and R. I. G. Morgan. 1978. Periodicity in Atlantic salmon Salmo salar L., smolt migration. Journal of Fish Biology 12: 541 – 548.
Thorpe, J. E., L. G. Ross, G. Struthers, and W. Watts. 1981. Tacking Atlantic salmon
smolts, Salmo salar L., through Loch Voil Scotland. Journal of Fish Biology 19: 519 – 537.
Thorpe, J. E. 1984. Downstream movements of juvenile salmonids: a forward speculative
review. In Mechanism of migration of fishes. Edited by J. D. McCleave, G. P. Arnold, J. J. Dodson, and W. H. Neill. Plenum Press, New York and London. pp. 387 – 396.
Tytler, P., J. E. Thorpe, and W. M. Shearer. 1978. Ultrasonic tracking of the movements
of Atlantic salmon smolts (Salmo salar L.) in the estuaries of two Scottish rivers. Journal of Fish Biology 12: 575 – 586.
Wedemeyer, G. A., R. L. Saunders, and W. C. Clarke. 1980. Environmental factors
affecting smoltification and early marine survival of anadromous salmonids. Mar. Fish. Rev. 42: 1 – 14.

97
Chapter 4 – Estimates of Atlantic smolt production by the
Western Brook system, Newfoundland
Abstract:
The production of Atlantic salmon smolts by the Western Brook system was
estimated by electrofishing, fish-counting fence data, and a mark-recapture experiment.
The production estimates are for use in preliminary assessment purposes of this
watershed for Gros Morne National Park, Newfoundland. Parr densities for the two
tributaries of this system were not significantly different within the same year, however,
smolt production was greater for Western Brook due to greater area of suitable rearing
habitat. No significant difference in parr densities were noticed between years sampled
for the same tributary. Estimates of smolt production (1998 – 2000) in the Western
Brook system indicated 7 500 – 11 000 smolts produced in one migratory season. The
results indicate a substantial contribution by the fiord lake, Western Brook Pond, to the
production of smolts for this system.

98
Introduction:
Knowledge of the production of emigrating smolts for a river system is often
required for the management of the Atlantic salmon populations (Chadwick 1985,
Dempson & Stansbury, 1991). Smolts are the last stage in the life cycle of Atlantic
salmon that can be censused before fishing mortality occurs. Quantifying changes in
smolt abundance and age composition can indicate stock problems requiring management
attention, and can be a good measure of enhanced production due to management (Power
1985).
Atlantic salmon smolt production has been estimated using a variety of
parameters. Estimates of standing parr density for a river system have been used to
predict the number of smolts to be produced the following year. This method is based on
the area of habitat that is available to rear parr. However, this method often is
accompanied by large confidence limits causing both over- and under-estimations of
smolt production (Baglinière et al. 1993, Chadwick and Green 1985).
Total counts or complete census sampling have also been used to try to estimate
Atlantic salmon smolt production. A complete enumeration of the smolts caught exiting
a system or a tributary is often coupled with the efficiency of the sampling gear, most
often a fish-counting fence or fish way, to estimate the total run of smolts for a year
(Saunders et al. 1967, Chadwick 1981, Chadwick and Green 1985, Baglinière et al. 1993,
Cunjak and Therrien 1998). Counting smolts at traps is considered the most accurate
method for determining their abundance of smolts (Power 1985). However, traps work
best in rivers that are small with relatively low discharges. In this situation, efficiencies
are high and smolt mortalities are not substantial (Chadwick 1985). In larger river

99
systems, which have high fluctuations in discharge, obtaining a complete count may not
be feasible.
An alternate method of estimating smolt production is by the enumeration of
adults. Fish-counting fences and fish ways have been used to enumerate the number of
adults returning to a river to spawn. Chadwick and Green (1985) used counts of adults to
calculate smolt production for Western Arm Brook. Previous studies have quantified
survival of Atlantic salmon at sea from smolt to adult stages (Saunders et al. 1967,
Hansen 1988). Applying the likelihood of survival to adult stage to the number of adults
that did return can yield an estimate of smolt production for the previous year.
In situations where total counts are not feasible, mark-recapture estimates of
salmon smolt populations have been employed. Many estimates of abundance have been
based on the single census Petersen formula (Ricker 1975). Assumptions associated with
the such an estimate are: (1) the population is closed (i.e., additions or losses to the
population are negligible during the time of study); (2) fish do not loose there marks; (3)
fish are correctly identified as marked or unmarked; (4) marking does not affect the
catchability of the fish; and (5) marked and unmarked smolts mix randomly in the
population (Ricker 1975, Dempson and Stansbury 1991). However, this estimator may
not be appropriate when applied to migrating populations, especially if the assumptions
of constant probability of capture, closed population, and random mixing of marked and
unmarked individuals are not met (Seber 1982). Previous studies have employed a
maximum likelihood estimate (Darroch 1961) for stratified populations (Dempson and
Stansbury 1991, Schwarz et al. 1994, Schwarz et al. 1997). This type of estimate takes
into account differences in the probability of capture/recapture during stratified sampling

100
occasions. Estimation using this type of technique requires a large number of smolts to
be marked over the stratified time period. A large number of individuals must also be
recaptured during each sampling occasion. The Petersen formula may be employed by
default in situations of low numbers (Schwarz et al. 1994).
The potential freshwater production of Atlantic salmon smolts was historically
attributed to the amount of rearing habitat available to parr (Elson 1975). However,
previous studies have shown that, in Newfoundland, juvenile Atlantic salmon rear
extensively in lacustrine habitat and, therefore, these habitats should be considered when
estimating smolt production (Pepper 1976, 1985, Chadwick and Green 1985, Hutchings
1986, Ryan 1986, O’Connell et al. 1989).
Smolt production in lakes has been difficult to estimate. Chadwick and Green
(1985) used a combination of a total census of emigrating smolts as well as electrofishing
density estimates of fluvial parr to calculate that 67 % of smolts were produced in
lacustrine habitats of Western Arm Brook. Mark-recapture estimates have also been used
(Ryan, 1986), as well as censusing smolts emigrating out of a lake (O’Connell and Ash
1989). Dempson et al. (1996) compared empirical and back-calculated growth of
lacustrine versus fluvial reared Atlantic salmon parr, and concluded that as many as 75 %
of the juveniles had used lakes for rearing, further indicating the importance of lakes to
smolt production.
The purpose of this study was to provide a preliminary estimate of Atlantic smolt
production for the Western Brook system, Newfoundland, based on direct enumeration,
standing parr densities, and mark-recapture data. An estimate of the contribution to smolt
production from Western Brook Pond, a large fjord lake, to the overall production in the

system is discussed. Information pertaining to Atlantic salmon smolt production for this
catchment is scarce. Dependable estimates of smolt production would be invaluable for
the management of the salmon populations in Gros Morne National Park.
Methods:
Electrofishing:
Electrofishing surveys in 1998, 1999 and 2000 were used to estimate the density
of parr in the fluvial portions of the system. Five sites were located on Stag Brook and
six on Western Brook (Figure 4.1).
Figure 4.1: Map showing the Western Brook Pond river system and the location of fyke
trap sampling sites, fish-counting fence, and electrofishing sites for 1999 – 2000.
101

102
The sampling sites represented the habitat types found in the river, which
included riffles, runs, and flats. Sampling was carried out during the last week of July
and the first week of August in all years as the low water conditions needed for sampling
persisted over this time period. Sites were blocked off with barrier nets of 0.5 cm mesh
and the area corralled by the nets was measured. The enclosed sections were
electrofished 3 to 4 times (sweeps). After each sweep, captured salmon parr were
anesthetized (using 40 ppm clove oil/ethanol bath)(Anderson et al. 1997), measured for
length and weight, sampled for scales, and retained in a live-box until the end of
sampling for that site.
Stag Brook was surveyed for the occurrence of riffles, runs, flats and pools from
its headwaters to its mouth. Measurements of river length and width were taken using
tape measures at each of these habitat types for subsequent calculation of the area of
suitable rearing habitat for juvenile Atlantic salmon. The area of suitable parr rearing
habitat was used to estimate the density of parr in Stag Brook from 1998 - 2000.
Western Brook was previously surveyed for the occurrence of particular habitat types by
Hickey (1983). Measurements of habitat length and width were carried out manually
(with a tape measure) and with aerial photographs for calculation of the area of suitable
parr rearing habitat for the brook. The area of suitable parr rearing habitat reported by
Hickey (1983) was used in this study to estimate the density of parr in Western Brook for
1998 and 1999. Elevated water levels made electrofishing impossible in 2000 and,
therefore, parr densities for this river were unattainable for Western Brook.
The sampled scales were aged to determine the age distribution of parr captured
in each river. This distribution was then used to predict the number of parr age ≥ 2

103
contributed to smolt production the following year (the vast majority of smolts exiting
this system are age 3; see Chapter 3). A survival rate of 30 % from summer parr to
spring smolts (Cunjak and Therrien 1998) was used to estimate smolt production using
age 2 or greater parr densities.
Counting Fence Operations:
In 1999 a fish-counting fence was constructed just below the head of tide on
Western Brook (Figure 4.1). This fish counting fence was constructed of aluminum
conduit spaced 6 mm apart and had both an upstream adult trap and a downstream smolt
trap (Anderson and McDonald 1978). It was operational from June 3 to September 8.
Adult Atlantic salmon captured in the upstream fish trap were counted, identified
as grilse or multi-winter sea adult, and sexed. All adults were also measured for length
and weight, and sampled for scales.
Using a return rate of 4-6 % (C. Mullins pers. comm. D. F. O., Newfoundland), an
estimate of the previous year’s smolt production for the entire system was calculated
from the count of adult grilse spawners caught at the counting fence.
The fish-counting fence was intended to give a total count of smolts exiting the
Western Brook system in 1999. Smolts captured in the trap were observed for any marks
administered at upstream marking sites. A sub-sample of ten smolts per day was
anesthetized and measured for length and weight.
The efficiency of the smolt fence with 6 mm spacing between the conduits was
tested. A fyke net was placed approximately 500 m upstream from the fish-counting
fence and smolts captured were given upper caudal fin clips (UCFC). The efficiency of

104
the smolt-counting trap was then applied to the number of Atlantic salmon smolts caught
exiting the system in 1999 to estimate the total number of smolts produced by the system
for that year.
Mark – Recapture:
Upstream Marking Site – Stag Brook:
Two fyke traps (18 mm mesh size) were set in Stag Brook on May 30, 2000
(Figure 4.1). The traps were fitted with wood boxes at their cod end to reduce mortality
due to capture. Captured smolts were anesthetized using a 40 ppm clove oil bath and
measured for fork-length and weight.
A Panjet dental inoculator was used to administer Alcian Blue tattoos to the
ventral body surface, just anterior to the pelvic girdle (Hart & Pitcher 1969, Moffett et al.
1997). This location was chosen due to its lack of pigmentation that made the mark
easily distinguishable.
Individually numbered Carlin tags were also used to mark migrating smolts. The
green plastic tags were attached just anterior of the dorsal fin with double polyethylene
monofilament thread. All individuals were marked with an anal fin clip (AFC) to create a
check on tag or tattoo loss. Marked smolts were held for 24 hours to observe mortalities
that may have been due to marking.
When marking, the total number of smolts captured by both fyke traps was
assessed. Half of these smolts were then given Panjet tattoos and the other half were
given Carlin tags.

105
Downstream Recapture Site – Western Brook:
Five fyke traps were positioned approximately 440 m downstream from Western
Brook Pond on June 14, 2000. This site was approximately 5 km from where smolts were
marked in Stag Brook (Figure 4.1). A fyke trap was used to capture and mark smolts
approximately 300 m upstream from the main trapping site on this river. Recaptures
from this marking site were used to calculate efficiency of the five fyke traps, for
estimating the total number of smolts emigrating from Western Brook Pond (Figure 4.1).
The captures at this site were checked carefully for marks administered in Stag Brook.
Recaptures were anesthetized and re-measured for length and weight. By subtracting the
estimate of smolt produced in Stag Brook for the same year, an estimate of the smolt
production of the lake was reached.
Statistical Analyses:
Densities of salmon parr were calculated using catch-depletion data and the
removal method (Zippin 1956, Seber 1982). This analysis gave maximum-likelihood
estimates of population size (Ñ) and the percentage of the population captured after 3 – 4
sweeps for a site. Interannual comparisons of parr density for both Stag Brook and
Western Brook were done by General Linear Model analysis followed by pairwise
difference testing. Student’s t-tests were preformed to compare parr densities between
the two brooks for 1998 and 1999.
The mark-recapture data were used in a single census Petersen method to estimate
the population of smolts exiting the system in 2000.

The Petersen estimate is calculated in the following manner (Chapman 1951):
Ñ = [(M + 1)(C+1) (R + 1)] - 1
106
where Ñ = size of population at time of marking
M = number of fish marked
C = catch or sample taken for census
R = number of recaptures in the sample
The variance estimate for Ñ (Seber 1970) is:
V(Ñ) = [(M + 1)(C + 1)(M – R)(C – R)] [(R + 1)2(R + 2)]
The 95 % confidence intervals for the population size (Lohr 2000) were calculated using: ________
Ñ ± 1.96 √ V(Ñ)
Results:
a) Estimate of smolt production in Stag Brook and Western Brook using parr
densities calculated from electrofishing data:
Although a slight decrease in mean parr density (number of fish per 100 m2) in
Stag Brook from 1998 – 2000 occurred, General Linear Model analysis showed that this
difference was not significant (P > 0.05). The same analysis indicated there was no
significant change in the parr density of Western Brook between 1998 and 1999. The
comparison of parr density between tributaries within the same year showed no
significant difference (P > 0.05)(Figure 4.2).

0
10
20
30
40
50
60
StagBrook
WesternBrook
StagBrook
WesternBrook
StagBrook
WesternBrook
Tributary
Den
sity
(# o
f fis
h pe
r 10
0 m
2 )1998 1999 2000
Figure 4.2: Yearly changes in the density (+ 1 SD) of Atlantic salmon parr aged ≥ 2 +
years at electrofished sites on Stag Brook and Western Brook.
The calculated parr density in Stag Brook in 1998 was 32.80 parr/100 m2
(Table 4.1). Total parr rearing habitat in Stag Brook was estimated as 82 334 m2 by this
study. Therefore the total number of parr in Stag Brook was estimated at 27 006, in
1998. 33 % of parr captured during electrofishing were age 2 or 3. Applying this
percentage to the estimated total number of parr in Stag Brook in 1998 yields an estimate
of 8 912 parr ≥ age 2. Assuming a survival of 30 % for Atlantic salmon from the parr to
smolt stage (Cunjak and Therrien 1998), an estimated 2 674 smolts was predicted from
Stag Brook in 1999 (Table 4.1).
107

108
Table 4.1: Estimated Atlantic salmon smolt production derived from parr densities
estimated from electrofishing Stag Brook and Western Brook from 1998 – 2000.
Estimate of Estimate of Estimate of Year Density Parr Pop. Age 2-3 Parr Smolt Production(n) Tributary (# fish/100 m2) (N) in Population (year n + 1)
1998 Stag Brook 32.80 27006 8912 2674
Western Brook 20.54 34049 11236 3371
1999 Stag Brook 25.41 20921 6904 2071 Western Brook 22.35 37050 12226 3668
2000 Stag Brook 18.27 15042 4964 1489 Western Brook n/a n/a n/a n/a
Means Stag Brook 25.49 20987 6926 2078 Western Brook 21.45 35558 11734 3520
The same calculations were carried out for Stag Brook densities in 1999 and
2000. The estimated smolt production in Stag Brook was greatest for 1999 when
compared to 2000 and 2001. The estimate of smolt production for 2001 was the lowest
of all three years sampled (Table 4.1). The estimated smolt production for this tributary
ranged from 1 489 – 2 674, with the average being 2 078.
In Western Brook, the estimated the area of suitable parr rearing habitat was
165 770 m2 (Hickey 1983). The parr density in Western Brook from electrofishing data in
1998 was 20.54 parr / 100 m2 (Table 4.1). The proportion of parr age ≥ 2 in Western
Brook was 33 %, the same as in Stag Brook, and the survival from parr to smolt was
again assumed to be 30 % (Cunjak and Therrien 1998). Therefore, the predicted smolt

109
production in Western Brook in 1999 was 3 371 (Table 4.1). Predicted smolt production
for 2000 was 3 668, and the mean for the two years was 3 520 (Table 4.1).
Using this method of estimation the sub-catchments were predicted to have
produced an average of 5 598 smolts per year from 1999 – 2001. However, this estimate
does not take into consideration the number of smolts that may be produced from parr
rearing in Western Brook Pond and the steadies of Western Brook.
b) Estimate of Western Brook Pond smolt production using fyke trap efficiency
data:
A total of 916 smolts was captured emigrating from Western Brook Pond in 2000.
The efficiency of capture was 12 % (5 smolts recaptured out of 42 marked). Therefore
the total number of smolts that may have migrated past this site in 2000 was 7 633.
However, this number includes smolts produced in Stag Brook that migrate though the
lake in the same year (Chapter 3). If the estimated number of smolts produced in Stag
Brook in 2000 (using the electrofishing data for 1999, Table 4.1) is subtracted from the
above estimate, smolt production by the lake in 2000 was:
7 633 – 2 071 (Stag Brook) = 5 562 smolts
Therefore, the total production of smolts for the entire river system using the above
estimates was:
2 071 (Stag Brook) + 5 562 (Western Brook Pond) + 3 668 (Western Brook)
= 11 301 smolts (Table 4.2)

110
c) Estimate of 1997 Western Brook system smolt production using the number of
migrating adult salmon captured in 1998:
The number of Atlantic salmon grilse (1 sea winter) captured moving upstream at
the Western Brook fish fence in 1998 was 213. Using a 4-6 % smolt to adult survival
coefficient (C. Mullins, pers. comm., D. F. O. Newfoundland) then the total number of
smolts emigrating out of the system in 1997 was between 3 550 – 5 325 (Table 4.2).

111
Table 4.2: Estimates of yearly smolt production created by electrofishing, enumeration
and mark-recapture data for Stag Brook, Western Brook Pond, Western Brook, and the
system as a whole.
Smolt Technique of Estimated SmoltYear Estimation Water Body Production
1997 Enumeration Total system 3 550 – 5 325
lectrofishing Western Brook Pond 2 490 - smolts)
2000 Electrofishing Stag Brook 2071
99) Western Brook
numeration Western Brook Pond 5 562 00)
Total system 11 301
ark-Recapture Stag Brook + 14 861 ± 5 081
) Western Brook Pond
(fish fence 1998 - adults)
1998 Enumeration Total system 5 383 – 8 075 (fish fence 1999 - adults)
1999 Enumeration Total system 8 535 (fish fence 1999 - smolts)
Enumeration & E(fish fence 1999
(parr density 1998)
(parr density 19 3668 E (fyke traps 20
M(Petersen formula

112
) Estimate of 1998 Western Brook system smolt production using the
aptured moving upstream at
e We
98
) Estimate of total smolt production using the total count of smolts exiting the
leaving the system at the mouth of Western
Estimate of smolts produced in Western Brook Pond in 1999 using the total count
of Atlantic salmon smolts leaving the system in 1999 was 8 535
olts
d
number of migrating adult salmon captured in 1999:
The number of Atlantic salmon grilse (1 sea winter) c
th stern Brook fish fence in 1999 was 323. Using the same 4-6 % smolt to adult
survival coefficient, then the total number of smolts emigrating out of the system in 19
was between 5 383 – 8 075 smolts (Table 4.2).
e
system in 1999 through the fish fence:
The total number of smolts counted
Brook in 1999 was 1707. However, the efficiency of the smolt fence was estimated at
20 %. As a result, the estimate of smolts leaving the system in 1999 was 8 535 smolts
(Table 4.2).
f)
of smolts exiting the system in 1999 and 1998 parr densities of Stag Brook and
Western Brook:
The estimate
(Table 4.2). By subtracting the predicted smolt production of both Stag Brook and
Western Brook for 1999, which was estimated using the parr densities in these two
tributaries in 1998 (Table 4.1), the production of smolts in the lake can be isolated:
8 535 (total) – 2 674 (Stag Brook) – 3 371 (Western Brook) = 2 490 lake sm
(Table 4.2).

113
mark-recapture data for the 2000 field season:
umber of
was
ars
iscussion:
arr densities gained by electrofishing from 1998 – 2000 indicate that the
l
ious studies (Porter et al. 1974, Hickey 1983, Ball 1991) do not supply parr
g) Petersen estimate using
The total number of smolts marked in Stag Brook was 470. The total n
captures at the Western Brook Pond site was 916. The total number of recaptures was 28
(Chapter 3). The Petersen method yielded an estimate of 14 861 ± 5 081 (95 %
confidence interval) of smolts from both Stag Brook and the lake. This estimate
higher than the other estimate for 2000, and higher than smolt estimates in previous ye
for the upper portion of the system (Table 4.2).
D
The p
density of parr in both Stag Brook and Western Brook pond were stable over the three
years sampled. The higher parr densities and smolt production estimates in Stag Brook
compared to Western Brook are in contrast to Hickey (1983), who reported little potentia
rearing habitat in this tributary. However, these results coincide with the opinion of Ball
(1991) that Stag Brook was responsible for a significant amount of juvenile production in
the system.
Prev
densities and do not take into account Western Brook Pond or the three steadies of
Western Brook when estimating smolt production. Sampling by electrofishing was
restricted to the lower reaches of Stag Brook and barrier nets were not always used
(Hickey 1983, Ball 1991).

114
Low flow areas (i.e., steadies) of the system were not sampled. Possible
utilization of these steadies by Atlantic salmon parr may have caused underestimation of
smolt production for the Western Brook (Pepper 1976, 1985, Chadwick and Green 1985,
Hutchings 1986, Ryan 1986, O’Connell et al. 1989). However, when compared to
estimates derived from different sampling techniques, the predicted production of smolts
in Stag Brook and Western Brook are realistic. Furthermore, by supplementing the
estimated smolt fluvial smolt production with an estimate of production by Western
Brook Pond using enumeration and trap efficiency data, a more complete estimate of
production for the system was reached.
Estimations of smolt production were approximately equal for 1997 – 1999.
However, the estimate of smolt production for 2000 was greater than in any other year.
The estimate of smolt production for 1997 is likely low since adult salmon were observed
squeezing between the conduit of the fence and it is unknown how many individuals did
this. However, count of grilse caught at the fence in 1999 was almost twice that in 1998.
The estimate of smolt production in 1998 is likely a good one as the efficiency of the fish
counting fence in 1999 was greatly improved. However, smolt to adult survival was not
determined for the Western Brook river system. Rather, a survival rate of 4 – 6 % from
nearby Western Arm Brook (Mullins and Caines 2000) was used in the present study.
Western Arm Brook is located approximately 180 km north of the Western Brook and
was considered representative of Northern Peninsula rivers. The rate of smolt to adult
survival used in this study seems applicable since the estimate of smolt production by
direct enumeration of smolts in 1999 was quite close. The efficiency of the fish-counting
fence for smolt capture in 1999 was 20 %, which is low. Smolts were observed

115
swimming between conduits that were spaced only 6 mm apart, something not reported
previously. The predicted number of smolts exiting the system in 1999 by direct
enumeration is also similar to the estimate of smolt production for the same year using
parr densities in 1998. Consequently, the estimate of efficiency for the fish fence is
reasonable. Previous attempts at smolt enumeration for the system were generally
unsuccessful due to improper location of the fish fence and a series of high water events
(Ball 1990, Anions 1997).
The estimated increase in smolt production from 1997 – 2000 by the Western
Brook system is in contrast to Mullins and Caines (2000), who reported a decline in smolt
production in each successive year in the Western Arm Brook system. In 1997, the
number of smolts leaving Western Arm Brook was 23 845, and by 2000 only 12 691
smolts were produced by the system (Mullins and Caines 2000). The estimate of smolt
production for the Western Brook system in 2000 may be overestimated due to the
predicted number of smolts produced in the pond. The number of smolts produced by
Western Brook Pond was estimated through enumeration and testing the efficiency of the
traps used in enumeration. The efficiency of these traps was tested later in the smolt run
(July 6 – 22) when the river discharge was relatively low. The efficiency of these traps
may have been greater earlier in the run and therefore the estimate of smolt production by
Western Brook Pond may be slightly inflated. The estimate of lake production, using the
estimated parr density of Stag Brook and Western Brook (1998) subtracted from the total
production of the system in 1999 (as predicted by direct enumeration), indicates
approximately 3 000 less smolts produced by the lake in 1999 than in 2000. This further
indicates that the 2000 prediction of smolt production by the lake was inflated.

116
Despite possible inaccuracies with the estimate of smolts produced by Western
Brook Pond, it is clear that this lake contributes significantly to the production of smolts
in the Western Brook system. The predicted contribution of Western Brook Pond to total
smolt production in the entire system ranged from 30 % in 1999 to as high as 50 % in
2000. From the difference between a total census of emigrating smolts and fluvial
standing parr density, Chadwick and Green (1985) estimated that 67 % of the smolts
produced in Western Arm Brook, Newfoundland, came from lacustrine habitats.
Therefore, estimates of lacustrine smolt production for the Western Brook system are
realistic. Dempson et al. (1995), through analysis of scale characteristics, estimated that
75 % of parr sampled in the Conne River, Newfoundland, used lakes for rearing.
Although confirmation of migration to Western Brook Pond by salmon parr from Stag
Brook is not available, the large number of smolts caught exiting the lake in 2000 relative
to the number of smolts enumerated exiting the system in 1999 indicates some degree of
parr rearing and a substantial contribution to smolt production by the fjord lake.
The mark-recapture estimate was used to quantify production for the upper
portion of the system (i.e., Stag Brook and Western Brook Pond). The numbers marked,
captured, and recaptured were not sufficient to use stratification estimation techniques
(Schwarz et al. 1994). As a result, a single-census Petersen estimate was employed by
default. The estimated production of the upper part of the Western Brook system using
the Petersen estimate was high (14 861 ± 5 081), likely due to the low numbers of smolts
tagged and recaptured.
When using the Petersen index for research interests, where the population
estimate will be used as a stepping-stone to further research endeavors, the margin of

117
error divided by the estimated population size (ME / Ñ) is expected to be ≤ 10 %, (pers.
comm., C. Schwarz via C. Mullins, D. F. O.). An ME / Ñ ≤ 20 % is acceptable for
management purposes (pers. comm., C. Schwarz via C. Mullins, D. F. O.). However, an
ME / Ñ ≤ 50 % is considered acceptable for preliminary surveys of populations (pers.
comm., C. Schwarz via C. Mullins, D. F. O.). The estimate of smolt production for the
Western Brook system was known to be a preliminary survey from the beginning of this
project as little previous work had been completed in this regard. The smolt population
generated using the mark-recapture data from this study is 14 861, with a margin of error
equal to 5 081. Therefore, the range of smolt production from this method is 9 811 – 19
973 for Stag Brook and Western Brook Pond combined and the ME / Ñ = 34 %.
Although the ME / Ñ is less than 50%, the estimate seems too large for this part of the
system when compared to the estimates generated by other techniques. If a smolt
population within Stag Brook and Western Brook Pond of approximately 7 600
individuals is inferred from the others methods of estimation, and the numbers gained by
the mark-recapture experiment are used, the number of recaptures expected was 57 at a
standard error of 24 %. This standard error is well under the 50 % put forth by Schwarz
(pers. comm., via C. Mullins, D. F. O.) for preliminary survey purposes and close to that
usable for management purposes. However, less than half the expected marked smolts
were recaptured. To reach a confidence interval of 10 % with the number of individuals
marked and captured, 180 recaptures were needed. It seems most likely that a lack of
recapture success occurred in this study. The assumptions of constant probability of
capture and random mixing of marked and unmarked individuals may have been
compromised since the distance traveled between the marking site and recapture site was
118
through a lake. Reductions in migratory speed (Chapter 4) may have caused inaccuracies
in the Petersen estimate. As a result, the estimates generated by electrofishing parr
density and enumeration of adults and smolts are likely more reliable.
Due to the error associated with each type of estimating technique, a reliable
estimate of smolts produced by the system is not possible. However, the range in smolt
production created by most of the estimation techniques provides reasonable bounds for
production in the Western Brook system. The contribution by the upper part of the
system (Stag Brook and Western Brook Pond) may be as high as 75 % of total smolt
production.
This paper documents the first successful estimates of Atlantic salmon parr
density and both adult and smolt enumeration for the system. Information pertaining to
the production of juvenile Atlantic salmon by the Western Brook system was scarce.
The results of this study are a successful step in the monitoring of this system, and it
presents baseline information on the juvenile salmon population therein. Recent
proposals to increase the amount of tourism and research on Western Brook Pond may
have impact on the Atlantic salmon community there. This study provides a reference
point for the future monitoring of the effects of increased anthropogenic disturbance.

119
Conclusions:
Despite a predicted decline in Atlantic salmon smolt production from 1998 –
2000, parr densities within Stag Brook and Western Brook were similar and stable.
Enumeration and standing parr density estimates gave similar results for predicted smolt
production. Estimates of smolt production (1998 – 2000) in the Western Brook system
indicated 7 500 – 11 000 smolts produced in one migratory season. The use of the
Petersen formula was not successful in determining the smolt production of Stag Brook
and the fjord lake. However, a substantial contribution (30 – 50 %) by Western Brook
Pond to the total smolt production in the system was evident.

120
References:
Anderson, T. C., and B. P. McDonald. 1978. A portable weir for counting migrating fishes in rivers. Fish. Mar. Serv. Tech. Rep. 733: 13p.
Anderson, W. G. , R. S. McKinley, and M. Colavecchia. 1997. The use of clove oil as an anesthetic for rainbow trout and its effects on swimming performance. North American Journal of Fisheries Management 17: 301 – 307.
Anions, M. F. E. 1994. The freshwater fish of Gros Morne National Park, resource description and analysis. Gros Morne National Park. 69 p.
Ball, B. 1991. Salmonid management study, Gros Morne National Park, 1987 – 1990
field program activity report. 35 p. Baglinière, J. C., G. Maisse, and A. Nihouarn. 1993. Comparison of two methods of
estimating Atlantic salmon (Salmo salar) wild smolt production. p. 189 – 201. In R.J. Gibson and R. E. Cutting [ed.] Production of juvenile Atlantic salmon, (Salmo salar, in natural water. Canadian Journal of Fisheries and Aquatic Sciences 118.
Chadwick, E. M. P. 1981. Biological characteristics of Atlantic salmon smolts in
Western Arm Brook, Newfoundland. Canadian Technical Report of Fisheries and Aquatic Sciences, No. 1024.
Chadwick, E. M. P. 1985. Fundamental research problems in the management of
Atlantic salmon, Salmo salar L., in Atlantic Canada. Journal of Fish Biology 27: (Suppl. A), 9 – 25.
Chadwick, E. M. P. and J. M. Green. 1985. Atlantic salmon (Salmo salar L.) production
in a largely lacustrine Newfoundland watershed. Verh. Internat. Verein. Limnol. 22: 2509 – 2515.
Chapman, D. G. 1951. Some properties of the hypergeometric distribution with
applications to zoological sample censuses. University of California Publications in Statistics 1: 131 – 160.
Dempson, J. B. and D. E. Stansbury. 1991. Using partial counting fences and a two- sample stratified design for mark-recapture estimation of an Atlantic salmon smolt population. North American Journal of Fisheries Management 11: 27 – 37.
Elson, P. F. 1975. Atlantic salmon rivers smolt production and optimal spawning an
overview of natural production. International Atlantic Salmon Foundation Special Publication Series 6: 96 – 119.

121
Hansen, L. P. 1988. Effects of Carlin tagging and fin clipping on the survival of Atlantic salmon 9Salmo salar L.) released as smolts. Aquaculture. 70: 391 – 394.
Hart, P. J. B. and T. J. Pitcher. 1969. Field trials of fish marking using a jet inoculator. Journal of Fish Biology 1: 383 – 385.
Hickey, T. E. 1983. Preliminary assessment of Atlantic salmon habitat potential of selected streams in Gros Morne National Park, 1983. Hardy Associates (1978) Ltd. Report for Parks Canada. 19p., 17 tables, appendices, 13 photos, 21 maps.
Hutchings, J. A. 1986. Lakeward migrations by juvenile Atlantic salmon, Salmo salar.
Canadian Journal of Fisheries and Aquatic Sciences 43: 732 – 741. Lohr, S. A. 1999. Sampling design and analysis. California: Brooks/Cole Moffett, I. J. J., W. W. Crozier, and G. J. A. Kennedy. 1997. A comparison of five
external marks for Atlantic salmon, Salmo salar L. Fisheries Management and Ecology 4: 49 – 53.
Mullins, C.C., and D. Caines. MS 2000. Status of Atlantic salmon (Salmo salar L.) stocks of Lomond River, Torrent River and Western Arm Brook, Newfoundland, 1999. DFO Can. Stock Assess. Sec. Res. Doc. 2000/38, 40 p.
O’Connell, M. F., and E. G. M. Ash. 1989. Atlantic salmon (Salmo salar) smolt
production in a Newfoundland river system characterized by lacustrine habitat. Int. Revue ges. Hydrobio. 74 (1): 73 – 82.
Pepper, V. A. 1976. Lacustrine nursery areas for Atlantic salmon in insular
Newfoundland. Fish. Mar. Serv. Tech. Rep. 671: 61 pp. Pepper, V. A., N. P. Oliver, and R. Blundon. 1985. Evaluation of an experiment in
lacustrine rearing of juvenile anadromous Atlantic salmon. N. Am. J. Fish. Manage. 5: 507 – 525.
Power, G. 1985. Estimating and understanding smolt output from Atlantic salmon rivers. Pages 108 – 124 in 1885 Northeast Atlantic salmon workshop. Atlantic Salmon Federation Montreal, and New Brunswick Wildlife Federation, Moncton.
Ricker, W. E. 1975. Computation and interpretation of biological statistics of fish
populations, Bulletin of the Fisheries Research Board of Canada. Bulletin 191.
Ryan, P. M. 1986. Lake use by wild anadromous Atlantic salmon, Salmo salar, as an index of subsequent adult abundance. Canadian Journal of Fisheries and Aquatic. Sciences 43: 2 – 11.

122
Saunders, R. L. and K. R. Allen. 1967. Effects of tagging and of fin-clipping on the survival and growth of Atlantic salmon between smolt and adult stages. Journal of the Fisheries Research Board of Canada 24(12).
Schwarz, C. J. and J. B. Dempson. 1994. Mark-recapture estimation of a salmon smolt
population. Biometrics. 50: 98 – 108. Schwarz, C. J. and C. G. Taylor. 1997. Use of the stratified-Petersen estimator in
fisheries management: estimating the number of pink salmon (Onchorynchus gorbuscha) spawners in the Fraser River. Canadian Journal of Fisheries and Aquatic Sciences 55: 281 – 296.
Seber, G. A. F. 1970. The effects of trap response on tag-recapture estimates. Biometrics
26: 13 – 22. Seber, G. A. F. 1982. The estimation of animal abundance and related parameters.
MacMillan Publishing Co. Inc., New York, N.Y. 654p. Zippin, C. 1956. An evaluation of the removal method of estimating animal populations.
Biometrics 12: 163 – 189.

123
Chapter 5 – Summary and Conclusions
No significant difference in the initial rate of mortality between Atlantic salmon
smolts marked by Carlin tag versus Panjet tattoo was observed in this study . However,
Carlin tagged individuals were slightly more susceptible to mortality due to the handling,
anesthetization, and marking procedure (Hansen 1988, Kennedy 1991). Carlin tagging
caused no mortality initially or over time for individuals tagged in the hatchery
environment. Hatchery tagged individuals did not suffer any reductions in growth or
condition factor when compared to non-tagged salmon juveniles. Therefore, it seems
unlikely that the low number of recaptures in the wild can be blamed on the personal
technique of the experimenter when Carlin tagging smolts.
Panjet tattooed smolts were not recaptured at a significantly higher rate in the
field than Carlin tagged individuals, indicating that Carlin tagging can be used just as
successfully as dye injection in mark-recapture experiments. The ease of identifying
individuals with Carlin tags with individual identification numbers is a definite benefit to
this type of mark. Therefore, it appears just as acceptable to use this mode of marking in
the wild, using the protocol described earlier.
The hatchery experiment also indicated that the type of fin clip administered does
not affect growth or condition factor. However, for monitoring marked individuals past
340 degree-days, anal fin clipped juvenile Atlantic salmon may be more successfully (or
with less subjectivity) classified as marked due to a slower rate of fin regeneration over
other fins. In the warmest year sampled, 1999, the number of degree-days reached

124
approximately 937 (late May – late July) in Stag Brook, which was the tributary of
warmest temperature throughout the study. Even after 937 degree-days the regenerative
properties of all the fin types clipped, in the hatchery experiment, would not likely have
been rapid enough to allow for misidentification of marked juveniles in the field. Fin
clipped smolts and parr would have shown indication of their previous marks. Therefore,
the lack of recaptures at the outflow of Western Brook Pond must be attributed to low
trap efficiency. The estimation of smolt production for Stag Brook and Western Brook
Pond created by the mark-recapture data is not conclusive and should be treated as such.
The use of the Petersen formula was not successful in determining the smolt production
of Stag Brook and Western Brook Pond due to this low number of recaptures.
Estimates using enumeration and standing parr densities gave similar results for
smolt production by the system. Estimates of smolt production (1998 – 2000) in the
Western Brook system indicated 7 500 – 11 000 smolts produced in one migratory
season. A general increase in smolt production from 1997 – 2000 for the Western Brook
system by this study does not agree with a similar study conducted in nearby Western
Arm Brook (Mullins and Caines 2000) that described a significant decrease in smolt
production over these years. The trend observed in the present study was likely a product
of using different estimating techniques to predict smolt production for a particular year.
Despite a lack of clear evidence indicating a large scale migration of Atlantic
salmon parr into Western Brook Pond, the capture of a large number of smolts exiting the
lake in each year and population estimates indicated a substantial contribution to smolt
production by the pond. The contribution of the fjord lake may be 30 – 50 % of the total
smolt production in the system, which is in agreement with previous studies that reported

125
a large contribution to rearing and smolt production in lakes (Pepper 1976, 1985,
Chadwick and Green 1985, Hutchings 1986, Ryan 1986, O’Connell et al. 1989).
Parr migration into the fjord pond could occur from Stag Brook (downstream) or
in an upstream movement from Western Brook. Both modes of movement have been
described for Atlantic salmon parr (Huntsman 1945; Hutchings 1986; Ryan 1986;
Erkinaro and Gibson 1997; Erkinaro et al. 1998a, 1998b). The capture of parr at the
outflow of Western Brook Pond and at the mouth of Western Brook indicated possible
downstream movements at these locations; however, parr were not marked at these sites
it is not known if the parr were resident and captured repeatedly. Parr movement has
been described as preceding and accompanying smolt migration (Hutchings 1986). The
results of this study indicate that peaks in downstream parr movement may also occur
directly following a peak in smolt emigration. Parr ≥ 2 years of age were more mobile
than 1 year old parr, possibly indicating a greater likelihood of older parr moving
downstream to Western Brook Pond. Erkinaro et al. (1998b) indicated that the large
majority of parr that shifted from fluvial to lacustrine habitat in the River Teno system
(Finland) did so at an age of 2+.
Regardless of the number of parr reared and smolts produced by Western Brook
Pond, it is clear that the fjord lake is an important area for juvenile growth. The lake
produces larger and well smoltified individuals compared to Stag Brook and Western
Brook. The lake also serves as an area to increase growth of smolting individuals
migrating through the pond from Stag Brook. The distance migrated through the pond is
relatively short (3.5 km) and could be traversed in a matter of days. However, some
smolts marked in Stag Brook took as much as a month to reach the outflow of the pond at

126
Western Brook. Delays in migration are related to cooler water temperatures experienced
by fish in the lake. Increases in Western Brook Pond’s water temperature were directly
related to the start and peak of smolt migration. The compensatory advantage to
prolonging their migration to the sea is an increase in growth that may not be
accomplished in the river or estuary. It seems probable that Western Brook Pond is likely
more productive than earlier considered (Kerekes 1994). Increased growth potential is
available in the lake despite cooler temperatures throughout the migratory season. The
present study also indicates that the migration of Atlantic salmon smolts in Western
Brook Pond entails a large directed active component to migration (Bourgeois et al.
1986).
The results of this study have created questions such as: what areas and habitats of
the fjord lake are Atlantic salmon smolts using during the temperature induced delay in
migration? What sort of physiological response accompanies the migration of smolting
juveniles into a deeper lentic environment? What are the food items that resident parr and
migrant smolt feed on to increase their growth rates while in Western Brook Pond? Little
is know regarding the flora and fauna that inhabit this water system. This study presents
a minuscule piece of the puzzle. The future holds many answers regarding this beautiful
lake and its tributaries, and more importantly many more mysteries.

127
References: Bourgeois, C. E. and M. F. O’Connell. 1988. Observations on the seaward migration of
Atlantic salmon (Salmo salar L.) smolts through a large lake as determined by radiotelemetry and Carlin tagging studies. Canadian Journal of Zoology 66: 685 – 691.
Chadwick, E. M. P. and J. M. Green. 1985. Atlantic salmon (Salmo salar L.) production in a largely lacustrine Newfoundland watershed. Verh. Internat. Verein. Limnol. 22: 2509 – 2515.
Erkinaro, J., and R.J. Gibson. 1997. Interhabitat migration of juvenile Atlantic salmon in a Newfoundland river system Canadian Journal of Fish Biology 51: 373 – 388.
Erkinaro, J., M. Julkunen, and E. Niemela. 1998a. Migration of juvenile Atlantic salmon
Salmo salar in small tributaries of the subarctic River Teno, northern Finland. Aquaculture 168: 105 – 119.
Erkinaro, J., E. Niemela, A. Saari, Y. Shustov, and L. Jorgensen. 1998b. Timing of habitat shift by Atlantic salmon parr form fluvial to lacustrine habitat: analysis of age, distribution, growth, and scale characteristics. Canadian Journal of Fisheries and Aquatic Science 55: 2266 – 2273.
Hansen, L. P. 1988. Effects of Carlin tagging and fin clipping on survival of Atlantic
salmon (Salmo salar L.) released as smolts. Aquaculture, 70: 391 – 394.
Huntsman, A.G. 1945. Migration of salmon parr. Journal of the Fisheries Research Board of Canada 6 (5): 399 - 402.
Hutchings, J. A. 1986. Lakeward migrations by juvenile Atlantic salmon, Salmo salar. Canadian Journal of Fisheries and Aquatic Sciences 43: 732 – 741.
Kennedy, G. J. A., C. D. Strange, and P. M. Johnston. 1991. Evaluation of Carlin tagging
as a mark-recapture technique for estimating total river runs of salmon smolts, Salmo salar L. Aquaculture and Fisheries Management 22: 363 – 368.
Kerekes, J. J. 1994. Western Brook Pond. Pp. 284 – 293. In: Allan, R. J. et al. (eds.). The
book of Canadian Lakes. Canadian Association on the Water Quality, Monograph No. 3. Canada Centre for Inland Waters, Burlington, Ont. 598p.
Mullins, C. C., and D. Caines. MS 2000. Status of Atlantic salmon (Salmo salar L.) stocks of Lomond River, Torrent River and Western Arm Brook, Newfoundland, 1999. DFO Can. Stock Assess. Sec. Res. Doc. 2000/38, 40 p.

128
O’Connell, M. F., and E. G. M. Ash. 1989. Atlantic salmon (Salmo salar) smolt production in a Newfoundland river system characterized by lacustrine habitat. Int. Revue ges. Hydrobio. 74 (1): 73 – 82.
Pepper, V. A. 1976. Lacustrine nursery areas for Atlantic salmon in insular
Newfoundland. Fish. Mar. Serv. Tech. Rep. 671: 61 pp. Pepper, V. A., N. P. Oliver, and R. Blundon. 1985. Evaluation of an experiment in
lacustrine rearing of juvenile anadromous Atlantic salmon. N. Am. J. Fish. Manage. 5: 507 – 525.
Ryan, P. M. 1986. Lake use by wild anadromous Atlantic salmon, Salmo salar, as an index of subsequent adult abundance. Canadian Journal of Fisheries and Aquatic. Sciences 43: 2 – 11.

VITA Candidates full name: Jason Paul Dietrich Universities attended: Hon. B. Sc. Biology, Environmental Science Option,
Wilfrid Laurier University, 1998. M. Sc. Biology, University of New Brunswick, 2001. Publications: Conference Presentations: Dietrich, Jason P., and R. A. Cunjak, Influence of a large fiord
lake on the migration patterns of Atlantic salmon smolts. Canadian Conference for Fisheries Research, Jan. 2001, Toronto, ON. Dietrich, Jason P., and R. A. Cunjak, Migratory patterns of Atlantic salmon (Salmo salar) in a Newfoundland fiord lake river system. Canadian Conference for Fisheries Research, Jan. 2000, Fredericton NB.
Dietrich, Jason P and E. Kott. A comparison of the diets of juvenile Atlantic cod (Gadus morhua) and Greenland cod (Gadus ogac) over late summer at an inshore site of Newfoundland. Ontario Biology Day, Feb. 1998, Laurentian University, Sudbury, ON.