the behaviour and design of concentrically loaded t...
TRANSCRIPT

SCHOOL OF CIVIL ENGINEERING
RESEARCH REPORT R933FEBRUARY 2013
ISSN 1833-2781
THE BEHAVIOUR AND DESIGN OF CONCENTRICALLY LOADED T-SECTION STEEL COLUMNS
FRANCISCO SENA CARDOSOKIM JR RASMUSSEN

SCHOOL OF CIVIL ENGINEERING
THE BEHAVIOUR AND DESIGN OF CONCENTRICALLY LOADED T-SECTION STEEL COLUMNS RESEARCH REPORT R933 FRANCISCO SENA CARDOSO BSc MSc KIM JR RASMUSSEN MScEng PhD February 2013 ISSN 1833-2781

The behaviour and design of concentrically loaded T-section steel columns
School of Civil Engineering Research Report R933 Page 2 The University of Sydney
Copyright Notice School of Civil Engineering, Research Report R933 The behaviour and design of concentrically loaded T-section steel columns © 2013 Francisco Sena Cardoso & Kim J. R. Rasmussen [email protected] [email protected] February 2013 ISSN 1833-2781 This publication may be redistributed freely in its entirety and in its original form without the consent of the copyright owner. Use of material contained in this publication in any other published works must be appropriately referenced, and, if necessary, permission sought from the author. Published by: School of Civil Engineering The University of Sydney Sydney NSW 2006 Australia This report and other Research Reports published by the School of Civil Engineering are available at http://sydney.edu.au/civil

The behaviour and design of concentrically loaded T-section steel columns
School of Civil Engineering Research Report R933 Page 3 The University of Sydney
ABSTRACT The buckling behaviour of T-section columns is discussed in detail followed by a numerical study using geometric and material (GMNIA) analysis to produce column strengths for a wide range of geometries of T-sections and column lengths. The T-sections are assumed to be hot-rolled and include residual stresses and geometric imperfections typical of hot-rolled sections. Based on the numerical strengths thus produced and available test strengths for T-section columns, the design provisions of the Australian, European and American Specifications for hot-rolled steel structures are evaluated. It is shown that while the Australian Standard provides fairly consistent and accurate predictions of strength, the design provisions for T-sections of current European and American Specifications are conservative and associated with large variability, particularly for T-sections with slender elements. The paper recommends modifications to the European and American specifications which improve the design strength predictions of these specifications for T-section columns.
KEYWORDS Columns; Buckling; Design; Finite Element Method; T-sections; Steel structures; Numerical models. .

The behaviour and design of concentrically loaded T-section steel columns
School of Civil Engineering Research Report R933 Page 4 The University of Sydney
TABLE OF CONTENTS ABSTRACT .......................................................................................................................................................... 3 KEYWORDS ........................................................................................................................................................ 3 TABLE OF CONTENTS....................................................................................................................................... 4 1 INTRODUCTION ............................................................................................................................................. 5 2 ELASTIC BUCKLING ...................................................................................................................................... 6
2.1 Global buckling ......................................................................................................................................... 6 2.2 Local buckling ........................................................................................................................................... 7 2.3 Shift of the effective centroid ..................................................................................................................... 9
3 FINITE ELEMENT MODELLING AND PARAMETRIC STUDY .................................................................... 10 3.1 The model ............................................................................................................................................... 10 3.2 Calibration ............................................................................................................................................... 11 3.3 Parametric study - Methodology ............................................................................................................. 12 3.4 Parametric study - Results ...................................................................................................................... 12
4 DESIGN PROVISIONS ................................................................................................................................. 13 4.1 General ................................................................................................................................................... 13 4.2 AS4100 ................................................................................................................................................... 14 4.3 Eurocode 3 .............................................................................................................................................. 14 4.4 AISC-360-10 ........................................................................................................................................... 15 4.5 Modified Eurocode approach (NC,Rd = A.fy.(r)) ..................................................................................... 16 4.6 Modified AISC-360 approach .................................................................................................................. 17 4.7 Discussion ............................................................................................................................................... 17
5 CONCLUSIONS ............................................................................................................................................ 18 6 REFERENCES .............................................................................................................................................. 19 FIGURES ........................................................................................................................................................... 21 TABLES ............................................................................................................................................................. 29

The behaviour and design of concentrically loaded T-section steel columns
School of Civil Engineering Research Report R933 Page 5 The University of Sydney
1 INTRODUCTION This paper concerns hot-rolled T-section members and their failure behaviour under concentrically applied compression load. Despite the fact that T-sections are readily available commercially and can be easily obtained by cutting standard I-sections through the middle of the web, the failure behaviour of these members when subjected to a compressive force is still not fully understood as corroborated by the numerous different design approaches for these members in various national specifications for steel structures. T-sections pertain to the particular class of sections for which the mid-lines of all component walls intersect at one single point. For these sections, the warping constant (Iw) is negligible, derived only from secondary warping. In addition to T-sections, this class of sections includes equal and unequal leg angles as well as cruciforms. Collectively, the sections are weak in torsion, particularly for sections with small thickness because of the resulting small torsion constant (J). Consequently, when subjected to compression (or bending), the failure mode commonly involves torsion. T-sections are singly symmetric and hence, the critical overall buckling modes in compression are the flexural buckling mode in the plane of symmetry and the flexural torsional buckling mode, as shown in Figs 1a and 1b respectively. At short and intermediate column lengths, the critical overall buckling mode is the flexural-torsional mode which, at intermediate and long lengths (Fig. 1b), may change to the minor axis flexural mode (Fig. 1a). The flexural-torsional mode consists of coupled flexure about the axis of symmetry (Fig. 1c) and torsion about the shear centre (Fig. 1d). At short lengths, torsion dominates the flexural-torsional mode and in the limit where the length approaches zero, the flexural-torsional mode becomes the torsional mode. Furthermore, when the flange and web elements are equal in width and thickness, the local buckling mode, as obtained by solving the St Venant plate buckling equation, is essentially the same as the torsional buckling mode for practical lengths of members. In fact, as shown in Rasmussen (Rasmussen 2003), in the limit where the local buckling half-wavelength approaches infinity, the buckling mode is linear across the elements and the local buckling stress is exactly identical to the torsional buckling stress. When the thicknesses of the flanges and web differ, or for very slender component plates, the local buckling mode may involve plate flexure, as exemplified in Fig. 1e for the case of a slender web element. Because of the resemblance between the torsional and local buckling modes, care needs to be taken when designing T-, angle and cruciform sections. As discussed in Rasmussen (Rasmussen 2005), simply supported slender equal angle sections may be designed by ignoring the torsional buckling mode in calculating the global buckling mode while accounting for torsional buckling through the effective area calculation. The advantage of this approach is that it accounts for post-local buckling capacity. The same approach is applied to T-, angle and cruciform sections in the Australian Standard for Steel Structures (AS4100 1998). Conversely, Eurocode3 Part 1.1 (EN1993-1-1 2005) requires the global buckling check to consider torsional buckling while also local buckling to be considered through an effective area calculation. As shown in this paper, the Eurocode3 procedure leads to conservative strength predictions for T-section columns as it accounts for torsional (local) buckling twice: through the member provisions and through the effective width provisions. Alternative formulations have been presented for equal angles (Dinis, Camotim et al. 2011) in which the torsional (local) mode is considered in the global buckling check while using the gross area. A recent Direct Strength Method formulation for equal angles has also been recently presented (Silvestre, Dinis et al. 2012) which adopts the column strength curve for equal angles proposed by Young (Young 2004; Ellobody and Young 2005). A further complication arises when loading singly-symmetric slender cross-sections axially, namely the stress redistribution associated with local buckling leads to a shift of the effective centroid, which induces bending when the section is loaded between pinned ends (Rhodes and Harvey 1977; Rasmussen and Hancock 1994). Thus, slender T-sections and angles compressed between pinned ends undergo overall bending in the plane of symmetry as a result of local buckling. The bending effect may be severe for cold-formed angles which can feature plate slenderness values (=fy/cr,local) of 1.35 e.g. see (OneSteel 2011) and need to be considered in design (Rasmussen 2005). In the Australian Standard for Cold-formed Steel Structures (AS/NZS4600 2005) and Eurocode3, Part 1.1, as a way of incorporating the effect of the shift of the effective cross-section in design, a column is assumed to be concentrically loaded when the applied force passes through the centroid of the effective cross-section. In the Australian AS4100 and the American Specification AISC-360 (AISC360 2010), it is not required to account for the effect of the shift of the effective centroid and columns are considered to be concentrically loaded when the applied force passes through the gross section centroid. However, while the strength of T-sections can potentially be affected by the shift of the effective centroid, the

The behaviour and design of concentrically loaded T-section steel columns
School of Civil Engineering Research Report R933 Page 6 The University of Sydney
effect is relatively minor because (i) T-sections are generally hot-rolled and only moderately slender in cross-section, and (ii) for most practical geometries, the critical global buckling is the flexural-torsional mode which is unaffected by the shift of the effective cross-section, as discussed in Section 2.3. Experiments on T-section columns appear to be limited to those presented by Kitipornchai et al. (Kitipornchai and Lee 1986). Numerical studies have been undertaken by Kitipornchai et al (Kitipornchai, Al-Bermani et al. 1990) and Dinis et al (Dinis, Camotim et al. 2010). In the absence of comprehensive experimental data, this paper first presents a finite element model calibrated against the tests by Kitipornchai and Lee (Kitipornchai and Lee 1986) and subsequently a parametric study of the strength of concentrically loaded T-section columns covering a wide range of geometries. The paper then compares the numerical strengths obtained and test strengths with strength predictions by the Australian, European and American specifications for hot-rolled and fabricated steel structures, and suggests more accurate design approaches than those currently available.
2 ELASTIC BUCKLING
2.1 GLOBAL BUCKLING According to Bleich (Bleich 1952), the warping constant (Iw) of a generic cross-section is given by
A
w dAI 2ω (1)
where represents the normalised sectorial coordinate,
A
SS dAA
ωωω1
; n
s
S rndsh 0
ω (2, 3)
In eqns (2,3), S is the sectorial coordinate with respect to the shear centre (S), h is the perpendicular distance from the point S to the tangent through an arbitrary point (A), rn is the perpendicular distance from the point S to the normal through A, and (n,s) are coordinates in the normal and tangential directions aligned with the mid-surface, as shown in Fig. 2. The first term of eqn. (3) is associated with primary warping resistance, which in cross-sections for which the mid-lines intersect as a single point is zero. The second term is associated with secondary warping resistance and is only important for very short members and when the primary warping resistance is zero. For a T-section, the (secondary) warping (Iw) and torsion (J) constants are given by,
36
)2/(
144
3333w
w
TTHTBI
(4)
3
2/
3
33wTTHTB
J
(5)
where the plate widths (B,H) and thicknesses (T,Tw) are defined in Fig. 3. According to classical theory (Timoshenko and Gere 1961; Chajes and Winter 1965), for a simply supported column with a singly-symmetric cross-section subjected to a concentrically applied compression force, the critical buckling modes are a flexural mode in the plane of symmetry and two flexural-torsional modes consisting of flexure in the direction perpendicular to the axis of symmetry and torsion. The corresponding buckling loads are,
FxNN 1 (flexural buckling) (6)
20
20
20
20
20
202
3,2 2
4
yr
r
yr
rNNNNNN
NTFyTFyTFy
(flexural-torsional buckling) (7)

The behaviour and design of concentrically loaded T-section steel columns
School of Civil Engineering Research Report R933 Page 7 The University of Sydney
where the y-axis is assumed to be the axis of symmetry, and
2
2
L
EIN xFx
π (flexural buckling load about the x axis) (8)
2
2
L
EIN yFy
π (flexural buckling load about the y axis) (9)
2
2
20
20
20
1
L
EIGJ
yxrN wT
π (torsional buckling load) (10)
A
IIr yx 2
0 (11)
In eqn. (10), (x0, y0) represent the coordinates of the shear centre in the principal axis system, (see Fig. 3), such that x0 = 0 for a singly symmetric section with the y-axis chosen as the axis of symmetry, as in this paper. While eqns (9,10) provide the buckling loads for pure flexural buckling about the y-axis and pure torsional buckling, these pure modes do not occur in singly symmetric cross-sections with the y-axis chosen as the axis of symmetry but combine to produce coupled flexural-torsional modes. The smaller of the two flexural torsional loads (N2,3) is denoted by NFT, whereas the flexural buckling load (N1) is denoted by NFx. Which of these buckling loads is lower depends on the cross-section geometry. Only if Ix>Iy will the critical buckling mode always be the flexural-torsional mode. Figures 4a and 4b show buckling loads for T-sections chosen such that Ix<Iy and Ix>Iy respectively. The following observations can be made from Figures 4a and 4b: i] For Ix<Iy (Figure 4a), the critical overall buckling load is, for short to intermediate lengths, the flexural-torsional buckling load (NFT) and, for intermediate to long lengths, the flexural buckling load (NFx) in the plane of symmetry. Consequently, a length exists at which the critical buckling mode changes from the flexural-torsional mode to the flexural mode. This length depends on the cross-section geometry and decreases as the Ix/Iy-ratio decreases. For Ix=Iy, the NFx and NFy curves coincide and there is no mode switch, although failure may occur by flexural buckling in the plane of symmetry if affected by the shift of the effective centroid. ii] For Ix>Iy (Figure 4b), the critical overall buckling load for the entire length range is the flexural-torsional buckling load (NFT). It presents two asymptotes: the pure torsional buckling load for short lengths and the pure flexural buckling (about the symmetry/y-axis) load for long lengths. iii] The influence of neglecting the secondary warping constant is minute for both sections and only visible for extremely short lengths. In fact, the flexural-torsional load graph considering the secondary warping resistance virtually coincides with the one where the secondary warping resistance is neglected for almost the entire length range.
2.2 LOCAL BUCKLING Local buckling is in this paper defined as the solution to the St Venant’s plate buckling equation (12), which assumes the buckling displacement field consists entirely of deflections (w) perpendicular to the plane of the plate. In the particular situation where the flange and web elements have the same dimensions, (i.e. b=h and T=Tw in Fig. 3), the elements buckle simultaneously when subjected to uniform compression and there is no interaction between the elements at the junction, which may then be assumed to be pinned. This case will first be explored. A characteristic of this case is that the column will form a single half-wave longitudinally, irrespective of the column length.
)1(12,2
2
3
2
2,
4
4
22
4
4
4
ν
σ
TE
Dx
w
D
T
y
w
yx
w
x
w Pcr (12)
The solution to the St Venant’s plate buckling equation comprises harmonic and hyperbolic functions in the transverse direction, and for short lengths, the buckling mode of flange elements feature curvature across the width of the plate. However, for longer lengths of plate, the buckling mode becomes increasing linear in the

The behaviour and design of concentrically loaded T-section steel columns
School of Civil Engineering Research Report R933 Page 8 The University of Sydney
transverse direction and an energy solution for the buckling of a flange element simply supported along three edges while free at one longitudinal edge based on the displacement field,
L
x
b
yAw
πsin (13)
leads to the following expression for the buckling stress,
2
2
2
, )1(12
b
TEkPcr ν
πσ (14)
where the plate buckling coefficient (k) is approximately given by
22
1)1(6
φπ
ν
k (15)
In the limit where L =L/b, for =0.3, the plate buckling coefficient (k) assumes the value of 0.425. Figure 5a shows a graph titled “Thinwall” of the local buckling stress of the T-section shown in Figure 5b, for which b/T=25. The graph was obtained using the finite strip analysis described in (Papangelis and Hancock 1995), which assumes a single half-wave of length L forms longitudinally. In the Thinwall analysis, the displacements of the intersection point between the flange and web elements were restrained along the length of the column, as shown in Figure 5b. Figure 5a also shows the approximate solution given by eqns (14,15) and two torsional buckling stresses, cr,T=NT/A, where NT is the torsional buckling load given by eqn. (10). The two torsional buckling stresses correspond to ignoring secondary warping (Iw=0), in which case the stress is independent of length, and including secondary warping with Iw calculated using eqn. (4). The torsional buckling stress including secondary warping agrees closely with the local buckling stress obtained using eqn. (15) for calculating the plate buckling coefficient. As shown in Rasmussen (Rasmussen 2003), the torsional and local buckling stresses are exactly equal in the limit L, and given by eqn. (14) with k=0.425 for =0.3. The local and torsional buckling stresses (Iw0) agree closely with the Thinwall results, even at short lengths (L/b<1) where the buckling mode is affected by transverse plate curvature. When the flange and web elements are not identical, which is the practical case of interest, the most slender element will be elastically restrained by adjoining elements. In this case, the column may form multiple local buckles longitudinally, in which case the local buckling pattern of a T-section is similar to that of other conventional thin-walled open sections like I-sections and channel sections, except that the section comprises only elements supported along a single longitudinal edge and the primary warping constant is zero. For instance, if h=2b and T=2Tw, as shown in Fig. 6b, the local buckling mode involves considerable flexure in the transverse direction of the web and the minimum local buckling stress is associated with a critical half-wavelength of Lcr=1.64b, as shown by the Thinwall curve in Fig. 6a. (Note that the Thinwall analysis assumes that a single half-wave forms longitudinally). In the limit where the flange prevents the rotation of the web, (or vice versa), the plate buckling coefficient (k) takes the value of 1.247 (Lundquist and Stowell 1942; Timoshenko and Gere 1961; Bulson 1970). The corresponding local buckling stress is also shown in Fig. 6a. It follows that as one element becomes more slender and is increasingly restrained by the adjoining elements, the plate buckling coefficient gradually changes from k=0.425 (asymptotic value at long lengths) to 1.247. Using an energy analysis based on the following displacement field,
L
xn
b
yAw
ππsin
2cos (16)
the plate buckling coefficient (k) can be obtained approximately as
2
2
/
1
)83(2
4
)83(16
/
n
nk
φπ
νπ
π
φπ
(17)
The behaviour and design of concentrically loaded T-section steel columns
School of Civil Engineering Research Report R933 Page 9 The University of Sydney
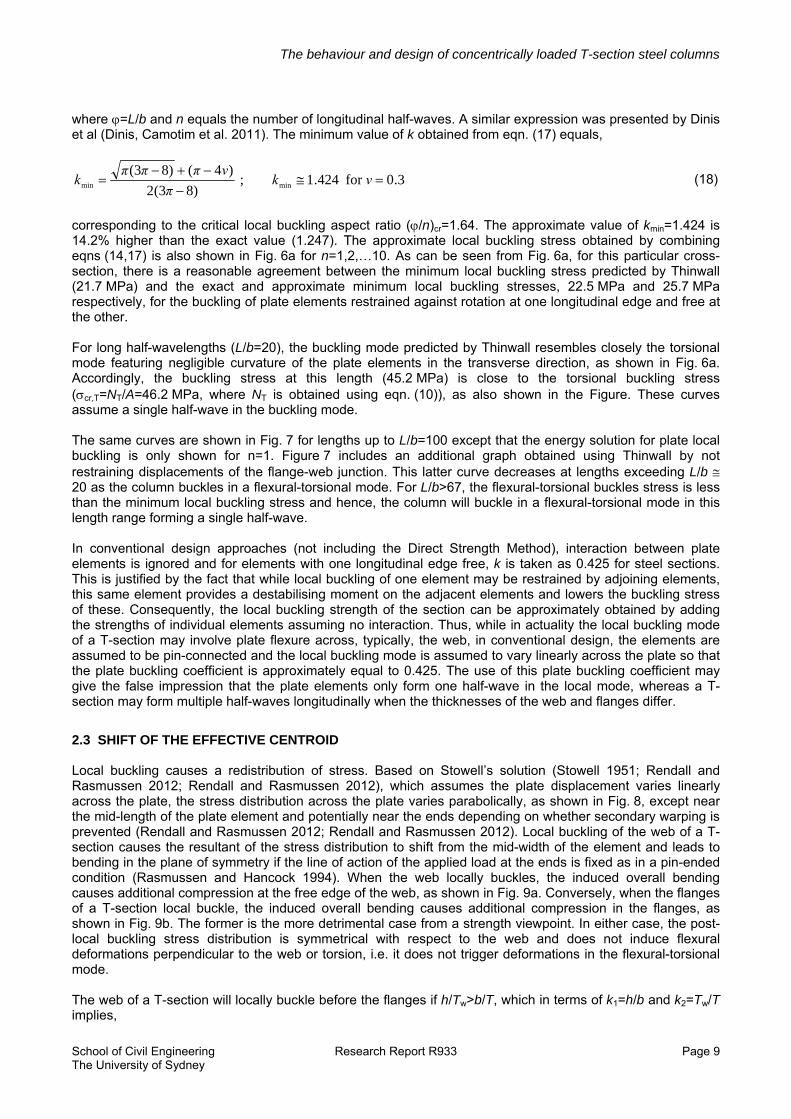
where =L/b and n equals the number of longitudinal half-waves. A similar expression was presented by Dinis et al (Dinis, Camotim et al. 2011). The minimum value of k obtained from eqn. (17) equals,
3.0for 424.1;)83(2
)4()83(minmin
νπ
νπππkk (18)
corresponding to the critical local buckling aspect ratio (/n)cr=1.64. The approximate value of kmin=1.424 is 14.2% higher than the exact value (1.247). The approximate local buckling stress obtained by combining eqns (14,17) is also shown in Fig. 6a for n=1,2,…10. As can be seen from Fig. 6a, for this particular cross-section, there is a reasonable agreement between the minimum local buckling stress predicted by Thinwall (21.7 MPa) and the exact and approximate minimum local buckling stresses, 22.5 MPa and 25.7 MPa respectively, for the buckling of plate elements restrained against rotation at one longitudinal edge and free at the other. For long half-wavelengths (L/b=20), the buckling mode predicted by Thinwall resembles closely the torsional mode featuring negligible curvature of the plate elements in the transverse direction, as shown in Fig. 6a. Accordingly, the buckling stress at this length (45.2 MPa) is close to the torsional buckling stress (cr,T=NT/A=46.2 MPa, where NT is obtained using eqn. (10)), as also shown in the Figure. These curves assume a single half-wave in the buckling mode. The same curves are shown in Fig. 7 for lengths up to L/b=100 except that the energy solution for plate local buckling is only shown for n=1. Figure 7 includes an additional graph obtained using Thinwall by not restraining displacements of the flange-web junction. This latter curve decreases at lengths exceeding L/b 20 as the column buckles in a flexural-torsional mode. For L/b>67, the flexural-torsional buckles stress is less than the minimum local buckling stress and hence, the column will buckle in a flexural-torsional mode in this length range forming a single half-wave. In conventional design approaches (not including the Direct Strength Method), interaction between plate elements is ignored and for elements with one longitudinal edge free, k is taken as 0.425 for steel sections. This is justified by the fact that while local buckling of one element may be restrained by adjoining elements, this same element provides a destabilising moment on the adjacent elements and lowers the buckling stress of these. Consequently, the local buckling strength of the section can be approximately obtained by adding the strengths of individual elements assuming no interaction. Thus, while in actuality the local buckling mode of a T-section may involve plate flexure across, typically, the web, in conventional design, the elements are assumed to be pin-connected and the local buckling mode is assumed to vary linearly across the plate so that the plate buckling coefficient is approximately equal to 0.425. The use of this plate buckling coefficient may give the false impression that the plate elements only form one half-wave in the local mode, whereas a T-section may form multiple half-waves longitudinally when the thicknesses of the web and flanges differ.
2.3 SHIFT OF THE EFFECTIVE CENTROID Local buckling causes a redistribution of stress. Based on Stowell’s solution (Stowell 1951; Rendall and Rasmussen 2012; Rendall and Rasmussen 2012), which assumes the plate displacement varies linearly across the plate, the stress distribution across the plate varies parabolically, as shown in Fig. 8, except near the mid-length of the plate element and potentially near the ends depending on whether secondary warping is prevented (Rendall and Rasmussen 2012; Rendall and Rasmussen 2012). Local buckling of the web of a T-section causes the resultant of the stress distribution to shift from the mid-width of the element and leads to bending in the plane of symmetry if the line of action of the applied load at the ends is fixed as in a pin-ended condition (Rasmussen and Hancock 1994). When the web locally buckles, the induced overall bending causes additional compression at the free edge of the web, as shown in Fig. 9a. Conversely, when the flanges of a T-section local buckle, the induced overall bending causes additional compression in the flanges, as shown in Fig. 9b. The former is the more detrimental case from a strength viewpoint. In either case, the post-local buckling stress distribution is symmetrical with respect to the web and does not induce flexural deformations perpendicular to the web or torsion, i.e. it does not trigger deformations in the flexural-torsional mode. The web of a T-section will locally buckle before the flanges if h/Tw>b/T, which in terms of k1=h/b and k2=Tw/T implies,

The behaviour and design of concentrically loaded T-section steel columns
School of Civil Engineering Research Report R933 Page 10 The University of Sydney
12 kk (19)
The associated induced overall bending in the plane of symmetry will be particularly detrimental to the strength if the critical overall buckling mode is the flexural mode in the plane of symmetry, i.e. when NFxNFT. This condition is length dependent and only possible if Ix < Iy, which in terms of k1 and k2 implies,
31
21
41
21
2
11
k
kkkk
(20)
Hence in the (k1,k2)-space, sections for which both conditions in eqns (19,20) are satisfied are particularly prone to be affected by the shift of the effective cross-section. This space is shown in Figure 10. Most practical sections have relatively narrow flanges such that Ix > Iy, and as such are represented by points to the right of the Ix = Iy-curve and are not in the space bounded by eqns (19,20) prone to be affected by the shift in the effective centroid.
3 FINITE ELEMENT MODELLING AND PARAMETRIC STUDY
3.1 THE MODEL Because of the limited number of experimental tests available on T-section columns, a finite element model was calibrated using the available test data and subsequently used to perform a comprehensive parametric study of the strength of a wide range of T-section geometries. In all cases, the column was assumed to be pinned at the ends with respect to both principal axes and loaded through the geometric centroid. The general purpose commercial finite element package ABAQUS was used for the finite element simulations. It is generally accepted that shell-element-based inelastic large displacement analysis can accurately predict the behaviour and ultimate capacity of structures undergoing local instability provided geometric imperfections and residual stresses are incorporated in the analysis (Bakker and Peköz 2003; Sarawit, Kim et al. 2003). Thus, and considering the remarks made by Schafer (Schafer, Li et al. 2010), T-section columns were modelled using S8R shell-elements. This type of element is directly available from the ABAQUS library and consists of an 8-node doubly curved thick shell with reduced integration. It employs quadratic shape functions and assigns six degrees of freedom per node. The default Simpson’s rule was used considering five integration points through the thickness of the element and assuming a homogeneous cross-section. The mesh had no elements with width-to-thickness ratios greater than four which resulted in a number of elements across each plate ranging from five to thirty depending on the plate width. The characteristic rounded transition from flanges to web of hot-rolled profiles was not modelled. To materialize the prescribed boundary conditions, two rigid plates were attached to each end of the T-section column and a reference point axially coincident with the geometric centroid of T-section was assigned to each rigid plate. At one reference point, the three translational and the twisting degrees of freedom where fully restrained while at the other reference point, the two transverse translational and the twisting degrees of freedom were fully restrained. Additionally, the described setup does not prevent secondary warping and thus the warping degree of freedom is deemed unrestrained at both ends. At the axially unrestrained end, a point load is applied at the reference point in order to simulate a concentric compression load. An example of the developed finite element model is shown in Fig. 11. As for the hot-rolled steel material, the stress-strain curve was chosen as elastic-perfectly plastic being defined, as shown in Fig. 12, by Young’s modulus (E) and yield stress (fy). Guidelines for including residual stresses, particularly relevant to hot-rolled members, are available in the SSRC Guide (Ziemian 2010). The following sections details how both residual stresses and geometric imperfections were incorporated in the finite element model.

The behaviour and design of concentrically loaded T-section steel columns
School of Civil Engineering Research Report R933 Page 11 The University of Sydney
3.2 CALIBRATION The finite element model was calibrated by (i) comparing the results of elastic buckling analyses to the global buckling loads and modes obtained from classical theory (eqns (9,10)), and (ii) comparing ultimate strength data with the test strengths reported by Kitipornchai and Lee (Kitipornchai and Lee 1986). Three cross-sections were tested by Kitipornchai and Lee, as shown in Fig. 13. The sections were obtained by cutting three I-sections lengthwise through the centre of the web so as to produce two T-sections for each length of I-section, resulting in a total of six T-section specimens. The cross-section dimensions and column lengths are shown in Table 1. The measured values of Young’s modulus and yield stress were 214 GPa and 300 MPa respectively. The elastic buckling analyses were performed on the columns tested by Kitipornchai and Lee ignoring geometric imperfections and residual stresses. The first two buckling modes and loads obtained using Abaqus are shown in Table 1 as are the buckling loads obtained using eqns (9,10). It can be seen that the finite element model predicts the 1st and 2nd buckling loads to within 2.6% and 1.6% error, respectively. This degree of accuracy was deemed acceptable. The residual stresses incorporated in the non-linear inelastic analyses were based on the ECCS (ECCS 1976) model shown in Fig. 14, where in this study the peak residual stress (r) was taken as 0.3fy. However, when considering half of this model for a T-section, it is found that while the residual stresses produce a net zero axial force, as required, they produce a non-zero bending moment (Mr) about an axis parallel to the flange. This moment cannot exist and so the T-section will bend in essentially uniform curvature (r) when the I-section is sliced into two T-sections. The bending of the T-section will alter the residual stress distribution to be in equilibrium both in terms of axial force and bending moment, and cause an initial imperfection (r) of the section consisting of flexure in the plane of symmetry towards to free edge of the web. The out-of-balance moment of a T-section produced by the residual stress distribution shown in Fig. 14 is given by,
rwrTHTM
2
61
2 (21)
The associated curvature and mid-span deflection produced by the release of this moment are,
48
42 and
otherwise ,0
a-Lxa ,6
2 222
ry
2
x
rw
x
rw
r EI
aLTHTEI
THT
(22,23)
where a is the dimension (92.5 mm) of the end bearings, which were assumed to be rigid. The ry/L values obtained from eqn. (23) for test specimens T1, T2, T3, T4, T5 and T6 are 1/3040, 1/2600, 1/1520, 1/1370, 1/1980, and 1/1770 respectively, and are thus close to the construction tolerance (L/1000) for some of the longer specimens. While the initial geometric imperfections are not reported in the paper (Kitipornchai and Lee 1986), the test specimens are likely to have featured imperfections of the calculated magnitudes. In the non-linear Abaqus analyses, the residual stress pattern for one half of the I-section shown in Fig. 14 was incorporated as an initial stress state. No external load was applied in the first load step which then consisted of finding an equilibrium state for the incorporated initial stress. This produced deflections of similar magnitude to the calculated ry-values, (equal to within 5%), which served as initial geometric imperfections in the plane of symmetry, as well as an altered residual stress state. The change in residual stress can be calculated from
yI
M
x
rr σ (24)
where r is positive as tension, the principal coordinate y is positive towards the free edge of the web, and Mr is given by eqn. (21).

The behaviour and design of concentrically loaded T-section steel columns
School of Civil Engineering Research Report R933 Page 12 The University of Sydney
Imperfections were also included for deflections in the direction perpendicular to the web and twist rotations. These imperfections were incorporated by scaling the flexural-torsional buckling mode obtained from a linear buckling analysis by scaling factors of L/2000, L/1750 and L/1500. The resulting ultimate loads are shown and compared with the experimental ultimate loads in Table 2. It can be concluded from Table 2 that the finite element model predicts reasonably well the experimental failure loads obtained by Kitipornchai and Lee (Kitipornchai and Lee 1986). Overall, the best agreement is obtained for a scale factor for the flexural-torsional buckling mode of L/2000. However, the ultimate loads shown in Table 2 are not strongly dependent on the magnitude of flexural-torsional imperfection and to comply with Bjorhovde’s survey, which found that the mean minor axis geometric imperfection of rolled I-sections is L/1470 (Bjorhovde 1972), the scale factor of L/1500 was chosen for generating imperfections in the shape of the flexural-torsional buckling mode in the parametric study. These were in addition to the residual stresses and imperfections in the plane of symmetry generated in the first load step detailed in previous paragraphs.
3.3 PARAMETRIC STUDY - METHODOLOGY Two series of parametric studies were conducted, referred to as the N- and M-series. In the N-series, three generic cross-sections were selected to cover a wide range of geometries by changing the widths of the flange and web elements and assuming the same thickness for both flange and web, whereby k2=Tw/T=1. Two cross-sections were chosen so that H/B=2 (k14) and 1/4 (k10.5), where B and H are the total flange width and the web width, respectively, as shown in Fig. 15. The third section was chosen such that Ix=Iy, which implied equal flexural buckling stresses for buckling about the x- and y-axes. For each cross-section, four values of thickness were selected so as to obtain the values of the ratio NY/NT (Iw=0) of 0.5, 1.0, 1.5 and 2.0, where NY is the squash capacity (A fy) of the section and NT (Iw=0) is the torsional buckling load ignoring secondary warping. For each cross-section, in order to determine the column strength curve, a minimum of five lengths were selected corresponding to normalised flexural slenderness values of e = 0.25, 0.50, 1.00, 2.00 and 4.00, where the normalised flexural slenderness is given by:
Fy
Y
Fx
Ye N
N
N
N,maxλ (25)
For some cross-sections, additional short lengths were chosen in order to determine the column strength curve when plotted against the normalised global slenderness (r) given by,
FT
Y
Fx
Yr N
N
N
N,maxλ (26)
The M-series T-sections were chosen as one half of a selection of common Australian hot-rolled I-sections (OneSteel 2011). As shown in Fig. 16, five cross-sections were chosen and modelled by ignoring the rounded transition between the web and flange elements. The column lengths for each cross-section were chosen in a similar manner as for the N-series T-sections. The cross-section geometry, column lengths, geometric properties, elastic buckling loads, column slenderness values and key ratios are shown in Table 3 for the Series N and M T-section columns. For all Series N and M models, the assumed values of Young’s modulus (E) and yield stress (fy) were 210 GPa and 355 MPa respectively.
3.4 PARAMETRIC STUDY - RESULTS Two separate numerical analyses were performed using ABAQUS for each of the T-section columns detailed in Table 3, namely:
1. An elastic eigenvalue buckling analysis that provided the deformed shape of the flexural-torsional mode for implementing the geometric imperfection in this mode in the subsequent non-linear analysis.
The behaviour and design of concentrically loaded T-section steel columns
School of Civil Engineering Research Report R933 Page 13 The University of Sydney
2. A geometric and material non-linear failure analysis that used the modified Riks method including the
effects of geometric imperfections and residual stresses. (The modified Riks method employs, in each step, proportional loading, solving simultaneously for both loads and displacements. ABAQUS uses the arc length along the static equilibrium path in the load-displacement space to measure the progress of the solution. This method is useful for providing post-buckling solutions of stable or unstable structures when material and geometrical non-linearities are involved (Simulia 2011)).
As discussed in Section 3.2, before advancing to the actual failure analysis, the first step of the non-linear analysis consisted of determining the equilibrium state in the presence of the non-self-equilibrating residual stress pattern. This step induced bending in the plane of symmetry and modified the residual stress pattern. The subsequent analysis featured local buckling of those sections with slender elements, as exemplified in Fig. 17a for specimen N01_T1L4. Figure 17b shows the load plotted against the displacement in the transverse direction. The 3rd and 4th columns of Table 4 contain the ultimate load (Nu) and the prominent mode of failure observed at the ultimate load for each specimen, respectively. Because the load was applied at the geometric centroid, those sections featuring local buckling underwent flexural displacements as a result of the shift of the effective centroid, as discussed in Section 2.3.
4 DESIGN PROVISIONS
4.1 GENERAL This section compares strength predictions obtained using the provisions of the Australian Standard AS4100 (AS4100 1998), Eurocode3 Part 1.1 (EN1993-1-1 2005) and the AISC-360 Specification (AISC360 2010) with the ultimate strength data obtained from the parametric study described in Section 3.4 and experiments by Kitipornchai and Lee (Kitipornchai and Lee 1986). The design approaches adapted in the three specifications are substantially different as will be highlighted in the following sections, which also propose improvements to existing provisions. The two main difficulties encountered in formulating design provisions for T-sections are:
1. The cross-section deformations of the local and torsional buckling modes are similar, albeit the corresponding half-wavelengths may be different, as discussed in Section 2.2, and hence, strength predictions are conservative if both modes are accounted for through effective area and flexural-torsional buckling calculations.
2. When ignoring secondary warping (Iw=0), as is customary in design, the critical buckling stress
becomes the pure torsional buckling stress (cr,T) in the limit L0, implying a non-zero column slenderness of r=y/cr,T 0. As a result, the design stress is less than the yield stress (y) in the limit L0. This is in contrast to designing for flexural buckling where cr,Fx in the limit L0, so that r=y/cr,Fx 0 and the design stress becomes the yield stress as required.
The abovementioned three design specifications present different approaches to addressing these difficulties, or not. Consistent with the pin-ended support conditions simulated in the numerical investigation presented in Section 3.4, the effective column lengths for flexural buckling about the minor and major axes as well as torsional buckling were taken as the column length (L) in the design strength predictions detailed in Sections 4.2-4.6. In calculating design strengths for the columns tested by Kitipornchai and Lee, the effective lengths for flexural buckling about the x- and y-axes were taken equal to the distance between the centres of the pin-ended supports, while for calculating the torsion buckling strength including secondary warping, the effective length was taken as half of the column length because warping was prevented by the use of rigid end plates in the experiments.

The behaviour and design of concentrically loaded T-section steel columns
School of Civil Engineering Research Report R933 Page 14 The University of Sydney
4.2 AS4100 According to the Australian Specification for steel structures (AS4100 1998), the strength of a concentrically loaded column is given by
yecc fAN α (27)
where c, Ae and fy represent the geometric slenderness reduction factor, the effective area of the cross-section and the nominal yield stress, respectively. The first variable (c) reflects the effect of flexural buckling on the member capacity as well as the distribution and magnitudes of the residual stresses for standard Australian sections. This parameter is function of the flexural geometric slenderness ratio (L/r), yield stress and section type, and as such does not consider torsional or flexural-torsional buckling. The second variable (Ae) is obtained by incorporating the effect of local buckling through the effective width methodology in the net area. This reduction accounts for the fact that the yield stress may not be attainable due to local buckling and is a function of both yield stress and plate slenderness. It is apparent that according to AS4100, the global torsional buckling mode is implicitly taken into account through the effective area provisions which account for local buckling and include post-local buckling capacity. The ratios (Nu/Nc) between the experimental or numerical ultimate strengths and the AS4100 predictions are shown in the 6th column of Table 4, including the statistics of the same ratio at the end of the Table. The mean value and CoV of the ratio are 1.12 and 0.170, respectively, while the minimum and maximum values of the ratio are 0.73 and 1.67, respectively. This implies a generally conservative design approach with a relatively small scatter, although the column strength prediction is up to 27% optimistic for the N01_T5 section, which is a particularly slender cross-section featuring a slender web (see Fig. 15) and a NY/NT (Iw=0)-ratio of 2.5 (r=1.53 and e=0.50). The 6th column of Table 4 also shows the mean and CoV for non-slender (Ae/A=1) and slender sections (Ae/A<1), from which it follows that the AS4100 procedure is slightly more accurate for non-slender than slender sections. The fourth set of statistics exclude slenderness values (e) less than 0.15. Since the mean and CoV are nearly unchanged from the statistics including all slenderness values, it follows that the AS4100 procedure works equally well for columns of short and intermediate to long lengths. Using the 4th set of statistics (excluding columns with e<0.15) and denoting the mean and CoV of the Nu/Nc-ratio by Pm and VP, respectively, in conjunction with the LRFD framework for the dead and live load combination, the resistance factor is calculated as =0.88 using,
2222048.1 GPFM VVVV
mmm ePFM βφ (28)
where values of Mm=1.1, VM=0.1, Fm=1.0, VF=0.05, are assumed (Ellingwood, Galambos et al. 1980). Equation (28) is derived on the basis of the load combination G=DDn+LLn using D=1.2 and L=1.6 as per the ASCE-7 Standard (ASCE 2010) and assuming a ratio (Dn/Ln) of nominal dead to nominal live load of 1/3. Using VD=0.1 and VL=0.25, the CoV of the load effect is obtained as VG=0.19. Consistent with the calibration of the AISC-360 Specification, (e.g. see Commentary of the AISC-360 Specification), the target reliability index is chosen as 0=2.6. The calculated value of resistance factor (=0.88) is close to the value of 0.9 prescribed in AS4100.
4.3 EUROCODE 3 According to Eurocode 3, Part 1.1 (EN1993-1-1 2005), the nominal strength of a concentrically loaded column is given by,
yeffRkb fAN χ, (29)
where , Aeff and fy represent the geometric slenderness reduction factor, the effective area of the cross-section and the nominal yield stress, respectively. The reduction factor depends on the non-dimensional slenderness defined by,
The behaviour and design of concentrically loaded T-section steel columns
School of Civil Engineering Research Report R933 Page 15 The University of Sydney
cr
yeff
N
fA λ (30)
where Ncr is the critical elastic buckling load, taken as the lower of the flexural (NFx) and flexural-torsional (NFT) elastic buckling loads. In this study, the flexural torsional buckling load (NFT) has been determined using eqns (7,9,10) with Iw taken as zero. EN1993-1.1 specifies the “c” column curve for both the flexural and flexural-torsional buckling strength calculations of T-sections. For slender cross-sections, EN1993-1.1 requires calculation of the effective centroid and the eccentricity between the effective and gross section centroids. In singly and non-symmetric cross-sections, the eccentricity gives rise to end moments which cause overall bending in the plane of symmetry, as discussed in Section 2.3, and accordingly, EN1993-1.1 requires the column to be designed as a beam-column. This approach is in contrast to the approaches described in AS4100 and the AISC-360 Specification, which do not require the effect of the shift of the effective centroid to be considered. To enable a direct comparison between the column strength predictions of the various specifications, the effect of the shift of the effective centroid in slender T-sections is ignored in this paper. The ratios (Nu/Nb,Rk) between the experimental or numerical strengths to the EN1993-1.1 strength predictions are shown in the 8th column of Table 4. The mean and CoV of the ratio are 1.60 and 0.400, respectively, suggesting a very conservative design approach of poor accuracy. When considering only slender cross-sections, the mean and CoV change slightly to 1.62 and 0.403, respectively, suggesting that the design approach is conservative and of poor accuracy for both slender and stocky cross-sections. The main reason for the conservative prediction of design strengths is that EN1993-1.1 accounts for both torsional buckling (in the calculation of NFT) and local buckling (in the Aeff calculation), and as such, notwithstanding that the buckling half-wavelengths of the two modes may be different, accounts for the same mode twice. The conservatism is brought out by the fact that in calculating the flexural-torsional buckling
strength, in the limit L0, the buckling load equals the torsional buckling load (NT=GJ/(Aro2)) so that
FTAeff fy/NT 0 and consequently, FT<1 rather than FT=1 for L0. When determining the column strength using eqn. (29), the section capacity Aeff fy is then unnecessarily further reduced by the factor FT<1. Section 4.5 explores the possibility of using the gross area (A) rather than the effective area (Aeff) in the EN1993-1.1 approach. The conservatism of the Eurocode3 approach is particularly pronounced for short columns and the high Nu/Nb,Rk-ratios at short lengths contribute substantially to the high CoV. When excluding columns with slenderness e<0.15, the mean and CoV of the Nu/Nb,Rk-ratio reduce to 1.38 and 0.2257 respectively. Based on these values for Pm and VP, the resistance factor is calculated as =0.93.
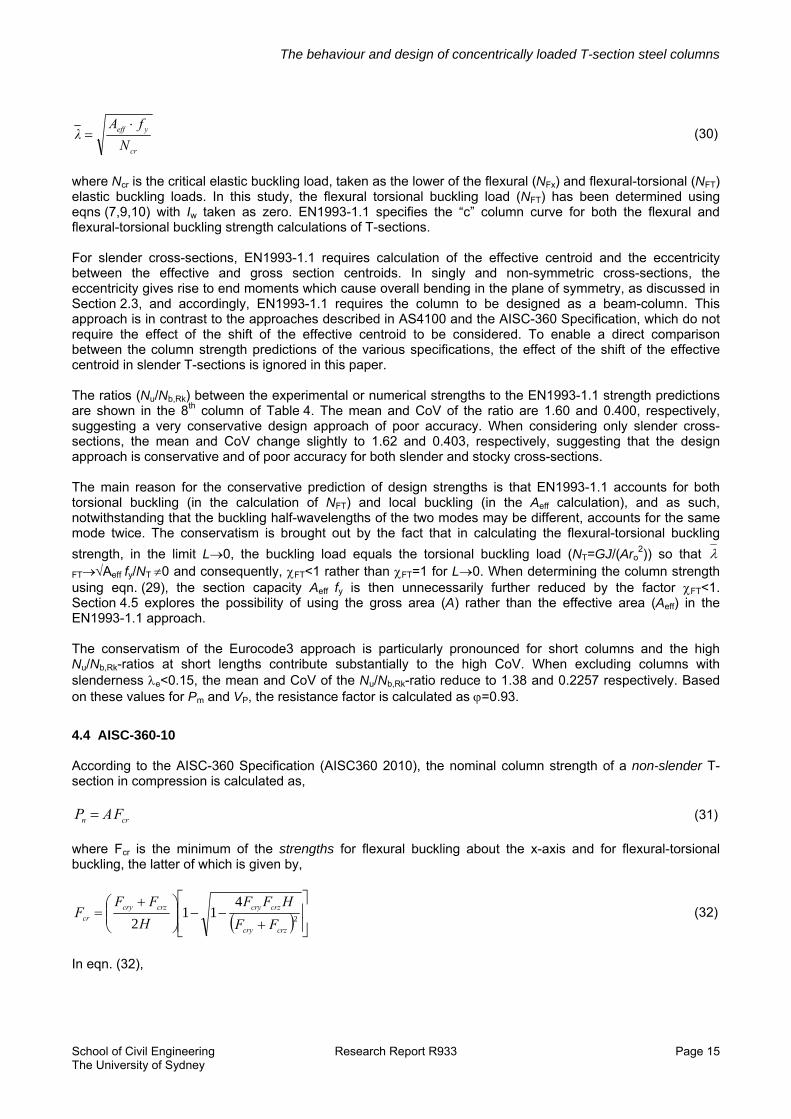
4.4 AISC-360-10 According to the AISC-360 Specification (AISC360 2010), the nominal column strength of a non-slender T-section in compression is calculated as,
crn FAP (31)
where Fcr is the minimum of the strengths for flexural buckling about the x-axis and for flexural-torsional buckling, the latter of which is given by,
2
411
2 crzcry
crzcrycrzcry
crFF
HFF
H
FFF (32)
In eqn. (32),

The behaviour and design of concentrically loaded T-section steel columns
School of Civil Engineering Research Report R933 Page 16 The University of Sydney
2
0
01
r
yH ,
20Ar
GJFcrz (33,34)
and Fcry is the inelastic flexural strength for buckling about the y-axis. Thus, the strength equation (32) for flexural-torsional buckling combines the elastic torsional buckling stress with the y-axis inelastic flexural buckling strength in the conventional expression for the elastic flexural-torsional buckling stress. For short lengths of column (L0), the y-axis flexural buckling strength (Fcry) equals the yield stress and hence, the column strength is a H-weighted average of the yield stress and the elastic torsional buckling stress in this limit. For slender T-sections, in lieu of using eqn. (32), the AISC-360 Specification requires the critical inelastic strength be calculated as,
25.2for877.0
25.2for658.0
e
y
e
e
yF
QF
y
cr
F
QFF
F
QFQF
F
e
y
(35)
where Fe is the minimum of the elastic buckling stresses for flexural buckling about the x-axis and flexural-torsional buckling, and Q is the minimum of the be/b-ratios of the flange and web elements, which is equivalent to the ratio between the effective and gross areas in the AS4100 and EN1993-1.1 specifications, so that Q<1 for a slender cross-section. The ratios (Nu/Pn) between the experimental or numerical strengths to the AISC strength predictions are shown in the 10th column of Table 4. The mean and CoV of the ratio are 1.39 and 0.381, respectively, suggesting a very conservative design approach of relatively poor accuracy. Considering only those columns with non-slender cross-sections (Q=1), the mean and CoV are 1.070 and 0.108, respectively, while for the columns with slender cross-sections (Q<1), the mean and CoV are 1.484 and 0.382, respectively. Hence, the AISC-360 Specification offers an accurate design approach for non-slender T-sections while the approach is generally conservative and associated with high variability for slender sections. As for Eurocode3, the main sources of inaccuracy in determining the strength of slender T-section columns
are that (i) the slenderness reduction factor eFyQF
658.0 approaches TcrFyQF
,658.0 <1 in the limit L0, rather than
unity as for the cases of flexural buckling and torsional buckling when Iw>0 where Fe so that eFyQF
658.0 1, and (ii) the torsional buckling mode is considered in both the flexural-torsional and local buckling (Q) design calculations. Section 4.6 described ways of improving the AISC procedure. The design strength predictions are particularly conservative at very short column lengths. Excluding columns with slenderness e<0.15, the mean and CoV of the Nu/Pn-ratio reduce to 1.20 and 0.224 respectively. Based on these values for Pm and VP, the resistance factor is calculated as =0.87, which is slightly less than the specified value of 0.90 and slightly greater than the value of 0.85 specified in previous LRFD versions of the AISC-360 Specification.
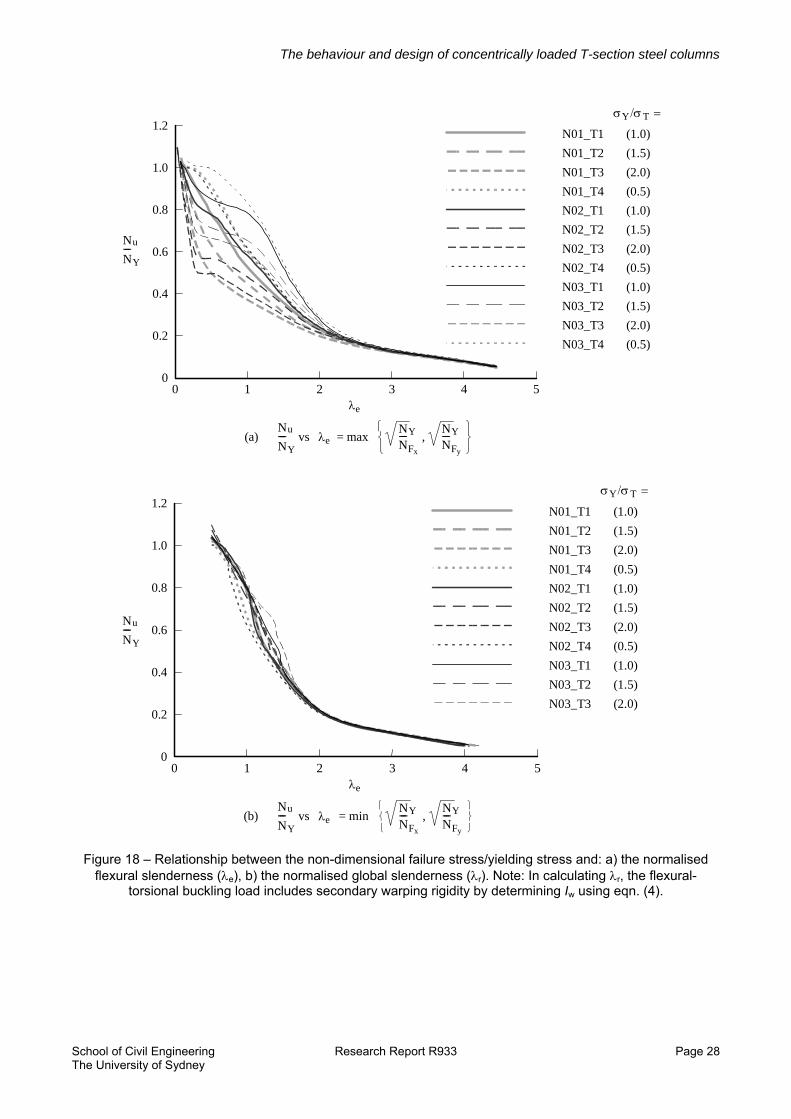
4.5 MODIFIED EUROCODE APPROACH (NC,Rd = A.fy.(r)) The main issue in improving the Eurocode design approach is to resolve the double consideration of the torsional/local buckling mode in the strength prediction, as discussed in Section 4.3. This may be achieved by ignoring flexural-torsional buckling in determining the member buckling load, as in the AS4100 approach, or by using the gross area rather than the effective area. Motivated by the plots of normalised strength (Nu/Ny) against slenderness shown in Figs 18a and 18b, the latter approach is here selected. As shown in Fig 18, when the normalised strength is plotted against the “global” slenderness (r), which is defined by eqn. (26) and considers both flexural and flexural-torsional buckling, the strengths are grouped in a much narrower band than when plotted against the flexural slenderness (e) defined by eqn. (25), suggesting that a more direct design approach may be achieved by employing the global slenderness. This implies the consideration

The behaviour and design of concentrically loaded T-section steel columns
School of Civil Engineering Research Report R933 Page 17 The University of Sydney
of the flexural-torsional buckling load in determining the design strength, in which case the area is taken as the gross area rather than the effective area, i.e.
yrRkb fAN )(, λχ (36)
Comparisons also show that a more accurate design procedure can be achieved using the b-curve rather than the c-curve as currently specified for T-sections in Eurocode3. The resulting strength predictions are shown in the 10th and 11th columns of Table 4 for the cases where secondary warping is ignored (Iw=0) and considered (Iw>0), respectively. When secondary warping is ignored, the mean and CoV of the ratio between the experimental or numerical strength to the modified EN1993-1.1 strength prediction (Nu/NRd) are 1.36 and 0.353. These statistics compared to the mean and CoV of 1.60 and 0.400 obtained using the existing provisions. Excluding the results for short lengths (e<0.15), the mean and CoV improve to 1.20 and 0.205 respectively, leading to a resistance factor of =0.89. If secondary warping is taken account of, the mean and CoV of all columns are 1.15 and 0.132 respectively, indicating a relatively conservative procedure with a small scatter. The mean and CoV change slightly to 1.14 and 0.141 when the results for short lengths (e<0.15) are excluded, suggesting that the proposed procedure is consistent in terms of length. The resistance factor calculated on the basis of the latter statistics is =0.94.
4.6 MODIFIED AISC-360 APPROACH As shown in Section 4.4, the AISC-360 approach is accurate for non-slender cross-sections (Q=1) while excessively conservative for slender cross-sections (Q<1). As a first modification, the same design approach is here adopted for slender sections as for non-slender sections, i.e. eqns (31-34) are used except that Fcry is calculated using eqn. (35) with Fe=cr,Fy and Q<1. The resulting strength predictions are shown in the 13th and 15th columns of Table 4 for the cases where secondary warping is ignored (Iw) and considered (Iw>0) respectively. In the former case, the mean and CoV of the ratio between the experimental or numerical strength to the modified AISC-360 strength prediction (Nu/NRd) are 1.36 and 0.397, respectively, indicating a slight improvement of the mean but a slightly higher CoV compared to the current AISC-360 procedure (AISC360 2010). When taking secondary warping into account, the mean and CoV improve to 1.23 and 0.247 respectively. To avoid accounting for the similar torsional/local modes twice, a second modified AISC-360 strength prediction model is obtained by again using eqns (31-34) but determining Fcry from eqn. (35) with Fe=cr,Fy and Q=1; i.e. local buckling is ignored in determining the flexural-torsional buckling strength. In this procedure Fcrx is determined from eqn. (35) with Fe=cr,Fx and Q<1 for slender sections. The resulting strength predictions are shown in the 14th and 16th columns of Table 4. The mean and CoV of the ratio between the experimental or numerical strength to the 2nd modified AISC-360 strength prediction (Nu/NRd) are 1.25 and 0.329, respectively, when secondary warping is ignored, and 1.15 and 0.205 when secondary warping is considered, respectively. The statistics for the 1st and 2nd modified AISC procedures improve significantly when the strengths for very short columns (e<0.15) are excluded. For this case, the resistance factors for the for the modified AISC models ignoring, or not, secondary warping vary between 0.84 and 0.92, and so are relatively close to the values used in the current (0.90) and previous (0.85) versions of the AISC-360 Specification.
4.7 DISCUSSION It follows from Table 4 that AS4100 is mainly optimistic for the N01 and N02 cross-sections, and particularly so for the slender N01_T5, N02_T2, N02_T3 and N01_T5 sections in the short flexural slenderness range (e[0.25,0.5]) where the design strength exceeds the ultimate strength by 20% or more. This result is attributed to the effect of bending induced by the shift of the effective centroid which is not considered in the design guidelines of the AS4100 (and AISC-360) Specifications. Note that while the N01_T5 and N03_T3 cross-sections are similar in terms of slenderness (Ae/A equals 0.65 and 0.67 respectively according to AS4100, see Table 4), the design strengths for the N03_T3 cross-section are generally conservative because the effect of the shift of the effective centroid less insignificant for this section as local buckling occurs mainly in the flanges and causes bending in the plane of symmetry that induces tension at the free edge of the web, as discussed in Section 2.3.

The behaviour and design of concentrically loaded T-section steel columns
School of Civil Engineering Research Report R933 Page 18 The University of Sydney
The ultimate strength to design strength ratio (Nu/Nc) is consistently relatively low for a flexural slenderness (e) of about 4, as shown in Table 4. This trend is attributed to interaction between the flexural-torsional buckling mode and the buckling mode for flexure in the plane of symmetry. It follows from Table 3 that the elastic buckling loads for these two modes are similar for e-values of about 4. The provisions of AS4100 are generally satisfactory for T-section columns except when the web is slender and the column is pinned about the x-axis (the axis perpendicular to the plane of symmetry). It is suggested that such columns should be required to be designed as beam-columns when the Ae/A ratio is less than 0.8. This requirement is not necessary when the columns are fixed against rotations about the x-axis at the two ends, since local buckling does not induce overall bending in this case (Rasmussen and Hancock 1994). The statistics of the current and proposed modified design procedures of the AS4100, EN1993-1.1 and AISC-360 Specifications are summarised in Table 5. The statistics exclude short columns (e) and are based on design predictions that ignore secondary warping, i.e. Iw is taken as zero. It follows from the Table that comparable levels of accuracy and (Pm and VP) and reliability () are achieved using the current rules of AS4100 and the proposed modified rules of the EN1993-1.1 and AISC-360 Specifications. The accuracy deteriorates considerably if short columns are included in the statistics and secondary warping is ignored. While the accuracy can be greatly improved for short columns by including secondary warping (determining Iw using eqn. (4)), it is considered appropriate to maintain Iw=0 in the proposed modified design approaches for simplicity. A note could be added to the proposed modified design procedures to the effect that when designing short T-section columns, say e<0.2, the designer should consider to include secondary warping when determining the flexural-torsional buckling load.
5 CONCLUSIONS A study of the buckling behaviour and strength of hot-rolled steel T-section columns has been presented. The study was motivated by the fact that the torsional and local buckling modes are similar for this cross-section, whereby design strength predictions may be conservative if accounting for both modes. The focus of the study is on columns compressed between pinned ends. The elastic buckling in global and local modes are first summarised, highlighting that (i) the critical global buckling mode is always the flexural-torsional mode at short lengths, which may, and may not, change to a flexural mode at intermediate to long lengths depending on the Ix/Iy-ratio, and (ii) local buckling may involve a single or numerous longitudinal half-waves depending on the cross-section geometry. A numerical study of T-sections columns is conducted to augment the available experimental ultimate strength data. The development of residual stresses in T-section columns produced by cutting I-sections in half is first explained, including the initial bending of each T-section that results when an I-section is cut in half. The residual stresses, initial bending deformations and geometric imperfections are included in shell finite element models, which are analysed using geometric and material non-linear (GMNIA) analyses. The ultimate strength data is compared with predictions obtained using the Australian, European and American specifications for hot-rolled steel structures. It is shown that the Australian Standard (AS4100) is reliable except for pin-ended columns with slender webs, for which the design strength may be seriously optimistic because of the effect of the shift of the effective centroid. It is proposed that pin-ended T-section columns shall be required to be designed as beam-columns when the Ae/A-ratio is less than 0.8, as determined using AS4100. However, this requirement is not necessary for fixed-ended columns. The European (EN1993-1.1) code is shown to be excessively conservative because (i) it considers both flexural-torsional buckling and local buckling in the strength calculation, and (ii) the column slenderness for flexural-torsional buckling does not approach to zero for short lengths as in the design for flexural buckling. The paper proposes a modification to EN1993-1.1, allowing (i) the area to be taken as the full area (A) irrespective of cross-section slenderness and (ii) the b-curve to be used rather than the c-curve currently specified. It is shown that adequate reliability is achieved using this approach without considering bending arising from the shift of the effective centroid, which is required to be accounted for in the current version of the code. The American (AISC-360) Specification is shown to be reliable for T-section columns with stocky cross-sections but seriously conservative for columns with slender cross-sections. Modifications to the specification

The behaviour and design of concentrically loaded T-section steel columns
School of Civil Engineering Research Report R933 Page 19 The University of Sydney
for slender cross-sections are proposed which (i) enable the same rules to be used for slender and stocky cross-sections and (ii) allow the Q-factor of unity to be used for slender cross-sections. The proposed rules for the European and American specifications are shown to have comparable reliability to those of the current version of the Australian standard. This is remarkable seeing that the design approaches of the three specifications are completely different. The study shows that T-section columns with slender cross-sections are not required to be design as beam-columns to account for the effect of the shift of the effective centroid, except for the Australian standard when the Ae/A-ratio is less than 0.8.
6 REFERENCES AISC360 (2010). ANSI/AISC 360-10: Specification for structural steel buildings, American Institute of Steel
Construction. AS4100 (1998). Australian Standard - Steel structures. Standards Australia. AS/NZS4600 (2005). Australian/New Zealand Standard - Cold-formed steel structures. Standards Australia &
Standards New Zealand. ASCE (2010). Minimum design loads for buildings and other structures: ASCE Standard 7-10, American
Society of Civil Engineers. Bakker, M. C. M. and T. Peköz (2003). "The finite element method for thin-walled members—basic principles."
Thin-Walled Structures 41(2–3): 179-189. Bjorhovde, R. (1972). Deterministic and probabilistic approaches to the strength of steel columns. Lehigh
University, University Microfilms. Bleich, F. (1952). Buckling strength of metal structures. United States of America, McGraw-Hill Book
Company, Inc. Bulson, P. S. (1970). The stability of flat plates, Chatto & Windus. Chajes, A. and G. Winter (1965). "Torsional-flexural buckling of thin-walled members." ASCE Journal
Structural Division 91(ST4): 103-124. Dinis, P. B., D. Camotim, et al. (2010). "On the local and global buckling behaviour of angle, T-section and
cruciform thin-walled members." Thin-Walled Structures 48(10–11): 786-797. Dinis, P. B., D. Camotim, et al. (2011). On the design of steel angle columns. Proceedings of 6th International
Conference on Thin-Walled Structures (ICTWS 2011). D. Dubina and V. Ungureanu (eds). Timisoara, 5-7/9: 271-279.
ECCS (1976). "Manual on stability for steel structures." ECCS Publication 22. Ellingwood, B. R., T. V. Galambos, et al. (1980). Development of a probability based load criterion for
American National Standard A58. Washington D. C.,, National Bureau of Standards. Ellobody, E. and B. Young (2005). "Behavior of cold-formed steel plain angle columns." Journal of Structural
Engineering 131(3): 457-466. EN1993-1-1 (2005). Eurocode 3: Design of steel structures - Part 1-1: General rules and rules for buildings.
CEN - European Committee for Standardization. Kitipornchai, S., F. Al-Bermani, et al. (1990). "Elasto-plastic finite element models for angle steel frames."
Journal of Structural Engineering 116(10): 2567-2581. Kitipornchai, S. and H. W. Lee (1986). "Inelastic experiments on angle and tee struts." Journal of
Constructional Steel Research 6: 219-236. Lundquist, E. E. and E. Z. Stowell (1942). Critical compressive stress for outstanding flanges. N. A. C. A.
(NACA). Washington D.C., United States. OneSteel (2011). Hot-rolled and structural steel products. O. M. P. Limited. www.onesteel.com. Papangelis, J. P. and G. J. Hancock (1995). "Computer analysis of thin-walled structural members."
Computers & Structures 56(1): 157-176. Rasmussen, K. J. R. (2003). Design of angle columns with locally unstable legs. Sydney, Australia, Dept. of
Civil Engineering, University of Sydney. Research Report No. 830. Rasmussen, K. J. R. (2005). "Design of angle columns with locally unstable legs." Journal of Structural
Engineering 131(10): 1553-1560. Rasmussen, K. J. R. and G. J. Hancock (1994). "Design of thin-walled plain channel section columns against
flexural buckling." Thin-Walled Structures 20(1–4): 219-240. Rendall, M. A. and K. J. R. Rasmussen (2012). The behaviour of pin-ended flange elements in compression.
Proceedings of the 6th International Conference on Coupled Instabilities in Metal Structures, Glasgow.

The behaviour and design of concentrically loaded T-section steel columns
School of Civil Engineering Research Report R933 Page 20 The University of Sydney
Rendall, M. A. and K. J. R. Rasmussen (2012). Elliptic solutions to the buckling of flange elements under compression. Sydney, Australia, Department of Civil Engineering, University of Sydney. Research Report R928.
Rhodes, J. and J. M. Harvey (1977). Interaction behaviour of plain channel columns under concentric and eccentric loading. Proceedings of 2nd International Colloquium on the Stability of Steel Structures. ECCS, Liege: 439-444.
Sarawit, A. T., Y. Kim, et al. (2003). "The finite element method for thin-walled members-applications." Thin-Walled Structures 41(2–3): 191-206.
Schafer, B. W., Z. Li, et al. (2010). "Computational modeling of cold-formed steel." Thin-Walled Structures 48(10–11): 752-762.
Silvestre, N., P. Dinis, et al. (2012). "Developments on the design of cold-formed steel angles." Journal of Structural Engineering(post ahead of print).
Simulia (2011). "ABAQUS: User's manual." Stowell, E. Z. (1951). Compressive strength of flanges,. N. A. C. A. (NACA). Washigton D.C., United States.
Report 1029. Timoshenko, S. P. and J. M. Gere (1961). Theory of elastic stability, McGraw-Hill. Young, B. (2004). "Tests and design of fixed-ended cold-formed steel plain angle columns." Journal of
Structural Engineering 130(12): 1931-1940. Ziemian, R. D. (2010). Guide to stability design criteria for metal structures, John Wiley & Sons.

The behaviour and design of concentrically loaded T-section steel columns
School of Civil Engineering Research Report R933 Page 21 The University of Sydney
FIGURES
Figure 1 – Deformation modes: a) Flexural buckling in the plane of symmetry, b) Flexural-torsional buckling mode, c) Flexure about symmetry axis, d) Pure torsional and local buckling modes, and e) Local buckling
modes.
Figure 2 – Warping definition in both normal and perpendicular directions of point A.
Figure 3 – Geometric definition of a T-section.
(a) (b) (c) (d) (e)
S
n
n
ATangent
through A
r
h
n
s
b
B
Hh
y
x
y
T
T
C
S
w
0

The behaviour and design of concentrically loaded T-section steel columns
School of Civil Engineering Research Report R933 Page 22 The University of Sydney
Figure 4 – Buckling load for T-sections with: a) Ix < Iy and b) Ix > Iy.
Figure 5 – Plate buckling coefficient for T-section with equal size flange and web elements.
(a) I < I
0 50 100 150 200 250 300L/r
0
50
100
150
200
250
300
N (
kN)
0 50 100 150 200 250 3000
20
40
60
80
y L/ry
NFT
yx (b) I > Iyx
NFy
NFT (I > 0 )w
NFT (I = 0 )w
NFx
NTNFyNT
NFT
NFx
NFT(I = 0 )w
NFT(I > 0 )w
N (
kN)
50mm 50mm
2mm
2mm
Localbucklingmode
50mm
50mm 50mm
1mm
2mm
Localbucklingmode
100mm
yy
50mm 50mm
2mm
2mm
Localbucklingmode
(a)
0 2.5 5 7.5 10 12.5 15 17.5 20L/b
0
50
100
150
200
250
300
Buc
klin
g S
tres
s (M
Pa)
Asymptotic ( k = 0.425)
T(I > 0)w
Energysolution
Thinwall
solution and
50mm
(b)
T(I = 0)w

The behaviour and design of concentrically loaded T-section steel columns
School of Civil Engineering Research Report R933 Page 23 The University of Sydney
Figure 6 – Plate buckling coefficient for T-section with stocky flanges and slender web for L/b<20.
Figure 7 – Plate buckling coefficient for T-section with stocky flanges and slender web for L/b<100.
Figure 8 – Longitudinal stress distribution in T-section, a) pre-buckling stress and b) post-buckling stress.
(a)
0 2.5 5 7.5 10 12.5 15 17.5 20L/b
0
25
50
75
100B
uckl
ing
Str
ess
(MPa
)
Minimum ( k = 1.247)
n=3n=2n=1
T(I > 0)w
Thinwall
Energy solution50mm 50mm
1mm
2mm
Localbucklingmode
(b)
100mm
0 25 50 75 100L/b
0
25
50
75
100
Buc
klin
g S
tres
s (M
Pa)
Minimum ( k = 1.247)
T(I > 0)w
Energysolution
Thinwall
Thinwall
(a) av < crP (b) av > crP

The behaviour and design of concentrically loaded T-section steel columns
School of Civil Engineering Research Report R933 Page 24 The University of Sydney
Figure 9 – Overall bending induced by the shift of the effective centroid.
Figure 10 – (k1,k2)-space for T-sections.
(a) (b)
Figure 11 – Finite Element Model of Column M01_L2, a) undeformed shape and b) deformed shape of first buckling mode.
(a) Local bucklingof web
(b) Local bucklingof flange
C
CC
C
Centroid (C) Centroid (C)C C
e
e
= h/b
0 1 2 3 4 5
k
0
0.5
1
1.5
2
TT
1
k2 ----= w
Equal local bucklingstresses of web andflange ( = )k1 k2
T=Tw
NFx>NFy NFx=NFy
Test - T sectionsN - series T - sectionsM - series T - sections
NFx<NFy
Sections Sections SectionsN03 N02 N01

The behaviour and design of concentrically loaded T-section steel columns
School of Civil Engineering Research Report R933 Page 25 The University of Sydney
Figure 12 – Bilinear stress-strain diagram adopted for the FE material.
Figure 13 – Cross-section geometries of the columns tested by Kitipornchai and Lee (1986), dimensions in
mm.
Figure 14 – Residual stresses pattern for an I-section according to ECCS (1976).
E1
fy
y
T5 and T6
147.5
127.0
9.8
5.9
x
y
C
T3 and T4
133.5
99.5
7.8
5.8
x
y
C
T1 and T2
75.6
75.0
10
6.4x
y
C
d
bf
r
r r
r
d / b < 1.2 : = 0.5frf y
d / b > 1.2 : = 0.3frf y
r
rr
r

The behaviour and design of concentrically loaded T-section steel columns
School of Civil Engineering Research Report R933 Page 26 The University of Sydney
Figure 15 – N-series T-sections.
Figure 16 – T-sections obtained from standard I-sections.
Dimensions in mm
N01
N02
N03
x
x
x
B = 100 B = 100
B = 200
H = BT = T
y
y
y
w
T = Tw
T = Tw
k
H = B/4 = 50
H = 2B = 200
T T
T
xxx
xx
y
y
M01
yy
y
M02
M03
M04 M05
190228
149 133 99
14.8
301
227
149
8.0 7.8
101 99
7.0
12.7
Dimensions in mm
8.5
10.6
5.5
5.8 4.5
CC
C C C

The behaviour and design of concentrically loaded T-section steel columns
School of Civil Engineering Research Report R933 Page 27 The University of Sydney
(a)
(b)
Figure 17: a) Deformed shape of Specimen N01_T1L4 at the ultimate load (amplified 10 times); b) Force-displacement behaviour for specimen N01_T1L4.
0
50
100
150
200
250
0 10 20 30 40 50
Compression
Force [kN
]
Transverse Displacement of the cross‐section lower point at mid‐span [mm]
Failure N01_T1L4
The behaviour and design of concentrically loaded T-section steel columns
School of Civil Engineering Research Report R933 Page 28 The University of Sydney
Figure 18 – Relationship between the non-dimensional failure stress/yielding stress and: a) the normalised
flexural slenderness (e), b) the normalised global slenderness (r). Note: In calculating r, the flexural-torsional buckling load includes secondary warping rigidity by determining Iw using eqn. (4).
(a)
0 1 2 3 4 5
0
0.2
0.4
0.6
0.8
1.0
1.2N01_T1
e
N
N---- vs
u
Ye = max
NN----Y
Fx
,NN----Y
Fy
N01_T2
N01_T3
N01_T4
N02_T1
N02_T2
N02_T3
N02_T4
N03_T1
N03_T2
N03_T3
N03_T4
(1.0)
(1.5)
(2.0)
(0.5)
(1.0)
(1.5)
(2.0)
(0.5)
(1.0)
(1.5)
(2.0)
(0.5)
Y T
N
N----
u
Y
(b)
0 1 2 3 4 5
0
0.2
0.4
0.6
0.8
1.0
1.2
e
N
N---- vs
u
Ye = min
NN----Y
Fx
,NN----Y
Fy
N01_T1
N01_T2
N01_T3
N01_T4
N02_T1
N02_T2
N02_T3
N02_T4
N03_T1
N03_T2
N03_T3
(1.0)
(1.5)
(2.0)
(0.5)
(1.0)
(1.5)
(2.0)
(0.5)
(1.0)
(1.5)
(2.0)
Y T
N
N----
u
Y

The behaviour and design of concentrically loaded T-section steel columns
School of Civil Engineering Research Report R933 Page 29 The University of Sydney
TABLES
Cross section Dimensions1 Geometric Prop. Theoretical Elastic Buckling Loads
Abaqus 1st Fundamental Buckling Load
Abaqus 2nd Fundamental Buckling Load
ID B T H Tw L6 A Ncr,x4 Ncr,y Ncr,T Ncr,FT
4 Ncr,1 Type of Buckling
Ratio Ncr,abaqus/Ncr
Ncr,2 Type of Buckling
Ratio Ncr,abaqus/Ncr
[-] [mm] [mm] [mm] [mm] [mm] [mm2] [kN] [kN] [kN] [kN] [kN] [-] [-] [kN] [-] [-] T1 75.6 10.0 75.0 6.4 685 1172 2386 1627 2854 1382 1419 FT 1.026 2373 F 0.994 T2 75.6 10.0 75.0 6.4 785 1172 1817 1239 2829 1105 1125 FT 1.018 1800 F 0.991 T3 133.5 7.8 99.5 5.8 1785 1573 828 1026 1108 776 778 FT 1.003 815 F 0.984 T4 133.5 7.8 99.5 5.8 1985 1573 670 830 1105 680 661 F 0.987 682 FT 1.003 T5 147.5 9.8 127.0 5.9 1785 2137 1783 1739 1575 1194 1170 FT 0.980 T6 147.5 9.8 127.0 5.9 1985 2137 1441 1406 1570 1071 1058 FT 0.988
F flexural buckling about the horizontal axis FT flexural-torsional buckling (flexural component about the vertical (symmetry) axis
Table 1: Geometric properties and buckling loads of T-section members tested by Kitipornchai and Lee (1986).
Geometric
Imperfections Ratio - L/dmax
1500 1750 2000
Pult,test Pult,num Pnum/Ptest Error Pult,num Pnum/Ptest Error Pult,num Pnum/Ptest Error [kN] [kN] [-] [-] [kN] [-] [-] [kN] [-] [-]
T1 315 310.3 0.985 1.5% 311.4 0.989 1.1% 312.3 0.991 0.9% T2 320 294.7 0.921 7.9% 296.1 0.925 7.5% 297.2 0.929 7.1% T3 371 369.7 0.996 0.4% 371.7 1.002 -0.2% 373.3 1.006 -0.6% T4 385 347.5 0.903 9.7% 350.1 0.909 9.1% 351.6 0.913 8.7% T5 519 523.9 1.009 -0.9% 526.4 1.014 -1.4% 528.2 1.018 -1.8% T6 513 502.9 0.980 2.0% 505.6 0.986 1.4% 507.7 0.990 1.0% Average (Ā) 0.966 Average (Ā) 0.971 Average (Ā) 0.975
Standard Deviation ()
0.043 Standard
Deviation () 0.043
Standard
Deviation () 0.043
Table 2: Failure load of FE models considering geometric imperfections with different ratios of span/maximum displacement.
Cross section Dimensions1 Geometric Prop. Elastic Buckling Loads3 Ratios
ID B T H Tw L6 A Ncr,x4 Ncr,y Ncr,T Ncr,FT
4 e r NY/Ncr,T (Cw=0) Ixx/Iyy [-] [mm] [mm] [mm] [mm] [mm] [mm2] [kN] [kN] [kN] [kN] [-] [-] [-] [-]
N01_T1L1 100.0 10.7 200.0 10.7 328 3095.5 2.52E+05 1.76E+04 1.67E+03 1.60E+03 0.25 0.83 1.0 14.34 N01_T1L2 100.0 10.7 200.0 10.7 655 3095.5 6.31E+04 4.40E+03 1.25E+03 1.08E+03 0.50 1.01 1.0 14.34 N01_T1L3 100.0 10.7 200.0 10.7 1310 3095.5 1.58E+04 1.10E+03 1.14E+03 6.60E+02 1.00 1.29 1.0 14.34 N01_T1L4 100.0 10.7 200.0 10.7 2621 3095.5 3.94E+03 2.75E+02 1.11E+03 2.42E+02 2.00 2.13 1.0 14.34 N01_T1L5 100.0 10.7 200.0 10.7 5243 3095.5 9.85E+02 6.87E+01 1.11E+03 6.66E+01 4.00 4.06 1.0 14.34 N01_T1L6 100.0 10.7 200.0 10.7 134 3095.5 1.50E+06 1.05E+05 4.49E+03 4.40E+03 0.10 0.50 1.0 14.34 N01_T2L1 100.0 8.8 200.0 8.8 325 2562.6 2.14E+05 1.46E+04 9.36E+02 9.07E+02 0.25 1.00 1.5 14.66 N01_T2L2 100.0 8.8 200.0 8.8 650 2562.6 5.34E+04 3.65E+03 6.93E+02 6.29E+02 0.50 1.20 1.5 14.66 N01_T2L3 100.0 8.8 200.0 8.8 1301 2562.6 1.34E+04 9.11E+02 6.32E+02 4.37E+02 1.00 1.44 1.5 14.66 N01_T2L4 100.0 8.8 200.0 8.8 2603 2562.6 3.34E+03 2.28E+02 6.17E+02 1.88E+02 2.00 2.20 1.5 14.66 N01_T2L5 100.0 8.8 200.0 8.8 5208 2562.6 8.33E+02 5.69E+01 6.13E+02 5.43E+01 4.00 4.09 1.5 14.66 N01_T2L6 100.0 8.8 200.0 8.8 106 2562.6 2.03E+06 1.39E+05 3.69E+03 3.64E+03 0.08 0.50 1.5 14.66 N01_T2L7 100.0 8.8 200.0 8.8 202 2562.6 5.53E+05 3.78E+04 1.45E+03 1.42E+03 0.16 0.80 1.5 14.66 N01_T3L1 100.0 7.6 200.0 7.6 325 2222.2 1.86E+05 1.25E+04 6.03E+02 5.89E+02 0.25 1.16 2.0 14.86 N01_T3L2 100.0 7.6 200.0 7.6 648 2222.2 4.70E+04 3.16E+03 4.46E+02 4.16E+02 0.50 1.38 2.0 14.86 N01_T3L3 100.0 7.6 200.0 7.6 1296 2222.2 1.17E+04 7.90E+02 4.07E+02 3.10E+02 1.00 1.60 2.0 14.86 N01_T3L4 100.0 7.6 200.0 7.6 2593 2222.2 2.93E+03 1.97E+02 3.97E+02 1.52E+02 2.00 2.28 2.0 14.86 N01_T3L5 100.0 7.6 200.0 7.6 5188 2222.2 7.33E+02 4.93E+01 3.94E+02 4.63E+01 4.00 4.13 2.0 14.86 N01_T3L6 100.0 7.6 200.0 7.6 89 2222.2 2.49E+06 1.67E+05 3.19E+03 3.16E+03 0.07 0.50 2.0 14.86 N01_T3L7 100.0 7.6 200.0 7.6 161 2222.2 7.60E+05 5.12E+04 1.25E+03 1.23E+03 0.12 0.80 2.0 14.86 N01_T4L1 100.0 14.9 200.0 14.9 333 4248.0 3.28E+05 2.41E+04 4.47E+03 4.07E+03 0.25 0.61 0.5 13.60 N01_T4L2 100.0 14.9 200.0 14.9 666 4248.0 8.20E+04 6.03E+03 3.38E+03 2.51E+03 0.50 0.78 0.5 13.60 N01_T4L3 100.0 14.9 200.0 14.9 1333 4248.0 2.05E+04 1.51E+03 3.10E+03 1.17E+03 1.00 1.14 0.5 13.60 N01_T4L4 100.0 14.9 200.0 14.9 2666 4248.0 5.13E+03 3.77E+02 3.03E+03 3.54E+02 2.00 2.06 0.5 13.60 N01_T4L5 100.0 14.9 200.0 14.9 5332 4248.0 1.28E+03 9.43E+01 3.02E+03 9.28E+01 4.00 4.03 0.5 13.60 N01_T4L6 100.0 14.9 200.0 14.9 219 4248.0 7.58E+05 5.58E+04 6.39E+03 6.04E+03 0.16 0.50 0.5 13.60 N01_T5L1 100.0 6.8 200.0 6.8 323 1993.8 1.70E+05 1.13E+04 4.33E+02 4.25E+02 0.25 1.29 2.5 14.99 N01_T5L2 100.0 6.8 200.0 6.8 647 1993.8 4.24E+04 2.83E+03 3.19E+02 3.02E+02 0.50 1.53 2.5 14.99 N01_T5L3 100.0 6.8 200.0 6.8 1294 1993.8 1.06E+04 7.08E+02 2.91E+02 2.34E+02 1.00 1.74 2.5 14.99 N01_T5L4 100.0 6.8 200.0 6.8 2588 1993.8 2.65E+03 1.77E+02 2.84E+02 1.27E+02 2.00 2.36 2.5 14.99 N01_T5L5 100.0 6.8 200.0 6.8 5176 1993.8 6.63E+02 4.42E+01 2.82E+02 4.09E+01 4.00 4.16 2.5 14.99 N01_T5L6 100.0 6.8 200.0 6.8 138 1993.8 9.30E+05 6.20E+04 1.11E+03 1.10E+03 0.11 0.80 2.5 14.99 N02_T1L1 100.0 4.0 73.4 4.0 423 677.8 3.85E+03 3.86E+03 2.54E+02 2.51E+02 0.25 0.98 1.0 1.00 N02_T1L2 100.0 4.0 73.4 4.0 847 677.8 9.64E+02 9.65E+02 2.47E+02 2.33E+02 0.50 1.02 1.0 1.00 N02_T1L3 100.0 4.0 73.4 4.0 1693 677.8 2.41E+02 2.41E+02 2.45E+02 1.70E+02 1.00 1.19 1.0 1.00 N02_T1L4 100.0 4.0 73.4 4.0 3389 677.8 6.02E+01 6.02E+01 2.44E+02 5.70E+01 2.00 2.05 1.0 1.00 N02_T1L5 100.0 4.0 73.4 4.0 6777 677.8 1.50E+01 1.51E+01 2.44E+02 1.49E+01 4.00 4.02 1.0 1.00 N02_T1L6 100.0 4.0 73.4 4.0 51 677.8 2.66E+05 2.66E+05 9.64E+02 9.64E+02 0.03 0.50 1.0 1.00 N02_T1L7 100.0 4.0 73.4 4.0 144 677.8 3.32E+04 3.32E+04 3.34E+02 3.33E+02 0.09 0.85 1.0 1.00 N02_T2L1 100.0 3.2 73.1 3.2 423 543.6 3.09E+03 3.09E+03 1.31E+02 1.30E+02 0.25 1.22 1.5 1.00 N02_T2L2 100.0 3.2 73.1 3.2 847 543.6 7.72E+02 7.72E+02 1.27E+02 1.22E+02 0.50 1.26 1.5 1.00 N02_T2L3 100.0 3.2 73.1 3.2 1693 543.6 1.93E+02 1.93E+02 1.26E+02 1.03E+02 1.00 1.37 1.5 1.00 N02_T2L4 100.0 3.2 73.1 3.2 3386 543.6 4.83E+01 4.82E+01 1.25E+02 4.38E+01 2.00 2.10 1.5 1.00 N02_T2L5 100.0 3.2 73.1 3.2 6772 543.6 1.21E+01 1.21E+01 1.25E+02 1.18E+01 4.00 4.04 1.5 1.00 N02_T2L6 100.0 3.2 73.1 3.2 39 543.6 3.73E+05 3.73E+05 7.72E+02 7.72E+02 0.02 0.50 1.5 1.00 N02_T2L7 100.0 3.2 73.1 3.2 82 543.6 8.18E+04 8.18E+04 2.67E+02 2.67E+02 0.05 0.85 1.5 1.00 N02_T3L1 100.0 2.8 72.9 2.8 423 476.1 2.70E+03 2.70E+03 8.76E+01 8.71E+01 0.25 1.39 2.0 1.00 N02_T3L2 100.0 2.8 72.9 2.8 847 476.1 6.75E+02 6.75E+02 8.49E+01 8.28E+01 0.50 1.43 2.0 1.00 N02_T3L3 100.0 2.8 72.9 2.8 1691 476.1 1.69E+02 1.69E+02 8.43E+01 7.37E+01 1.00 1.51 2.0 1.00 N02_T3L4 100.0 2.8 72.9 2.8 3384 476.1 4.23E+01 4.23E+01 8.41E+01 3.69E+01 2.00 2.14 2.0 1.00 N02_T3L5 100.0 2.8 72.9 2.8 6768 476.1 1.06E+01 1.06E+01 8.41E+01 1.03E+01 4.00 4.05 2.0 1.00 N02_T3L6 100.0 2.8 72.9 2.8 33 476.1 4.45E+05 4.45E+05 6.76E+02 6.76E+02 0.02 0.50 2.0 1.00 N02_T3L7 100.0 2.8 72.9 2.8 65 476.1 1.13E+05 1.13E+05 2.35E+02 2.34E+02 0.04 0.85 2.0 1.00 N02_T4L1 100.0 5.6 74.3 5.6 423 944.8 5.41E+03 5.41E+03 6.94E+02 6.76E+02 0.25 0.70 0.5 1.00 N02_T4L2 100.0 5.6 74.3 5.6 850 944.8 1.34E+03 1.34E+03 6.72E+02 5.87E+02 0.50 0.76 0.5 1.00 N02_T4L3 100.0 5.6 74.3 5.6 1700 944.8 3.35E+02 3.35E+02 6.67E+02 2.92E+02 1.00 1.07 0.5 1.00 N02_T4L4 100.0 5.6 74.3 5.6 3400 944.8 8.38E+01 8.38E+01 6.66E+02 8.17E+01 2.00 2.03 0.5 1.00 N02_T4L5 100.0 5.6 74.3 5.6 6800 944.8 2.10E+01 2.10E+01 6.65E+02 2.08E+01 4.00 4.01 0.5 1.00 N02_T4L6 100.0 5.6 74.3 5.6 86 944.8 1.30E+05 1.30E+05 1.35E+03 1.35E+03 0.05 0.50 0.5 1.00 N02_T5L1 100.0 2.5 72.7 2.5 423 425.5 2.41E+03 2.41E+03 6.24E+01 6.21E+01 0.25 1.56 2.5 1.00 N02_T5L2 100.0 2.5 72.7 2.5 846 425.5 6.05E+02 6.04E+02 6.05E+01 5.93E+01 0.50 1.60 2.5 1.00

The behaviour and design of concentrically loaded T-section steel columns
School of Civil Engineering Research Report R933 Page 30 The University of Sydney
N02_T5L3 100.0 2.5 72.7 2.5 1691 425.5 1.51E+02 1.51E+02 6.00E+01 5.43E+01 1.00 1.67 2.5 1.00 N02_T5L4 100.0 2.5 72.7 2.5 3382 425.5 3.78E+01 3.78E+01 5.99E+01 3.13E+01 2.00 2.20 2.5 1.00 N02_T5L5 100.0 2.5 72.7 2.5 6764 425.5 9.45E+00 9.44E+00 5.99E+01 9.13E+00 4.00 4.07 2.5 1.00 N02_T5L6 100.0 2.5 72.7 2.5 51 425.5 1.66E+05 1.66E+05 2.36E+02 2.36E+02 0.03 0.80 2.5 1.00 N03_T1L1 200.0 6.1 50.0 6.1 212 1487.8 8.45E+03 1.87E+05 7.36E+02 7.36E+02 0.25 0.85 1.0 0.05 N03_T1L2 200.0 6.1 50.0 6.1 425 1487.8 2.11E+03 4.67E+04 5.77E+02 5.77E+02 0.50 0.96 1.0 0.05 N03_T1L3 200.0 6.1 50.0 6.1 850 1487.8 5.28E+02 1.17E+04 5.38E+02 5.37E+02 1.00 1.00 1.0 0.05 N03_T1L4 200.0 6.1 50.0 6.1 1700 1487.8 1.32E+02 2.92E+03 5.28E+02 5.27E+02 2.00 2.00 1.0 0.05 N03_T1L5 200.0 6.1 50.0 6.1 3399 1487.8 3.30E+01 7.30E+02 5.25E+02 5.16E+02 4.00 4.00 1.0 0.05 N03_T1L6 200.0 6.1 50.0 6.1 78 1487.8 6.34E+04 1.40E+06 2.11E+03 2.11E+03 0.09 0.50 1.0 0.05 N03_T2L1 200.0 5.0 50.0 5.0 215 1225.0 6.96E+03 1.50E+05 4.05E+02 4.05E+02 0.25 1.04 1.5 0.05 N03_T2L2 200.0 5.0 50.0 5.0 430 1225.0 1.74E+03 3.75E+04 3.19E+02 3.19E+02 0.50 1.17 1.5 0.05 N03_T2L3 200.0 5.0 50.0 5.0 859 1225.0 4.35E+02 9.36E+03 2.97E+02 2.97E+02 1.00 1.21 1.5 0.05 N03_T2L4 200.0 5.0 50.0 5.0 1718 1225.0 1.09E+02 2.34E+03 2.92E+02 2.92E+02 2.00 2.00 1.5 0.05 N03_T2L5 200.0 5.0 50.0 5.0 3436 1225.0 2.72E+01 5.85E+02 2.91E+02 2.89E+02 4.00 4.00 1.5 0.05 N03_T2L6 200.0 5.0 50.0 5.0 60 1225.0 8.81E+04 1.90E+06 1.74E+03 1.74E+03 0.07 0.50 1.5 0.05 N03_T2L7 200.0 5.0 50.0 5.0 130 1225.0 1.89E+04 4.08E+05 6.02E+02 6.02E+02 0.15 0.85 1.5 0.05 N03_T3L1 200.0 4.3 50.0 4.3 216 1056.5 6.00E+03 1.27E+05 2.57E+02 2.57E+02 0.25 1.21 2.0 0.05 N03_T3L2 200.0 4.3 50.0 4.3 433 1056.5 1.50E+03 3.17E+04 2.03E+02 2.03E+02 0.50 1.36 2.0 0.05 N03_T3L3 200.0 4.3 50.0 4.3 865 1056.5 3.75E+02 7.94E+03 1.90E+02 1.90E+02 1.00 1.41 2.0 0.05 N03_T3L4 200.0 4.3 50.0 4.3 1731 1056.5 9.38E+01 1.98E+03 1.86E+02 1.86E+02 2.00 2.00 2.0 0.05 N03_T3L5 200.0 4.3 50.0 4.3 3461 1056.5 2.34E+01 4.96E+02 1.86E+02 1.85E+02 4.00 4.00 2.0 0.05 N03_T3L6 200.0 4.3 50.0 4.3 51 1056.5 1.10E+05 2.32E+06 1.50E+03 1.50E+03 0.06 0.50 2.0 0.05 N03_T3L7 200.0 4.3 50.0 4.3 100 1056.5 2.79E+04 5.90E+05 5.20E+02 5.20E+02 0.12 0.85 2.0 0.05 N03_T4L1 200.0 8.7 50.0 8.7 208 2099.3 1.19E+04 2.79E+05 2.14E+03 2.14E+03 0.25 0.59 0.5 0.04 N03_T4L2 200.0 8.7 50.0 8.7 415 2099.3 2.98E+03 6.97E+04 1.66E+03 1.66E+03 0.50 0.67 0.5 0.04 N03_T4L3 200.0 8.7 50.0 8.7 831 2099.3 7.45E+02 1.74E+04 1.54E+03 1.54E+03 1.00 1.00 0.5 0.04 N03_T4L4 200.0 8.7 50.0 8.7 1662 2099.3 1.86E+02 4.36E+03 1.51E+03 1.51E+03 2.00 2.00 0.5 0.04 N03_T4L5 200.0 8.7 50.0 8.7 3323 2099.3 4.66E+01 1.09E+03 1.50E+03 1.07E+03 4.00 4.00 0.5 0.04 N03_T4L6 200.0 8.7 50.0 8.7 136 2099.3 2.78E+04 6.51E+05 2.98E+03 2.98E+03 0.16 0.50 0.5 0.04
M01L1_610UB101 228.0 14.8 301.0 10.6 911 6408.1 1.42E+05 3.65E+04 1.97E+03 1.94E+03 0.25 1.08 1.3 3.89 M01L2_610UB101 228.0 14.8 301.0 10.6 1826 6408.1 3.54E+04 9.10E+03 1.85E+03 1.72E+03 0.50 1.15 1.3 3.89 M01L3_610UB101 228.0 14.8 301.0 10.6 3651 6408.1 8.86E+03 2.28E+03 1.81E+03 1.29E+03 1.00 1.33 1.3 3.89 M01L4_610UB101 228.0 14.8 301.0 10.6 7306 6408.1 2.21E+03 5.69E+02 1.81E+03 5.07E+02 2.00 2.12 1.3 3.89 M01L5_610UB101 228.0 14.8 301.0 10.6 14612 6408.1 5.53E+02 1.42E+02 1.80E+03 1.39E+02 4.00 4.05 1.3 3.89 M01L6_610UB101 228.0 14.8 301.0 10.6 138 6408.1 6.16E+06 1.58E+06 9.15E+03 9.13E+03 0.04 0.50 1.3 3.89 M01L7_610UB101 228.0 14.8 301.0 10.6 322 6408.1 1.14E+06 2.93E+05 3.16E+03 3.15E+03 0.09 0.85 1.3 3.89 M02L1_460UB67.1 190.0 12.7 227.0 8.5 789 4234.6 6.79E+04 2.42E+04 1.69E+03 1.66E+03 0.25 0.95 0.9 2.80 M02L2_460UB67.1 190.0 12.7 227.0 8.5 1582 4234.6 1.69E+04 6.02E+03 1.61E+03 1.48E+03 0.50 1.01 0.9 2.80 M02L3_460UB67.1 190.0 12.7 227.0 8.5 3164 4234.6 4.22E+03 1.51E+03 1.59E+03 1.02E+03 1.00 1.21 0.9 2.80 M02L4_460UB67.1 190.0 12.7 227.0 8.5 6332 4234.6 1.05E+03 3.76E+02 1.59E+03 3.49E+02 2.00 2.07 0.9 2.80 M02L5_460UB67.1 190.0 12.7 227.0 8.5 12664 4234.6 2.63E+02 9.40E+01 1.59E+03 9.24E+01 4.00 4.03 0.9 2.80 M02L6_460UB67.1 190.0 12.7 227.0 8.5 121 4234.6 2.88E+06 1.03E+06 6.04E+03 6.03E+03 0.04 0.50 0.9 2.80 M02L7_460UB67.1 190.0 12.7 227.0 8.5 359 4234.6 3.28E+05 1.17E+05 2.09E+03 2.08E+03 0.11 0.85 0.9 2.80 M03L1_310UB32.0 149.0 8.0 149.0 5.5 639 1967.5 1.98E+04 1.12E+04 7.15E+02 7.04E+02 0.25 1.00 1.0 1.77 M03L2_310UB32.0 149.0 8.0 149.0 5.5 1279 1967.5 4.94E+03 2.80E+03 6.90E+02 6.48E+02 0.50 1.04 1.0 1.77 M03L3_310UB32.0 149.0 8.0 149.0 5.5 2558 1967.5 1.24E+03 6.99E+02 6.84E+02 4.72E+02 1.00 1.22 1.0 1.77 M03L4_310UB32.0 149.0 8.0 149.0 5.5 5119 1967.5 3.08E+02 1.75E+02 6.82E+02 1.63E+02 2.00 2.07 1.0 1.77 M03L5_310UB32.0 149.0 8.0 149.0 5.5 10237 1967.5 7.71E+01 4.37E+01 6.82E+02 4.30E+01 4.00 4.03 1.0 1.77 M03L6_310UB32.0 149.0 8.0 149.0 5.5 80 1967.5 1.27E+06 7.16E+05 2.80E+03 2.79E+03 0.03 0.50 1.0 1.77 M03L7_310UB32.0 149.0 8.0 149.0 5.5 217 1967.5 1.72E+05 9.73E+04 9.69E+02 9.67E+02 0.08 0.85 1.0 1.77 M04L1_200UB25.4 133.0 7.8 101.0 5.8 549 1578.0 8.97E+03 1.05E+04 1.10E+03 1.08E+03 0.25 0.72 0.5 0.85 M04L2_200UB25.4 133.0 7.8 101.0 5.8 1097 1578.0 2.24E+03 2.64E+03 1.07E+03 9.82E+02 0.50 0.76 0.5 0.85 M04L3_200UB25.4 133.0 7.8 101.0 5.8 2194 1578.0 5.61E+02 6.59E+02 1.06E+03 5.66E+02 1.00 1.00 0.5 0.85 M04L4_200UB25.4 133.0 7.8 101.0 5.8 4391 1578.0 1.40E+02 1.65E+02 1.06E+03 1.60E+02 2.00 2.00 0.5 0.85 M04L5_200UB25.4 133.0 7.8 101.0 5.8 8782 1578.0 3.50E+01 4.11E+01 1.05E+03 4.09E+01 4.00 4.00 0.5 0.85 M04L6_200UB25.4 133.0 7.8 101.0 5.8 103 1578.0 2.55E+05 3.00E+05 2.24E+03 2.24E+03 0.05 0.50 0.5 0.85 M05L1_200UB18.2 99.0 7.0 99.0 4.5 433 1107.0 1.03E+04 6.26E+03 7.07E+02 6.90E+02 0.25 0.75 0.6 1.64 M05L2_200UB18.2 99.0 7.0 99.0 4.5 864 1107.0 2.58E+03 1.57E+03 6.85E+02 6.08E+02 0.50 0.80 0.6 1.64 M05L3_200UB18.2 99.0 7.0 99.0 4.5 1728 1107.0 6.46E+02 3.93E+02 6.80E+02 3.30E+02 1.00 1.09 0.6 1.64 M05L4_200UB18.2 99.0 7.0 99.0 4.5 3458 1107.0 1.61E+02 9.82E+01 6.78E+02 9.51E+01 2.00 2.03 0.6 1.64 M05L5_200UB18.2 99.0 7.0 99.0 4.5 6915 1107.0 4.03E+01 2.46E+01 6.78E+02 2.44E+01 4.00 4.02 0.6 1.64 M05L6_200UB18.2 99.0 7.0 99.0 4.5 78 1107.0 3.14E+05 1.91E+05 1.58E+03 1.57E+03 0.05 0.50 0.6 1.64
Table 3: Geometric properties and elastic buckling modes of Series N and M T-section columns.

The behaviour and design of concentrically loaded T-section steel columns
School of Civil Engineering Research Report R933 Page 31 The University of Sydney
Test or FE
strength AS4100 EC3-1.1 AISC360
Modified EC3-1.1 Modified AISC360
Iw=0 Iw>0 Iw=0 Iw=0 Iw>0 Iw>0
Fcry(Q<1) Fcry(Q=1) Fcry(Q<1) Fcry(Q=1)
ID e Nu Failure Ae/A Nu/Nc Aeff/A Nu/Nb,Rk Q Nu/Pn Nu/Nb,Rk Nu/Nb,Rk Nu/Pn Nu/Pn Nu/Pn Nu/Pn
[-] [-] [kN] Type [-] [-] [-] [-] [-] [-] [-] [-] [-] [-] [-] [-]
(1) (2) (3) (4) (5) (6) (7) (8) (9) (10) (11) (12) (13) (14) (15) (16)
T1 0.46 315 FT 1.00 1.12 1.00 1.07 1.00 1.00 1.02 1.02 1.00 1.00 1.00 1.00
T2 0.53 320 FT 1.00 1.21 1.00 1.13 1.00 1.05 1.07 1.06 1.05 1.05 1.05 1.05
T3 0.75 371 FT 0.97 1.30 0.95 1.21 1.00 1.02 1.07 1.07 1.02 1.02 1.02 1.02
T4 0.84 385 F 0.97 1.47 0.95 1.32 1.00 1.10 1.17 1.17 1.10 1.10 1.10 1.10
T5 0.61 519 P 0.91 1.23 0.90 1.24 0.92 1.08 1.06 1.06 1.08 1.01 1.07 1.01
T6 0.68 513 FT 0.91 1.29 0.90 1.26 0.92 1.09 1.08 1.08 1.10 1.03 1.10 1.03
N01_T1L1 0.25 1007 FT 0.84 1.14 0.82 1.90 0.97 1.43 1.56 1.30 1.60 1.57 1.35 1.32
N01_T1L2 0.50 830 FT 0.84 1.11 0.82 1.64 0.97 1.23 1.36 1.28 1.37 1.35 1.30 1.28
N01_T1L3 1.00 538 FT 0.84 1.11 0.82 1.35 0.97 1.00 1.15 1.13 1.07 1.05 1.05 1.04
N01_T1L4 2.00 211 FT 0.84 1.06 0.82 1.13 0.97 1.00 1.03 1.03 0.98 0.98 0.98 0.98
N01_T1L5 4.00 58.4 FT 0.84 0.98 0.82 1.00 0.97 1.00 0.95 0.95 1.00 1.00 1.00 1.00
N01_T1L6 0.10 1119 FT 0.84 1.21 0.82 2.09 0.97 1.57 1.71 1.15 1.75 1.73 1.19 1.16
N01_T2L1 0.25 720 FT 0.75 1.10 0.74 2.11 0.77 1.68 1.71 1.33 1.89 1.70 1.55 1.34
N01_T2L2 0.50 550 FT 0.75 0.98 0.74 1.67 0.77 1.32 1.37 1.27 1.49 1.34 1.40 1.24
N01_T2L3 1.00 379 FT 0.75 1.00 0.74 1.38 0.77 1.07 1.16 1.14 1.16 1.06 1.15 1.05
N01_T2L4 2.00 166 FT 0.75 1.03 0.74 1.15 0.77 1.01 1.04 1.04 0.99 0.99 0.99 0.99
N01_T2L5 4.00 47.9 FT 0.75 0.97 0.74 1.01 0.77 1.01 0.96 0.96 1.00 1.00 1.00 1.00
N01_T2L6 0.08 942 FT 0.75 1.38 0.74 2.73 0.77 2.17 2.22 1.17 2.45 2.20 1.49 1.35
N01_T2L7 0.16 850 FT 0.75 1.25 0.74 2.48 0.77 1.97 2.01 1.29 2.22 2.00 1.58 1.31
N01_T3L1 0.25 508 FT 0.69 0.97 0.69 2.12 0.59 1.81 1.74 1.28 2.04 1.69 1.66 1.28
N01_T3L2 0.50 380 FT 0.69 0.84 0.69 1.63 0.59 1.38 1.35 1.23 1.56 1.29 1.46 1.19
N01_T3L3 1.00 277 FT 0.69 0.89 0.69 1.37 0.59 1.13 1.16 1.14 1.24 1.05 1.23 1.03
N01_T3L4 2.00 136 FT 0.69 0.99 0.69 1.16 0.59 1.02 1.04 1.04 0.99 0.99 0.99 0.99
N01_T3L5 4.00 41.0 FT 0.69 0.97 0.69 1.01 0.59 1.01 0.96 0.96 1.00 1.00 1.00 1.00
N01_T3L6 0.07 828 FT 0.69 1.52 0.69 3.41 0.59 2.92 2.80 1.19 3.30 2.74 1.92 1.78
N01_T3L7 0.12 746 FT 0.69 1.37 0.69 3.08 0.59 2.64 2.53 1.31 2.98 2.47 1.96 1.60
N01_T4L1 0.25 1501 FT 1 1.06 0.96 1.45 1 1.32 1.30 1.20 1.32 1.32 1.32 1.32
N01_T4L2 0.50 1332 FT 1 1.13 0.96 1.38 1 1.24 1.23 1.19 1.24 1.24 1.24 1.24
N01_T4L3 1.00 837 FT 1 1.15 0.96 1.22 1 1.00 1.09 1.08 1.00 1.00 1.00 1.00
N01_T4L4 2.00 304 FT 1 1.07 0.96 1.09 1 0.97 1.02 1.02 0.97 0.97 0.97 0.97
N01_T4L5 4.00 81.2 FT 1 0.98 0.96 0.98 1 1.00 0.95 0.95 1.00 1.00 1.00 1.00
N01_T4L6 0.16 1508 FT 1 1.01 0.96 1.44 1 1.31 1.29 1.13 1.31 1.31 1.31 1.31
N01_T5L1 0.25 379 FT 0.65 0.85 0.66 2.08 0.47 1.88 1.73 1.24 2.12 1.67 1.73 1.22

The behaviour and design of concentrically loaded T-section steel columns
School of Civil Engineering Research Report R933 Page 32 The University of Sydney
N01_T5L2 0.50 285 FT 0.65 0.73 0.66 1.61 0.47 1.44 1.34 1.22 1.62 1.28 1.52 1.16
N01_T5L3 1.00 218 FT 0.65 0.80 0.66 1.38 0.47 1.20 1.17 1.15 1.33 1.07 1.31 1.04
N01_T5L4 2.00 114 FT 0.65 0.94 0.66 1.16 0.47 1.03 1.04 1.04 1.00 0.99 1.00 0.98
N01_T5L5 4.00 36.3 FT 0.65 0.96 0.66 1.02 0.47 1.01 0.96 0.96 1.00 1.00 1.00 1.00
N01_T5L6 0.11 678 FT 0.65 1.47 0.66 3.70 0.47 3.34 3.07 1.32 3.78 2.97 2.37 2.03
N02_T1L1 0.25 200 FT 0.91 0.97 0.87 1.65 0.99 1.27 1.39 1.36 1.21 1.20 1.19 1.18
N02_T1L2 0.50 184 FT 0.91 1.06 0.87 1.55 0.99 1.19 1.31 1.30 1.16 1.15 1.15 1.14
N02_T1L3 1.00 130 FT 0.91 1.18 0.87 1.30 0.99 0.99 1.12 1.12 1.00 1.00 1.00 1.00
N02_T1L4 2.00 45.9 FT 0.91 1.03 0.87 1.04 0.99 0.92 0.96 0.96 0.91 0.91 0.91 0.91
N02_T1L5 4.00 12.1 FT 0.91 0.92 0.87 0.92 0.99 0.93 0.88 0.88 0.93 0.93 0.93 0.93
N02_T1L6 0.03 252 FT 0.91 1.15 0.87 2.06 0.99 1.59 1.74 1.18 1.50 1.49 1.12 1.11
N02_T1L7 0.09 220 FT 0.91 1.01 0.87 1.80 0.99 1.39 1.52 1.32 1.31 1.30 1.16 1.15
N02_T2L1 0.25 113 FT 0.78 0.79 0.73 1.60 0.76 1.27 1.30 1.26 1.22 1.11 1.19 1.08
N02_T2L2 0.50 110 FT 0.78 0.90 0.73 1.57 0.76 1.24 1.28 1.27 1.21 1.10 1.20 1.09
N02_T2L3 1.00 87.8 FT 0.78 1.08 0.73 1.39 0.76 1.08 1.15 1.15 1.09 1.00 1.09 1.00
N02_T2L4 2.00 37.0 FT 0.78 1.08 0.73 1.11 0.76 0.96 1.00 1.00 0.95 0.95 0.95 0.95
N02_T2L5 4.00 9.80 FT 0.78 0.94 0.73 0.95 0.76 0.94 0.90 0.90 0.94 0.94 0.94 0.94
N02_T2L6 0.02 208 FT 0.78 1.39 0.73 2.92 0.76 2.31 2.36 1.22 2.21 2.02 1.47 1.41
N02_T2L7 0.05 178 FT 0.78 1.19 0.73 2.50 0.76 1.97 2.02 1.33 1.89 1.72 1.41 1.21
N02_T3L1 0.25 87.4 FT 0.68 0.79 0.65 1.73 0.60 1.43 1.39 1.34 1.38 1.20 1.34 1.16
N02_T3L2 0.50 83.7 FT 0.68 0.88 0.65 1.68 0.60 1.38 1.35 1.34 1.34 1.16 1.34 1.15
N02_T3L3 1.00 64.2 FT 0.68 0.97 0.65 1.38 0.60 1.13 1.13 1.13 1.13 0.97 1.13 0.97
N02_T3L4 2.00 31.6 FT 0.68 1.08 0.65 1.14 0.60 0.98 1.01 1.01 0.96 0.96 0.96 0.96
N02_T3L5 4.00 8.60 FT 0.68 0.95 0.65 0.96 0.60 0.95 0.91 0.91 0.95 0.95 0.95 0.95
N02_T3L6 0.02 186 FT 0.68 1.63 0.65 3.66 0.60 3.03 2.94 1.24 2.91 2.53 1.88 1.82
N02_T3L7 0.04 161 FT 0.68 1.41 0.65 3.17 0.60 2.62 2.54 1.37 2.52 2.19 1.77 1.58
N02_T4L1 0.25 331 FT 1 1.05 0.98 1.41 1 1.16 1.28 1.26 1.16 1.16 1.16 1.16
N02_T4L2 0.50 286 FT 1 1.10 0.98 1.26 1 1.07 1.14 1.14 1.07 1.07 1.07 1.07
N02_T4L3 1.00 191 FT 1 1.18 0.98 1.15 1 0.94 1.03 1.03 0.94 0.94 0.94 0.94
N02_T4L4 2.00 65.8 FT 1 1.04 0.98 1.03 1 0.92 0.96 0.96 0.92 0.92 0.92 0.92
N02_T4L5 4.00 16.9 FT 1 0.91 0.98 0.91 1 0.92 0.88 0.88 0.92 0.92 0.92 0.92
N02_T4L6 0.05 338 FT 1 1.01 0.98 1.42 1 1.16 1.29 1.14 1.16 1.16 1.16 1.16
N02_T5L1 0.25 72.3 FT 0.60 0.82 0.59 1.92 0.48 1.66 1.54 1.49 1.59 1.34 1.55 1.29
N02_T5L2 0.50 67.5 FT 0.60 0.87 0.59 1.81 0.48 1.56 1.46 1.45 1.51 1.26 1.50 1.25
N02_T5L3 1.00 55.3 FT 0.60 1.01 0.59 1.57 0.48 1.33 1.28 1.27 1.33 1.10 1.32 1.10
N02_T5L4 2.00 27.1 FT 0.60 1.07 0.59 1.16 0.48 0.99 1.01 1.01 0.97 0.96 0.97 0.96
N02_T5L5 4.00 7.60 FT 0.60 0.95 0.59 0.97 0.48 0.95 0.90 0.90 0.94 0.94 0.94 0.94
N02_T5L6 0.03 150 FT 0.60 1.65 0.59 3.98 0.48 3.43 3.19 1.37 3.29 2.77 2.22 2.06
N03_T1L1 0.25 483 FT 0.87 1.11 0.82 1.87 0.92 1.47 1.54 1.32 1.05 1.02 1.02 1.02
N03_T1L2 0.50 445 FT 0.87 1.21 0.82 1.73 0.92 1.35 1.42 1.35 1.01 1.01 1.01 1.01

The behaviour and design of concentrically loaded T-section steel columns
School of Civil Engineering Research Report R933 Page 33 The University of Sydney
N03_T1L3 1.00 396 FT 0.87 1.67 0.82 1.54 0.92 1.20 1.26 1.25 1.20 1.20 1.20 1.20
N03_T1L4 2.00 114 F 0.87 1.17 0.82 1.13 0.92 0.98 1.03 1.03 0.98 0.98 0.98 0.98
N03_T1L5 4.00 28.3 F 0.87 0.98 0.82 0.97 0.92 0.98 0.93 0.93 0.98 0.98 0.98 0.98
N03_T1L6 0.09 535 FT 0.87 1.16 0.82 2.08 0.92 1.63 1.70 1.15 1.16 1.11 1.11 1.11
N03_T2L1 0.25 336 FT 0.75 1.08 0.73 2.06 0.81 1.59 1.66 1.34 1.19 1.17 0.99 0.98
N03_T2L2 0.50 306 FT 0.75 1.15 0.73 1.88 0.81 1.45 1.51 1.42 1.09 1.07 1.01 0.98
N03_T2L3 1.00 271 FT 0.75 1.51 0.73 1.67 0.81 1.28 1.34 1.32 1.08 1.08 1.08 1.08
N03_T2L4 2.00 92.9 F 0.75 1.21 0.73 1.15 0.81 0.97 1.02 1.02 0.97 0.97 0.97 0.97
N03_T2L5 4.00 23.2 F 0.75 0.99 0.73 0.98 0.81 0.97 0.93 0.93 0.97 0.97 0.97 0.97
N03_T2L6 0.07 446 FT 0.75 1.38 0.73 2.74 0.81 2.11 2.21 1.16 1.58 1.56 1.27 1.27
N03_T2L7 0.15 382 FT 0.75 1.18 0.73 2.35 0.81 1.81 1.89 1.27 1.36 1.34 1.10 1.10
N03_T3L1 0.25 263 FT 0.67 1.09 0.66 2.33 0.71 1.81 1.89 1.48 1.44 1.43 1.10 1.04
N03_T3L2 0.50 248 FT 0.67 1.19 0.66 2.20 0.71 1.70 1.78 1.66 1.36 1.35 1.25 1.23
N03_T3L3 1.00 213 FT 0.67 1.46 0.66 1.89 0.71 1.46 1.52 1.49 1.17 1.16 1.14 1.13
N03_T3L4 2.00 79.3 F 0.67 1.23 0.66 1.16 0.71 0.96 1.01 1.01 0.96 0.96 0.96 0.96
N03_T3L5 4.00 19.7 F 0.67 0.98 0.66 0.97 0.71 0.96 0.91 0.91 0.96 0.96 0.96 0.96
N03_T3L6 0.06 389 FT 0.67 1.56 0.66 3.45 0.71 2.67 2.78 1.17 2.13 2.11 1.47 1.47
N03_T3L7 0.12 328 FT 0.67 1.31 0.66 2.91 0.71 2.25 2.35 1.26 1.80 1.78 1.25 1.24
N03_T4L1 0.25 752 FT 1 1.08 1.00 1.40 1 1.04 1.29 1.20 1.04 1.04 1.04 1.04
N03_T4L2 0.50 734 FT 1 1.26 1.00 1.36 1 1.09 1.26 1.23 1.09 1.09 1.09 1.09
N03_T4L3 1.00 584 F 1 1.63 1.00 1.45 1 1.19 1.31 1.31 1.19 1.19 1.19 1.19
N03_T4L4 2.00 170 F 1 1.22 1.00 1.16 1 1.04 1.09 1.09 1.04 1.04 1.04 1.04
N03_T4L5 4.00 42.5 F 1 1.03 1.00 1.02 1 1.04 0.99 0.99 1.04 1.04 1.04 1.04
N03_T4L6 0.16 765 FT 1 1.04 1.00 1.42 1 1.04 1.31 1.16 1.04 1.04 1.04 1.04
M01L1_610UB101 0.25 1422 FT 0.76 0.86 0.76 1.50 0.51 1.62 1.21 1.15 1.62 1.24 1.58 1.24
M01L2_610UB101 0.50 1439 P 0.76 1.01 0.76 1.56 0.51 1.66 1.27 1.25 1.69 1.27 1.68 1.27
M01L3_610UB101 1.00 1081 FT 0.76 1.14 0.76 1.38 0.51 1.37 1.15 1.15 1.42 1.03 1.42 1.03
M01L4_610UB101 2.00 447 FT 0.76 1.11 0.76 1.15 0.51 1.01 1.04 1.04 1.00 0.99 1.00 0.99
M01L5_610UB101 4.00 121 FT 0.76 0.98 0.76 1.00 0.51 1.00 0.95 0.95 0.99 0.99 0.99 0.99
M01L6_610UB101 0.04 2348 FT 0.76 1.35 0.76 2.45 0.51 2.66 1.98 1.17 2.65 2.04 2.13 2.04
M01L7_610UB101 0.09 1806 FT 0.76 1.04 0.76 1.89 0.51 2.05 1.52 1.15 2.04 1.57 1.80 1.57
M02L1_460UB67.1 0.25 1139 FT 0.80 0.99 0.80 1.55 0.57 1.67 1.25 1.21 1.63 1.33 1.60 1.33
M02L2_460UB67.1 0.50 1118 FT 0.80 1.14 0.80 1.56 0.57 1.66 1.27 1.26 1.65 1.33 1.65 1.33
M02L3_460UB67.1 1.00 814 FT 0.80 1.26 0.80 1.38 0.57 1.35 1.15 1.15 1.39 1.04 1.39 1.04
M02L4_460UB67.1 2.00 305 FT 0.80 1.13 0.80 1.14 0.57 1.00 1.03 1.03 0.99 0.99 0.99 0.99
M02L5_460UB67.1 4.00 80.4 FT 0.80 0.98 0.80 0.99 0.57 0.99 0.94 0.94 0.99 0.99 0.99 0.99
M02L6_460UB67.1 0.04 1533 FT 0.80 1.28 0.80 2.07 0.57 2.24 1.66 1.15 2.17 1.78 1.86 1.78
M02L7_460UB67.1 0.11 1102 FT 0.80 0.92 0.80 1.49 0.57 1.61 1.20 1.06 1.56 1.28 1.48 1.28
M03L1_310UB32.0 0.25 519 P 0.81 0.96 0.81 1.56 0.56 1.70 1.27 1.24 1.62 1.35 1.60 1.35
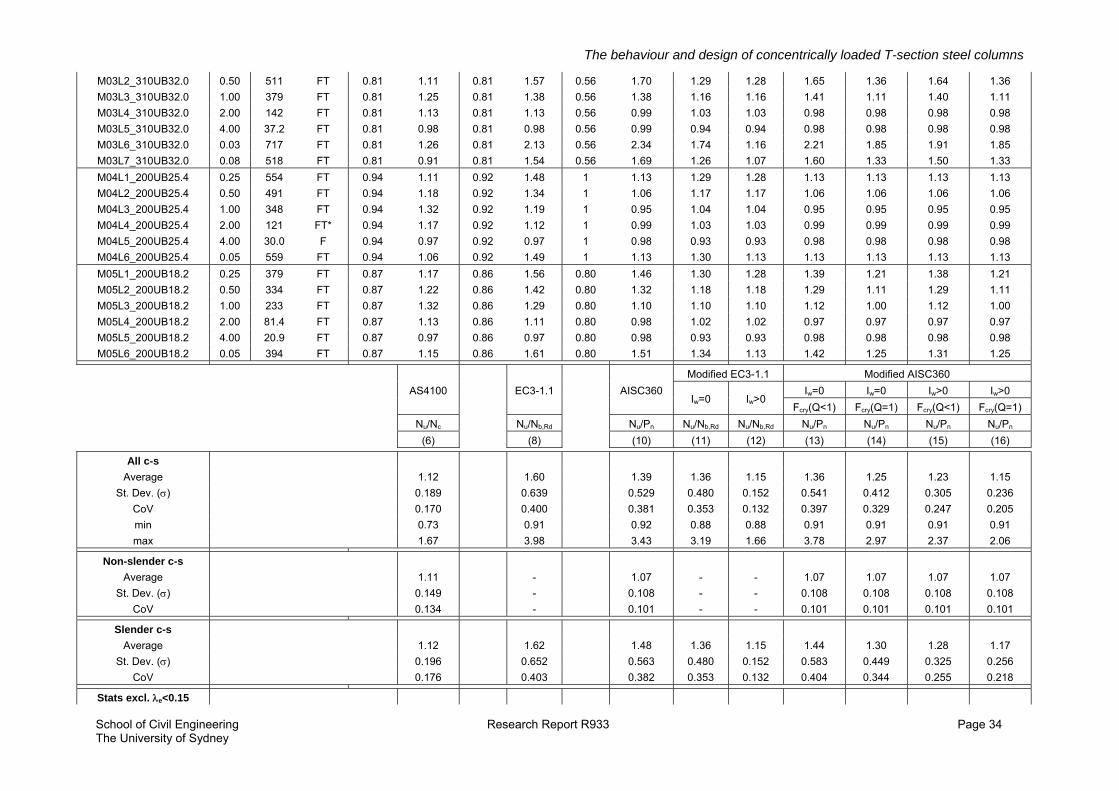
The behaviour and design of concentrically loaded T-section steel columns
School of Civil Engineering Research Report R933 Page 34 The University of Sydney
M03L2_310UB32.0 0.50 511 FT 0.81 1.11 0.81 1.57 0.56 1.70 1.29 1.28 1.65 1.36 1.64 1.36
M03L3_310UB32.0 1.00 379 FT 0.81 1.25 0.81 1.38 0.56 1.38 1.16 1.16 1.41 1.11 1.40 1.11
M03L4_310UB32.0 2.00 142 FT 0.81 1.13 0.81 1.13 0.56 0.99 1.03 1.03 0.98 0.98 0.98 0.98
M03L5_310UB32.0 4.00 37.2 FT 0.81 0.98 0.81 0.98 0.56 0.99 0.94 0.94 0.98 0.98 0.98 0.98
M03L6_310UB32.0 0.03 717 FT 0.81 1.26 0.81 2.13 0.56 2.34 1.74 1.16 2.21 1.85 1.91 1.85
M03L7_310UB32.0 0.08 518 FT 0.81 0.91 0.81 1.54 0.56 1.69 1.26 1.07 1.60 1.33 1.50 1.33
M04L1_200UB25.4 0.25 554 FT 0.94 1.11 0.92 1.48 1 1.13 1.29 1.28 1.13 1.13 1.13 1.13
M04L2_200UB25.4 0.50 491 FT 0.94 1.18 0.92 1.34 1 1.06 1.17 1.17 1.06 1.06 1.06 1.06
M04L3_200UB25.4 1.00 348 FT 0.94 1.32 0.92 1.19 1 0.95 1.04 1.04 0.95 0.95 0.95 0.95
M04L4_200UB25.4 2.00 121 FT* 0.94 1.17 0.92 1.12 1 0.99 1.03 1.03 0.99 0.99 0.99 0.99
M04L5_200UB25.4 4.00 30.0 F 0.94 0.97 0.92 0.97 1 0.98 0.93 0.93 0.98 0.98 0.98 0.98
M04L6_200UB25.4 0.05 559 FT 0.94 1.06 0.92 1.49 1 1.13 1.30 1.13 1.13 1.13 1.13 1.13
M05L1_200UB18.2 0.25 379 FT 0.87 1.17 0.86 1.56 0.80 1.46 1.30 1.28 1.39 1.21 1.38 1.21
M05L2_200UB18.2 0.50 334 FT 0.87 1.22 0.86 1.42 0.80 1.32 1.18 1.18 1.29 1.11 1.29 1.11
M05L3_200UB18.2 1.00 233 FT 0.87 1.32 0.86 1.29 0.80 1.10 1.10 1.10 1.12 1.00 1.12 1.00
M05L4_200UB18.2 2.00 81.4 FT 0.87 1.13 0.86 1.11 0.80 0.98 1.02 1.02 0.97 0.97 0.97 0.97
M05L5_200UB18.2 4.00 20.9 FT 0.87 0.97 0.86 0.97 0.80 0.98 0.93 0.93 0.98 0.98 0.98 0.98
M05L6_200UB18.2 0.05 394 FT 0.87 1.15 0.86 1.61 0.80 1.51 1.34 1.13 1.42 1.25 1.31 1.25
AS4100
EC3-1.1
AISC360
Modified EC3-1.1 Modified AISC360
Iw=0 Iw>0 Iw=0 Iw=0 Iw>0 Iw>0
Fcry(Q<1) Fcry(Q=1) Fcry(Q<1) Fcry(Q=1)
Nu/Nc Nu/Nb,Rd Nu/Pn Nu/Nb,Rd Nu/Nb,Rd Nu/Pn Nu/Pn Nu/Pn Nu/Pn
(6) (8) (10) (11) (12) (13) (14) (15) (16)
All c-s
Average 1.12 1.60 1.39 1.36 1.15 1.36 1.25 1.23 1.15
St. Dev. () 0.189 0.639 0.529 0.480 0.152 0.541 0.412 0.305 0.236
CoV 0.170 0.400 0.381 0.353 0.132 0.397 0.329 0.247 0.205
min 0.73 0.91 0.92 0.88 0.88 0.91 0.91 0.91 0.91
max 1.67 3.98 3.43 3.19 1.66 3.78 2.97 2.37 2.06
Non-slender c-s
Average 1.11 - 1.07 - - 1.07 1.07 1.07 1.07
St. Dev. () 0.149 - 0.108 - - 0.108 0.108 0.108 0.108
CoV 0.134 - 0.101 - - 0.101 0.101 0.101 0.101
Slender c-s
Average 1.12 1.62 1.48 1.36 1.15 1.44 1.30 1.28 1.17
St. Dev. () 0.196 0.652 0.563 0.480 0.152 0.583 0.449 0.325 0.256
CoV 0.176 0.403 0.382 0.353 0.132 0.404 0.344 0.255 0.218
Stats excl. e<0.15

The behaviour and design of concentrically loaded T-section steel columns
School of Civil Engineering Research Report R933 Page 35 The University of Sydney
Average (Pm) 1.08 1.38 1.20 1.20 1.14 1.19 1.11 1.15 1.07
St. Dev. () 0.165 0.355 0.269 0.245 0.161 0.277 0.192 0.218 0.123
CoV (VP) 0.153 0.257 0.224 0.205 0.141 0.233 0.172 0.190 0.115
0.88 0.93 0.87 0.89 0.94 0.84 0.87 0.88 0.92
Table 4: Comparison of test and numerical strengths with design strengths calculated using the AS4100, EN1993-1.1 and AISC-360 Specifications as well as modified versions of the EN1993-1.1 and AISC-360 procedures

The behaviour and design of concentrically loaded T-section steel columns
School of Civil Engineering Research Report R933 Page 36 The University of Sydney
Current procedure Proposed modified procedure
Pm VP A Pm VP A AS4100 1.08 0.153 0.88 e
* Ae - - - - - EC3-1.1 1.38 0.257 0.93 r
# Ae 1.20 0.205 0.89 r A AISC-360 1.20 0.224 0.87 r Q<1 1.11 0.172 0.87 r
† Q=1 * e defined by Eqn. (25), (flexure only) # r defined by Eqn. (26) † Fcry (inelastic strength) and Fcrz (elastic) in strength equation (32) as for Q=1 in current specification
Table 5: Statistics of current and modified versions of AS4100, EC3-1.1 and AISC-360 specifications excluding short columns (e<0.15); P is the ratio of ultimate strength to design strength, Pm and VP are the
mean and CoV of the same ratio.