the behavior of sub-surface oil plumes, in the real world
TRANSCRIPT

1
The Behavior of Sub-Surface Oil Plumes, in the Real World . . .
and Some Practical Observations on How to Manage Them
LNAPL Seminar
HDOH
April 26, 2013
Pat Hughes
Chevron Energy Technology Company
Site Assessment and Remediation Team

Outline Summary and Key Points (#1)
Introduction / Background
What we’ll focus on . . . . And what we won’t focus on
How we got ourselves into this sort of trouble? [“LNAPL: The Early Years.”]
Both the “good news” and the “bad news”
Define a few terms (“wettability” and “residual NAPL”)
Some simplifying assumptions we’ll make
Sand tank studies
Introduce our “case study“ site

Outline Summary and Key Points
Introduction / Background
Processes governing LNAPL behavior in “normal” (i.e. inland, Non-Tidal) aquifers
Processes governing LNAPL behavior in coastal, Tidally Influenced Aquifers
How we apply all of this stuff to best manage our LNAPL plumes
Summary and Implications

© 2012 Chevron U.S.A. Inc. All rights reserved. 4
Quick Summary and Key Points
1) In the “Early Years”, we stumbled quite a bit . . . 2) As we’ve done more research on the movement of
shallow NAPL plumes (delving into the petroleum reservoir literature + new university research) . . . . . . . . AND, as we have gathered more actual data in the field, then our understanding of how shallow NAPL plumes behave, has both evolved and improved.

© 2012 Chevron U.S.A. Inc. All rights reserved. 5
Quick Summary and Key Points
3) We now have a body of both theoretical work and actual field data, which suggests that NAPL plumes generated by finite releases of NAPL, will stabilize over time (i.e. become immobile).
4) For NAPL plumes located in coastal (i.e. tidally influenced) areas, there are some additional factors that help to stabilize these even more quickly.
5) The same factors that cause NAPL plumes (from finite releases) to stabilize, also inhibit our ability to continue recovering the NAPL, once NAPL saturations in the plume have dropped below “residual” NAPL saturation” levels.

What we’ll focus on . . . and what we won’t . . .
We’ll focus on . . .
LNAPLs (both plumes and
sheens).
The normal petroleum
hydrocarbons (gasoline, diesel,
bunker fuels).
Granular aquifers (silt, sand
gravel, etc.).
Physical models.
6
We won’t focus on . . .
DNAPLs and dissolved phase
plumes.
Chlorinated hydrocarbons.
Fractured bedrock / basalt
aquifers.
Mathematical models.

© 2012 Chevron U.S.A. Inc. All rights reserved.
Wettability
Wettability describes the relative affinity of a given fluid (i.e. air, water, or NAPL), to preferentially spread over a solid surface, (for example, a soil grain).
From the “API Interactive NAPL Guide”
Wetting fluid Non-Wetting fluid

© 2012 Chevron U.S.A. Inc. All rights reserved.
1. For “normal” sites: a. Water is the wetting fluid with respect to both NAPL and Air b. NAPL is the wetting fluid with respect to Air.
2. For a situation where the pore space is filled with a combination of water and NAPL, (Think: the saturated zone), water is the wetting fluid and can therefore move more freely than the NAPL.
3. For a situation where the pore space is filled with a combination of NAPL and Air, (Think: the unsaturated zone), NAPL is the wetting fluid and can therefore move more freely.
Wettability

© 2012 Chevron U.S.A. Inc. All rights reserved.
Wettability
For a “3 Phase” system (Water, NAPL and Air): • Water is the wetting phase • NAPL is the intermediate wetting phase and • Air is the non-wetting phase

Monitoring Well
Groundwater

General Shape of a Drawdown Cone
for a Pumping Well
Pumping Well

General Shape of a Drawdown Cone
for a Pumping Well

Paper Towel
Container Of Water
Materials

Paper Towel
“Source Area” Container Of Water
A B C
“Dissolved Phase Plume”
“Advective G
round W
ate
r F
low
”

A couple of simplifying assumptions for this discussion:
1) We will be talking about “finite” (rather than continuing)
LNAPL releases.

Because of both greatly improved environmental awareness and greatly improved leak detection systems . . . . . . . . . . . at the vast majority of our current sites, instead of continuing releases of LNAPL . . . . .
. . . . we are now dealing with finite releases.

© 2012 Chevron U.S.A. Inc. All rights reserved. 17
The “Scary Version” of the equation:

A second simplifying assumption:
A couple of guidelines for this discussion:
1) We will be using a simplified version of the LNAPL flux equation:
a = (b) (c)
qn = (kn) (in)

qN = K i
qN = NAPL flux
KN = Effective NAPL Conductivity
iN = NAPL Gradient
NAPL Flow (Darcy’s Law simplified)
19

KN = Effective NAPL Conductivity
A measure of how easy it is for this particular NAPL to flow . . .
. . . . through this particular lithology . . .
. . . . with this particular relative (NAPL) saturation . . .
. . . . with these particular other fluids present . . .
20

qN = K i
qN = NAPL flux
KN = Effective NAPL Conductivity
iN = NAPL Gradient
NAPL Flow (Darcy’s Law simplified)
21

NAPL Table
Water Table
Harbor
iN = NAPL Gradient
= Slope of the NAPL table
22

© 2012 Chevron U.S.A. Inc. All rights reserved. 23

AST
AST
AST
AST
AST
GW Flow Direction
MW w/ NAPL
MW w/o NAPL
Former
AST
24

© 2012 Chevron U.S.A. Inc. All rights reserved.
qN = (KN) (iN)
NAPL Flow (simplified)
During the remainder of today’s discussion,
we’ll keep coming back to this equation . . . . .
So let’s think about the implications of the this equation . . . . .
25

© 2012 Chevron U.S.A. Inc. All rights reserved. 26
Sand Tank Studies

NAPL (with fluorescent tracer)
Sand Tank Experiments
27


Image # 4619

© 2012 Chevron U.S.A. Inc. All rights reserved.
The complete tank set-up (white light).
Two UV lights
Camera
Computer programmed to take pictures
every 15 minutes, 24 hours a day.
30

Sand Tank Experiment Photographed under White Light
(the distribution of the NAPL is very difficult to see)

The Same Photograph under UV Light (the distribution of the NAPL (yellow) is much easier to see)


© 2012 Chevron U.S.A. Inc. All rights reserved.
Soil Particle
Water
Hydrocarbon
Singlet ( Single Pore )
Doublet ( 2 Pores ) Ganglion ( More than 2 Pores )

© 2012 Chevron U.S.A. Inc. All rights reserved.
qn = (kn) (in)


37
Aquarium Experiments : Diesel (spreading)

38
Thin films of spreading NAPL in groundwater are in the order
of 10-100 m [ = 0.04 - 0.004 in = between 1 and 10
pieces of copier paper thick!]
1 cm = 10,000 m 1 mm = 1,000 m
0.1 cm = 100 m
Wetting fluid
mechanics
(“spontaneous
imbibition”) Non-wetting fluid
mechanics (“blobs”
of non-wetting NAPL
displacing water)

0 0.1 0.2 0.3 0.4 0.5 0.6 0.7 0.8 0.9 10
5
10
15
20
25
Saturation
Dis
tance f
rom
low
tid
e (
cm
)
Saturation Curve
“Digital Imaging” (using binarization)

© 2012 Chevron U.S.A. Inc. All rights reserved. 40
Case Study Field Site

© 2012 Chevron U.S.A. Inc. All rights reserved.

© 2012 Chevron U.S.A. Inc. All rights reserved.
IDPP Update For DOT Management Team
April 7, 2008


Outline Summary and Key Points
Introduction / Background
Processes governing LNAPL behavior in “normal” (i.e. inland, Non-Tidal) aquifers

The Distribution and Behavior of NAPL in
the Subsurface

© 2012 Chevron U.S.A. Inc. All rights reserved.
100 0
Percent of the Pore Space, Filled with NAPL
“Pancake Model”
“Vertical Equilibrium Model”
3 Phase
2 Phase

100 0
The current model
(assumes vertical equilibrium)
Percent of the Pore Space, Filled with NAPL
50

© 2012 Chevron U.S.A. Inc. All rights reserved.
Monitoring Well
Groundwater
Oil
51

© 2012 Chevron U.S.A. Inc. All rights reserved.
Legend:
Soil grain
Pore space filled with water
Oil droplet
52

© 2012 Chevron U.S.A. Inc. All rights reserved.
Legend:
Soil grain
Pore space filled with water
Oil droplet
53

© 2012 Chevron U.S.A. Inc. All rights reserved.
Legend:
Soil grain
Pore space filled with water
Oil droplet
54

Processes governing LNAPL behavior in “normal” (i.e. Inland / Non-Tidal) aquifers)
1) Aquifer materials have a pore entry pressure; non-wetting fluids (like NAPL) cannot intrude into adjacent pores without a sufficient pressure driving it.
“Entry Pressure” must be exceeded before LNAPL can enter a water filled pore.

© 2012 Chevron U.S.A. Inc. All rights reserved.
56
Soil Matrix
H2O
Time = 0
Conditions in the
water saturated zone
prior to LNAPL migration

© 2012 Chevron U.S.A. Inc. All rights reserved.
57
NAPL
Soil Matrix
H2O
Time = 1

© 2012 Chevron U.S.A. Inc. All rights reserved.
58
Soil Matrix
Increasing
LNAPL
Pressure
Time = 2

© 2012 Chevron U.S.A. Inc. All rights reserved.
59
Soil Matrix
Increasing
LNAPL
Pressure
Pore Entry
Pressure
Exceeded
Time = 3

© 2012 Chevron U.S.A. Inc. All rights reserved.
60
LNAPL
Soil Matrix
Time = 4

© 2012 Chevron U.S.A. Inc. All rights reserved.
61
LNAPL
Soil Matrix
Time = 5

© 2012 Chevron U.S.A. Inc. All rights reserved.
62
Reduction in
LNAPL
Pressure
Soil Matrix
Time = 6

© 2012 Chevron U.S.A. Inc. All rights reserved.
63
Soil Matrix
LNAPL
Pressure
Less Than
Pore Entry
Pressure LNAPL
pressure
decreasing
Time = 7

© 2012 Chevron U.S.A. Inc. All rights reserved.
64
Soil Matrix
Residual LNAPL
Saturation below
water table
Time = 8
LNAPL

1) Aquifer materials have a pore entry pressure; non-wetting fluids (like NAPL) cannot intrude into adjacent pores without a sufficient pressure.
2) The NAPL saturation – and hence, the effective conductivity (KN) – diminishes through time, as the finite volume of oil is spread over larger volumes of the aquifer.
Higher “Kn”
Lower “Kn”
NAPL Saturation ( % )
Kn
Eff
ect
ive N
APL
Con
duc
tivity
qn = (kn) (in)
Processes governing LNAPL behavior in “normal” (i.e. Inland / Non-Tidal) aquifers)

© 2012 Chevron U.S.A. Inc. All rights reserved.

1) Aquifer materials have a pore entry pressure; non-wetting fluids (like NAPL) cannot intrude into adjacent pores without a sufficient pressure.
2) The NAPL saturation – and hence, the effective conductivity (KN) – diminishes through time, as the finite volume of oil is spread over larger volumes of the aquifer.
3) The NAPL gradient (iN) also diminishes through time, as the NAPL head cannot be sustained without an ongoing release.
T = 1 T = 2
qn = (kn) (in)
Processes governing LNAPL behavior in “normal” (i.e. Inland / Non-Tidal) aquifers)

80 70 90 50 60 30 40 10 20 0 100
NAPL Saturation ( % )
Kn
Eff
ect
ive N
APL
Con
duc
tivity
0.1
0.2
0.3
0.4
0.5
0.6
1.0
0.8
0.7
0.9
Higher “Kn”
Lower “Kn”
68
“Kn” = 0
“Residual Oil”

Time
bot
h
Kn
and i n
Ongoing Release
Finite Release
Higher “Kn” and in
Lower “Kn” and in
“Kn” and in = 0
qn = (kn) (in)

80 70 90 50 60 30 40 10 20 0 100
NAPL Saturation ( % )
Eff
ect
ive N
APL
Con
duc
tivity
0.1
0.2
0.3
0.4
0.5
0.6
1.0
0.8
0.7
0.9 Higher “Kn”
Lower “Kn”
80 70 90 50 60 30 40 10 20 0 100
Water Saturation ( % )
70

A quick review of processes governing LNAPL behavior in aquifers:
1) Aquifer materials have a pore entry pressure; non-wetting fluids (like NAPL) cannot intrude into adjacent pores without a sufficient pressure.
2) The NAPL saturation – and hence, the effective conductivity (KN) – diminishes through time, as the finite volume of oil is spread over larger volumes of the aquifer.
3) The NAPL gradient (iN) also diminishes through time, as the NAPL head cannot be sustained without an ongoing release.
4) Soil has a capacity to hold oil against drainage / movement as residual oil. All of this means that an entire finite NAPL release will theoretically be retained as residual oil, at some maximum spreading distance.

© 2012 Chevron U.S.A. Inc. All rights reserved. 72
NAPL Flow Mechanism #1: Pushing out from the Source Area (Advective Flow) Examples: A classic “LNAPL Plumes” and “Seeps”

© 2012 Chevron U.S.A. Inc. All rights reserved. 73
NAPL Flow Mechanism #2: Pulling out from the Source Area (Capillary Flow) Examples: “Sheens”

© 2012 Chevron U.S.A. Inc. All rights reserved. 74
NAPL Flow Mechanism #2: Pulling out from the Source Area (Capillary Flow) Examples: “Sheens”

Check on the progress of our “Oil
Spill” and Paper Towel Experiments
1) How much Oil was “Recovered “ (drained from the cup)?
2) What was the “fate” of our contaminant plume?

© 2012 Chevron U.S.A. Inc. All rights reserved. 76

Paper Towel
“Source Area” Container Of Water
A B C
“Dissolved Phase Plume”
“Advective G
round W
ate
r F
low
”

“Kd scan 1”

B C
Water
Legend
A
“Low Permeability
Zone”

“Low Perm. Scan 3”

Outline Summary and Key Points
Introduction / Background
Processes governing LNAPL behavior in “normal” (i.e. inland, Non-Tidal) aquifers
Processes governing LNAPL behavior in coastal, Tidally Influenced Aquifers

Processes governing LNAPL behavior in Tidal aquifers
All of these processes for Non-Tidal Aquifers still apply:
1) Aquifer materials have a pore entry pressure; non-wetting fluids (like NAPL) cannot intrude into adjacent pores without a sufficient pressure.
2) The NAPL saturation – and hence, the effective conductivity (KN) – diminishes through time, as the finite volume of oil is spread over larger volumes of the aquifer.
3) The NAPL gradient (iN) also diminishes through time, as the NAPL head cannot be sustained without an ongoing release.
4) Soil has a capacity to hold oil against drainage / movement as residual oil. This means that an entire finite NAPL release will theoretically be retained as residual oil, at some maximum spreading distance.
qn = (kn) (in)

Additional processes governing LNAPL behavior in Tidal aquifers
1) Both the kn and the in terms are continually changing in response to the tidal fluctuations.

Tidal Forcing Groundwater flow
Harbor
Inflection point

Harbor
Source Area Tidally
Influenced Zone
Cross section View
Map View

Potentiometric Surface Elevation vs. NAPL Thickness
MW - 22
-0.5
0.5
1.5
2.5
3.5
4.5
12/20/2
007
12/21/2
007
12/22/2
007
12/23/2
007
12/24/2
007
12/25/2
007
12/26/2
007
12/27/2
007
Date Time
Po
ten
tio
metr
ic S
urf
ace E
levati
on
(ft
msl)
-0.50
0.50
1.50
2.50
3.50
4.50
5.50
NA
PL
Th
ickn
ess (
ft)
Potentiometric Water Surface
NAPL Thickness

Additional Processes governing LNAPL behavior in Tidal aquifers
1) Both the kn and the in terms are continually changing in response to the tidal fluctuations.
2) These changes are rapid enough that the aquifer never reaches equilibrium conditions.

Time
Wat
er
Tab
le E
leva
tion
Wet Season Dry Season

Additional Processes governing LNAPL behavior in Tidal aquifers
1) Both the kn and the in terms are continually changing in response to the tidal fluctuations .
2) These changes are rapid enough that the aquifer never reaches equilibrium conditions.
3) In addition to the “horizontal smearing” that we see with LNAPL plumes in Non-Tidal aquifers, we now also have “vertical smearing”, in Tidal aquifers.

© 2012 Chevron U.S.A. Inc. All rights reserved.

0 0.1 0.2 0.3 0.4 0.5 0.6 0.7 0.8 0.9 10
5
10
15
20
25
Saturation
Dis
tance f
rom
low
tid
e (
cm
)
Saturation Curve
Rising (mid) Tide
0 0.1 0.2 0.3 0.4 0.5 0.6 0.7 0.8 0.9 10
5
10
15
20
25
Saturation
Dis
tance f
rom
low
tid
e (
cm
)
Saturation Curve
Low Tide
0 0.1 0.2 0.3 0.4 0.5 0.6 0.7 0.8 0.9 10
5
10
15
20
25
Saturation
Dis
tance f
rom
low
tid
e (
cm
)
Saturation Curve
High Tide
qn = (kn) (in)

© 2012 Chevron U.S.A. Inc. All rights reserved.
Soil Particle
Air
Water
Oil
Groundwater flow

Additional Processes governing LNAPL behavior in Tidal aquifers
1) Both the kn and the in terms are continually changing in response to the tidal fluctuations .
2) These changes are rapid enough that the aquifer never reaches equilibrium conditions.
3) In addition to the “horizontal smearing” that we see with LNAPL plumes in Non-Tidal aquifers, we now also have “vertical smearing”, in Tidal aquifers.
4) [Soil has a capacity to hold oil against drainage / movement as residual oil. This means that an entire finite NAPL release will theoretically be retained as residual oil, at some maximum spreading distance.]
The combined effect of these additional processes means that in a Tidal aquifer we would expect that the maximum spreading distance where the entire plume could be theoretically retained as residual oil, would be reached more quickly.

Some practical bits for folks who have to
manage NAPL plumes:

Some Talking Points
The presence of NAPL in a monitoring well MAY or MAY NOT indicate the presence of some “locally mobile” NAPL in the vicinity of that well.
Even if there is no measurable NAPL in a monitoring well, it is possible (and probably not uncommon), for there to be some NAPL in some of the pore spaces in the aquifer outside of that well bore:
Capillary oil ( < 1 atmosphere of pressure )
NAPL at residual saturations ( immobile )
95

Some Talking Points (continued):
While NAPL at the center of a plume may be able to move around within a narrow horizontal range, the edges of the plume are frequently immobile, and therefore, the plume as a whole can be considered stable.
One of the keys to determining the stability of the overall NAPL plume, therefore, is to focus on monitoring the edges of the plume.
96

Some Talking Points (continued):
As the potentiometric surface (PS) in an area changes (either rises or falls), the apparent NAPL thickness in a monitoring well will generally change in an inverse manner [i.e. increase as the PS falls, and decrease as the PS rises].
Removing mobile NAPL from monitoring wells does not necessarily reduce the Magnitude of the risk generated by the NAPL plume [though it may reduce the Longevity of the risk.]
97

Some Talking Points (continued):
The same factors that act to reduce the recoverability of a plume, also reduce the potential mobility of both the NAPL and dissolved phase components of that plume.
98

Some Talking Points (continued):
The issues related to the concepts of Risk, Mobility and Recoverability are all linked.
For example:
If the bulk of a NAPL plume is not recoverable, it is likely that the plume is immobile.
99

Some Practical Issues for Project Managers
100
1) The problem with Monitoring Wells:
“Monitoring wells are holes in the ground, whose main purpose in life, is to lie to us!”
(John Wilson, EPA)

Some Practical Issues for Project Managers
101
2) In tidally influenced costal settings, the continually fluctuating water levels can have a significant effect on the movement of an LNAPL plume.
qN = (KN) (iN)

Here are Some Things You Can Do with a
Monitoring Well:
You can measure the potentiometric surface.
You can monitor for the presence of NAPL, ground water
or vapor impacts.
You can sample the NAPL, ground water or vapors.
You can recover some of the NAPL, ground water or vapors.
102

Here are some things you Can’t do with the measured
apparent LNAPL thickness in a monitoring well:
You cannot use the measured thickness to calculate the “volume” of NAPL in the plume.
103
In the vast majority of cases, you cannot compare
the measured NAPL thicknesses in different
wells, and use those differences to draw
conclusions about either which areas are more
heavily impacted or which wells will yield more
NAPL.

Here is a Complete List of the Things You Can Do with the
Measured Apparent NAPL Thickness in a Monitoring Well::
104
Any questions?

Check on the progress of our “Oil
Spill” and Paper Towel Experiments
1) How much Oil was “Recovered “ (drained from the cup)?
2) What was the “fate” of our contaminant plume?

© 2012 Chevron U.S.A. Inc. All rights reserved.
General Shape of a Drawdown Cone for a Pumping
Well
106

© 2012 Chevron U.S.A. Inc. All rights reserved. 107

© 2012 Chevron U.S.A. Inc. All rights reserved. 108

© 2012 Chevron U.S.A. Inc. All rights reserved. 109
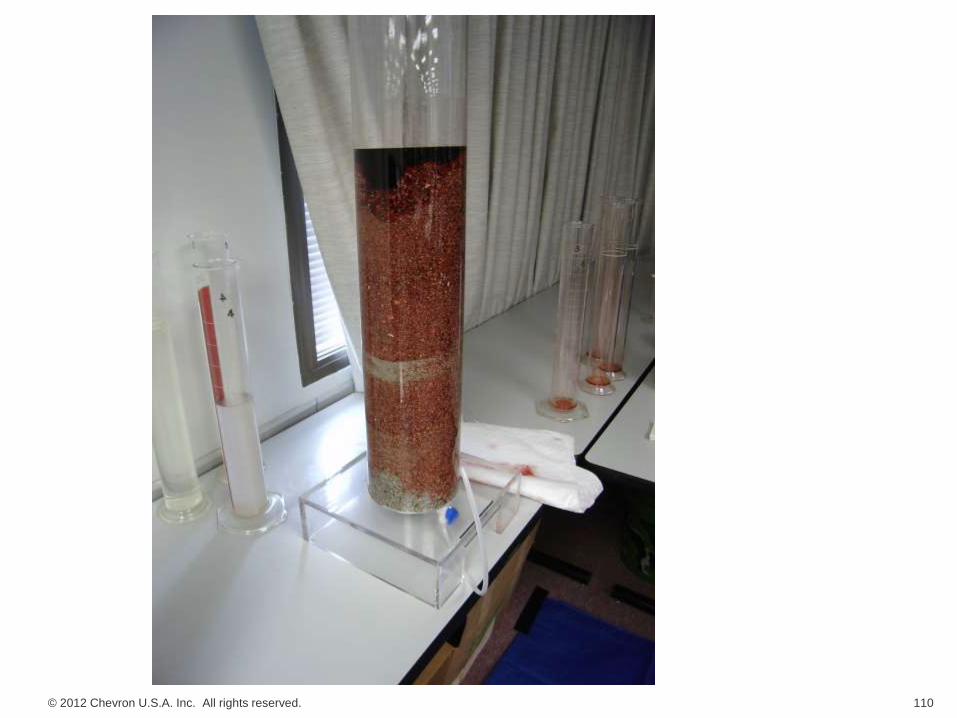
© 2012 Chevron U.S.A. Inc. All rights reserved. 110

© 2012 Chevron U.S.A. Inc. All rights reserved. 111

© 2012 Chevron U.S.A. Inc. All rights reserved.
NAPL Left in Place with "Pumping"
0
100
200
300
400
500
600
700
800
1 2 3 4
Pore volumes of water "pumped" through the aquifer
NA
PL
rem
ain
ing
in
th
e a
qu
ifer
Series1
Oil
112

© 2012 Chevron U.S.A. Inc. All rights reserved.
NAPL Recovery with "Pumping"
0
10
20
30
40
50
60
70
1 2 3
Pore volumes of water
NA
PL
reco
vere
d, p
er
po
re v
olu
me f
lush
ed
th
rou
gh
th
e c
olu
mn
(m
l)
Series1

A B
Simulated Location
of a recovery well
B
Flow
direction
Simulated Location
of a recovery well

“Before scan 3” “After scan 3”

© 2012 Chevron U.S.A. Inc. All rights reserved. 116
Quick Summary and Key Points
1) In the “Early Years”, we stumbled quite a bit . . . But, as we’ve done more research on the movement of shallow NAPL plumes AND, as we have gathered more actual data in the field, then our understanding of how shallow NAPL plumes behave, has both evolved and improved.

© 2012 Chevron U.S.A. Inc. All rights reserved. 117
Quick Summary and Key Points
2) We now have a body of both theoretical work and actual field data, which suggests that NAPL plumes generated by finite releases of NAPL, will stabilize over time (i.e. become immobile).
3) For NAPL plumes located in coastal (i.e. tidally influenced) areas, there are some additional factors that help to stabilize these even more quickly.

© 2012 Chevron U.S.A. Inc. All rights reserved. 118
Quick Summary and Key Points
4) The same factors that cause NAPL plumes (from finite releases) to stabilize, also inhibit our ability to continue recovering the NAPL, once NAPL saturations in the plume have dropped below “residual” NAPL saturation” levels.
5) When thinking about the potential mobility of a NAPL plume, keep focused on this equation:
qn = (kn) (in)

Questions?
119