the bayt.com middle and north africa salary survey...
TRANSCRIPT

The Bayt.com Middle and North AfricaSalary Survey 2015
May 2015

Objective
§ The research was conducted to gauge employee satisfaction of their current salaries and factors
affecting thereof. The key objectives were as follows:
§ Understanding overall satisfaction levels with current salary.
§ Level of raise received in the past year and satisfaction with the same.
§ Raise expected in the coming year.
§ Factors affecting the increase/ decrease in salary levels in country of residence.
§ Drivers of loyalty towards current employer.

RESEARCH METHODOLOGYSection 1

Sample definition
Age and Gender:Working males and femalesAged 18+ years
Nationalities:
GCC Arabs, North Africans, Levantines, Western and Asian expatriates
Country of Residence
GCC: UAE, KSA, Kuwait, Oman, Qatar, Bahrain
Levant: Lebanon, Syria*, Jordan
North Africa: Egypt, Morocco, Algeria, Tunisia*Small data sample.
Data Collection
All data was collected online. Fieldwork was done between 30th March to 6th April 2015. The total number of respondents achieved was 12,158.
* Note: Lower sample

RESEARCH FINDINGSSection 2

CURRENT JOBSection 2a

Summary
§ Almost all respondents (96%) are working full time, covering a wide variety of job positions/
titles and industries.
§ More than half (54%) have been working in their current career path for 6 years or less.
§ Half of them (51%) have been working with their current employer for less than 3 years, while
some 7% have been working with their current employer for at least 11 years.
§ Over half of them (52%) have up to 10 people reporting to them both directly and indirectly.
§ 2 in every 3 of them (66%) claim to be in the mid to senior level.
§ A quarter (25%) claim that the average length of time they have held a job is at least 6 years.

Current role
Base: Total (12158)
All figures are %’s

Number of years working in current career path
All figures are %’s
Q. What is the total number of years in which you have been working in your current career path?
Base: Total (12158), UAE(3561), Saudi Arabia(3081), Qatar(811), Kuwait(537), Bahrain(189), Oman(284), Lebanon(320) Jordan(561), Syria(45), Egypt(1892), Morocco(269), Algeria(456), Tunisia(152)

Number of years working with current employer
All figures are %’s
Q. What is the total duration that you have been working with your current employer?
Base: Total (12158), UAE(3561), Saudi Arabia(3081), Qatar(811), Kuwait(537), Bahrain(189), Oman(284), Lebanon(320) Jordan(561), Syria(45), Egypt(1892), Morocco(269), Algeria(456), Tunisia(152)

Number of people reporting to me
All figures are %’s
Q. Can you tell us how many people currently report to you both directly and indirectly?
Base: Total (12158), UAE(3561), Saudi Arabia(3081), Qatar(811), Kuwait(537), Bahrain(189), Oman(284), Lebanon(320) Jordan(561), Syria(45), Egypt(1892), Morocco(269), Algeria(456), Tunisia(152)

Position in career path
All figures are %’s
Q. Which of the following best describes the level that you have attained so far within your career path?
Base: Total (12158), UAE(3561), Saudi Arabia(3081), Qatar(811), Kuwait(537), Bahrain(189), Oman(284), Lebanon(320) Jordan(561), Syria(45), Egypt(1892), Morocco(269), Algeria(456), Tunisia(152)

Average length of time jobs held
All figures are %’s
Q. What is the average length of time that you have held a job for (in years)?
Base: Total (12158), UAE(3561), Saudi Arabia(3081), Qatar(811), Kuwait(537), Bahrain(189), Oman(284), Lebanon(320) Jordan(561), Syria(45), Egypt(1892), Morocco(269), Algeria(456), Tunisia(152)

CURRENT PACKAGESection 2b

Summary
§ A little over half (52%) claim that their current salary package consists of basic salary + benefits.
§ On the other hand, the majority of those employed in Jordan, Morocco and Tunisia are only
entitled to their basic salaries (55%, 58%, and 53% respectively).
§ Close to 1 in every 2 respondents (46%) exhibit low level of satisfaction with their salary, with
those in Levant being more dissatisfied (52% vs. 46% for both Gulf and North Africa).
§ Approximately 1 out of 2 employees in the MENA receive personal medical insurance from their
company.
§ Additional benefits received by the employees differ across geographies. Specifically:
• Personal medical insurance is provided to 61% of those surveyed in Saudi, a proportion that is
much higher than in any other country covered.§ A higher proportion of those currently employed in the Gulf region (42%) receive personal
annual air ticket.§ More respondents from Lebanon receive transportation allowance (46%).§ Housing allowance is provided to 46% of respondents in Saudi Arabia, and to 37% of respondents
in Qatar.

Composition of current package
All figures are %’s
Q. The current salary you get includes
Base: Total (12158), UAE(3561), Saudi Arabia(3081), Qatar(811), Kuwait(537), Bahrain(189), Oman(284), Lebanon(320) Jordan(561), Syria(45), Egypt(1892), Morocco(269), Algeria(456), Tunisia(152)

Proportion of basic salary
All figures are %’s
Q. What percentage of the total salary package that you receive is your basic MONTHLY salary?
Base: Those who receive basic salary along with other benefits/commission: Total (8243), UAE(2742), Saudi Arabia(2307), Qatar(581), Kuwait(283), Bahrain(118), Oman(205), Lebanon(251), Jordan(253), Egypt(1130), Morocco(108), Algeria(218), Tunisia(68)
*Data for Syria not shown due to small base

Satisfaction with income
All figures are %’s
Q. Please indicate your level of satisfaction with your current salary
Base: Total (12158), UAE(3561), Saudi Arabia(3081), Qatar(811), Kuwait(537), Bahrain(189), Oman(284), Lebanon(320) Jordan(561), Syria(45), Egypt(1892), Morocco(269), Algeria(456), Tunisia(152)

Additional benefits
All figures are %’s
Q. Apart from your salary which of the following are included in the compensation / benefits you receive from your current company?
Total UAE Saudi Arabia Qatar Kuwait Bahrain Oman Lebanon Jordan Syria Egypt Morocco Algeria Tunisia
Personal medical insurance 48 47 61 38 27 34 50 34 46 49 43 51 48 43Bonus 31 30 32 31 38 32 35 35 27 36 34 25 23 26Personal annual air ticket 30 42 46 45 27 30 42 3 3 4 3 2 4 7Transportation allowance 28 27 37 34 21 24 27 46 23 33 21 16 17 16Housing allowance 26 28 46 37 21 22 25 3 2 9 5 9 4 7Family medical insurance 22 19 34 14 11 20 27 15 25 18 14 25 21 28
Company-provided accommodation 18 19 26 33 18 23 36 4 4 7 7 4 11 7
Company-provided mobile 17 13 20 18 16 20 30 9 16 20 17 19 11 15
Company-provided car / transport 16 15 21 25 17 21 27 5 9 4 12 11 7 16
End-of-service gratuity 15 27 9 25 10 14 35 3 5 7 3 5 5 3
Telecom bills paid by company / allowance 15 14 14 16 16 20 25 7 10 4 19 10 6 8
Family annual air tickets 13 13 23 17 11 19 22 1 2 - 1 1 1 1
Personal training / development courses allowance 8 5 9 9 6 8 9 11 7 16 12 7 9 12
Holiday allowances / foreign trips 7 6 11 9 8 7 6 6 3 4 4 3 4 3
Children’s education allowance 4 4 6 8 5 8 6 9 2 - 1 1 2 -
Fitness benefits 3 3 4 4 2 3 4 2 1 2 2 3 3 5Childcare facility 1 1 1 1 1 3 1 1 1 - 1 0 3 1Stock options 1 1 1 1 1 2 1 - 0 4 1 1 1 -None / Don’t know 18 14 11 11 24 14 13 27 29 22 26 28 30 31
Base: Total (12158), UAE(3561), Saudi Arabia(3081), Qatar(811), Kuwait(537), Bahrain(189), Oman(284), Lebanon(320) Jordan(561), Syria(45), Egypt(1892), Morocco(269), Algeria(456), Tunisia(152)

SALARY COMPARISONS AND EXPECTATIONS
Section 2c
Summary
§ About a fifth (22%) of respondents received a salary raise of only 1% - 5% in 2014.
§ 39% did not receive a raise at all in 2014, with respondents from Lebanon (51%), Morocco
(55%) and Algeria (51%) stating that to a greater extent.
§ More than half (53%) of those who received a raise are unhappy with the raise they received.
§ Respondents from GCC (49%) seem somewhat happier with the raise they received in 2014, as
compared to respondents from Levant (42%) and North Africa (44%).
§ A little over a quarter (26%) do not expect to be given a raise in 2015, with employees in
Morocco (42%) and Algeria (41%) being somewhat more pessimistic. Only 5% had already
received a raise this year.
§ Majority of respondents (58%) believe that there is parity in the salaries given to men and
women in the same position in their company.

Raise received in 2014
All figures are %’s
Q. Can you please select the total percentage raise you received in the year 2014 (January 2014 December 2014)?
Base: Total (12158), UAE(3561), Saudi Arabia(3081), Qatar(811), Kuwait(537), Bahrain(189), Oman(284), Lebanon(320) Jordan(561), Syria(45), Egypt(1892), Morocco(269), Algeria(456), Tunisia(152)

Views on raise received
All figures are %’s
Q. Please indicate how satisfied you are with the salary raise you received in the year 2014 (January 2014 December 2014)?
Base: Those who received a raise (6611), UAE(1818), Saudi Arabia(1613), Qatar(438), Kuwait(280), Bahrain(100), Oman(169), Lebanon(145) Jordan(319), Syria(32), Egypt(1304), Morocco(109), Algeria(198), Tunisia(86)
Total UAE Saudi Arabia Qatar Kuwait Bahrain Oman Lebanon Jordan Syria Egypt Morocco Algeria Tunisia
I am very happy with my raise 7 9 8 10 8 12 11 8 4 - 4 6 9 6
I am modestly happy with my raise 15 16 15 17 18 16 20 16 12 6 15 10 10 6
My raise is fair in light of my contribution to the company 10 10 11 12 13 13 9 16 9 3 8 14 11 10
My raise is fair in light of the company’s financial situation 9 8 8 7 9 7 7 6 9 13 11 4 9 12
My raise is fair in light of my contribution and the company’s financial situation 6 6 6 3 6 2 4 8 4 9 6 6 10 5
I am quite unhappy with my raise 31 29 31 30 25 33 29 32 29 25 33 32 31 34
I am very unhappy with my raise 22 23 20 21 20 17 22 14 34 44 22 28 20 28

Salaries offered to men and women
All figures are %’s
Q. In your opinion, which of the following statements best applies to the salaries offered to men and women (doing the same work) in your company?
Base: Those who did not answered Don’t know/ Can’t say (6009), UAE(1868), Saudi Arabia(1117), Qatar(378), Kuwait(272), Bahrain(108), Oman(133), Lebanon(190) Jordan(336), Egypt(1009), Morocco(164), Algeria(300), Tunisia(105)
Total UAE Saudi Arabia Qatar Kuwait Bahrain Oman Lebanon Jordan Egypt Morocco Algeria Tunisia
The salary offered to women is higher than that offered to men in the same position/ doing the same work
19 21 27 21 22 13 16 8 15 15 9 13 10
There is parity in the salaries given to men and women in the same position/ doing the same work
58 57 41 55 54 67 62 77 64 67 66 77 73
The salary offered to women is lower than that offered to men in the same position/ doing the same work
23 23 32 23 24 20 22 15 20 18 24 10 17
*Data for Syria not shown due to small base

Raise expected in 2015
All figures are %’s
Q. Can you please select the total percentage raise you expect to receive in the year 2015 (January 2015 December 2015)?
Base: Total (12158), UAE(3561), Saudi Arabia(3081), Qatar(811), Kuwait(537), Bahrain(189), Oman(284), Lebanon(320) Jordan(561), Syria(45), Egypt(1892), Morocco(269), Algeria(456), Tunisia(152)

COST OF LIVING AND SAVINGSSection 2d

Summary
§ About one third (32%) of respondents report having seen an increase of at least 21% in their cost of
living in 2014.
§ Food & beverage and rents are the top two elements for which respondents noticed an increase in
costs in 2014 (71% and 70%, respectively).
§ In the UAE and Kuwait, 86% of respondents claim to have seen an increase in the rents, a proportion
which is higher than in other countries covered.
§ The majority (79%) still expect a further increase in the cost of living in 2015.
§ When probed on their savings, about one-third (32%) claim they do not save any of their monthly
salary. Lack of savings is more prominent among those in Levant and North Africa (53% and 45%,
respectively vs. 25% for the Gulf).
§ Most respondents would prefer a 100% fixed pay structure (60%).
§ 2 in every 3 respondents (66%) believe that their salary is lower than other companies in their
industry.

Increase in cost of living in 2014
All figures are %’s
Q. On average, by what percentage do you think your cost of living has increased in the year 2014 (January 2014 December 2014)?
Base: Total (12158), UAE(3561), Saudi Arabia(3081), Qatar(811), Kuwait(537), Bahrain(189), Oman(284), Lebanon(320) Jordan(561), Syria(45), Egypt(1892), Morocco(269), Algeria(456), Tunisia(152)

Factors that increased in cost in 2014
All figures are %’s
Q. For which of the following elements have you seen an increase in cost in the year 2014 (January 2014 December 2014)?
Base: Those who mentioned that the cost of living increased (10474), UAE(3126), Saudi Arabia(2588), Qatar(686), Kuwait(471), Bahrain(150), Oman(241), Lebanon(274) Jordan(493), Syria(44), Egypt(1723), Morocco(205), Algeria(339), Tunisia(134)
Total UAE Saudi Arabia Qatar Kuwait Bahrain Oman Lebanon Jordan Syria Egypt Morocco Algeria Tunisia
Food and Beverage 71 59 74 69 71 73 75 80 74 89 84 72 84 88
Rents 70 86 71 74 86 63 61 50 59 75 51 54 49 63
Utilities (Water, electricity, gas, etc.) 53 56 35 28 29 29 45 49 80 75 84 69 46 80
Education (school/ college) 39 33 40 35 45 39 35 51 43 61 50 28 19 36
Entertainment 37 28 35 31 29 35 37 51 51 73 51 29 38 54
Other 7 7 6 6 6 5 5 5 9 14 8 5 7 6

Expectation of future cost of living in 2015
All figures are %’s
Q. In the year 2015 (January 2015 December 2015) you expect your cost of living to..
Base: Total (12158), UAE(3561), Saudi Arabia(3081), Qatar(811), Kuwait(537), Bahrain(189), Oman(284), Lebanon(320) Jordan(561), Syria(45), Egypt(1892), Morocco(269), Algeria(456), Tunisia(152)

Proportion of salary saved
All figures are %’s
Q. On average, what percentage of your monthly personal income do you save?
Base: Total (12158), UAE(3561), Saudi Arabia(3081), Qatar(811), Kuwait(537), Bahrain(189), Oman(284), Lebanon(320) Jordan(561), Syria(45), Egypt(1892), Morocco(269), Algeria(456), Tunisia(152)

Proportion of salary repatriated
All figures are %’s
Q. What percentage of your savings do you repatriate to your home country?
Base: Those who do not live in their home country (8698), UAE(3464), Saudi Arabia(2579), Qatar(778), Kuwait(516), Bahrain(150), Oman(251), Lebanon(80) Jordan(157), Egypt(469), Morocco(69), Algeria(133), Tunisia(39)
*Data for Syria not shown due to small base

Preferred pay structure
All figures are %’s
Q. Which of the following do you think is a better pay structure for you?
Base: Total (12158), UAE(3561), Saudi Arabia(3081), Qatar(811), Kuwait(537), Bahrain(189), Oman(284), Lebanon(320) Jordan(561), Syria(45), Egypt(1892), Morocco(269), Algeria(456), Tunisia(152)

Salary comparison
All figures are %’s
Q. For the work that you do, is your salary
Base: Total (12158), UAE(3561), Saudi Arabia(3081), Qatar(811), Kuwait(537), Bahrain(189), Oman(284), Lebanon(320) Jordan(561), Syria(45), Egypt(1892), Morocco(269), Algeria(456), Tunisia(152)

PERCEPTION OF SALARIES IN THE COUNTRY AND QUALITY OF LIFE
Section 2e

Summary
§ Close to half (46%) claim to be better off than other people of a similar generation in their country of residence. This belief is stronger among respondents from GCC (51%) as compared to Levant (33%) and North Africa (37%).
§ When asked about their plans in the next 12 months, more than half (54%) stated that they will look for a better job in the same industry.
§ Employees from GCC are less likely to move to another country as expats (GCC: 11%, Levant: 16%, North Africa: 14%).
§ On a positive note, the majority of respondents (63%) believe that salaries are increasing in their country of residence. Among those who think salaries are increasing, 55% believe that inflation/ rise in cost of living is the catalyst for such increase, followed by those who attribute this rise to the growth in opportunities and economic growth in their country of residence (34%).
§ Of those who believe that salaries are either decreasing or staying the same in their country of residence, 36% blame the poor economy, while one-third attribute it to employer-friendly laws.
§ Over a quarter (28%) believe that there is a skills shortage in their country of residence. This belief is more prominent among respondents in Oman (40%) and Saudi Arabia (39%).

Overall quality of life
All figures are %’s
Q. Thinking about your quality of life, how would you compare yourself to other people of a similar generation in your country of residence?
Base: Total (12158), UAE(3561), Saudi Arabia(3081), Qatar(811), Kuwait(537), Bahrain(189), Oman(284), Lebanon(320) Jordan(561), Syria(45), Egypt(1892), Morocco(269), Algeria(456), Tunisia(152)

Future plans
All figures are %’s
Q. Which of the following do you intend to do in the next 12 months?
Total UAE Saudi Arabia Qatar Kuwait Bahrain Oman Lebanon Jordan Syria Egypt Morocco Algeria Tunisia
Look for a better job in the same industry 54 59 56 52 55 54 48 47 51 47 53 42 35 38
Look for a better job in a different industry 32 39 32 25 33 40 25 33 30 20 26 34 29 30
Look for a better job as an expat in a different country in the Middle East 30 17 31 38 29 34 45 32 43 33 40 36 48 51
Move to another region as an expat 12 11 11 13 11 12 14 15 16 27 13 16 20 18
Return to home country 6 8 8 8 9 7 8 - - - 1 1 - -
Other 4 3 4 4 2 5 2 4 5 2 6 6 6 4
Nothing/ None of these 9 8 9 8 8 8 8 14 7 16 9 13 10 13
Base: Total (12158), UAE(3561), Saudi Arabia(3081), Qatar(811), Kuwait(537), Bahrain(189), Oman(284), Lebanon(320) Jordan(561), Syria(45), Egypt(1892), Morocco(269), Algeria(456), Tunisia(152)

Perception of salaries in the country
All figures are %’s
Q. In general, are salaries increasing or decreasing in your country of residence?
Base: Total (12158), UAE(3561), Saudi Arabia(3081), Qatar(811), Kuwait(537), Bahrain(189), Oman(284), Lebanon(320) Jordan(561), Syria(45), Egypt(1892), Morocco(269), Algeria(456), Tunisia(152)
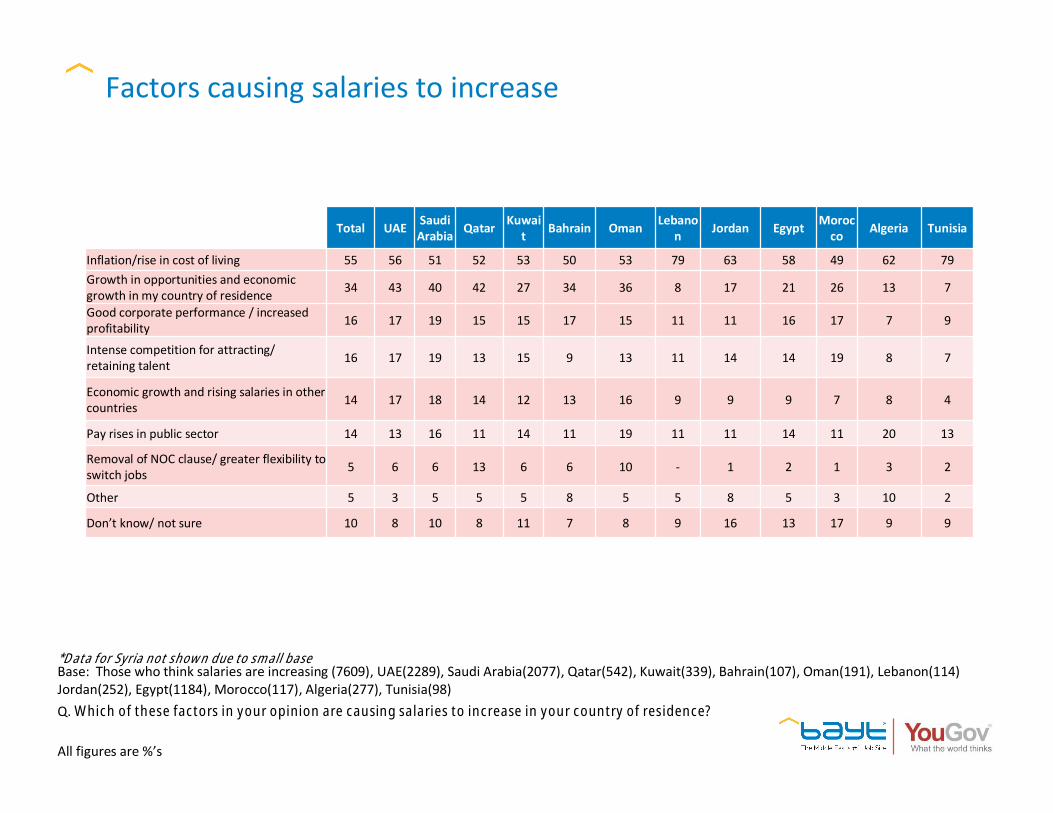
Factors causing salaries to increase
All figures are %’s
Q. Which of these factors in your opinion are causing salaries to increase in your country of residence?
Base: Those who think salaries are increasing (7609), UAE(2289), Saudi Arabia(2077), Qatar(542), Kuwait(339), Bahrain(107), Oman(191), Lebanon(114) Jordan(252), Egypt(1184), Morocco(117), Algeria(277), Tunisia(98)
Total UAE Saudi Arabia Qatar Kuwai
t Bahrain Oman Lebanon Jordan Egypt Moroc
co Algeria Tunisia
Inflation/rise in cost of living 55 56 51 52 53 50 53 79 63 58 49 62 79Growth in opportunities and economic growth in my country of residence 34 43 40 42 27 34 36 8 17 21 26 13 7
Good corporate performance / increased profitability 16 17 19 15 15 17 15 11 11 16 17 7 9
Intense competition for attracting/ retaining talent 16 17 19 13 15 9 13 11 14 14 19 8 7
Economic growth and rising salaries in other countries 14 17 18 14 12 13 16 9 9 9 7 8 4
Pay rises in public sector 14 13 16 11 14 11 19 11 11 14 11 20 13
Removal of NOC clause/ greater flexibility to switch jobs 5 6 6 13 6 6 10 - 1 2 1 3 2
Other 5 3 5 5 5 8 5 5 8 5 3 10 2
Don’t know/ not sure 10 8 10 8 11 7 8 9 16 13 17 9 9
*Data for Syria not shown due to small base

Factors causing salaries not to increase
All figures are %’s
Q. Which of these factors do you think are causing salaries to not increase sufficiently in your country?
Base: Those who think salaries are decreasing/ remain the same (3556), UAE(908), Saudi Arabia(793), Qatar(191), Kuwait(154), Bahrain(59), Oman(70), Lebanon(174) Jordan(281), Egypt(563), Morocco(136), Algeria(156), Tunisia(51)
Total UAE Saudi Arabia Qatar Kuwait Bahrain Oman Lebanon Jordan Egypt Morocco Algeria Tunisia
Poor economy 36 24 24 24 23 41 27 72 52 56 29 53 84
Employer-friendly laws 33 20 42 31 30 29 27 16 37 48 42 28 27
Poor corporate performance/ decreased profitability 24 26 22 21 31 31 20 24 22 28 13 15 14
There is more top talent than top jobs in local recruitment market today 19 20 20 17 19 19 14 18 23 19 28 11 6
Tax-free environment of GCC countries 9 12 11 13 13 10 11 5 7 6 2 5 6
Don’t know/ not sure/ not applicable 19 25 19 23 19 20 24 13 13 8 24 17 6
*Data for Syria not shown due to small base

Skills/ labor supply status in country of residence
All figures are %’s
Q. Do you believe that in your country of residence there is a...
Base: Total (12158), UAE(3561), Saudi Arabia(3081), Qatar(811), Kuwait(537), Bahrain(189), Oman(284), Lebanon(320) Jordan(561), Syria(45), Egypt(1892), Morocco(269), Algeria(456), Tunisia(152)

DRIVERS OF LOYALTYSection 2f

Summary
§ 32% claim that their loyalty to their company is not linked to the salary they receive, with
respondents from North Africa (41%), and especially from Egypt (44%) and from Tunisia (45%),
claiming that to a greater extent.
§ Besides salary, the line manager (39%) and opportunities for long-term career advancement
(37%), followed by senior management (32%), are all variables that seem to drive loyalty.
§ These drivers are somewhat higher for respondents from Lebanon and Egypt.

Loyalty towards the company linked to salary
All figures are %’s
Q. To what extent is your loyalty to your company directly linked to the salary you receive?
Base: Total (12158), UAE(3561), Saudi Arabia(3081), Qatar(811), Kuwait(537), Bahrain(189), Oman(284), Lebanon(320) Jordan(561), Syria(45), Egypt(1892), Morocco(269), Algeria(456), Tunisia(152)

Loyalty towards the company linked to other variables
All figures are %’s
Q. What other variables most strongly drive your loyalty to the company besides salary?
Total UAE Saudi Arabia Qatar Kuwait Bahrain Oman Lebanon Jordan Syria Egypt Morocco Algeria Tunisia
My line manager 39 33 43 30 38 32 30 38 54 53 47 32 31 35
Opportunities for long-term career advancement 37 37 36 40 35 37 35 39 43 27 42 26 27 30
Senior management 32 30 35 27 32 29 35 30 40 38 38 22 19 25
My colleagues 28 28 29 27 26 25 23 28 32 22 34 23 22 23
Training and development opportunities 28 24 29 23 22 21 23 30 35 29 34 26 27 36
The company brand and reputation 27 29 27 29 28 29 24 38 23 22 27 17 16 19
The nature of my daily responsibilities 26 26 26 26 26 29 26 30 22 33 27 25 24 16
Fun office environment 23 19 24 14 16 17 15 27 37 22 30 28 21 27
Physical location of my workplace 19 18 20 13 12 20 16 28 18 13 25 19 18 19
Opportunities to travel 14 12 14 11 9 9 10 16 21 20 19 11 13 15
Other 5 5 5 6 4 6 7 5 5 7 6 6 7 5
None – I am primarily interested in the salary 6 6 6 5 7 5 6 2 4 7 4 7 9 6
Don’t know – can’t say 8 9 7 9 7 9 8 8 5 2 5 10 11 9
Base: Total (12158), UAE(3561), Saudi Arabia(3081), Qatar(811), Kuwait(537), Bahrain(189), Oman(284), Lebanon(320) Jordan(561), Syria(45), Egypt(1892), Morocco(269), Algeria(456), Tunisia(152)

END OF SERVICE BENEFITS AND OVERTIME
Section 2g

Summary
§ Just over half (53%) state that their company offers end-of-service gratuity. This benefit is
offered more in the GCC (68%), where the expatriate working population is larger.
§ On the other hand, pension on retirement is higher in the Levant (18%) and North Africa (23%),
as compared to the GCC (5%).
§ 64% claim that their company does not pay for overtime. Respondents from UAE (74%), Oman
(75%) and from Lebanon (72%) claim that to a greater extent.

End of service benefits
All figures are %’s
Q. Which of the following end of service benefits does your company presently offer all its employees?
Total UAE Saudi Arabia Qatar Kuwait Bahrain Oman Lebanon Jordan Syria Egypt Morocco Algeria Tunisia
End-of-service gratuity 53 73 61 75 65 52 66 27 17 33 22 10 14 13
Pension on retirement 10 4 7 3 6 13 8 13 21 29 15 32 45 39
Others 6 4 8 6 5 10 3 10 5 - 9 8 9 9
None of the above 30 19 24 17 24 26 23 51 57 38 55 50 32 39
Base: Total (12158), UAE(3561), Saudi Arabia(3081), Qatar(811), Kuwait(537), Bahrain(189), Oman(284), Lebanon(320) Jordan(561), Syria(45), Egypt(1892), Morocco(269), Algeria(456), Tunisia(152)

Pay for overtime
All figures are %’s
Q. Does your company pay for overtime?
Base: Total (12158), UAE(3561), Saudi Arabia(3081), Qatar(811), Kuwait(537), Bahrain(189), Oman(284), Lebanon(320) Jordan(561), Syria(45), Egypt(1892), Morocco(269), Algeria(456), Tunisia(152)
INVESTMENTS AND HOME OWNERSHIP
Section 2h

Summary
§ Only 18% make financial investments regularly, and it is somewhat higher in GCC (20%), as
compared to Levant (13%) and North Africa (16%). Of those who make regular investments,
22% invest in local property.
§ Close to one fourth (23%) eat out on a daily basis. Dining out every day is more frequent for
those living in North Africa (28%), and especially for respondents from Morocco (32%).
§ Rent is the top monthly expense for 43%, and it is particularly high for UAE (62%) and Kuwait
(62%), countries which according to respondents had a high increase in rents during 2014.
§ Across the MENA region, home ownership is at 37%.
§ More than half (53%) of respondents from Egypt own a home.

Regularly make financial investments*
All figures are %’s
Q. Do you regularly make financial investments? *By regularly we mean at least once a month.
Base: Total (12158), UAE(3561), Saudi Arabia(3081), Qatar(811), Kuwait(537), Bahrain(189), Oman(284), Lebanon(320) Jordan(561), Syria(45), Egypt(1892), Morocco(269), Algeria(456), Tunisia(152)

Investment products
All figures are %’s
Q. Which of the following products do you invest in? Please select all that apply
Total UAE Saudi Arabia Qatar Kuwait Bahrain Oman Lebanon Jordan Egypt Morocco Algeria
Property (local) 22 18 29 27 23 15 15 17 12 22 9 20
Own business 18 13 21 12 13 15 12 21 29 24 21 32
Insurance plus investment plans 15 22 9 19 25 32 18 12 11 5 9 3
Stocks 14 15 17 11 20 15 9 10 11 10 13 9
Gold 14 17 14 14 14 17 25 13 8 6 6 10
Savings certificates 13 17 7 12 15 12 18 12 3 16 2 7
Property (international) 9 12 9 10 12 17 9 2 5 5 4 13
Jewelry 9 12 9 11 14 17 13 10 2 4 2 4
Property (regional) 7 7 7 7 11 7 10 8 5 7 2 9
Mutual funds (international) 6 9 5 7 6 12 4 2 5 1 2 3
Mutual funds (local) 6 7 6 5 11 12 12 2 - 4 2 3
Bonds 6 9 4 5 7 10 3 2 3 2 2 7
Mutual funds (regional) 2 4 2 2 7 2 4 2 - 1 - 1
Other 18 15 18 17 16 17 18 25 29 20 23 23None of the above 14 9 15 12 10 5 6 12 28 18 38 29
Base: Those who invest regularly (2222), UAE(717), Saudi Arabia(539), Qatar(189), Kuwait(102), Bahrain(41), Oman(67), Lebanon(52) Jordan(65),Egypt(304), Morocco(47), Algeria(69)
*Data for Syria and Tunisia not shown due to small base

Frequency of eating out
All figures are %’s
Q. How often do you eat out?
Base: Total (12158), UAE(3561), Saudi Arabia(3081), Qatar(811), Kuwait(537), Bahrain(189), Oman(284), Lebanon(320) Jordan(561), Syria(45), Egypt(1892), Morocco(269), Algeria(456), Tunisia(152)

Top-ranked monthly expenses
All figures are %’s
Q. From the list provided please rank from 1 to 3, the top three monthly expenses for you, where 1 is item on which you spend the most on average in a month and so on ..
Total UAE Saudi Arabia Qatar Kuwait Bahrain Oman Lebanon Jordan Syria Egypt Morocco Algeria Tunisia
Rent 45 62 41 44 62 46 37 28 40 38 27 41 24 41
Dining out 12 9 15 15 8 15 14 13 9 9 14 14 15 9
Children’s schooling 12 7 14 13 9 11 13 12 12 16 20 10 7 10
Transportation 9 6 7 6 3 3 8 18 22 27 15 13 14 15
Health / medical bills 6 3 5 4 3 7 7 6 3 4 10 9 12 11
Entertainment/ Traveling 5 4 5 5 3 5 7 5 6 2 4 4 5 3
Investment 4 4 5 7 5 6 7 11 3 - 3 2 4 3
Electronics 3 2 4 2 4 3 4 2 2 - 4 1 7 1
Exercise/ Fitness 2 1 2 1 2 - 1 2 1 2 2 2 4 3
Furniture 1 1 1 1 1 2 1 2 2 2 1 3 3 3
Books 1 1 1 1 1 2 1 1 - - 1 1 5 1
Base: Total (12158), UAE(3561), Saudi Arabia(3081), Qatar(811), Kuwait(537), Bahrain(189), Oman(284), Lebanon(320) Jordan(561), Syria(45), Egypt(1892), Morocco(269), Algeria(456), Tunisia(152)

Home ownership
All figures are %’s
Q. Do you own a home?
Base: Total (12158), UAE(3561), Saudi Arabia(3081), Qatar(811), Kuwait(537), Bahrain(189), Oman(284), Lebanon(320) Jordan(561), Syria(45), Egypt(1892), Morocco(269), Algeria(456), Tunisia(152)

Interest in owning a hone
All figures are %’s
Q. Would you like to own a home?
Total UAE Saudi Arabia Qatar Kuwait Bahrain Oman Lebanon Jordan Syria Egypt Morocco Algeria Tunisia
Yes, in my country of residence 44 44 41 30 24 41 32 44 50 57 53 52 58 55
Yes, in my home country 63 66 66 70 76 63 70 59 58 54 55 59 47 61
Yes, in another country 13 10 12 12 12 13 6 13 11 29 16 11 31 16
No 2 3 2 4 2 1 3 2 1 - 2 1 1 -
Don’t know/ Can’t say 2 3 1 2 2 5 2 4 2 4 2 3 1 1
Base: Those who do not own a home (7695), UAE(2396), Saudi Arabia(2033), Qatar(458), Kuwait(329), Bahrain(120), Oman(162), Lebanon(199) Jordan(380), Syria(28), Egypt(895), Morocco(223), Algeria(356), Tunisia(116)

DEMOGRAPHICSSection 3

Respondent Profile
Age•Below 30 – 40%•30-39 – 42%•40+ – 18%
Nationality group•Gulf – 6%•Levant – 14%•North African – 31%•Westerner – 3%•Asian – 40%•Other – 6%
Main earner•Yes – 75%•No – 25%
Gender•Male – 84%•Female – 16%
All figures are %’s
Base: Total (12158)

Respondent Profile
All figures are %’s
Base: Total (12158)

Thank you