the bank of nova scotia · 2020-01-29 · attention: hector becil (212) 225-5000 (name, address...
TRANSCRIPT
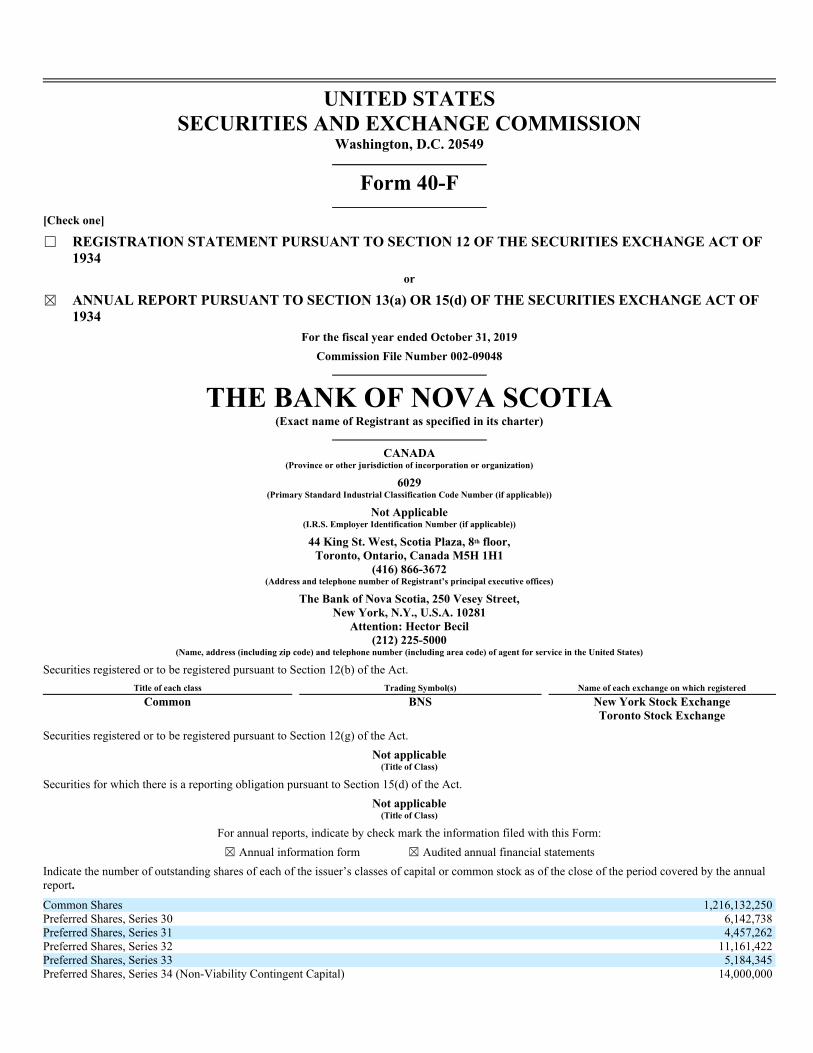
UNITED STATES
SECURITIES AND EXCHANGE COMMISSION
Washington, D.C. 20549
Form 40-F
[Check one]
☐ REGISTRATION STATEMENT PURSUANT TO SECTION 12 OF THE SECURITIES EXCHANGE ACT OF
1934
or
☒ ANNUAL REPORT PURSUANT TO SECTION 13(a) OR 15(d) OF THE SECURITIES EXCHANGE ACT OF
1934
For the fiscal year ended October 31, 2019
Commission File Number 002-09048
THE BANK OF NOVA SCOTIA (Exact name of Registrant as specified in its charter)
CANADA
(Province or other jurisdiction of incorporation or organization)
6029
(Primary Standard Industrial Classification Code Number (if applicable))
Not Applicable
(I.R.S. Employer Identification Number (if applicable))
44 King St. West, Scotia Plaza, 8 floor,
Toronto, Ontario, Canada M5H 1H1
(416) 866-3672
(Address and telephone number of Registrant’s principal executive offices)
The Bank of Nova Scotia, 250 Vesey Street,
New York, N.Y., U.S.A. 10281
Attention: Hector Becil
(212) 225-5000
(Name, address (including zip code) and telephone number (including area code) of agent for service in the United States)
Securities registered or to be registered pursuant to Section 12(b) of the Act.
Title of each class Trading Symbol(s) Name of each exchange on which registered
Common BNS New York Stock Exchange
Toronto Stock Exchange
Securities registered or to be registered pursuant to Section 12(g) of the Act.
Not applicable
(Title of Class)
Securities for which there is a reporting obligation pursuant to Section 15(d) of the Act.
Not applicable
(Title of Class)
For annual reports, indicate by check mark the information filed with this Form:
☒ Annual information form ☒ Audited annual financial statements
Indicate the number of outstanding shares of each of the issuer’s classes of capital or common stock as of the close of the period covered by the annual
report.
Common Shares 1,216,132,250
Preferred Shares, Series 30 6,142,738
Preferred Shares, Series 31 4,457,262
Preferred Shares, Series 32 11,161,422
Preferred Shares, Series 33 5,184,345
Preferred Shares, Series 34 (Non-Viability Contingent Capital) 14,000,000
th

Preferred Shares, Series 36 (Non-Viability Contingent Capital) 20,000,000
Preferred Shares, Series 38 (Non-Viability Contingent Capital) 20,000,000
Preferred Shares, Series 40 (Non-Viability Contingent Capital) 12,000,000
Indicate by check mark whether the Registrant (1) has filed all reports required to be filed by Section 13 or 15(d) of the Exchange Act during the
preceding 12 months (or for such shorter period that the Registrant was required to file such reports) and (2) has been subject to such filing requirements
for the past 90 days.
Yes ☒ No ☐
Indicate by check mark whether the Registrant has submitted electronically every Interactive Data File required to be submitted pursuant to Rule 405 of
Regulation S-T (§232.405 of this chapter) during the preceding 12 months (or for such shorter period that the Registrant was required to submit such
files).
Yes ☐ No ☐
Indicate by check mark whether the registrant is an emerging growth company as defined in Rule 12b-2 of the Exchange Act.
Emerging growth company ☐
If an emerging growth company that prepares its financial statements in accordance with U.S. GAAP, indicate by check mark if the registrant has
elected not to use the extended transition period for complying with any new or revised financial accounting standards† provided pursuant to Section 13
(a) of the Exchange Act. ☐
† The term “new or revised financial accounting standard” refers to any update issued by the Financial Accounting Standards Board to its Accounting
Standards Codification after April 5, 2012.

DISCLOSURE CONTROLS AND PROCEDURES
Management’s responsibility for financial information contained in the Annual Report is described on page 136 of Exhibit 99.3, 2019 Consolidated
Financial Statements. In addition, the Bank’s Audit and Conduct Review Committee of the Board of Directors has reviewed, and the Board of Directors
has reviewed and approved, the 2019 Consolidated Financial Statements and Management’s Discussion and Analysis prior to release. Scotiabank is
committed to providing timely, accurate and balanced disclosure of all material information and to providing fair and equal access to such information.
The Bank’s disclosure policies and practices are published on its website.
Disclosure Controls and Procedures
The Bank’s disclosure controls and procedures are designed to provide reasonable assurance that information is accumulated and communicated to the
Bank’s management, including the Chief Executive Officer (“CEO”) and Chief Financial Officer (“CFO”), as appropriate, to allow timely decisions
regarding required disclosure.
As of October 31, 2019, the Bank’s management, with the participation of the CEO and CFO, evaluated the effectiveness of its disclosure controls
and procedures, as defined under the rules adopted by the United States Securities and Exchange Commission (“SEC”) and the Canadian securities
regulatory authorities, and have concluded that the Bank’s disclosure controls and procedures are effective.
Internal control over financial reporting
Management of the Bank is responsible for establishing and maintaining adequate internal control over financial reporting. These controls include
policies and procedures that: (1) pertain to the maintenance of records that, in reasonable detail, accurately and fairly reflect the transactions and
dispositions of the assets of the Bank; (2) provide reasonable assurance that transactions are recorded as necessary to permit preparation of financial
statements in accordance with International Financial Reporting Standards (“IFRS”) as issued by the International Accounting Standards Board, and that
receipts and expenditures are being made only in accordance with authorizations of management and directors of the Bank; and (3) provide reasonable
assurance regarding prevention or timely detection of unauthorized acquisition, use or disposition of the Bank’s assets that could have a material effect
on the financial statements.
All control systems contain inherent limitations, no matter how well designed. As a result, the Bank’s management acknowledges that its internal
control over financial reporting will not prevent or detect all misstatements due to error or fraud. In addition, management’s evaluation of controls can
provide only reasonable, not absolute, assurance that all control issues that may result in material misstatements, if any, have been detected.
Management assessed the effectiveness of internal control over financial reporting, using the Committee of Sponsoring Organizations of the
Treadway Commission (COSO) 2013 framework, and based on that assessment concluded that internal control over financial reporting was effective as
of October 31, 2019.

Changes in internal control over financial reporting
There have been no changes in the Bank’s internal control over financial reporting that have materially affected, or are reasonably likely to materially
affect, the Bank’s internal control over financial reporting during the year ended October 31, 2019.
MANAGEMENT’S INTERNAL CONTROL OVER FINANCIAL REPORTING
Management’s Report on Internal Control over Financial Reporting and the Report of Independent Registered Public Accounting Firm are provided in
Exhibit 99.4.
AUDIT COMMITTEE FINANCIAL EXPERTS
All of the members of the Bank’s Audit and Conduct Review Committee of the Board of Directors (“audit committee”) are financially literate and
independent, and one or more members of the audit committee meets the definition of a financial expert. The Bank’s Board of Directors has determined
that Una M. Power, Aaron W. Regent and Benita M. Warmbold are audit committee financial experts and are independent, as that term is defined by the
New York Stock Exchange’s corporate governance standards applicable to the Bank.
The SEC has indicated that the designation of a person as an audit committee financial expert does not impose on such person any duties,
obligations or liability that are greater than the duties, obligations and liability imposed on such person as a member of the audit committee and board of
directors in the absence of such designation.
CODE OF ETHICS
The Bank has adopted a code of ethics, entitled “Scotiabank Code of Conduct” (the “Code ”). The Code has been in place for many years and applies to
all directors, officers, employees and contingent workers of the Bank. A copy of the Code was most recently filed as an exhibit to Form 6-K filed with
the SEC (EDGAR Company Filings) on November 26, 2019. The Code is also available on the Bank’s website at www.scotiabank.com, in the
Corporate Governance section, and is available in print to any person, without charge, upon written request to the Corporate Secretary of the Bank at the
Toronto executive office address shown above. A supplement to the Code, the Whistleblower Policy and Procedures, is also posted on the Bank’s
website. Amendments to the Code and waivers, if any, for directors and executive officers will be disclosed on the Bank’s website. There were no such
waivers under the Code granted in fiscal 2019.
PRINCIPAL ACCOUNTANT FEES AND SERVICES
The disclosure provided in Table 75 “Fees paid to the shareholders’ auditors” on page 124 of Exhibit 99.2, Management’s Discussion and Analysis, is
incorporated by reference herein. The nature of these services is as follows:
• Audit services generally relate to the statutory audits and review of financial statements, regulatory required attestation reports, as well as
services associated with registration statements, prospectuses, periodic reports and other documents filed with securities regulatory bodies
or other documents issued in connection with securities offerings.
• Audit-related services include special attest services not directly linked to the financial statements, review of controls and procedures
related to regulatory reporting, audits of employee benefit plans and consultation and training on accounting and financial reporting.

• Tax services outside of the audit scope relate primarily to specified review procedures required by local tax authorities, attestation on tax
returns of certain subsidiaries as required by local tax authorities, and review to determine compliance with an agreement with the tax
authorities.
• Other non-audit services are primarily for the review and translation of English language financial statements into other languages and
other services.
None of the above services were approved pursuant to an exemption under paragraph (c)(7)(i)(C) of Rule 2-01 of Regulation S-X from the
requirement that the audit committee pre-approve the services. The majority of the hours expended on the audits of the 2019 and 2018 consolidated
financial statements were attributable to work performed by the full-time permanent employees of the Bank’s independent auditors, KPMG LLP or its
affiliates. The audit committee’s pre-approval policies and procedures, as revised effective March 5, 2007, were attached as Exhibit 7 to the Form 40-F
filed on December 19, 2007 for the fiscal year ended October 31, 2007. The pre-approval policies and procedures have been subsequently approved
without any major changes at each annual review.
OFF-BALANCE SHEET ARRANGEMENTS
The disclosure provided under “Off-balance Sheet Arrangements” on pages 64 to 66 and “Structured entities” on pages 65 to 66 of Exhibit 99.2,
Management’s Discussion and Analysis, is incorporated by reference herein. Additional information from note 3 on pages 149 to 166, note 7 on pages
168 to 173, note 10 on pages 176 to 184, note 14 on page 197 , note 15 on pages 197 to 200, note 23 on pages 204 to 205, note 24 on pages 205 to 208,
note 35 on pages 225 to 227 and note 36 on pages 227 to 234 of Exhibit 99.3, 2019 Consolidated Financial Statements, is incorporated by reference into
“Off-balance Sheet Arrangements” in Management’s Discussion and Analysis.
CONTRACTUAL OBLIGATIONS
The disclosure provided under “Contractual maturities and obligations” on pages 99 to 101 of Exhibit 99.2, Management’s Discussion and Analysis, is
incorporated by reference herein. Additional information from note 7 on pages 168 to 173, note 20 on page 203, note 28 on pages 213 to 217, note 35 on
pages 225 to 227 and note 36 on pages 227 to 234 of Exhibit 99.3, 2019 Consolidated Financial Statements, is incorporated by reference into
“Contractual Obligations” in Management’s Discussion and Analysis.
IDENTIFICATION OF THE AUDIT COMMITTEE
The Bank’s audit committee is composed of the following directors: Una M. Power (Chair and financial expert), Scott B. Bonham, Charles H. Dallara,
Tiff Macklem, Michael D. Penner, Aaron W. Regent (financial expert), Susan L. Segal and Benita M. Warmbold (financial expert).
SUMMARY OF SIGNIFICANT CORPORATE GOVERNANCE DIFFERENCES
A summary of significant ways corporate governance practices followed by the Bank differ from corporate governance practices required to be followed
by U.S. domestic companies under the New York Stock Exchange’s listing standards (disclosure required by Section 303A.11 of the NYSE Listed
Company Manual) is available on the Bank’s website at https://www.scotiabank.com/ca/en/about/inside-scotiabank/corporate-
governance/differences.html.
DISCLOSURE PURSUANT TO SECTION 13(r) OF THE EXCHANGE ACT
Pursuant to section 13(r) of the Exchange Act, the Bank is required to disclose whether it or any of its affiliates knowingly engaged in certain activities,
transactions or dealings related to both the Islamic Republic of Iran (“Iran”) and certain persons listed on the Specially Designated National and Blocked
Persons list maintained by the United States Department of Treasury Office of Foreign Assets Control, during the year ended October 31, 2019.
Disclosure of these certain activities, transactions or dealings is generally required even if conducted in compliance

with applicable law and regulations. The Bank is not aware that it or any of its affiliates have knowingly engaged in any transaction or dealing
reportable under section 13(r) of the Exchange Act during the year ended October 31, 2019.
Undertaking
Registrant undertakes to make available, in person or by telephone, representatives to respond to inquiries made by the Commission staff, and to furnish
promptly, when requested to do so by the Commission staff, information relating to: the securities registered pursuant to Form 40-F; the securities in
relation to which the obligation to file an annual report on Form 40-F arises; or transactions in said securities.

Signatures
Pursuant to the requirements of the Exchange Act, the Registrant certifies that it meets all of the requirements for filing on Form 40-F and has duly
caused this annual report to be signed on its behalf by the undersigned, thereto duly authorized.
Registrant: THE BANK OF NOVA SCOTIA
By: /s/ Rajagopal Viswanathan
Name: Rajagopal Viswanathan
Title: Executive Vice-President and Chief Financial Officer
Date: November 26, 2019
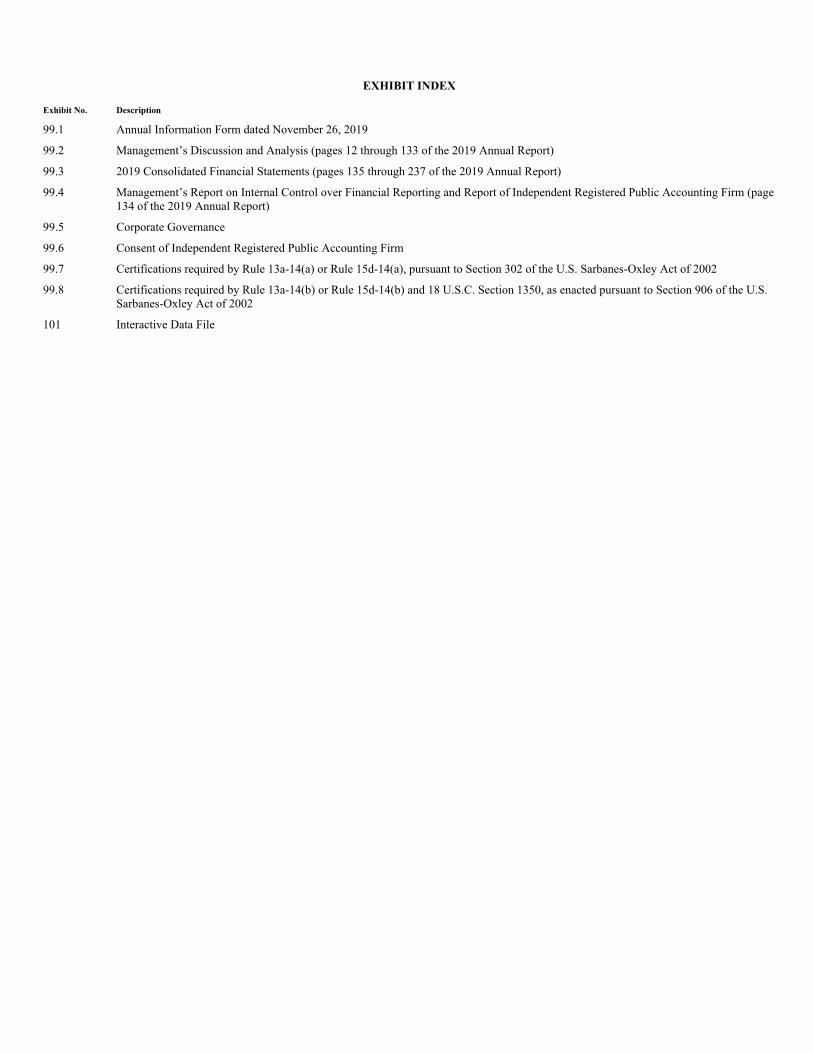
EXHIBIT INDEX
Exhibit No. Description
99.1 Annual Information Form dated November 26, 2019
99.2 Management’s Discussion and Analysis (pages 12 through 133 of the 2019 Annual Report)
99.3 2019 Consolidated Financial Statements (pages 135 through 237 of the 2019 Annual Report)
99.4 Management’s Report on Internal Control over Financial Reporting and Report of Independent Registered Public Accounting Firm (page
134 of the 2019 Annual Report)
99.5 Corporate Governance
99.6 Consent of Independent Registered Public Accounting Firm
99.7 Certifications required by Rule 13a-14(a) or Rule 15d-14(a), pursuant to Section 302 of the U.S. Sarbanes-Oxley Act of 2002
99.8 Certifications required by Rule 13a-14(b) or Rule 15d-14(b) and 18 U.S.C. Section 1350, as enacted pursuant to Section 906 of the U.S.
Sarbanes-Oxley Act of 2002
101 Interactive Data File

Exhibit 99.1
The Bank of Nova Scotia
ANNUAL
INFORMATION
FORM
NOVEMBER 26, 2019
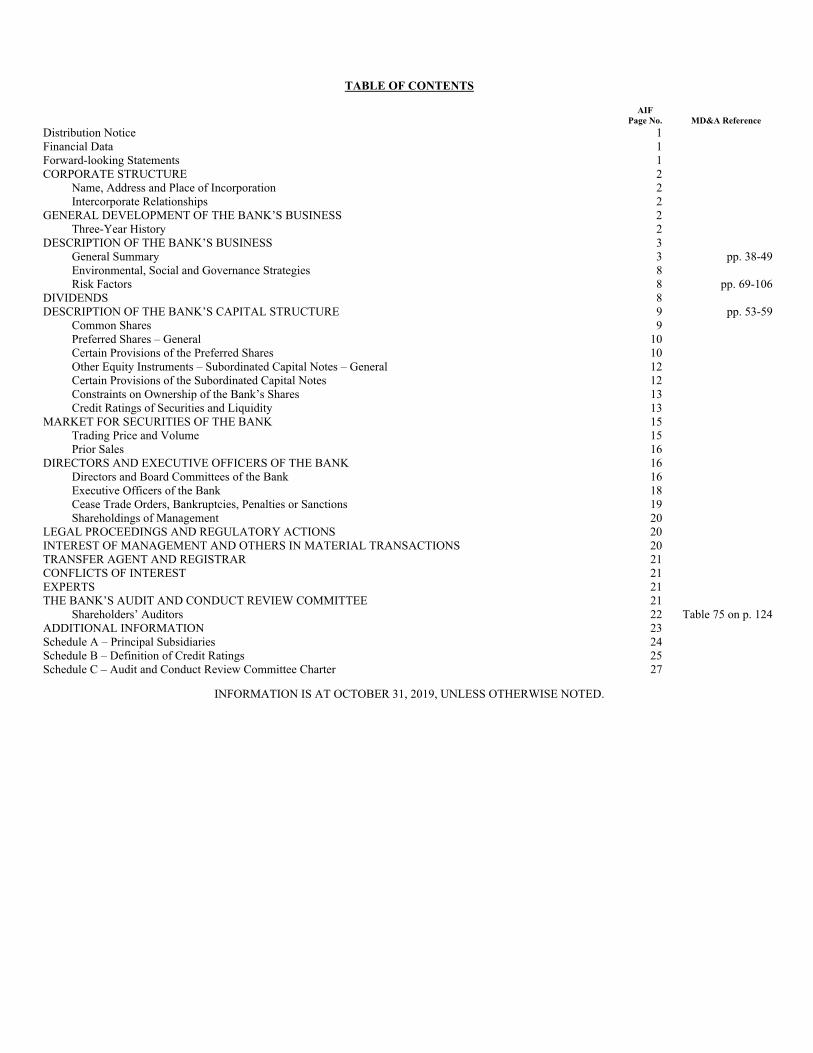
TABLE OF CONTENTS
AIF
Page No. MD&A Reference
Distribution Notice 1
Financial Data 1
Forward-looking Statements 1
CORPORATE STRUCTURE 2
Name, Address and Place of Incorporation 2
Intercorporate Relationships 2
GENERAL DEVELOPMENT OF THE BANK’S BUSINESS 2
Three-Year History 2
DESCRIPTION OF THE BANK’S BUSINESS 3
General Summary 3 pp. 38-49
Environmental, Social and Governance Strategies 8
Risk Factors 8 pp. 69-106
DIVIDENDS 8
DESCRIPTION OF THE BANK’S CAPITAL STRUCTURE 9 pp. 53-59
Common Shares 9
Preferred Shares – General 10
Certain Provisions of the Preferred Shares 10
Other Equity Instruments – Subordinated Capital Notes – General 12
Certain Provisions of the Subordinated Capital Notes 12
Constraints on Ownership of the Bank’s Shares 13
Credit Ratings of Securities and Liquidity 13
MARKET FOR SECURITIES OF THE BANK 15
Trading Price and Volume 15
Prior Sales 16
DIRECTORS AND EXECUTIVE OFFICERS OF THE BANK 16
Directors and Board Committees of the Bank 16
Executive Officers of the Bank 18
Cease Trade Orders, Bankruptcies, Penalties or Sanctions 19
Shareholdings of Management 20
LEGAL PROCEEDINGS AND REGULATORY ACTIONS 20
INTEREST OF MANAGEMENT AND OTHERS IN MATERIAL TRANSACTIONS 20
TRANSFER AGENT AND REGISTRAR 21
CONFLICTS OF INTEREST 21
EXPERTS 21
THE BANK’S AUDIT AND CONDUCT REVIEW COMMITTEE 21
Shareholders’ Auditors 22 Table 75 on p. 124
ADDITIONAL INFORMATION 23
Schedule A – Principal Subsidiaries 24
Schedule B – Definition of Credit Ratings 25
Schedule C – Audit and Conduct Review Committee Charter 27
INFORMATION IS AT OCTOBER 31, 2019, UNLESS OTHERWISE NOTED.

Distribution Notice
When this Annual Information Form is provided to security holders or other interested parties, it must be accompanied by copies of all the documents
(or excerpts thereof) incorporated herein by reference. Portions of this Annual Information Form of The Bank of Nova Scotia (the “Bank”,
“Scotiabank”, “we” or “our”) dated November 26, 2019 (the “AIF”), are disclosed in the Management’s Discussion and Analysis for the year ended
October 31, 2019 (the “MD&A”). The MD&A is also available on SEDAR at www.sedar.com.
Financial Data
Except as otherwise noted, all information is given at or for the year ended October 31, 2019. Amounts are expressed in Canadian dollars. Financial
information is presented in accordance with International Financial Reporting Standards (“IFRS”) as issued by the International Accounting Standards
Board, unless otherwise noted.
Forward-looking Statements
From time to time, our public communications often include oral or written forward-looking statements. Statements of this type are included in this
document, and may be included in other filings with Canadian securities regulators or the U.S. Securities and Exchange Commission (“SEC”), or in
other communications. In addition, representatives of the Bank may include forward-looking statements orally to analysts, investors, the media and
others. All such statements are made pursuant to the “safe harbor” provisions of the U.S. Private Securities Litigation Reform Act of 1995 and any
applicable Canadian securities legislation. Forward-looking statements may include, but are not limited to, statements made in this document, the
Management’s Discussion and Analysis in the Bank’s 2019 Annual Report under the headings “Outlook” and in other statements regarding the Bank’s
objectives, strategies to achieve those objectives, the regulatory environment in which the Bank operates, anticipated financial results, and the outlook
for the Bank’s businesses and for the Canadian, U.S. and global economies. Such statements are typically identified by words or phrases such as
“believe,” “expect,” “foresee,” “forecast,” “anticipate,” “intend,” “estimate,” “plan,” “goal,” “project,” and similar expressions of future or conditional
verbs, such as “will,” “may,” “should,” “would” and “could.”
By their very nature, forward-looking statements require us to make assumptions and are subject to inherent risks and uncertainties, which give rise to
the possibility that our predictions, forecasts, projections, expectations or conclusions will not prove to be accurate, that our assumptions may not be
correct and that our financial performance objectives, vision and strategic goals will not be achieved.
We caution readers not to place undue reliance on these statements as a number of risk factors, many of which are beyond our control and effects of
which can be difficult to predict, could cause our actual results to differ materially from the expectations, targets, estimates or intentions expressed in
such forward-looking statements.
The future outcomes that relate to forward-looking statements may be influenced by many factors, including but not limited to: general economic and
market conditions in the countries in which we operate; changes in currency and interest rates; increased funding costs and market volatility due to
market illiquidity and competition for funding; the failure of third parties to comply with their obligations to the Bank and its affiliates; changes in
monetary, fiscal, or economic policy and tax legislation and interpretation; changes in laws and regulations or in supervisory expectations or
requirements, including capital, interest rate and liquidity requirements and guidance, and the effect of such changes on funding costs; changes to our
credit ratings; operational and infrastructure risks; reputational risks; the accuracy and completeness of information the Bank receives on customers and
counterparties; the timely development and introduction of new products and services; our ability to execute our strategic plans, including the successful
completion of acquisitions and dispositions, including obtaining regulatory approvals; critical accounting estimates and the effect of changes to
accounting standards, rules and interpretations on these estimates; global capital markets activity; the Bank’s ability to attract, develop and retain key
executives; the evolution of various types of fraud or other criminal behaviour to which the Bank is exposed; disruptions in or attacks (including cyber-
attacks) on the Bank’s information technology, internet, network access, or other voice or data communications systems or services; increased
competition in the geographic and in business areas in which we operate, including through internet and mobile banking and non-traditional
competitors; exposure related to significant litigation and regulatory matters; the occurrence of natural and unnatural catastrophic events and claims
resulting from such events; and the Bank’s anticipation of and success in managing the risks implied by the foregoing. A substantial amount of the
Bank’s business involves making loans or otherwise committing resources to specific companies, industries or countries. Unforeseen events affecting
such borrowers, industries or countries could have a material adverse effect on the Bank’s
- 1 -

financial results, businesses, financial condition or liquidity. These and other factors may cause the Bank’s actual performance to differ materially from
that contemplated by forward-looking statements. The Bank cautions that the preceding list is not exhaustive of all possible risk factors and other factors
could also adversely affect the Bank’s results, for more information, please see the “Risk Management” section of the Bank’s 2019 Annual Report, as
may be updated by quarterly reports.
Material economic assumptions underlying the forward-looking statements contained in this document are set out in the 2019 Annual Report under the
headings “Outlook”, as updated by quarterly reports. The “Outlook” sections are based on the Bank’s views and the actual outcome is uncertain.
Readers should consider the above-noted factors when reviewing these sections. When relying on forward-looking statements to make decisions with
respect to the Bank and its securities, investors and others should carefully consider the preceding factors, other uncertainties and potential events.
Any forward-looking statements contained in this document represent the views of management only as of the date hereof and are presented for the
purpose of assisting the Bank’s shareholders and analysts in understanding the Bank’s financial position, objectives and priorities, and anticipated
financial performance as at and for the periods ended on the dates presented, and may not be appropriate for other purposes. Except as required by law,
the Bank does not undertake to update any forward-looking statements, whether written or oral, that may be made from time to time by or on its behalf.
Additional information relating to the Bank can be located on the SEDAR website at www.sedar.com and on the EDGAR section of the SEC’s website
at www.sec.gov.
CORPORATE STRUCTURE
Name, Address and Place of Incorporation
The Bank was granted a charter under the laws of the Province of Nova Scotia in 1832 and commenced operations in Halifax, Nova Scotia in that year.
Since 1871, the Bank has been a chartered bank under the Bank Act (Canada) (the “Bank Act”). The Bank is a Schedule I bank under the Bank Act and
the Bank Act is its charter. The head office of the Bank is located at 1709 Hollis Street, Halifax, Nova Scotia, B3J 1W1 and its executive offices are at
Scotia Plaza, 44 King Street West, Toronto, Ontario, M5H 1H1. A copy of the Bank’s by-laws is available on www.sedar.com.
Intercorporate Relationships
Each international principal subsidiary of the Bank is incorporated or established and existing under the laws of the jurisdiction in which its principal
office is located, with the exception of Scotia Holdings (US) Inc. which is incorporated and existing under the laws of the State of Delaware. Each
Canadian principal subsidiary of the Bank is incorporated or established and existing under the laws of Canada, with the exception of: 1832 Asset
Management L.P., Scotia Capital Inc. and Scotia Securities Inc. which are incorporated or established and existing under the laws of the Province of
Ontario.
The Bank’s principal subsidiaries are listed on Schedule A.
GENERAL DEVELOPMENT OF THE BANK’S BUSINESS
Three-Year History
As reported in accordance with IFRS, for the fiscal year ended October 31, 2019, the Bank’s net income attributable to common shareholders was
$8,208 million, down from $8,361 million in 2018. The Bank’s net income attributable to common shareholders was $7,876 million in 2017. Earnings
per share (on a diluted basis) for the fiscal year ended October 31, 2019 was $6.68 compared to $6.82 in 2018 and $6.49 in 2017.
Return on equity for the fiscal year ended October 31, 2019 was 13.1%, compared to 14.5% in 2018 and 14.6% in 2017. In fiscal 2019, the Bank’s
actual dividend payout ratio was 51.9% compared to 47.7% in 2018 and 46.6% in 2017.
For additional information on the Bank’s businesses, see the descriptions provided below and on pages 38 to 49 of the MD&A.
- 2 -

Certain acquisitions and dispositions that have influenced the general development of the Bank’s business over the past three years are summarized
below, for additional information on acquisitions and divestitures, see note 37 to the Bank’s consolidated financial statements for the year ended
October 31, 2019.
On October 31, 2019, the Bank completed the sale of its banking operations in Anguilla, Dominica, Grenada, St. Kitts & Nevis, St. Lucia, St. Maarten
and St. Vincent & the Grenadines to Republic Financial Holdings Limited.
On April 30, 2019, the Bank completed the sale of Scotia Crecer AFP and Scotia Seguros, its pension and related insurance businesses in the Dominican
Republic, to Grupo Rizek.
On March 1, 2019, the Bank completed the acquisition of Banco Dominicano del Progreso, a bank with operations in the Dominican Republic.
On October 3, 2018, the Bank completed the acquisition of MD Financial Management Inc. (“MD”) from the Canadian Medical Association (“CMA”),
for approximately $2.7 billion. MD is Canada’s leading provider of financial services to physicians and their families, with more than $49 billion in
assets under management and administration. The Bank and the CMA have entered into a 10-year affinity agreement under which the Bank will commit
to pay $115 million over the next 10 years to support the advancement of the medical profession and health care in Canada. MD forms part of the
Canadian Banking business segment.
On July 6, 2018, the Bank completed the acquisition of 68.2% of Banco Bilbao Vizcaya Argentaria, Chile, 100% of BBVA Seguros Vida S.A., 100% of
Servicios Corporativos S.A., 68.1% of Inmobiliaria e Inversiones S.A. and 4.1% of Inversiones DCV S.A. (together, “BBVA Chile”) for approximately
US$2.2 billion. The Bank consolidated 100% of BBVA Chile’s assets and liabilities and recorded a non-controlling interest of 31.8%. The acquired
business forms part of the International Banking business segment.
On June 30, 2018, the Bank’s Colombian subsidiary, Scotiabank Colpatria S.A., completed the acquisition of Citibank’s consumer (retail and credit
cards) and small and medium enterprise operations in Colombia. This acquisition forms part of the International Banking business segment.
On May 1, 2018, the Bank completed the acquisition of Jarislowsky Fraser Limited, an independent investment firm with approximately $40 billion in
assets under management on behalf of institutional and high net worth clients, for approximately $978 million.
On August 4, 2017, the Bank completed the disposition of HollisWealth, its independent wealth advisory business, to Industrial Alliance Insurance and
Financial Services Inc. The agreement was first announced on December 5, 2016. The net assets and gain on sale are not material to the Bank.
DESCRIPTION OF THE BANK’S BUSINESS
General Summary
Scotiabank is a leading bank in Canada and a leading financial services provider in the Americas. We help our customers, their families and their
communities achieve success through a broad range of advice, products and services, including personal and commercial banking, wealth management
and private banking, corporate and investment banking, and capital markets.
For the year ended October 31, 2019, the Bank’s three business operating segments are: Canadian Banking, International Banking and Global Banking
and Markets. Effective November 1, 2019, Global Wealth Management will become a fourth business segment.
Canadian Banking provides a full suite of financial advice and banking solutions, supported by an excellent customer experience, to over 11 million
Retail, Small Business, and Commercial Banking customers. It serves these customers through its network of approximately 950 branches and more
than 3,650 automated banking machines (“ABMs”), and internet, mobile, telephone banking, and specialized sales teams. Canadian Banking also
provides an alternative self-directed banking solution to over 2 million Tangerine Bank customers.
- 3 -

International Banking has a strong and diverse franchise with more than 11 million Retail, Corporate and Commercial customers. The Bank has almost
60,000 employees and our customers are served by a network of more than 1,900 branches, 5,500 ATMs and contact centres.
Global Banking and Markets (“GBM”) provides corporate clients with lending and transaction services, investment banking advice and access to capital
markets. GBM is a full-service wholesale bank in the Americas, with operations in 21 countries, serving clients across Canada, the United States, Latin
America, Europe and Asia-Pacific.
Global Wealth Management is focused on delivering comprehensive wealth management advice and solutions to clients across the Bank’s footprint.
Global Wealth Management serves over 2.5 million investment fund and advisory clients across 14 countries – managing over $490 billion in assets.
A more complete description of services provided by each of the Bank’s major business lines is available in the MD&A, on pages 38 to 49 inclusive,
and those pages are herein incorporated by reference.
Competition
The Canadian banking system consists of numerous banks and other financial institutions. Certain large Canadian banks are required by law to be
widely held because their equity exceeds a threshold of $12 billion. These banks compete nationwide through extensive branch networks, ABMs,
telephone, internet and mobile banking offerings. In total, the Canadian system includes 37 domestic banks, 28 foreign banks and more than 300 credit
unions and caisses populaires. More broadly, the Canadian financial services industry includes thousands of institutions such as life insurance
companies, property and casualty insurers, consumer finance companies, independent investment dealers and independent retail mutual fund
management companies.
Competition is reflected in the range of products and services offered, innovation in features, services, technology and delivery, as well as the various
pricing schemes adopted. Canada ranks 9 in the world in terms of its financial market development, according to the 2019 Global Competitiveness
Report of the World Economic Forum. Additionally, a greater number of service providers in the Canadian marketplace are offering alternative channels
and competition in the payments space. The increased number of new entrants into the financial services sector in recent years has also underscored an
enhanced level of competition.
Scotiabank is a leading financial services provider in the Americas. In providing these services and products, the Bank competes with local and
international banks and other financial institutions.
Supervision and Regulation in Canada
As a Canadian Schedule I Bank, the Bank’s activities in Canada are governed by the Bank Act, which is one of four main federal statutes governing the
financial services industry in Canada. The other three statutes cover trust and loan companies, insurance companies and co-operative credit associations.
In accordance with the Bank Act, an organization may engage in and carry on the business of banking and such business generally as pertains to the
business of banking. The Bank Act grants Canadian chartered banks broad powers of investment in the securities of other corporations and entities, but
imposes limits upon substantial investments. Under the Bank Act, generally a bank has a substantial investment in a body corporate when (a) voting
rights attached to the voting shares beneficially owned by the bank and by entities controlled by the bank exceed 10% of the voting rights attached to the
outstanding voting shares of the body corporate, or (b) the total number of shares of the body corporate that are beneficially owned by the bank and
entities controlled by the bank represent more than 25% of the total shareholders’ equity of the body corporate. In addition, under the Bank Act, a bank
has a substantial investment in an unincorporated entity where the ownership interests in such entity beneficially owned by that bank and by entities
controlled by that bank exceed 25% of all ownership interests in such entity. A Canadian chartered bank is permitted to have a substantial investment in
entities whose activities are consistent with those of certain prescribed permitted substantial investments. In general, a bank will be permitted to invest
in an entity that carries on any financial services activity. Further, a bank may generally invest in entities that carry on commercial activities that are
related to the promotion, sale, delivery or distribution of a financial product or service. A bank may also invest in entities that provide professional
investment management to closed-end funds and mutual
- 4 -
th

funds, engage in the distribution of mutual funds and provide consulting and agency services for real property or service financial institutions and the
bank may have downstream holding companies to hold these investments. In certain cases, the approval of the Minister of Finance (the “Minister”) or
the Superintendent of Financial Institutions Canada (the “Superintendent”) is required prior to making the investment and/or the bank is required to
control the entity. Canadian chartered banks may offer through their branch network credit or charge-card related insurance, creditors’ disability
insurance, creditors’ life insurance, creditors’ loss of employment insurance, creditors’ vehicle inventory insurance, export credit insurance, mortgage
insurance and travel insurance. Outside bank branches, a bank may offer insurance only in the limited circumstances prescribed by the Bank Act.
Without Minister approval, no person or group of associated persons may own more than 10% of any class of shares of the Bank. No person may be a
major shareholder of a bank if the bank has equity of $12 billion or more (which includes the Bank). A person is a major shareholder of a bank if: (a) the
aggregate of shares of any class of voting shares beneficially owned by that person and that are beneficially owned by any entities controlled by that
person is more than 20% of that class of voting shares; or (b) the aggregate of shares of any class of non-voting shares beneficially owned by that person
and that are beneficially owned by any entities controlled by that person is more than 30% of that class of non-voting shares. Ownership of the Bank’s
shares by Canadian or foreign governments is prohibited under the Bank Act. However, in 2009 certain amendments were made to the Bank Act that
provide for limited circumstances in which the Canadian federal government may be permitted to acquire shares of a bank, including the Bank, if the
Minister and Governor in Council were to conclude that to do so would promote stability in the financial system. While the government holds any
shares of a bank, including the Bank, the Minister may impose certain terms and conditions, including conditions on the payment by the Bank of
dividends on any of its shares.
The Superintendent is responsible to the Minister for the administration of the Bank Act. The Superintendent is required to make an annual examination
of each bank to ensure compliance with the Bank Act and to ensure that each bank is in sound financial condition. The report of the Superintendent’s
examination is submitted to the Minister. The Bank is also required to disclose certain financial information. The Bank is subject to regulation by the
Canada Deposit Insurance Corporation and the Financial Consumer Agency of Canada, and the activities of the Bank in Canada are subject to various
other federal statutory provisions, including the Proceeds of Crime (Money Laundering) and Terrorist Financing Act which applies to all of the Bank’s
businesses in Canada. The activities of the Bank’s trust subsidiaries and insurance subsidiaries are regulated in Canada under the Trust and Loan
Companies Act and the Insurance Companies Act, respectively, and under provincial laws in respect of their activities in the provinces. Certain activities
of the Bank and its subsidiaries acting as securities brokers, dealers (including investment and mutual fund dealers), underwriters and advisors
(including investment counsel and portfolio managers) are regulated in Canada under provincial securities legislation and, in some cases, by self-
regulatory organizations, such as the Investment Industry Regulatory Organization of Canada for broker dealers and the Mutual Fund Dealers
Association for mutual fund dealers.
Bank Recapitalization (Bail-In) Regime
On September 23, 2018, the regulations under the Canada Deposit Insurance Corporation Act (Canada) (the “CDIC Act”) and the Bank Act
(collectively, the “Bail-In Regulations”) which provides the details of conversion, issuance and compensation regimes for bail-in instruments issued by
domestic systemically important banks, including the Bank, came into force. Pursuant to the CDIC Act, in circumstances where the Superintendent of
Financial Institutions has determined that the Bank has ceased, or is about to cease, to be viable, the Governor in Council may, upon a recommendation
of the Minister of Finance that he or she is of the opinion that it is in the public interest to do so, grant an order directing CDIC to convert all or a portion
of certain shares and liabilities of the Bank into common shares of the Bank. For a description of the Canadian bank resolution powers and the
consequent risk factors attaching to certain liabilities of the Bank reference is made to the Bank’s website under Regulatory Disclosures for Fixed
Income Investors . The information on our website does not form part of this Annual Information Form.
International Supervision and Regulation
Capital adequacy for Canadian banks is regulated by the Office of the Superintendent of Financial Institutions, Canada (“OSFI”) and subject to the
revised capital adequacy requirements as published by the Basel Committee on Banking
Visit webpage at
https://www.scotiabank.com/ca/en/about/investors-shareholders/regulatory-disclosures/canadian-bank-resolution-powers-including-bail-in.html.
- 5 -
1
1

Supervision (BCBS) and commonly referred to as Basel III. Additional information on the regulatory capital of the Bank and developments facing the
Bank are described under the headings “Regulatory capital” and “Regulatory capital developments during the year” on pages 53-55 of the MD&A,
respectively, and those sections are incorporated herein by reference.
Automatic Exchange of Information
Under the initiative of the Organization for Economic Co-Operation and Development, many countries have committed to automatic exchange of
information relating to accounts held by tax residents of signatory countries, using a Common Reporting Standard (“CRS”). Canada’s automatic
exchange of financial account information arrangements with jurisdictions, other than the U.S., has been implemented in accordance with the CRS and
the implementation of the CRS legislation in Canada was effective July 1, 2017. The Bank meets all obligations imposed under the CRS, in accordance
with local laws, in Canada and all applicable jurisdictions in which it operates.
Supervision and Regulation Outside Canada – Key Jurisdictions
United States
The activities of the Bank and its subsidiaries in the U.S. are subject to federal and state supervision, regulation and examination by bank regulatory and
other governmental agencies. The Bank is subject to the Bank Holding Company Act of 1956 (“BHCA”) and the International Banking Act of 1978 and
associated regulations of the Board of Governors of the Federal Reserve System (the “Federal Reserve Board”). The Federal Reserve Board and other
banking regulators oversee the operation of the Bank’s branches, offices and subsidiaries in the U.S. The SEC, state securities regulators and self-
regulatory organizations, such as the Financial Industry Regulatory Authority, regulate its broker-dealer subsidiary and the Commodity Futures Trading
Commission (“CFTC”) oversees the Bank’s swaps and commodities trading and clearing businesses.
The Bank is a “financial holding company” under the BHCA. This status allows a broad range of financial activities to be undertaken in the U.S. In
addition, the Bank owns a commercial and retail bank in the Commonwealth of Puerto Rico that is subject to various laws and regulation and
examination by the Commonwealth of Puerto Rico and federal regulators and is a Federal Deposit Insurance Corporation-insured depository institution.
Provisions of the Federal Reserve Act place certain limitations and restrictions on the transactions that the Bank’s U.S. branches, agencies and
subsidiary bank can engage in with affiliates of the Bank.
The Bank, as a non-U.S. bank with U.S. operations, is required by the U.S. Bank Secrecy Act as amended by the USA PATRIOT Act of 2001, to take
certain steps to prevent, detect and report individuals and entities involved in international money laundering and the financing of terrorism. Failure of a
financial institution to comply with these requirements could have serious legal and reputational consequences for the institution.
The Bank is also subject to the Dodd-Frank Wall Street Reform and Consumer Protection Act (the “Dodd-Frank Act”). Dodd-Frank Act reforms include
heightened consumer protection, revised regulation of over-the-counter derivatives markets, restrictions on proprietary trading and the ownership and
sponsorship of private investment funds by banks and their affiliates (referred to as the Volcker Rule), imposition of heightened prudential standards,
and broader application of leverage and risk-based capital requirements. The Volcker Rule impacts our global activities as its reach extends to the Bank
and each of its subsidiaries and affiliates (subject to certain exceptions and exclusions). The Bank has an enterprise wide compliance program to meet
the requirements of the Volcker Rule, which became effective on July 21, 2015. During 2019, the five federal agencies responsible for overseeing the
Volcker Rule passed certain changes to the Rule. The Bank is assessing the impact of the changes, which it believes will not be material.
The Bank is subject to the enhanced prudential standards and early remediation requirements of sections 165 (implemented by Regulation YY) and 166
of the Dodd-Frank Act (the “FBO Rule”) for bank holding companies and foreign banking organizations. With respect to foreign banking organizations,
the overall intent of Section 165 and Regulation YY is to strengthen the regulation of the U.S. operations of foreign banking organizations by requiring
home country capital certification consistent with the Basel capital framework, home country capital stress tests comparable to U.S. standards,
maintenance of a liquidity buffer for U.S. branches and agencies and establishment of a U.S. risk committee with the
- 6 -

appointment of a U.S. Chief Risk Officer. The Bank has a Chief Risk Officer for the U.S., a U.S. Risk Committee and complies with the FBO Rule. The
Bank is not currently required to form a U.S. intermediate holding company under the FBO Rule. On October 2019, the Federal Reserve finalized its
rules to further tailor the regulatory framework for enhanced prudential standards and the U.S. Basel III capital and liquidity requirements applicable to
domestic banking organizations and foreign banking organizations (FBOs). The Bank is assessing the impact of these rules, which it believes will not be
material.
The SEC has taken several steps toward completing its regulatory framework for security-based swap dealers and majority security-based swap
participants, as required under the Dodd-Frank Act. The SEC unanimously adopted final rules providing the registration process for security-based swap
dealers and majority security-based swap participants, including the detailed forms that registrants will be required to file. The Bank, which is currently
registered as a swap dealer with the CFTC, anticipates that it will be required to register as a security-based swap dealer with the SEC.
Mexico
Grupo Financiero Scotiabank Inverlat, S.A. de C.V. is an “affiliate holding company” pursuant to the Law for the Regulation of Financial Groups of
Mexico and the Rules for the Establishment of Foreign Affiliate Financial Institutions of Mexico. The governing authority is the Ministry of Finance of
Public Credit of Mexico and the supervising and regulatory authorities are the Central Bank of Mexico, the National Banking and Securities
Commission and the National Commission for the Protection of the Users of Financial Services.
Peru
Scotiabank Peru S.A.A. is a “banking company” pursuant to the Law of the Banking System, Insurance and Private Pension Funds Administrators and
applicable rules for financial groups enacted by the Superintendency of Banking System, Insurance and Private Pension Funds Administrators (“SBS”)
and the Superintendency of Securities Market (“SMV”). Beside SBS and SMV, the other governing authorities are the Central Bank of Peru, and the
National Institution for the Defense of Competition and Intellectual Property, in charge, among other functions, of the protection of consumers of
financial services.
Pursuant to SBS and SMV regulations on ownership and control of supervised companies, Scotiabank Peru S.A.A. also reports on its holding company
shareholder Scotia Peru Holdings S.A.
Chile
Scotiabank Chile (“Scotiabank Chile”) is a special stock corporation governed by the provisions of the General Banking Act and by the provisions
applicable to listed corporations contained in the Corporations Act. It is supervised by the Financial Markets Commission (CMF), which is an
autonomous institution related to the Chilean Government through the Ministry of Finance. Scotiabank Chile is also governed by the Central Bank of
Chile and the National Consumer Service (Sernac), the latter being responsible for, among other functions, consumer protection with regards to financial
services, in accordance with the provisions of the Financial Consumer Protection Act. Scotiabank Chile’s subsidiaries are supervised by the CMF,
according to their respective business lines.
Colombia
Scotiabank Colpatria S.A., a subsidiary of the Bank, is a bank incorporated in compliance with the regulations of the Financial Superintendence of
Colombia (Superintendencia Financiera de Colombia or “SFC”). The SFC is the supervisor of the national banking, insurance, pension funds, and
securities markets under Colombian laws, with the purpose of assuring their stability, efficiency and transparency, as well as maintaining and fostering a
sound and balanced development of the financial system as a whole, while protecting the interests of the public in Colombia. The SFC is responsible for
inspecting, supervising and controlling Scotiabank Colpatria S.A. Additionally, the SFC promotes, organizes and develops regulations in order to
ensure the protection of investors, depositors, shareholders and stakeholders. The SFC is also responsible for financial customer protection.
- 7 -

United Kingdom
In respect of its London Branch, the Bank is authorized in the United Kingdom by the Prudential Regulation Authority (“PRA”) and subject to
regulation by the Financial Conduct Authority (“FCA”) and limited regulation by the PRA. Scotiabank Europe plc, a wholly owned subsidiary of the
Bank in the United Kingdom, is authorized by the PRA and regulated by the FCA and the PRA. Scotiabank Europe plc’s prudential supervisor is the
PRA and its conduct supervisor is the FCA.
Other Jurisdictions
Outside of the U.S., Mexico, Peru, Chile, Colombia and the United Kingdom, each of the Bank’s branches, agencies and subsidiaries, many of which
are banks in their own right, is also subject to the regulatory requirements of the jurisdiction in which it conducts its business.
Certain regulatory developments facing the Bank are described on pages 113 to 115 inclusive of the MD&A and those pages are incorporated herein by
reference.
Environmental, Social and Governance Strategies
Each year the Bank publishes its Sustainable Business (“SBR”) Report, which provides details of the Bank’s SBR framework and progress on social,
environmental and governance policies and strategies. This document and additional information can be found in the Corporate Responsibility section of
the Bank’s website at https://www.scotiabank.com/corporate/en/home/corporate-responsibility.html.
Risk Factors
The risks faced by the Bank are described on pages 69 to 106 inclusive of the MD&A and those pages are incorporated herein by reference.
DIVIDENDS
Restrictions on Dividend Payments
Under the Bank Act, the Bank is prohibited from declaring any dividends on its common shares or preferred shares when the Bank is, or would be
placed by such a declaration, in contravention of the capital adequacy, liquidity or any other regulatory directives issued under the Bank Act. In
addition, common share dividends cannot be paid unless all dividends to which preferred shareholders are then entitled have been paid or sufficient
funds have been set aside to do so. In fiscal 2019, the Bank paid all of the applicable non-cumulative preferred share dividends. The Bank’s preferred
shares are entitled to preference over the common shares and over any other shares of the Bank ranking junior to the preferred shares with respect to the
payment of dividends.
In the event that applicable cash distributions on any of the Scotiabank Trust Securities (meaning securities issued by Scotiabank Capital Trust) are not
paid on a regular distribution date, the Bank has undertaken not to declare dividends of any kind on its preferred shares or common shares. Similarly,
should the Bank fail to declare regular dividends on any of its directly issued and outstanding preferred shares or, if no preferred shares are outstanding,
its common shares, cash distributions will also not be made on any of the Scotiabank Trust Securities.
In the event that distributions on the Subordinated Capital Notes (defined below) are not paid in full, the Bank has undertaken not to declare dividends
on its common or preferred shares or redeem, purchase or otherwise retire such shares until the month commencing after such distributions have been
made in full.
Currently, the limitations above do not restrict the payment of dividends on preferred shares or common shares.
- 8 -

Dividend Payments
In fiscal 2019, the Bank’s actual common share dividend payout ratio was 51.9%, compared to 47.7% in 2018. The Bank has declared and paid the
following dividends on its common shares and preferred shares over the past three completed financial years:
2019 2018 2017
Common Shares $3.490000 $3.280000 $3.050000
Series 16 — — $0.328125
Series 17 — — $0.700000
Series 18 — $0.418750 $0.837500
Series 19 — $0.374547 $0.642626
Series 20 — $0.902500 $0.902500
Series 21 — $0.691967 $0.554501
Series 22 $0.239375 $0.957500 $0.957500
Series 23 $0.215885 $0.736967 $0.600126
Series 30 $0.455000 $0.455000 $0.455000
Series 31 $0.657072 $0.516968 $0.380126
Series 32 $0.515752 $0.515752 $0.515752
Series 33 $0.742073 $0.601968 $0.465159
Series 34 $1.375000 $1.375000 $1.375000
Series 36 $1.375000 $1.375000 $1.375000
Series 38 $1.212500 $1.212500 $1.351175
Series 40 $1.271475 — —
DESCRIPTION OF THE BANK’S CAPITAL STRUCTURE
The following summary of the Bank’s share capital is qualified in its entirety by the Bank’s by-laws and the actual terms and conditions of such
securities. For more details on the Bank’s capital structure, see pages 53 to 59 of the MD&A and notes 21 and 24 of the consolidated financial
statements for the year ended October 31, 2019. The Bank incorporates those pages and notes by reference.
Common Shares
The authorized common share capital of the Bank consists of an unlimited number of common shares, without nominal or par value, of which
1,216,132,250 common shares were issued and outstanding as at October 31, 2019.
Holders of the Bank’s common shares are entitled to vote at all meetings of the shareholders of the Bank except meetings at which only the holders of
preferred shares of the Bank are entitled to vote. Common shareholders are entitled to receive dividends, as and when declared on the common shares.
After the payment to the holders of the preferred shares of the amount or amounts to which they may be entitled, the holders of the Bank’s common
shares shall be entitled to receive the remaining property of the Bank upon liquidation, dissolution or winding-up thereof.
On January 27, 2017, the Bank redeemed all of its issued and outstanding Preferred Shares, Series 16
On April 26, 2017, the Bank redeemed all of its issued and outstanding Preferred Shares, Series 17
On April 26, 2018, the Bank redeemed all of its issued and outstanding Preferred Series 18 and 19.
On October 26, 2018, the Bank redeemed all of its issued and outstanding Preferred Shares, Series 20 and Series 21.
On January 28, 2019, the Bank redeemed all of its issued and outstanding Preferred Shares, Series 22 and Series 23.
On April 26, 2015, 4,457,262 shares of Preferred Shares, Series 30 were converted to Preferred Shares, Series 31.
On February 2, 2016, 5,184,345 shares of Preferred Shares, Series 32 were converted to Preferred Shares, Series 33.
On December 17, 2015, 14,000,000 Preferred Shares, Series 34 were issued.
On March 14, 2016, 20,000,000 Preferred Shares, Series 36 were issued.
On September 16, 2016, 20,000,000 Preferred Shares, Series 38 were issued.
On October 12, 2018, 12,000,000 Preferred Shares, Series 40 were issued.
- 9 -
1
2
3
3
4
4
5
5
6
6
7
7
8
9
10
11
1
2
3\
4
5
6
7
8
9
10
11
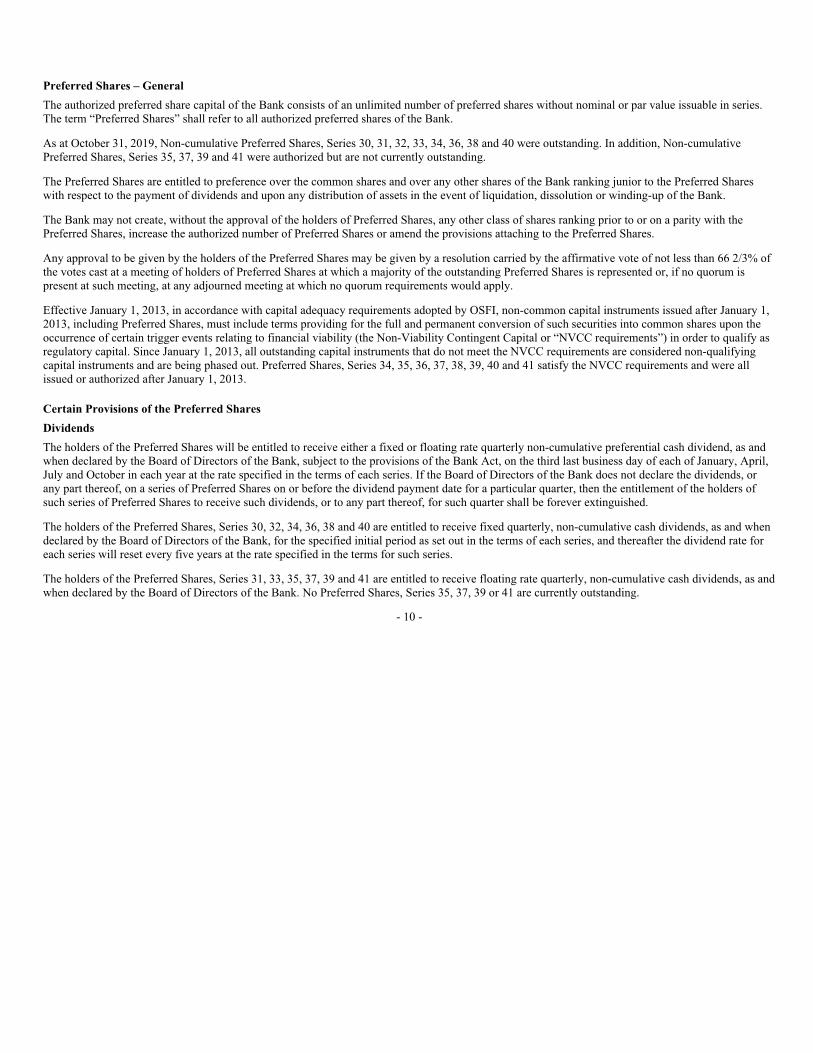
Preferred Shares – General
The authorized preferred share capital of the Bank consists of an unlimited number of preferred shares without nominal or par value issuable in series.
The term “Preferred Shares” shall refer to all authorized preferred shares of the Bank.
As at October 31, 2019, Non-cumulative Preferred Shares, Series 30, 31, 32, 33, 34, 36, 38 and 40 were outstanding. In addition, Non-cumulative
Preferred Shares, Series 35, 37, 39 and 41 were authorized but are not currently outstanding.
The Preferred Shares are entitled to preference over the common shares and over any other shares of the Bank ranking junior to the Preferred Shares
with respect to the payment of dividends and upon any distribution of assets in the event of liquidation, dissolution or winding-up of the Bank.
The Bank may not create, without the approval of the holders of Preferred Shares, any other class of shares ranking prior to or on a parity with the
Preferred Shares, increase the authorized number of Preferred Shares or amend the provisions attaching to the Preferred Shares.
Any approval to be given by the holders of the Preferred Shares may be given by a resolution carried by the affirmative vote of not less than 66 2/3% of
the votes cast at a meeting of holders of Preferred Shares at which a majority of the outstanding Preferred Shares is represented or, if no quorum is
present at such meeting, at any adjourned meeting at which no quorum requirements would apply.
Effective January 1, 2013, in accordance with capital adequacy requirements adopted by OSFI, non-common capital instruments issued after January 1,
2013, including Preferred Shares, must include terms providing for the full and permanent conversion of such securities into common shares upon the
occurrence of certain trigger events relating to financial viability (the Non-Viability Contingent Capital or “NVCC requirements”) in order to qualify as
regulatory capital. Since January 1, 2013, all outstanding capital instruments that do not meet the NVCC requirements are considered non-qualifying
capital instruments and are being phased out. Preferred Shares, Series 34, 35, 36, 37, 38, 39, 40 and 41 satisfy the NVCC requirements and were all
issued or authorized after January 1, 2013.
Certain Provisions of the Preferred Shares
Dividends
The holders of the Preferred Shares will be entitled to receive either a fixed or floating rate quarterly non-cumulative preferential cash dividend, as and
when declared by the Board of Directors of the Bank, subject to the provisions of the Bank Act, on the third last business day of each of January, April,
July and October in each year at the rate specified in the terms of each series. If the Board of Directors of the Bank does not declare the dividends, or
any part thereof, on a series of Preferred Shares on or before the dividend payment date for a particular quarter, then the entitlement of the holders of
such series of Preferred Shares to receive such dividends, or to any part thereof, for such quarter shall be forever extinguished.
The holders of the Preferred Shares, Series 30, 32, 34, 36, 38 and 40 are entitled to receive fixed quarterly, non-cumulative cash dividends, as and when
declared by the Board of Directors of the Bank, for the specified initial period as set out in the terms of each series, and thereafter the dividend rate for
each series will reset every five years at the rate specified in the terms for such series.
The holders of the Preferred Shares, Series 31, 33, 35, 37, 39 and 41 are entitled to receive floating rate quarterly, non-cumulative cash dividends, as and
when declared by the Board of Directors of the Bank. No Preferred Shares, Series 35, 37, 39 or 41 are currently outstanding.
- 10 -

Redemption
The Preferred Shares currently outstanding will not be redeemable prior to the date specified in the terms for each series. On and after such dates for the
Preferred Shares specified in the foregoing sentence and for all other series of Preferred Shares issued and outstanding as at October 31, 2019, subject to
the provisions of the Bank Act and to the prior consent of the Superintendent and to certain conditions being met, the Bank may redeem at the time
specified in the terms of each series all or any part of an outstanding series of Preferred Shares at the Bank’s option without the consent of the holder, by
the payment of an amount in cash for each such share so redeemed as specified in the terms of each series.
Notice of any redemption of any series of Preferred Shares will be given by the Bank at least 30 days and not more than 60 days prior to the date fixed
for redemption. If less than all the outstanding Preferred Shares in any series are at any time to be redeemed, the shares to be redeemed will be redeemed
pro rata, disregarding fractions.
Rights Upon Dissolution or Winding-Up
In the event of the liquidation, dissolution or winding-up of the Bank, the holders of each series of the Preferred Shares shall be entitled to receive
$25.00 per Preferred Share, together with all dividends declared and unpaid to the date of payment before any amount shall be paid or any assets of the
Bank distributed to the holders of any shares ranking junior to the Preferred Shares. The holders of each series of the Preferred Shares shall not be
entitled to share in any further distribution of the assets of the Bank.
Restrictions on Dividends and Retirement of Shares
So long as any shares of a series of Preferred Shares are outstanding, the Bank will not, without the approval of the holders of the relevant series of
Preferred Shares:
(a) declare, pay or set apart for payment any dividends on the common shares of the Bank or any other shares ranking junior to the series of
Preferred Shares (other than stock dividends payable in shares ranking junior to the series of Preferred Shares);
(b) redeem, purchase or otherwise retire any common shares or any other shares ranking junior to the series of Preferred Shares (except out of
the net cash proceeds of a substantially concurrent issue of shares ranking junior to the series of Preferred Shares);
(c) redeem, purchase or otherwise retire less than all of the series of Preferred Shares; or
(d) except pursuant to any purchase obligation, sinking fund, retraction privilege or mandatory redemption provisions attaching to any series
of Preferred Shares of the Bank, redeem, purchase or otherwise retire any other shares ranking on a parity with the series of Preferred
Shares;
unless, in each case, all dividends up to and including those payable on the dividend payment date for the last completed period for which dividends
shall be payable shall have been declared and paid or set apart for payment in respect of each series of cumulative preferred shares of the Bank then
issued and outstanding and on all other cumulative shares ranking on a parity with the preferred shares of the Bank and there shall have been paid or set
apart for payment all declared dividends in respect of each series of non-cumulative preferred shares of the Bank (including the series of Preferred
Shares) then issued and outstanding and on all other non-cumulative shares ranking on a parity with the Preferred Shares of the Bank.
Purchase for Cancellation
Subject to the provisions of the Bank Act, the prior consent of the Superintendent and certain conditions being met, the Bank may at any time purchase
for cancellation any series of Preferred Shares outstanding, in the open market at the lowest price or prices at which in the opinion of the Board of
Directors of the Bank such shares are obtainable.
- 11 -

Issuance of Other Series of Preferred Shares
The Bank may issue other series of preferred shares ranking on parity with the Preferred Shares without the authorization of the holders of the Preferred
Shares.
Voting Rights
Subject to the provisions of the Bank Act, the holders of a series of Preferred Shares as such will not be entitled to receive notice of, attend, or vote at,
any meeting of the shareholders of the Bank unless and until the first time at which the Board of Directors of the Bank has not declared the whole
dividend on such series of Preferred Shares in respect of any quarter. In that event, the holders of such Preferred Shares will be entitled to receive notice
of, and to attend, meetings of shareholders at which directors of the Bank are to be elected and will be entitled to one vote for each Preferred Share held.
The voting rights of the holders of such series of Preferred Shares shall forthwith cease upon payment by the Bank of the first dividend on the series of
Preferred Shares to which the holders are entitled subsequent to the time such voting rights first arose until such time as the Bank may again fail to
declare the whole dividend on such series of Preferred Shares in any quarter, in which event such voting rights shall become effective again and so on
from time to time.
Other Equity Instruments – Subordinated Capital Notes – General
The Bank currently has outstanding US$1.25 billion 4.650% Fixed to Floating Rate Non-Cumulative Subordinated Additional Tier 1 Capital Notes
(NVCC) (“Subordinated Capital Notes”). The Subordinated Capital Notes have been determined to be compound instruments that have both equity and
liability features. For more details, see note 24 of the consolidated financial statements for the year ended October 31, 2019.
The Subordinated Capital Notes are direct unsecured obligations of the Bank and, in the event of the Bank’s insolvency or winding-up, will rank
subordinate to all of the Bank’s subordinated indebtedness and in right of payment equally with and not prior to indebtedness that ranks equally in right
of payment with, or is subordinated to, the Subordinated Capital Notes (other than indebtedness which by its terms ranks subordinate to the
Subordinated Capital Notes. The Subordinated Capital Notes will constitute subordinated indebtedness for the purposes of the Bank Act. In the event of
the Bank’s insolvency or winding-up, the Subordinated Capital Notes will rank ahead of the Bank’s common shares and Preferred Shares.
The Subordinated Capital Notes includes terms providing for the full and permanent conversion of such securities into common shares of the Bank upon
the occurrence of certain trigger events relating to NVCC requirements in order to qualify as regulatory capital.
Certain Provisions of the Subordinated Capital Notes
Distributions and Restrictions on Dividend and Retirement of Shares
Interest on the Subordinated Capital Notes is paid semi-annually in arrears for the initial five years. Thereafter, the interest will reset quarterly and
accrue at a floating rate. While interest is payable on a semi-annual basis for the initial five year period, and quarterly thereafter, the Bank may, at its
discretion, with prior notice, cancel the payments. If the Bank does not pay the interest in full to the note holders, the Bank will not declare dividends on
its common shares or Preferred Shares or redeem or otherwise retire such share until the month commencing after the Bank resumes full interest
payments on the Subordinated Capital Notes.
Interest will be due and payable on an interest payment date only if it is not cancelled by the Bank. Any cancelled interest payments will not be
cumulative. The Bank has the sole and absolute discretion at all times and for any reason to cancel (in whole or in part), with notice to the holders of the
Notes, any interest payment that would otherwise be payable on any interest payment date. As a result, the holder may not receive any interest on any
interest payment date or at any other times, and the holder will have no claims whatsoever in respect of that cancelled interest.
- 12 -

Maturity and Redemption
The Subordinated Capital Notes have no scheduled maturity or redemption date. Accordingly, the Bank is not required to make any repayment of the
principal amount of the Subordinated Capital Notes except in the event of bankruptcy or insolvency and provided that the NVCC requirements have not
been triggered. The Subordinated Capital Notes are redeemable at par five years after issuance solely at the option of the Bank, or following certain
regulatory or tax events, in accordance with their terms. All redemptions are subject to regulatory consent.
Purchase for Cancellation
Subject to regulatory consent, the Bank may at any time and from time to time, repurchase for cancellation any Subordinated Capital Notes in the open
market, by tender or by private agreement, in any manner and at any price or at differing prices.
Events of Default
An event of default in respect of the Subordinated Capital Notes will occur only if the Bank becomes bankrupt or insolvent or becomes subject to the
provisions of the Winding-up and Restructuring Act (Canada), consents to the institution of bankruptcy or insolvency proceedings against it, resolves to
wind-up, liquidate or dissolve, is ordered wound-up or otherwise acknowledges its insolvency. Neither a failure to make a payment on the Subordinated
Capital Notes when due (including any interest payment, whether as a result of cancellation or otherwise) nor an NVCC automatic conversion upon the
occurrence of a trigger event will constitute an event of default.
Issuance of other Senior or Pari Passu Securities
The terms governing the Subordinated Capital Notes do not limit the Bank’s ability to incur additional indebtedness or issue or repurchase securities,
other than the restriction on retirement of shares noted above. The Bank may incur additional indebtedness without the authorization of the holders of
the Subordinated Capital Notes.
Voting Rights
Holders of Subordinated Capital Notes are not entitled to any rights of holders of common shares, including any rights of shareholders to receive notice,
to attend or to vote at any meeting of the shareholders of the Bank. If the Subordinated Capital Notes are converted into common shares of the Bank
under NVCC requirements, holders of the Subordinated Capital Notes will become holders of the Bank’s common shares and will only have rights as
holders of common shares.
Constraints on Ownership of the Bank’s Shares
The Bank Act contains restrictions on the issue, transfer, acquisition, beneficial ownership and voting of all shares of a chartered bank. Please refer to
the section above entitled “Description of the Bank’s Business – General Summary – Supervision and Regulation in Canada” for a summary of these
restrictions.
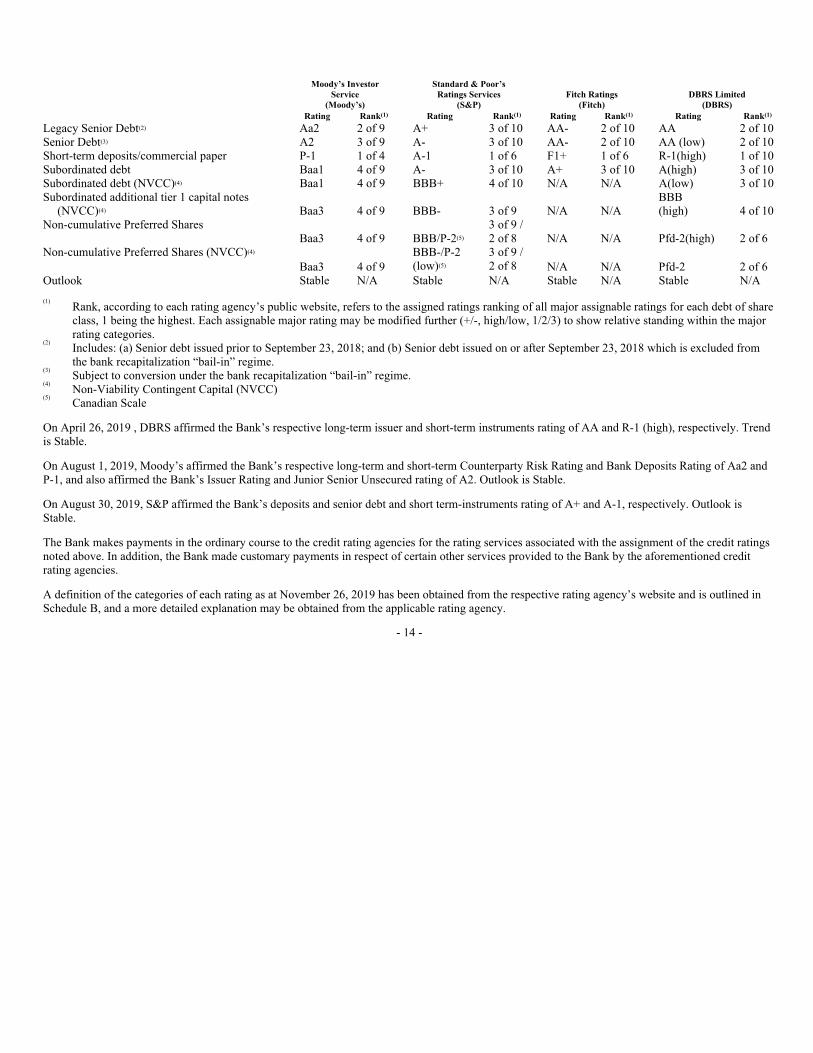
Credit Ratings of Securities and Liquidity
Credit ratings affect the Bank’s access to capital markets and borrowing costs, as well as the terms on which the Bank can conduct derivative and
hedging transactions. The following ratings have been assigned to the Bank’s securities by the rating agencies noted below, which are independent third
parties. Credit ratings, including stability or provisional ratings, are not recommendations to purchase, sell or hold a security as they do not comment on
market price or suitability for a particular investor. Ratings may not reflect the potential impact of all risks on the value of securities. In addition, real or
anticipated changes in the rating assigned to a security will generally affect the market value of that security. Ratings are subject to revision or
withdrawal at any time by the rating agency. Each rating listed in the chart below should be evaluated independently of any other rating applicable to the
Bank’s debt, Subordinated Additional Tier 1 Capital Notes and Preferred Shares.
- 13 -
Moody’s Investor
Service
(Moody’s)
Standard & Poor’s
Ratings Services
(S&P)
Fitch Ratings
(Fitch)
DBRS Limited
(DBRS)
Rating Rank Rating Rank Rating Rank Rating Rank
Legacy Senior Debt Aa2 2 of 9 A+ 3 of 10 AA- 2 of 10 AA 2 of 10
Senior Debt A2 3 of 9 A- 3 of 10 AA- 2 of 10 AA (low) 2 of 10
Short-term deposits/commercial paper P-1 1 of 4 A-1 1 of 6 F1+ 1 of 6 R-1(high) 1 of 10
Subordinated debt Baa1 4 of 9 A- 3 of 10 A+ 3 of 10 A(high) 3 of 10
Subordinated debt (NVCC) Baa1 4 of 9 BBB+ 4 of 10 N/A N/A A(low) 3 of 10
Subordinated additional tier 1 capital notes
(NVCC) Baa3 4 of 9 BBB- 3 of 9 N/A N/A
BBB
(high) 4 of 10
Non-cumulative Preferred Shares
Baa3 4 of 9 BBB/P-2
3 of 9 /
2 of 8 N/A N/A Pfd-2(high) 2 of 6
Non-cumulative Preferred Shares (NVCC)
Baa3 4 of 9
BBB-/P-2
(low)
3 of 9 /
2 of 8 N/A N/A Pfd-2 2 of 6
Outlook Stable N/A Stable N/A Stable N/A Stable N/A
Rank, according to each rating agency’s public website, refers to the assigned ratings ranking of all major assignable ratings for each debt of share
class, 1 being the highest. Each assignable major rating may be modified further (+/-, high/low, 1/2/3) to show relative standing within the major
rating categories.
Includes: (a) Senior debt issued prior to September 23, 2018; and (b) Senior debt issued on or after September 23, 2018 which is excluded from
the bank recapitalization “bail-in” regime.
Subject to conversion under the bank recapitalization “bail-in” regime.
Non-Viability Contingent Capital (NVCC)
Canadian Scale
On April 26, 2019 , DBRS affirmed the Bank’s respective long-term issuer and short-term instruments rating of AA and R-1 (high), respectively. Trend
is Stable.
On August 1, 2019, Moody’s affirmed the Bank’s respective long-term and short-term Counterparty Risk Rating and Bank Deposits Rating of Aa2 and
P-1, and also affirmed the Bank’s Issuer Rating and Junior Senior Unsecured rating of A2. Outlook is Stable.
On August 30, 2019, S&P affirmed the Bank’s deposits and senior debt and short term-instruments rating of A+ and A-1, respectively. Outlook is
Stable.
The Bank makes payments in the ordinary course to the credit rating agencies for the rating services associated with the assignment of the credit ratings
noted above. In addition, the Bank made customary payments in respect of certain other services provided to the Bank by the aforementioned credit
rating agencies.
A definition of the categories of each rating as at November 26, 2019 has been obtained from the respective rating agency’s website and is outlined in
Schedule B, and a more detailed explanation may be obtained from the applicable rating agency.
- 14 -
(1) (1) (1) (1)
(2)
(3)
(4)
(4)
(5)
(4)
(5)
(1)
(2)
(3)
(4)
(5)
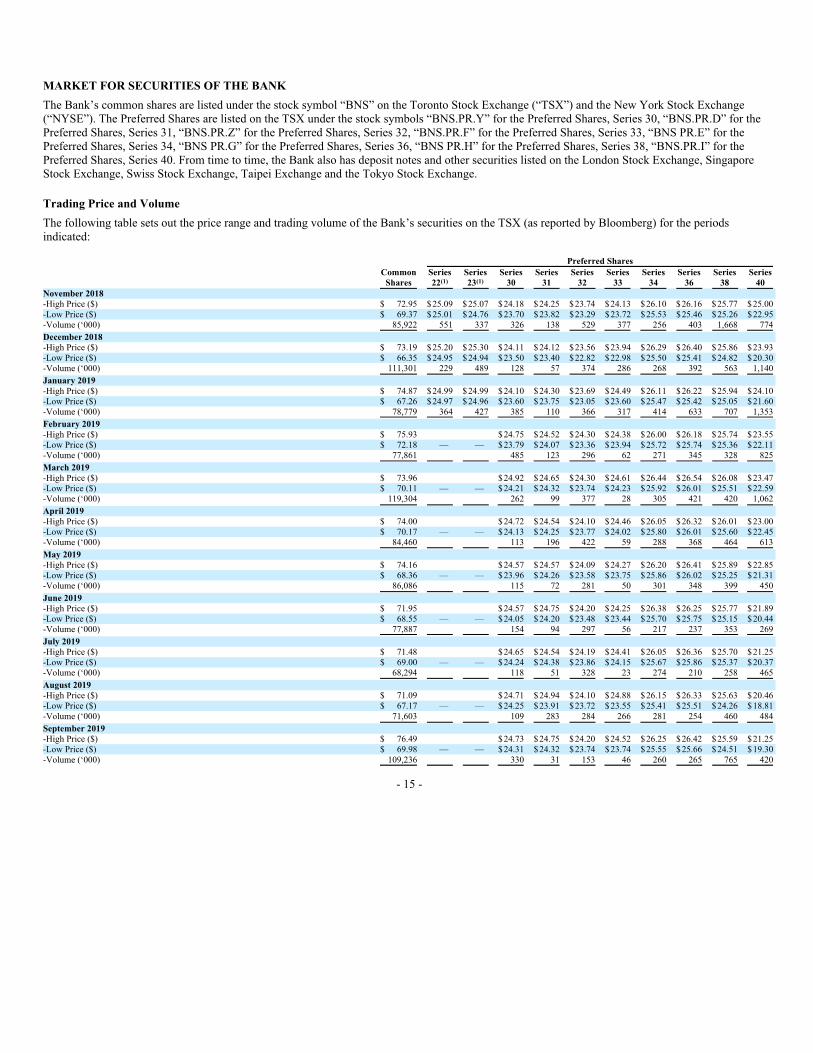
MARKET FOR SECURITIES OF THE BANK
The Bank’s common shares are listed under the stock symbol “BNS” on the Toronto Stock Exchange (“TSX”) and the New York Stock Exchange
(“NYSE”). The Preferred Shares are listed on the TSX under the stock symbols “BNS.PR.Y” for the Preferred Shares, Series 30, “BNS.PR.D” for the
Preferred Shares, Series 31, “BNS.PR.Z” for the Preferred Shares, Series 32, “BNS.PR.F” for the Preferred Shares, Series 33, “BNS PR.E” for the
Preferred Shares, Series 34, “BNS PR.G” for the Preferred Shares, Series 36, “BNS PR.H” for the Preferred Shares, Series 38, “BNS.PR.I” for the
Preferred Shares, Series 40. From time to time, the Bank also has deposit notes and other securities listed on the London Stock Exchange, Singapore
Stock Exchange, Swiss Stock Exchange, Taipei Exchange and the Tokyo Stock Exchange.
Trading Price and Volume
The following table sets out the price range and trading volume of the Bank’s securities on the TSX (as reported by Bloomberg) for the periods
indicated:
Common
Shares
Preferred Shares
Series
22
Series
23
Series
30
Series
31
Series
32
Series
33
Series
34
Series
36
Series
38
Series
40
November 2018
-High Price ($) $ 72.95 $25.09 $25.07 $24.18 $24.25 $23.74 $24.13 $26.10 $26.16 $25.77 $25.00
-Low Price ($) $ 69.37 $25.01 $24.76 $23.70 $23.82 $23.29 $23.72 $25.53 $25.46 $25.26 $22.95
-Volume (‘000) 85,922 551 337 326 138 529 377 256 403 1,668 774
December 2018
-High Price ($) $ 73.19 $25.20 $25.30 $24.11 $24.12 $23.56 $23.94 $26.29 $26.40 $25.86 $23.93
-Low Price ($) $ 66.35 $24.95 $24.94 $23.50 $23.40 $22.82 $22.98 $25.50 $25.41 $24.82 $20.30
-Volume (‘000) 111,301 229 489 128 57 374 286 268 392 563 1,140
January 2019
-High Price ($) $ 74.87 $24.99 $24.99 $24.10 $24.30 $23.69 $24.49 $26.11 $26.22 $25.94 $24.10
-Low Price ($) $ 67.26 $24.97 $24.96 $23.60 $23.75 $23.05 $23.60 $25.47 $25.42 $25.05 $21.60
-Volume (‘000) 78,779 364 427 385 110 366 317 414 633 707 1,353
February 2019
-High Price ($) $ 75.93 $24.75 $24.52 $24.30 $24.38 $26.00 $26.18 $25.74 $23.55
-Low Price ($) $ 72.18 — — $23.79 $24.07 $23.36 $23.94 $25.72 $25.74 $25.36 $22.11
-Volume (‘000) 77,861 485 123 296 62 271 345 328 825
March 2019
-High Price ($) $ 73.96 $24.92 $24.65 $24.30 $24.61 $26.44 $26.54 $26.08 $23.47
-Low Price ($) $ 70.11 — — $24.21 $24.32 $23.74 $24.23 $25.92 $26.01 $25.51 $22.59
-Volume (‘000) 119,304 262 99 377 28 305 421 420 1,062
April 2019
-High Price ($) $ 74.00 $24.72 $24.54 $24.10 $24.46 $26.05 $26.32 $26.01 $23.00
-Low Price ($) $ 70.17 — — $24.13 $24.25 $23.77 $24.02 $25.80 $26.01 $25.60 $22.45
-Volume (‘000) 84,460 113 196 422 59 288 368 464 613
May 2019
-High Price ($) $ 74.16 $24.57 $24.57 $24.09 $24.27 $26.20 $26.41 $25.89 $22.85
-Low Price ($) $ 68.36 — — $23.96 $24.26 $23.58 $23.75 $25.86 $26.02 $25.25 $21.31
-Volume (‘000) 86,086 115 72 281 50 301 348 399 450
June 2019
-High Price ($) $ 71.95 $24.57 $24.75 $24.20 $24.25 $26.38 $26.25 $25.77 $21.89
-Low Price ($) $ 68.55 — — $24.05 $24.20 $23.48 $23.44 $25.70 $25.75 $25.15 $20.44
-Volume (‘000) 77,887 154 94 297 56 217 237 353 269
July 2019
-High Price ($) $ 71.48 $24.65 $24.54 $24.19 $24.41 $26.05 $26.36 $25.70 $21.25
-Low Price ($) $ 69.00 — — $24.24 $24.38 $23.86 $24.15 $25.67 $25.86 $25.37 $20.37
-Volume (‘000) 68,294 118 51 328 23 274 210 258 465
August 2019
-High Price ($) $ 71.09 $24.71 $24.94 $24.10 $24.88 $26.15 $26.33 $25.63 $20.46
-Low Price ($) $ 67.17 — — $24.25 $23.91 $23.72 $23.55 $25.41 $25.51 $24.26 $18.81
-Volume (‘000) 71,603 109 283 284 266 281 254 460 484
September 2019
-High Price ($) $ 76.49 $24.73 $24.75 $24.20 $24.52 $26.25 $26.42 $25.59 $21.25
-Low Price ($) $ 69.98 — — $24.31 $24.32 $23.74 $23.74 $25.55 $25.66 $24.51 $19.30
-Volume (‘000) 109,236 330 31 153 46 260 265 765 420
- 15 -
(1) (1)

Common
Shares
Preferred Shares
Series
22
Series
23
Series
30
Series
31
Series
32
Series
33
Series
34
Series
36
Series
38
Series
40
October 2019
-High Price ($) $ 76.18 $24.68 $24.84 $24.16 $24.07 $25.74 $25.81 $25.40 $20.78
-Low Price ($) $ 73.11 — — $24.47 $24.41 $23.89 $23.72 $25.47 $25.47 $25.06 $19.94
-Volume (‘000) 45,977 62 207 110 19 119 126 227 165
(1) Redeemed on January 28, 2019.
(2) As at October 15, 2019.
Prior Sales
From time to time, the Bank issues principal at risk notes, which are securities issued by the Bank for which the amount payable at maturity is
determined by reference to the price, value or level of an underlying interest, including an index, exchange traded fund or a notional basket of equities or
other securities. For information about the Bank’s issuance of subordinated indebtedness and other equity instruments since October 31, 2018, see notes
21 and 24 to the Bank’s consolidated financial statements for the year ended October 31, 2019, which is incorporated herein by reference.
DIRECTORS AND EXECUTIVE OFFICERS OF THE BANK
Directors and Board Committees of the Bank
The following table sets out the Bank’s directors as of November 26, 2019. The term of office of each director expires at the close of the Bank’s next
annual meeting of shareholders. Information concerning the nominees proposed by management for election as directors at the annual meeting of
shareholders will be contained in the Bank’s 2020 Management Proxy Circular.
Name and Place of Residence
Board Committee
Memberships Principal Occupation
Nora A. Aufreiter
Toronto, Ontario, Canada
(Director since August 25, 2014)
CGC – Chair
HRC
Corporate Director and a former Senior Partner of
McKinsey & Company, an international consulting firm
Guillermo E. Babatz
Mexico City, Mexico
(Director since January 28, 2014)
HRC
RC
Managing Partner of Atik Capital, S.C., an advisory firm that
specializes in structuring financial solutions for its clients
Scott B. Bonham
Atherton, California, U.S.A.
(Director since January 25, 2016)
ACRC
CGC
Corporate Director and co-founder of Intentional Capital, a
privately-held real estate asset management company
Charles H. Dallara, Ph.D.
Oak Hill, Virginia, U.S.A.
(Director since September 23, 2013)
ACRC
RC
Advisory Partner of Partners Group and Chairman of Partners
Group Board of Directors, USA, a private market investment
and asset management group
Tiff Macklem, Ph.D.
Toronto, Ontario, Canada
(Director since June 22, 2015)
ACRC
RC – Chair
Dean of the Rotman School of Management at the University
of Toronto
Michael D. Penner
Westmount, Quebec, Canada
(Director since June 26, 2017)
ACRC
CGC
Corporate Director
Brian J. Porter
Toronto, Ontario, Canada
(Director since April 9, 2013)
None President and Chief Executive Officer of the Bank
Una M. Power
Vancouver, British Columbia, Canada
(Director since April 12, 2016)
ACRC – Chair
HRC
Corporate Director
- 16 -
(1) (1)
(2)
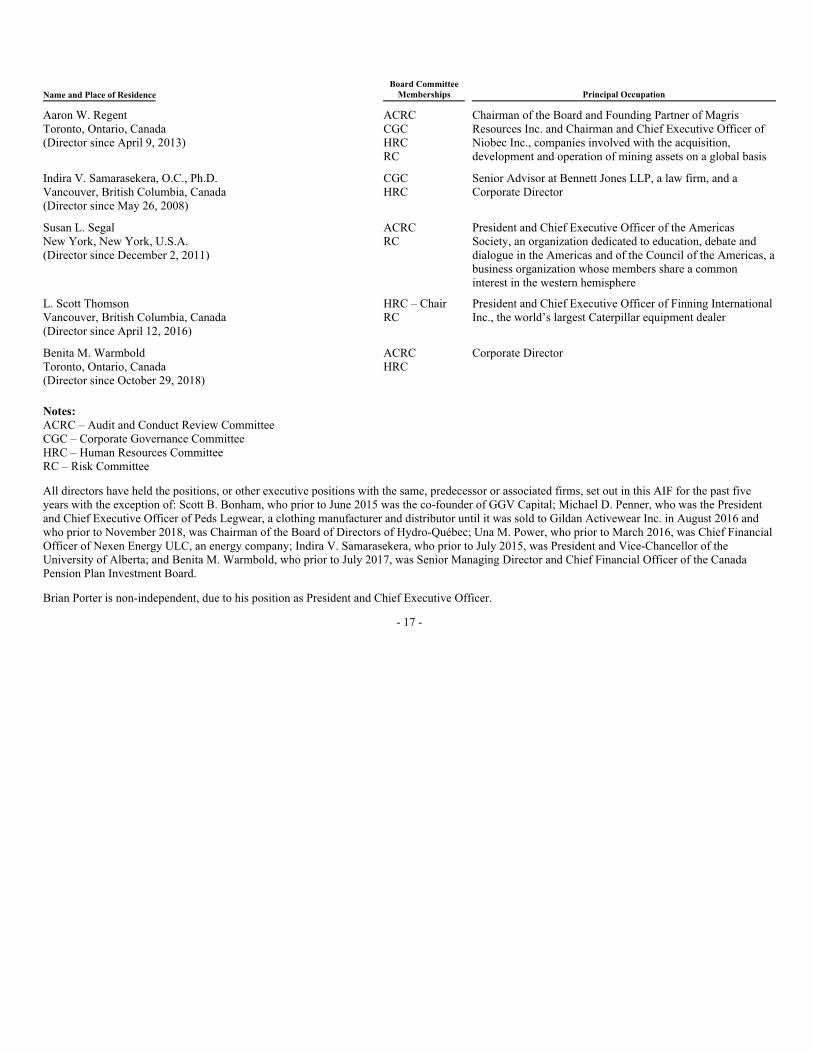
Name and Place of Residence
Board Committee
Memberships Principal Occupation
Aaron W. Regent
Toronto, Ontario, Canada
(Director since April 9, 2013)
ACRC
CGC
HRC
RC
Chairman of the Board and Founding Partner of Magris
Resources Inc. and Chairman and Chief Executive Officer of
Niobec Inc., companies involved with the acquisition,
development and operation of mining assets on a global basis
Indira V. Samarasekera, O.C., Ph.D.
Vancouver, British Columbia, Canada
(Director since May 26, 2008)
CGC
HRC
Senior Advisor at Bennett Jones LLP, a law firm, and a
Corporate Director
Susan L. Segal
New York, New York, U.S.A.
(Director since December 2, 2011)
ACRC
RC
President and Chief Executive Officer of the Americas
Society, an organization dedicated to education, debate and
dialogue in the Americas and of the Council of the Americas, a
business organization whose members share a common
interest in the western hemisphere
L. Scott Thomson
Vancouver, British Columbia, Canada
(Director since April 12, 2016)
HRC – Chair
RC
President and Chief Executive Officer of Finning International
Inc., the world’s largest Caterpillar equipment dealer
Benita M. Warmbold
Toronto, Ontario, Canada
(Director since October 29, 2018)
ACRC
HRC
Corporate Director
Notes:
ACRC – Audit and Conduct Review Committee
CGC – Corporate Governance Committee
HRC – Human Resources Committee
RC – Risk Committee
All directors have held the positions, or other executive positions with the same, predecessor or associated firms, set out in this AIF for the past five
years with the exception of: Scott B. Bonham, who prior to June 2015 was the co-founder of GGV Capital; Michael D. Penner, who was the President
and Chief Executive Officer of Peds Legwear, a clothing manufacturer and distributor until it was sold to Gildan Activewear Inc. in August 2016 and
who prior to November 2018, was Chairman of the Board of Directors of Hydro-Québec; Una M. Power, who prior to March 2016, was Chief Financial
Officer of Nexen Energy ULC, an energy company; Indira V. Samarasekera, who prior to July 2015, was President and Vice-Chancellor of the
University of Alberta; and Benita M. Warmbold, who prior to July 2017, was Senior Managing Director and Chief Financial Officer of the Canada
Pension Plan Investment Board.
Brian Porter is non-independent, due to his position as President and Chief Executive Officer.
- 17 -

Executive Officers of the Bank
The following are the Bank’s executive officers, their titles and places of residence in Canada (except as otherwise noted) as of November 26, 2019:
Name and Principal Occupation Place of Residence
Brian J. Porter
President and Chief Executive Officer
Toronto, Ontario
Rajagopal Viswanathan
Executive Vice President and Chief Financial Officer
Oakville, Ontario
Ignacio “Nacho” Deschamps
Group Head, International Banking and Digital Transformation
Toronto, Ontario
Jake Lawrence
Co-Group Head, Global Banking and Markets, Head, Global Capital Markets
Toronto, Ontario
James Neate
Co-Group Head, Global Banking and Markets, Head, Global Corporate and Investment Banking
Mississauga, Ontario
Barbara F. Mason
Group Head and Chief Human Resources Officer
Toronto, Ontario
Daniel Moore
Group Head and Chief Risk Officer
Toronto, Ontario
Dan Rees
Group Head, Canadian Banking
Toronto, Ontario
Michael Zerbs
Group Head and Chief Technology Officer
Markham, Ontario
Ian Arellano
Executive Vice President and General Counsel
Toronto, Ontario
Paul Baroni
Executive Vice President & Chief Auditor
Toronto, Ontario
Tracy Bryan
Executive Vice President, Global Operations
Whitby, Ontario
John Doig
Executive Vice President, Retail Distribution
Toronto, Ontario
Glen Gowland
Executive Vice President, Global Wealth Management
Toronto, Ontario
Michael Henry
Executive Vice-President, Enterprise Risk Governance
Mississauga, Ontario
Rania Llewellyn
Executive Vice President, Global Business Payments
Toronto, Ontario
Loretta Marcoccia
Executive Vice President & Chief Operating Officer, Global Banking and Markets
Toronto, Ontario
Tom McGuire
Executive Vice President and Group Treasurer
Toronto, Ontario
Gillian Riley
Executive Vice President, Tangerine
Toronto, Ontario
Shawn Rose
Executive Vice President and Chief Digital Officer
Toronto, Ontario
Adrián Otero Rosiles
Executive Vice President and Country Head, Mexico
Mexico City, Mexico
Francisco Sardon de Taboada
Executive Vice President and Country Head, Chile
Santiago, Chile
Anya Schnoor
Executive Vice-President, Retail Products
Toronto, Ontario
- 18 -
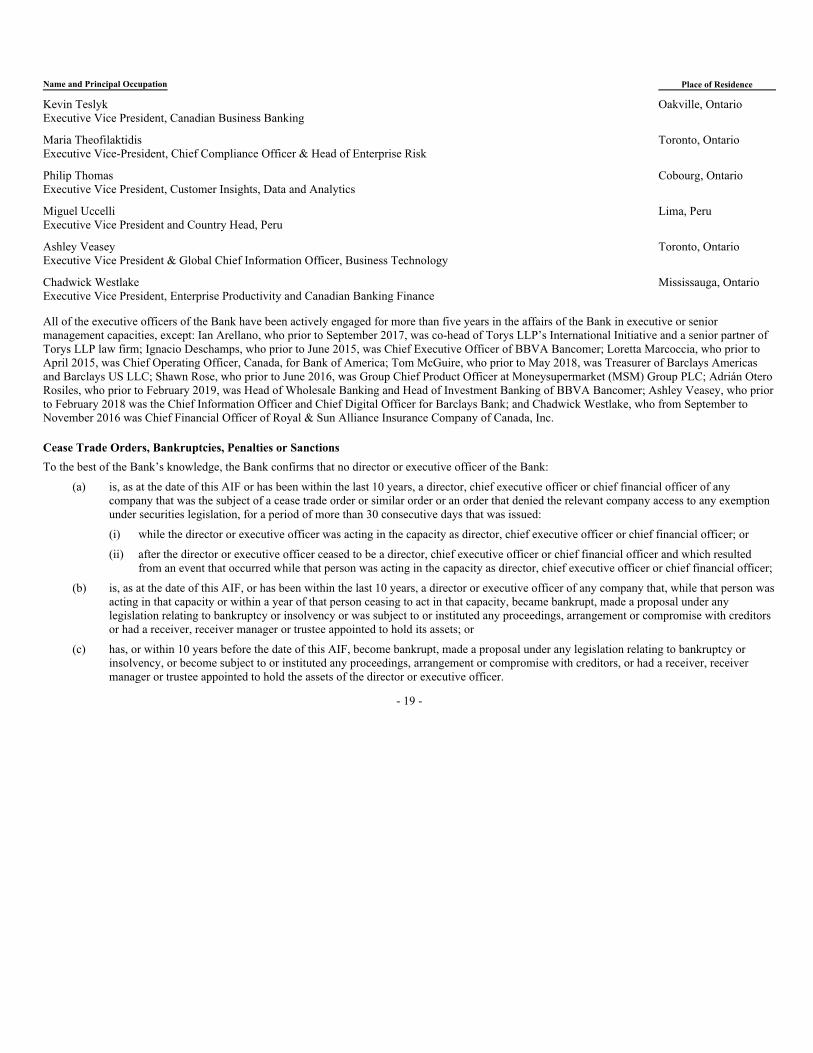
Name and Principal Occupation Place of Residence
Kevin Teslyk
Executive Vice President, Canadian Business Banking
Oakville, Ontario
Maria Theofilaktidis
Executive Vice-President, Chief Compliance Officer & Head of Enterprise Risk
Toronto, Ontario
Philip Thomas
Executive Vice President, Customer Insights, Data and Analytics
Cobourg, Ontario
Miguel Uccelli
Executive Vice President and Country Head, Peru
Lima, Peru
Ashley Veasey
Executive Vice President & Global Chief Information Officer, Business Technology
Toronto, Ontario
Chadwick Westlake
Executive Vice President, Enterprise Productivity and Canadian Banking Finance
Mississauga, Ontario
All of the executive officers of the Bank have been actively engaged for more than five years in the affairs of the Bank in executive or senior
management capacities, except: Ian Arellano, who prior to September 2017, was co-head of Torys LLP’s International Initiative and a senior partner of
Torys LLP law firm; Ignacio Deschamps, who prior to June 2015, was Chief Executive Officer of BBVA Bancomer; Loretta Marcoccia, who prior to
April 2015, was Chief Operating Officer, Canada, for Bank of America; Tom McGuire, who prior to May 2018, was Treasurer of Barclays Americas
and Barclays US LLC; Shawn Rose, who prior to June 2016, was Group Chief Product Officer at Moneysupermarket (MSM) Group PLC; Adrián Otero
Rosiles, who prior to February 2019, was Head of Wholesale Banking and Head of Investment Banking of BBVA Bancomer; Ashley Veasey, who prior
to February 2018 was the Chief Information Officer and Chief Digital Officer for Barclays Bank; and Chadwick Westlake, who from September to
November 2016 was Chief Financial Officer of Royal & Sun Alliance Insurance Company of Canada, Inc.
Cease Trade Orders, Bankruptcies, Penalties or Sanctions
To the best of the Bank’s knowledge, the Bank confirms that no director or executive officer of the Bank:
(a) is, as at the date of this AIF or has been within the last 10 years, a director, chief executive officer or chief financial officer of any
company that was the subject of a cease trade order or similar order or an order that denied the relevant company access to any exemption
under securities legislation, for a period of more than 30 consecutive days that was issued:
(i) while the director or executive officer was acting in the capacity as director, chief executive officer or chief financial officer; or
(ii) after the director or executive officer ceased to be a director, chief executive officer or chief financial officer and which resulted
from an event that occurred while that person was acting in the capacity as director, chief executive officer or chief financial officer;
(b) is, as at the date of this AIF, or has been within the last 10 years, a director or executive officer of any company that, while that person was
acting in that capacity or within a year of that person ceasing to act in that capacity, became bankrupt, made a proposal under any
legislation relating to bankruptcy or insolvency or was subject to or instituted any proceedings, arrangement or compromise with creditors
or had a receiver, receiver manager or trustee appointed to hold its assets; or
(c) has, or within 10 years before the date of this AIF, become bankrupt, made a proposal under any legislation relating to bankruptcy or
insolvency, or become subject to or instituted any proceedings, arrangement or compromise with creditors, or had a receiver, receiver
manager or trustee appointed to hold the assets of the director or executive officer.
- 19 -

To the best of the Bank’s knowledge, none of the directors or executive officers of the Bank have been subject to (a) any penalties or sanctions imposed
by a court relating to Canadian securities legislation or by a Canadian securities regulatory authority or have entered into a settlement agreement with a
Canadian securities regulatory authority; or (b) any other penalties or sanctions imposed by a court or a regulatory body that would likely be considered
important to a reasonable investor in making an investment decision.
Shareholdings of Management
To the knowledge of the Bank, the directors and executive officers of the Bank as a group own, or exercise control or direction over, less than one per
cent of the outstanding common shares of the Bank. The Bank’s directors or executive officers own, or exercise control or direction over, less than one
percent of the outstanding shares of any of the Bank’s subsidiaries.
LEGAL PROCEEDINGS AND REGULATORY ACTIONS
In the ordinary course of business, the Bank and its subsidiaries are routinely defendants in, or parties to a number of pending and threatened legal
actions and regulatory proceedings, including actions brought on behalf of various classes of claimants. In view of the inherent difficulty of predicting
the outcome of such matters, the Bank cannot state what the eventual outcome of such matters will be. However, based on current knowledge,
management does not believe that liabilities, if any, arising from pending litigation or regulatory proceedings will have a material adverse effect on the
Consolidated Statement of Financial Position or results of operations of the Bank.
Legal provisions are established when it becomes probable that the Bank will incur an expense related to a legal action and the amount can be reliably
estimated. Such provisions are recorded at the best estimate of the amount required to settle any obligation related to these legal actions as at the balance
sheet date, taking into account the risks and uncertainties surrounding the obligation. Management and internal and external experts are involved in
estimating any amounts that may be required. The actual costs of resolving these claims may vary significantly from the amount of the legal provisions.
The Bank’s estimate involves significant judgement, given the varying stages of the proceedings, the fact that the Bank’s liability, if any, has yet to be
determined and the fact that the underlying matters will change from time to time. As such, there is a possibility that the ultimate resolution of those
legal actions may be material to the Bank’s consolidated results of operations for any particular reporting period.
Furthermore, the Bank and its subsidiaries may be subject to penalties or sanctions imposed by regulatory authorities or enter into settlement agreements
with regulatory authorities from time to time. As the Bank and its subsidiaries are subject to numerous regulatory authorities around the world, fees,
administrative penalties and sanctions may be categorized differently by each regulator. Any such penalties imposed under these categories against the
Bank and its subsidiaries, however, are not material, nor would they likely be considered important to a reasonable investor in making an investment
decision, and would include penalties such as late filing fees. The Bank and its subsidiaries have not entered into any material settlement agreements
with a court relating to securities legislation or with a securities regulatory authority.
On November 5, 2015, the Bank and its New York Agency entered a written agreement (the “Agreement”) with the Federal Reserve Bank of New York
and the New York State Department of Financial Services relating to the New York Agency’s Bank Secrecy Act/Anti-Money Laundering Program. The
Bank has committed significant resources to addressing the findings in the Agreement and continues enhancing its Bank Secrecy Act/anti-money
laundering and sanctions program.
INTEREST OF MANAGEMENT AND OTHERS IN MATERIAL TRANSACTIONS
To the best of the Bank’s knowledge, the Bank confirms that there are no directors or executive officers or any associate or affiliate of a director or
executive officer with a material interest in any transaction within the three most recently completed financial years or during the current financial year
that has materially affected or will materially affect the Bank.
National Instrument 14-101 limits the meaning of “securities legislation” to Canadian provincial and territorial legislation and “securities
regulatory authority” to Canadian provincial and territorial securities regulatory authorities.
- 20 -
2
2

TRANSFER AGENT AND REGISTRAR
Computershare Trust Company of Canada is the Bank’s transfer agent and registrar at the following addresses: Computershare Trust Company of
Canada, 100 University Avenue, 8th Floor, Toronto, Ontario, M5J 2Y1 and Computershare Trust Company N.A., 250 Royall Street, Canton,
Massachusetts, 02021, U.S.
CONFLICTS OF INTEREST
To the knowledge of the Bank, no director or executive officer of the Bank has an existing or potential material conflict of interest with the Bank or any
of its subsidiaries.
EXPERTS
The Bank’s Shareholders’ Auditors are KPMG LLP, Bay Adelaide Centre, 333 Bay Street, Suite 4600, Toronto, Ontario, M5H 2S5. KPMG LLP is
independent of the Bank within the meaning of the Rules of Professional Conduct / Code of Ethics of various Canadian provincial institutes/ordre and
within the meaning of the relevant rules and related interpretations prescribed by the relevant professional bodies and any applicable legislation or
regulation.
THE BANK’S AUDIT AND CONDUCT REVIEW COMMITTEE
A copy of the Bank’s Audit and Conduct Review Committee charter is attached to this AIF as Schedule C and can also be found on the Bank’s website
at www.scotiabank.com in the Corporate Governance section.
The following directors are members of the Audit and Conduct Review Committee as of November 26, 2019: Una M. Power (Chair and financial
expert), Scott B. Bonham, Charles H. Dallara, Tiff Macklem, Michael D. Penner, Aaron W. Regent, Susan Segal and Benita Warmbold. All of the
members of the Committee are financially literate and independent as defined by Canadian and United States securities law. The Bank’s Board of
Directors has designated each of Una M. Power, Aaron W. Regent and Benita M. Warmbold as an ‘audit committee financial expert’, as that term is
defined by United States securities laws.
The education and related experience (as applicable) of each Audit and Conduct Review Committee member is described below.
Una M. Power (Chair) – Ms. Power is corporate director and the former Chief Financial Officer of Nexen Energy ULC, a former publicly-traded
energy company that is a wholly-owned subsidiary of CNOOC Limited. During her 24 year career with Nexen, Ms. Power held various executive
positions with responsibility for financial and risk management, strategic planning and budgeting, business development, energy marketing and trading,
information technology and capital investment. Ms. Power holds a B.Comm. (Honours) from Memorial University and CPA, CA and CFA designations.
She has completed executive development programs at Wharton Business School and INSEAD.
Scott B. Bonham – Mr. Bonham is a corporate director and the co-founder of Intentional Capital, a privately held real estate asset management
company. From 2000 to 2015, he was co-founder of GGV Capital, an expansion stage venture capital firm with investments in the U.S. and China. Prior
to GGV Capital, he served as Vice President of the Capital Group Companies, where he managed technology investments across several mutual funds
from 1996 to 2000. Mr. Bonham has a B.Sc. (in electrical engineering) from Queen’s University and an M.B.A. from Harvard Business School.
Charles H. Dallara – Dr. Dallara is an Advisory Partner of Partners Group and Chairman of Partners Group Board of Directors, USA, a private market
investment and asset management group, based in Switzerland . He has 43 years of industry experience. Dr. Dallara was Chairman of the Americas and
a member of the Board of Directors of Partners Group Holding AG until 2019. Prior to joining Partners Group in 2013, Dr. Dallara was the Managing
Director and Chief Executive Officer of the Institute of International Finance from 1993 to 2013. Previously, he was a Managing Director at J.P.
Morgan & Co. In addition, Dr. Dallara has held senior positions in the U.S. Department of the Treasury and with the IMF. He holds a B. Sc in
Economics from the University of South Carolina, an M.A., an M.A.L.D. (in Law & Diplomacy) and a Ph.D. from the Fletcher School of Law and
Diplomacy at Tufts University.
- 21 -

Tiff Macklem – Dr. Macklem is Dean of the Rotman School of Management at the University of Toronto. Previously, he served as Senior Deputy
Governor and Chief Operating Officer of the Bank of Canada (from July 2010 to May 2014). Prior to his appointment at the Bank of Canada,
Dr. Macklem served as Associate Deputy Minister of the federal Department of Finance and Canada’s finance deputy at the G7 and G20. He also served
as Chair of the Standing Committee on Standards Implementation of the Financial Stability Board. Dr. Macklem holds a B.A. (Honours) in Economics
from Queen’s University, and an M.A. and a Ph.D. in Economics from the University of Western Ontario.
Michael D. Penner – Mr. Penner is a corporate director, and the former Chairman of the Board of Directors of Hydro-Québec. He is Chairman and
Leading Operating Director of both US Infrastructure Corporation (USIC) and Enfragen Energy. He was the President and Chief Executive Officer of
Peds Legwear prior to selling his company to Gildan Activewear Inc. in August 2016. Mr. Penner has been active in his community, on the Board of
Directors of ICD Quebec and has served as a member of the Board of Directors of Les Grands Ballets Canadiens de Montréal, Selwyn House School,
Hofstra University School of Law and McGill University Football. Mr. Penner holds a Bachelor of Arts degree from McGill University and a Juris
Doctor from Hofstra University in New York.
Aaron W. Regent – Aaron Regent is Chairman of the Board of Scotiabank. He is the Founding Partner of Magris Resources Inc. and Chairman and
Chief Executive Officer of Niobec Inc., companies involved with the acquisition, development and operation of mining assets on a global basis. He was
President and Chief Executive Officer of Barrick Gold Corporation from January 2009 to June 2012. Previously, Mr. Regent was Senior Managing
Partner of Brookfield Asset Management and Co-Chief Executive Officer of the Brookfield Infrastructure Group, an asset management company, and
President and Chief Executive Officer of Falconbridge Limited. Mr. Regent holds a B.A. from the University of Western Ontario and is a chartered
accountant and a Fellow of CPA Ontario.
Susan L. Segal – Susan Segal was elected President and Chief Executive Officer of the Americas Society, an organization dedicated to education,
debate and dialogue in the Americas, and Council of the Americas, a business organization whose members share a common interest in the western
hemisphere, in August 2003. Previously, she was a banker for over 25 years with JPM Chase and its predecessor banks. Ms. Segal received a B.A. from
Sarah Lawrence College and an M.B.A. from Columbia University. In 1999, she was awarded the Order of Bernardo O’Higgins, Grado de Gran Oficial
in Chile. In 2009, President Alvaro Uribe of Colombia honored her with the Cruz de San Carlos award and in September 2012, Mexican President
Calderón awarded her with the Aguila Azteca, the highest award given to a foreigner. In 2013, the North American-Chilean Chamber of Commerce
recognized her as the Honorary Chilean of the Year. In 2018, Ms. Segal was awarded Peru’s Order of “Merit for Distinguished Services” in the rank of
Grand Official on behalf of President Martín Vizcarra.
Benita M. Warmbold – Ms. Warmbold is a corporate director, and the former Senior Managing Director and Chief Financial Officer of Canada
Pension Plan (CPP) Investment Board having retired in July 2017. Over her nine years at CPP Investment Board, Ms. Warmbold was responsible for
finance, risk, performance, tax, internal audit, legal, technology, data and investment operations. Prior to joining CPP Investment Board in 2008,
Ms. Warmbold held senior leadership positions with Northwater Capital, Canada Development Investment Corporation and KPMG. She is Chair of the
Canadian Public Accountability Board. Ms. Warmbold holds a B. Comm. (Honours) from Queen’s University and is a chartered professional accountant
and a Fellow of CPA Ontario. Ms. Warmbold has been recognized three times as one of “Canada’s Most Powerful Women – Top 100,” and in 2016 was
inducted into the WXN Hall of Fame.
Shareholders’ Auditors
Please refer to Table 75 on page 124 of the MD&A, which is incorporated herein by reference, for disclosure relating to the fees paid by the Bank to the
Bank’s Shareholders’ Auditors, KPMG LLP in each of the last three fiscal years. The nature of these services is described below:
• Audit services generally relate to the statutory audits and review of financial statements, regulatory required attestation reports, as well as
services associated with registration statements, prospectuses, periodic reports and other documents filed with securities regulatory bodies
or other documents issued in connection with securities offerings.
• Audit-related services include special attest services not directly linked to the financial statements, review of controls and procedures
related to regulatory reporting, audits of employee benefit plans and consultation and training on accounting and financial reporting.
- 22 -
• Tax services outside of the audit scope relate primarily to specified review procedures required by local tax authorities, attestation on tax
returns of certain subsidiaries as required by local tax authorities, and review to determine compliance with an agreement with the tax
authorities.
• Other non-audit services are primarily for the review and translation of English language financial statements into other languages and
other services.
The Audit and Conduct Review Committee has adopted policies and procedures (the “Policies”) for the pre-approval of services performed by the
Bank’s Shareholders’ Auditors. The objective of the Policies is to specify the scope of services permitted to be performed by the Bank’s Shareholders’
Auditors and to ensure the independence of the Bank’s Shareholders’ Auditors is not compromised through engaging them for other services. The
Policies state that the Audit and Conduct Review Committee shall pre-approve the following: audit services (all such engagements provided by the
Bank’s Shareholders’ Auditors as well as all such engagements provided by any other registered public accounting firm); and other permitted services to
be provided by the Bank’s Shareholders’ Auditors (primarily audit and audit-related services). The Bank’s Shareholders’ Auditors shall not be engaged
in the provision of tax or other non-audit services, without the pre-approval of the Audit and Conduct Review Committee. The Policies also enumerate
pre-approved services including specific audit, audit-related and other limited non-audit services that are consistent with the independence requirements
of the U.S. Sarbanes-Oxley Act of 2002, Canadian independence standards for auditors and applicable legal requirements. The Policies are applicable to
the Bank, its subsidiaries and entities that are required to be consolidated by the Bank. The Audit and Conduct Review Committee shall review and
approve the Policies on a regular basis. The Policies do not delegate any of the Audit and Conduct Review Committee’s responsibilities to management
of the Bank.
ADDITIONAL INFORMATION
Additional information relating to the Bank may be found on the SEDAR website at www.sedar.com and on the SEC’s website at www.sec.gov. For a
description of Canadian bank resolution powers and the consequent risk factors attaching to certain liabilities of the Bank reference is made to
https://www.scotiabank.com/ca/en/about/investors-shareholders/regulatory-disclosures/canadian-bank-resolution-powers-including-bail-in.html. Such
information may also be found at www.sedar.com and at www.sec.gov/edgar. Information contained in or otherwise accessible through the websites
mentioned in this Annual Information Form does not form a part of this Annual Information Form. All references in this Annual Information Form to
websites are inactive textual references and are for your information only. Additional information, including directors’ and officers’ compensation,
indebtedness and options to purchase securities, principal holders of the Bank’s securities and interests of insiders in material transactions, where
applicable, is contained in the Management Proxy Circular. Additional financial information is provided in the Bank’s consolidated financial statements
and MD&A for the year ended October 31, 2019. A copy of such documents may be obtained upon request from the Corporate Secretary’s Department,
at Scotia Plaza, 44 King Street West, Toronto, Ontario, M5H 1H1 Tel: (416) 866-3672. E-mail: [email protected].
- 23 -
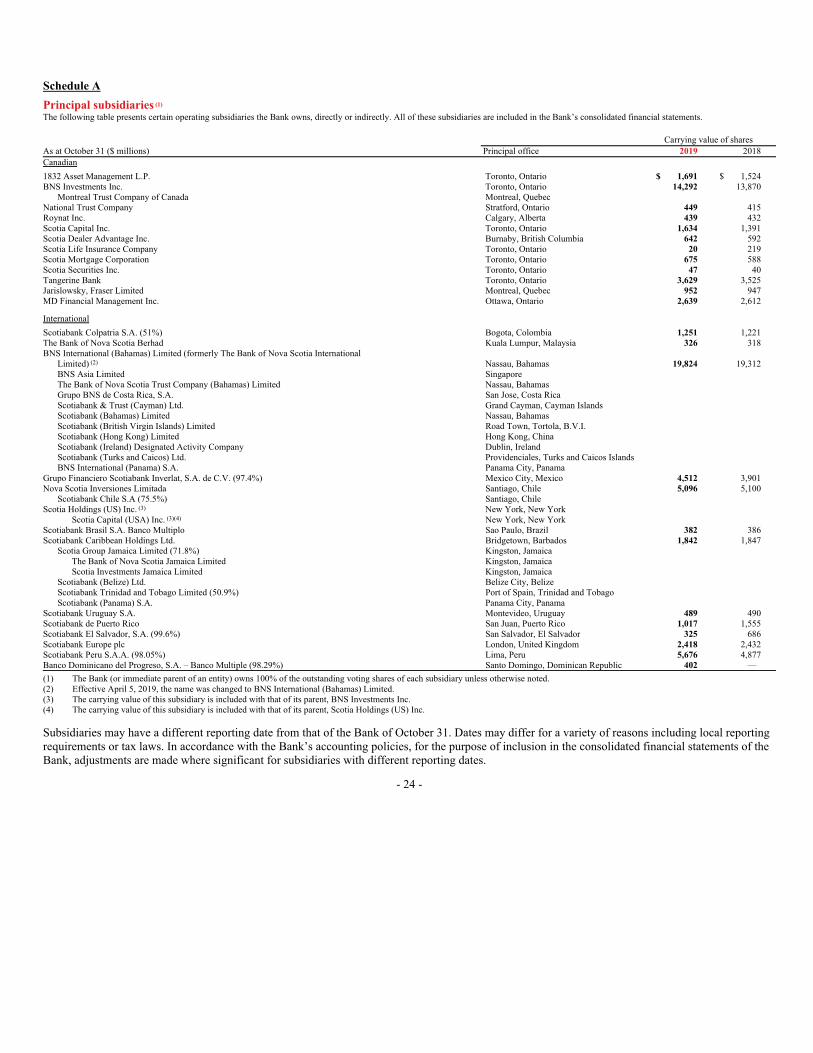
Schedule A
Principal subsidiaries
The following table presents certain operating subsidiaries the Bank owns, directly or indirectly. All of these subsidiaries are included in the Bank’s consolidated financial statements.
Carrying value of shares
As at October 31 ($ millions) Principal office 2019 2018
Canadian
1832 Asset Management L.P. Toronto, Ontario $ 1,691 $ 1,524
BNS Investments Inc. Toronto, Ontario 14,292 13,870
Montreal Trust Company of Canada Montreal, Quebec
National Trust Company Stratford, Ontario 449 415
Roynat Inc. Calgary, Alberta 439 432
Scotia Capital Inc. Toronto, Ontario 1,634 1,391
Scotia Dealer Advantage Inc. Burnaby, British Columbia 642 592
Scotia Life Insurance Company Toronto, Ontario 20 219
Scotia Mortgage Corporation Toronto, Ontario 675 588
Scotia Securities Inc. Toronto, Ontario 47 40
Tangerine Bank Toronto, Ontario 3,629 3,525
Jarislowsky, Fraser Limited Montreal, Quebec 952 947
MD Financial Management Inc. Ottawa, Ontario 2,639 2,612
International
Scotiabank Colpatria S.A. (51%) Bogota, Colombia 1,251 1,221
The Bank of Nova Scotia Berhad Kuala Lumpur, Malaysia 326 318
BNS International (Bahamas) Limited (formerly The Bank of Nova Scotia International
Limited) Nassau, Bahamas 19,824 19,312
BNS Asia Limited Singapore
The Bank of Nova Scotia Trust Company (Bahamas) Limited Nassau, Bahamas
Grupo BNS de Costa Rica, S.A. San Jose, Costa Rica
Scotiabank & Trust (Cayman) Ltd. Grand Cayman, Cayman Islands
Scotiabank (Bahamas) Limited Nassau, Bahamas
Scotiabank (British Virgin Islands) Limited Road Town, Tortola, B.V.I.
Scotiabank (Hong Kong) Limited Hong Kong, China
Scotiabank (Ireland) Designated Activity Company Dublin, Ireland
Scotiabank (Turks and Caicos) Ltd. Providenciales, Turks and Caicos Islands
BNS International (Panama) S.A. Panama City, Panama
Grupo Financiero Scotiabank Inverlat, S.A. de C.V. (97.4%) Mexico City, Mexico 4,512 3,901
Nova Scotia Inversiones Limitada Santiago, Chile 5,096 5,100
Scotiabank Chile S.A (75.5%) Santiago, Chile
Scotia Holdings (US) Inc. New York, New York
Scotia Capital (USA) Inc. New York, New York
Scotiabank Brasil S.A. Banco Multiplo Sao Paulo, Brazil 382 386
Scotiabank Caribbean Holdings Ltd. Bridgetown, Barbados 1,842 1,847
Scotia Group Jamaica Limited (71.8%) Kingston, Jamaica
The Bank of Nova Scotia Jamaica Limited Kingston, Jamaica
Scotia Investments Jamaica Limited Kingston, Jamaica
Scotiabank (Belize) Ltd. Belize City, Belize
Scotiabank Trinidad and Tobago Limited (50.9%) Port of Spain, Trinidad and Tobago
Scotiabank (Panama) S.A. Panama City, Panama
Scotiabank Uruguay S.A. Montevideo, Uruguay 489 490
Scotiabank de Puerto Rico San Juan, Puerto Rico 1,017 1,555
Scotiabank El Salvador, S.A. (99.6%) San Salvador, El Salvador 325 686
Scotiabank Europe plc London, United Kingdom 2,418 2,432
Scotiabank Peru S.A.A. (98.05%) Lima, Peru 5,676 4,877
Banco Dominicano del Progreso, S.A. – Banco Multiple (98.29%) Santo Domingo, Dominican Republic 402 —
(1) The Bank (or immediate parent of an entity) owns 100% of the outstanding voting shares of each subsidiary unless otherwise noted.
(2) Effective April 5, 2019, the name was changed to BNS International (Bahamas) Limited.
(3) The carrying value of this subsidiary is included with that of its parent, BNS Investments Inc.
(4) The carrying value of this subsidiary is included with that of its parent, Scotia Holdings (US) Inc.
Subsidiaries may have a different reporting date from that of the Bank of October 31. Dates may differ for a variety of reasons including local reporting
requirements or tax laws. In accordance with the Bank’s accounting policies, for the purpose of inclusion in the consolidated financial statements of the
Bank, adjustments are made where significant for subsidiaries with different reporting dates.
- 24 -
(1)
(2)
(3)
(3)(4)

Schedule B
Definition of Credit Ratings
Moody’s
Moody’s short-term ratings are assigned to obligations with an original maturity of thirteen months or less and reflect both on the likelihood of a default
on contractually promised payments and the expected financial loss suffered in the event of default. The “P-1” rating indicates that an issuer has a
superior ability to repay short-term debt obligations.
Moody’s long-term ratings are assigned to issuers or obligations with an original maturity of one year or more and reflect both on the likelihood of a
default on contractually promised payments and the expected financial loss suffered in the event of default. Obligations rated “Aa” are judged to be of
high quality and are subject to very low credit risk. Obligations rated “A” are judged to be upper-medium grade and are subject to low credit risk.
Obligations rated “Baa” are judged to be medium-grade and subject to moderate credit risk and as such may possess certain speculative characteristics.
The numerical modifiers 1, 2 and 3 indicate that the obligation ranks in the higher end, mid-range or lower end, respectively, of that generic rating
category.
Additionally, a *(hyb)* indicator is appended to all ratings of hybrid securities issued by banks, insurers, finance companies, and securities firm.
The Moody’s rating outlook is an opinion regarding the likely rating direction over the medium term. The “Stable” outlook indicates a low likelihood of
a rating change over the medium term.
S&P
S&P short-term issue credit ratings are generally assigned to those obligations considered short-term in the relevant market. Short-term ratings are also
used to indicate the creditworthiness of an obligor with respect to put features on long-term obligations. A short-term obligation rated “A-1” is rated in
the highest category and indicates S&P’s view that an obligor’s capacity to meet its financial commitments on these obligations is strong.
S&P long-term issue credit ratings are based, in varying degrees, on S&P Global Ratings’ analysis of the following considerations: likelihood of
payment – capacity and willingness of the obligor to meet its financial commitment on an obligation in accordance with the terms of the obligation;
nature of and provisions of the obligation, and the promise they impute; and protection afforded by, and relative position of, the obligation in the event
of bankruptcy, reorganization, or other arrangement under the laws of bankruptcy and other laws affecting creditors’ rights. A rating in the “A” category
means the obligation is somewhat more susceptible to the adverse effects of changes in circumstances and economic conditions than obligations in
higher-rated categories. However, the obligor’s capacity to meet its financial commitment on the obligation is still strong. An obligation rated in the
“BBB” category indicates that the obligation exhibits adequate protection parameters. However, adverse economic conditions or changing
circumstances are more likely to lead to a weakened capacity of the obligor to meet its financial commitment on the obligation. Ratings from AA to
CCC may be modified by the addition of a plus (+) or minus (–) sign to show relative standing within the major rating categories.
An S&P Global Ratings preferred share rating on the Canadian scale is a forward-looking opinion about the creditworthiness of an obligor with respect
to a specific preferred share obligation issued in the Canadian market relative to preferred shares issued by other issuers in the Canadian market. There
is a direct correspondence between the specific ratings assigned on the Canadian preferred share scale and the various rating levels on the global debt
rating scale of S&P Global Ratings. The Canadian scale rating is fully determined by the applicable global scale rating, and there are no additional
analytical criteria associated with the determination of ratings on the Canadian scale. It is the practice of S&P Global Ratings to present an issuer’s
preferred share ratings on both the global rating scale and on the Canadian national scale when listing the ratings for a particular issuer. A reference to
“high” or “low” reflects the relative strength within the rating category, and the absence of either a “high” or “low” designation indicates the rating is in
the middle of the category.
- 25 -

An S&P Global Ratings outlook assesses the potential direction of a long-term credit rating over the intermediate term (typically six months to two
years). In determining a rating outlook, consideration is given to any changes in economic and/or fundamental business conditions. An outlook is not
necessarily a precursor of a rating change or future CreditWatch action. The “Stable” rating outlook means that a rating is not likely to change.
Fitch
A short-term issuer or obligation rating is based in all cases on the short-term vulnerability to default of the rated entity and relates to the capacity to
meet financial obligations in accordance with the documentation governing the relevant obligation. Short-term deposit ratings may be adjusted for loss
severity. Short-Term Ratings are assigned to obligations whose initial maturity is viewed as “short term” based on market convention. A rating of “F1+”
denotes the highest short-term credit quality, indicating the strongest intrinsic capacity for the timely payment of financial commitments. The added “+”
denotes an exceptionally strong credit feature.
Long-term credit ratings are used as a benchmark measure of probability of default and are formally described as an Issuer Default Rating (“IDR”).
IDRs opine on an entity’s relative vulnerability to default (including by way of a distressed debt exchange) on financial obligations. A rating of “AA”
denotes expectation of very low default risk and indicates very strong capacity for payment of financial commitments; this capacity is not significantly
vulnerable to foreseeable events. A rating of “A” denotes expectations of low default risk and the capacity for payment of financial commitments is
considered strong; this capacity may, nevertheless, be more vulnerable to adverse business or economic conditions than is the case for higher ratings.
Within some of the rating levels, Fitch further differentiates the rankings by adding the modifiers “+” or “-” to denote relative status within major rating
categories.
Rating Outlooks indicate the direction a rating is likely to move over a one-to-two year period. They reflect financial or other trends that have not yet
reached or been sustained the level that would cause a rating action, but which may do so if such trends continue. The “Stable” rating outlook means
that the rating is not likely to change over a one-to-two year period.
DBRS
The DBRS short-term debt rating scale provides an opinion on the risk that an issuer will not meet its short-term financial obligations in a timely
manner. The R-1 and R-2 rating categories are further denoted by the subcategories “high”, “middle” and “low”. An obligation rated R-1(high) is of the
highest credit quality and indicates the capacity for the payment of short-term financial obligations as they fall due is exceptionally high; unlikely to be
adversely affected by future events.
The DBRS long-term rating scale provides an opinion on the risk of default. That is, the risk that an issuer will fail to satisfy its financial obligations in
accordance with the terms under which the obligations have been issued. Ratings are based on quantitative and qualitative considerations relevant to the
issuer, and the relative ranking of claims. All rating categories other than AAA and D also contain subcategories “(high)” and “(low)”. The absence of
either a “(high)” or “(low)” designation indicates the rating is in the middle of the category. Long-term financial obligations rated “AA” are of superior
credit quality and capacity for the payment is considered high; credit quality differs from AAA only to a small degree; unlikely to be significantly
vulnerable to future events. Long-term financial obligations rated “A” are of good credit quality and capacity for payment is considered substantial, but
of lesser credit quality than AA; and may be vulnerable to future events, but qualifying negative factors are considered manageable.
The DBRS preferred share rating scale is used in the Canadian securities market and is meant to give an indication of the risk that a borrower will not
fulfill its full obligations in a timely manner, with respect to both dividend and principal commitments. Every DBRS rating is based on quantitative and
qualitative considerations relevant to the borrowing entity. This scale may also apply to certain hybrid securities, in which case references to dividend
throughout will reflect interest commitments of the hybrid security. Each rating category is denoted by the subcategories “high” and “low”. The absence
of either a “high” or “low” designation indicates the rating is in the middle of the category. The “Pfd-2” rating indicates that the preferred shares are of
satisfactory credit quality.
Rating trends provide guidance in respect of DBRSs opinion regarding outlook for the rating in question. The “Stable” rating trend represents an
indication that there is less likelihood that the rating could change in the future than would be the case if the rating trend was “Negative”.
- 26 -

Schedule C
CHARTER
AUDIT AND CONDUCT REVIEW COMMITTEE OF THE BOARD OF DIRECTORS OF
THE BANK OF NOVA SCOTIA
The Audit and Conduct Review Committee of the Board of Directors (the “Committee”) has the responsibilities and duties as outlined below:
AUDIT
A. Mandate
1. To perform such duties as may be required by:
• the Bank Act (the “Bank Act”), the regulations thereunder and guidelines of the Office of the Superintendent of Financial Institutions
Canada (“OSFI”); and
• other applicable legislation and regulations, including those of the Ontario Securities Commission and the Canadian Securities
Administrators, the Toronto Stock Exchange, the New York Stock Exchange (“NYSE”), the Securities and Exchange Commission and
the Sarbanes-Oxley Act, 2002,
as more fully described under the heading “Duties” below.
2. To assist the Board of Directors (the “Board”) in fulfilling its oversight responsibilities for:
• the integrity of the Bank’s consolidated financial statements and related quarterly results releases;
• the system of internal control, including internal control over financial reporting and disclosure controls and procedures (“internal
controls”);
• the external auditor’s qualifications, independence and performance; and
• the Bank’s finance, compliance and internal audit functions.
3. To perform such other duties as may from time to time be assigned to the Committee by the Board.
4. To act as the audit committee for any federally chartered Canadian financial institution beneficially owned by the Bank as determined by the
Board.
B. Authority
The Committee has authority to:
• conduct or authorize investigations into any matters within its scope of responsibility;
• retain, as appropriate and at the Bank’s expense, independent counsel, accountants or others to advise the Committee or assist in the
conduct of an investigation;
• meet with Bank officers, the external auditor or outside counsel, as necessary;
• determine appropriate funding for independent advisors;
• communicate directly with the internal and external auditors;
• receive all material correspondence between the external auditor and management related to audit and interim review findings; and
• call a meeting of the Board to consider any matter of concern to the Committee.
C. Duties
The Committee shall:
- 27 -

Financial Information
• review the quarterly and annual consolidated financial statements of the Bank prior to approval by the Board and disclosure to the public,
and satisfy itself that the financial statements present fairly the financial position, results of operations and cash flows of the Bank;
• review should include discussion with management and the external auditor of significant issues, including significant accounting
policies, regarding the financial results, accounting principles, practices and management estimates and judgments;
• satisfy itself that the Bank’s accounting practices are prudent and appropriate;
• review the quarterly and annual Management’s Discussion & Analysis of Financial Condition and Results of Operations (“MD&A”) prior
to review and approval by the Board;
• review any material proposed changes in accounting standards and securities policies or regulation relevant to the Bank’s consolidated
financial statements and approve any material changes in accounting policies related to the Bank’s consolidated financial statements;
• review any tax matters material to the financial statements;
• be satisfied that adequate procedures are in place for the review of the Bank’s public disclosure of all consolidated financial statements,
related quarterly results press releases and financial information extracted or derived from the Bank’s consolidated financial statements
and periodically assess the adequacy of these procedures;
• review material financial press releases prior to public disclosure;
• review earnings press releases, as well as financial information and earnings guidance provided to analysts and rating agencies prior to
public disclosure;
• review investments and transactions that could adversely affect the well-being of the Bank brought to its attention by the external auditor
or by any officer of the Bank;
• discuss significant financial risk exposures and the steps management of the Bank has taken to monitor, control and report such exposures;
• review the Annual Information Form and Form 40-F; and
• review the process relating to and the certifications of the Chief Executive Officer and the Chief Financial Officer on the integrity of the
Bank’s quarterly and annual consolidated financial statements.
Internal Controls
• require Bank management to implement and maintain appropriate internal control procedures including anti-fraud controls and review,
evaluate and approve these procedures, including the Bank’s Internal Control Policy, as part of the Bank’s overall internal control
framework;
• receive and review reports from management and internal audit on the design and operating effectiveness of the internal control
framework and any significant control breakdowns, including any reports concerning significant deficiencies and material weaknesses in
the design or operation of internal controls which are reasonably likely to adversely affect the Bank’s ability to record, process, summarize
and report financial information, and any fraud involving management or other employees who have a significant role in the Bank’s
internal controls;
• as part of this review, the Committee should discuss with management whether any deficiencies identified may be systemic or
pervasive;
• receive and review the external auditor’s audit report on the Bank’s internal controls over financial reporting as of the Bank’s year end;
and
• require management to establish procedures and review and approve the procedures established for the receipt, retention, treatment and
resolution of complaints received by the Bank regarding accounting, internal accounting controls or auditing matters, including
confidential, anonymous submissions from employees, as part of the Bank’s Whistleblower Policy and Procedures, and carry out the
Committee’s responsibilities under the Bank’s Whistleblower Policy and Procedures, as required.
Finance
• oversee the Finance Department, having regard to its independence, by:
- 28 -

• reviewing and approving the appointment and/or removal of the Chief Financial Officer of the Bank;
• annually reviewing and approving the mandate of the Chief Financial Officer and the charter of the Finance Department;
• annually reviewing and approving the organizational structure of the Finance Department;
• annually reviewing and approving the Finance Department’s resources and budget;
• annually assessing the effectiveness of the Chief Financial Officer and the effectiveness of the Finance Department, and annually
approving the performance review of the Chief Financial Officer, taking into consideration any regulatory findings with respect to the
finance function;
• conveying its views to the Human Resources Committee on the following matters:
• the assessment of the effectiveness and performance review of the Chief Financial Officer;
• considerations to be factored into the total compensation to be paid to the Chief Financial Officer; and
• succession planning for the role of Chief Financial Officer;
• overseeing that the Finance Department has unfettered access and a functional reporting line to the Committee;
• periodically requesting independent reviews of the Finance Department, reviewing the results of such reviews and reporting such results to
the Board; and
• overseeing that deficiencies identified related to the Finance Department are remedied within an appropriate time frame and reporting to
the Board on the progress of necessary corrective actions.
Compliance
• approve the Compliance Risk Summary Framework;
• receive reports from management on the Bank’s compliance with legal and regulatory requirements and the adequacy and effectiveness of
the Bank’s compliance controls, including:
• review the annual and other periodic reports of Global Compliance; and
• follow up with management on plans to remediate any deficiencies identified in reports and on any regulatory recommendations or
findings, and discuss if weaknesses may exist elsewhere;
• meet, on its own or with the Board, with representatives of OSFI to discuss OSFI’s supervisory results;
• meet with Bank management to review and discuss the Bank’s response to OSFI’s recommendations and suggestions pursuant to their
supervisory activities;
• review any issues raised by Internal Audit that address the appropriateness and effectiveness of the Bank’s Compliance Risk Summary
Framework and management of significant compliance risks;
• oversee the Global Compliance Department, having regard to its independence, by:
• reviewing and approving the appointment and/or removal of the Chief Compliance Officer;
• annually reviewing and approving the mandate for the Chief Compliance Officer and the charter of the Global Compliance
Department;
• annually reviewing and approving the organizational structure of the Global Compliance Department;
• annually reviewing and approving the Global Compliance Department’s resources and budget;
• annually assessing the effectiveness of the Chief Compliance Officer and the effectiveness of the Global Compliance Department,
and annually approving the performance review of the Chief Compliance Officer, taking into consideration any regulatory findings
with respect to the Global Compliance Department;
• conveying its view to the Chief Risk Officer and the Human Resources Committee on the following matters:
• the assessment of the effectiveness and performance review of the Chief Compliance Officer;
• considerations to be factored into the total compensation to be paid to the Chief Compliance Officer; and
• succession planning for the role of Chief Compliance Officer;
• overseeing that Global Compliance has unfettered access and a functional reporting line to the Committee;
• periodically requesting independent reviews of the Global Compliance Department, reviewing the results of such reviews and
reporting such results to the Board; and
- 29 -

• overseeing that deficiencies identified related to Global Compliance are remedied within an appropriate time frame and reporting to
the Board on the progress of necessary corrective actions.
Internal Audit
• review the quarterly and other reports of the Chief Auditor;
• review any matters of significance that arose from non-audit engagements performed by the Audit Department;
• regularly meet with the Chief Auditor with and/or without management, to discuss the effectiveness of the Bank’s internal control, risk
management (including anti-money laundering) and governance processes;
• oversee the Audit Department, having regard to its independence, by:
• reviewing and approving the appointment and/or removal of the Chief Auditor;
• annually reviewing and approving the mandate of the Chief Auditor and the charter of the Audit Department;
• annually reviewing and approving the organizational structure of the Audit Department;
• annually reviewing and approving the annual audit plan, overall risk assessment methodology, budgets and resources of the Audit
Department;
• annually assessing the effectiveness of the Chief Auditor and the Audit Department, taking into consideration the objectivity and
independence of the Bank’s internal audit function, and annually approving the performance review of the Chief Auditor, taking into
consideration any regulatory findings with respect to the Audit Department;
• conveying its view to the Human Resources Committee on the following matters:
• the assessment of the effectiveness and performance review of the Chief Auditor;
• considerations to be factored into the total compensation to be paid to the Chief Auditor; and
• succession planning for the role of Chief Auditor;
• periodically reviewing results of the internal Quality Assurance and Improvement Program;
• periodically requesting independent reviews of the Audit Department, reviewing the results of such reviews and reporting such
results to the Board;
• overseeing that deficiencies identified related to the Audit Department are remedied within an appropriate time frame and reporting
to the Board on the progress of necessary corrective actions; and
• advising the Board of any recommendations for the continuous improvement of the Audit Department;
• ensure the Audit Department has unfettered access and a direct and independent reporting line to the Committee;
• provide for an open avenue of communication between the Audit Department and the Board;
• ensure that the Audit Department’s recommendations are adequately considered and acted on, by providing the Audit Department with the
authority to follow-up on observations and recommendations; and
• review and approve the Internal Audit Third Party Risk Management Policy.
External Auditor
• have responsibility for the oversight of the external auditor who reports directly to the Committee;
• recommend to the Board the retention or termination of the Bank’s external auditor, subject to shareholder ratification;
• review and approve the annual audit plan and letter(s) of engagement, and as part of such review, satisfy itself that the Bank’s audit plan is
risk based and covers all relevant activities over a measurable cycle;
• annually review the external auditor’s opinion on the annual financial statements including critical audit matters contained therein;
• review and evaluate the external auditor’s qualifications, performance and independence, including a review and evaluation of the lead
audit partner, taking into consideration the opinions of management and the Bank’s Audit Department in such evaluation and any concerns
raised by OSFI or other stakeholders about the external auditor’s independence;
• consistent with the Committee’s annual assessment and periodic comprehensive review of the external auditors, the Committee shall
establish a policy that stipulates the criteria for the Bank tendering the contract for the role of the Bank’s external auditor;
- 30 -

• as part of this policy and any review undertaken by the Committee, the Committee should periodically consider whether to put the
external auditor contract out for tender, taking into consideration the length of the current external auditor’s tenure and the risks that
tenure may pose to the external auditor’s objectivity and independence;
• receive the CPAB’s annual public report, along with any notices required to be communicated by the external auditor to the Committee,
including those required by CPAB, OSFI and PCAOB;
• review and recommend to the Board the annual fee for the audit of the Bank’s consolidated financial statements;
• as part of this review, the Committee should satisfy itself that the level of audit fees is commensurate with the scope of work
undertaken;
• review and pre-approve in accordance with established pre-approval policy, all services to be provided by the external auditor, including
audit and audit related services and permitted tax and non-audit services;
• delegate the authority to pre-approve non-audit services to a member of the Committee;
• review external auditor services pre-approved by the delegate of the Committee;
• review annually the total fees paid to the external auditor by required categories;
• at least annually, obtain and review reporting from the external auditor describing:
• the firm’s internal quality-control procedures;
• any material issues raised by the most recent internal quality-control review, or peer review, of the firm, or by any inquiry or
investigation by governmental or professional authorities, within the preceding five years, regarding one or more independent audits
carried out by the firm, and any steps taken to deal with any such issues;
• the skill and resources (amount and type) of the firm; and
• an assessment of all relationships between the external auditor and the Bank that pertain to independence;
• review the rotation plan for partners on the engagement;
• meet with the external auditor and with management to discuss the quarterly and the annual consolidated financial statements and the
Bank’s disclosure under any MD&A;
• review with management and the external auditor all matters required to be communicated to the Committee under generally accepted
auditing standards;
• review with the external auditor any audit problems or difficulties and management’s response;
• discuss with the external auditor the OSFI returns, investments or transactions reviewed by the Committee;
• resolve any disputes between the external auditor and management; and
• review and approve policies for the Bank’s employment of current and former employees or partners of the current or former external
auditor.
Other Duties
• review the periodic reports on litigation matters;
• review such returns as specified by OSFI;
• provide for an open avenue of communication between internal audit, the external auditor and the Board;
• annually, review the charter for the Committee and evaluate the Committee’s effectiveness in fulfilling its mandate;
• prepare a committee report for inclusion in the Bank’s management proxy circular; and
• institute and oversee special investigations as needed.
CONDUCT REVIEW
D. Mandate
1. To perform the duties with respect to the Bank’s procedures for ensuring its transactions with its related parties comply with Part XI of the Bank
Act and any regulations thereunder as more fully described under the heading “Duties” below.
2. In the event a widely held bank holding company or insurance holding company has a significant interest in any class of shares of the Bank:
- 31 -

• to establish policies for entering into transactions referred to in subsection 495.1(1) of the Bank Act, including transactions with a holding
company or any other related party of the Bank that is an entity in which the holding company has a substantial investment; and
• to review certain of the Bank’s transactions that are referred to in subsection 495.3(1) of the Bank Act including any transaction with a
widely held insurance or bank holding company or any other related party in which they hold a substantial investment.
3. To perform such duties as are required by the Bank Act to be dealt with by a committee of the Board concerning the monitoring of adherence to
procedures for identifying potential conflicts of interest and for resolving such conflicts of interest, for restricting the use of confidential
information, for providing disclosure of information to customers and for dealing with customer complaints as required under subsection 455(1)
of the Bank Act, and as more fully described under the heading “Duties” below.
4. To assist the Board in fulfilling its oversight responsibilities for:
• setting standards of conduct and ethical behaviour; and
• the oversight of conduct and conduct risk management.
5. To perform such other duties as are required under the Bank Act or by OSFI, or as may from time to time be assigned by the Board.
6. To monitor and fulfill the compliance requirements of the Bank in respect of the Financial Consumer Agency of Canada.
7. To act as the conduct review committee for any federally chartered Canadian financial institution beneficially owned by the Bank as determined
by the Board.
E. Duties
1. Approve criteria for determining whether the value of transactions with related parties of the Bank is nominal or immaterial to the Bank;
2. Approve the terms and conditions of:
• loans, other than margin loans, to senior officers of the Bank on terms and conditions more favourable to the senior officers than those
offered to the public; and
• loans to spouses of senior officers of the Bank on the security of mortgages of the principal residences of such spouses on terms and
conditions more favourable than those offered to the public;
3. Approve the practice of the Bank making financial services, other than loans or guarantees, available to senior officers of the Bank or to spouses,
or children who are less than 18 years of age of senior officers of the Bank, on terms and conditions more favourable than those offered to the
public, provided the financial services are offered by the Bank to its employees on those favourable terms and conditions;
4. Require Bank management to establish procedures to enable the Bank to verify that its transactions with related parties of the Bank comply with
Part XI of the Bank Act and to review those procedures and their effectiveness. These procedures should, among other things, enable
management to verify that:
• all related party transactions are on terms and conditions at least as favourable to the Bank as market terms and conditions, other than
transactions referred to in clauses 2 and 3 above;
• loans to full-time senior officers, other than margin loans and mortgages on their principal residences, do not exceed the greater of twice
their annual salaries and $100,000;
• aggregate loans or guarantees to, and investments in the securities of any related party (subject to certain exceptions) do not exceed 2% of
the Bank’s regulatory capital unless the approval of 2/3 of the Board has been obtained; and
• aggregate loans or guarantees to, and investments in the securities of all related parties (subject to certain exceptions) do not exceed 50%
of the Bank’s regulatory capital;
- 32 -

5. Review the practices of the Bank to identify any transactions with related parties of the Bank that may have a material effect on the stability or
solvency of the Bank;
6. Monitor the procedures established by the Board to resolve conflicts of interest, including techniques for the identification of potential conflict
situations and to restrict the use of confidential information;
7. Monitor the procedures established by the Board to provide disclosure to customers of the Bank of information that is required to be disclosed by
the Bank Act, and for dealing with and reporting complaints made by customers of the Bank who have requested or received products or
services in Canada and to satisfy itself that these procedures are being adhered to by the Bank;
8. Review and, if appropriate, recommend for Board approval, the Conduct Risk Summary Framework;
9. Review and, if appropriate, recommend for Board approval the Bank’s Code of Conduct which includes the standards of conduct and ethical
behaviour for employees, officers and directors of the Bank and its subsidiaries and recommend for approval by the Board any exceptions from
the Bank’s Code of Conduct , as appropriate;
10. Review reports from Global Compliance on compliance with the Bank’s Code of Conduct and any instances of material deviation therefrom
with corrective actions taken;
11. Review the annual letter of certification from the Chief Executive Officer on the Bank’s compliance with the Code of Conduct;
12. Review and, if appropriate, approve the Anti-Bribery and Anti-Corruption Policy;
13. Monitor the Bank’s exposure to material conduct risk and review the Bank’s conduct risk management practices including its identification,
measurement, monitoring and assessment of conduct risk;
14. Review reports to the Committee relating to conduct risk; and
15. Review with management the results of their assessment of the Bank’s conduct risk and their plans to remediate any material deficiencies
identified.
COMMITTEE OPERATIONS
F. Reporting
After each meeting of the Committee, the Committee is required to report to the Board on matters reviewed by the Committee. The Committee
shall also report as required to the Risk Committee on relevant issues.
The Chair of the Committee shall review, for completeness, the Board’s report to OSFI with respect to conduct review matters on the
Committee’s activities during the year. This report must be filed within 90 days after the Bank’s financial year-end.
The Committee shall review and assess the adequacy of this Charter on an annual basis and report the results of this review to the Corporate
Governance Committee of the Board.
G. Composition
Structure
The Committee shall consist of a minimum of 3 Directors. No member of the Committee may serve on more than three audit committees of public
company boards without the consent of the Corporate Governance Committee and the Board.
- 33 -

Each member must be financially literate or become financially literate within a reasonable period of time subsequent to his/her appointment to
the Committee. At least one member must be a financial expert. There should also be a reasonable representation of other key competencies on the
Committee, as determined by the Corporate Governance Committee.
Independence
The Committee is composed entirely of independent directors as defined in applicable laws, rules and regulations and as determined pursuant to
the Director Independence Standards approved by the Board for Committee members.
No member of the Committee may be an officer or employee of the Bank or of any of its subsidiaries or affiliates. No member may be a person
who is affiliated with the Bank.
Directors’ fees are the only compensation a member of the Committee may be paid by the Bank.
Appointment of Committee Members
Members of the Committee are appointed or reappointed annually by the Board, upon the recommendation of the Corporate Governance
Committee, such appointments to take effect immediately following the annual meeting of the shareholders of the Bank. Members of the Committee
shall hold office until their successors are appointed, or until they cease to be Directors of the Bank.
Vacancies
Vacancies may be filled for the remainder of the current term of appointment of members of the Committee by the Board, subject to the
requirements under the headings “Structure” and “Independence” above.
Appointment and Qualifications of Committee Chair
The Board shall appoint from the Committee membership, a Chair for the Committee to preside at meetings. In the absence of the Chair, one of
the other members of the Committee present shall be chosen by the Committee to preside at that meeting.
The Chair for the Committee must have all of the qualifications for Committee membership and have accounting or related financial management
expertise.
H. Meetings
Calling of Meetings
Meetings of the Committee may be called by the Chair, by any two members of the Committee or the external auditor. Members may participate
in meetings in person or by telephone, electronic or other communications facilities.
Written resolutions in lieu of a meeting are permitted, solely in accordance with the Bank Act.
The Committee shall hold an in camera session immediately prior to and/or following the conclusion of the regular agenda matters. The
Committee shall also hold in camera sessions, separately at each Committee meeting, with each of the Chief Financial Officer, Chief Compliance
Officer, Chief Auditor and the external auditor. The Committee shall also meet separately, at least quarterly, with management.
To facilitate communication between the Committee and the Risk Committee, the Chair of the Risk Committee shall receive notice of all
Committee meetings and may attend Committee meetings by invitation as a non-voting observer.
The Committee may invite any director, officer or employee or any other person to attend meetings to assist the Committee with its deliberations.
- 34 -

Notice of Meetings
Notice of meeting of the Committee shall be sent by prepaid mail, by personal delivery or other means of transmitted or recorded communication
or by telephone at least 12 hours before the meeting to each member of the Committee at the member’s address or communication number last recorded
with the Corporate Secretary. A Committee member may in any manner waive notice of a meeting of the Committee and attendance at a meeting is a
waiver of notice of the meeting, except where a member attends for the express purpose of objecting to the transaction of any business on the ground
that the meeting is not lawfully called.
Notice to the Internal Auditor and External Auditor
The Chief Auditor and the external auditor are entitled to receive notice of every meeting of the Committee and, at the expense of the Bank, to
attend and be heard at each meeting and to have the opportunity to discuss matters with the independent directors, without the presence of management.
Frequency
The Committee shall meet at least quarterly.
Quorum
The quorum for a meeting of the Committee shall be a majority of its members, subject to a minimum of two members.
Secretary and Minutes
The Corporate Secretary or, in the absence of the Corporate Secretary, an Assistant Corporate Secretary of the Bank shall act as Secretary of the
Committee.
Minutes of meetings of the Committee shall be recorded and maintained by the Corporate Secretary and subsequently presented to the Committee
and to the Board, if required by the Board.
This Charter was last reviewed and approved by the Board on June 25, 2019.
- 35 -
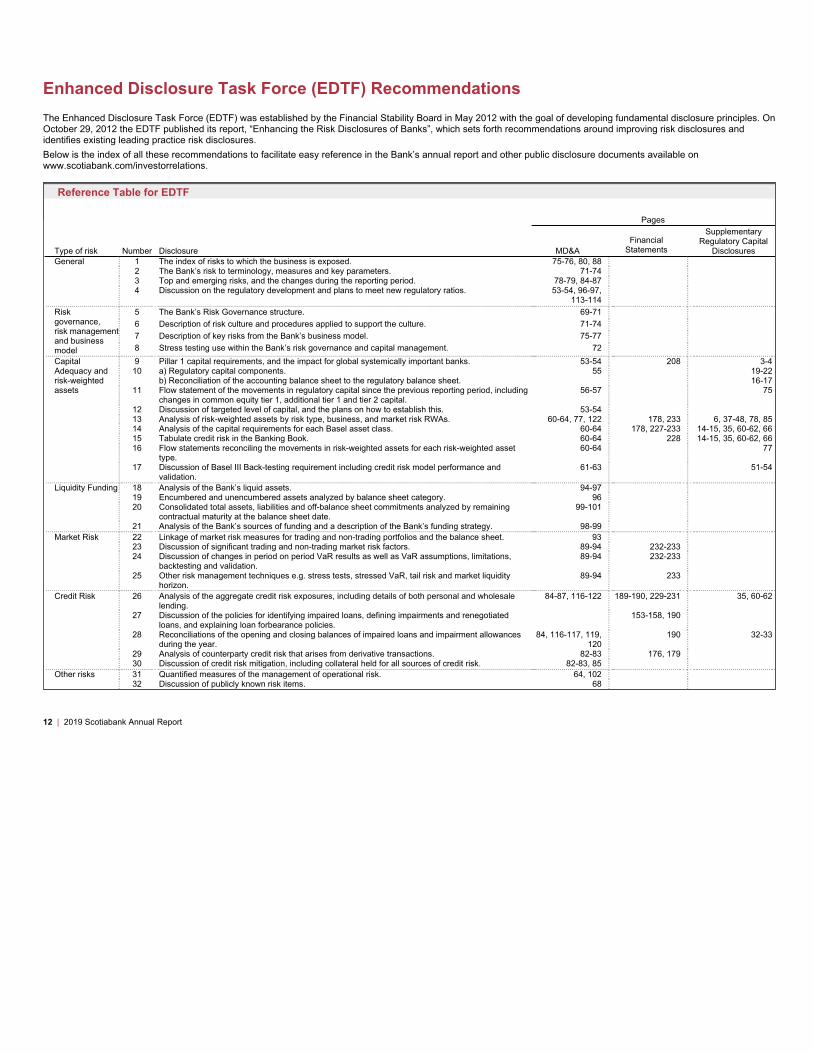
Enhanced Disclosure Task Force (EDTF) Recommendations
The Enhanced Disclosure Task Force (EDTF) was established by the Financial Stability Board in May 2012 with the goal of developing fundamental disclosure principles. On
October 29, 2012 the EDTF published its report, “Enhancing the Risk Disclosures of Banks”, which sets forth recommendations around improving risk disclosures and
identifies existing leading practice risk disclosures.
Below is the index of all these recommendations to facilitate easy reference in the Bank’s annual report and other public disclosure documents available on
www.scotiabank.com/investorrelations.
Reference Table for EDTF
Pages
Supplementary
Regulatory Capital
DisclosuresType of risk Number Disclosure MD&A
Financial
Statements
General 1 The index of risks to which the business is exposed. 75-76, 80, 88
2 The Bank’s risk to terminology, measures and key parameters. 71-74
3 Top and emerging risks, and the changes during the reporting period. 78-79, 84-87
4 Discussion on the regulatory development and plans to meet new regulatory ratios. 53-54, 96-97,
113-114
Risk
governance,
risk management
and business
model
5 The Bank’s Risk Governance structure. 69-71
6 Description of risk culture and procedures applied to support the culture. 71-74
7 Description of key risks from the Bank’s business model. 75-77
8 Stress testing use within the Bank’s risk governance and capital management. 72
Capital
Adequacy and
risk-weighted
assets
9 Pillar 1 capital requirements, and the impact for global systemically important banks. 53-54 208 3-4
10 a) Regulatory capital components. 55 19-22
b) Reconciliation of the accounting balance sheet to the regulatory balance sheet. 16-17
11 Flow statement of the movements in regulatory capital since the previous reporting period, including
changes in common equity tier 1, additional tier 1 and tier 2 capital.
56-57 75
12 Discussion of targeted level of capital, and the plans on how to establish this. 53-54
13 Analysis of risk-weighted assets by risk type, business, and market risk RWAs. 60-64, 77, 122 178, 233 6, 37-48, 78, 85
14 Analysis of the capital requirements for each Basel asset class. 60-64 178, 227-233 14-15, 35, 60-62, 66
15 Tabulate credit risk in the Banking Book. 60-64 228 14-15, 35, 60-62, 66
16 Flow statements reconciling the movements in risk-weighted assets for each risk-weighted asset
type.
60-64 77
17 Discussion of Basel III Back-testing requirement including credit risk model performance and
validation.
61-63 51-54
Liquidity Funding 18 Analysis of the Bank’s liquid assets. 94-97
19 Encumbered and unencumbered assets analyzed by balance sheet category. 96
20 Consolidated total assets, liabilities and off-balance sheet commitments analyzed by remaining
contractual maturity at the balance sheet date.
99-101
21 Analysis of the Bank’s sources of funding and a description of the Bank’s funding strategy. 98-99
Market Risk 22 Linkage of market risk measures for trading and non-trading portfolios and the balance sheet. 93
23 Discussion of significant trading and non-trading market risk factors. 89-94 232-233
24 Discussion of changes in period on period VaR results as well as VaR assumptions, limitations,
backtesting and validation.
89-94 232-233
25 Other risk management techniques e.g. stress tests, stressed VaR, tail risk and market liquidity
horizon.
89-94 233
Credit Risk 26 Analysis of the aggregate credit risk exposures, including details of both personal and wholesale
lending.
84-87, 116-122 189-190, 229-231 35, 60-62
27 Discussion of the policies for identifying impaired loans, defining impairments and renegotiated
loans, and explaining loan forbearance policies.
153-158, 190
28 Reconciliations of the opening and closing balances of impaired loans and impairment allowances
during the year.
84, 116-117, 119,
120
190 32-33
29 Analysis of counterparty credit risk that arises from derivative transactions. 82-83 176, 179
30 Discussion of credit risk mitigation, including collateral held for all sources of credit risk. 82-83, 85
Other risks 31 Quantified measures of the management of operational risk. 64, 102
32 Discussion of publicly known risk items. 68
12 | 2019 Scotiabank Annual Report

Management’s
Discussion and Analysis
Table of Contents
2019 Scotiabank Annual Report | 13
14 Forward-looking statements
15 Non-GAAP measures
21 Financial highlights
Overview of Performance
22 Financial results: 2019 vs 2018
22 Medium-term objectives
22 Shareholder returns
23 Economic outlook
23 Impact of foreign currency translation
Group Financial Performance
24 Net income
24 Net interest income
26 Non-interest income
27 Provision for credit losses
29 Non-interest expenses
30 Income taxes
31 Financial results review: 2018 vs 2017
33 Fourth quarter review
35 Trending analysis
Business Line Overview
36 Overview
38 Canadian Banking
42 International Banking
46 Global Banking and Markets
49 Global Wealth Management
50 Other
Group Financial Condition
52 Statement of financial position
53 Capital management
64 Off-balance sheet arrangements
67 Financial instruments
68 Selected credit instruments – publically known risk items
Risk Management
69 Risk management framework
80 Credit risk
88 Market risk
94 Liquidity risk
102 Other risks
Controls and Accounting Policies
107 Controls and procedures
107 Critical accounting estimates
111 Future accounting developments
113 Regulatory developments
115 Related party transactions
Supplementary Data
116 Geographic information
118 Credit risk
123 Revenues and expenses
125 Selected quarterly information
126 Eleven-year statistical review

Management’s Discussion and Analysis
Forward Looking Statements
From time to time, our public communications often include oral or written forward-looking statements. Statements of this type are included in this document, and may be
included in other filings with Canadian securities regulators or the U.S. Securities and Exchange Commission, or in other communications. In addition, representatives of the
Bank may include forward-looking statements orally to analysts, investors, the media and others. All such statements are made pursuant to the “safe harbor” provisions of
the U.S. Private Securities Litigation Reform Act of 1995 and any applicable Canadian securities legislation. Forward-looking statements may include, but are not limited to,
statements made in this document, the Management’s Discussion and Analysis in the Bank’s 2019 Annual Report under the headings “Outlook” and in other statements
regarding the Bank’s objectives, strategies to achieve those objectives, the regulatory environment in which the Bank operates, anticipated financial results, and the outlook
for the Bank’s businesses and for the Canadian, U.S. and global economies. Such statements are typically identified by words or phrases such as “believe,” “expect,”
“foresee,” “forecast,” “anticipate,” “intend,” “estimate,” “plan,” “goal,” “project,” and similar expressions of future or conditional verbs, such as “will,” “may,” “should,” “would”
and “could.”
By their very nature, forward-looking statements require us to make assumptions and are subject to inherent risks and uncertainties, which give rise to the possibility
that our predictions, forecasts, projections, expectations or conclusions will not prove to be accurate, that our assumptions may not be correct and that our financial
performance objectives, vision and strategic goals will not be achieved.
We caution readers not to place undue reliance on these statements as a number of risk factors, many of which are beyond our control and effects of which can be
difficult to predict, could cause our actual results to differ materially from the expectations, targets, estimates or intentions expressed in such forward-looking statements.
The future outcomes that relate to forward-looking statements may be influenced by many factors, including but not limited to: general economic and market conditions
in the countries in which we operate; changes in currency and interest rates; increased funding costs and market volatility due to market illiquidity and competition for
funding; the failure of third parties to comply with their obligations to the Bank and its affiliates; changes in monetary, fiscal, or economic policy and tax legislation and
interpretation; changes in laws and regulations or in supervisory expectations or requirements, including capital, interest rate and liquidity requirements and guidance, and
the effect of such changes on funding costs; changes to our credit ratings; operational and infrastructure risks; reputational risks; the accuracy and completeness of
information the Bank receives on customers and counterparties; the timely development and introduction of new products and services; our ability to execute our strategic
plans, including the successful completion of acquisitions and dispositions, including obtaining regulatory approvals; critical accounting estimates and the effect of changes
to accounting standards, rules and interpretations on these estimates; global capital markets activity; the Bank’s ability to attract, develop and retain key executives; the
evolution of various types of fraud or other criminal behaviour to which the Bank is exposed; disruptions in or attacks (including cyber-attacks) on the Bank’s information
technology, internet, network access, or other voice or data communications systems or services; increased competition in the geographic and in business areas in which we
operate, including through internet and mobile banking and non-traditional competitors; exposure related to significant litigation and regulatory matters; the occurrence of
natural and unnatural catastrophic events and claims resulting from such events; and the Bank’s anticipation of and success in managing the risks implied by the foregoing.
A substantial amount of the Bank’s business involves making loans or otherwise committing resources to specific companies, industries or countries. Unforeseen events
affecting such borrowers, industries or countries could have a material adverse effect on the Bank’s financial results, businesses, financial condition or liquidity. These and
other factors may cause the Bank’s actual performance to differ materially from that contemplated by forward-looking statements. The Bank cautions that the preceding list is
not exhaustive of all possible risk factors and other factors could also adversely affect the Bank’s results, for more information, please see the “Risk Management” section of
the Bank’s 2019 Annual Report, as may be updated by quarterly reports.
Material economic assumptions underlying the forward-looking statements contained in this document are set out in the 2019 Annual Report under the headings
“Outlook”, as updated by quarterly reports. The “Outlook” sections are based on the Bank’s views and the actual outcome is uncertain. Readers should consider the above-
noted factors when reviewing these sections. When relying on forward-looking statements to make decisions with respect to the Bank and its securities, investors and others
should carefully consider the preceding factors, other uncertainties and potential events.
Any forward-looking statements contained in this document represent the views of management only as of the date hereof and are presented for the purpose of
assisting the Bank’s shareholders and analysts in understanding the Bank’s financial position, objectives and priorities, and anticipated financial performance as at and for
the periods ended on the dates presented, and may not be appropriate for other purposes. Except as required by law, the Bank does not undertake to update any forward-
looking statements, whether written or oral, that may be made from time to time by or on its behalf.
Additional information relating to the Bank, including the Bank’s Annual Information Form, can be located on the SEDAR website at www.sedar.com and on the EDGAR
section of the SEC’s website at www.sec.gov.
November 26, 2019
14 | 2019 Scotiabank Annual Report

Management’s Discussion & Analysis
The Management’s Discussion and Analysis (MD&A) is provided to enable readers to assess the Bank’s financial condition and results of operations as at and for the year
ended October 31, 2019. The MD&A should be read in conjunction with the Bank’s 2019 Consolidated Financial Statements, including the Notes. This MD&A is dated
November 26, 2019.
Additional information relating to the Bank, including the Bank’s 2019 Annual Report, are available on the Bank’s website at www.scotiabank.com. As well, the Bank’s 2019
Annual Report and Annual Information Form are available on the SEDAR website at www.sedar.com and on the EDGAR section of the SEC’s website at www.sec.gov.
Non-GAAP Measures
The Bank uses a number of financial measures to assess its performance. Some of these measures are not calculated in accordance with Generally Accepted Accounting
Principles (GAAP), which are based on International Financial Reporting Standards (IFRS) as issued by the International Accounting Standards Board (IASB), are not
defined by GAAP and do not have standardized meanings that would ensure consistency and comparability among companies using these measures. The Bank believes
that certain non-GAAP measures are useful in assessing ongoing business performance and provide readers with a better understanding of how management assesses
performance. These non-GAAP measures are used throughout this report and defined below.
Adjusted results and diluted earnings per share
The following tables present reconciliations of GAAP Reported financial results to Non-GAAP Adjusted financial results. The financial results have been adjusted for the
following:
Acquisitionand divestiture-related amounts – Acquisition and divestiture-related amounts are defined as:
A. Acquisition-related costs
1. Integration costs – Includes costs that are incurred and relate to integrating the acquired operations and are recorded in the Canadian and International Banking
operating segments. These costs will cease once integration is complete. The costs relate to the following acquisitions:
• Banco Cencosud, Peru (closed Q2, 2019)
• Banco Dominicano del Progreso, Dominican Republic (closed Q2, 2019)
• MD Financial Management, Canada (closed Q4, 2018)
• Jarislowsky, Fraser Limited, Canada (closed Q3, 2018)
• Citibank consumer and small and medium enterprise operations, Colombia (closed Q3, 2018)
• BBVA, Chile (closed Q3, 2018)
2. Day 1 provision for credit losses on acquired performing financial instruments, as required by IFRS 9. The standard does not differentiate between originated and
purchased performing loans and as such, requires the same accounting treatment for both. These credit losses are considered Acquisition-related costs in periods where
applicable and are recorded in the International Banking segment. The costs for 2019 relate to Banco Cencosud, Peru and Banco Dominicano del Progreso, Dominican
Republic. The costs for 2018 relate to BBVA, Chile and Citibank, Colombia.
3. Amortization of Acquisition-related intangible assets, excluding software. These costs relate to the six acquisitions above, as well as prior acquisitions and are recorded in
the Canadian and International Banking operating segments.
B. Net (gain)/loss on divestitures – The Bank has announced a number of divestitures in 2019 in accordance with its strategy to reposition the Bank. The net loss
attributable to equity holders of $308 million was recorded in the Other segment, relating to the following divestitures (refer to Note 37 for further details):
• Gain on sale of banking operations in the Caribbean (closed Q4, 2019)
• Loss on sale of Colfondos AFP announced in Q4, 2019
• Loss on sale of operations in Puerto Rico announced in Q3, 2019
• Gain on divestiture of Scotia Crecer AFP and Scotia Seguros in the Dominican Republic (closed Q2, 2019)
• Loss on sale of the insurance and banking operations in El Salvador announced in Q2, 2019
2019 Scotiabank Annual Report | 15
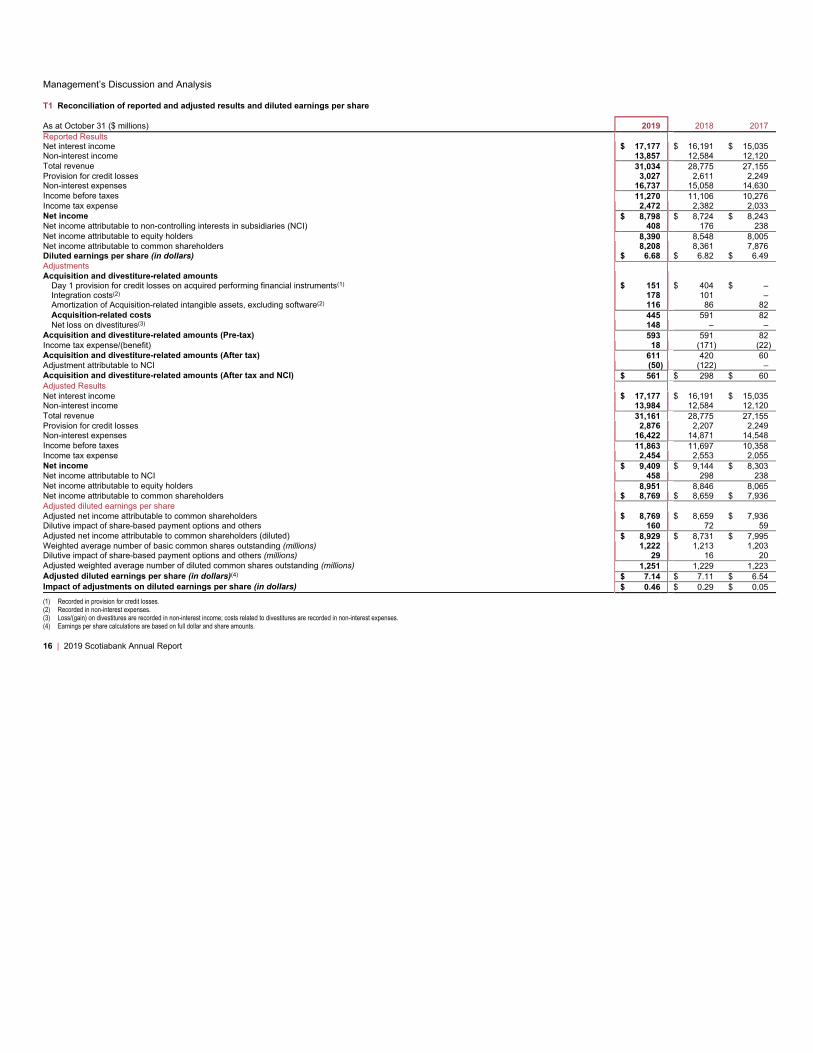
Management’s Discussion and Analysis
T1 Reconciliation of reported and adjusted results and diluted earnings per share
As at October 31 ($ millions) 2019 2018 2017
Reported Results
Net interest income $ 17,177 $ 16,191 $ 15,035
Non-interest income 13,857 12,584 12,120
Total revenue 31,034 28,775 27,155
Provision for credit losses 3,027 2,611 2,249
Non-interest expenses 16,737 15,058 14,630
Income before taxes 11,270 11,106 10,276
Income tax expense 2,472 2,382 2,033
Net income $ 8,798 $ 8,724 $ 8,243
Net income attributable to non-controlling interests in subsidiaries (NCI) 408 176 238
Net income attributable to equity holders 8,390 8,548 8,005
Net income attributable to common shareholders 8,208 8,361 7,876
Diluted earnings per share (in dollars) $ 6.68 $ 6.82 $ 6.49
Adjustments
Acquisition and divestiture-related amounts
Day 1 provision for credit losses on acquired performing financial instruments(1) $ 151 $ 404 $ –
Integration costs(2) 178 101 –
Amortization of Acquisition-related intangible assets, excluding software(2) 116 86 82
Acquisition-related costs 445 591 82
Net loss on divestitures(3) 148 – –
Acquisition and divestiture-related amounts (Pre-tax) 593 591 82
Income tax expense/(benefit) 18 (171) (22)
Acquisition and divestiture-related amounts (After tax) 611 420 60
Adjustment attributable to NCI (50) (122) –
Acquisition and divestiture-related amounts (After tax and NCI) $ 561 $ 298 $ 60
Adjusted Results
Net interest income $ 17,177 $ 16,191 $ 15,035
Non-interest income 13,984 12,584 12,120
Total revenue 31,161 28,775 27,155
Provision for credit losses 2,876 2,207 2,249
Non-interest expenses 16,422 14,871 14,548
Income before taxes 11,863 11,697 10,358
Income tax expense 2,454 2,553 2,055
Net income $ 9,409 $ 9,144 $ 8,303
Net income attributable to NCI 458 298 238
Net income attributable to equity holders 8,951 8,846 8,065
Net income attributable to common shareholders $ 8,769 $ 8,659 $ 7,936
Adjusted diluted earnings per share
Adjusted net income attributable to common shareholders $ 8,769 $ 8,659 $ 7,936
Dilutive impact of share-based payment options and others 160 72 59
Adjusted net income attributable to common shareholders (diluted) $ 8,929 $ 8,731 $ 7,995
Weighted average number of basic common shares outstanding (millions) 1,222 1,213 1,203
Dilutive impact of share-based payment options and others (millions) 29 16 20
Adjusted weighted average number of diluted common shares outstanding (millions) 1,251 1,229 1,223
Adjusted diluted earnings per share (in dollars)(4)$ 7.14 $ 7.11 $ 6.54
Impact of adjustments on diluted earnings per share (in dollars) $ 0.46 $ 0.29 $ 0.05
(1) Recorded in provision for credit losses.
(2) Recorded in non-interest expenses.
(3) Loss/(gain) on divestitures are recorded in non-interest income; costs related to divestitures are recorded in non-interest expenses.
(4) Earnings per share calculations are based on full dollar and share amounts.
16 | 2019 Scotiabank Annual Report

T2 Reconciliation of reported and adjusted results by business line
Canadian Banking(1)
As at October 31 ($ millions) 2019 2018 2017
Reported Results
Net interest income $ 8,284 $ 7,898 $ 7,363
Non-interest income 5,609 5,452 5,488
Total revenue 13,893 13,350 12,851
Provision for credit losses 972 794 913
Non-interest expenses 6,943 6,654 6,487
Income before taxes 5,978 5,902 5,451
Income tax expense 1,554 1,538 1,387
Net income $ 4,424 $ 4,364 $ 4,064
Net income attributable to non-controlling interests in subsidiaries (NCI) – – –
Net income attributable to equity holders $ 4,424 $ 4,364 $ 4,064
Adjustments
Acquisition-related costs
Day 1 provision for credit losses on acquired performing financial instruments(2) $ – $ – $ –
Integration costs(3) 27 31 –
Amortization of acquisition-related intangible assets, excluding software(3) 56 40 35
Acquisition-related costs (Pre-tax) 83 71 35
Income tax expense/(benefit) (22) (19) (9)
Adjustments for Acquisition-related costs (After tax) 61 52 26
Adjustment attributable to NCI – – –
Adjustments for Acquisition-related costs (After tax and NCI) $ 61 $ 52 $ 26
Adjusted Results
Net interest income $ 8,284 $ 7,898 $ 7,363
Non-interest income 5,609 5,452 5,488
Total revenue 13,893 13,350 12,851
Provision for credit losses 972 794 913
Non-interest expenses 6,860 6,583 6,452
Income before taxes 6,061 5,973 5,486
Income tax expense 1,576 1,557 1,396
Net income $ 4,485 $ 4,416 $ 4,090
Net income attributable to NCI – – –
Net income attributable to equity holders $ 4,485 $ 4,416 $ 4,090
(1) Refer to Business Line Overview on page 36.
(2) Recorded in provision for credit losses.
(3) Recorded in non-interest expenses.
2019 Scotiabank Annual Report | 17

Management’s Discussion and Analysis
T2 Reconciliation of reported and adjusted results by business line
International Banking(1)
As at October 31 ($ millions) 2019 2018 2017
Reported Results
Net interest income $ 8,482 $ 7,322 $ 6,726
Non-interest income 5,006 4,111 3,688
Total revenue 13,488 11,433 10,414
Provision for credit losses 2,076 1,867 1,294
Non-interest expenses 7,027 6,111 5,664
Income before taxes 4,385 3,455 3,456
Income tax expense 998 706 828
Net income $ 3,387 $ 2,749 $ 2,628
Net income attributable to non-controlling interests in subsidiaries (NCI) 391 176 238
Net income attributable to equity holders $ 2,996 $ 2,573 $ 2,390
Adjustments
Acquisition-related costs
Day 1 provision for credit losses on acquired performing financial instruments(2) $ 151 $ 404 $ –
Integration costs(3) 151 70 –
Amortization of Acquisition-related intangible assets, excluding software(3) 60 46 47
Acquisition-related costs (Pre-tax) 362 520 47
Income tax expense/(benefit) (104) (152) (13)
Adjustments for Acquisition-related costs (After tax) 258 368 34
Adjustment attributable to NCI (66) (122) –
Adjustments for Acquisition-related costs (After tax and NCI) $ 192 $ 246 $ 34
Adjusted Results
Net interest income $ 8,482 $ 7,322 $ 6,726
Non-interest income 5,006 4,111 3,688
Total revenue 13,488 11,433 10,414
Provision for credit losses 1,925 1,463 1,294
Non-interest expenses 6,816 5,995 5,617
Income before taxes 4,747 3,975 3,503
Income tax expense 1,102 858 841
Net income $ 3,645 $ 3,117 $ 2,662
Net income attributable to NCI 457 298 238
Net income attributable to equity holders $ 3,188 $ 2,819 $ 2,424
(1) Refer to Business Line Overview on page 36.
(2) Recorded in provision for credit losses.
(3) Recorded in non-interest expenses.
18 | 2019 Scotiabank Annual Report
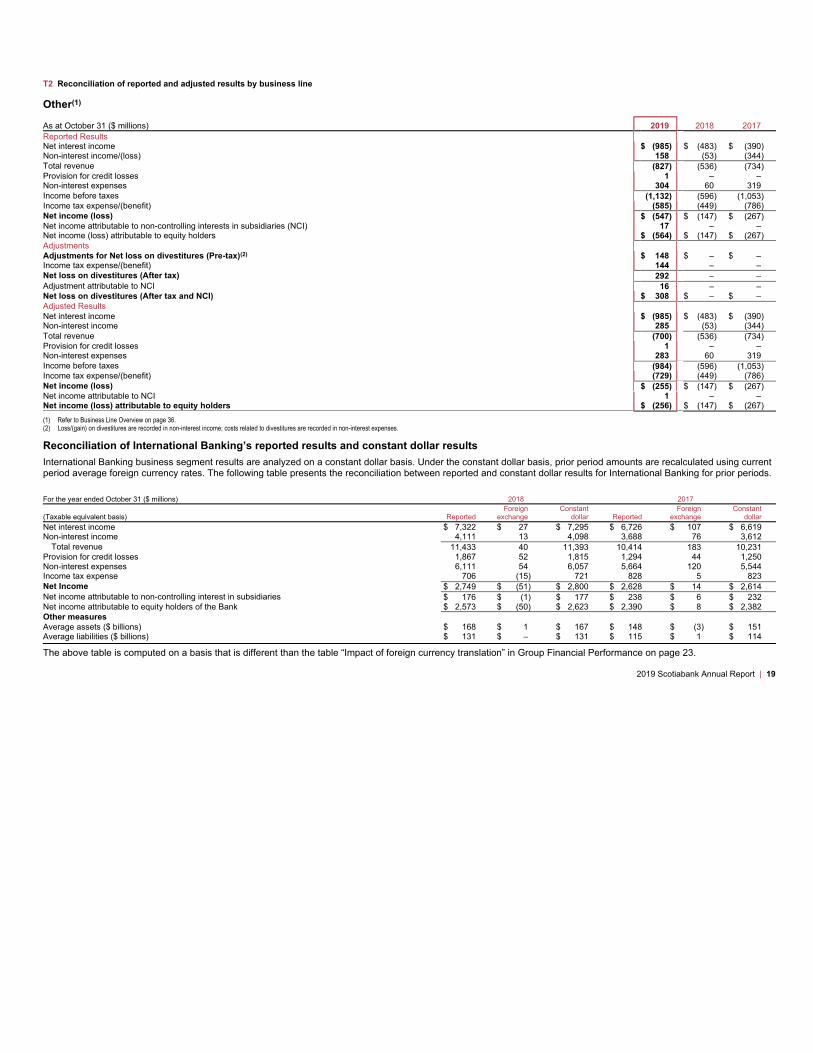
T2 Reconciliation of reported and adjusted results by business line
Other(1)
As at October 31 ($ millions) 2019 2018 2017
Reported Results
Net interest income $ (985) $ (483) $ (390)
Non-interest income/(loss) 158 (53) (344)
Total revenue (827) (536) (734)
Provision for credit losses 1 – –
Non-interest expenses 304 60 319
Income before taxes (1,132) (596) (1,053)
Income tax expense/(benefit) (585) (449) (786)
Net income (loss) $ (547) $ (147) $ (267)
Net income attributable to non-controlling interests in subsidiaries (NCI) 17 – –
Net income (loss) attributable to equity holders $ (564) $ (147) $ (267)
Adjustments
Adjustments for Net loss on divestitures (Pre-tax)(2) $ 148 $ – $ –
Income tax expense/(benefit) 144 – –
Net loss on divestitures (After tax) 292 – –
Adjustment attributable to NCI 16 – –
Net loss on divestitures (After tax and NCI) $ 308 $ – $ –
Adjusted Results
Net interest income $ (985) $ (483) $ (390)
Non-interest income 285 (53) (344)
Total revenue (700) (536) (734)
Provision for credit losses 1 – –
Non-interest expenses 283 60 319
Income before taxes (984) (596) (1,053)
Income tax expense/(benefit) (729) (449) (786)
Net income (loss) $ (255) $ (147) $ (267)
Net income attributable to NCI 1 – –
Net income (loss) attributable to equity holders $ (256) $ (147) $ (267)
(1) Refer to Business Line Overview on page 36.
(2) Loss/(gain) on divestitures are recorded in non-interest income; costs related to divestitures are recorded in non-interest expenses.
Reconciliation of International Banking’s reported results and constant dollar results
International Banking business segment results are analyzed on a constant dollar basis. Under the constant dollar basis, prior period amounts are recalculated using current
period average foreign currency rates. The following table presents the reconciliation between reported and constant dollar results for International Banking for prior periods.
For the year ended October 31 ($ millions) 2018 2017
(Taxable equivalent basis) Reported
Foreign
exchange
Constant
dollar Reported
Foreign
exchange
Constant
dollar
Net interest income $ 7,322 $ 27 $ 7,295 $ 6,726 $ 107 $ 6,619
Non-interest income 4,111 13 4,098 3,688 76 3,612
Total revenue 11,433 40 11,393 10,414 183 10,231
Provision for credit losses 1,867 52 1,815 1,294 44 1,250
Non-interest expenses 6,111 54 6,057 5,664 120 5,544
Income tax expense 706 (15) 721 828 5 823
Net Income $ 2,749 $ (51) $ 2,800 $ 2,628 $ 14 $ 2,614
Net income attributable to non-controlling interest in subsidiaries $ 176 $ (1) $ 177 $ 238 $ 6 $ 232
Net income attributable to equity holders of the Bank $ 2,573 $ (50) $ 2,623 $ 2,390 $ 8 $ 2,382
Other measures
Average assets ($ billions) $ 168 $ 1 $ 167 $ 148 $ (3) $ 151
Average liabilities ($ billions) $ 131 $ – $ 131 $ 115 $ 1 $ 114
The above table is computed on a basis that is different than the table “Impact of foreign currency translation” in Group Financial Performance on page 23.
2019 Scotiabank Annual Report | 19

Management’s Discussion and Analysis
Core banking assets
Core banking assets are average earning assets excluding bankers’ acceptances and average trading assets within Global Banking and Markets.
Core banking margin
This ratio represents net interest income divided by average core banking assets.
Return on equity
Return on equity is a profitability measure that presents the net income attributable to common shareholders as a percentage of average common shareholders’ equity.
In the first quarter of 2019, in line with OSFI’s increased Domestic Stability Buffer announced requirements, the Bank increased the capital attributed to its business lines to
approximate 10.0% of Basel III common equity capital requirements based on credit, market and operational risks and leverage inherent within each business segment.
Previously, capital was attributed based on a methodology that approximated 9.5% of Basel III common equity capital requirements.
Return on equity for the business segments is calculated as a ratio of net income attributable to common shareholders of the business segment and the capital attributed.
Prior period returns on equity for the business segments have not been restated.
20 | 2019 Scotiabank Annual Report
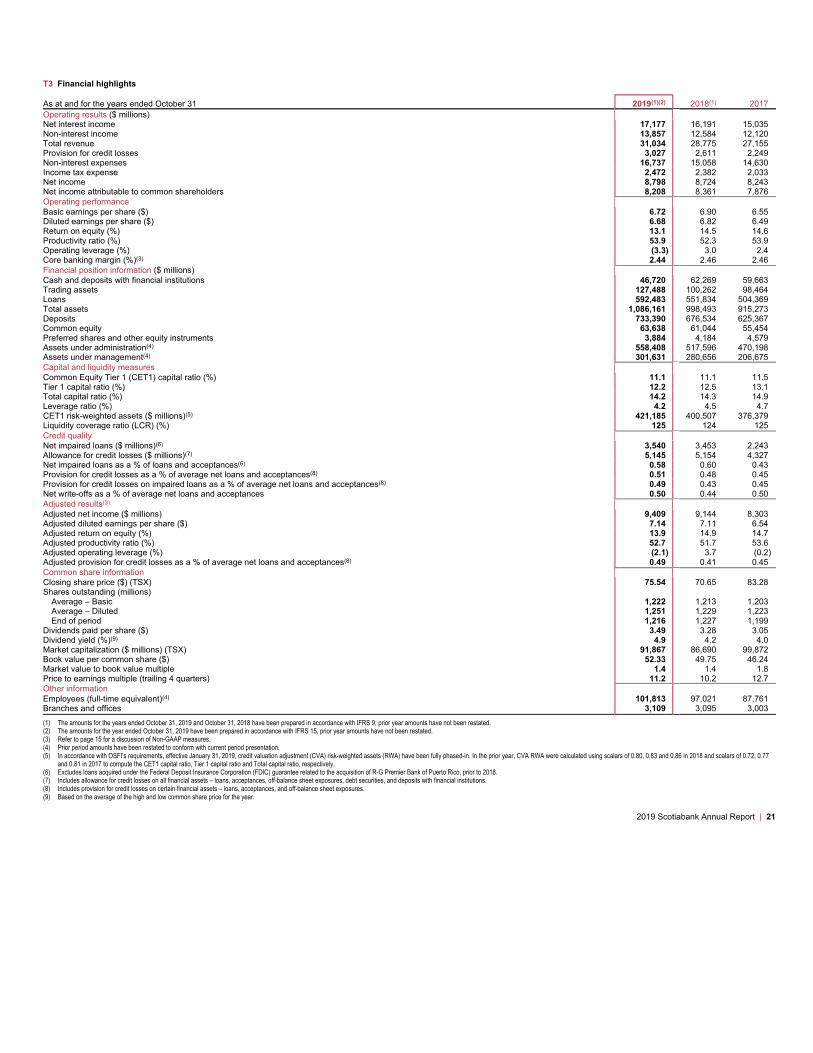
T3 Financial highlights
As at and for the years ended October 31 2019(1)(2) 2018(1) 2017
Operating results ($ millions)
Net interest income 17,177 16,191 15,035
Non-interest income 13,857 12,584 12,120
Total revenue 31,034 28,775 27,155
Provision for credit losses 3,027 2,611 2,249
Non-interest expenses 16,737 15,058 14,630
Income tax expense 2,472 2,382 2,033
Net income 8,798 8,724 8,243
Net income attributable to common shareholders 8,208 8,361 7,876
Operating performance
Basic earnings per share ($) 6.72 6.90 6.55
Diluted earnings per share ($) 6.68 6.82 6.49
Return on equity (%) 13.1 14.5 14.6
Productivity ratio (%) 53.9 52.3 53.9
Operating leverage (%) (3.3) 3.0 2.4
Core banking margin (%)(3) 2.44 2.46 2.46
Financial position information ($ millions)
Cash and deposits with financial institutions 46,720 62,269 59,663
Trading assets 127,488 100,262 98,464
Loans 592,483 551,834 504,369
Total assets 1,086,161 998,493 915,273
Deposits 733,390 676,534 625,367
Common equity 63,638 61,044 55,454
Preferred shares and other equity instruments 3,884 4,184 4,579
Assets under administration(4) 558,408 517,596 470,198
Assets under management(4) 301,631 280,656 206,675
Capital and liquidity measures
Common Equity Tier 1 (CET1) capital ratio (%) 11.1 11.1 11.5
Tier 1 capital ratio (%) 12.2 12.5 13.1
Total capital ratio (%) 14.2 14.3 14.9
Leverage ratio (%) 4.2 4.5 4.7
CET1 risk-weighted assets ($ millions)(5) 421,185 400,507 376,379
Liquidity coverage ratio (LCR) (%) 125 124 125
Credit quality
Net impaired loans ($ millions)(6) 3,540 3,453 2,243
Allowance for credit losses ($ millions)(7) 5,145 5,154 4,327
Net impaired loans as a % of loans and acceptances(6) 0.58 0.60 0.43
Provision for credit losses as a % of average net loans and acceptances(8) 0.51 0.48 0.45
Provision for credit losses on impaired loans as a % of average net loans and acceptances(8) 0.49 0.43 0.45
Net write-offs as a % of average net loans and acceptances 0.50 0.44 0.50
Adjusted results(3)
Adjusted net income ($ millions) 9,409 9,144 8,303
Adjusted diluted earnings per share ($) 7.14 7.11 6.54
Adjusted return on equity (%) 13.9 14.9 14.7
Adjusted productivity ratio (%) 52.7 51.7 53.6
Adjusted operating leverage (%) (2.1) 3.7 (0.2)
Adjusted provision for credit losses as a % of average net loans and acceptances(8) 0.49 0.41 0.45
Common share information
Closing share price ($) (TSX) 75.54 70.65 83.28
Shares outstanding (millions)
Average – Basic 1,222 1,213 1,203
Average – Diluted 1,251 1,229 1,223
End of period 1,216 1,227 1,199
Dividends paid per share ($) 3.49 3.28 3.05
Dividend yield (%)(9) 4.9 4.2 4.0
Market capitalization ($ millions) (TSX) 91,867 86,690 99,872
Book value per common share ($) 52.33 49.75 46.24
Market value to book value multiple 1.4 1.4 1.8
Price to earnings multiple (trailing 4 quarters) 11.2 10.2 12.7
Other information
Employees (full-time equivalent)(4) 101,813 97,021 87,761
Branches and offices 3,109 3,095 3,003
(1) The amounts for the years ended October 31, 2019 and October 31, 2018 have been prepared in accordance with IFRS 9; prior year amounts have not been restated.
(2) The amounts for the year ended October 31, 2019 have been prepared in accordance with IFRS 15, prior year amounts have not been restated.
(3) Refer to page 15 for a discussion of Non-GAAP measures.
(4) Prior period amounts have been restated to conform with current period presentation.
(5) In accordance with OSFI’s requirements, effective January 31, 2019, credit valuation adjustment (CVA) risk-weighted assets (RWA) have been fully phased-in. In the prior year, CVA RWA were calculated using scalars of 0.80, 0.83 and 0.86 in 2018 and scalars of 0.72, 0.77
and 0.81 in 2017 to compute the CET1 capital ratio, Tier 1 capital ratio and Total capital ratio, respectively.
(6) Excludes loans acquired under the Federal Deposit Insurance Corporation (FDIC) guarantee related to the acquisition of R-G Premier Bank of Puerto Rico, prior to 2018.
(7) Includes allowance for credit losses on all financial assets – loans, acceptances, off-balance sheet exposures, debt securities, and deposits with financial institutions.
(8) Includes provision for credit losses on certain financial assets – loans, acceptances, and off-balance sheet exposures.
(9) Based on the average of the high and low common share price for the year.
2019 Scotiabank Annual Report | 21
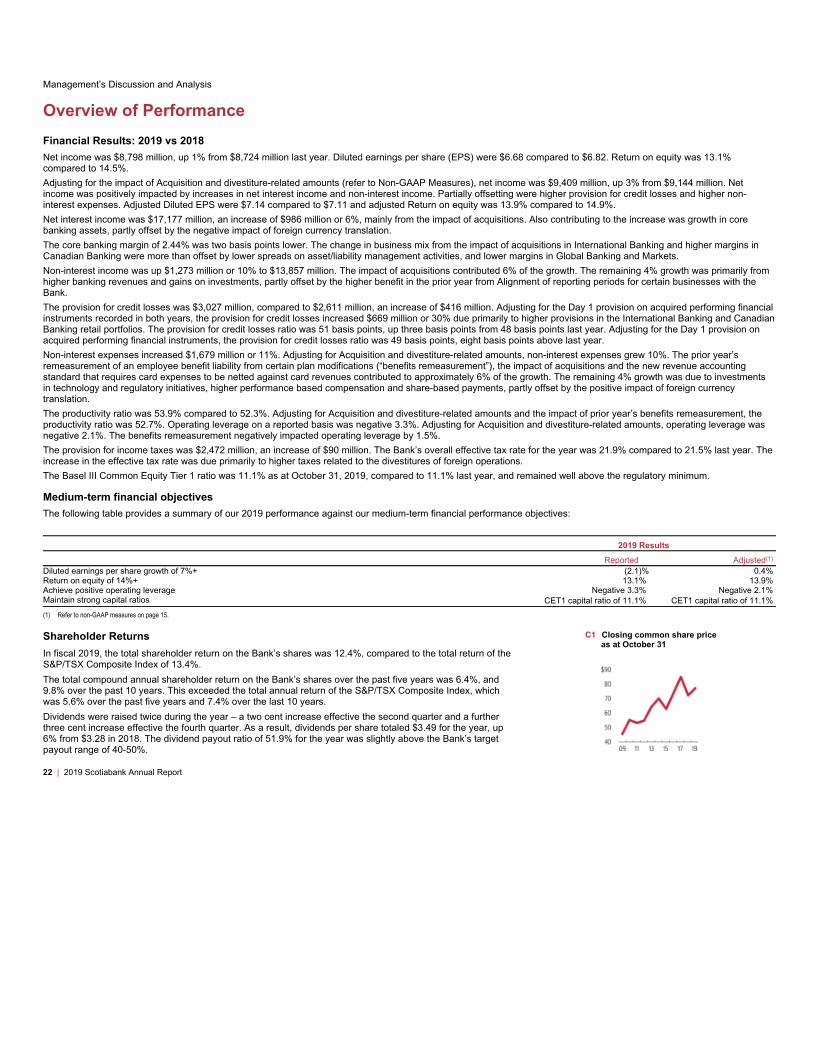
Management’s Discussion and Analysis
Overview of Performance Financial Results: 2019 vs 2018 Net income was $8,798 million, up 1% from $8,724 million last year. Diluted earnings per share (EPS) were $6.68 compared to $6.82. Return on equity was 13.1%
compared to 14.5%.
Adjusting for the impact of Acquisition and divestiture-related amounts (refer to Non-GAAP Measures), net income was $9,409 million, up 3% from $9,144 million. Net
income was positively impacted by increases in net interest income and non-interest income. Partially offsetting were higher provision for credit losses and higher non-
interest expenses. Adjusted Diluted EPS were $7.14 compared to $7.11 and adjusted Return on equity was 13.9% compared to 14.9%.
Net interest income was $17,177 million, an increase of $986 million or 6%, mainly from the impact of acquisitions. Also contributing to the increase was growth in core
banking assets, partly offset by the negative impact of foreign currency translation.
The core banking margin of 2.44% was two basis points lower. The change in business mix from the impact of acquisitions in International Banking and higher margins in
Canadian Banking were more than offset by lower spreads on asset/liability management activities, and lower margins in Global Banking and Markets.
Non-interest income was up $1,273 million or 10% to $13,857 million. The impact of acquisitions contributed 6% of the growth. The remaining 4% growth was primarily from
higher banking revenues and gains on investments, partly offset by the higher benefit in the prior year from Alignment of reporting periods for certain businesses with the
Bank.
The provision for credit losses was $3,027 million, compared to $2,611 million, an increase of $416 million. Adjusting for the Day 1 provision on acquired performing financial
instruments recorded in both years, the provision for credit losses increased $669 million or 30% due primarily to higher provisions in the International Banking and Canadian
Banking retail portfolios. The provision for credit losses ratio was 51 basis points, up three basis points from 48 basis points last year. Adjusting for the Day 1 provision on
acquired performing financial instruments, the provision for credit losses ratio was 49 basis points, eight basis points above last year.
Non-interest expenses increased $1,679 million or 11%. Adjusting for Acquisition and divestiture-related amounts, non-interest expenses grew 10%. The prior year’s
remeasurement of an employee benefit liability from certain plan modifications (“benefits remeasurement”), the impact of acquisitions and the new revenue accounting
standard that requires card expenses to be netted against card revenues contributed to approximately 6% of the growth. The remaining 4% growth was due to investments
in technology and regulatory initiatives, higher performance based compensation and share-based payments, partly offset by the positive impact of foreign currency
translation.
The productivity ratio was 53.9% compared to 52.3%. Adjusting for Acquisition and divestiture-related amounts and the impact of prior year’s benefits remeasurement, the
productivity ratio was 52.7%. Operating leverage on a reported basis was negative 3.3%. Adjusting for Acquisition and divestiture-related amounts, operating leverage was
negative 2.1%. The benefits remeasurement negatively impacted operating leverage by 1.5%.
The provision for income taxes was $2,472 million, an increase of $90 million. The Bank’s overall effective tax rate for the year was 21.9% compared to 21.5% last year. The
increase in the effective tax rate was due primarily to higher taxes related to the divestitures of foreign operations.
The Basel III Common Equity Tier 1 ratio was 11.1% as at October 31, 2019, compared to 11.1% last year, and remained well above the regulatory minimum.
Medium-term financial objectives The following table provides a summary of our 2019 performance against our medium-term financial performance objectives:
2019 Results
Reported Adjusted(1)
Diluted earnings per share growth of 7%+ (2.1)% 0.4%
Return on equity of 14%+ 13.1% 13.9%
Achieve positive operating leverage Negative 3.3% Negative 2.1%
Maintain strong capital ratios CET1 capital ratio of 11.1% CET1 capital ratio of 11.1%
(1) Refer to non-GAAP measures on page 15.
Shareholder ReturnsIn fiscal 2019, the total shareholder return on the Bank’s shares was 12.4%, compared to the total return of the
S&P/TSX Composite Index of 13.4%.
The total compound annual shareholder return on the Bank’s shares over the past five years was 6.4%, and
9.8% over the past 10 years. This exceeded the total annual return of the S&P/TSX Composite Index, which
was 5.6% over the past five years and 7.4% over the last 10 years.
Dividends were raised twice during the year – a two cent increase effective the second quarter and a further
three cent increase effective the fourth quarter. As a result, dividends per share totaled $3.49 for the year, up
6% from $3.28 in 2018. The dividend payout ratio of 51.9% for the year was slightly above the Bank’s target
payout range of 40-50%.
C1 Closing common share priceas at October 31
22 | 2019 Scotiabank Annual Report

Management’s Discussion and Analysis | Overview of Performance
Economic Outlook
Global uncertainty remains elevated owing largely to developments in US trade policy. The trade conflict between China and the US is now clearly affecting global business
sentiment and activity, and indications are that this uncertainty will continue for some time. Partly in response to these developments, and to counter further negative
developments, a number of central banks have been cutting interest rates. We expect this to continue over the next several months.
There are signs that external challenges are having a material impact on Canadian growth but activity remains solid in light of strong population growth, remarkably robust
employment growth, very accommodative monetary policy, strengthening activity in the housing market, and still-high business and consumer confidence. Inventory levels
are high, however, and we believe Canada is not immune to the ramifications of higher uncertainty and lower global growth. Inflation remains firmly at the Bank of Canada’s
target for the moment, though the rapid increase in wage growth may put upward pressure on inflation going forward. We believe that even though inflation is on target,
mounting external risks to the outlook may prompt the Bank of Canada to join other central banks and cut policy rates by 50 basis points by mid 2020 as it insures against
these risks.
There are now clear indications that trade uncertainty is affecting the US business sector. Indicators of business activity are pointing to a contraction in the manufacturing
sector, even as confidence remains generally resilient. In conjunction with the waning impacts of the 2018 fiscal stimulus package, the increase in uncertainty is leading to a
slowdown in US growth. The Federal Reserve is expected to cut its policy rates one more time in 2020, as US growth is expected to slow through the remainder of this year
and into 2020.
The trade tensions between China and the US are being felt in the Pacific Alliance countries, as the price of important regional commodities has fallen sharply over the year.
Adding to these issues are political developments, challenges in executing key reforms, as well as the impact of implemented reforms in Mexico. Social unrest and the
associated political and economic developments are weighing on the Chilean outlook. As a result, forecasts for the region have deteriorated along with that of most of the
global economy. Importantly, however, growth prospects for PAC countries in general remain much more solid than prospects for advanced economies.
Impact of Foreign Currency Translation
The impact of foreign currency translation on net income is shown in the table below.
T5 Impact of foreign currency translation
2019 2018 2017
For the fiscal years
Average
exchange rate % Change
Average
exchange rate % Change
Average
exchange rate % Change
U.S. Dollar/Canadian Dollar 0.753 (3.2)% 0.777 1.6% 0.765 1.4%
Mexican Peso/Canadian Dollar 14.607 (1.3)% 14.802 1.3% 14.608 6.9%
Peruvian Sol/Canadian Dollar 2.512 (1.0)% 2.538 1.0% 2.513 (1.0)%
Colombian Peso/Canadian Dollar 2,447 7.7% 2,272 0.3% 2,265 (1.8)%
Chilean Peso/Canadian Dollar 517.805 5.1% 492.892 (1.4)% 500.108 (2.8)%
Impact on net income(1) ($ millions except EPS)
2019
vs. 2018
2018
vs. 2017
2017
vs. 2016
Net interest income $ (52) $ (101) $ (112)
Non-interest income(2) 30 (21) (65)
Non-interest expenses 60 85 99
Other items (net of tax) 22 17 18
Net income $ 60 $ (20) $ (60)
Earnings per share (diluted) $ 0.05 $ (0.02) $ (0.05)
Impact by business line ($ millions)
Canadian Banking $ 7 $ (4) $ (4)
International Banking(2) 51 (46) (14)
Global Banking and Markets 28 (12) (12)
Other(2) (26) 42 (30)
$ 60 $ (20) $ (60)
(1) Includes impact of all currencies.
(2) Includes the impact of foreign currency hedges.
2019 Scotiabank Annual Report | 23
T4 Shareholder returns
For the years ended October 31 2019 2018 2017
Closing market price per common share ($) 75.54 70.65 83.28
Dividends paid ($ per share) 3.49 3.28 3.05
Dividend yield (%)(1) 4.9 4.2 4.0
Increase (decrease) in share price (%) 6.9 (15.2) 15.5
Total annual shareholder return (%)(2) 12.4 (11.6) 20.3
(1) Dividend yield is calculated as the dividend paid divided by the average of the high and low common share price for the year.
(2) Total annual shareholder return assumes reinvestment of quarterly dividends, and therefore may not equal the sum of dividend and share price returns in the table.
C2 Return to common shareholders Share price
appreciation plus dividends reinvested, 2009=100
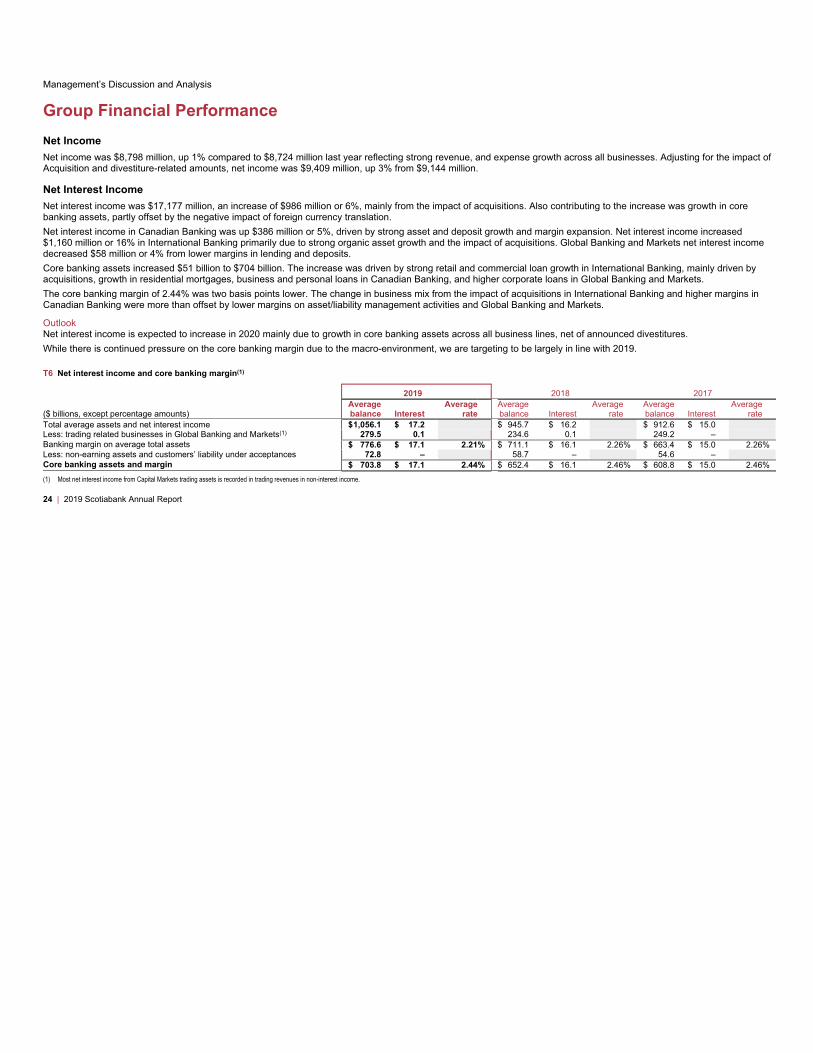
Management’s Discussion and Analysis
Group Financial Performance
Net Income
Net income was $8,798 million, up 1% compared to $8,724 million last year reflecting strong revenue, and expense growth across all businesses. Adjusting for the impact of
Acquisition and divestiture-related amounts, net income was $9,409 million, up 3% from $9,144 million.
Net Interest Income
Net interest income was $17,177 million, an increase of $986 million or 6%, mainly from the impact of acquisitions. Also contributing to the increase was growth in core
banking assets, partly offset by the negative impact of foreign currency translation.
Net interest income in Canadian Banking was up $386 million or 5%, driven by strong asset and deposit growth and margin expansion. Net interest income increased
$1,160 million or 16% in International Banking primarily due to strong organic asset growth and the impact of acquisitions. Global Banking and Markets net interest income
decreased $58 million or 4% from lower margins in lending and deposits.
Core banking assets increased $51 billion to $704 billion. The increase was driven by strong retail and commercial loan growth in International Banking, mainly driven by
acquisitions, growth in residential mortgages, business and personal loans in Canadian Banking, and higher corporate loans in Global Banking and Markets.
The core banking margin of 2.44% was two basis points lower. The change in business mix from the impact of acquisitions in International Banking and higher margins in
Canadian Banking were more than offset by lower margins on asset/liability management activities and Global Banking and Markets.
Outlook
Net interest income is expected to increase in 2020 mainly due to growth in core banking assets across all business lines, net of announced divestitures.
While there is continued pressure on the core banking margin due to the macro-environment, we are targeting to be largely in line with 2019.
T6 Net interest income and core banking margin(1)
2019 2018 2017
($ billions, except percentage amounts)
Average
balance Interest
Average
rate
Average
balance Interest
Average
rate
Average
balance Interest
Average
rate
Total average assets and net interest income $1,056.1 $ 17.2 $ 945.7 $ 16.2 $ 912.6 $ 15.0
Less: trading related businesses in Global Banking and Markets(1) 279.5 0.1 234.6 0.1 249.2 –
Banking margin on average total assets $ 776.6 $ 17.1 2.21% $ 711.1 $ 16.1 2.26% $ 663.4 $ 15.0 2.26%
Less: non-earning assets and customers’ liability under acceptances 72.8 – 58.7 – 54.6 –
Core banking assets and margin $ 703.8 $ 17.1 2.44% $ 652.4 $ 16.1 2.46% $ 608.8 $ 15.0 2.46%
(1) Most net interest income from Capital Markets trading assets is recorded in trading revenues in non-interest income.
24 | 2019 Scotiabank Annual Report
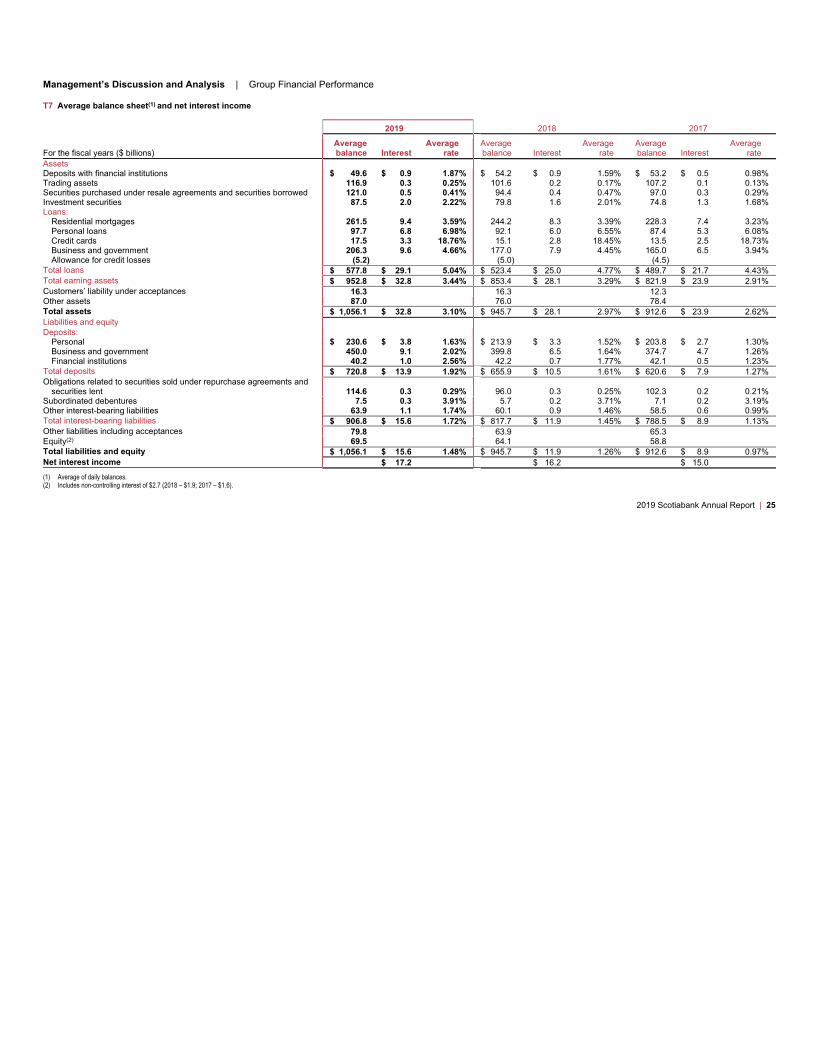
Management’s Discussion and Analysis | Group Financial Performance
T7 Average balance sheet(1) and net interest income
2019 2018 2017
For the fiscal years ($ billions)
Average
balance Interest
Average
rate
Average
balance Interest
Average
rate
Average
balance Interest
Average
rate
Assets
Deposits with financial institutions $ 49.6 $ 0.9 1.87% $ 54.2 $ 0.9 1.59% $ 53.2 $ 0.5 0.98%
Trading assets 116.9 0.3 0.25% 101.6 0.2 0.17% 107.2 0.1 0.13%
Securities purchased under resale agreements and securities borrowed 121.0 0.5 0.41% 94.4 0.4 0.47% 97.0 0.3 0.29%
Investment securities 87.5 2.0 2.22% 79.8 1.6 2.01% 74.8 1.3 1.68%
Loans:
Residential mortgages 261.5 9.4 3.59% 244.2 8.3 3.39% 228.3 7.4 3.23%
Personal loans 97.7 6.8 6.98% 92.1 6.0 6.55% 87.4 5.3 6.08%
Credit cards 17.5 3.3 18.76% 15.1 2.8 18.45% 13.5 2.5 18.73%
Business and government 206.3 9.6 4.66% 177.0 7.9 4.45% 165.0 6.5 3.94%
Allowance for credit losses (5.2) (5.0) (4.5)
Total loans $ 577.8 $ 29.1 5.04% $ 523.4 $ 25.0 4.77% $ 489.7 $ 21.7 4.43%
Total earning assets $ 952.8 $ 32.8 3.44% $ 853.4 $ 28.1 3.29% $ 821.9 $ 23.9 2.91%
Customers’ liability under acceptances 16.3 16.3 12.3
Other assets 87.0 76.0 78.4
Total assets $ 1,056.1 $ 32.8 3.10% $ 945.7 $ 28.1 2.97% $ 912.6 $ 23.9 2.62%
Liabilities and equity
Deposits:
Personal $ 230.6 $ 3.8 1.63% $ 213.9 $ 3.3 1.52% $ 203.8 $ 2.7 1.30%
Business and government 450.0 9.1 2.02% 399.8 6.5 1.64% 374.7 4.7 1.26%
Financial institutions 40.2 1.0 2.56% 42.2 0.7 1.77% 42.1 0.5 1.23%
Total deposits $ 720.8 $ 13.9 1.92% $ 655.9 $ 10.5 1.61% $ 620.6 $ 7.9 1.27%
Obligations related to securities sold under repurchase agreements and
securities lent 114.6 0.3 0.29% 96.0 0.3 0.25% 102.3 0.2 0.21%
Subordinated debentures 7.5 0.3 3.91% 5.7 0.2 3.71% 7.1 0.2 3.19%
Other interest-bearing liabilities 63.9 1.1 1.74% 60.1 0.9 1.46% 58.5 0.6 0.99%
Total interest-bearing liabilities $ 906.8 $ 15.6 1.72% $ 817.7 $ 11.9 1.45% $ 788.5 $ 8.9 1.13%
Other liabilities including acceptances 79.8 63.9 65.3
Equity(2) 69.5 64.1 58.8
Total liabilities and equity $ 1,056.1 $ 15.6 1.48% $ 945.7 $ 11.9 1.26% $ 912.6 $ 8.9 0.97%
Net interest income $ 17.2 $ 16.2 $ 15.0
(1) Average of daily balances.
(2) Includes non-controlling interest of $2.7 (2018 – $1.9; 2017 – $1.6).
2019 Scotiabank Annual Report | 25
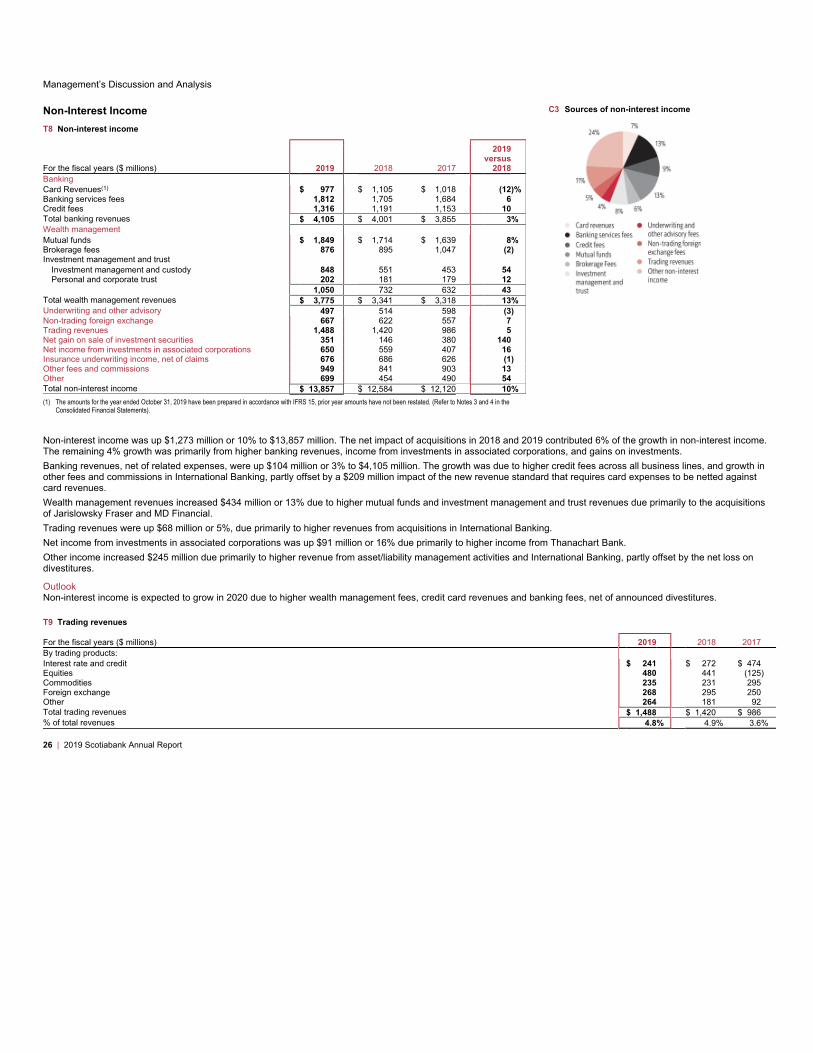
Management’s Discussion and Analysis
Non-interest income was up $1,273 million or 10% to $13,857 million. The net impact of acquisitions in 2018 and 2019 contributed 6% of the growth in non-interest income.
The remaining 4% growth was primarily from higher banking revenues, income from investments in associated corporations, and gains on investments.
Banking revenues, net of related expenses, were up $104 million or 3% to $4,105 million. The growth was due to higher credit fees across all business lines, and growth in
other fees and commissions in International Banking, partly offset by a $209 million impact of the new revenue standard that requires card expenses to be netted against
card revenues.
Wealth management revenues increased $434 million or 13% due to higher mutual funds and investment management and trust revenues due primarily to the acquisitions
of Jarislowsky Fraser and MD Financial.
Trading revenues were up $68 million or 5%, due primarily to higher revenues from acquisitions in International Banking.
Net income from investments in associated corporations was up $91 million or 16% due primarily to higher income from Thanachart Bank.
Other income increased $245 million due primarily to higher revenue from asset/liability management activities and International Banking, partly offset by the net loss on
divestitures.
Outlook
Non-interest income is expected to grow in 2020 due to higher wealth management fees, credit card revenues and banking fees, net of announced divestitures.
T9 Trading revenues
For the fiscal years ($ millions) 2019 2018 2017
By trading products:
Interest rate and credit $ 241 $ 272 $ 474
Equities 480 441 (125)
Commodities 235 231 295
Foreign exchange 268 295 250
Other 264 181 92
Total trading revenues $ 1,488 $ 1,420 $ 986
% of total revenues 4.8% 4.9% 3.6%
26 | 2019 Scotiabank Annual Report
Non-Interest Income
T8 Non-interest income
For the fiscal years ($ millions) 2019 2018 2017
2019
versus
2018
Banking
Card Revenues(1) $ 977 $ 1,105 $ 1,018 (12)%
Banking services fees 1,812 1,705 1,684 6
Credit fees 1,316 1,191 1,153 10
Total banking revenues $ 4,105 $ 4,001 $ 3,855 3%
Wealth management
Mutual funds $ 1,849 $ 1,714 $ 1,639 8%
Brokerage fees 876 895 1,047 (2)
Investment management and trust
Investment management and custody 848 551 453 54
Personal and corporate trust 202 181 179 12
1,050 732 632 43
Total wealth management revenues $ 3,775 $ 3,341 $ 3,318 13%
Underwriting and other advisory 497 514 598 (3)
Non-trading foreign exchange 667 622 557 7
Trading revenues 1,488 1,420 986 5
Net gain on sale of investment securities 351 146 380 140
Net income from investments in associated corporations 650 559 407 16
Insurance underwriting income, net of claims 676 686 626 (1)
Other fees and commissions 949 841 903 13
Other 699 454 490 54
Total non-interest income $ 13,857 $ 12,584 $ 12,120 10%
(1) The amounts for the year ended October 31, 2019 have been prepared in accordance with IFRS 15, prior year amounts have not been restated. (Refer to Notes 3 and 4 in the
Consolidated Financial Statements).
C3 Sources of non-interest income
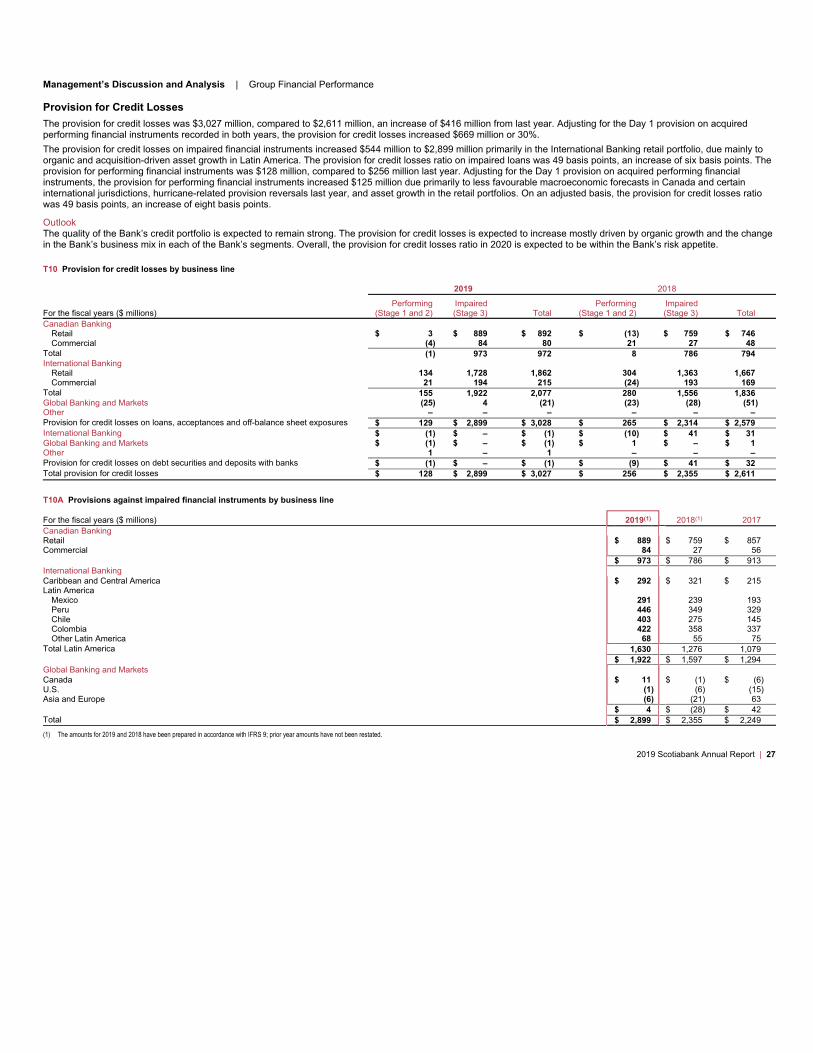
Management’s Discussion and Analysis | Group Financial Performance
Provision for Credit Losses
The provision for credit losses was $3,027 million, compared to $2,611 million, an increase of $416 million from last year. Adjusting for the Day 1 provision on acquired
performing financial instruments recorded in both years, the provision for credit losses increased $669 million or 30%.
The provision for credit losses on impaired financial instruments increased $544 million to $2,899 million primarily in the International Banking retail portfolio, due mainly to
organic and acquisition-driven asset growth in Latin America. The provision for credit losses ratio on impaired loans was 49 basis points, an increase of six basis points. The
provision for performing financial instruments was $128 million, compared to $256 million last year. Adjusting for the Day 1 provision on acquired performing financial
instruments, the provision for performing financial instruments increased $125 million due primarily to less favourable macroeconomic forecasts in Canada and certain
international jurisdictions, hurricane-related provision reversals last year, and asset growth in the retail portfolios. On an adjusted basis, the provision for credit losses ratio
was 49 basis points, an increase of eight basis points.
Outlook
The quality of the Bank’s credit portfolio is expected to remain strong. The provision for credit losses is expected to increase mostly driven by organic growth and the change
in the Bank’s business mix in each of the Bank’s segments. Overall, the provision for credit losses ratio in 2020 is expected to be within the Bank’s risk appetite.
T10 Provision for credit losses by business line
2019 2018
For the fiscal years ($ millions)
Performing
(Stage 1 and 2)
Impaired
(Stage 3) Total
Performing
(Stage 1 and 2)
Impaired
(Stage 3) Total
Canadian Banking
Retail $ 3 $ 889 $ 892 $ (13) $ 759 $ 746
Commercial (4) 84 80 21 27 48
Total (1) 973 972 8 786 794
International Banking
Retail 134 1,728 1,862 304 1,363 1,667
Commercial 21 194 215 (24) 193 169
Total 155 1,922 2,077 280 1,556 1,836
Global Banking and Markets (25) 4 (21) (23) (28) (51)
Other – – – – – –
Provision for credit losses on loans, acceptances and off-balance sheet exposures $ 129 $ 2,899 $ 3,028 $ 265 $ 2,314 $ 2,579
International Banking $ (1) $ – $ (1) $ (10) $ 41 $ 31
Global Banking and Markets $ (1) $ – $ (1) $ 1 $ – $ 1
Other 1 – 1 – – –
Provision for credit losses on debt securities and deposits with banks $ (1) $ – $ (1) $ (9) $ 41 $ 32
Total provision for credit losses $ 128 $ 2,899 $ 3,027 $ 256 $ 2,355 $ 2,611
T10A Provisions against impaired financial instruments by business line
For the fiscal years ($ millions) 2019(1) 2018(1) 2017
Canadian Banking
Retail $ 889 $ 759 $ 857
Commercial 84 27 56
$ 973 $ 786 $ 913
International Banking
Caribbean and Central America $ 292 $ 321 $ 215
Latin America
Mexico 291 239 193
Peru 446 349 329
Chile 403 275 145
Colombia 422 358 337
Other Latin America 68 55 75
Total Latin America 1,630 1,276 1,079
$ 1,922 $ 1,597 $ 1,294
Global Banking and Markets
Canada $ 11 $ (1) $ (6)
U.S. (1) (6) (15)
Asia and Europe (6) (21) 63
$ 4 $ (28) $ 42
Total $ 2,899 $ 2,355 $ 2,249
(1) The amounts for 2019 and 2018 have been prepared in accordance with IFRS 9; prior year amounts have not been restated.
2019 Scotiabank Annual Report | 27
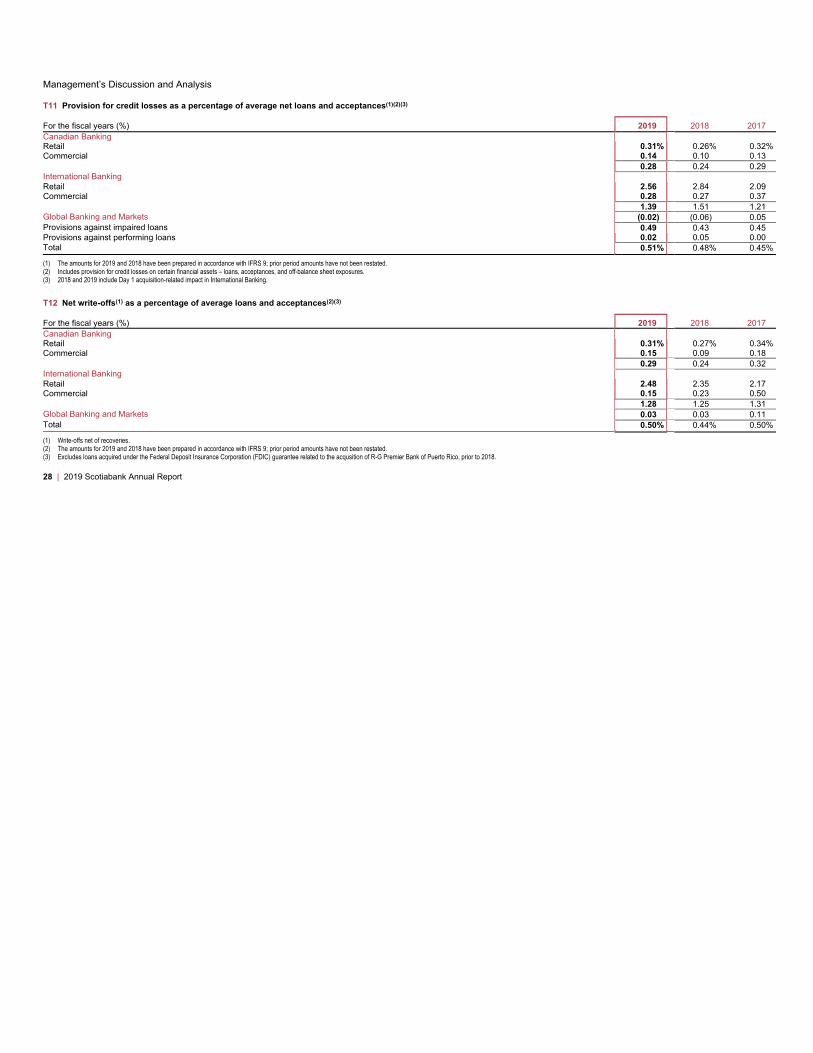
Management’s Discussion and Analysis
T11 Provision for credit losses as a percentage of average net loans and acceptances(1)(2)(3)
For the fiscal years (%) 2019 2018 2017
Canadian Banking
Retail 0.31% 0.26% 0.32%
Commercial 0.14 0.10 0.13
0.28 0.24 0.29
International Banking
Retail 2.56 2.84 2.09
Commercial 0.28 0.27 0.37
1.39 1.51 1.21
Global Banking and Markets (0.02) (0.06) 0.05
Provisions against impaired loans 0.49 0.43 0.45
Provisions against performing loans 0.02 0.05 0.00
Total 0.51% 0.48% 0.45%
(1) The amounts for 2019 and 2018 have been prepared in accordance with IFRS 9; prior period amounts have not been restated.
(2) Includes provision for credit losses on certain financial assets – loans, acceptances, and off-balance sheet exposures.
(3) 2018 and 2019 include Day 1 acquisition-related impact in International Banking.
T12 Net write-offs(1) as a percentage of average loans and acceptances(2)(3)
For the fiscal years (%) 2019 2018 2017
Canadian Banking
Retail 0.31% 0.27% 0.34%
Commercial 0.15 0.09 0.18
0.29 0.24 0.32
International Banking
Retail 2.48 2.35 2.17
Commercial 0.15 0.23 0.50
1.28 1.25 1.31
Global Banking and Markets 0.03 0.03 0.11
Total 0.50% 0.44% 0.50%
(1) Write-offs net of recoveries.
(2) The amounts for 2019 and 2018 have been prepared in accordance with IFRS 9; prior period amounts have not been restated.
(3) Excludes loans acquired under the Federal Deposit Insurance Corporation (FDIC) guarantee related to the acqusition of R-G Premier Bank of Puerto Rico, prior to 2018.
28 | 2019 Scotiabank Annual Report

Management’s Discussion and Analysis | Group Financial Performance
2019 Scotiabank Annual Report | 29
Non-Interest Expenses
T13 Non-interest expenses and productivity
For the fiscal years ($ millions) 2019 2018 2017
2019
versus
2018
Salaries and employee benefits
Salaries $ 4,939 $ 4,454 $ 4,220 11%
Performance-based compensation 1,761 1,624 1,599 8
Share-based payments 278 192 209 45
Other employee benefits 1,465 1,185 1,347 24
$ 8,443 $ 7,455 $ 7,375 13%
Premises and technology
Premises
Occupancy 527 477 444 10
Property taxes 95 98 93 (3)
Other premises costs 458 437 432 5
$ 1,080 $ 1,012 $ 969 7%
Technology $ 1,727 $ 1,565 $ 1,467 10%
$ 2,807 $ 2,577 $ 2,436 9%
Depreciation and amortization
Depreciation 402 354 340 14
Amortization of intangible assets 651 494 421 32
$ 1,053 $ 848 $ 761 24%
Communications $ 459 $ 447 $ 437 3%
Advertising and business development $ 625 $ 581 $ 581 8%
Professional $ 861 $ 881 $ 775 (2)%
Business and capital taxes
Business taxes 471 419 383 12
Capital taxes 44 45 40 (2)
$ 515 $ 464 $ 423 11%
Other $ 1,974 $ 1,805 $ 1,842 9%
Total non-interest expenses $ 16,737 $ 15,058 $ 14,630 11%
Productivity ratio 53.9% 52.3% 53.9%
C4 Non-interest expenses $ millions
C5 Direct and indirect taxes $ millions

Management’s Discussion and Analysis
Non-interest expenses increased $1,679 million or 11%. Adjusting for Acquisition and divestiture-related costs, non-interest expenses grew 10%. The prior year’s
remeasurement of an employee benefit liability from certain plan modifications (“benefits remeasurement”), the impact of acquisitions and the new revenue accounting
standard that requires card expenses to be netted against card revenues contributed to approximately 6% of the growth. The remaining 4% growth was due to investments
in technology and regulatory initiatives, higher performance based compensation and share-based payments, partly offset by the positive impact of foreign currency
translation.
The Bank’s total technology cost, that includes Technology expenses in Table T13 and those included within Salaries, Professional, Amortization of Intangible Assets and
Depreciation, was approximately $3.6 billion, an increase of 7% compared to 2018. This reflects our continued investment in modernization and technology, including
cybersecurity.
The productivity ratio was 53.9% compared to 52.3%. Adjusting for Acquisition and divestiture-related amounts and the impact of prior year’s benefits remeasurement, the
productivity ratio was 52.7% compared to 52.4%. Operating leverage on a reported basis was negative 3.3%. Adjusting for Acquisition and divestiture-related amounts,
operating leverage was negative 2.1%. The benefits remeasurement negatively impacted operating leverage by 1.5%.
Outlook
While Non-interest expense are expected to rise in 2020 in support of business growth initiatives and continued technology and regulatory investments, the growth will be
partly offset by further savings from efficiency initiatives. Expense management and delivery of positive operating leverage remain key business priorities.
Income Taxes
The provision for income taxes was $2,472 million, an increase of $90 million. The effective tax rate increased marginally to 21.9% compared to 21.5% due primarily to
higher taxes related to the divestitures of foreign operations partially offset by higher tax-exempt income.
Outlook
The Bank’s consolidated effective tax rate is expected to be in the range of 21% to 25% in 2020.
30 | 2019 Scotiabank Annual Report

Management’s Discussion and Analysis | Group Financial Performance
Financial Results Review: 2018 vs. 2017
In order to identify key business trends between 2018 and 2017, commentary and the related financial results are below.
Net income
Net income was $8,724 million in 2018, up 6% from $8,243 million in 2017. Diluted earnings per share (EPS) were $6.82 compared to $6.49, up 5%. Return on equity
was 14.5% compared to 14.6%.
Adjusting for the impact of Acquisition-related costs (refer to Non-GAAP Measures), net income was $9,144 million, up 10% from $8,303 million. Net income was
positively impacted by increases in net interest income and trading revenues, as well as lower provision for credit losses. Partially offsetting were lower gains on sale of
real estate and investment securities, and a higher effective tax rate. Adjusted Diluted EPS were $7.11 compared to $6.54, up 9%. Adjusted Return on equity was
14.9% compared to 14.7%.
Net interest income
Net interest income was $16,191 million in 2018, an increase of $1,156 million or 8% from strong growth in Canadian Banking and International Banking including the
2% impact of acquisitions. This was partly offset by the negative impact of foreign currency translation.
Non-interest income
Non-interest income was $12,584 million in 2018, up $464 million or 4%. The impact of the sale of the HollisWealth business (“Sale of Business”) in 2017, net of the
benefit from 2018 acquisitions, reduced non-interest income by 1%. The remaining 5% growth was from higher banking and credit card fees, trading revenues, income
from associated corporations and the benefit from an additional month of income for certain businesses from the alignment of reporting period with the Bank
(“Alignment of reporting period”). This was partly offset by lower gains on the sale of real estate and investment securities.
Provision for credit losses
Provision for credit losses was $2,611 million, an increase of $362 million from 2017. Adjusting for the Day 1 provision on acquired performing financial instruments, the
provision for credit losses decreased $42 million, due primarily to lower provisions in Canadian Banking and Global Banking and Markets, offset by higher provisions in
International Banking. The provision for credit losses ratio was 48 basis points, up three basis points from 45 basis points in 2017. Adjusting for the Day 1 provision on
acquired performing financial instruments, the provision for credit losses ratio decreased four basis points to 41 basis points.
Non-interest expenses
Non-interest expenses were $15,058 million in 2018, an increase of $428 million or 3%. Adjusting for Acquisition-related costs, non-interest expenses increased 2%.
The impact of the acquisitions was more than offset by the benefit from the Sale of Business in 2017. The remaining increase was due to higher investments in
technology and regulatory initiatives and higher business taxes, partly offset by the accounting benefit driven by remeasurement of an employee benefit liability
(“benefits remeasurement”), and the positive impact of foreign currency translation.
Income taxes
The provision for income taxes was $2,382 million in 2018, an increase of $349 million. The Bank’s overall effective tax rate for 2018 was 21.5% compared to 19.8% for
2017. The increase in the effective tax rate was due primarily to higher tax-exempt income from client-driven equity trading activities in 2017, partially offset by lower
taxes in certain foreign jurisdictions in 2018.
T14 Financial Results Review
For the year ended October 31, 2018 ($ millions)(1)
Canadian
Banking
International
Banking
Global Banking
and Markets Other(2) Total
Net interest income $ 7,898 $ 7,322 $ 1,454 $ (483) $ 16,191
Non-interest income 5,452 4,111 3,074 (53) 12,584
Total revenue $ 13,350 $ 11,433 $ 4,528 $ (536) $ 28,775
Provision for credit losses 794 1,867 (50) – 2,611
Non-interest expenses 6,654 6,111 2,233 60 15,058
Income tax expense 1,538 706 587 (449) 2,382
Net income $ 4,364 $ 2,749 $ 1,758 $ (147) $ 8,724
Net income attributable to non-controlling interests – 176 – – 176
Net income attributable to equity holders of the Bank $ 4,364 $ 2,573 $ 1,758 $ (147) $ 8,548
(1) Taxable equivalent basis. Refer to Glossary.
(2) Includes all other smaller operating segments, including Group Treasury, and corporate adjustments, such as the elimination of the tax-exempt income gross-up reported in net interest income, non-interest income and provision for income taxes for the year ended
October 31, 2018 – $112 to arrive at the amounts reported in Consolidated Statement of Income, and differences in the actual amount of costs incurred and charged to the operating segments.
2019 Scotiabank Annual Report | 31

Management’s Discussion and Analysis
For the year ended October 31, 2017 ($ millions)(1)
Canadian
Banking
International
Banking
Global Banking
and Markets
Other
(2) Total
Net interest income $ 7,363 $ 6,726 $ 1,336 $ (390) $ 15,035
Non-interest income 5,488 3,688 3,288 (344) 12,120
Total revenue $ 12,851 $ 10,414 $ 4,624 $ (734) $ 27,155
Provision for credit losses 913 1,294 42 – 2,249
Non-interest expenses 6,487 5,664 2,160 319 14,630
Income tax expense 1,387 828 604 (786) 2,033
Net income $ 4,064 $ 2,628 $ 1,818 $ (267) $ 8,243
Net income attributable to non-controlling interests – 238 – – 238
Net income attributable to equity holders of the Bank $ 4,064 $ 2,390 $ 1,818 $ (267) $ 8,005
(1) Taxable equivalent basis. Refer to Glossary.
(2) Includes all other smaller operating segments, including Group Treasury, and corporate adjustments, such as the elimination of the tax-exempt income gross-up reported in net interest income, non-interest income and provision for income taxes for the year ended
October 31, 2017 – $562 to arrive at the amounts reported in Consolidated Statement of Income, and differences in the actual amount of costs incurred and charged to the operating segments.
32 | 2019 Scotiabank Annual Report
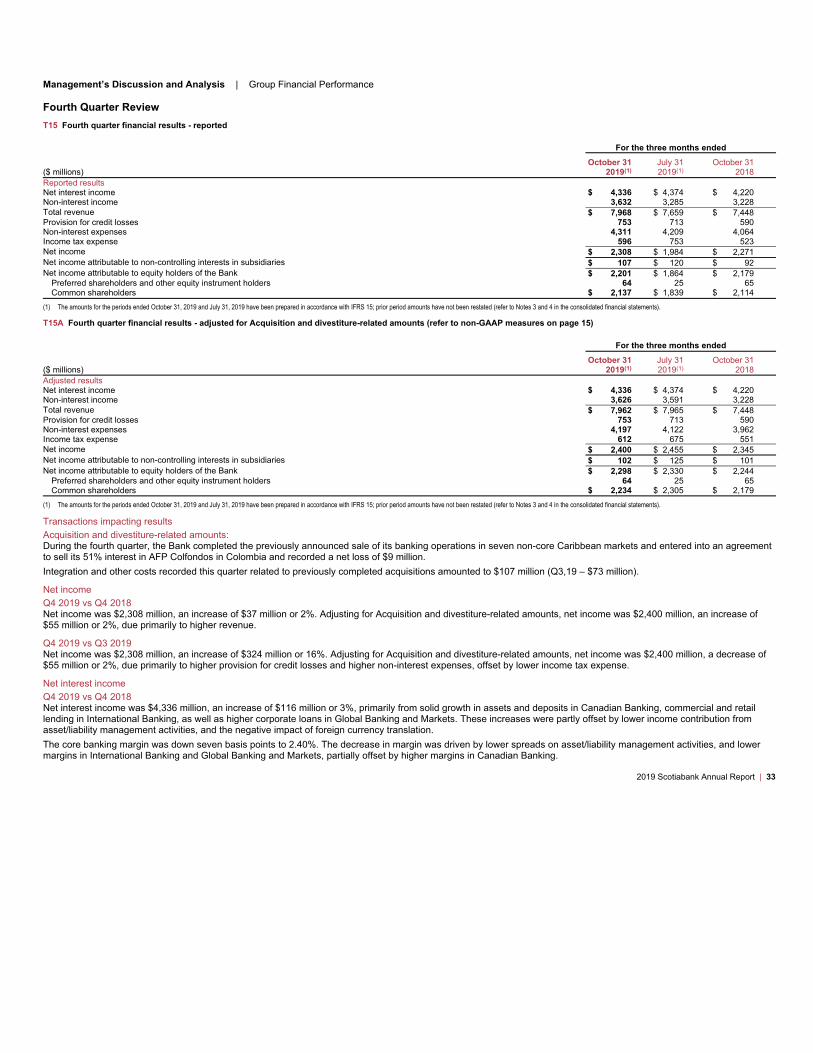
Management’s Discussion and Analysis | Group Financial Performance
Fourth Quarter Review
T15 Fourth quarter financial results - reported
For the three months ended
($ millions)
October 31
2019(1)
July 31
2019(1)
October 31
2018
Reported results
Net interest income $ 4,336 $ 4,374 $ 4,220
Non-interest income 3,632 3,285 3,228
Total revenue $ 7,968 $ 7,659 $ 7,448
Provision for credit losses 753 713 590
Non-interest expenses 4,311 4,209 4,064
Income tax expense 596 753 523
Net income $ 2,308 $ 1,984 $ 2,271
Net income attributable to non-controlling interests in subsidiaries $ 107 $ 120 $ 92
Net income attributable to equity holders of the Bank $ 2,201 $ 1,864 $ 2,179
Preferred shareholders and other equity instrument holders 64 25 65
Common shareholders $ 2,137 $ 1,839 $ 2,114
(1) The amounts for the periods ended October 31, 2019 and July 31, 2019 have been prepared in accordance with IFRS 15; prior period amounts have not been restated (refer to Notes 3 and 4 in the consolidated financial statements).
T15A Fourth quarter financial results - adjusted for Acquisition and divestiture-related amounts (refer to non-GAAP measures on page 15)
For the three months ended
($ millions)
October 31
2019(1)
July 31
2019(1)
October 31
2018
Adjusted results
Net interest income $ 4,336 $ 4,374 $ 4,220
Non-interest income 3,626 3,591 3,228
Total revenue $ 7,962 $ 7,965 $ 7,448
Provision for credit losses 753 713 590
Non-interest expenses 4,197 4,122 3,962
Income tax expense 612 675 551
Net income $ 2,400 $ 2,455 $ 2,345
Net income attributable to non-controlling interests in subsidiaries $ 102 $ 125 $ 101
Net income attributable to equity holders of the Bank $ 2,298 $ 2,330 $ 2,244
Preferred shareholders and other equity instrument holders 64 25 65
Common shareholders $ 2,234 $ 2,305 $ 2,179
(1) The amounts for the periods ended October 31, 2019 and July 31, 2019 have been prepared in accordance with IFRS 15; prior period amounts have not been restated (refer to Notes 3 and 4 in the consolidated financial statements).
Transactions impacting results
Acquisition and divestiture-related amounts:
During the fourth quarter, the Bank completed the previously announced sale of its banking operations in seven non-core Caribbean markets and entered into an agreement
to sell its 51% interest in AFP Colfondos in Colombia and recorded a net loss of $9 million.
Integration and other costs recorded this quarter related to previously completed acquisitions amounted to $107 million (Q3,19 – $73 million).
Net income
Q4 2019 vs Q4 2018
Net income was $2,308 million, an increase of $37 million or 2%. Adjusting for Acquisition and divestiture-related amounts, net income was $2,400 million, an increase of
$55 million or 2%, due primarily to higher revenue.
Q4 2019 vs Q3 2019
Net income was $2,308 million, an increase of $324 million or 16%. Adjusting for Acquisition and divestiture-related amounts, net income was $2,400 million, a decrease of
$55 million or 2%, due primarily to higher provision for credit losses and higher non-interest expenses, offset by lower income tax expense.
Net interest income
Q4 2019 vs Q4 2018
Net interest income was $4,336 million, an increase of $116 million or 3%, primarily from solid growth in assets and deposits in Canadian Banking, commercial and retail
lending in International Banking, as well as higher corporate loans in Global Banking and Markets. These increases were partly offset by lower income contribution from
asset/liability management activities, and the negative impact of foreign currency translation.
The core banking margin was down seven basis points to 2.40%. The decrease in margin was driven by lower spreads on asset/liability management activities, and lower
margins in International Banking and Global Banking and Markets, partially offset by higher margins in Canadian Banking.
2019 Scotiabank Annual Report | 33

Management’s Discussion and Analysis
Q4 2019 vs Q3 2019
Net interest income was $4,336 million, a decrease of $38 million or 1%, from lower asset/liability management activities and the negative impact of foreign currency
translation, partly offset by strong asset growth in Canadian Banking.
The core banking margin of 2.40% was down five basis points. The decrease in the margin was driven by lower spreads on asset/liability management activities, lower
margin contribution from International Banking due mainly to unfavourable foreign currency translation on higher margin assets, as well as lower margins in Canadian
Banking.
Non-interest income
Q4 2019 vs Q4 2018
Non-interest income was $3,632 million, up $404 million or 13%. Acquisitions contributed to approximately one quarter of the growth. Other primary contributors to growth
were higher banking and wealth management revenues, underwriting and advisory fees, and net gains on investments. These were partly offset by the impact of the new
revenue accounting standard that requires credit card expenses to be netted against credit card revenue.
Q4 2019 vs Q3 2019
Non-interest income was up $347 million or 11%. Adjusting for the net gain on divestitures in the current quarter and the loss on divestitures in the prior quarter, non-interest
income increased by $35 million or 1%. The growth was driven by higher banking, underwriting and advisory, and wealth management fees, partly offset by lower trading
revenues and income from associated corporations.
Provision for credit losses
Q4 2019 vs Q4 2018
The provision for credit losses was $753 million, an increase of $163 million or 28%, due to higher provisions in both the retail and commercial portfolios in line with organic
and acquisition driven asset growth.
The provision for credit losses on impaired financial instruments was $744 million, up $107 million due to higher retail portfolio provisions in International Banking in line with
growth and in Canadian Banking due to lower recoveries, as well as higher commercial portfolio provisions in Canadian Banking and in Global Banking and Markets due to
lower recoveries. Commercial portfolio provisions in International Banking remained relatively stable, with the provision relating to the Barbados debt restructuring being
offset with higher recoveries last year. The provision for credit losses ratio on impaired loans was 49 basis points, an increase of seven basis points. The provision on
performing financial instruments was $9 million, an increase of $56 million due primarily to hurricane-related reversals last year and retail portfolio growth. The provision for
credit losses ratio increased 11 basis points to 50 basis points.
Q4 2019 vs Q3 2019
The provision for credit losses was $753 million, an increase of $40 million.
The provision on impaired financial instruments decreased $32 million or 4%, due primarily to lower retail portfolio provisions driven by lower write-offs in Canada and credit
quality improvements in International Banking, partially offset by higher commercial portfolio provisions in Canadian Banking and Global Banking and Markets. The provision
for credit losses ratio on impaired loans was 49 basis points, a decrease of three basis points. The provision for performing financial instruments was $9 million, an increase
of $72 million mainly in the International Banking retail portfolio driven by less favourable macroeconomic impacts due to geopolitical uncertainty and hurricanes in the
Bahamas. The prior quarter benefitted from credit quality improvements. The provision for credit losses ratio increased two basis points to 50 basis points.
Non-interest expenses
Q4 2019 vs Q4 2018
Non-interest expenses were $4,311 million, up $247 million or 6%. Adjusting for Acquisition and divestiture-related amounts, non-interest expenses also grew by 6%. Higher
non-interest expenses from the impact of acquisitions, partly offset by the impact of the new revenue accounting standard that requires card expenses to be netted against
card revenues, contributed to approximately 1% of the growth. The remaining 5% increase was due to higher salaries and benefits related to regulatory and technology
initiatives and higher depreciation and amortization, performance based compensation and other business growth related expenses. Partly offsetting were lower professional
fees and the positive impact of foreign currency translation.
The productivity ratio was 54.1% compared to 54.6%. Adjusting for Acquisition and divestiture-related amounts, the productivity ratio was 52.7% compared to 53.2%.
Q4 2019 vs Q3 2019
Non-interest expenses were up $102 million or 2%. Adjusting for Acquisition and divestiture-related amounts, non-interest expenses also grew by 2%. The increase was due
to higher professional fees, technology costs and other business growth related expenses partly offset by lower share-based compensation costs, salaries and the positive
impact of foreign currency translation.
The productivity ratio was 54.1% compared to 55.0%.
Income taxes
Q4 2019 vs Q4 2018
The effective tax rate was 20.5% compared to 18.7% due primarily to higher taxes in certain foreign jurisdictions.
Q4 2019 vs Q3 2019
The effective tax rate decreased to 20.5% from 27.5% due primarily to higher taxes related to the loss on the announced divestiture of Puerto Rico in the prior quarter.
34 | 2019 Scotiabank Annual Report
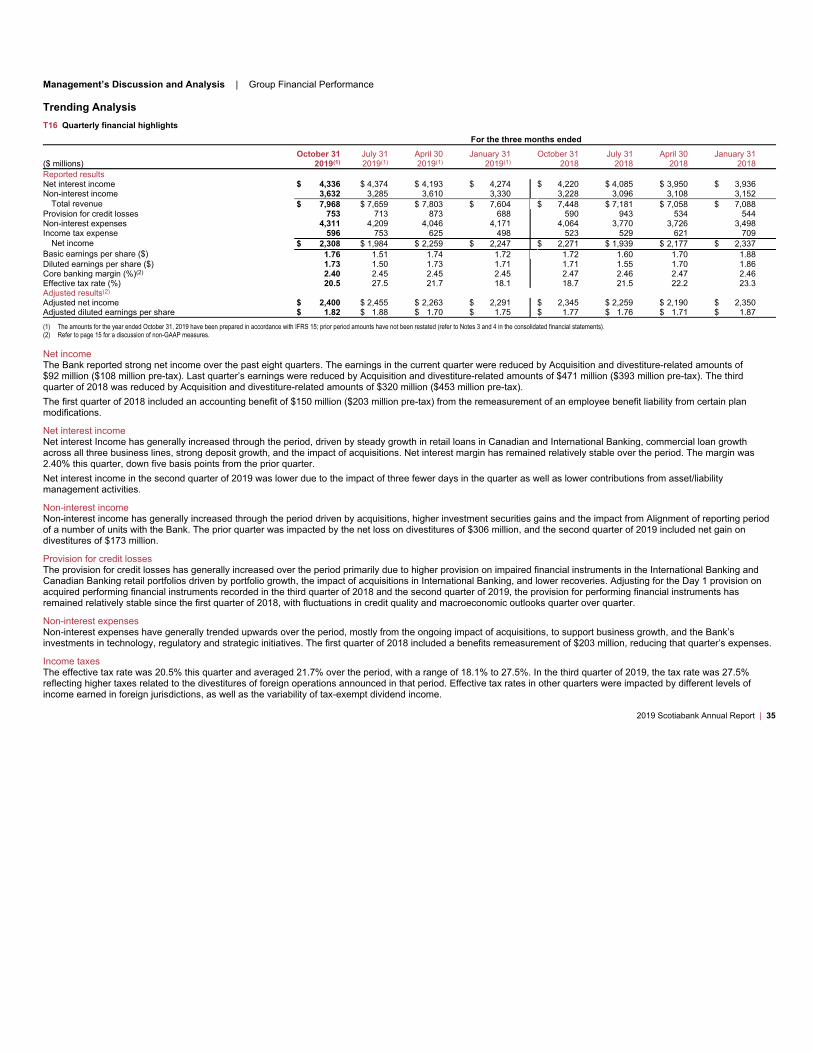
Management’s Discussion and Analysis | Group Financial Performance
Trending Analysis
T16 Quarterly financial highlights
For the three months ended
($ millions)
October 31
2019(1)
July 31
2019(1)
April 30
2019(1)
January 31
2019(1)
October 31
2018
July 31
2018
April 30
2018
January 31
2018
Reported results
Net interest income $ 4,336 $ 4,374 $ 4,193 $ 4,274 $ 4,220 $ 4,085 $ 3,950 $ 3,936
Non-interest income 3,632 3,285 3,610 3,330 3,228 3,096 3,108 3,152
Total revenue $ 7,968 $ 7,659 $ 7,803 $ 7,604 $ 7,448 $ 7,181 $ 7,058 $ 7,088
Provision for credit losses 753 713 873 688 590 943 534 544
Non-interest expenses 4,311 4,209 4,046 4,171 4,064 3,770 3,726 3,498
Income tax expense 596 753 625 498 523 529 621 709
Net income $ 2,308 $ 1,984 $ 2,259 $ 2,247 $ 2,271 $ 1,939 $ 2,177 $ 2,337
Basic earnings per share ($) 1.76 1.51 1.74 1.72 1.72 1.60 1.70 1.88
Diluted earnings per share ($) 1.73 1.50 1.73 1.71 1.71 1.55 1.70 1.86
Core banking margin (%)(2) 2.40 2.45 2.45 2.45 2.47 2.46 2.47 2.46
Effective tax rate (%) 20.5 27.5 21.7 18.1 18.7 21.5 22.2 23.3
Adjusted results(2)
Adjusted net income $ 2,400 $ 2,455 $ 2,263 $ 2,291 $ 2,345 $ 2,259 $ 2,190 $ 2,350
Adjusted diluted earnings per share $ 1.82 $ 1.88 $ 1.70 $ 1.75 $ 1.77 $ 1.76 $ 1.71 $ 1.87
(1) The amounts for the year ended October 31, 2019 have been prepared in accordance with IFRS 15; prior period amounts have not been restated (refer to Notes 3 and 4 in the consolidated financial statements).
(2) Refer to page 15 for a discussion of non-GAAP measures.
Net income
The Bank reported strong net income over the past eight quarters. The earnings in the current quarter were reduced by Acquisition and divestiture-related amounts of
$92 million ($108 million pre-tax). Last quarter’s earnings were reduced by Acquisition and divestiture-related amounts of $471 million ($393 million pre-tax). The third
quarter of 2018 was reduced by Acquisition and divestiture-related amounts of $320 million ($453 million pre-tax).
The first quarter of 2018 included an accounting benefit of $150 million ($203 million pre-tax) from the remeasurement of an employee benefit liability from certain plan
modifications.
Net interest income
Net interest Income has generally increased through the period, driven by steady growth in retail loans in Canadian and International Banking, commercial loan growth
across all three business lines, strong deposit growth, and the impact of acquisitions. Net interest margin has remained relatively stable over the period. The margin was
2.40% this quarter, down five basis points from the prior quarter.
Net interest income in the second quarter of 2019 was lower due to the impact of three fewer days in the quarter as well as lower contributions from asset/liability
management activities.
Non-interest income
Non-interest income has generally increased through the period driven by acquisitions, higher investment securities gains and the impact from Alignment of reporting period
of a number of units with the Bank. The prior quarter was impacted by the net loss on divestitures of $306 million, and the second quarter of 2019 included net gain on
divestitures of $173 million.
Provision for credit losses
The provision for credit losses has generally increased over the period primarily due to higher provision on impaired financial instruments in the International Banking and
Canadian Banking retail portfolios driven by portfolio growth, the impact of acquisitions in International Banking, and lower recoveries. Adjusting for the Day 1 provision on
acquired performing financial instruments recorded in the third quarter of 2018 and the second quarter of 2019, the provision for performing financial instruments has
remained relatively stable since the first quarter of 2018, with fluctuations in credit quality and macroeconomic outlooks quarter over quarter.
Non-interest expenses
Non-interest expenses have generally trended upwards over the period, mostly from the ongoing impact of acquisitions, to support business growth, and the Bank’s
investments in technology, regulatory and strategic initiatives. The first quarter of 2018 included a benefits remeasurement of $203 million, reducing that quarter’s expenses.
Income taxes
The effective tax rate was 20.5% this quarter and averaged 21.7% over the period, with a range of 18.1% to 27.5%. In the third quarter of 2019, the tax rate was 27.5%
reflecting higher taxes related to the divestitures of foreign operations announced in that period. Effective tax rates in other quarters were impacted by different levels of
income earned in foreign jurisdictions, as well as the variability of tax-exempt dividend income.
2019 Scotiabank Annual Report | 35

Management’s Discussion and Analysis
Business Line Overview
Business line results are presented on a taxable equivalent basis, adjusting for the following:
• The Bank analyzes revenue on a taxable equivalent basis (TEB) for business lines. This methodology grosses up tax-exempt income earned on certain securities
reported in either net interest income or non-interest income to an equivalent before tax basis. A corresponding increase is made to the provision for income taxes;
hence, there is no impact on net income. Management believes that this basis for measurement provides a uniform comparability of net interest income and
non-interest income arising from both taxable and non-taxable sources and facilitates a consistent basis of measurement. While other banks also use TEB, their
methodology may not be comparable to the Bank’s methodology. A segment’s revenue and provision for income taxes are grossed up by the taxable equivalent
amount. The elimination of the TEB gross up is recorded in the Other segment.
• For business line performance assessment and reporting, net income from associated corporations, which is an after-tax number, is adjusted to normalize for income
taxes. The tax normalization adjustment grosses up the amount of net income from associated corporations and normalizes the effective tax rate in the business lines
to better present the contribution of the associated corporations to the business line results.
• International Banking business segment results are analyzed on a constant dollar basis. Under constant dollar basis, prior period amounts are recalculated using
current period average foreign currency rates eliminating the impact of foreign currency translation. The Bank believes that reporting in constant dollar is useful for
readers in assessing ongoing business performance.
Below are the results of the Bank’s three business operating segments for 2019.
CANADIAN BANKING
Canadian Banking reported net income attributable to equity holders of $4,424 million in 2019, up 1% from last year. Adjusting for Acquisition related costs, net income was
$4,485 million, up 2%. Solid growth in assets and deposits, along with an improving margin driven mainly from past Bank of Canada interest rate increases and higher
non-interest income contributed to growth in 2019. This was partly offset by higher non-interest expenses and higher provision for credit losses. Return on equity was 18.8%,
compared with 22.7% last year, mainly due to prior year acquisitions.
INTERNATIONAL BANKING
International Banking reported net income attributable to equity holders of $2,996 million, up $423 million or 16% from last year. Adjusting for Acquisition-related costs, net
income attributable to equity holders increased by $369 million or 13% to $3,188 million. Strong results in Latin America, including benefits from acquisitions, and Asia, were
complemented by good earnings in the Caribbean. The impact of acquisitions and divestitures contributed approximately 3% to the adjusted earnings growth. The remaining
increase was driven by strong loan growth in Latin America, higher net interest income and non-interest income. This was partly offset by higher provision for credit losses,
non-interest expenses and higher income taxes. Return on equity was 13.9% compared to 14.4% last year. Adjusting for Acquisition-related costs, the return on equity was
14.8%.
GLOBAL BANKING AND MARKETS
Global Banking and Markets reported net income attributable to equity holders of $1,534 million, a decrease of $224 million or 13% from last year. Lower revenues in the
equities business, higher expenses, as well as higher provision for credit losses, were partly offset by very strong results in the fixed income business. Return on equity was
13.3%, compared to 16.0% last year.
36 | 2019 Scotiabank Annual Report
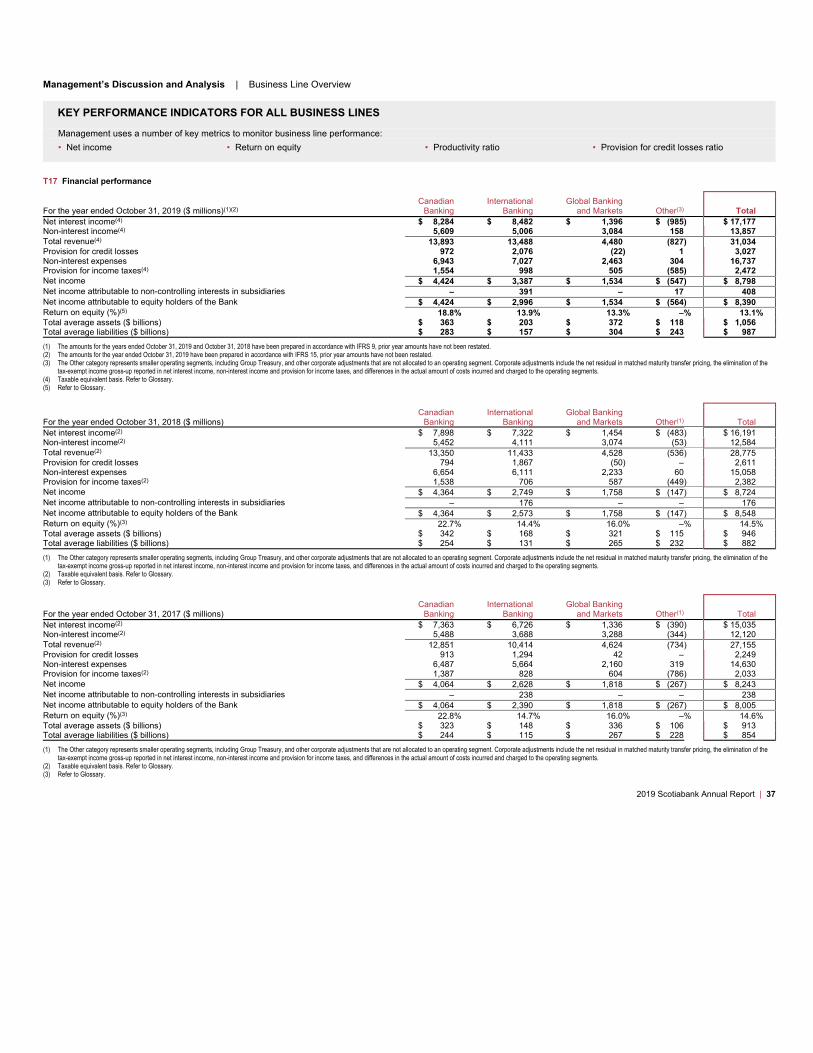
Management’s Discussion and Analysis | Business Line Overview
KEY PERFORMANCE INDICATORS FOR ALL BUSINESS LINES
Management uses a number of key metrics to monitor business line performance:• Net income • Return on equity • Productivity ratio • Provision for credit losses ratio
T17 Financial performance
For the year ended October 31, 2019 ($ millions)(1)(2)Canadian
BankingInternational
BankingGlobal Banking
and Markets Other(3) Total
Net interest income(4) $ 8,284 $ 8,482 $ 1,396 $ (985) $ 17,177
Non-interest income(4) 5,609 5,006 3,084 158 13,857
Total revenue(4) 13,893 13,488 4,480 (827) 31,034
Provision for credit losses 972 2,076 (22) 1 3,027
Non-interest expenses 6,943 7,027 2,463 304 16,737
Provision for income taxes(4) 1,554 998 505 (585) 2,472
Net income $ 4,424 $ 3,387 $ 1,534 $ (547) $ 8,798
Net income attributable to non-controlling interests in subsidiaries – 391 – 17 408
Net income attributable to equity holders of the Bank $ 4,424 $ 2,996 $ 1,534 $ (564) $ 8,390
Return on equity (%)(5)18.8% 13.9% 13.3% –% 13.1%
Total average assets ($ billions) $ 363 $ 203 $ 372 $ 118 $ 1,056
Total average liabilities ($ billions) $ 283 $ 157 $ 304 $ 243 $ 987
(1) The amounts for the years ended October 31, 2019 and October 31, 2018 have been prepared in accordance with IFRS 9, prior year amounts have not been restated.
(2) The amounts for the year ended October 31, 2019 have been prepared in accordance with IFRS 15, prior year amounts have not been restated.
(3) The Other category represents smaller operating segments, including Group Treasury, and other corporate adjustments that are not allocated to an operating segment. Corporate adjustments include the net residual in matched maturity transfer pricing, the elimination of the
tax-exempt income gross-up reported in net interest income, non-interest income and provision for income taxes, and differences in the actual amount of costs incurred and charged to the operating segments.
(4) Taxable equivalent basis. Refer to Glossary.
(5) Refer to Glossary.
For the year ended October 31, 2018 ($ millions)Canadian
BankingInternational
BankingGlobal Banking
and Markets Other(1) TotalNet interest income(2) $ 7,898 $ 7,322 $ 1,454 $ (483) $ 16,191Non-interest income(2) 5,452 4,111 3,074 (53) 12,584Total revenue(2) 13,350 11,433 4,528 (536) 28,775Provision for credit losses 794 1,867 (50) – 2,611Non-interest expenses 6,654 6,111 2,233 60 15,058Provision for income taxes(2) 1,538 706 587 (449) 2,382Net income $ 4,364 $ 2,749 $ 1,758 $ (147) $ 8,724Net income attributable to non-controlling interests in subsidiaries – 176 – – 176Net income attributable to equity holders of the Bank $ 4,364 $ 2,573 $ 1,758 $ (147) $ 8,548Return on equity (%)(3) 22.7% 14.4% 16.0% –% 14.5% Total average assets ($ billions) $ 342 $ 168 $ 321 $ 115 $ 946Total average liabilities ($ billions) $ 254 $ 131 $ 265 $ 232 $ 882
(1) The Other category represents smaller operating segments, including Group Treasury, and other corporate adjustments that are not allocated to an operating segment. Corporate adjustments include the net residual in matched maturity transfer pricing, the elimination of the
tax-exempt income gross-up reported in net interest income, non-interest income and provision for income taxes, and differences in the actual amount of costs incurred and charged to the operating segments.
(2) Taxable equivalent basis. Refer to Glossary.
(3) Refer to Glossary.
For the year ended October 31, 2017 ($ millions)Canadian
BankingInternational
BankingGlobal Banking
and Markets Other(1) TotalNet interest income(2) $ 7,363 $ 6,726 $ 1,336 $ (390) $ 15,035Non-interest income(2) 5,488 3,688 3,288 (344) 12,120Total revenue(2) 12,851 10,414 4,624 (734) 27,155Provision for credit losses 913 1,294 42 – 2,249Non-interest expenses 6,487 5,664 2,160 319 14,630Provision for income taxes(2) 1,387 828 604 (786) 2,033Net income $ 4,064 $ 2,628 $ 1,818 $ (267) $ 8,243Net income attributable to non-controlling interests in subsidiaries – 238 – – 238Net income attributable to equity holders of the Bank $ 4,064 $ 2,390 $ 1,818 $ (267) $ 8,005Return on equity (%)(3) 22.8% 14.7% 16.0% –% 14.6% Total average assets ($ billions) $ 323 $ 148 $ 336 $ 106 $ 913Total average liabilities ($ billions) $ 244 $ 115 $ 267 $ 228 $ 854
(1) The Other category represents smaller operating segments, including Group Treasury, and other corporate adjustments that are not allocated to an operating segment. Corporate adjustments include the net residual in matched maturity transfer pricing, the elimination of the
tax-exempt income gross-up reported in net interest income, non-interest income and provision for income taxes, and differences in the actual amount of costs incurred and charged to the operating segments.
(2) Taxable equivalent basis. Refer to Glossary.
(3) Refer to Glossary.
2019 Scotiabank Annual Report | 37
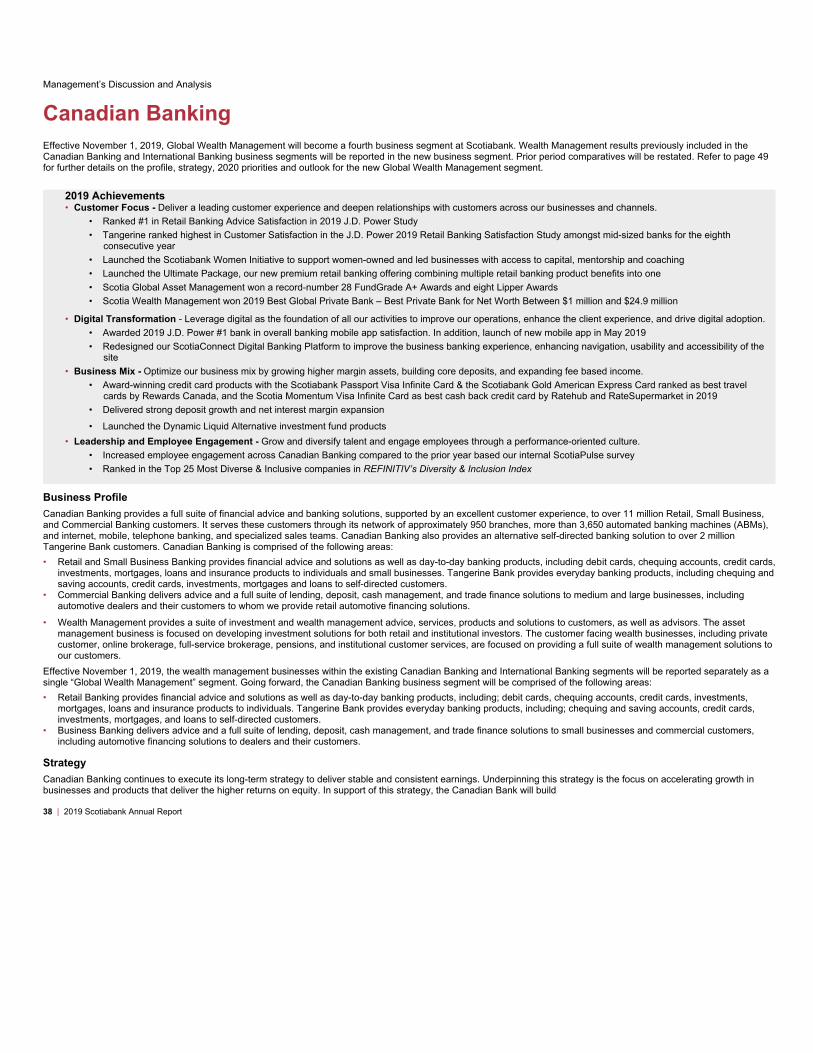
Management’s Discussion and Analysis
Canadian Banking
Effective November 1, 2019, Global Wealth Management will become a fourth business segment at Scotiabank. Wealth Management results previously included in the Canadian Banking and International Banking business segments will be reported in the new business segment. Prior period comparatives will be restated. Refer to page 49 for further details on the profile, strategy, 2020 priorities and outlook for the new Global Wealth Management segment.
2019 Achievements
• Customer Focus - Deliver a leading customer experience and deepen relationships with customers across our businesses and channels.• Ranked #1 in Retail Banking Advice Satisfaction in 2019 J.D. Power Study• Tangerine ranked highest in Customer Satisfaction in the J.D. Power 2019 Retail Banking Satisfaction Study amongst mid-sized banks for the eighth
consecutive year• Launched the Scotiabank Women Initiative to support women-owned and led businesses with access to capital, mentorship and coaching• Launched the Ultimate Package, our new premium retail banking offering combining multiple retail banking product benefits into one• Scotia Global Asset Management won a record-number 28 FundGrade A+ Awards and eight Lipper Awards• Scotia Wealth Management won 2019 Best Global Private Bank – Best Private Bank for Net Worth Between $1 million and $24.9 million
• Digital Transformation - Leverage digital as the foundation of all our activities to improve our operations, enhance the client experience, and drive digital adoption.• Awarded 2019 J.D. Power #1 bank in overall banking mobile app satisfaction. In addition, launch of new mobile app in May 2019• Redesigned our ScotiaConnect Digital Banking Platform to improve the business banking experience, enhancing navigation, usability and accessibility of the
site• Business Mix - Optimize our business mix by growing higher margin assets, building core deposits, and expanding fee based income.
• Award-winning credit card products with the Scotiabank Passport Visa Infinite Card & the Scotiabank Gold American Express Card ranked as best travel cards by Rewards Canada, and the Scotia Momentum Visa Infinite Card as best cash back credit card by Ratehub and RateSupermarket in 2019
• Delivered strong deposit growth and net interest margin expansion
• Launched the Dynamic Liquid Alternative investment fund products• Leadership and Employee Engagement - Grow and diversify talent and engage employees through a performance-oriented culture.
• Increased employee engagement across Canadian Banking compared to the prior year based our internal ScotiaPulse survey• Ranked in the Top 25 Most Diverse & Inclusive companies in REFINITIV’s Diversity & Inclusion Index
Business Profile
Canadian Banking provides a full suite of financial advice and banking solutions, supported by an excellent customer experience, to over 11 million Retail, Small Business, and Commercial Banking customers. It serves these customers through its network of approximately 950 branches, more than 3,650 automated banking machines (ABMs), and internet, mobile, telephone banking, and specialized sales teams. Canadian Banking also provides an alternative self-directed banking solution to over 2 million Tangerine Bank customers. Canadian Banking is comprised of the following areas: • Retail and Small Business Banking provides financial advice and solutions as well as day-to-day banking products, including debit cards, chequing accounts, credit cards,
investments, mortgages, loans and insurance products to individuals and small businesses. Tangerine Bank provides everyday banking products, including chequing and saving accounts, credit cards, investments, mortgages and loans to self-directed customers.
• Commercial Banking delivers advice and a full suite of lending, deposit, cash management, and trade finance solutions to medium and large businesses, including automotive dealers and their customers to whom we provide retail automotive financing solutions.
• Wealth Management provides a suite of investment and wealth management advice, services, products and solutions to customers, as well as advisors. The asset management business is focused on developing investment solutions for both retail and institutional investors. The customer facing wealth businesses, including private customer, online brokerage, full-service brokerage, pensions, and institutional customer services, are focused on providing a full suite of wealth management solutions to our customers.
Effective November 1, 2019, the wealth management businesses within the existing Canadian Banking and International Banking segments will be reported separately as a single “Global Wealth Management” segment. Going forward, the Canadian Banking business segment will be comprised of the following areas: • Retail Banking provides financial advice and solutions as well as day-to-day banking products, including; debit cards, chequing accounts, credit cards, investments,
mortgages, loans and insurance products to individuals. Tangerine Bank provides everyday banking products, including; chequing and saving accounts, credit cards, investments, mortgages, and loans to self-directed customers.
• Business Banking delivers advice and a full suite of lending, deposit, cash management, and trade finance solutions to small businesses and commercial customers, including automotive financing solutions to dealers and their customers.
Strategy
Canadian Banking continues to execute its long-term strategy to deliver stable and consistent earnings. Underpinning this strategy is the focus on accelerating growth in businesses and products that deliver the higher returns on equity. In support of this strategy, the Canadian Bank will build
38 | 2019 Scotiabank Annual Report

Management’s Discussion and Analysis | Canadian Banking
stronger relationships with its customers in order to drive increased loyalty and higher engagement. This will be driven by ongoing efforts to build a high-quality team
comprised of diverse and highly engaged employees.
2020 Priorities
• Improve Sustained Business Performance: Invest to grow the higher ROE businesses, including Business Banking, to deliver consistent and stable long-term earnings
growth.
• Instill a Winning team Culture: Engage employees through a RESULTS (Revenue, Earnings, Simplify, Urgency, Listen, Trust, Support) focused culture.
• Superior Customer Experience: Develop deeper household relationships for our customers across Canada by providing differentiated focus and service to drive loyalty
and engagement.
• Scale our unique partnerships and assets: Leverage our long-term partnerships and assets like MLSE, Scene and Wealth businesses to generate growth across our
division.
T18 Canadian Banking financial performance
($ millions) 2019(1)(2) 2018 2017
Reported results
Net interest income(3) $ 8,284 $ 7,898 $ 7,363
Non-interest income(3)(4) 5,609 5,452 5,488
Total revenue(3)13,893 13,350 12,851
Provision for credit losses 972 794 913
Non-interest expenses 6,943 6,654 6,487
Income tax expense 1,554 1,538 1,387
Net income $ 4,424 $ 4,364 $ 4,064
Net income attributable to non-controlling interests in subsidiaries – – –
Net income attributable to equity holders of the Bank $ 4,424 $ 4,364 $ 4,064
Key ratios and other financial data
Return on equity(5) 18.8% 22.7% 22.8%
Productivity(3) 50.0% 49.8% 50.5%
Net interest margin(6) 2.47% 2.44% 2.40%
Provision for credit losses - performing (Stages 1 and 2) $ (1) $ 8 n/a
Provision for credit losses - impaired (Stage 3) $ 973 $ 786 n/a
Provision for credit losses as a percentage of average net loans and acceptances 0.28% 0.24% 0.29%
Provision for credit losses on impaired loans as a percentage of average net loans and acceptances 0.28% 0.24% 0.29%
Net write-offs as a percentage of average net loans and acceptances 0.29% 0.24% 0.32%
Selected Consolidated Statement of Financial Position data (average balances)
Earning assets $ 348,994 $ 334,103 $ 315,916
Total assets 362,735 341,825 322,712
Deposits 263,993 240,855 233,260
Total liabilities 283,193 253,591 243,748
Other ($ billions)
Assets under administration(7) $ 386 $ 357 $ 315
Assets under management(7) $ 243 $ 223 $ 155
(1) The amounts for the years ended October 31, 2019 and October 31, 2018 have been prepared in accordance with IFRS 9, prior year amounts have not been restated.
(2) The amounts for the year ended October 31, 2019 have been prepared in accordance with IFRS 15; prior period amounts have not been restated (refer to Notes 3 and 4 in the consolidated financial statements).
(3) Taxable equivalent basis (TEB).
(4) Includes net income from investments in associated corporations of $65 (2018 – $93; 2017 – $66).
(5) Refer to Glossary.
(6) Net interest income (TEB) as % of average earning assets excluding bankers acceptances.
(7) Prior period amounts have been restated to conform with current period presentation.
T18A Adjusted Canadian Banking financial performance(1)
($ millions) 2019 2018 2017
Adjusted results
Net interest income $ 8,284 $ 7,898 $ 7,363
Non-interest income 5,609 5,452 5,488
Total revenue 13,893 13,350 12,851
Provision for credit losses 972 794 913
Non-interest expenses 6,860 6,583 6,452
Income before taxes 6,061 5,973 5,486
Income tax expense 1,576 1,557 1,396
Net income $ 4,485 $ 4,416 $ 4,090
Net income attributable to non-controlling interests in subsidiaries (NCI) – – –
Net income attributable to equity holders $ 4,485 $ 4,416 $ 4,090
(1) Refer to Non-GAAP Measures for the reconciliation of Reported and Adjusted results.
2019 Scotiabank Annual Report | 39
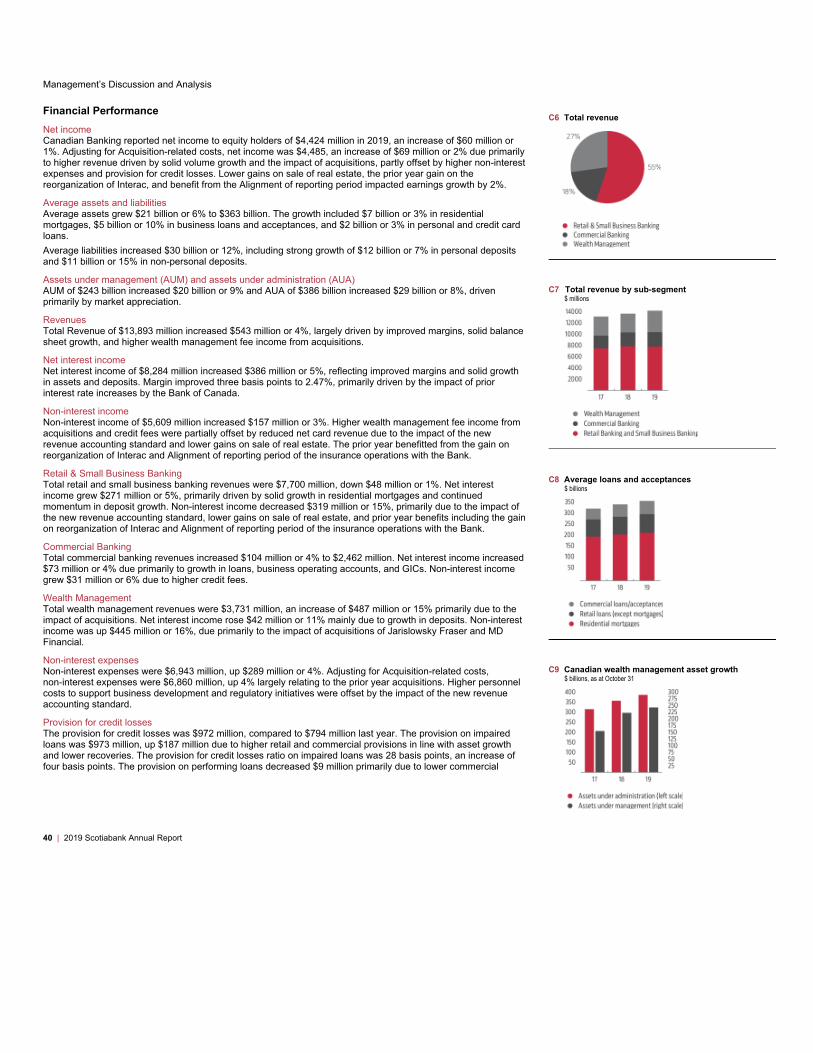
Management’s Discussion and Analysis
40 | 2019 Scotiabank Annual Report
Financial Performance Net income
Canadian Banking reported net income to equity holders of $4,424 million in 2019, an increase of $60 million or
1%. Adjusting for Acquisition-related costs, net income was $4,485, an increase of $69 million or 2% due primarily
to higher revenue driven by solid volume growth and the impact of acquisitions, partly offset by higher non-interest
expenses and provision for credit losses. Lower gains on sale of real estate, the prior year gain on the
reorganization of Interac, and benefit from the Alignment of reporting period impacted earnings growth by 2%.
Average assets and liabilities
Average assets grew $21 billion or 6% to $363 billion. The growth included $7 billion or 3% in residential
mortgages, $5 billion or 10% in business loans and acceptances, and $2 billion or 3% in personal and credit card
loans.
Average liabilities increased $30 billion or 12%, including strong growth of $12 billion or 7% in personal deposits
and $11 billion or 15% in non-personal deposits.
Assets under management (AUM) and assets under administration (AUA)
AUM of $243 billion increased $20 billion or 9% and AUA of $386 billion increased $29 billion or 8%, driven
primarily by market appreciation.
Revenues
Total Revenue of $13,893 million increased $543 million or 4%, largely driven by improved margins, solid balance
sheet growth, and higher wealth management fee income from acquisitions.
Net interest income
Net interest income of $8,284 million increased $386 million or 5%, reflecting improved margins and solid growth
in assets and deposits. Margin improved three basis points to 2.47%, primarily driven by the impact of prior
interest rate increases by the Bank of Canada.
Non-interest income
Non-interest income of $5,609 million increased $157 million or 3%. Higher wealth management fee income from
acquisitions and credit fees were partially offset by reduced net card revenue due to the impact of the new
revenue accounting standard and lower gains on sale of real estate. The prior year benefitted from the gain on
reorganization of Interac and Alignment of reporting period of the insurance operations with the Bank.
Retail & Small Business Banking
Total retail and small business banking revenues were $7,700 million, down $48 million or 1%. Net interest
income grew $271 million or 5%, primarily driven by solid growth in residential mortgages and continued
momentum in deposit growth. Non-interest income decreased $319 million or 15%, primarily due to the impact of
the new revenue accounting standard, lower gains on sale of real estate, and prior year benefits including the gain
on reorganization of Interac and Alignment of reporting period of the insurance operations with the Bank.
Commercial Banking
Total commercial banking revenues increased $104 million or 4% to $2,462 million. Net interest income increased
$73 million or 4% due primarily to growth in loans, business operating accounts, and GICs. Non-interest income
grew $31 million or 6% due to higher credit fees.
Wealth Management
Total wealth management revenues were $3,731 million, an increase of $487 million or 15% primarily due to the
impact of acquisitions. Net interest income rose $42 million or 11% mainly due to growth in deposits. Non-interest
income was up $445 million or 16%, due primarily to the impact of acquisitions of Jarislowsky Fraser and MD
Financial.
Non-interest expenses
Non-interest expenses were $6,943 million, up $289 million or 4%. Adjusting for Acquisition-related costs,
non-interest expenses were $6,860 million, up 4% largely relating to the prior year acquisitions. Higher personnel
costs to support business development and regulatory initiatives were offset by the impact of the new revenue
accounting standard.
Provision for credit losses
The provision for credit losses was $972 million, compared to $794 million last year. The provision on impaired
loans was $973 million, up $187 million due to higher retail and commercial provisions in line with asset growth
and lower recoveries. The provision for credit losses ratio on impaired loans was 28 basis points, an increase of
four basis points. The provision on performing loans decreased $9 million primarily due to lower commercial
C6 Total revenue
C7 Total revenue by sub-segment$ millions
C8 Average loans and acceptances$ billions
C9 Canadian wealth management asset growth$ billions, as at October 31

Management’s Discussion and Analysis | Canadian Banking
provisions driven by improved credit quality partially offset by higher retail provisions impacted by less favourable macroeconomic trends. The provision for credit losses ratio
was 28 basis points, an increase of four basis points.
Provision for income taxes
The effective tax rate was at 26.0%, in line with the prior year.
Outlook
Canadian Banking’s growth in 2020 is expected to be driven by balance sheet expansion, supported by a stable economic environment. Assets are projected to grow across
both retail and business banking. Deposits are also expected to grow across the business lines. Margins are expected to remain under pressure over the next year.
Non-interest revenues are expected to grow, underpinned by growth in fee income. Key priorities for 2020 will be to continue to drive growth in the core businesses along
with improving operational efficiencies and targeting positive operating leverage.
2019 Scotiabank Annual Report | 41

Management’s Discussion and Analysis
International Banking
Effective November 1, 2019, Global Wealth Management will become a fourth business segment at Scotiabank. Wealth Management results previously included in the Canadian Banking and International Banking business segments will be reported in the new business segment. Prior period comparatives will be restated. Refer to page 49 for further details on the profile, strategy, 2020 priorities and outlook for the new Global Wealth Management segment.
2019 Achievements
• Footprint Optimization
• Significant progress has been made in our footprint optimization program, which is substantially complete• Integrations of our acquisitions in Chile, Colombia, Peru and Dominican Republic on-track in terms of execution and synergies captured• Announced divestitures in non-core markets and businesses, including selected eastern Caribbean countries, Puerto Rico, El Salvador and Thailand
• Customer Focus
• Continued primary customer growth in both retail and commercial. Retail customer growth maintains its steady progress towards our goal of adding 1 million new primary customers
• Significant Customer Experience improvements across countries in the Pacific Alliance; our proprietary system allowed us to accurately identify and improve on customer satisfaction following system migration and integration in Mexico and Chile respectively
• Leadership
• Scotiabank named #6 best workplace in Latin America by Great Place to Work, up from 15th in 2018• Significant progress made in women leadership. Recognized among the top 10 organizations in gender equality in 3 of our Pacific Alliance countries by
the Aequales PAR Ranking• Continue to strengthen a diverse leadership team and to leverage international mobility
• Enterprise Productivity
• Adjusting for Acquisition-related costs, productivity ratio improved by more than 190 basis points while delivering positive operating leverage of more than 400 basis points
• Digital Transformation
• Achieved strong progress on digital targets across our markets; reached milestone of selling 50%+ of all retail products via digital banking in Chile• Successfully launched new mobile applications across the 4 Pacific Alliance countries• Built good momentum in new revenue flows generated from products sold digitally, surpassing the operating cost of running our Digital Factories• Began deployment of digital solutions in branches across key markets for enhanced customer experience and productivity; Colombia leads with more
than 90% of saving accounts completed through end-to-end digital solutions• Business Mix Alignment
• Closed a 15-year strategic partnership to accelerate our insurance business• Strong Risk Culture
• Enhanced in-country organizational structures for anti-money laundering (AML) with senior leaders and local teams in-place.• Delivery of priority initiatives strengthening internal controls and continued AML risk mitigation underway.
Business Profile
International Banking has a strong and diverse franchise with more than 11 million Retail, Corporate and Commercial customers. We have almost 60,000 employees and our customers are served by a network of more than 1,900 branches, 5,500 ATMs and contact centres. International Banking continues to be an attractive growth opportunity for the Bank with a geographical footprint focused on the Pacific Alliance countries of Mexico, Colombia, Peru and Chile. The Pacific Alliance countries have a combined GDP that is more than double the size of Canada’s, a young population, rising middle class, growing economies and a sound banking environment. Our franchise is supported by a solid, mature and profitable business in Central America and the Caribbean.
Strategy
International Banking continues to execute its medium-term strategy that is aligned with the all-Bank strategic priorities of: customer focus, leadership, enterprise productivity, digital transformation, business mix alignment, and strong risk culture. Underpinning this strategy is our increased focus on growth in the Pacific Alliance while optimizing operations in Central America and the Caribbean.
2020 Priorities
• Optimize Footprint: Continue executing with discipline announced acquisitions and divestitures to enhance the risk profile of our portfolio and improve quality of our earnings.
• Lead in Customer Experience and Digital: Continue accelerating our digital transformation to amplify business impact and continue deploying digital solutions to other channels to optimize our distribution model.
• Accelerate Growth Drivers: Leverage new strategic partnership to accelerate insurance growth, scale our Capital Markets business in the Pacific Alliance and build our Wealth business with focus in affluent customer segment.
42 | 2019 Scotiabank Annual Report
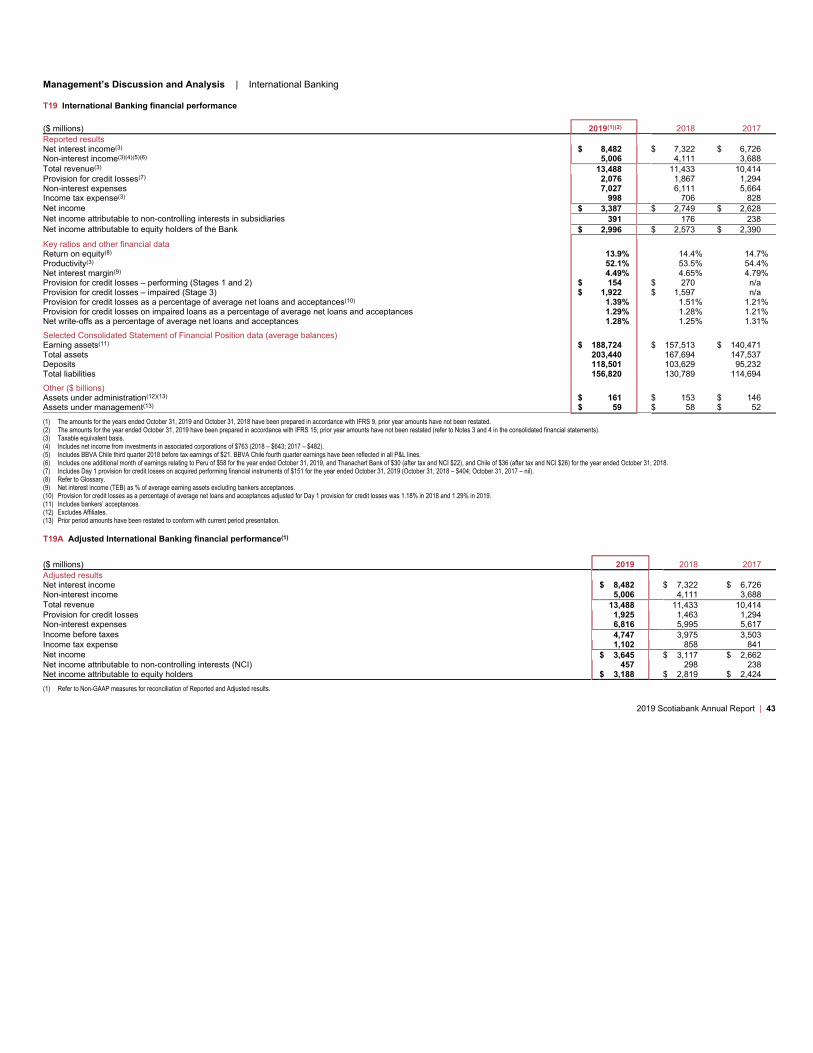
Management’s Discussion and Analysis | International Banking
T19 International Banking financial performance
($ millions) 2019(1)(2) 2018 2017
Reported results
Net interest income(3) $ 8,482 $ 7,322 $ 6,726
Non-interest income(3)(4)(5)(6) 5,006 4,111 3,688
Total revenue(3)13,488 11,433 10,414
Provision for credit losses(7) 2,076 1,867 1,294
Non-interest expenses 7,027 6,111 5,664
Income tax expense(3) 998 706 828
Net income $ 3,387 $ 2,749 $ 2,628
Net income attributable to non-controlling interests in subsidiaries 391 176 238
Net income attributable to equity holders of the Bank $ 2,996 $ 2,573 $ 2,390
Key ratios and other financial data
Return on equity(8) 13.9% 14.4% 14.7%
Productivity(3) 52.1% 53.5% 54.4%
Net interest margin(9) 4.49% 4.65% 4.79%
Provision for credit losses – performing (Stages 1 and 2) $ 154 $ 270 n/a
Provision for credit losses – impaired (Stage 3) $ 1,922 $ 1,597 n/a
Provision for credit losses as a percentage of average net loans and acceptances(10) 1.39% 1.51% 1.21%
Provision for credit losses on impaired loans as a percentage of average net loans and acceptances 1.29% 1.28% 1.21%
Net write-offs as a percentage of average net loans and acceptances 1.28% 1.25% 1.31%
Selected Consolidated Statement of Financial Position data (average balances)
Earning assets(11) $ 188,724 $ 157,513 $ 140,471
Total assets 203,440 167,694 147,537
Deposits 118,501 103,629 95,232
Total liabilities 156,820 130,789 114,694
Other ($ billions)
Assets under administration(12)(13) $ 161 $ 153 $ 146
Assets under management(13) $ 59 $ 58 $ 52
(1) The amounts for the years ended October 31, 2019 and October 31, 2018 have been prepared in accordance with IFRS 9, prior year amounts have not been restated.
(2) The amounts for the year ended October 31, 2019 have been prepared in accordance with IFRS 15; prior year amounts have not been restated (refer to Notes 3 and 4 in the consolidated financial statements).
(3) Taxable equivalent basis.
(4) Includes net income from investments in associated corporations of $763 (2018 – $643; 2017 – $482).
(5) Includes BBVA Chile third quarter 2018 before tax earnings of $21. BBVA Chile fourth quarter earnings have been reflected in all P&L lines.
(6) Includes one additional month of earnings relating to Peru of $58 for the year ended October 31, 2019, and Thanachart Bank of $30 (after tax and NCI $22), and Chile of $36 (after tax and NCI $26) for the year ended October 31, 2018.
(7) Includes Day 1 provision for credit losses on acquired performing financial instruments of $151 for the year ended October 31, 2019 (October 31, 2018 – $404; October 31, 2017 – nil).
(8) Refer to Glossary.
(9) Net interest income (TEB) as % of average earning assets excluding bankers acceptances.
(10) Provision for credit losses as a percentage of average net loans and acceptances adjusted for Day 1 provision for credit losses was 1.18% in 2018 and 1.29% in 2019.
(11) Includes bankers’ acceptances.
(12) Excludes Affiliates.
(13) Prior period amounts have been restated to conform with current period presentation.
T19A Adjusted International Banking financial performance(1)
($ millions) 2019 2018 2017
Adjusted results
Net interest income $ 8,482 $ 7,322 $ 6,726
Non-interest income 5,006 4,111 3,688
Total revenue 13,488 11,433 10,414
Provision for credit losses 1,925 1,463 1,294
Non-interest expenses 6,816 5,995 5,617
Income before taxes 4,747 3,975 3,503
Income tax expense 1,102 858 841
Net income $ 3,645 $ 3,117 $ 2,662
Net income attributable to non-controlling interests (NCI) 457 298 238
Net income attributable to equity holders $ 3,188 $ 2,819 $ 2,424
(1) Refer to Non-GAAP measures for reconciliation of Reported and Adjusted results.
2019 Scotiabank Annual Report | 43
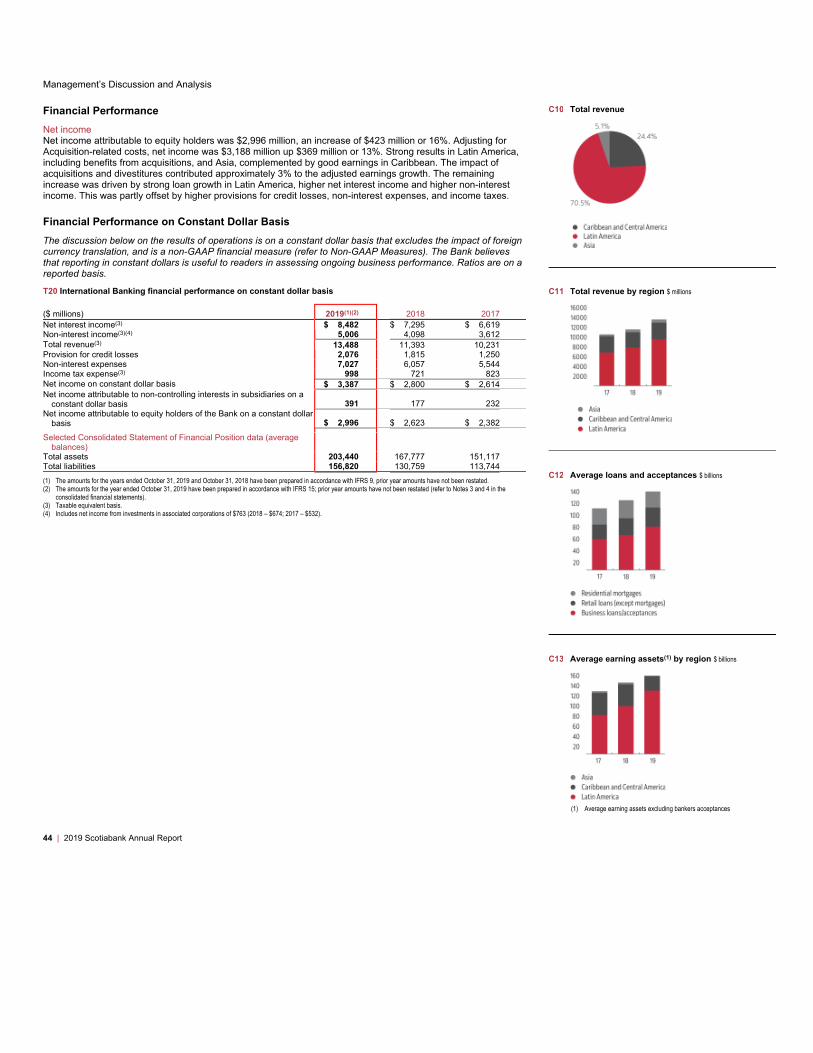
Management’s Discussion and Analysis
44 | 2019 Scotiabank Annual Report
Financial Performance
Net income
Net income attributable to equity holders was $2,996 million, an increase of $423 million or 16%. Adjusting for
Acquisition-related costs, net income was $3,188 million up $369 million or 13%. Strong results in Latin America,
including benefits from acquisitions, and Asia, complemented by good earnings in Caribbean. The impact of
acquisitions and divestitures contributed approximately 3% to the adjusted earnings growth. The remaining
increase was driven by strong loan growth in Latin America, higher net interest income and higher non-interest
income. This was partly offset by higher provisions for credit losses, non-interest expenses, and income taxes.
Financial Performance on Constant Dollar Basis
The discussion below on the results of operations is on a constant dollar basis that excludes the impact of foreign
currency translation, and is a non-GAAP financial measure (refer to Non-GAAP Measures). The Bank believes
that reporting in constant dollars is useful to readers in assessing ongoing business performance. Ratios are on a
reported basis.
T20 International Banking financial performance on constant dollar basis
($ millions) 2019(1)(2) 2018 2017
Net interest income(3) $ 8,482 $ 7,295 $ 6,619
Non-interest income(3)(4) 5,006 4,098 3,612
Total revenue(3)13,488 11,393 10,231
Provision for credit losses 2,076 1,815 1,250
Non-interest expenses 7,027 6,057 5,544
Income tax expense(3) 998 721 823
Net income on constant dollar basis $ 3,387 $ 2,800 $ 2,614
Net income attributable to non-controlling interests in subsidiaries on a
constant dollar basis 391 177 232
Net income attributable to equity holders of the Bank on a constant dollar
basis $ 2,996 $ 2,623 $ 2,382
Selected Consolidated Statement of Financial Position data (average
balances)
Total assets 203,440 167,777 151,117
Total liabilities 156,820 130,759 113,744
(1) The amounts for the years ended October 31, 2019 and October 31, 2018 have been prepared in accordance with IFRS 9, prior year amounts have not been restated.
(2) The amounts for the year ended October 31, 2019 have been prepared in accordance with IFRS 15; prior year amounts have not been restated (refer to Notes 3 and 4 in the
consolidated financial statements).
(3) Taxable equivalent basis.
(4) Includes net income from investments in associated corporations of $763 (2018 – $674; 2017 – $532).
C10 Total revenue
C11 Total revenue by region $ millions
C12 Average loans and acceptances $ billions
C13 Average earning assets(1) by region $ billions
(1) Average earning assets excluding bankers acceptances

Management’s Discussion and Analysis | International Banking
Net income
Net income attributable to equity holders was $2,996 million, an increase of $373 million or 14%. Adjusting for Acquisition-related costs, net income was $3,188 million up
$341 million or 12%. Strong results in Latin America, including benefits from acquisitions, and Asia, complemented by good earnings in Caribbean. The impact of
acquisitions and divestitures contributed approximately 3% to the adjusted earnings growth. The remaining increase was driven by strong loan growth in Latin America,
higher net interest income and higher non-interest income. This was partly offset by higher provisions for credit losses, non-interest expenses, and higher income taxes.
Assets and liabilities
Average assets of $203 billion increased $36 billion or 21% driven by strong retail and commercial loan growth, primarily in Latin America, partly due to acquisitions. Retail
loan growth was 24% and commercial loan growth was 21%. Average liabilities increased $26 billion or 20% to $157 billion due to strong deposit growth in Pacific Alliance,
partly due to acquisitions. Commercial and retail deposits increased 17% and 13% respectively.
Revenues
Total revenues of $13,488 million increased $2,095 million or 18%. Net interest income was $8,482 million, up 16% driven by strong retail and commercial loan growth,
approximately two-thirds of the increase is driven by acquisitions. The net interest margin decreased 16 basis points to 4.49% due primarily to the impact of acquisitions and
margin compression in Mexico and Chile. Non-interest income increased $908 million or 22% to $5,006 million, approximately half of the increase is driven by acquisitions.
The remaining increase was due primarily to higher banking fees, investment gains, trading revenues and increased contribution from associated corporations.
Latin America
Total revenues of $9,502 million increased 23% from last year. Net interest income increased $1,124 million or 22%, driven by strong asset growth, approximately two-thirds
of the increase is driven by acquisitions. The net interest margin decreased 23 basis points to 4.43% due primarily to the impact of acquisitions and margin compression in
Mexico and Chile. Non-interest income increased $643 million or 26% to $3,162 million, approximately half of the increase is driven by acquisitions. The remaining increase
was due to higher banking fees, credit card fees, investment gains and trading revenues.
Caribbean and Central America
Total revenues were $3,295 million, up 8% over last year. Net interest income was up $63 million or 3%, driven by acquisitions. Non-interest income was up $172 million or
18% as a result of good growth in banking fees and investment gains.
Asia
Total revenues were $691 million, up 15% versus last year, driven by higher contributions from Thanachart Bank, partly due to lower provisions for credit losses.
Non-interest expenses
Non-interest expenses increased $970 million or 16% to $7,027 million. Adjusting for Acquisition-related costs, non-interest expenses were up 15%, approximately two-thirds
of the increase is driven by acquisitions. The remaining increase was due primarily to business volume growth, inflation, and higher technology costs, partly offset by benefits
from cost-reduction initiatives. Operating leverage was a positive 3.0% or 4.3% adjusting for Acquisition-related costs.
Provision for credit losses
The provision for credit losses was $2,076 million compared to $1,815 million in 2018. Adjusting for the Day 1 provision on acquired performing financial instruments, the
provision for credit losses increased $491 million driven by higher retail provisions.
The provision on impaired financial instruments was $1,922 million, up $349 million due primarily to organic and acquisition-driven asset growth in the retail portfolio partially
offset by lower commercial provisions. Last year, the impact of the commercial provision relating to the Barbados debt restructuring was offset with higher recoveries. The
provision for credit losses ratio on impaired loans was 129 basis points, an increase of one basis point. The provision on performing financial instruments was $154 million,
compared to $242 million last year. Adjusting for the impact of Day 1 provision on acquired performing financial instruments, the provision on performing financial
instruments increased $138 million. This was due to an increase in commercial provisions resulting from hurricane-related provision reversals in the prior year and less
favourable macroeconomic forecasts for the Pacific Alliance countries, as well as higher retail provisions due to asset growth. The provision for credit losses ratio was 151
basis points, an increase of 12 basis points. On an adjusted basis, the provision for credit losses ratio was 129 basis points, an increase of 11 basis points.
Provision for income taxes
The effective tax rate was 23.2% compared to 21.6% due mainly to lower tax benefits in Mexico and lower inflation in Chile.
Outlook
In 2020, International Banking will continue to leverage its diversified footprint, focused on the Pacific Alliance countries of Mexico, Colombia, Peru and Chile and supported
by a simplified footprint in the Caribbean and Central America. With a reshaped footprint we will have more scale in key markets, less risk, more growth potential, and higher
quality of earnings. Expense management and delivery of positive operating leverage remain key business priorities. The main source of uncertainty is in Chile where the
government is implementing a number of social policy measures and governance reforms to address the concerns of its population and a change in the Constitution will take
place in 2020.
2019 Scotiabank Annual Report | 45

Management’s Discussion and Analysis
Global Banking and Markets
2019 Achievements
Build strategic approach to lending by up-tiering corporate relationships and increasing lending penetration:
• Deepened client focus to expand client relationships and drive multi-faceted revenue opportunities from origination, advisory, hedging,deposits and payments.• Demonstrated leadership in green bonds financings, having participated in approximately 30 green bond offerings across six currencies,totaling more than CAD $18 billion equivalent, over the past two years.
Strengthen Investment Banking:
• As part of a multi-year strategy, built out Canadian and regional leadership capabilities to enhance the client coverage model.• Capturing cross-sell opportunities in Equity Capital Markets, Debt Capital Markets and Foreign Exchange in focus sectors such as Powerand Utilities, Energy, and Infrastructure and gaining in new sectors such as Healthcare and Real Estate.
Deepen penetration across core markets:
• Continuous progress on multi-year strategy of creating a top-tier local and cross-border wholesale banking business in the Americas.• Re-formulated Global Capital Markets Strategy and executing a GCM Transformation Program in the Pacific Alliance.• Achieved significant league table advancement in the Pacific Alliance and Latin America.• Ranked #2 in Pacific Alliance DCM, up from #6 in fiscal 2018• Ranked #3 in Latin America Syndicated Loans• Demonstrated continued leadership in Canadian Syndicated Loans; ranked #3 in Canada Loans (New Money) League Table, up from #4 infiscal 2018.
Select awards and deal highlights:
• Scotiabank achieved top-tier results in the 2019 Brendan Wood International Canadian Equities report.• Best Global Wholesale Bank 2019 – International Finance Awards (2019), Acquisition International.• Canada Large M&A Deal of the Year (2019), M&A Atlas Awards.• Introduced the innovative Scotiabank Alternative Mutual Fund Index to track the performance of Canadian liquid alternative investments.• Continued modernization of payments infrastructure – first to market with digital wire tracking for business payments.• Launched The Scotiabank Women Initiative™ for Global Banking and Markets to deepen client relationships.• Global Coordinator and Joint Bookrunner for Chilean company Arauco’s US$1 billion two-tranche Sustainable issuance.• Lead Bookrunner on over $7 billion in debt issuance for the Canadian Telecommunication sector having co-led multiple bond offerings aswell as providing backstop financing to support requirements for Canadian wireless spectrum auction.• Financial Advisor, Initial Underwriter and Joint Bookrunner on Brookfield Business Partners’ financing for the acquisition of JohnsonControls’ Power Solutions business – one of the largest Leveraged Buyouts (LBO) since the financial crisis.• Bookrunner on US$1.5 billion Senior Facilities for Global Power Generation, whereby Scotiabank provided a customized multi-currency,multi-product financing solution.• Joint Bookrunner, Dealer Manager, and Billing & Delivery Bank for a liability management transaction and simultaneous new issue for theRepublic of Peru.
46 | 2019 Scotiabank Annual Report

Management’s Discussion and Analysis | Global Banking and Markets
Business Profile
Global Banking and Markets (GBM) provides corporate clients with lending and transaction services, investment banking advice and access to capital markets. GBM is a full-
service wholesale bank in the Americas, with operations in 21 countries, serving clients across Canada, the United States, Latin America, Europe and Asia-Pacific.
Strategy
Global Banking and Markets’ strategy is focused on strengthening our franchise by expanding our full service corporate offering, and our regional and institutional
capabilities, to better serve our clients and deliver profitable growth.
2020 Priorities
• Client Focus: Increase our relevance to our corporate clients and drive alignment of resources with the most significant revenue opportunities, to capture more of the
non-lending wallet.
• Strengthen our capital markets offering: Enhance distribution and product capabilities and deepen institutional relationships.
• Build on our presence in the Americas: Enhance our franchise in Canada, continue to pursue targeted, phased growth in the U.S., create a top-tier local and cross-
border Pacific Alliance business, and leverage Europe and Asia for distribution of our Americas product in support of our corporate clients.
T21 Global Banking and Markets financial performance
($ millions) 2019(1)(2) 2018 2017
Net interest income(3) $ 1,396 $ 1,454 $ 1,336
Non-interest income(3) 3,084 3,074 3,288
Total revenue(3)4,480 4,528 4,624
Provision for credit losses (22) (50) 42
Non-interest expenses 2,463 2,233 2,160
Income tax expense(3) 505 587 604
Net income $ 1,534 $ 1,758 $ 1,818
Net income attributable to non-controlling interests in subsidiaries – – –
Net income attributable to equity holders of the Bank $ 1,534 $ 1,758 $ 1,818
Key ratios and other financial data
Return on equity(4) 13.3% 16.0% 16.0%
Productivity(3) 55.0% 49.3% 46.7%
Net interest margin(5)(6) 1.68% 1.83% 1.75%
Provision for credit losses – performing (Stages 1 and 2) $ (26) $ (22) n/a
Provision for credit losses – impaired (Stage 3) $ 4 $ (28) n/a
Provision for credit losses as a percentage of average net loans and acceptances (0.02)% (0.06)% 0.05%
Provision for credit losses on impaired loans as a percentage of average net loans and acceptances –% (0.03)% 0.05%
Net write-offs as a percentage of average net loans and acceptances 0.03% 0.03% 0.11%
Selected Consolidated Statement of Financial Position data (average balances)
Trading assets $112,317 $ 98,130 $103,861
Loans and acceptances 92,977 81,838 79,937
Earning assets 337,589 282,997 291,870
Total assets 371,909 320,850 335,599
Deposits 99,346 86,260 77,158
Total liabilities 304,253 264,983 267,377
(1) The amounts for the years ended October 31, 2019 and October 31, 2018 have been prepared in accordance with IFRS 9, prior year amounts have not been restated.
(2) The amounts for the year ended October 31, 2019 have been prepared in accordance with IFRS 15; prior year amounts have not been restated (refer to Notes 3 and 4 in the consolidated financial statements).
(3) Taxable equivalent basis.
(4) Refer to Glossary.
(5) Corporate Banking and Securitization only.
(6) Net interest income (TEB) as % of average earning assets excluding bankers’ acceptances.
2019 Scotiabank Annual Report | 47

Management’s Discussion and Analysis
48 | 2019 Scotiabank Annual Report
Financial Performance
Net income
Global Banking and Markets reported net income attributable to equity holders of $1,534 million, a decrease of
$224 million or 13%. Lower net interest income, higher non-interest expenses, as well as lower recoveries for
credit losses, were partly offset by higher trading revenue and credit fees.
Average assets and liabilities
Average assets increased by $51 billion or 16% to $372 billion this year. Adjusting for the impact of foreign
currency translation, assets increased $47 billion mainly due to increases in securities purchased under resale
agreements, trading securities, and business and government loans.
Average liabilities increased by $39 billion or 15% to $304 billion this year. Adjusting for the impact of foreign
currency translation, liabilities increased $35 billion due primarily to growth in securities sold under repurchase
agreements and deposits.
Net interest income
Net interest income decreased by 4% to $1,396 million, mainly driven by lower interest income from capital
markets operations, lower lending margins across the regions and deposit margin compression, which is offsetting
the positive impact of higher loan and deposits volume. The net interest margin was 1.68%, a decrease of 15
basis points.
Non-interest income
Non-interest income of $3,084 million increased by $10 million mainly due to higher trading revenues in equities
and fixed income, as well as higher credit fees. This was partly offset by lower advisory and underwriting fees.
Non-interest expense
Non-interest expenses increased by $230 million or 10% to $2,463 million. This was due primarily to higher
compliance and technology investments driven by regulatory requirements, higher share-based compensation,
and the unfavourable impact of foreign currency translation. Operating leverage was negative 11.3%.
Provision for credit losses
The provision for credit losses increased $28 million due primarily to higher recoveries in Europe and the U.S. last
year and higher impaired loan provisions in Canada this year. The provision for credit losses ratio was negative
two basis points, an increase of 4 basis points.
Provision for income taxes
The effective tax rate was 24.8%, compared to 25.0% in the prior year.
Outlook
In 2020, Global Banking and Markets’ growth will result from leveraging our unique footprint centered on the
Americas and by increasing our relevance to our corporate clients, strengthening our Capital Markets offerings
and building our presence in key markets. Global Banking and Markets expects to continue to deliver strong
balance sheet growth as well as improved results in Capital Markets and Business Banking. Provisions for credit
losses are expected to increase following two years of recoveries. Continued regulatory and technology
investments will lead to expense growth, but at a moderating pace. Global Banking and Markets is targeting to
achieve positive operating leverage.
C14 Total revenue
C15 Business banking revenue $ millions
C16 Capital markets revenue by business line $ millions
C17 Composition of average assets $ billions
C18 Trading day losses

Management’s Discussion and Analysis | Global Wealth Management
Global Wealth Management
The Wealth Management businesses within the Canadian Banking and International Banking segments will be reported separately as a single “Global Wealth Management”
segment effective November 1, 2019. The composition, strategy, 2020 priorities and outlook of our new reportable segment has been provided below.
Business Profile
Global Wealth Management is focused on delivering comprehensive wealth management advice and solutions to clients across Scotiabank’s footprint. Global Wealth
Management serves over 2.5 million investment fund and advisory clients across 14 countries – managing over $490 billion in assets.
Through organic growth and acquisitions, Global Wealth Management has built a robust client-centric business with comprehensive advice, products, and platforms to meet
a broad range of client needs.
Global Wealth Management is comprised of the following businesses:
• Advisory: Online brokerage (Scotia iTRADE), Mobile investment specialists (Scotiabank), Full-service brokerage (ScotiaMcLeod), Trust, Private Banking, Private
Investment Counsel (Scotia Wealth Management and MD Financial Management)
• Product Manufacturing: Retail mutual funds (Scotia & Dynamic Funds), Exchange Traded Funds (Scotia & Dynamic Funds), Liquid Alternatives (Dynamic Funds),
Institutional funds (Scotia & Jarislowsky Fraser)
Scotiatrust, ScotiaMcLeod, Scotia iTRADE, Private Banking, Private Investment Counsel, 1832 Asset Management and Dynamic Funds are top-performers in key industry
metrics.
Strategy
Global Wealth Management continues to execute on its strategy of delivering comprehensive wealth advice and investment solutions globally, through integrated advice
platforms and industry leading investment management capabilities to meet client needs.
2020 Priorities
• Maximize growth in asset management and advisory businesses by enhancing the product shelf to deliver superior investment management results to investors
across our distribution network; and delivering integrated wealth management solutions for clients with complex needs.
• Leverage our acquisitions to grow in new segments including institutional mandates in Canada and internationally; and deliver value added wealth management
services to Jarislowsky Fraser and MD Financial clients.
• Expand international capabilities and offering to deliver investment solutions and wealth management advice to new clients in priority markets.
Outlook
Global Wealth Management’s unique operating model is well positioned for growth in 2020 driven by continued momentum in the core asset management and advisory
businesses; leveraging MD Financial and Jarislowsky Fraser for growth in new segments; and delivering best in class products and solutions through the Bank’s footprint in
Canada and internationally. Expense management and delivery of positive operating leverage remain key business priorities.
2019 Scotiabank Annual Report | 49
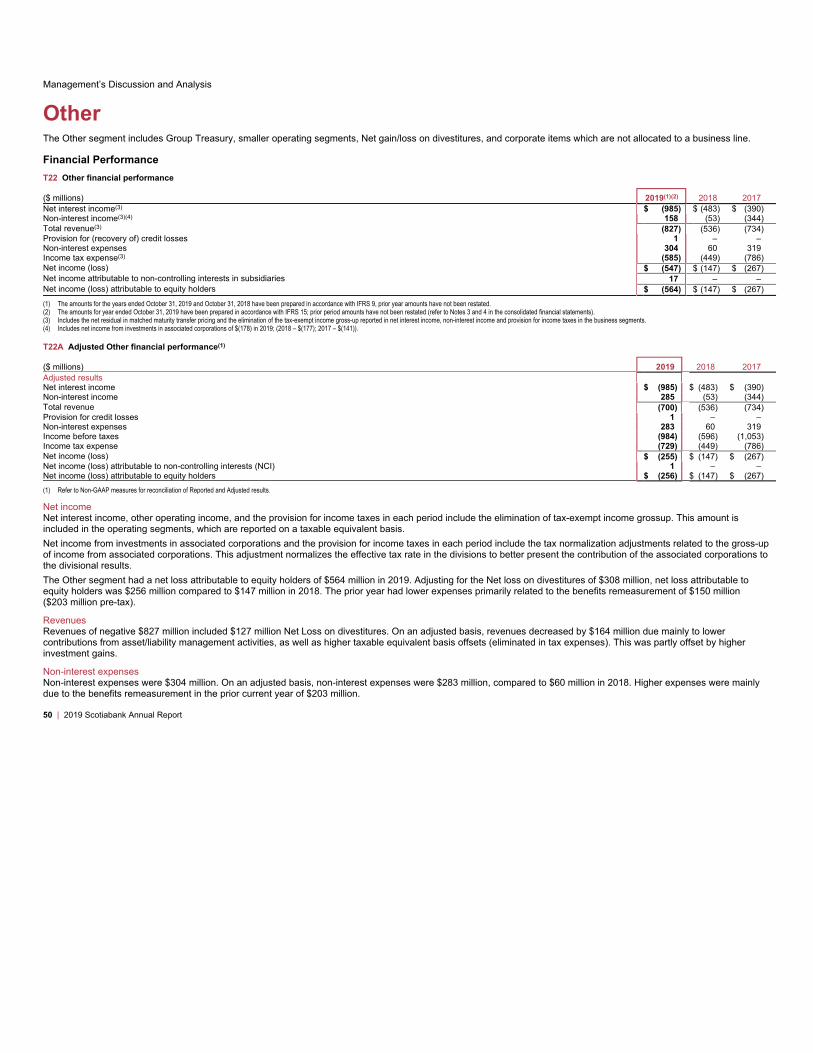
Management’s Discussion and Analysis
Other
The Other segment includes Group Treasury, smaller operating segments, Net gain/loss on divestitures, and corporate items which are not allocated to a business line.
Financial Performance
T22 Other financial performance
($ millions) 2019(1)(2) 2018 2017
Net interest income(3) $ (985) $ (483) $ (390)
Non-interest income(3)(4) 158 (53) (344)
Total revenue(3)(827) (536) (734)
Provision for (recovery of) credit losses 1 – –
Non-interest expenses 304 60 319
Income tax expense(3) (585) (449) (786)
Net income (loss) $ (547) $ (147) $ (267)
Net income attributable to non-controlling interests in subsidiaries 17 – –
Net income (loss) attributable to equity holders $ (564) $ (147) $ (267)
(1) The amounts for the years ended October 31, 2019 and October 31, 2018 have been prepared in accordance with IFRS 9, prior year amounts have not been restated.
(2) The amounts for year ended October 31, 2019 have been prepared in accordance with IFRS 15; prior period amounts have not been restated (refer to Notes 3 and 4 in the consolidated financial statements).
(3) Includes the net residual in matched maturity transfer pricing and the elimination of the tax-exempt income gross-up reported in net interest income, non-interest income and provision for income taxes in the business segments.
(4) Includes net income from investments in associated corporations of $(178) in 2019; (2018 – $(177); 2017 – $(141)).
T22A Adjusted Other financial performance(1)
($ millions) 2019 2018 2017
Adjusted results
Net interest income $ (985) $ (483) $ (390)
Non-interest income 285 (53) (344)
Total revenue (700) (536) (734)
Provision for credit losses 1 – –
Non-interest expenses 283 60 319
Income before taxes (984) (596) (1,053)
Income tax expense (729) (449) (786)
Net income (loss) $ (255) $ (147) $ (267)
Net income (loss) attributable to non-controlling interests (NCI) 1 – –
Net income (loss) attributable to equity holders $ (256) $ (147) $ (267)
(1) Refer to Non-GAAP measures for reconciliation of Reported and Adjusted results.
Net income
Net interest income, other operating income, and the provision for income taxes in each period include the elimination of tax-exempt income grossup. This amount is
included in the operating segments, which are reported on a taxable equivalent basis.
Net income from investments in associated corporations and the provision for income taxes in each period include the tax normalization adjustments related to the gross-up
of income from associated corporations. This adjustment normalizes the effective tax rate in the divisions to better present the contribution of the associated corporations to
the divisional results.
The Other segment had a net loss attributable to equity holders of $564 million in 2019. Adjusting for the Net loss on divestitures of $308 million, net loss attributable to
equity holders was $256 million compared to $147 million in 2018. The prior year had lower expenses primarily related to the benefits remeasurement of $150 million
($203 million pre-tax).
Revenues
Revenues of negative $827 million included $127 million Net Loss on divestitures. On an adjusted basis, revenues decreased by $164 million due mainly to lower
contributions from asset/liability management activities, as well as higher taxable equivalent basis offsets (eliminated in tax expenses). This was partly offset by higher
investment gains.
Non-interest expenses
Non-interest expenses were $304 million. On an adjusted basis, non-interest expenses were $283 million, compared to $60 million in 2018. Higher expenses were mainly
due to the benefits remeasurement in the prior current year of $203 million.
50 | 2019 Scotiabank Annual Report

Management’s Discussion and Analysis | Other
Financial Performance of Business Lines: 2018 vs. 2017
Canadian Banking
Canadian Banking reported net income attributable to equity holders of $4,364 million in 2018, up 7% from last year. Adjusting for Acquisition-related costs, net
income was $4,416 million, up 8%. This reflects the contributions from acquisitions in the current year, partly offset by last year’s gain on sale of HollisWealth (“Sale of
Business”) as well as lower gains on sale of real estate.
Solid growth in assets and deposits, along with improving margin driven primarily from the Bank of Canada interest rate increase, higher non-interest income and
lower provision for credit losses contributed to strong growth in 2018. This was partly offset by higher non-interest expenses. Return on equity was 22.7%, compared
with 22.8% last year. Adjusting for Acquisition-related costs, the return on equity was 23.0%.
International Banking
International Banking reported net income attributable to equity holders of $2,573 million, up $183 million or 8% from last year. Adjusting for Acquisition-related costs,
net income attributable to equity holders increased by $395 million or 16% to $2,819 million. Strong results in Latin America, including benefits from acquisitions, and
Asia, complemented solid earnings in the Caribbean. The impact of the acquisitions and the benefit of one additional month of earnings, from the Alignment of the
reporting period in Chile and Thailand, contributed 3% to the adjusted earnings growth. The remaining increase was driven by strong loan growth in Latin America,
higher non-interest income, and lower taxes. This was partly offset by higher provision for credit losses and non-interest expenses, a lower net interest margin and the
negative impact of foreign currency translation. Return on equity was 14.4% compared to 14.7% last year. Adjusting for Acquisition-related costs, the return on equity
was 15.8%.
Global Banking and Markets
Global Banking and Markets reported net income attributable to equity holders of $1,758 million, a decrease of $60 million or 3% from last year. Lower income from
capital markets businesses and higher expenses were partly offset by stronger results in corporate lending, as well as lower provision for credit losses. Return on
equity was 16.0%, in line with the prior year.
Other
The Other segment had a net loss attributable to equity holders of $147 million in 2018 compared to $267 million in 2017. This was primarily due to the benefits
remeasurement of $150 million ($203 million pre-tax).
2019 Scotiabank Annual Report | 51
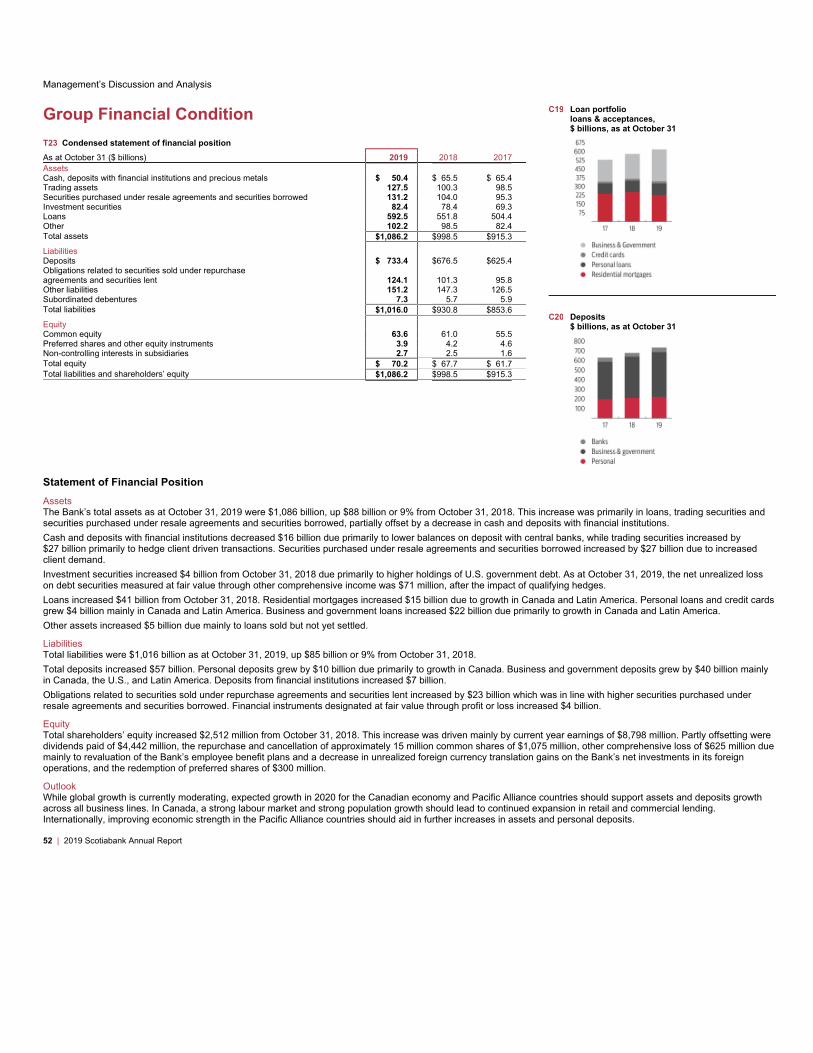
Management’s Discussion and Analysis
Statement of Financial Position
Assets
The Bank’s total assets as at October 31, 2019 were $1,086 billion, up $88 billion or 9% from October 31, 2018. This increase was primarily in loans, trading securities and
securities purchased under resale agreements and securities borrowed, partially offset by a decrease in cash and deposits with financial institutions.
Cash and deposits with financial institutions decreased $16 billion due primarily to lower balances on deposit with central banks, while trading securities increased by
$27 billion primarily to hedge client driven transactions. Securities purchased under resale agreements and securities borrowed increased by $27 billion due to increased
client demand.
Investment securities increased $4 billion from October 31, 2018 due primarily to higher holdings of U.S. government debt. As at October 31, 2019, the net unrealized loss
on debt securities measured at fair value through other comprehensive income was $71 million, after the impact of qualifying hedges.
Loans increased $41 billion from October 31, 2018. Residential mortgages increased $15 billion due to growth in Canada and Latin America. Personal loans and credit cards
grew $4 billion mainly in Canada and Latin America. Business and government loans increased $22 billion due primarily to growth in Canada and Latin America.
Other assets increased $5 billion due mainly to loans sold but not yet settled.
Liabilities
Total liabilities were $1,016 billion as at October 31, 2019, up $85 billion or 9% from October 31, 2018.
Total deposits increased $57 billion. Personal deposits grew by $10 billion due primarily to growth in Canada. Business and government deposits grew by $40 billion mainly
in Canada, the U.S., and Latin America. Deposits from financial institutions increased $7 billion.
Obligations related to securities sold under repurchase agreements and securities lent increased by $23 billion which was in line with higher securities purchased under
resale agreements and securities borrowed. Financial instruments designated at fair value through profit or loss increased $4 billion.
Equity
Total shareholders’ equity increased $2,512 million from October 31, 2018. This increase was driven mainly by current year earnings of $8,798 million. Partly offsetting were
dividends paid of $4,442 million, the repurchase and cancellation of approximately 15 million common shares of $1,075 million, other comprehensive loss of $625 million due
mainly to revaluation of the Bank’s employee benefit plans and a decrease in unrealized foreign currency translation gains on the Bank’s net investments in its foreign
operations, and the redemption of preferred shares of $300 million.
Outlook
While global growth is currently moderating, expected growth in 2020 for the Canadian economy and Pacific Alliance countries should support assets and deposits growth
across all business lines. In Canada, a strong labour market and strong population growth should lead to continued expansion in retail and commercial lending.
Internationally, improving economic strength in the Pacific Alliance countries should aid in further increases in assets and personal deposits.
52 | 2019 Scotiabank Annual Report
Group Financial Condition
T23 Condensed statement of financial position
As at October 31 ($ billions) 2019 2018 2017
Assets
Cash, deposits with financial institutions and precious metals $ 50.4 $ 65.5 $ 65.4
Trading assets 127.5 100.3 98.5
Securities purchased under resale agreements and securities borrowed 131.2 104.0 95.3
Investment securities 82.4 78.4 69.3
Loans 592.5 551.8 504.4
Other 102.2 98.5 82.4
Total assets $1,086.2 $998.5 $915.3
Liabilities
Deposits $ 733.4 $676.5 $625.4
Obligations related to securities sold under repurchase
agreements and securities lent 124.1 101.3 95.8
Other liabilities 151.2 147.3 126.5
Subordinated debentures 7.3 5.7 5.9
Total liabilities $1,016.0 $930.8 $853.6
Equity
Common equity 63.6 61.0 55.5
Preferred shares and other equity instruments 3.9 4.2 4.6
Non-controlling interests in subsidiaries 2.7 2.5 1.6
Total equity $ 70.2 $ 67.7 $ 61.7
Total liabilities and shareholders’ equity $1,086.2 $998.5 $915.3
C19 Loan portfolio
loans & acceptances,
$ billions, as at October 31
C20 Deposits
$ billions, as at October 31

Management’s Discussion and Analysis | Group Financial Condition
Capital Management
Overview
Scotiabank is committed to maintaining a strong capital base to support the risks associated with its diversified businesses. Strong capital levels contribute to financial safety
for the Bank’s customers, foster investor confidence and support strong credit ratings. It also allows the Bank to take advantage of growth opportunities as they arise and
enhance shareholder returns through increased dividends. The Bank’s capital management framework includes a comprehensive internal capital adequacy assessment
process (ICAAP), aimed at ensuring that the Bank’s capital is adequate to meet current and future risks and achieve its strategic objectives. Key components of the Bank’s
ICAAP include sound corporate governance; creating a comprehensive risk appetite for the Bank; managing and monitoring capital, both currently and prospectively; and
utilizing appropriate financial metrics which relate risk to capital, including internal capital and regulatory capital measures.
Governance and oversight
The Bank has a sound capital management framework to measure, deploy and monitor its available capital and assess its adequacy. Capital is managed in accordance with
the Board-approved Capital Management Policy. In addition, the Board reviews and approves the Bank’s annual capital plan. The Asset-Liability Committee and senior
executive management provide governance over the capital management process. The Bank’s Finance, Treasury and Global Risk Management groups take a coordinated
approach to implementing the Bank’s capital plan.
Risk appetite
The risk appetite framework that establishes enterprise wide risk tolerances in addition to capital targets are detailed in the Risk Management section “Risk Appetite”. The
framework encompasses medium-term targets with respect to regulatory capital thresholds, earnings and other risk-based parameters. These targets drive behaviour to
work to ensure the Bank achieves the following overall objectives: exceed regulatory and internal capital targets, manage capital levels commensurate with the risk profile of
the Bank, maintain strong credit ratings and provide the Bank’s shareholders with acceptable returns.
Regulatory capital
Effective November 1, 2012, Canadian banks are subject to the revised capital adequacy requirements as published by the Basel Committee on Banking Supervision
(BCBS) and commonly referred to as Basel III. Basel III builds on the “International Convergence of Capital Measurement and Capital Standards: A Revised
Framework” (Basel II). Under Basel III, there are three primary risk-based regulatory capital ratios used to assess capital adequacy: Common Equity Tier 1 (CET1), Tier 1
and Total capital, which are determined by dividing those capital components by risk-weighted assets. Basel III also provides guidance on non-viability contingent capital
(NVCC). The guidance stipulates that in order to qualify as regulatory capital, non-common share capital instruments must be convertible into common equity upon a trigger
event as defined within the guidance. All non-common share capital instruments issued after December 31, 2012, are required to meet these NVCC requirements to qualify
as regulatory capital.
The Office of the Superintendent of Financial Institutions, Canada (OSFI) has issued guidelines, reporting requirements and disclosure guidance which are consistent with
the Basel III reforms.
OSFI requires Canadian deposit-taking institutions to meet minimum requirements related to risk-weighted assets of 7%, 8.5% and 10.5% for CET1, Tier 1 and Total Capital
ratios, respectively. OSFI has also designated the Bank a domestic systemically important bank (D-SIB), increasing its minimum capital ratio requirements by 1% across all
tiers of capital, in line with the requirements for global systemically important banks. Furthermore, an additional Domestic Stability Buffer of 2.0% was implemented as a Pillar
2 requirement as noted below.
In addition to risk-based capital requirements, the Basel III reforms introduced a simpler, non risk-based Leverage ratio requirement to act as a supplementary measure to its
risk-based capital requirements. The Leverage ratio is defined as a ratio of Basel III Tier 1 capital to a leverage exposure measure which includes on-balance sheet assets
and off-balance sheet commitments, derivatives and securities financing transactions, as defined within the requirements. In January 2014, the BCBS issued revisions to the
Basel III Leverage ratio framework. In 2014, OSFI released its Basel III Leverage Ratio Requirements Guideline and Public Disclosure Requirements which outlines the
application and disclosure of the Basel III Leverage ratio in Canada and the replacement of the former Assets-to-Capital Multiple (ACM), effective the first quarter of 2015.
Institutions are expected to maintain a material operating buffer above the 3% minimum.
Regulatory capital developments during the year
Capital Adequacy and Leverage Requirements
Effective the first quarter of 2019, OSFI finalized revisions to its Capital Adequacy Requirements (CAR) Guideline that include: implementation of the revised standardized
approach to counterparty credit risk and centralized counterparties (CCPs); implementation of the revised securitization framework, including OSFI’s transitional provisions
which substantially delay the impact on regulatory capital to the first quarter of 2020; and, the removal of the CVA phase-in transitional arrangements which concluded at the
end of 2018. The revisions also codify in the CAR Guideline changes to the Basel II standardized regulatory capital floor, which were announced in January 2018 and
implemented in the second quarter of 2018. OSFI’s 2019 revisions to its Leverage Ratio framework and its disclosure requirements align the Leverage Ratio Guideline with
related changes within the CAR Guideline in respect of securitizations and counterparty credit risk.
In addition, effective 2019 OSFI implemented the amendments to Basel III as finalized by the BCBS in respect of holdings of Other Total Loss Absorbing Capital (TLAC)
instruments issued by global systemically important banks (G-SIBs) which qualify towards their TLAC requirements and instruments ranking pari passu with those
instruments. The BCBS regulatory capital treatment in respect of holdings of Other TLAC aims to reduce a significant source of contagion in the banking system. OSFI has
also determined that it is appropriate to extend the Basel III treatment to holdings of Other TLAC instruments issued by Canadian D-SIBs.
Domestic Stability Buffer
In order to provide increased transparency to the market, OSFI clarified its additional requirement for its Domestic Stability Buffer, currently held by Domestic Systemically
Important Banks (D-SIBs) as a Pillar 2 buffer requirement. The Domestic Stability Buffer is not a Pillar 1 buffer. Breaches will not result in banks being subject to automatic
constraints on capital distributions. If a D-SIB breaches the buffer (i.e. dips into the buffer when it has not been released), OSFI will require a remediation plan. Supervisory
interventions pursuant to OSFI’s Guide to Intervention would occur in cases where a remediation plan is not produced or executed in a timely manner satisfactory to OSFI.
As noted above, OSFI’s minimum Pillar 1 capital ratio requirements, including the D-SIB 1% surcharge, are 8.0%, 9.5% and 11.5% for Common Equity Tier 1, Tier 1 and
Total capital ratios, respectively. The Domestic Stability Buffer will range between 0 and 2.5% of a bank’s total risk-
2019 Scotiabank Annual Report | 53

Management’s Discussion and Analysis
weighted assets (RWA). OSFI will undertake a review of the buffer on a semi-annual basis, in June and December, and any changes to the buffer will be made public, along
with supporting rationale. In exceptional circumstances, OSFI may make and announce adjustments to the buffer in-between scheduled review dates.
During fiscal 2019, OSFI announced a 25 basis point increase to its Domestic Stability Buffer at each semi-annual review. As at year end, the Domestic Stability Buffer was
set at 2.0% of total risk-weighted assets.
Total Loss Absorbing Capacity (TLAC)
OSFI has issued its guideline on Total Loss Absorbing Capacity (TLAC), which applies to Canada’s D-SIBs as part of the Federal Government’s bail-in regime. The
standards are intended to address the sufficiency of a systemically important bank’s loss absorbing capacity to support its recapitalization in the event of its failure. Effective
November 1, 2021, D-SIBs will be required to maintain a minimum risk-based TLAC ratio and a minimum TLAC leverage ratio. TLAC is defined as the aggregate of Tier 1
capital, Tier 2 capital, and other TLAC instruments that are subject to conversion in whole or in part into common shares under the CDIC Act and meet all of the eligibility
criteria under the guidelines. The Bank’s minimum TLAC ratio requirements consist of 21.5% of risk-weighted assets (plus the Domestic Stability Buffer requirement) and
6.75% of leverage ratio exposures. OSFI may subsequently vary the minimum TLAC requirements for individual D-SIBs or groups of D-SIBs. Where a D-SIB falls below the
minimum TLAC requirements, OSFI may take any measures deemed appropriate, including measures set out in the Bank Act. The Bank does not anticipate any challenges
in meeting its TLAC requirements.
OSFI also revised its Capital Adequacy Requirements (CAR) guideline to implement the amendments to Basel III finalized by the BCBS in October 2016 in respect of
holdings of Other TLAC Instruments issued by global systemically important banks (G-SIBs) that qualify towards their TLAC requirements and instruments ranking pari
passu with those instruments. The BCBS regulatory capital treatment in respect of holdings of Other TLAC aims to reduce a significant source of contagion in the banking
system. OSFI has determined that it is appropriate to extend the Basel III treatment to holdings of Other TLAC instruments issued by Canadian D-SIBs. The regulatory
adjustments relating to holdings of Other TLAC instruments applied from November 1, 2018.
In addition, we continue to monitor and prepare for new regulatory capital developments to ensure compliance with these requirements.
Planning, managing and monitoring capital
Capital is managed and monitored based on planned changes in the Bank’s strategy, identified changes in its operating environment or changes in its risk profile. As part of
the Bank’s comprehensive ICAAP, sources and uses of capital are continuously measured and monitored through financial metrics, including regulatory thresholds, and
internal capital. These results are used in capital planning and strategic decision-making.
The Bank’s assessment of capital adequacy is in the context of its current position and its expected future risk profile and position relative to its internal targets while
considering the potential impact of various stress scenarios. Specific scenarios are selected based on the current economic conditions and business events facing the Bank.
In addition, the Bank’s forward looking capital adequacy assessment includes a consideration of the results of more severe multi-risk scenarios within its enterprise-wide
stress testing. This testing is used to determine the extent to which severe, but plausible events, impact the Bank’s capital.
The Bank sets internal regulatory capital targets to ensure the Bank’s available capital is sufficient within the context of its risk appetite.
The Bank’s internal target includes an adequate buffer over the regulatory minimum ensuring sufficient flexibility for future capital deployment and in consideration of the
Bank’s risk appetite, the volatility of planning assumptions, the results from stress testing and contingency planning.
The Bank has a comprehensive risk management framework to ensure that the risks taken while conducting its business activities are consistent with its risk appetite, its
impact on capital relative to internal targets, and that there is an appropriate balance between risk and return. Refer to the Risk Management section for further discussion on
the Bank’s risk management framework. In managing the Bank’s capital base, close attention is paid to the cost and availability of the various types of capital, desired
leverage, changes in the assets and risk-weighted assets, and the opportunities to profitably deploy capital. The amount of capital required for the business risks being
assumed, and to meet regulatory requirements, is balanced against the goal of generating an appropriate return for the Bank’s shareholders.
Capital generation
Capital is generated internally through net earnings after dividend payments. As well, capital is generated by the issuance of common shares, preferred shares and other
equity instruments, and subordinated debentures, net of redemptions.
Capital deployment
The Bank deploys capital to support sustainable, long-term revenue and net income growth. The growth can be through existing businesses by attracting new customers,
increasing cross-selling activities to existing customers, adding new products and enhancing sales productivity, or through acquisitions. All major initiatives to deploy capital
are subject to rigorous analysis, validation of business case assumptions and evaluation of expected benefits. Key financial criteria include impact on earnings per share,
capital ratios, return on invested capital, expected payback period and internal rate of return based on discounted cash flows.
Regulatory capital ratios
The Bank continues to maintain strong, high quality capital levels which position it well for future business growth. The Common Equity Tier 1 (CET1) ratio as at October 31,
2019 was 11.1%, remaining flat from prior year due primarily to strong internal capital generation which was offset by strong risk-weighted asset growth, share buybacks
under the Bank’s Normal Course Issuer Bid, the impact from employee pension and retirement benefits on accumulated other comprehensive income, and the impact from
the Bank’s acquisitions during the year.
The Bank’s Tier 1 capital ratio was 12.2% as at October 31, 2019, a decline of approximately 30 basis points from the prior year, primarily due to the redemptions of
$650 million of Scotiabank Tier 1 Trust Securities and $300 million of preferred shares. The Total capital ratio was 14.2% as at October 31, 2019, a decline of 10 basis points
from 2018, due primarily to the redemptions of Tier 1 capital noted above and the redemption of $1.75 billion of subordinated debentures. These redemptions were partly
offset by the issuances of $3.25 billion of subordinated debentures during the year. The Leverage ratio was 4.2% a decline of approximately 30 basis points in 2019 due
primarily to the Bank’s acquisitions and strong organic asset growth.
The Bank’s capital ratios continue to be well in excess of OSFI’s minimum capital ratio requirements for 2019 (including the 1% D-SIB surcharge and 2% Domestic Stability
Buffer requirements) of 10.0%, 11.5% and 13.5% for CET1, Tier 1 and Total Capital, respectively. The Bank was well above the OSFI minimum Leverage ratio as at
October 31, 2019.
54 | 2019 Scotiabank Annual Report
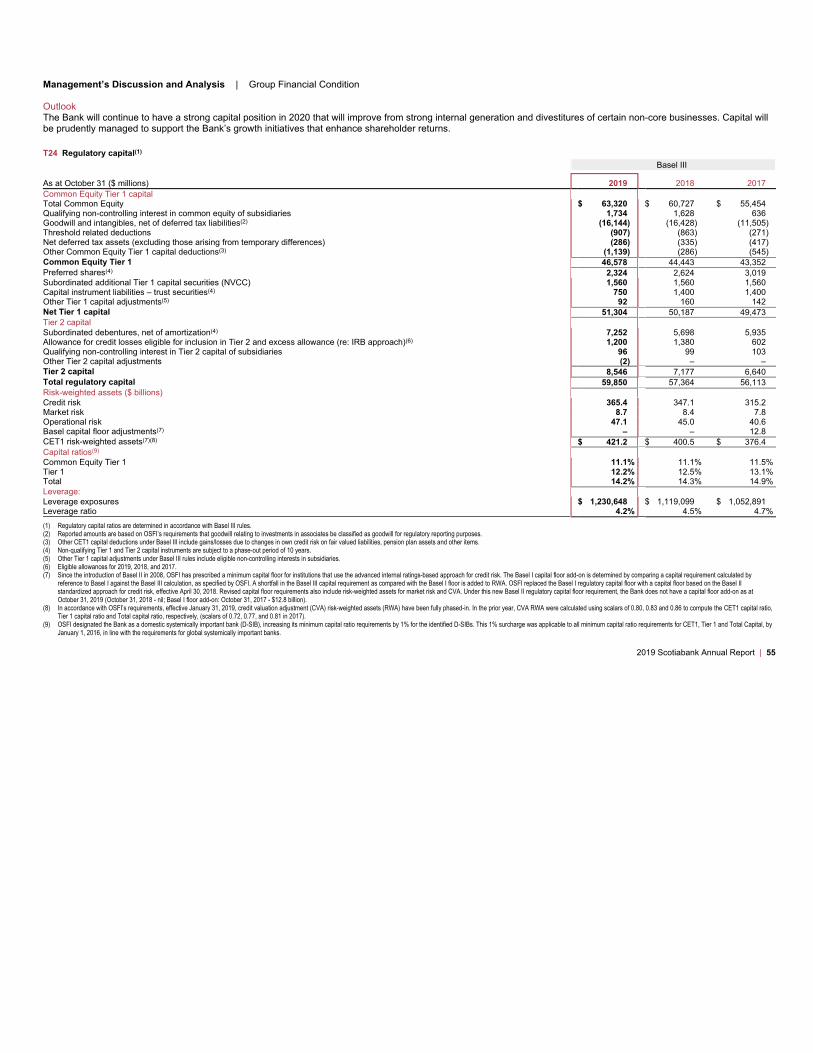
Management’s Discussion and Analysis | Group Financial Condition
Outlook
The Bank will continue to have a strong capital position in 2020 that will improve from strong internal generation and divestitures of certain non-core businesses. Capital will
be prudently managed to support the Bank’s growth initiatives that enhance shareholder returns.
T24 Regulatory capital(1)
Basel III
As at October 31 ($ millions) 2019 2018 2017
Common Equity Tier 1 capital
Total Common Equity $ 63,320 $ 60,727 $ 55,454
Qualifying non-controlling interest in common equity of subsidiaries 1,734 1,628 636
Goodwill and intangibles, net of deferred tax liabilities(2) (16,144) (16,428) (11,505)
Threshold related deductions (907) (863) (271)
Net deferred tax assets (excluding those arising from temporary differences) (286) (335) (417)
Other Common Equity Tier 1 capital deductions(3) (1,139) (286) (545)
Common Equity Tier 1 46,578 44,443 43,352
Preferred shares(4)2,324 2,624 3,019
Subordinated additional Tier 1 capital securities (NVCC) 1,560 1,560 1,560
Capital instrument liabilities – trust securities(4) 750 1,400 1,400
Other Tier 1 capital adjustments(5) 92 160 142
Net Tier 1 capital 51,304 50,187 49,473
Tier 2 capital
Subordinated debentures, net of amortization(4) 7,252 5,698 5,935
Allowance for credit losses eligible for inclusion in Tier 2 and excess allowance (re: IRB approach)(6) 1,200 1,380 602
Qualifying non-controlling interest in Tier 2 capital of subsidiaries 96 99 103
Other Tier 2 capital adjustments (2) – –
Tier 2 capital 8,546 7,177 6,640
Total regulatory capital 59,850 57,364 56,113
Risk-weighted assets ($ billions)
Credit risk 365.4 347.1 315.2
Market risk 8.7 8.4 7.8
Operational risk 47.1 45.0 40.6
Basel capital floor adjustments(7) – – 12.8
CET1 risk-weighted assets(7)(8)$ 421.2 $ 400.5 $ 376.4
Capital ratios(9)
Common Equity Tier 1 11.1% 11.1% 11.5%
Tier 1 12.2% 12.5% 13.1%
Total 14.2% 14.3% 14.9%
Leverage:
Leverage exposures $ 1,230,648 $ 1,119,099 $ 1,052,891
Leverage ratio 4.2% 4.5% 4.7%
(1) Regulatory capital ratios are determined in accordance with Basel III rules.
(2) Reported amounts are based on OSFI’s requirements that goodwill relating to investments in associates be classified as goodwill for regulatory reporting purposes.
(3) Other CET1 capital deductions under Basel III include gains/losses due to changes in own credit risk on fair valued liabilities, pension plan assets and other items.
(4) Non-qualifying Tier 1 and Tier 2 capital instruments are subject to a phase-out period of 10 years.
(5) Other Tier 1 capital adjustments under Basel III rules include eligible non-controlling interests in subsidiaries.
(6) Eligible allowances for 2019, 2018, and 2017.
(7) Since the introduction of Basel II in 2008, OSFI has prescribed a minimum capital floor for institutions that use the advanced internal ratings-based approach for credit risk. The Basel I capital floor add-on is determined by comparing a capital requirement calculated by
reference to Basel I against the Basel III calculation, as specified by OSFI. A shortfall in the Basel III capital requirement as compared with the Basel I floor is added to RWA. OSFI replaced the Basel I regulatory capital floor with a capital floor based on the Basel II
standardized approach for credit risk, effective April 30, 2018. Revised capital floor requirements also include risk-weighted assets for market risk and CVA. Under this new Basel II regulatory capital floor requirement, the Bank does not have a capital floor add-on as at
October 31, 2019 (October 31, 2018 - nil; Basel I floor add-on: October 31, 2017 - $12.8 billion).
(8) In accordance with OSFI’s requirements, effective January 31, 2019, credit valuation adjustment (CVA) risk-weighted assets (RWA) have been fully phased-in. In the prior year, CVA RWA were calculated using scalars of 0.80, 0.83 and 0.86 to compute the CET1 capital ratio,
Tier 1 capital ratio and Total capital ratio, respectively, (scalars of 0.72, 0.77, and 0.81 in 2017).
(9) OSFI designated the Bank as a domestic systemically important bank (D-SIB), increasing its minimum capital ratio requirements by 1% for the identified D-SIBs. This 1% surcharge was applicable to all minimum capital ratio requirements for CET1, Tier 1 and Total Capital, by
January 1, 2016, in line with the requirements for global systemically important banks.
2019 Scotiabank Annual Report | 55
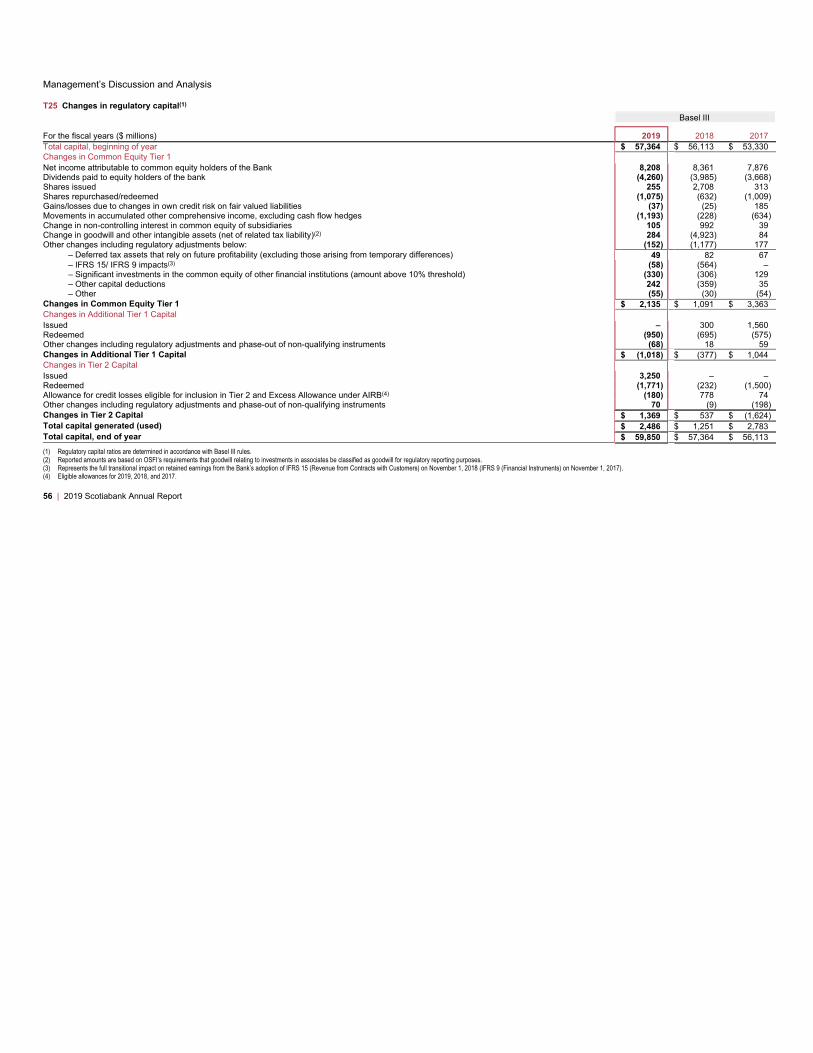
Management’s Discussion and Analysis
T25 Changes in regulatory capital(1)
Basel III
For the fiscal years ($ millions) 2019 2018 2017
Total capital, beginning of year $ 57,364 $ 56,113 $ 53,330
Changes in Common Equity Tier 1
Net income attributable to common equity holders of the Bank 8,208 8,361 7,876
Dividends paid to equity holders of the bank (4,260) (3,985) (3,668)
Shares issued 255 2,708 313
Shares repurchased/redeemed (1,075) (632) (1,009)
Gains/losses due to changes in own credit risk on fair valued liabilities (37) (25) 185
Movements in accumulated other comprehensive income, excluding cash flow hedges (1,193) (228) (634)
Change in non-controlling interest in common equity of subsidiaries 105 992 39
Change in goodwill and other intangible assets (net of related tax liability)(2) 284 (4,923) 84
Other changes including regulatory adjustments below: (152) (1,177) 177
– Deferred tax assets that rely on future profitability (excluding those arising from temporary differences) 49 82 67
– IFRS 15/ IFRS 9 impacts(3) (58) (564) –
– Significant investments in the common equity of other financial institutions (amount above 10% threshold) (330) (306) 129
– Other capital deductions 242 (359) 35
– Other (55) (30) (54)
Changes in Common Equity Tier 1 $ 2,135 $ 1,091 $ 3,363
Changes in Additional Tier 1 Capital
Issued – 300 1,560
Redeemed (950) (695) (575)
Other changes including regulatory adjustments and phase-out of non-qualifying instruments (68) 18 59
Changes in Additional Tier 1 Capital $ (1,018) $ (377) $ 1,044
Changes in Tier 2 Capital
Issued 3,250 – –
Redeemed (1,771) (232) (1,500)
Allowance for credit losses eligible for inclusion in Tier 2 and Excess Allowance under AIRB(4) (180) 778 74
Other changes including regulatory adjustments and phase-out of non-qualifying instruments 70 (9) (198)
Changes in Tier 2 Capital $ 1,369 $ 537 $ (1,624)
Total capital generated (used) $ 2,486 $ 1,251 $ 2,783
Total capital, end of year $ 59,850 $ 57,364 $ 56,113
(1) Regulatory capital ratios are determined in accordance with Basel III rules.
(2) Reported amounts are based on OSFI’s requirements that goodwill relating to investments in associates be classified as goodwill for regulatory reporting purposes.
(3) Represents the full transitional impact on retained earnings from the Bank’s adoption of IFRS 15 (Revenue from Contracts with Customers) on November 1, 2018 (IFRS 9 (Financial Instruments) on November 1, 2017).
(4) Eligible allowances for 2019, 2018, and 2017.
56 | 2019 Scotiabank Annual Report
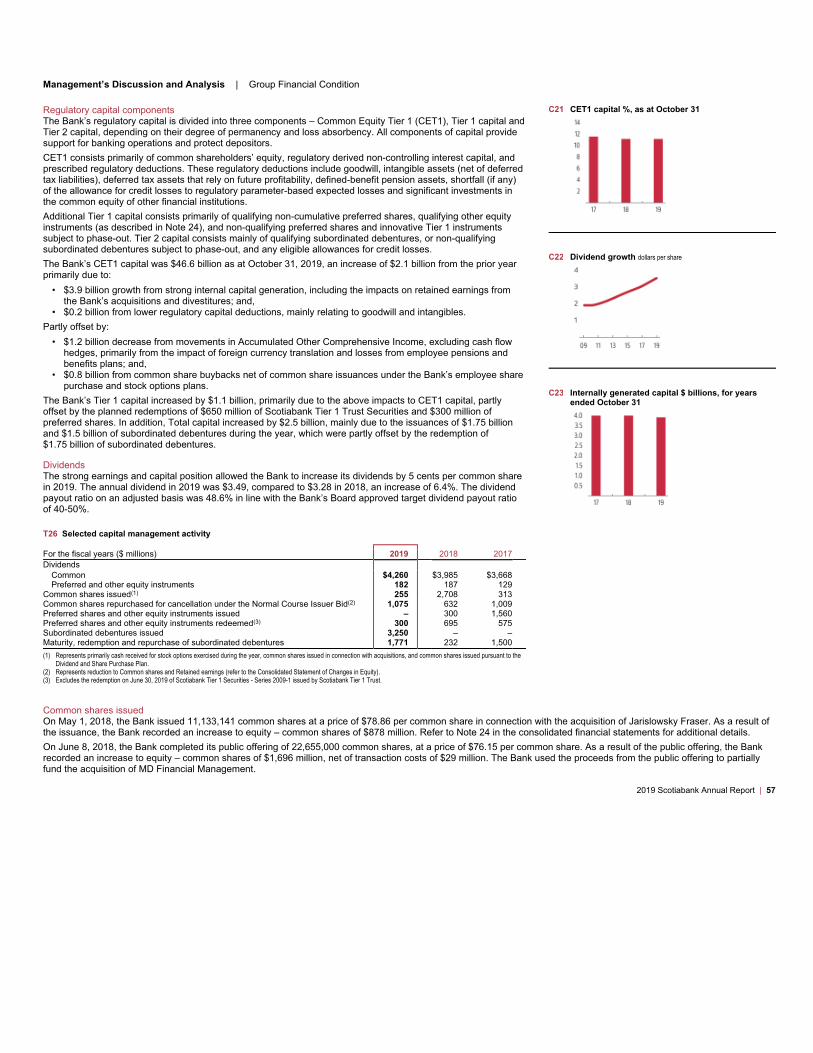
Management’s Discussion and Analysis | Group Financial Condition
Common shares issued
On May 1, 2018, the Bank issued 11,133,141 common shares at a price of $78.86 per common share in connection with the acquisition of Jarislowsky Fraser. As a result of
the issuance, the Bank recorded an increase to equity – common shares of $878 million. Refer to Note 24 in the consolidated financial statements for additional details.
On June 8, 2018, the Bank completed its public offering of 22,655,000 common shares, at a price of $76.15 per common share. As a result of the public offering, the Bank
recorded an increase to equity – common shares of $1,696 million, net of transaction costs of $29 million. The Bank used the proceeds from the public offering to partially
fund the acquisition of MD Financial Management.
2019 Scotiabank Annual Report | 57
Regulatory capital components
The Bank’s regulatory capital is divided into three components – Common Equity Tier 1 (CET1), Tier 1 capital and
Tier 2 capital, depending on their degree of permanency and loss absorbency. All components of capital provide
support for banking operations and protect depositors.
CET1 consists primarily of common shareholders’ equity, regulatory derived non-controlling interest capital, and
prescribed regulatory deductions. These regulatory deductions include goodwill, intangible assets (net of deferred
tax liabilities), deferred tax assets that rely on future profitability, defined-benefit pension assets, shortfall (if any)
of the allowance for credit losses to regulatory parameter-based expected losses and significant investments in
the common equity of other financial institutions.
Additional Tier 1 capital consists primarily of qualifying non-cumulative preferred shares, qualifying other equity
instruments (as described in Note 24), and non-qualifying preferred shares and innovative Tier 1 instruments
subject to phase-out. Tier 2 capital consists mainly of qualifying subordinated debentures, or non-qualifying
subordinated debentures subject to phase-out, and any eligible allowances for credit losses.
The Bank’s CET1 capital was $46.6 billion as at October 31, 2019, an increase of $2.1 billion from the prior year
primarily due to:
• $3.9 billion growth from strong internal capital generation, including the impacts on retained earnings from
the Bank’s acquisitions and divestitures; and,
• $0.2 billion from lower regulatory capital deductions, mainly relating to goodwill and intangibles.
Partly offset by:
• $1.2 billion decrease from movements in Accumulated Other Comprehensive Income, excluding cash flow
hedges, primarily from the impact of foreign currency translation and losses from employee pensions and
benefits plans; and,
• $0.8 billion from common share buybacks net of common share issuances under the Bank’s employee share
purchase and stock options plans.
The Bank’s Tier 1 capital increased by $1.1 billion, primarily due to the above impacts to CET1 capital, partly
offset by the planned redemptions of $650 million of Scotiabank Tier 1 Trust Securities and $300 million of
preferred shares. In addition, Total capital increased by $2.5 billion, mainly due to the issuances of $1.75 billion
and $1.5 billion of subordinated debentures during the year, which were partly offset by the redemption of
$1.75 billion of subordinated debentures.
Dividends
The strong earnings and capital position allowed the Bank to increase its dividends by 5 cents per common share
in 2019. The annual dividend in 2019 was $3.49, compared to $3.28 in 2018, an increase of 6.4%. The dividend
payout ratio on an adjusted basis was 48.6% in line with the Bank’s Board approved target dividend payout ratio
of 40-50%.
T26 Selected capital management activity
For the fiscal years ($ millions) 2019 2018 2017
Dividends
Common $4,260 $3,985 $3,668
Preferred and other equity instruments 182 187 129
Common shares issued(1) 255 2,708 313
Common shares repurchased for cancellation under the Normal Course Issuer Bid(2) 1,075 632 1,009
Preferred shares and other equity instruments issued – 300 1,560
Preferred shares and other equity instruments redeemed(3) 300 695 575
Subordinated debentures issued 3,250 – –
Maturity, redemption and repurchase of subordinated debentures 1,771 232 1,500
(1) Represents primarily cash received for stock options exercised during the year, common shares issued in connection with acquisitions, and common shares issued pursuant to the
Dividend and Share Purchase Plan.
(2) Represents reduction to Common shares and Retained earnings (refer to the Consolidated Statement of Changes in Equity).
(3) Excludes the redemption on June 30, 2019 of Scotiabank Tier 1 Securities - Series 2009-1 issued by Scotiabank Tier 1 Trust.
C21 CET1 capital %, as at October 31
C22 Dividend growth dollars per share
C23 Internally generated capital $ billions, for years
ended October 31

Management’s Discussion and Analysis
Normal Course Issuer Bid
On May 30, 2019, the Bank announced that OSFI and the Toronto Stock Exchange have approved a normal course issuer bid (the “2019 NCIB”) pursuant to which it may
repurchase for cancellation up to 24 million of the Bank’s common shares. Purchases under the 2019 NCIB commenced on June 4, 2019 and terminate upon earlier of:
(i) the Bank purchasing the maximum number of common shares under the 2019 NCIB, (ii) the Bank providing a notice of termination, or (iii) June 3, 2020. On a quarterly
basis, the Bank will notify OSFI prior to making purchases.
On May 29, 2018, the Bank announced that OSFI and the Toronto Stock Exchange (TSX) approved a normal course issuer bid (the “2018 NCIB”) pursuant to which it may
repurchase for cancellation up to 24 million of the Bank’s common shares. Under the 2018 NCIB, which terminated on June 3, 2019, the Bank cumulatively repurchased and
cancelled approximately 14.8 million common shares at an average price of $73.46 per share.
During the year ended October 31, 2019, the Bank repurchased and cancelled approximately 15 million common shares (2018 – approximately 8.23 million) at a volume
weighted average price of $71.51 per share (2018 – $76.77) for a total amount of $1,075 million (2018 – $632 million).
58 | 2019 Scotiabank Annual Report
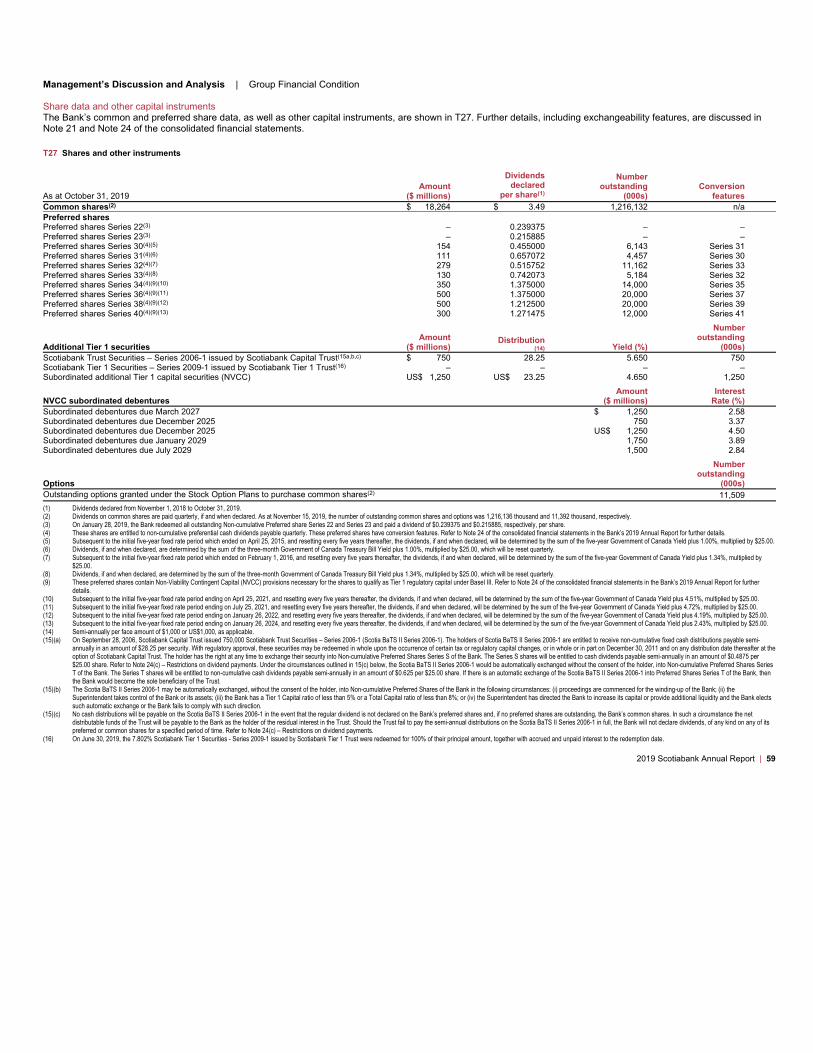
Management’s Discussion and Analysis | Group Financial Condition
Share data and other capital instruments
The Bank’s common and preferred share data, as well as other capital instruments, are shown in T27. Further details, including exchangeability features, are discussed in
Note 21 and Note 24 of the consolidated financial statements.
T27 Shares and other instruments
As at October 31, 2019
Amount
($ millions)
Dividends
declared
per share(1)
Number
outstanding
(000s)
Conversion
features
Common shares(2) $ 18,264 $ 3.49 1,216,132 n/a
Preferred shares
Preferred shares Series 22(3) – 0.239375 – –
Preferred shares Series 23(3) – 0.215885 – –
Preferred shares Series 30(4)(5) 154 0.455000 6,143 Series 31
Preferred shares Series 31(4)(6) 111 0.657072 4,457 Series 30
Preferred shares Series 32(4)(7) 279 0.515752 11,162 Series 33
Preferred shares Series 33(4)(8) 130 0.742073 5,184 Series 32
Preferred shares Series 34(4)(9)(10) 350 1.375000 14,000 Series 35
Preferred shares Series 36(4)(9)(11) 500 1.375000 20,000 Series 37
Preferred shares Series 38(4)(9)(12) 500 1.212500 20,000 Series 39
Preferred shares Series 40(4)(9)(13) 300 1.271475 12,000 Series 41
Additional Tier 1 securities
Amount
($ millions)
Distribution
(14) Yield (%)
Number
outstanding
(000s)
Scotiabank Trust Securities – Series 2006-1 issued by Scotiabank Capital Trust(15a,b,c) $ 750 28.25 5.650 750
Scotiabank Tier 1 Securities – Series 2009-1 issued by Scotiabank Tier 1 Trust(16) – – – –
Subordinated additional Tier 1 capital securities (NVCC) US$ 1,250 US$ 23.25 4.650 1,250
NVCC subordinated debentures
Amount
($ millions)
Interest
Rate (%)
Subordinated debentures due March 2027 $ 1,250 2.58
Subordinated debentures due December 2025 750 3.37
Subordinated debentures due December 2025 US$ 1,250 4.50
Subordinated debentures due January 2029 1,750 3.89
Subordinated debentures due July 2029 1,500 2.84
Options
Number
outstanding
(000s)
Outstanding options granted under the Stock Option Plans to purchase common shares(2)11,509
(1) Dividends declared from November 1, 2018 to October 31, 2019.
(2) Dividends on common shares are paid quarterly, if and when declared. As at November 15, 2019, the number of outstanding common shares and options was 1,216,136 thousand and 11,392 thousand, respectively.
(3) On January 28, 2019, the Bank redeemed all outstanding Non-cumulative Preferred share Series 22 and Series 23 and paid a dividend of $0.239375 and $0.215885, respectively, per share.
(4) These shares are entitled to non-cumulative preferential cash dividends payable quarterly. These preferred shares have conversion features. Refer to Note 24 of the consolidated financial statements in the Bank’s 2019 Annual Report for further details.
(5) Subsequent to the initial five-year fixed rate period which ended on April 25, 2015, and resetting every five years thereafter, the dividends, if and when declared, will be determined by the sum of the five-year Government of Canada Yield plus 1.00%, multiplied by $25.00.
(6) Dividends, if and when declared, are determined by the sum of the three-month Government of Canada Treasury Bill Yield plus 1.00%, multiplied by $25.00, which will be reset quarterly.
(7) Subsequent to the initial five-year fixed rate period which ended on February 1, 2016, and resetting every five years thereafter, the dividends, if and when declared, will be determined by the sum of the five-year Government of Canada Yield plus 1.34%, multiplied by
$25.00.
(8) Dividends, if and when declared, are determined by the sum of the three-month Government of Canada Treasury Bill Yield plus 1.34%, multiplied by $25.00, which will be reset quarterly.
(9) These preferred shares contain Non-Viability Contingent Capital (NVCC) provisions necessary for the shares to qualify as Tier 1 regulatory capital under Basel III. Refer to Note 24 of the consolidated financial statements in the Bank’s 2019 Annual Report for further
details.
(10) Subsequent to the initial five-year fixed rate period ending on April 25, 2021, and resetting every five years thereafter, the dividends, if and when declared, will be determined by the sum of the five-year Government of Canada Yield plus 4.51%, multiplied by $25.00.
(11) Subsequent to the initial five-year fixed rate period ending on July 25, 2021, and resetting every five years thereafter, the dividends, if and when declared, will be determined by the sum of the five-year Government of Canada Yield plus 4.72%, multiplied by $25.00.
(12) Subsequent to the initial five-year fixed rate period ending on January 26, 2022, and resetting every five years thereafter, the dividends, if and when declared, will be determined by the sum of the five-year Government of Canada Yield plus 4.19%, multiplied by $25.00.
(13) Subsequent to the initial five-year fixed rate period ending on January 26, 2024, and resetting every five years thereafter, the dividends, if and when declared, will be determined by the sum of the five-year Government of Canada Yield plus 2.43%, multiplied by $25.00.
(14) Semi-annually per face amount of $1,000 or US$1,000, as applicable.
(15)(a) On September 28, 2006, Scotiabank Capital Trust issued 750,000 Scotiabank Trust Securities – Series 2006-1 (Scotia BaTS II Series 2006-1). The holders of Scotia BaTS II Series 2006-1 are entitled to receive non-cumulative fixed cash distributions payable semi-
annually in an amount of $28.25 per security. With regulatory approval, these securities may be redeemed in whole upon the occurrence of certain tax or regulatory capital changes, or in whole or in part on December 30, 2011 and on any distribution date thereafter at the
option of Scotiabank Capital Trust. The holder has the right at any time to exchange their security into Non-cumulative Preferred Shares Series S of the Bank. The Series S shares will be entitled to cash dividends payable semi-annually in an amount of $0.4875 per
$25.00 share. Refer to Note 24(c) – Restrictions on dividend payments. Under the circumstances outlined in 15(c) below, the Scotia BaTS II Series 2006-1 would be automatically exchanged without the consent of the holder, into Non-cumulative Preferred Shares Series
T of the Bank. The Series T shares will be entitled to non-cumulative cash dividends payable semi-annually in an amount of $0.625 per $25.00 share. If there is an automatic exchange of the Scotia BaTS II Series 2006-1 into Preferred Shares Series T of the Bank, then
the Bank would become the sole beneficiary of the Trust.
(15)(b) The Scotia BaTS II Series 2006-1 may be automatically exchanged, without the consent of the holder, into Non-cumulative Preferred Shares of the Bank in the following circumstances: (i) proceedings are commenced for the winding-up of the Bank; (ii) the
Superintendent takes control of the Bank or its assets; (iii) the Bank has a Tier 1 Capital ratio of less than 5% or a Total Capital ratio of less than 8%; or (iv) the Superintendent has directed the Bank to increase its capital or provide additional liquidity and the Bank elects
such automatic exchange or the Bank fails to comply with such direction.
(15)(c) No cash distributions will be payable on the Scotia BaTS II Series 2006-1 in the event that the regular dividend is not declared on the Bank’s preferred shares and, if no preferred shares are outstanding, the Bank’s common shares. In such a circumstance the net
distributable funds of the Trust will be payable to the Bank as the holder of the residual interest in the Trust. Should the Trust fail to pay the semi-annual distributions on the Scotia BaTS II Series 2006-1 in full, the Bank will not declare dividends, of any kind on any of its
preferred or common shares for a specified period of time. Refer to Note 24(c) – Restrictions on dividend payments.
(16) On June 30, 2019, the 7.802% Scotiabank Tier 1 Securities - Series 2009-1 issued by Scotiabank Tier 1 Trust were redeemed for 100% of their principal amount, together with accrued and unpaid interest to the redemption date.
2019 Scotiabank Annual Report | 59

Management’s Discussion and Analysis
Credit ratings
Credit ratings are one of the factors that impact the Bank’s access to capital markets and the terms on which it can conduct derivatives, hedging transactions and borrow
funds. The credit ratings and outlook that the rating agencies assign to the Bank are based on their own views and methodologies.
The Bank continues to have strong credit ratings and its deposits and legacy senior debt are rated AA by DBRS, Aa2 by Moody’s, AA- by Fitch and A+ by Standard and
Poor’s (S&P). The Bank’s bail-inable senior debt is rated AA (low) by DBRS, A2 by Moody’s, AA- by Fitch and A- by S&P. All four credit rating agencies have a Stable
outlook on the Bank.
There were no changes to the Bank’s credit ratings during the year.
Risk-weighted assets
Regulatory capital requirements are based on OSFI’s target minimum percentage of risk-weighted assets (RWA). RWA represent the Bank’s exposure to credit, market and
operational risk and are computed by applying a combination of the OSFI approved Bank’s internal risk models and OSFI prescribed risk weights to on- and off-balance
sheet exposures.
As at year end, the Bank’s RWA of $421.2 billion, represents an increase in CET1, Tier 1 and Total Capital RWA of approximately $20.7 billion, $20.5 billion, and $20.3
billion, respectively, from 2018. Increases to RWA during the year are primarily due to organic growth and the Bank’s acquisitions which closed during the year, partly offset
by the impacts from foreign currency translation and the Bank’s divestitures.
CET1 Credit risk-weighted assets
As shown in Table T28, CET1 credit risk-weighted assets increased by approximately $18.3 billion to $365.4 billion, due primarily to the following components:
• Higher volumes increased RWA by $19.7 billion;
• Book quality changes, including parameter recalibrations, decreased RWA by $2.0 billion;
• Model updates increased RWA by $1.1 billion;
• Methodology and policy changes increased RWA by $1.2 billion;
• Acquisitions and divestitures, on a net basis, increased RWA by $0.6 billion;
• The impact of foreign exchange translation decreased RWA by $1.0 billion; and,
• Other changes decreased RWA by $1.4 billion.
T28 Flow statement for Basel III credit risk-weighted assets ($ millions)
2019 2018
Credit risk-weighted assets movement by key driver
($ millions)
Credit
risk
Of which
counterparty
credit risk
Credit
risk
Of which
counterparty
credit risk
CET1 Credit risk-weighted assets as at beginning of year $ 347,096 $ 17,543 $ 315,159 $ 16,494
Book size(1) 19,722 1,645 13,351 (2,525)
Book quality(2) (2,000) (499) (488) (109)
Model updates(3) 1,127 169 (1,037) –
Methodology and policy(4) 1,238 1,238 332 332
Acquisitions and disposals 614 – 21,195 2,998
Foreign exchange movements (955) 30 (1,249) 353
Other (1,411) – (167) –
CET1 Credit risk-weighted assets as at end of year(5)$ 365,431 $ 20,126 $ 347,096 $ 17,543
Tier 1 CVA scalar – – 173 173
Tier 1 Credit risk-weighted assets as at end of year(5) 365,431 20,126 347,269 17,716
Total CVA scalar – – 173 173
Total Credit risk-weighted assets as at end of year(5)$ 365,431 $ 20,126 $ 347,442 $ 17,889
(1) Book size is defined as organic changes in book size and composition (including new business and maturing loans).
(2) Book quality is defined as quality of book changes caused by experience such as underlying customer behaviour or demographics, including changes through model calibrations/realignments.
(3) Model updates are defined as model implementation, change in model scope or any change to address model enhancement.
(4) Methodology and policy is defined as methodology changes to the calculations driven by regulatory policy changes, such as new regulation (e.g. Basel III).
(5) In accordance with OSFI’s requirements, effective January 31, 2019, credit valuation adjustment (CVA) risk-weighted assets (RWA) have been fully phased-in. In the prior year, CVA RWA were calculated using scalars of 0.80, 0.83 and 0.86 to compute the CET1 capital ratio,
Tier 1 capital ratio and Total capital ratio, respectively.
60 | 2019 Scotiabank Annual Report
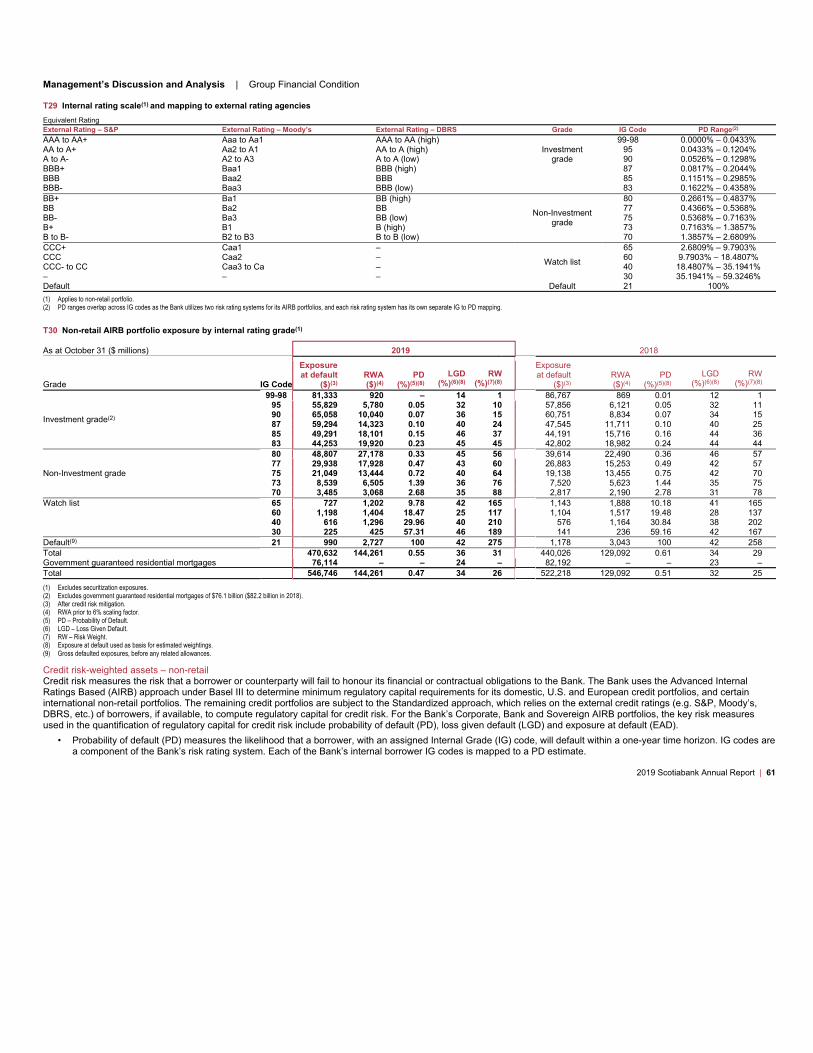
Management’s Discussion and Analysis | Group Financial Condition
T29 Internal rating scale(1) and mapping to external rating agencies
Equivalent Rating
External Rating – S&P External Rating – Moody’s External Rating – DBRS Grade IG Code PD Range(2)
AAA to AA+ Aaa to Aa1 AAA to AA (high)
Investment
grade
99-98 0.0000% – 0.0433%
AA to A+ Aa2 to A1 AA to A (high) 95 0.0433% – 0.1204%
A to A- A2 to A3 A to A (low) 90 0.0526% – 0.1298%
BBB+ Baa1 BBB (high) 87 0.0817% – 0.2044%
BBB Baa2 BBB 85 0.1151% – 0.2985%
BBB- Baa3 BBB (low) 83 0.1622% – 0.4358%
BB+ Ba1 BB (high)
Non-Investment
grade
80 0.2661% – 0.4837%
BB Ba2 BB 77 0.4366% – 0.5368%
BB- Ba3 BB (low) 75 0.5368% – 0.7163%
B+ B1 B (high) 73 0.7163% – 1.3857%
B to B- B2 to B3 B to B (low) 70 1.3857% – 2.6809%
CCC+ Caa1 –
Watch list
65 2.6809% – 9.7903%
CCC Caa2 – 60 9.7903% – 18.4807%
CCC- to CC Caa3 to Ca – 40 18.4807% – 35.1941%
– – – 30 35.1941% – 59.3246%
Default Default 21 100%
(1) Applies to non-retail portfolio.
(2) PD ranges overlap across IG codes as the Bank utilizes two risk rating systems for its AIRB portfolios, and each risk rating system has its own separate IG to PD mapping.
T30 Non-retail AIRB portfolio exposure by internal rating grade(1)
As at October 31 ($ millions) 2019 2018
Grade IG Code
Exposure
at default
($)(3)
RWA
($)(4)
PD
(%)(5)(8)
LGD
(%)(6)(8)
RW
(%)(7)(8)
Exposure
at default
($)(3)
RWA
($)(4)
PD
(%)(5)(8)
LGD
(%)(6)(8)
RW
(%)(7)(8)
Investment grade(2)
99-98 81,333 920 – 14 1 86,767 869 0.01 12 1
95 55,829 5,780 0.05 32 10 57,856 6,121 0.05 32 11
90 65,058 10,040 0.07 36 15 60,751 8,834 0.07 34 15
87 59,294 14,323 0.10 40 24 47,545 11,711 0.10 40 25
85 49,291 18,101 0.15 46 37 44,191 15,716 0.16 44 36
83 44,253 19,920 0.23 45 45 42,802 18,982 0.24 44 44
Non-Investment grade
80 48,807 27,178 0.33 45 56 39,614 22,490 0.36 46 57
77 29,938 17,928 0.47 43 60 26,883 15,253 0.49 42 57
75 21,049 13,444 0.72 40 64 19,138 13,455 0.75 42 70
73 8,539 6,505 1.39 36 76 7,520 5,623 1.44 35 75
70 3,485 3,068 2.68 35 88 2,817 2,190 2.78 31 78
Watch list 65 727 1,202 9.78 42 165 1,143 1,888 10.18 41 165
60 1,198 1,404 18.47 25 117 1,104 1,517 19.48 28 137
40 616 1,296 29.96 40 210 576 1,164 30.84 38 202
30 225 425 57.31 46 189 141 236 59.16 42 167
Default(9) 21 990 2,727 100 42 275 1,178 3,043 100 42 258
Total 470,632 144,261 0.55 36 31 440,026 129,092 0.61 34 29
Government guaranteed residential mortgages 76,114 – – 24 – 82,192 – – 23 –
Total 546,746 144,261 0.47 34 26 522,218 129,092 0.51 32 25
(1) Excludes securitization exposures.
(2) Excludes government guaranteed residential mortgages of $76.1 billion ($82.2 billion in 2018).
(3) After credit risk mitigation.
(4) RWA prior to 6% scaling factor.
(5) PD – Probability of Default.
(6) LGD – Loss Given Default.
(7) RW – Risk Weight.
(8) Exposure at default used as basis for estimated weightings.
(9) Gross defaulted exposures, before any related allowances.
Credit risk-weighted assets – non-retail
Credit risk measures the risk that a borrower or counterparty will fail to honour its financial or contractual obligations to the Bank. The Bank uses the Advanced Internal
Ratings Based (AIRB) approach under Basel III to determine minimum regulatory capital requirements for its domestic, U.S. and European credit portfolios, and certain
international non-retail portfolios. The remaining credit portfolios are subject to the Standardized approach, which relies on the external credit ratings (e.g. S&P, Moody’s,
DBRS, etc.) of borrowers, if available, to compute regulatory capital for credit risk. For the Bank’s Corporate, Bank and Sovereign AIRB portfolios, the key risk measures
used in the quantification of regulatory capital for credit risk include probability of default (PD), loss given default (LGD) and exposure at default (EAD).
• Probability of default (PD) measures the likelihood that a borrower, with an assigned Internal Grade (IG) code, will default within a one-year time horizon. IG codes are
a component of the Bank’s risk rating system. Each of the Bank’s internal borrower IG codes is mapped to a PD estimate.
2019 Scotiabank Annual Report | 61

Management’s Discussion and Analysis
• Loss given default (LGD) measures the severity of loss on a facility in the event of a borrower’s default. The Bank’s internal LGD grades are mapped to ranges of
LGD estimates. LGD grades are assigned based on facility characteristics such as seniority, collateral type, collateral coverage and other structural elements. LGD for
a defaulted exposure is based on the concept of economic loss and is calculated using the present value of repayments, recoveries and related direct and indirect
expenses.
• Exposure at default (EAD) measures the expected exposure on a facility at the time of default.
All three risk measures are estimated using the Bank’s historical data, as well as available external benchmarks, and are updated on a regular basis. The historical data
used for estimating these risk measures exceeds the minimum five-year AIRB requirement for PD estimates and the minimum seven-year AIRB requirement for LGD and
EAD estimates. Further analytical adjustments, as required under the Basel III Framework and OSFI’s requirements set out in its Domestic Implementation Notes, including
any input floor requirements, are applied to average estimates obtained from historical data. These analytical adjustments incorporate the regulatory requirements pertaining
to:
• Long-run estimation of PD, which requires that PD estimates capture average default experience over a reasonable mix of high-default and low-default years of the
economic cycle;
• Downturn estimation for LGD, which requires that LGD estimates appropriately reflect conditions observed during periods where credit losses are substantially higher
than average; and
• Downturn estimation for EAD, which requires that EAD estimates appropriately reflect conditions observed during periods of economic downturn; and
• The addition of a margin of conservatism, which is related to the likely range of errors based on the identification and quantification of the various sources of
uncertainty inherent in historical estimates.
These risk measures are used in the calculation of regulatory capital requirements based on formulas specified by the Basel framework. The credit quality distribution of the
Bank’s AIRB non-retail portfolio is shown in Table T30.
The risk measures are subject to a rigorous back-testing framework which uses the Bank’s historical data to ensure that they are appropriately calibrated. Based on results
obtained from the back-testing process, risk measures are reviewed, re-calibrated and independently validated on at least an annual basis in order to reflect the implications
of new data, technical advances and other relevant information.
• As PD estimates represent long-run parameters, back-testing is performed using historical data spanning at least one full economic cycle. Realized PDs are back-
tested using pre-defined confidence intervals, and the results are then aggregated to provide an overall assessment of the appropriateness of each PD estimate;
• The back-testing for LGD and EAD estimates is conducted from both long-run and downturn perspectives, in order to ensure that these estimates are adequately
conservative to reflect both long-run and downturn conditions.
Portfolio-level back-testing results, based on a comparison of estimated and realized parameters for the four-quarter period ended at July 31, 2019, are shown in Table T31.
During this period the actual experience was materially more favourable than the estimates as reflected within the risk parameters.
T31 Portfolio-level comparison of estimated and actual non-retail percentages
Estimated(1) Actual
Average PD 0.72 0.20
Average LGD 40.79 23.00
Average CCF(2) 48.96 24.77
(1) Estimated parameters are based on portfolio averages at Q3/18, whereas actual parameters are based on averages of realized parameters during the subsequent four quarters.
(2) EAD back-testing is performed through Credit Conversion Factor (CCF) back-testing, as EAD is computed using the sum of the drawn exposure and undrawn exposure multiplied by the estimated CCF.
Credit risk-weighted assets – Canadian retail
The AIRB approach is used to determine minimum regulatory capital requirements for the retail credit portfolio. The retail portfolio is comprised of the following Basel-based
pools:
• Residential real estate secured exposures consist of conventional and high ratio residential mortgages and all other products opened under the Scotia Total Equity
Plan (STEP), such as loans, credit cards and secured lines of credit;
• Qualifying revolving retail exposures consists of all unsecured credit cards and lines of credit;
• Other retail consists of term loans (secured and unsecured), as well as credit cards and lines of credit which are secured by assets other than real estate.
For the AIRB portfolios, the following models and parameters are estimated, subject to parameter input floors as required by OSFI:
• Probability of default (PD) is the likelihood that the facility will default within the next 12 months.
• Loss Given Default (LGD) measures the economic loss as a proportion of the defaulted balance.
• Exposure at Default (EAD) is the portion of expected exposures at time of default.
The data observation period used for PD/EAD/LGD estimates meets the five year minimum. Various statistical techniques including predictive modeling and decision trees
were used to develop models. The models assign accounts into homogenous segments using internal and external borrower/facility-level credit experience. Every month,
exposures are automatically re-rated based on risk and loss characteristics. PD, LGD and EAD estimates are then assigned to each of these segments incorporating the
following regulatory requirements:
• PD incorporates the average long run default experience over an economic cycle. This long run average includes a mix of high and low default years.
• LGD is adjusted to appropriately reflect economic downturn conditions.
• EAD may also be adjusted to reflect downturn conditions when PD and EAD are highly correlated.
• Sources of uncertainty are reviewed regularly to ensure uncertainties are identified, quantified and included in calculations so that all parameter estimates reflect
appropriate levels of conservatism.
62 | 2019 Scotiabank Annual Report
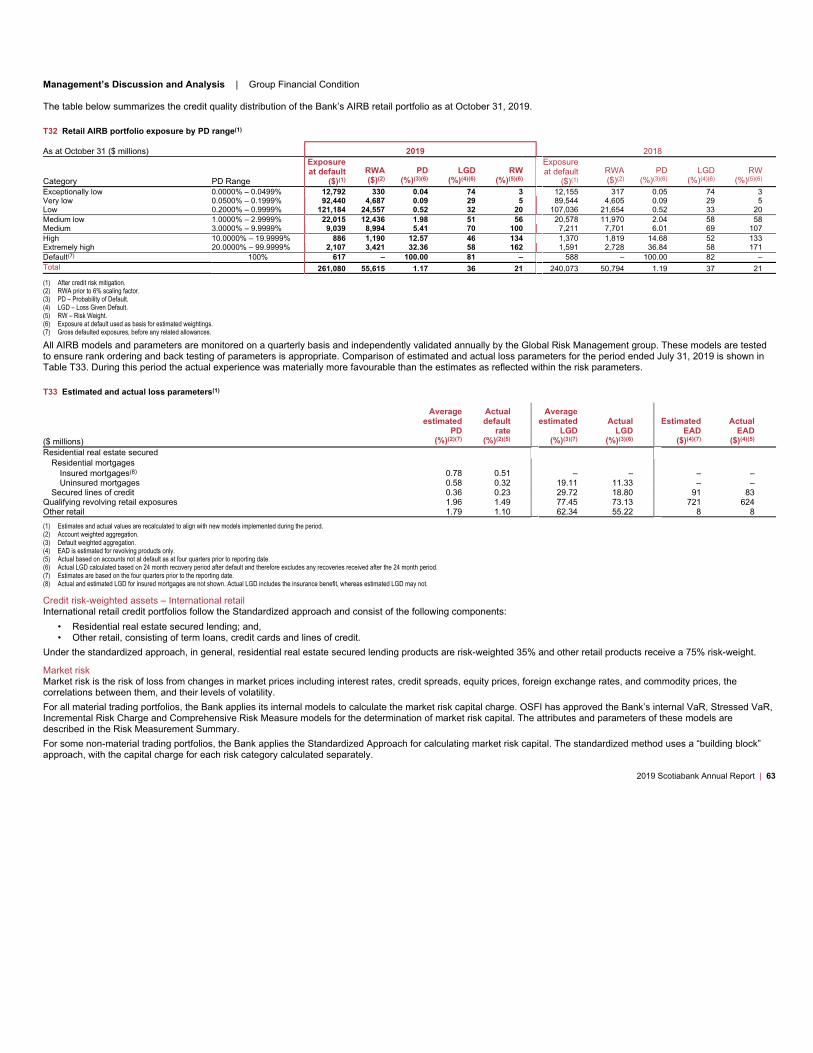
Management’s Discussion and Analysis | Group Financial Condition
The table below summarizes the credit quality distribution of the Bank’s AIRB retail portfolio as at October 31, 2019.
T32 Retail AIRB portfolio exposure by PD range(1)
As at October 31 ($ millions) 2019 2018
Category PD Range
Exposure
at default
($)(1)
RWA
($)(2)
PD
(%)(3)(6)
LGD
(%)(4)(6)
RW
(%)(5)(6)
Exposure
at default
($)(1)
RWA
($)(2)
PD
(%)(3)(6)
LGD
(%)(4)(6)
RW
(%)(5)(6)
Exceptionally low 0.0000% – 0.0499% 12,792 330 0.04 74 3 12,155 317 0.05 74 3
Very low 0.0500% – 0.1999% 92,440 4,687 0.09 29 5 89,544 4,605 0.09 29 5
Low 0.2000% – 0.9999% 121,184 24,557 0.52 32 20 107,036 21,654 0.52 33 20
Medium low 1.0000% – 2.9999% 22,015 12,436 1.98 51 56 20,578 11,970 2.04 58 58
Medium 3.0000% – 9.9999% 9,039 8,994 5.41 70 100 7,211 7,701 6.01 69 107
High 10.0000% – 19.9999% 886 1,190 12.57 46 134 1,370 1,819 14.68 52 133
Extremely high 20.0000% – 99.9999% 2,107 3,421 32.36 58 162 1,591 2,728 36.84 58 171
Default(7) 100% 617 – 100.00 81 – 588 – 100.00 82 –
Total 261,080 55,615 1.17 36 21 240,073 50,794 1.19 37 21
(1) After credit risk mitigation.
(2) RWA prior to 6% scaling factor.
(3) PD – Probability of Default.
(4) LGD – Loss Given Default.
(5) RW – Risk Weight.
(6) Exposure at default used as basis for estimated weightings.
(7) Gross defaulted exposures, before any related allowances.
All AIRB models and parameters are monitored on a quarterly basis and independently validated annually by the Global Risk Management group. These models are tested
to ensure rank ordering and back testing of parameters is appropriate. Comparison of estimated and actual loss parameters for the period ended July 31, 2019 is shown in
Table T33. During this period the actual experience was materially more favourable than the estimates as reflected within the risk parameters.
T33 Estimated and actual loss parameters(1)
($ millions)
Average
estimated
PD
(%)(2)(7)
Actual
default
rate
(%)(2)(5)
Average
estimated
LGD
(%)(3)(7)
Actual
LGD
(%)(3)(6)
Estimated
EAD
($)(4)(7)
Actual
EAD
($)(4)(5)
Residential real estate secured
Residential mortgages
Insured mortgages(8) 0.78 0.51 – – – –
Uninsured mortgages 0.58 0.32 19.11 11.33 – –
Secured lines of credit 0.36 0.23 29.72 18.80 91 83
Qualifying revolving retail exposures 1.96 1.49 77.45 73.13 721 624
Other retail 1.79 1.10 62.34 55.22 8 8
(1) Estimates and actual values are recalculated to align with new models implemented during the period.
(2) Account weighted aggregation.
(3) Default weighted aggregation.
(4) EAD is estimated for revolving products only.
(5) Actual based on accounts not at default as at four quarters prior to reporting date.
(6) Actual LGD calculated based on 24 month recovery period after default and therefore excludes any recoveries received after the 24 month period.
(7) Estimates are based on the four quarters prior to the reporting date.
(8) Actual and estimated LGD for insured mortgages are not shown. Actual LGD includes the insurance benefit, whereas estimated LGD may not.
Credit risk-weighted assets – International retail
International retail credit portfolios follow the Standardized approach and consist of the following components:
• Residential real estate secured lending; and,
• Other retail, consisting of term loans, credit cards and lines of credit.
Under the standardized approach, in general, residential real estate secured lending products are risk-weighted 35% and other retail products receive a 75% risk-weight.
Market risk
Market risk is the risk of loss from changes in market prices including interest rates, credit spreads, equity prices, foreign exchange rates, and commodity prices, the
correlations between them, and their levels of volatility.
For all material trading portfolios, the Bank applies its internal models to calculate the market risk capital charge. OSFI has approved the Bank’s internal VaR, Stressed VaR,
Incremental Risk Charge and Comprehensive Risk Measure models for the determination of market risk capital. The attributes and parameters of these models are
described in the Risk Measurement Summary.
For some non-material trading portfolios, the Bank applies the Standardized Approach for calculating market risk capital. The standardized method uses a “building block”
approach, with the capital charge for each risk category calculated separately.
2019 Scotiabank Annual Report | 63
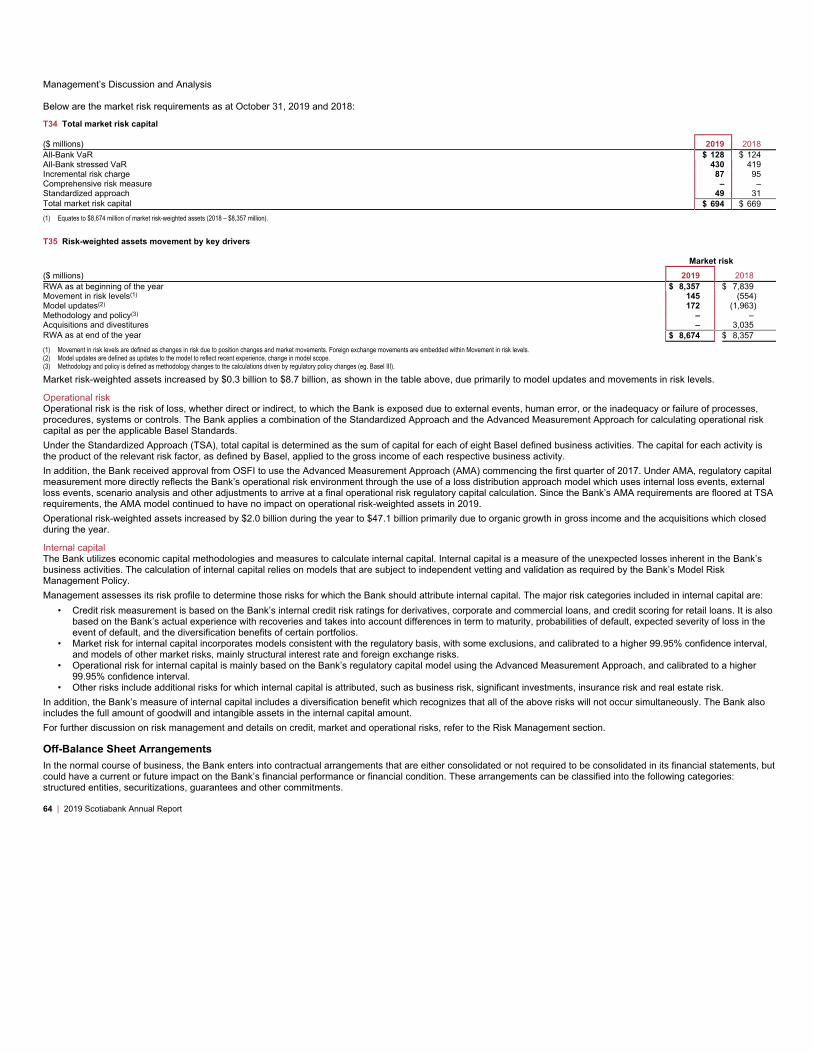
Management’s Discussion and Analysis
Below are the market risk requirements as at October 31, 2019 and 2018:
T34 Total market risk capital
($ millions) 2019 2018
All-Bank VaR $ 128 $ 124
All-Bank stressed VaR 430 419
Incremental risk charge 87 95
Comprehensive risk measure – –
Standardized approach 49 31
Total market risk capital $ 694 $ 669
(1) Equates to $8,674 million of market risk-weighted assets (2018 – $8,357 million).
T35 Risk-weighted assets movement by key drivers
Market risk
($ millions) 2019 2018
RWA as at beginning of the year $ 8,357 $ 7,839
Movement in risk levels(1) 145 (554)
Model updates(2) 172 (1,963)
Methodology and policy(3) – –
Acquisitions and divestitures – 3,035
RWA as at end of the year $ 8,674 $ 8,357
(1) Movement in risk levels are defined as changes in risk due to position changes and market movements. Foreign exchange movements are embedded within Movement in risk levels.
(2) Model updates are defined as updates to the model to reflect recent experience, change in model scope.
(3) Methodology and policy is defined as methodology changes to the calculations driven by regulatory policy changes (eg. Basel III).
Market risk-weighted assets increased by $0.3 billion to $8.7 billion, as shown in the table above, due primarily to model updates and movements in risk levels.
Operational risk
Operational risk is the risk of loss, whether direct or indirect, to which the Bank is exposed due to external events, human error, or the inadequacy or failure of processes,
procedures, systems or controls. The Bank applies a combination of the Standardized Approach and the Advanced Measurement Approach for calculating operational risk
capital as per the applicable Basel Standards.
Under the Standardized Approach (TSA), total capital is determined as the sum of capital for each of eight Basel defined business activities. The capital for each activity is
the product of the relevant risk factor, as defined by Basel, applied to the gross income of each respective business activity.
In addition, the Bank received approval from OSFI to use the Advanced Measurement Approach (AMA) commencing the first quarter of 2017. Under AMA, regulatory capital
measurement more directly reflects the Bank’s operational risk environment through the use of a loss distribution approach model which uses internal loss events, external
loss events, scenario analysis and other adjustments to arrive at a final operational risk regulatory capital calculation. Since the Bank’s AMA requirements are floored at TSA
requirements, the AMA model continued to have no impact on operational risk-weighted assets in 2019.
Operational risk-weighted assets increased by $2.0 billion during the year to $47.1 billion primarily due to organic growth in gross income and the acquisitions which closed
during the year.
Internal capital
The Bank utilizes economic capital methodologies and measures to calculate internal capital. Internal capital is a measure of the unexpected losses inherent in the Bank’s
business activities. The calculation of internal capital relies on models that are subject to independent vetting and validation as required by the Bank’s Model Risk
Management Policy.
Management assesses its risk profile to determine those risks for which the Bank should attribute internal capital. The major risk categories included in internal capital are:
• Credit risk measurement is based on the Bank’s internal credit risk ratings for derivatives, corporate and commercial loans, and credit scoring for retail loans. It is also
based on the Bank’s actual experience with recoveries and takes into account differences in term to maturity, probabilities of default, expected severity of loss in the
event of default, and the diversification benefits of certain portfolios.
• Market risk for internal capital incorporates models consistent with the regulatory basis, with some exclusions, and calibrated to a higher 99.95% confidence interval,
and models of other market risks, mainly structural interest rate and foreign exchange risks.
• Operational risk for internal capital is mainly based on the Bank’s regulatory capital model using the Advanced Measurement Approach, and calibrated to a higher
99.95% confidence interval.
• Other risks include additional risks for which internal capital is attributed, such as business risk, significant investments, insurance risk and real estate risk.
In addition, the Bank’s measure of internal capital includes a diversification benefit which recognizes that all of the above risks will not occur simultaneously. The Bank also
includes the full amount of goodwill and intangible assets in the internal capital amount.
For further discussion on risk management and details on credit, market and operational risks, refer to the Risk Management section.
Off-Balance Sheet Arrangements
In the normal course of business, the Bank enters into contractual arrangements that are either consolidated or not required to be consolidated in its financial statements, but
could have a current or future impact on the Bank’s financial performance or financial condition. These arrangements can be classified into the following categories:
structured entities, securitizations, guarantees and other commitments.
64 | 2019 Scotiabank Annual Report
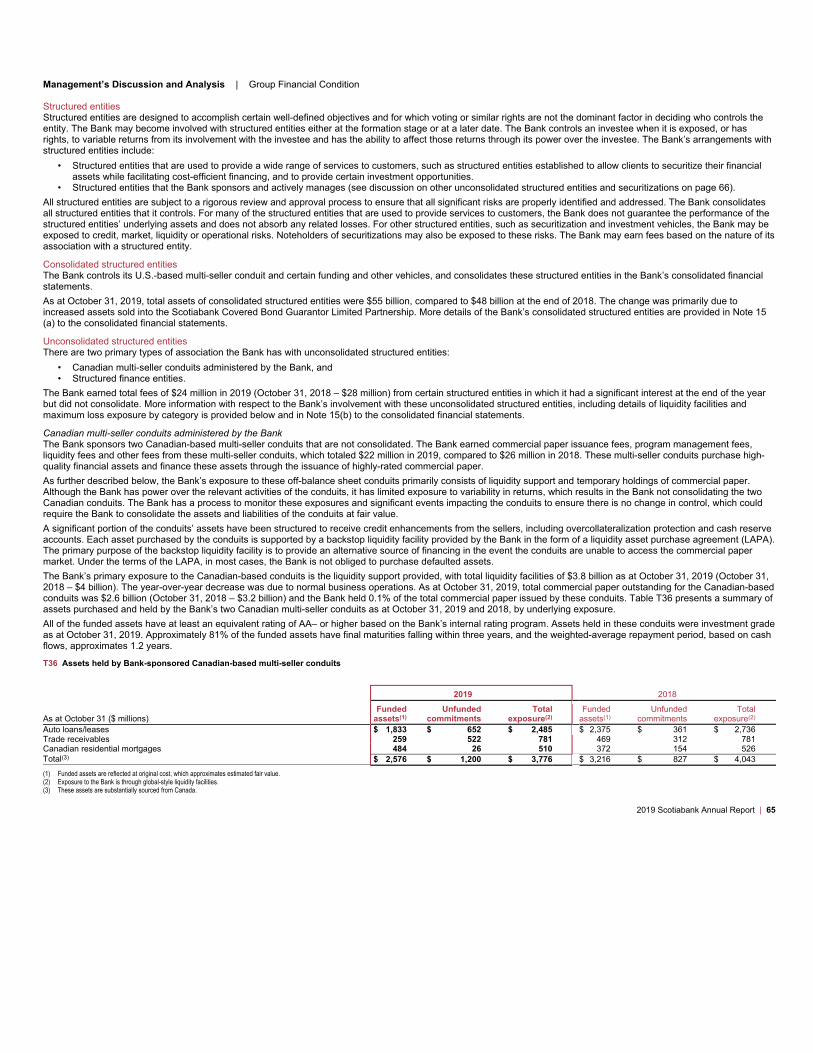
Management’s Discussion and Analysis | Group Financial Condition
Structured entities
Structured entities are designed to accomplish certain well-defined objectives and for which voting or similar rights are not the dominant factor in deciding who controls the
entity. The Bank may become involved with structured entities either at the formation stage or at a later date. The Bank controls an investee when it is exposed, or has
rights, to variable returns from its involvement with the investee and has the ability to affect those returns through its power over the investee. The Bank’s arrangements with
structured entities include:
• Structured entities that are used to provide a wide range of services to customers, such as structured entities established to allow clients to securitize their financial
assets while facilitating cost-efficient financing, and to provide certain investment opportunities.
• Structured entities that the Bank sponsors and actively manages (see discussion on other unconsolidated structured entities and securitizations on page 66).
All structured entities are subject to a rigorous review and approval process to ensure that all significant risks are properly identified and addressed. The Bank consolidates
all structured entities that it controls. For many of the structured entities that are used to provide services to customers, the Bank does not guarantee the performance of the
structured entities’ underlying assets and does not absorb any related losses. For other structured entities, such as securitization and investment vehicles, the Bank may be
exposed to credit, market, liquidity or operational risks. Noteholders of securitizations may also be exposed to these risks. The Bank may earn fees based on the nature of its
association with a structured entity.
Consolidated structured entities
The Bank controls its U.S.-based multi-seller conduit and certain funding and other vehicles, and consolidates these structured entities in the Bank’s consolidated financial
statements.
As at October 31, 2019, total assets of consolidated structured entities were $55 billion, compared to $48 billion at the end of 2018. The change was primarily due to
increased assets sold into the Scotiabank Covered Bond Guarantor Limited Partnership. More details of the Bank’s consolidated structured entities are provided in Note 15
(a) to the consolidated financial statements.
Unconsolidated structured entities
There are two primary types of association the Bank has with unconsolidated structured entities:
• Canadian multi-seller conduits administered by the Bank, and
• Structured finance entities.
The Bank earned total fees of $24 million in 2019 (October 31, 2018 – $28 million) from certain structured entities in which it had a significant interest at the end of the year
but did not consolidate. More information with respect to the Bank’s involvement with these unconsolidated structured entities, including details of liquidity facilities and
maximum loss exposure by category is provided below and in Note 15(b) to the consolidated financial statements.
Canadian multi-seller conduits administered by the Bank
The Bank sponsors two Canadian-based multi-seller conduits that are not consolidated. The Bank earned commercial paper issuance fees, program management fees,
liquidity fees and other fees from these multi-seller conduits, which totaled $22 million in 2019, compared to $26 million in 2018. These multi-seller conduits purchase high-
quality financial assets and finance these assets through the issuance of highly-rated commercial paper.
As further described below, the Bank’s exposure to these off-balance sheet conduits primarily consists of liquidity support and temporary holdings of commercial paper.
Although the Bank has power over the relevant activities of the conduits, it has limited exposure to variability in returns, which results in the Bank not consolidating the two
Canadian conduits. The Bank has a process to monitor these exposures and significant events impacting the conduits to ensure there is no change in control, which could
require the Bank to consolidate the assets and liabilities of the conduits at fair value.
A significant portion of the conduits’ assets have been structured to receive credit enhancements from the sellers, including overcollateralization protection and cash reserve
accounts. Each asset purchased by the conduits is supported by a backstop liquidity facility provided by the Bank in the form of a liquidity asset purchase agreement (LAPA).
The primary purpose of the backstop liquidity facility is to provide an alternative source of financing in the event the conduits are unable to access the commercial paper
market. Under the terms of the LAPA, in most cases, the Bank is not obliged to purchase defaulted assets.
The Bank’s primary exposure to the Canadian-based conduits is the liquidity support provided, with total liquidity facilities of $3.8 billion as at October 31, 2019 (October 31,
2018 – $4 billion). The year-over-year decrease was due to normal business operations. As at October 31, 2019, total commercial paper outstanding for the Canadian-based
conduits was $2.6 billion (October 31, 2018 – $3.2 billion) and the Bank held 0.1% of the total commercial paper issued by these conduits. Table T36 presents a summary of
assets purchased and held by the Bank’s two Canadian multi-seller conduits as at October 31, 2019 and 2018, by underlying exposure.
All of the funded assets have at least an equivalent rating of AA– or higher based on the Bank’s internal rating program. Assets held in these conduits were investment grade
as at October 31, 2019. Approximately 81% of the funded assets have final maturities falling within three years, and the weighted-average repayment period, based on cash
flows, approximates 1.2 years.
T36 Assets held by Bank-sponsored Canadian-based multi-seller conduits
2019 2018
As at October 31 ($ millions)
Funded
assets(1)
Unfunded
commitments
Total
exposure(2)
Funded
assets(1)
Unfunded
commitments
Total
exposure(2)
Auto loans/leases $ 1,833 $ 652 $ 2,485 $ 2,375 $ 361 $ 2,736
Trade receivables 259 522 781 469 312 781
Canadian residential mortgages 484 26 510 372 154 526
Total(3)$ 2,576 $ 1,200 $ 3,776 $ 3,216 $ 827 $ 4,043
(1) Funded assets are reflected at original cost, which approximates estimated fair value.
(2) Exposure to the Bank is through global-style liquidity facilities.
(3) These assets are substantially sourced from Canada.
2019 Scotiabank Annual Report | 65

Management’s Discussion and Analysis
Structured finance entities
The Bank has interests in structured finance entities used to assist corporate clients in accessing cost-efficient financing through their securitization structures. The Bank’s
maximum exposure to loss from structured finance entities was $2,194 million as at October 31, 2019, (October 31, 2018 – $2,032 million). The year-over-year increase was
due to normal business operations.
Other unconsolidated structured entities
The Bank sponsors unconsolidated structured entities including mutual funds, in which it has insignificant or no interest at the reporting date. The Bank is a sponsor when it
is significantly involved in the design and formation at inception of the structured entity, and the Bank’s name is used by the structured entity to create an awareness of the
instruments being backed by the Bank’s reputation and obligation. The Bank also considers other factors, such as its continuing involvement and obligations to determine if,
in substance, the Bank is a sponsor. For the year ended October 31, 2019, the Bank earned $2,190 million income from its involvement with the unconsolidated Bank-
sponsored structured entities, a majority of which is from Bank-sponsored mutual funds (for the year ended October 31, 2018 – $2,121 million).
Securitizations
The Bank securitizes its retail loans, as described further below, as an efficient source of financing its operations.
The Bank securitizes fully insured residential mortgage loans, originated by the Bank and third parties, through the creation of mortgage backed securities that are sold to
Canada Housing Trust (CHT) and/or third party investors. The sale of such mortgages does not meet the derecognition requirements, where the Bank retains substantially
all of the risks and rewards of ownership of the securitized mortgages. The transferred mortgages continue to be recognized on the Consolidated Statement of Financial
Position, along with the proceeds from sale treated as secured borrowings. More details have been provided in Note 14 of the consolidated financial statements.
Third-party originated mortgages purchased by the Bank and social housing mortgage pools originated by the Bank qualify for derecognition where the Bank transfers
substantially all of the risks and rewards of ownership to third parties. As at October 31, 2019, the outstanding amount of off-balance sheet securitized third-party originated
mortgages was $2,734 million (October 31, 2018 – nil) and off-balance sheet securitized social housing pools was $945 million (October 31, 2018 - $1,101 million).
The Bank securitizes a portion of its Canadian lines of credit and credit card receivables (receivables) through two Bank-sponsored structured entities. The receivables are
comprised of unsecured personal lines of credit, securitized through Halifax Receivables Trust (Halifax) (formerly Hollis Receivables Term Trust II), and personal and small
business credit card receivables, securitized through Trillium Credit Card Trust II (Trillium). Halifax issues Class A notes to third-party investors and subordinated notes to
the Bank. Trillium issues Class A notes to investors and subordinated notes to investors or the Bank. The proceeds of such issuances are used to purchase co-ownership
interests in the respective receivables originated by the Bank. The sale of such co-ownership interests does not qualify for derecognition and therefore the receivables
continue to be recognized on the Bank’s Consolidated Statement of Financial Position. Recourse of the noteholders is limited to the purchased co-ownership interests.
During the year, no receivables were securitized through Halifax (2018 – nil) and $1,792 million of receivables were securitized through Trillium (2018 – $1,678 million). As at
October 31, 2019, the outstanding Bank-held subordinated notes issued by Halifax of $102 million (2018 – $205 million) and Trillium of $134 million (2018 – $134 million) are
eliminated on consolidation.
The Bank securitizes a portion of its Canadian auto loan receivables (receivables) through Securitized Term Auto Receivables Trust 2016-1, 2017-1, 2017-2, 2018-1, 2018-2
and 2019-1 (START) Bank-sponsored structured entities. The START entities issue Class A notes to third-party investors and may issue Class A and/or subordinated notes
to the Bank, and the proceeds of such issuances are used to purchase discrete pools of retail indirect auto loan receivables from the Bank on a fully serviced basis. The sale
of such pools does not qualify for derecognition and therefore the receivables continue to be recognized on the Bank’s Consolidated Statement of Financial Position.
Recourse of the note holders is limited to the receivables. During the year, assets of $896 million were securitized through the START program (2018 – $1,874 million). As at
October 31, 2019, the outstanding subordinated notes issued by the START entities that are held by the Bank of $325 million (2018 – $447 million) are eliminated on
consolidation.
Guarantees and other commitments
Guarantees and other commitments are fee-based products that the Bank provides to its customers. These products can be categorized as follows:
• Standby letters of credit and letters of guarantee. As at October 31, 2019, these amounted to $36 billion, compared to $35 billion last year. These instruments are
issued at the request of a Bank customer to secure the customer’s payment or performance obligations to a third party.
• Liquidity facilities. These generally provide an alternate source of funding to asset-backed commercial paper conduits in the event a general market disruption
prevents the conduits from issuing commercial paper or, in some cases, when certain specified conditions or performance measures are not met;
• Indemnification contracts. In the ordinary course of business, the Bank enters into many contracts where it may indemnify contract counterparties for certain aspects
of its operations that are dependent on other parties’ performance, or if certain events occur. The Bank cannot estimate, in all cases, the maximum potential future
amount that may be payable, nor the amount of collateral or assets available under recourse provisions that would mitigate any such payments. Historically, the Bank
has not made any significant payments under these indemnities;
• Loan commitments. The Bank has commitments to extend credit, subject to specific conditions, which represent undertakings to make credit available in the form of
loans or other financings for specific amounts and maturities. As at October 31, 2019, these commitments amounted to $212 billion, compared to $197 billion last
year. The year-over-year increase is primarily due to an increase in business activity.
These guarantees and loan commitments may expose the Bank to credit or liquidity risks, and are subject to the Bank’s standard review and approval processes. For the
guaranteed products, the dollar amounts represent the maximum risk of loss in the event of a total default by the guaranteed parties, and are stated before any reduction for
recoveries under recourse provisions, insurance policies or collateral held or pledged.
Fees from the Bank’s guarantees and loan commitment arrangements, recorded as credit fees in other income in the Consolidated Statement of Income, were $588 million
in 2019, compared to $572 million in the prior year. Detailed information on guarantees and loan commitments is disclosed in Note 35 in the consolidated financial
statements.
66 | 2019 Scotiabank Annual Report

Management’s Discussion and Analysis | Group Financial Condition
Financial Instruments
Given the nature of the Bank’s main business activities, financial instruments make up a substantial portion of the Bank’s financial position and are integral to the Bank’s
business. Assets that are financial instruments include cash resources, securities, securities purchased under resale agreements, loans and customers’ liability under
acceptances. Financial instrument liabilities include deposits, acceptances, obligations related to securities sold under repurchase agreements, obligations related to
securities sold short, subordinated debentures and capital instrument liabilities. In addition, the Bank uses derivative financial instruments for both trading and hedging
purposes.
Financial instruments are generally carried at fair value, except for non-trading loans and receivables, certain securities and most financial liabilities, which are carried at
amortized cost unless designated as fair value through profit and loss at inception.
Unrealized gains and losses on the following items are recorded in other comprehensive income (OCI):
• debt instruments measured at fair value through OCI,
• equity instruments measured at fair value through OCI,
• derivatives designated as cash flow hedges, and
• net investment hedges.
Gains and losses on derecognition of debt instruments at FVOCI and impairment provisions are reclassified from OCI to the Consolidated Statement of Income under
non-interest income. Gains and losses on derecognition of equity instruments designated at FVOCI are not reclassified from OCI to the consolidated statement of income.
Gains and losses on cash flow hedges and net investment hedges are recorded in the Consolidated Statement of Income when the hedged item affects income.
The Bank’s accounting policies for derivatives and hedging activities are further described in Note 3 to the consolidated financial statements.
Interest income and expense on non-trading interest-bearing financial instruments are recorded in the Consolidated Statement of Income as part of net interest income.
Credit losses related to loans are recorded in the provision for credit losses in the Consolidated Statement of Income. Interest income and expense, as well as gains and
losses, on trading securities and trading loans are recorded in non-interest income – trading revenues.
Several risks arise from transacting financial instruments, including credit risk, liquidity risk, operational risk and market risk. The Bank manages these risks using extensive
risk management policies and practices, including various Board-approved risk management limits.
A discussion of the Bank’s risk management policies and practices can be found in the Risk Management section on pages 69 to 106. In addition, Note 36 to the
consolidated financial statements presents the Bank’s exposure to credit risk, liquidity risk and market risks arising from financial instruments as well as the Bank’s
corresponding risk management policies and procedures.
There are various measures that reflect the level of risk associated with the Bank’s portfolio of financial instruments. For example, the interest rate risk arising from the
Bank’s financial instruments can be estimated by calculating the impact of a 100 basis point increase or decrease in interest rates on annual income, and the economic value
of shareholders’ equity, as described on page 91. For trading activities, Table T45 discloses the average one-day Value at Risk by risk factor. For derivatives, based on the
maturity profile of the notional amount of the Bank’s derivative financial instruments, only 18% (2018 – 18%) had a term to maturity greater than five years.
Note 10 to the consolidated financial statements provides details about derivatives used in trading and hedging activities, including notional amounts, remaining term to
maturity, credit risk and fair values.
The fair value of the Bank’s financial instruments is provided in Note 7 to the consolidated financial statements along with a description of how these amounts were
determined.
The fair value of the Bank’s financial instruments was favourable when compared to their carrying value by $5 billion as at October 31, 2019 (October 31, 2018 – favourable
$2.8 billion). This difference relates mainly to loan assets, deposit liabilities, subordinated debentures and other liabilities. These changes are primarily driven by movements
in interest rates and by volume changes. Fair value estimates are based on market conditions as at October 31, 2019, and may not be reflective of future fair values. Further
information on how fair values are estimated is contained in the section on critical accounting estimates.
Disclosures specific to certain financial instruments designated at fair value through profit and loss can be found in Note 9 to the consolidated financial statements. These
designations were made primarily to significantly reduce accounting mismatches.
2019 Scotiabank Annual Report | 67
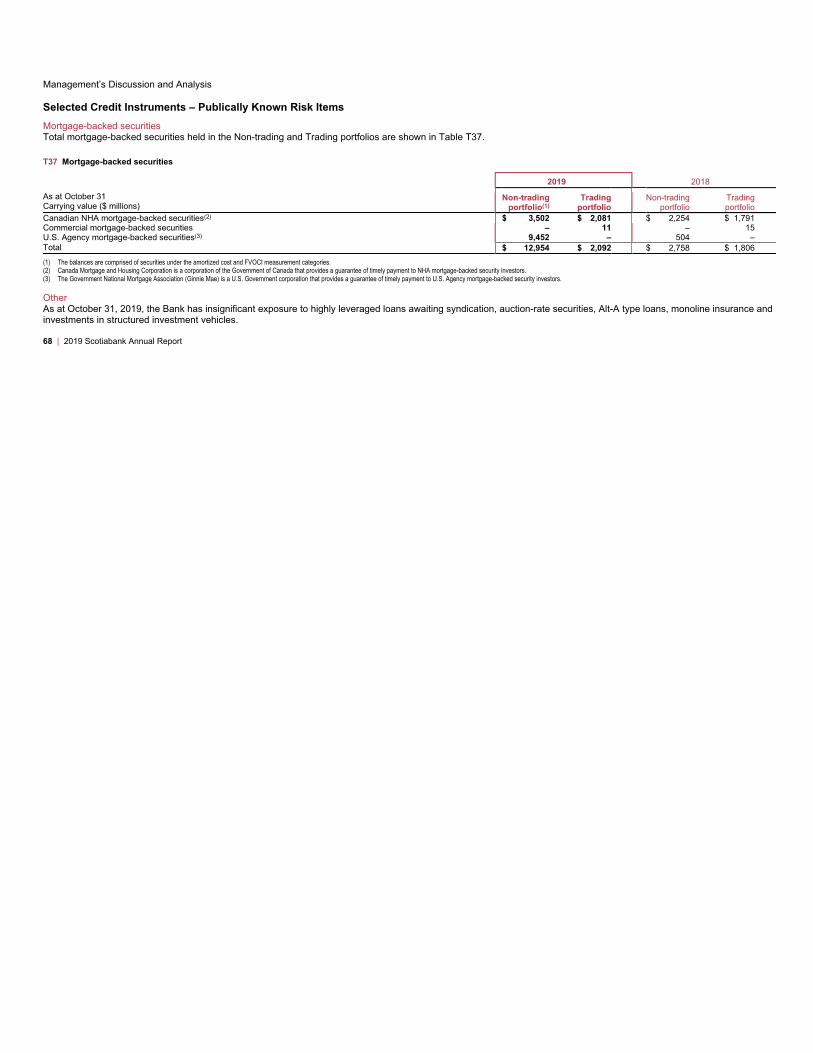
Management’s Discussion and Analysis
Selected Credit Instruments – Publically Known Risk Items
Mortgage-backed securities
Total mortgage-backed securities held in the Non-trading and Trading portfolios are shown in Table T37.
T37 Mortgage-backed securities
2019 2018
As at October 31
Carrying value ($ millions)
Non-trading
portfolio(1)
Trading
portfolio
Non-trading
portfolio
Trading
portfolio
Canadian NHA mortgage-backed securities(2) $ 3,502 $ 2,081 $ 2,254 $ 1,791
Commercial mortgage-backed securities – 11 – 15
U.S. Agency mortgage-backed securities(3) 9,452 – 504 –
Total $ 12,954 $ 2,092 $ 2,758 $ 1,806
(1) The balances are comprised of securities under the amortized cost and FVOCI measurement categories.
(2) Canada Mortgage and Housing Corporation is a corporation of the Government of Canada that provides a guarantee of timely payment to NHA mortgage-backed security investors.
(3) The Government National Mortgage Association (Ginnie Mae) is a U.S. Government corporation that provides a guarantee of timely payment to U.S. Agency mortgage-backed security investors.
Other
As at October 31, 2019, the Bank has insignificant exposure to highly leveraged loans awaiting syndication, auction-rate securities, Alt-A type loans, monoline insurance and
investments in structured investment vehicles.
68 | 2019 Scotiabank Annual Report

Management’s Discussion and Analysis | Risk Management
Risk Management
Risk Management Principles
Risk-taking and risk management activities across the enterprise are guided by the following principles:
Risk and Reward – business and risk decisions are consistent with strategies and risk appetite.
Understand the Risks – all material risks to which the Bank is exposed, including both financial and non-financial, are identified and managed.
Forward Thinking – emerging risks and potential vulnerabilities are proactively identified.
Shared Accountability – every employee is responsible for managing risk.
Customer Focus – understanding our customers and their needs is essential to all business and risk decision-making.
Protect our Brand – all risk taking activities must be in line with the Bank’s risk appetite, Code of Conduct, values and policy principles.
Compensation – performance and compensation structures reinforce the Bank’s values and promote sound risk taking behaviour.
Risk Governance
Effective risk management begins with effective risk governance.
The Bank has a well-established risk governance structure, with an active and engaged Board of Directors supported by an experienced executive management team.
Decision-making is highly centralized through a number of senior and executive risk management committees.
The Bank’s risk management framework is predicated on the three-lines-of-defence model. Within this model:
• the First Line of Defence (typically comprised of the business lines and most corporate functions) incurs and owns the risks,
• the Second Line of Defence (typically comprised of control functions such as Global Risk Management, Global Compliance, AML Risk and Global Finance) provides
independent oversight and objective challenge to the First Line of Defence, as well as monitoring and managing risk, and
• the Third Line of Defence (Internal Audit) provides enterprise-wide independent assurance to management and the Board on the effectiveness of risk management
practices.
2019 Scotiabank Annual Report | 69
Effective risk management is fundamental to the success of the Bank, and is
recognized as key in the Bank’s overall approach to strategy management.
Scotiabank has a strong, disciplined risk culture where managing risk is a
responsibility shared by all of the Bank’s employees.
Risk Management Framework
The primary goals of risk management are to ensure that the outcomes of risk-
taking activities are consistent with the Bank’s strategies and risk appetite, and that
there is an appropriate balance between risk and reward in order to maximize
shareholder value. Scotiabank’s Enterprise-Wide Risk Management Framework
articulates the foundation for achieving these goals.
This Framework is subject to constant evaluation in order for it to meet the
challenges and requirements of the global markets in which the Bank operates,
including regulatory standards and industry best practices. The risk management
programs of the Bank’s subsidiaries align in all material respects to the Bank’s risk
management framework, although the actual execution of their programs may be
different.
The Bank’s risk management framework is applied on an enterprise-wide basis and
consists of five key elements:
• Risk Governance
• Risk Appetite
• Risk Management Tools
• Risk Identification and Assessment
• Risk Culture
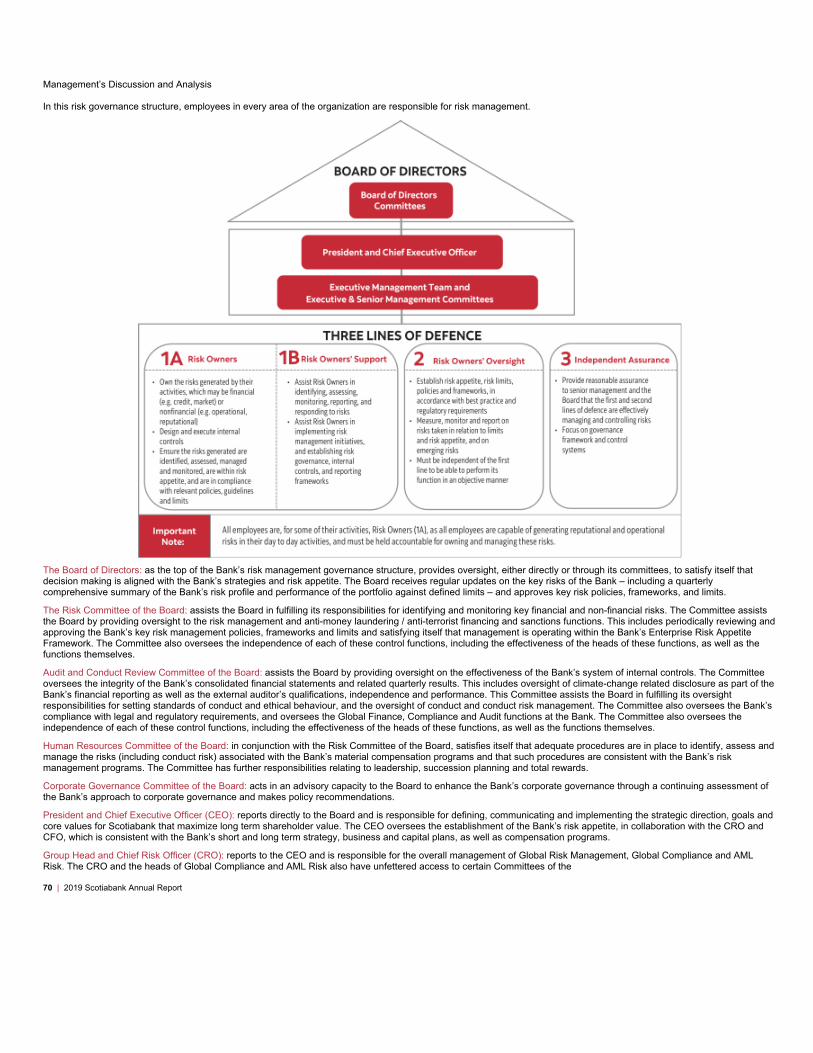
Management’s Discussion and Analysis
In this risk governance structure, employees in every area of the organization are responsible for risk management.
The Board of Directors: as the top of the Bank’s risk management governance structure, provides oversight, either directly or through its committees, to satisfy itself that
decision making is aligned with the Bank’s strategies and risk appetite. The Board receives regular updates on the key risks of the Bank – including a quarterly
comprehensive summary of the Bank’s risk profile and performance of the portfolio against defined limits – and approves key risk policies, frameworks, and limits.
The Risk Committee of the Board: assists the Board in fulfilling its responsibilities for identifying and monitoring key financial and non-financial risks. The Committee assists
the Board by providing oversight to the risk management and anti-money laundering / anti-terrorist financing and sanctions functions. This includes periodically reviewing and
approving the Bank’s key risk management policies, frameworks and limits and satisfying itself that management is operating within the Bank’s Enterprise Risk Appetite
Framework. The Committee also oversees the independence of each of these control functions, including the effectiveness of the heads of these functions, as well as the
functions themselves.
Audit and Conduct Review Committee of the Board: assists the Board by providing oversight on the effectiveness of the Bank’s system of internal controls. The Committee
oversees the integrity of the Bank’s consolidated financial statements and related quarterly results. This includes oversight of climate-change related disclosure as part of the
Bank’s financial reporting as well as the external auditor’s qualifications, independence and performance. This Committee assists the Board in fulfilling its oversight
responsibilities for setting standards of conduct and ethical behaviour, and the oversight of conduct and conduct risk management. The Committee also oversees the Bank’s
compliance with legal and regulatory requirements, and oversees the Global Finance, Compliance and Audit functions at the Bank. The Committee also oversees the
independence of each of these control functions, including the effectiveness of the heads of these functions, as well as the functions themselves.
Human Resources Committee of the Board: in conjunction with the Risk Committee of the Board, satisfies itself that adequate procedures are in place to identify, assess and
manage the risks (including conduct risk) associated with the Bank’s material compensation programs and that such procedures are consistent with the Bank’s risk
management programs. The Committee has further responsibilities relating to leadership, succession planning and total rewards.
Corporate Governance Committee of the Board: acts in an advisory capacity to the Board to enhance the Bank’s corporate governance through a continuing assessment of
the Bank’s approach to corporate governance and makes policy recommendations.
President and Chief Executive Officer (CEO): reports directly to the Board and is responsible for defining, communicating and implementing the strategic direction, goals and
core values for Scotiabank that maximize long term shareholder value. The CEO oversees the establishment of the Bank’s risk appetite, in collaboration with the CRO and
CFO, which is consistent with the Bank’s short and long term strategy, business and capital plans, as well as compensation programs.
Group Head and Chief Risk Officer (CRO): reports to the CEO and is responsible for the overall management of Global Risk Management, Global Compliance and AML
Risk. The CRO and the heads of Global Compliance and AML Risk also have unfettered access to certain Committees of the
70 | 2019 Scotiabank Annual Report

Management’s Discussion and Analysis | Risk Management
Board to ensure their independence. As a senior member of the Bank’s executive management team, the CRO participates in strategic decisions related to where and how
the Bank will deploy its various sources of capital to meet the performance targets of the business lines.
Global Risk Management (GRM): supports the Bank’s objectives and is mandated to maintain an ongoing and effective enterprise-wide risk management framework that
resonates through all levels of the Bank. GRM is responsible for providing reasonable assurance to executive management, the Board of Directors and shareholders that
risks are actively identified, managed and communicated to all key stakeholders. GRM’s mission is to ensure that the outcomes of risk taking activities are consistent with the
Bank’s strategies and risk appetite, and that there is an appropriate balance between risk and reward in order to maximize shareholder value.
Global Compliance: on an enterprise-wide basis, manages compliance risk which includes regulatory compliance, conduct, and privacy risks throughout Scotiabank. A
primary objective of Global Compliance is to take a holistic view of compliance risk to ensure consistency in the application of the Compliance Program, and assurance of
outputs from its compliance risk management processes. Global Compliance provides independent oversight of Compliance Risk through the Compliance Program by:
• developing and maintaining compliance frameworks, policies, standards, and procedures;
• effectively challenging compliance risk management in the Bank’s Business Lines and Corporate Functions;
• acting as a consultant and educator on regulatory compliance, internal policies and procedures; and
• being responsible for conducting ongoing risk-based enterprise-wide assessment, monitoring, testing, issues management, regulatory relationship management, and
reporting.
AML Risk: on an enterprise-wide basis, develops controls and standards for the prevention, detection, deterrence and reporting of money laundering, terrorist financing, and
sanctions risks. AML Risk is responsible for maintaining the program in accordance with Scotiabank’s needs, industry practice, and anti-money laundering / anti-terrorist
financing (AML/ATF) and Sanctions legal and regulatory requirements, as well as providing risk-tailored oversight of Scotiabank’s compliance with these standards and
requirements.
Global Finance: leads enterprise-wide financial strategies which support the Bank’s ability to maximize sustainable shareholder value, and actively manages the reliable and
timely reporting of financial information to management, the Board of Directors and shareholders, regulators, as well as other stakeholders. This reporting includes the
Bank’s consolidated financial statements and related quarterly and annual results, as well as financial regulatory filings. Global Finance executes the Bank’s financial and
capital management strategies with appropriate governance and control, while ensuring its processes are efficient and effective.
Internal Audit: reports independently to the Audit and Conduct Review Committee of the Board on the design and operating effectiveness of the Bank’s risk management
practices. The mission of the audit department is to provide enterprise-wide independent, objective assurance over the design and operating effectiveness of the Bank’s
internal controls, risk management and governance processes and to provide consulting services designed to improve the Bank’s operations.
Business Line and Corporate Functions: as the first line of defence in the Three Lines of Defence model, are accountable for effective management of the risks within their
business lines and functions through identifying, assessing, mitigating, monitoring and reporting the risks. Business lines and corporate functions actively implement effective
internal controls as well as governance activities to manage risk and maintain activities within risk appetite and policies. Further, business lines have processes to be able to
effectively identify, monitor and report against allocated risk appetite limits.
Risk Appetite
Effective risk management requires clear articulation of the Bank’s risk appetite and how the Bank’s risk profile will be managed in relation to that appetite.
Risk Appetite Statement
The Bank’s Risk Appetite Statement can be summarized as follows:
• The Bank favours businesses that generate sustainable, consistent and predictable earnings.
• The Bank expects to take certain risks in order to generate earnings, but sets limits to ensure risk taking activities are in line with the Bank’s strategic objectives, risk
culture, and risk appetite.
• The Bank limits its risk-taking activities to those that are well understood and where there is sufficient expertise, resources and infrastructure to effectively measure and
manage the risk and balance risk with reward.
2019 Scotiabank Annual Report | 71
The Bank’s Enterprise Risk Appetite Framework (RAF) articulates the amount and
types of risk the Bank is willing to take in order to meet its strategic objectives. The
Enterprise RAF consists of the risk capacity, risk appetite statement, risk appetite
metrics, and roles and responsibilities. Together, the application of these
components helps to ensure the Bank stays within appropriate risk boundaries,
finds an optimal balance between risk and return, and supports a strong risk
culture.
Scotiabank’s risk appetite is integrated into the strategic and capital planning
process and is reviewed annually by senior management who recommend it to the
Board for approval. Business lines, sub-business lines, control functions and key
subsidiaries develop their own risk appetite frameworks and/or statements, which
are aligned with the Bank’s Enterprise RAF.

Management’s Discussion and Analysis
• Capital considerations are part of all material risk decisions.
• The Bank has low appetite for reputational, legal, regulatory or taxation risk, and no appetite for breaches of the Code of Conduct.
• All employees of the Bank are responsible for understanding the limits and any other boundaries that apply to their activities.
Risk Appetite Metrics
Risk appetite metrics provide clear risk limits, which are critical in implementing effective risk management. Certain risk appetite metrics are supported by management level
limit structures and controls, as applicable.
Other components of Scotiabank’s risk appetite metrics:
• Set risk capacity and appetite in relation to regulatory constraints
• Use stress testing to provide forward-looking metrics
• Ensure Scotiabank’s credit rating remains strong
• Minimize earnings volatility
• Limit exposure to operational events that can have an impact on earnings, including regulatory fines
• Ensure reputational risk is top of mind and strategy is being executed within operating parameters
Risk Management Tools
Effective risk management includes tools that are guided by the Bank’s Enterprise Risk Appetite Framework and integrated with the Bank’s strategies and
business planning processes.
Scotiabank’s risk management framework is supported by a variety of risk management tools that are used together to manage enterprise-wide risks. Risk management
tools are regularly reviewed and updated to ensure consistency with risk-taking activities, and relevance to the business and financial strategies of the Bank.
Policies, Frameworks & Limits
Policies and Frameworks
The Bank develops and implements its key risk policies and frameworks in consultation with the Board. Such policies and frameworks are also subject to the requirements
and guidelines of the Office of the Superintendent of Financial Institutions (OSFI), the Bank Act, and the Canada Deposit Insurance Corporation (CDIC). Policy and
framework development and implementation reflect best governance practices which the Bank strives to adhere to at all times. The Bank also provides advice and counsel to
its subsidiaries in respect of their risk policies and frameworks to ensure alignment with the Bank, subject to the local regulatory requirements of each subsidiary.
Policies and frameworks apply to specific types of risk or to the activities that are used to measure and control risk exposure. They are based on recommendations from risk
management and other control and corporate functions including internal audit, business lines, and senior and executive management. Industry best practices and regulatory
requirements are also factored into the policies and frameworks, are guided by the Bank’s risk appetite, and set the limits and controls within which the Bank and its
subsidiaries can operate. Key risk policies and frameworks are supported by manuals, procedures and guidelines.
Limits
Limits govern and control risk-taking activities within the appetite and tolerances established by the Board and executive management. Limits also establish accountability for
key tasks in the risk-taking process and establish the level or conditions under which transactions may be approved or executed.
Risk Measurement
Models
The use of quantitative risk methodologies and models is balanced by a strong governance framework and includes the application of sound and experienced judgment. The
development, independent review, and approval of models are subject to formalized policies such as the Model Risk Management Policy and oversight of senior
management committees such as the Model Review Committee (for market risk, counterparty credit risk, and liquidity risk models). Key models used in the calculation of
regulatory capital on an enterprise basis are OSFI approved. All in-scope models are incorporated into the Bank’s framework for governance and control of model risk to
ensure that they continue to perform in line with regulatory requirements. The Bank uses models for a range of purposes including:
• valuing transactions
• measuring risk exposures
• determining credit risk ratings and parameters
• calculating internal economic and regulatory capital
• calculating expected credit risk loss
Monitoring and Reporting
The Bank continuously monitors its risk exposures to ensure business activities are operating within approved limits or guidelines, and the Bank’s strategies and risk
appetite. Breaches of these limits or guidelines are reported to senior management and/or the Board depending on the limit or guideline.
Risk reporting aggregates measures of risk across products and businesses, and are used to ensure compliance with risk policies, limits, and guidelines. They also provide a
clear statement of the amounts, types, and sensitivities of the various risks in the portfolio. Senior management and the Board use this information to understand the Bank’s
risk profile and the performance of the portfolios. A comprehensive summary of the Bank’s risk profile and performance of the portfolio is presented quarterly to the Board of
Directors.
72 | 2019 Scotiabank Annual Report
Management’s Discussion and Analysis | Risk Management
Forward-Looking Exercises
Stress Testing
Stress testing programs at both the enterprise-wide level and individual risk level allow the Bank to estimate the potential impact on the Bank’s income and capital resulting
from significant changes in market conditions, credit environment, liquidity demands, or other risk factors. Enterprise-wide stress testing is also integrated with both the
strategic and financial planning processes, as well as financial crisis management planning. The development, approval and on-going review of the Bank’s stress testing
programs are subject to policy, and the oversight of the Stress & Scenarios Committee (SSC) or other management committees as appropriate. The Stress & Scenarios
Model Review Committee (SSMRC) was established as a subcommittee of the SSC to review and approve enterprise-wide stress testing models as well as review IFRS 9
models prior to submission for approval to the SSC. Where appropriate, the Board of Directors or the Risk Committee of the Board approves stress testing limits for certain
risk factors, and receives reports on performance regularly. Each program is developed with input from a broad base of stakeholders, and results are integrated into
management decision making processes for capital, funding, market risk limits, and credit risk appetite. The stress testing programs are designed to capture a number of
enterprise-wide stress scenarios with differing severities and time horizons.
Other Testing
Other tests are conducted, as required, at the enterprise-wide level and within specific functional areas to test the decision-making processes of the Senior Management
team and key personnel, by simulating a potential stress scenario. Simulated stress scenarios may include several complexities and disruptions through which Senior
Management are engaged to make certain key decisions. Generally, the objectives of the simulations can include testing (1) the executability of activation protocols,
(2) operational readiness, (3) the flexibility of the executive decision-making process, and (4) the process by which actions to be taken are prioritized. The exercises may
also be designed to test the applicability and relevance of available data and the timeliness of reporting for decision making under stressed/crisis conditions.
Risk Identification and Assessment
Effective risk management requires a comprehensive process to identify risks and assess their materiality.
Assessment of Risks
On an annual basis, the Bank undergoes a Bank-wide risk assessment that identifies the material risks faced by the Bank for the Internal Capital Adequacy Assessment
Process (ICAAP) and the determination of internal capital. This process evaluates the risks and determines the pervasiveness of the risk across multiple business lines, the
significance of the risk to a specific business line, the likelihood and potential impact of the risk and whether the risk may cause unexpected losses in income and therefore
would be mitigated by internal capital. The process also reviews other evolving and emerging risks and includes qualitative considerations such as strategic, economic and
environmental risk factors. The identified risks are ascribed a rating of how probable and impactful they may be and are used as an important input in the ICAAP process and
the determination of internal capital.
Principal Risk Types
Principal Risks are defined as:
Those risks which management considers of primary importance: i) having a significant impact or influence on the Bank’s primary business and revenue generating activities
(Financial Risks) or ii) inherent in the Bank’s business and can have significant negative strategic, business, financial and/or reputational consequences (Non-Financial Risks
(i.e. Core Risks)).
Principal Risks are assessed on an annual basis considering, amongst other things, the following factors:
• Potential impact (direct or indirect) on the Bank’s financial results, operations, management and strategy
• Effect on the Bank’s long term prospects and ongoing viability
• Regulatory focus and/or social concern
• Short to mid-term macroeconomic and market environment
• Financial and human resources required to manage and monitor the risk
• Establishment of key risk indicators, performance indicators or management limits to monitor and control the risk
• Peer identification and global best practices
• Regular monitoring and reporting to the Board on the risk is warranted
Once a Principal Risk has been identified, governance for that risk should be developed including:
• appropriate committee oversight structures;
• dedicated 2nd line resources; and
• regular measurement, monitoring and reporting supporting adequate and effective Board oversight.
The Bank’s principal risk types are reviewed annually to determine that they adequately reflect the Bank’s risk profile. Principal risks are categorized into two main groups:
Financial Risks:
Credit, Market, Liquidity
These are risks that are directly associated with the Bank’s primary business and revenue generating activities. The Bank understands these risks well and takes them on in
order to generate sustainable, consistent and predictable earnings. Financial risks are generally quantifiable and are relatively predictable. The Bank has higher risk appetite
for financial risks which are considered to be a fundamental part of doing business; but only when they are well understood, within established limits, and meet the desired
risk and return profile.
2019 Scotiabank Annual Report | 73

Management’s Discussion and Analysis
Non-Financial Risks (i.e. Core Risks): Operational, Information Technology & Cybersecurity, Data, Compliance, Money Laundering & Terrorist Financing and Sanctions, Environmental, Reputational, Strategic
These are risks that are inherent in the Bank’s business and can have significant negative strategic, business, financial and/or reputational consequences if not managed properly. In comparison to financial risks, Core Risks are less predictable and more difficult to define and measure. The Bank has low risk appetite for Core Risks and mitigates these accordingly.
Other Considerations • Other non-principal risks are reviewed and assessed as part of the Assessment of Risks process • Risk identification and assessment is performed on an ongoing basis through the following:
o Transactions – risks, including credit and market exposures, are assessed by the business lines and reviewed by GRM, as applicable. o Monitoring – risks are identified by constantly monitoring and reporting current trends and analysis. o New Products and Services – new products and services are assessed for potential risks through a standardized process. o Strategic Investments – investment transactions are thoroughly reviewed for risks and are approved by the Strategic Transactions and Investment Committee (STIC)
which provides advice, counsel and decisions on effective allocation and prioritization of resources.
Risk Culture
Effective risk management requires a strong, robust, and pervasive risk management culture where every Bank employee is a risk manager and is responsible
for managing risks.
The Bank’s risk culture is influenced by numerous factors including the interdependent relationship amongst the Bank’s risk governance structure, risk appetite, strategy, organizational culture, and risk management tools.A strong risk culture promotes behaviours that align to the Bank’s values, supports sound risk taking and enables employees to identify risk taking activities that are beyond the established risk appetite.The Bank’s Risk Culture Program is based on four indicators of a strong risk culture:1. Tone from the Top – Clear and consistent communication on risk behaviour expectations, the
importance of Scotiabank’s values, and fostering an environment where everyone has ownership and responsibility for “doing the right thing”.
2. Accountability – All employees are accountable for risk management. There is an environment of open communication where employees feel safe to speak-up and raise concerns without fear of retaliation.
3. Risk Management – Risk taking activities are consistent with the Bank’s strategies and risk appetite. Risk appetite considerations are embedded in key decision making processes.
4. People Management – Performance and compensation structures encourage desired behaviors and reinforce the Bank’s risk culture.
Other elements that influence and support the Bank’s risk culture: • Code of Conduct: describes the minimum standards of behaviour to which all directors, officers, and employees must adhere and attest to on an annual basis. • Values: Integrity – Act With Honour; Respect – Value Every Voice; Accountability – Make It Happen; Passion – Be Your Best. • Communication: the Bank actively communicates risk appetite, and how it relates to Scotiabankers, to promote a sound risk culture.
o Reputation is everything o Information is key o Success depends on you o Know your boundaries
• Compensation: programs are structured to discourage behaviours that are not aligned with the Bank’s values and Code of Conduct, and ensure that such behaviors are not rewarded.
• Training: risk culture is continually reinforced by providing effective and informative mandatory and non-mandatory training modules for all employees on a variety of risk management topics.
• Decision-making on risk issues is highly centralized: the flow of information and transactions to senior and executive committees keeps management well informed of the risks the Bank faces, and ensures that transactions and risks are aligned with the Bank’s risk appetite.
• Executive Mandates: all Executives across the Bank have risk management responsibilities within their mandates.
74 | 2019 Scotiabank Annual Report
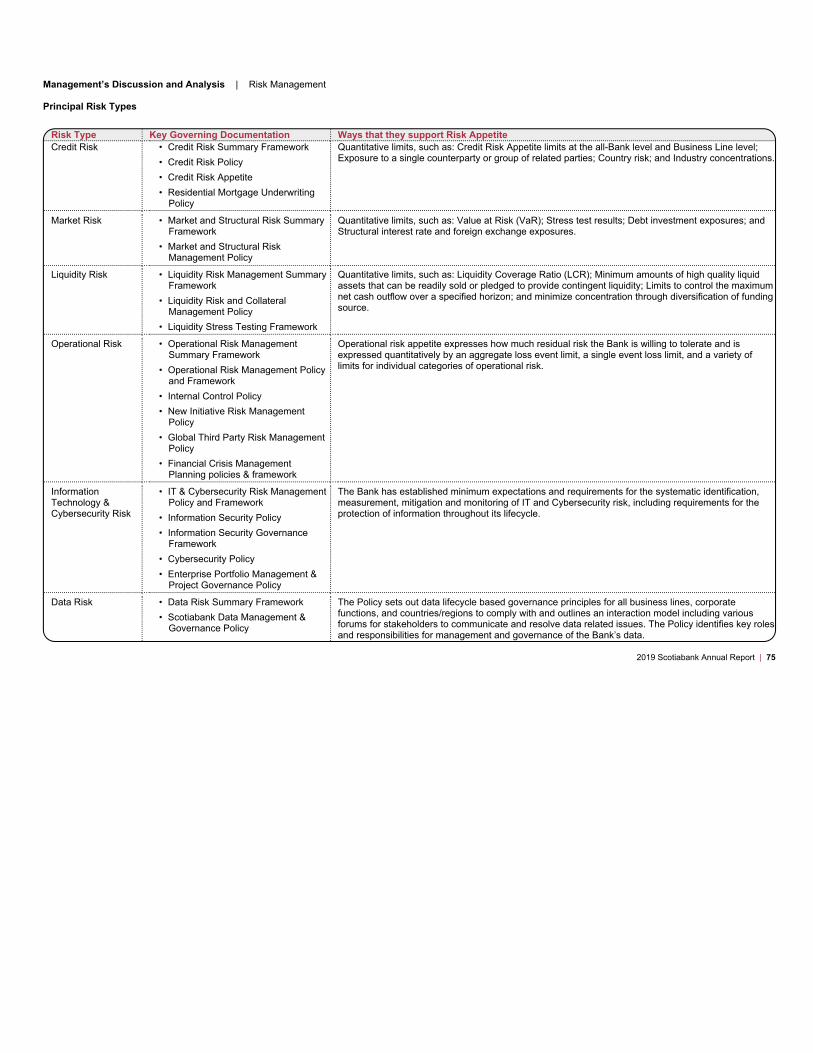
Management’s Discussion and Analysis | Risk Management
Principal Risk Types
Risk Type Key Governing Documentation Ways that they support Risk Appetite
Credit Risk • Credit Risk Summary Framework• Credit Risk Policy• Credit Risk Appetite• Residential Mortgage Underwriting
Policy
Quantitative limits, such as: Credit Risk Appetite limits at the all-Bank level and Business Line level; Exposure to a single counterparty or group of related parties; Country risk; and Industry concentrations.
Market Risk • Market and Structural Risk Summary Framework
• Market and Structural Risk Management Policy
Quantitative limits, such as: Value at Risk (VaR); Stress test results; Debt investment exposures; and Structural interest rate and foreign exchange exposures.
Liquidity Risk • Liquidity Risk Management Summary Framework
• Liquidity Risk and Collateral Management Policy
• Liquidity Stress Testing Framework
Quantitative limits, such as: Liquidity Coverage Ratio (LCR); Minimum amounts of high quality liquid assets that can be readily sold or pledged to provide contingent liquidity; Limits to control the maximum net cash outflow over a specified horizon; and minimize concentration through diversification of funding source.
Operational Risk • Operational Risk Management Summary Framework
• Operational Risk Management Policy and Framework
• Internal Control Policy• New Initiative Risk Management
Policy• Global Third Party Risk Management
Policy• Financial Crisis Management
Planning policies & framework
Operational risk appetite expresses how much residual risk the Bank is willing to tolerate and is expressed quantitatively by an aggregate loss event limit, a single event loss limit, and a variety of limits for individual categories of operational risk.
Information Technology & Cybersecurity Risk
• IT & Cybersecurity Risk Management Policy and Framework
• Information Security Policy• Information Security Governance
Framework• Cybersecurity Policy• Enterprise Portfolio Management &
Project Governance Policy
The Bank has established minimum expectations and requirements for the systematic identification, measurement, mitigation and monitoring of IT and Cybersecurity risk, including requirements for the protection of information throughout its lifecycle.
Data Risk • Data Risk Summary Framework• Scotiabank Data Management &
Governance Policy
The Policy sets out data lifecycle based governance principles for all business lines, corporate functions, and countries/regions to comply with and outlines an interaction model including various forums for stakeholders to communicate and resolve data related issues. The Policy identifies key roles and responsibilities for management and governance of the Bank’s data.
2019 Scotiabank Annual Report | 75

Management’s Discussion and Analysis
Compliance Risk • Compliance Risk Summary Framework
• Conduct Risk Summary Framework• Risk Culture Summary Framework• Conduct Risk Management Policy• Global Compliance Risk Management
Policy• Privacy Risk Management Framework• Code of Conduct
Compliance Risk appetite is based on the moderate all-Bank Residual Compliance Risk Rating obtained through the annual Compliance Risk and Control Assessment.
Money Laundering & Terrorist Financing and Sanctions Risks
• AML/ATF Policy• AML/ATF Procedures and Standards• Sanctions Policy• Sanctions Procedures and Standards
The Bank has no appetite for Clients where money laundering/terrorist financing risk is not well understood or where there is insufficient expertise, resources and infrastructure to effectively measure and manage the risk.The Bank has no appetite for any business activity or services to Clients that are prohibited by sanctions laws and regulations, or for the changing, manipulation, or stripping of data with an intent to avoid sanctions obligation.
Reputational Risk • Reputational Risk Policy Low appetite for reputational, legal, or taxation risk arising in business activities, initiatives, products, services, transactions or processes, or from a lack of suitability of products for clients.
Environmental Risk • Environmental Policy The Bank has policies and procedures in place to ensure that it provides loans to borrowers that demonstrate an ability and willingness to practice sound environmental risk management.
Strategic Risk • Annual Strategy Report to the Board of Directors
Strategy report considers linkages between the Bank’s Enterprise Risk Appetite Framework with the enterprise strategy, business line strategies and corporate function strategies.
76 | 2019 Scotiabank Annual Report
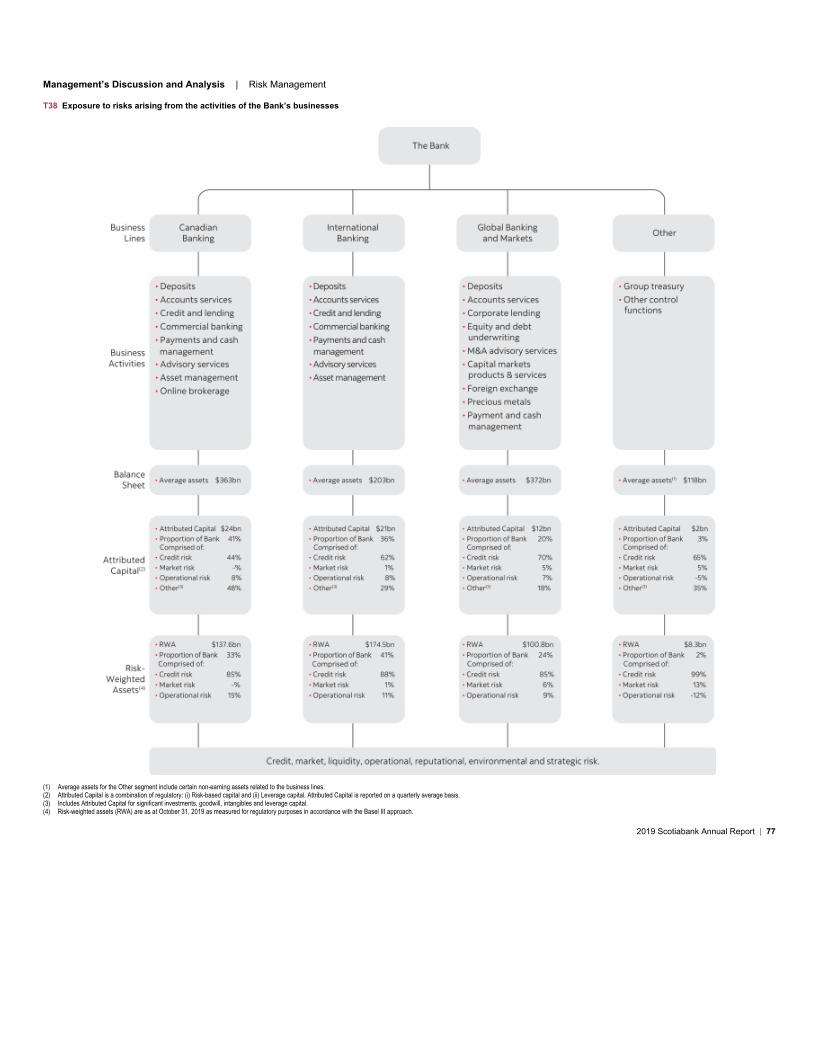
Management’s Discussion and Analysis | Risk Management
T38 Exposure to risks arising from the activities of the Bank’s businesses
(1) Average assets for the Other segment include certain non-earning assets related to the business lines.
(2) Attributed Capital is a combination of regulatory: (i) Risk-based capital and (ii) Leverage capital. Attributed Capital is reported on a quarterly average basis.
(3) Includes Attributed Capital for significant investments, goodwill, intangibles and leverage capital.
(4) Risk-weighted assets (RWA) are as at October 31, 2019 as measured for regulatory purposes in accordance with the Basel III approach.
2019 Scotiabank Annual Report | 77

Management’s Discussion and Analysis
Top and emerging risks
The Bank is exposed to a variety of top and emerging risks. These risks can potentially adversely affect the Bank’s business strategies, financial performance, and
reputation. As part of our risk management approach, we proactively identify, assess, review, monitor and manage a broad range of top and emerging risks and undertake
appropriate risk mitigation strategies. Every quarter, a listing and a brief discussion of selected top and emerging risks is presented to Senior Management and the Board of
Directors.
The Bank’s top and emerging risks are as follows:
Geopolitical risk and macroeconomic uncertainty
Geopolitical risks including trade tensions could affect volatility in foreign exchange and capital markets globally. This affects all participants in these markets. In the short
run, a market shock could potentially impact the Bank’s trading and non-trading market activities and revenues. Over a longer period of time, the more broadly based
macroeconomic effects could potentially impact the Bank’s exposures to customers and market segments impacted by those shocks. Although it is difficult to predict where
new geopolitical disruption will occur or economic consequences of trade-related events, the Bank’s stress testing program assists in evaluating the potential impact of
severe conditions, whether caused by geopolitical or other circumstances. Management’s strong understanding of the local political landscapes and macroeconomic
environments in which the Bank operates, combined with the Bank’s business model and diversified geographic footprint, serve as ongoing mitigants to this risk.
Money laundering, terrorist financing and sanctions compliance
Money laundering, terrorist financing and sanctions compliance continues to receive significant attention as nations attempt to deal with the harmful legal, economic, and
social consequences of criminal activities. Governments, law enforcement agencies, and regulators around the world employ a variety of means, including establishing
regulatory requirements on financial institutions, to curtail the ability of criminal and terrorist elements to profit from, or finance, their activities. It is widely recognized that
financial institutions are uniquely positioned and possess the means to assist in the fight against money laundering, terrorist financing, and criminal activity (including anti-
trafficking and exploitation) through prevention, detection, deterrence and the exchange/reporting of information.
Scotiabank is subject to the expanding and constantly evolving anti-money laundering/anti-terrorist financing and economic sanctions, laws and regulations internationally
across the Bank’s global footprint. Money laundering, terrorist financing, and economic sanctions violations represent material risk to the Bank including regulatory, legal,
financial and reputational exposure.
The Bank is committed to sustaining secure financial systems in the countries in which it maintains a presence by taking the necessary action, using a risk tailored approach.
The Bank’s AML Risk program includes policies, procedures and control standards relating to client identification and due diligence, transaction monitoring, payment and
name screening, investigating and reporting of suspicious activity, and evaluation of new products and services to prevent and/or detect activities that may pose risk to the
Bank. The AML Risk program also facilitates an annual enterprise-wide AML/ATF and Sanctions risk assessment process and ensures that all employees, including the
Board of Directors and Executive Management, undergo initial and ongoing AML/ATF and Sanctions training.
Information Technology and cybersecurity risk
Technology, information and cybersecurity risks continue to impact financial institutions and other businesses in Canada and around the globe. Threats are not only
increasing in volume but in their sophistication as adversaries use ever evolving technologies and attack methodologies. The technology environment of the Bank, its
customers and the third parties providing services to the Bank, may be subject to attacks, breaches or other compromises. Incidences like these can result in disruption to
operations, misappropriation or unauthorized release of confidential, financial or personal information, and reputational damage, among other things. The Bank proactively
monitors and manages the risks and constantly updates and refines programs as threats emerge to minimize disruptions and keep systems and information protected. In
addition, the Bank has purchased insurance coverage to help mitigate against certain potential losses associated with cyber incidents.
Technology innovation and disruption
The pace of technology innovation continues to impact the financial services industry and its customers. Global regulators continue to push for increased competition with
open banking, in addition to, non-traditional new participants entering certain segments of the market and challenging the position of financial institutions. New participants
are disrupting the traditional Bank operating model with the use of advanced technologies and analytical tools offering a highly customized user experience with lower fixed
costs which has the potential to impact revenues and costs in certain areas of the Bank’s businesses. In response to increased customer demands, needs and expectations,
the Bank has embarked on a multi-year digital transformation with the aspiration to be a digital leader in the financial services industry. To support this strategy the Bank has
opened digital factories in Toronto and its key international focus markets, in Mexico, Peru, Chile and Colombia to contribute to financial innovation, while continuing to
monitor for evolving risks in new technology tools.
Third party service providers
As the Bank continues to expand its ecosystem of third party information technology (IT) service and cloud providers and FinTec partners, the traditional boundaries of
where the Bank is able to assert control becomes indistinct. There is growing dependency on the effectiveness of the control environment in place at IT vendors to limit the
impacts of vendor availability and security incidents on the Bank’s operations, intellectual property, and reputation. Additionally, third party service providers other than IT
vendors, as well as service providers to those third parties (i.e. fourth party vendors) can also fall victim to systems, data and privacy breaches if their control environments
fail to operate effectively. Any such breaches could impact the Bank if the Bank’s data is shared with such vendors in the course of their provision of services to the Bank.
The Bank continues to enhance the resources, capabilities and accountabilities of third party risk management areas within the first and second line of defence areas.
Legal and compliance risk
The Bank is subject to extensive regulation in the jurisdictions in which it operates. Although the Bank continually monitors and evaluates the potential impact of regulatory
developments to assess the impact on our businesses and to implement any necessary changes, regulators and private parties may challenge our compliance. Failure to
comply with legal and regulatory requirements may result in fines, penalties, litigation, regulatory sanctions, enforcement actions and limitations or prohibitions from engaging
in business activities, all of which may negatively impact the Bank’s financial performance and its reputation. In addition, day-to-day compliance with existing laws and
regulations has involved and will continue to involve significant resources, including requiring the Bank to take actions or incur greater costs than anticipated, which may
negatively
78 | 2019 Scotiabank Annual Report

Management’s Discussion and Analysis | Risk Management
impact the Bank’s financial performance. Such changes could also adversely impact the Bank’s business strategies or limit its product or service offerings, or enhance the
ability of the Bank’s competitors to offer their own products and services that rival the Bank’s. Regulators have also evidenced an increased focus on risks associated with
conduct, privacy, model risk, and operational resilience. This focus could lead to more regulatory or other enforcement actions including for practices which may historically
have been considered acceptable.
The Bank continues to monitor and respond to global regulatory developments relating to a broad spectrum of topics, such that control and business units are responsive on
a timely basis and business impacts, if any, are minimized.
For additional information on some of the key regulatory developments that have the potential of impacting the Bank’s operations, see “Regulatory Developments” on page
113.
Canadian household indebtedness
After a period of low interest rates, Canadians have increased household borrowing at a pace that exceeded their income growth. Canadian household indebtedness and
household debt-service ratio are nearing historic highs. Household saving rates are at record lows, leaving little margin to sustain consumption if the macro-economic outlook
proves more negative. The Bank performs stress tests considering these sensitivities and actively manages its lending portfolio. The Bank continues to enhance risk
management capabilities through investments in technology and analytics.
Climate change
Climate change has the potential to impact the Bank’s retail and business banking profitability through credit losses. Severe weather can damage Bank properties and
disrupt operations. Emerging policy/regulatory actions on climate can elevate the Bank’s reputational, legal and regulatory compliance risks. There are also sustainable
finance opportunities to invest in. For further details on the Bank’s Climate Change strategy and actions taken, please refer to the Other Risks section of the MD&A.
2019 Scotiabank Annual Report | 79

Management’s Discussion and Analysis
Credit Risk
Credit risk is the risk of loss resulting from the failure of a borrower or counterparty to honour its financial or contractual obligations to the Bank. Credit risk arises in the
Bank’s direct lending operations, and in its funding, investment and trading activities where counterparties have repayment or other obligations to the Bank.
Index of all credit risk disclosures
Page Tables and charts Page
Credit risk summary 81
Credit Risk Management Framework
Risk measures 81
Corporate and commercial 81
Risk ratings 81
Adjudication 82
Credit Risk Mitigation-Collateral/Security 82
Traditional Non-Retail Products 82
Commercial/Corporate Real Estate 82
Traded products 83
Credit Risk Mitigation-Collateral/Security 83
Retail 83
Adjudication 83
Risk ratings 83
Credit Risk Mitigation-Collateral/Security 83
Credit Quality 84 T3 Financial highlights 21
Impaired loans 84 T11 Provision for credit losses as a percentage of average loans and acceptances 28
Allowance for credit losses 84 T12 Net charge-offs as a percentage of average loans and acceptances 28
T59 Gross impaired loans by geographic segment 117
T60 Provision against impaired loans by geographic segment 117
T61 Cross-border exposure to select countries 117
T62 Loans and acceptances by type of borrower 118
T63 Off-balance sheet credit instruments 118
T64 Changes in net impaired loans 119
T65 Provision for credit losses 119
T66 Provision for credit losses against impaired loans by type of borrower 120
T67 Impaired loans by type of borrower 120
T68 Total credit risk exposures by geography 121
T69 AIRB credit risk exposures by maturity 121
T70 Total credit risk exposures and risk-weighted assets 122
Analysis of the aggregate credit risk exposure including market risk exposure, assets of the Bank’s
insurance subsidiaries and other assets that fully reconciles to the balance sheet (refer Note 36 –
Financial instruments – risk management in the consolidated financial statements) 227
Portfolio review 84
Risk diversification 85 C24 Well diversified in Canada and internationally – loans and acceptances 85
C25 and in household and business lending – loans and acceptances 85
T58 Loans and acceptances by geography 116
Risk mitigation 85
Real estate secured lending 85 T43 Bank’s exposure distribution by country 87
Loans to Canadian condominium developers 86
European exposures 86
Financial instruments 67 T37 Mortgage-backed securities 68
80 | 2019 Scotiabank Annual Report

Management’s Discussion and Analysis | Risk Management
Credit risk summary
• Loans and acceptances (Retail and Non-Retail) remained diversified by region, industry and customer. Regional exposure is spread across our key markets (Canada
64%, United States 7%, Chile 7%, Mexico 5% and Other 17%). Financial Services constitutes 5.6% of overall gross exposures (before consideration of collateral) and
was $34 billion, an increase of $5 billion from October 31, 2018. These exposures are predominately to highly rated counterparties and are generally collateralized.
• The Bank’s overall loan book as of October 31, 2019 increased to $611 billion versus $573 billion as of October 31, 2018, with growth reflected in Personal, and Business
and Government lending. Residential mortgages were $268 billion as of October 31, 2019, with 85% in Canada. The corporate loan book, which accounts for 37% of the
total loan book, is composed of 55% of loans with an investment grade rating as of October 31, 2019, unchanged from October 31, 2018.
The effective management of credit risk requires the establishment of an appropriate credit risk culture. Key credit risk policies and appetite statements are important
elements used to create this culture.
The Board of Directors, either directly or through the Risk Committee (the Board), reviews and approves the Bank’s Credit Risk Appetite limits annually and Credit Risk
Policy limits biennially.
• The objectives of the Credit Risk Appetite are to ensure that:
– target markets and product offerings are well defined at both the enterprise-wide and business line levels;
– the risk parameters for new underwritings and for the portfolios as a whole are clearly specified; and
– transactions, including origination, syndication, loan sales and hedging, are managed in a manner that is consistent with the Bank’s risk appetite.
• The Credit Risk Policy articulates the credit risk management framework, including:
– key credit risk management principles;
– delegation of authority;
– the credit risk management program;
– counterparty credit risk management for trading and investment activities; and
– aggregate limits, beyond which credit applications must be escalated to the Board for approval.
GRM develops the credit risk management framework and policies that detail, among other things, the credit risk rating systems and associated parameter estimates; the
delegation of authority for granting credit; the calculation of the allowance for credit losses; and the authorization of write-offs.
Corporate and commercial credit exposures are segmented by country and by major industry group. Aggregate credit risk limits for each of these segments are also
reviewed and approved annually by the Board. Portfolio management objectives and risk diversification are key factors in setting these limits.
Consistent with the Board-approved limits, borrower limits are set within the context of established lending criteria and guidelines for individual borrowers, particular
industries, countries and certain types of lending, to ensure the Bank does not have excessive concentration in any single borrower, or related group of borrowers, particular
industry sector or geographic region. Through the portfolio management process, loans may be syndicated to reduce overall exposure to a single name. For certain
segments of the portfolio, credit derivative contracts are also used to mitigate the risk of loss due to borrower default. Risk is also mitigated through the selective sale of
loans.
Banking units and GRM regularly review the various segments of the credit portfolio on an enterprise-wide basis to assess the impact of economic trends or specific events
on the performance of the portfolio, and to determine whether corrective action is required. These reviews include the examination of the risk factors for particular products,
industries and countries. The results of these reviews are reported to the Risk Policy Committee and, when significant, to the Board.
Risk measures
The credit risk rating systems support the determination of key credit risk parameter estimates which measure credit and transaction risk. These risk parameters – probability
of default, loss given default and exposure at default are transparent and may be replicated in order to provide accuracy and consistency of credit adjudication, as well as
minimum lending standards for each of the risk rating categories. The parameters are an integral part of enterprise-wide policies and procedures encompassing governance,
risk management, and control structure, and are used in various internal and regulatory credit risk quantification calculations.
The Bank’s credit risk rating system is subject to a rigorous validation, governance and oversight framework. The objectives of this framework are to ensure that:
• Credit risk rating methodologies and parameters are appropriately designed and developed, independently validated, and regularly reviewed; and
• The review and validation processes represent an effective challenge to the design and development process.
Non-retail credit risk rating methodologies and parameters are reviewed and validated at least annually. Units within GRM are responsible for design and development,
validation and review, and are functionally independent from the business units responsible for originating transactions. Within GRM, they are also independent from the
units involved in risk rating approval and credit adjudication.
Internal credit risk ratings and associated risk parameters affect lending decisions, loan pricing, computation of the collective allowance for credit losses, and return on
equity.
Corporate and commercial
Corporate and commercial credit exposure arises in the Bank’s business lines.
Risk ratings
The Bank’s risk rating system utilizes internal grade (IG) ratings – an 18 point scale used to differentiate the risk of default of borrowers, and the risk of loss on facilities. The
general relationship between the Bank’s internal IG ratings and external agency ratings is shown in T29.
2019 Scotiabank Annual Report | 81

Management’s Discussion and Analysis
IG ratings are also used to define credit adjudication authority levels appropriate to the size and risk of each credit application. Lower-rated credits require increasingly more
senior management involvement depending upon the aggregate exposure. Where the decision is beyond their authority levels, credit units will refer the request – with its
recommendation – to a senior credit committee for adjudication. In certain cases, these must be referred to the Risk Committee of the Board of Directors.
Adjudication
Credit adjudication units within GRM analyze and evaluate all significant credit requests for corporate and commercial credit exposures, to ensure that risks are adequately
assessed, properly approved, continually monitored and actively managed. The decision-making process begins with an assessment of the credit risk of the individual
borrower or counterparty. Key factors considered in the assessment include:
• The borrower’s management;
• The borrower’s current and projected financial results and credit statistics;
• The industry in which the borrower operates;
• Economic trends; and
• Geopolitical risk.
Based on this assessment, a risk rating is assigned to the individual borrower or counterparty, using the Bank’s risk rating systems.
A separate risk rating is also assigned at the facility level, taking into consideration additional factors, such as security, seniority of claim, structure, term and any other forms
of credit risk mitigation that affect the amount of potential loss in the event of a default of the facility. Security typically takes the form of charges over inventory, receivables,
real estate, and operating assets when lending to corporate and commercial borrowers; and cash or treasuries for trading lines such as securities lending, repurchase
transactions, and derivatives. The types of acceptable collateral, and related valuation processes are documented in risk management policies and manuals.
Other forms of credit risk mitigation include third party guarantees and, in the case of derivatives facilities, master netting agreements.
Internal borrower and facility risk ratings are assigned when a facility is first authorized, and are promptly re-evaluated and adjusted, if necessary, as a result of changes to
the customer’s financial condition or business prospects. Re-evaluation is an ongoing process, and is done in the context of general economic changes, specific industry
prospects, and event risks, such as revised financial projections, interim financial results and extraordinary announcements.
The internal credit risk ratings are also considered as part of the Bank’s adjudication limits, as guidelines for hold levels are tied to different risk ratings. Single borrower limits
are much lower for higher risk borrowers than low risk borrowers.
The credit adjudication process also uses a risk-adjusted return on equity profitability model to ensure that the client and transaction structure offers an appropriate return for
a given level of risk. For the corporate portfolio, and the large borrowers in International, the Loan Portfolio Management Group reviews the profitability model results,
together with external benchmarks, and provides an opinion on the relative return and pricing of each transaction above a minimum threshold.
Individual credit exposures are regularly monitored by both the business line units and GRM for any signs of deterioration. In addition, the business line units and GRM
conduct a review and risk analysis of each borrower annually, or more frequently for higher-risk borrowers. If, in the judgement of management, an account requires the
expertise of specialists in workouts and restructurings, it will be transferred to a special accounts group for monitoring and resolution.
Credit Risk Mitigation – Collateral/Security
Traditional Non-Retail Products (e.g. Operating lines of Credit, Term Loans)
Collateral values are accurately identified at the outset and throughout the tenure of a transaction by using standard evaluation methodologies. Collateral valuation estimates
are conducted at a frequency that is appropriate to the frequency by which the market value fluctuates, using the collateral type and the borrower risk profile.
In addition, when it is not cost effective to monitor highly volatile collateral (e.g. accounts receivable, inventory), appropriate lending margins are applied to compensate (e.g.
accounts receivable are capped at 80% of value, inventory at 50%). The frequency of collateral valuations is also increased when early warning signals of a borrower’s
deteriorating financial condition are identified.
Borrowers are required to confirm adherence to covenants including confirmation of collateral values on a periodic basis, which are used by the Bank to provide early
warning signals of collateral value deterioration. Periodic inspections of physical collateral are performed where appropriate and where reasonable means of doing so are
available.
Bank procedures require verification including certification by banking officers during initial, annual, and periodic reviews, that collateral values/margins/etc. have been
assessed and, where necessary, steps have been taken to mitigate any decreased collateral values.
The Bank does not use automated valuation models (AVMs) for valuation purposes for traditional non-retail products. GRM performs its own valuations of companies based
on various factors such as book value, discounted book value, enterprise value etc.
Commercial/Corporate Real Estate
New or updated appraisals are generally obtained at inception of a new facility, as well as during loan modifications, loan workouts and troubled debt restructure. The
primary reason for requiring a new appraisal is if, in the reasonable opinion of the banking execution unit, or GRM, there has been a material change in value. Additionally,
none of the appraisal guidelines contained within the policies should dissuade the Bank from requesting an appraisal more frequently if an adverse change in market
conditions, sponsorship, credit worthiness, or other underwriting assumptions is realized or expected.
Appraisals must be in writing and must contain sufficient information and analysis to support the Bank’s decision to make the loan. Moreover, in rendering an opinion of the
property’s market value, third party appraisers are responsible for establishing the scope of work necessary to develop credible assignment results. The appraisal must meet
the regulatory and industry requirements which, depending on the type of property being appraised, contain any or all of the following three approaches to value:
i. comparable sales approach
ii. replacement cost approach
iii. income approach
82 | 2019 Scotiabank Annual Report

Management’s Discussion and Analysis | Risk Management
The appraiser must disclose the rationale for the omission of any valuation approach. Furthermore, the appraiser must disclose whether the subject property was physically
inspected and whether anyone provided significant assistance to the person signing the appraisal report. The report must contain a presentation and explanation of the
assumptions used in determining value under each of the above mentioned approaches.
Review of every appraisal is conducted by the banking units and GRM to confirm that the appraisal identifies all of the relevant issues for the specific asset class, location
and economic environment and incorporates all appropriate valuation methodologies and assumptions. In most cases, the banking units also include comparable properties
in addition to what is included in the appraisal to further justify value.
When third party assessors are used, they must be accredited and satisfactory to the Bank. In addition, GRM validates any third party valuations via internal desktop
estimates either based on comparables or discounted income valuations.
Traded products
Traded products are transactions such as derivatives, foreign exchange, commodities, repurchase/reverse repurchase agreements, and securities lending/borrowing. Credit
risks arising from traded products cannot be determined with certainty at the outset, because during the tenure of a transaction the dollar value of the counterparty’s
obligation to the Bank will be affected by changes in the capital markets (such as changes in stock prices, interest rates, and exchange rates). The Bank adjudicates credit
exposures arising from transacting in traded products by considering their current fair value plus an additional component to reflect potential future changes in their
mark-to-market value. The credit adjudication process also includes an evaluation of potential wrong-way risk, which arises when the exposure to a counterparty is positively
correlated to the probability of default of that counterparty.
Credit risk associated with traded products is managed within the same credit adjudication process as the lending business. The Bank considers the credit risk arising from
lending activities, as well as the potential credit risk arising from transacting in traded products with that counterparty.
Credit risk mitigation – collateral/security
Derivatives are generally transacted under industry standard International Swaps and Derivatives Association (ISDA) master netting agreements, which allow for a single net
settlement of all transactions covered by that agreement in the event of a default or early termination of the transactions. ISDA agreements are frequently accompanied by
an ISDA Credit Support Annex (CSA), the terms of which may vary according to each party’s view of the other party’s creditworthiness. CSAs can require one party or both
parties to post initial margin at the onset of each transaction. CSAs also allow for variation margin to be called if total uncollateralized mark-to-market exposure exceeds an
agreed upon threshold. Such variation margin provisions can be one-way (only one party will ever post collateral) or bilateral (either party may post depending upon which
party is in-the-money). The CSA will also detail the types of collateral that are acceptable to each party, and the haircuts that will be applied against each collateral type. The
terms of the ISDA master netting agreements and CSAs are taken into consideration in the calculation of counterparty credit risk exposure.
For derivative transactions, investment grade counterparties account for approximately 86% of the credit risk. Approximately 30% of the Bank’s derivative counterparty
exposures are to bank counterparties. After taking into consideration, where applicable, netting and collateral arrangements, no net credit risk amount arising from traded
products transactions with any single counterparty was considered material to the financial position of the Bank as at October 31, 2019. No individual exposure to an
investment grade bilateral counterparty exceeded $1,114 million and no individual exposure to a corporate counterparty exceeded $464 million.
Retail
Retail credit exposures arise in the Canadian Banking and International Banking business lines.
Adjudication
The decision-making process for retail loans ensures that credit risks are adequately assessed, properly approved, continually monitored and actively managed. Generally,
credit decisions on consumer loans are processed by proprietary adjudication software and are based on risk ratings, which are generated using predictive credit scoring
models.
The Bank’s credit adjudication and portfolio management methodologies are designed to ensure consistent underwriting and early identification of problem loans in line with
our risk appetite. The Bank’s rigorous credit underwriting and retail risk modeling methodologies are more customer focused than product focused. The Bank’s view is that a
customer-centric approach provides better risk assessment than product-based approaches, a more consistent experience to the customer, and should result in lower loan
losses over time.
All credit scoring and policy changes are initiated by units within GRM that are functionally independent from the business units responsible for retail portfolios. Risk models
and parameters are also subject to independent validation and review from the units involved in the design and development of models. The review process includes referral
to the appropriate Senior Credit Committee for approval, where required. Consumer credit portfolios are reviewed at least monthly to identify emerging trends in loan quality
and to assess whether corrective action is required.
Risk ratings
The Bank’s consumer risk rating systems are oriented to borrower or transaction risk. Each retail exposure is assigned a risk grade based on the customer’s credit history
and/or internal credit score. The Bank’s automated risk rating systems assess the ongoing credit-worthiness of individual customers on a monthly basis. This process
provides for meaningful and timely identification and management of problem loans.
The risk rating system under the AIRB approach is subject to regular review and ongoing performance monitoring of key components. Risk model validations are conducted
independently from the areas responsible for rating system development and implementation, to ensure effective independence in design and performance review.
Customer behavior characteristics which are used as inputs within the Bank’s Basel III AIRB models are consistent with those used by the Bank’s Canadian consumer risk
rating systems. The International portfolios are subject to the Standardized approach at this time.
Credit risk mitigation – collateral/security
The property values for residential real estate secured exposures are confirmed at origination through a variety of validation methodologies, including AVM and full
appraisal’s (in-person inspection). The appraisal is completed by a third party, Bank approved appraiser. For monitoring of material portfolios, property values are indexed
quarterly to house prices. For loan impairment within material portfolios, residential property values are re-confirmed using third party AVM’s.
Where AVM values are used, these AVM values are subject to routine validation through a continuous random sampling process that back-tests AVM values against
available property appraisals (primarily third party AVMs). Where third party appraisals are obtained, the Bank relies on the professional
2019 Scotiabank Annual Report | 83
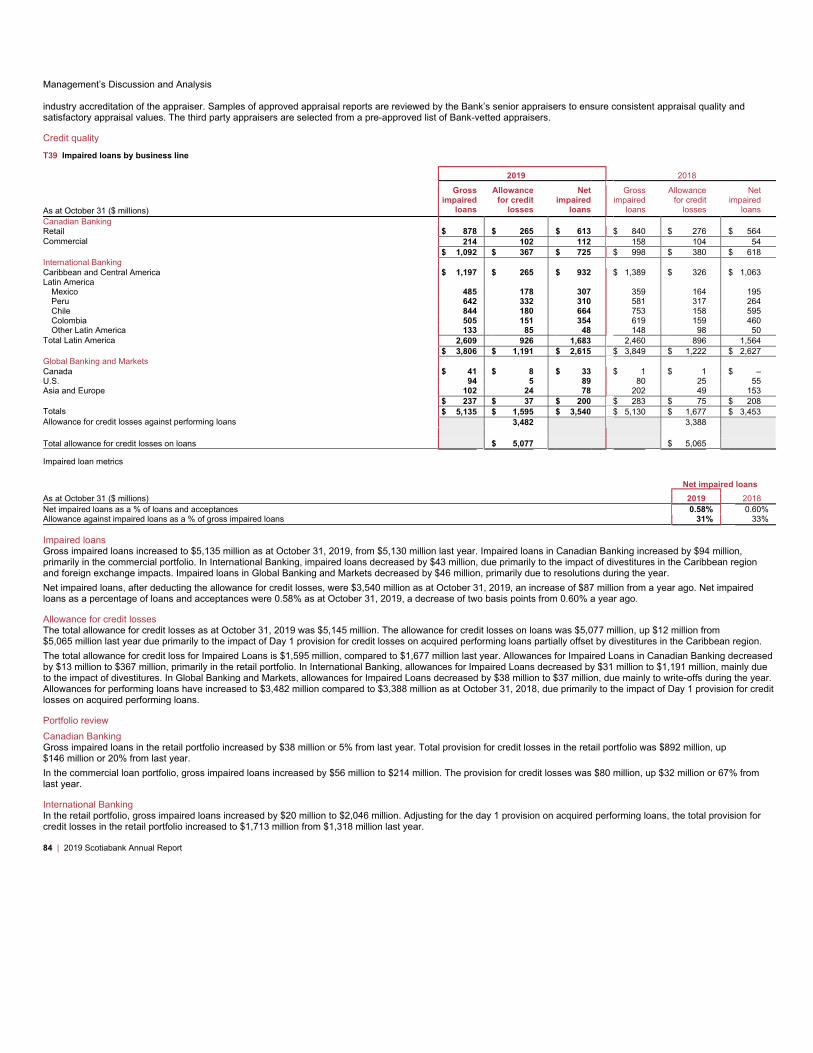
Management’s Discussion and Analysis
industry accreditation of the appraiser. Samples of approved appraisal reports are reviewed by the Bank’s senior appraisers to ensure consistent appraisal quality and
satisfactory appraisal values. The third party appraisers are selected from a pre-approved list of Bank-vetted appraisers.
Credit quality
T39 Impaired loans by business line
2019 2018
As at October 31 ($ millions)
Gross
impaired
loans
Allowance
for credit
losses
Net
impaired
loans
Gross
impaired
loans
Allowance
for credit
losses
Net
impaired
loans
Canadian Banking
Retail $ 878 $ 265 $ 613 $ 840 $ 276 $ 564
Commercial 214 102 112 158 104 54
$ 1,092 $ 367 $ 725 $ 998 $ 380 $ 618
International Banking
Caribbean and Central America $ 1,197 $ 265 $ 932 $ 1,389 $ 326 $ 1,063
Latin America
Mexico 485 178 307 359 164 195
Peru 642 332 310 581 317 264
Chile 844 180 664 753 158 595
Colombia 505 151 354 619 159 460
Other Latin America 133 85 48 148 98 50
Total Latin America 2,609 926 1,683 2,460 896 1,564
$ 3,806 $ 1,191 $ 2,615 $ 3,849 $ 1,222 $ 2,627
Global Banking and Markets
Canada $ 41 $ 8 $ 33 $ 1 $ 1 $ –
U.S. 94 5 89 80 25 55
Asia and Europe 102 24 78 202 49 153
$ 237 $ 37 $ 200 $ 283 $ 75 $ 208
Totals $ 5,135 $ 1,595 $ 3,540 $ 5,130 $ 1,677 $ 3,453
Allowance for credit losses against performing loans 3,482 3,388
Total allowance for credit losses on loans $ 5,077 $ 5,065
Impaired loan metrics
Net impaired loans
As at October 31 ($ millions) 2019 2018
Net impaired loans as a % of loans and acceptances 0.58% 0.60%
Allowance against impaired loans as a % of gross impaired loans 31% 33%
Impaired loans
Gross impaired loans increased to $5,135 million as at October 31, 2019, from $5,130 million last year. Impaired loans in Canadian Banking increased by $94 million,
primarily in the commercial portfolio. In International Banking, impaired loans decreased by $43 million, due primarily to the impact of divestitures in the Caribbean region
and foreign exchange impacts. Impaired loans in Global Banking and Markets decreased by $46 million, primarily due to resolutions during the year.
Net impaired loans, after deducting the allowance for credit losses, were $3,540 million as at October 31, 2019, an increase of $87 million from a year ago. Net impaired
loans as a percentage of loans and acceptances were 0.58% as at October 31, 2019, a decrease of two basis points from 0.60% a year ago.
Allowance for credit losses
The total allowance for credit losses as at October 31, 2019 was $5,145 million. The allowance for credit losses on loans was $5,077 million, up $12 million from
$5,065 million last year due primarily to the impact of Day 1 provision for credit losses on acquired performing loans partially offset by divestitures in the Caribbean region.
The total allowance for credit loss for Impaired Loans is $1,595 million, compared to $1,677 million last year. Allowances for Impaired Loans in Canadian Banking decreased
by $13 million to $367 million, primarily in the retail portfolio. In International Banking, allowances for Impaired Loans decreased by $31 million to $1,191 million, mainly due
to the impact of divestitures. In Global Banking and Markets, allowances for Impaired Loans decreased by $38 million to $37 million, due mainly to write-offs during the year.
Allowances for performing loans have increased to $3,482 million compared to $3,388 million as at October 31, 2018, due primarily to the impact of Day 1 provision for credit
losses on acquired performing loans.
Portfolio review
Canadian Banking
Gross impaired loans in the retail portfolio increased by $38 million or 5% from last year. Total provision for credit losses in the retail portfolio was $892 million, up
$146 million or 20% from last year.
In the commercial loan portfolio, gross impaired loans increased by $56 million to $214 million. The provision for credit losses was $80 million, up $32 million or 67% from
last year.
International Banking
In the retail portfolio, gross impaired loans increased by $20 million to $2,046 million. Adjusting for the day 1 provision on acquired performing loans, the total provision for
credit losses in the retail portfolio increased to $1,713 million from $1,318 million last year.
84 | 2019 Scotiabank Annual Report
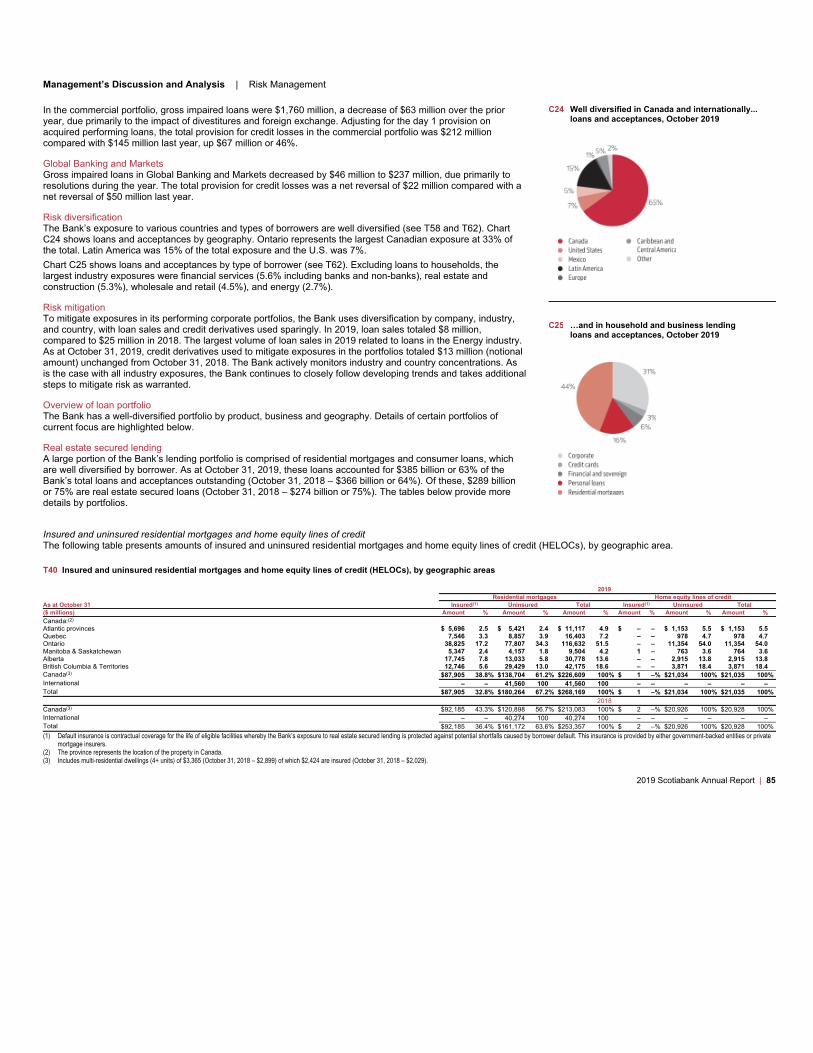
Management’s Discussion and Analysis | Risk Management
Insured and uninsured residential mortgages and home equity lines of credit
The following table presents amounts of insured and uninsured residential mortgages and home equity lines of credit (HELOCs), by geographic area.
T40 Insured and uninsured residential mortgages and home equity lines of credit (HELOCs), by geographic areas
2019
Residential mortgages Home equity lines of credit
As at October 31 Insured(1) Uninsured Total Insured(1) Uninsured Total
($ millions) Amount % Amount % Amount % Amount % Amount % Amount %
Canada:(2)
Atlantic provinces $ 5,696 2.5 $ 5,421 2.4 $ 11,117 4.9 $ – – $ 1,153 5.5 $ 1,153 5.5
Quebec 7,546 3.3 8,857 3.9 16,403 7.2 – – 978 4.7 978 4.7
Ontario 38,825 17.2 77,807 34.3 116,632 51.5 – – 11,354 54.0 11,354 54.0
Manitoba & Saskatchewan 5,347 2.4 4,157 1.8 9,504 4.2 1 – 763 3.6 764 3.6
Alberta 17,745 7.8 13,033 5.8 30,778 13.6 – – 2,915 13.8 2,915 13.8
British Columbia & Territories 12,746 5.6 29,429 13.0 42,175 18.6 – – 3,871 18.4 3,871 18.4
Canada(3)$87,905 38.8% $138,704 61.2% $226,609 100% $ 1 –% $21,034 100% $21,035 100%
International – – 41,560 100 41,560 100 – – – – – –
Total $87,905 32.8% $180,264 67.2% $268,169 100% $ 1 –% $21,034 100% $21,035 100%
2018
Canada(3) $92,185 43.3% $120,898 56.7% $213,083 100% $ 2 –% $20,926 100% $20,928 100%
International – – 40,274 100 40,274 100 – – – – – –
Total $92,185 36.4% $161,172 63.6% $253,357 100% $ 2 –% $20,926 100% $20,928 100%
(1) Default insurance is contractual coverage for the life of eligible facilities whereby the Bank’s exposure to real estate secured lending is protected against potential shortfalls caused by borrower default. This insurance is provided by either government-backed entities or private
mortgage insurers.
(2) The province represents the location of the property in Canada.
(3) Includes multi-residential dwellings (4+ units) of $3,365 (October 31, 2018 – $2,899) of which $2,424 are insured (October 31, 2018 – $2,029).
2019 Scotiabank Annual Report | 85
In the commercial portfolio, gross impaired loans were $1,760 million, a decrease of $63 million over the prior
year, due primarily to the impact of divestitures and foreign exchange. Adjusting for the day 1 provision on
acquired performing loans, the total provision for credit losses in the commercial portfolio was $212 million
compared with $145 million last year, up $67 million or 46%.
Global Banking and Markets
Gross impaired loans in Global Banking and Markets decreased by $46 million to $237 million, due primarily to
resolutions during the year. The total provision for credit losses was a net reversal of $22 million compared with a
net reversal of $50 million last year.
Risk diversification
The Bank’s exposure to various countries and types of borrowers are well diversified (see T58 and T62). Chart
C24 shows loans and acceptances by geography. Ontario represents the largest Canadian exposure at 33% of
the total. Latin America was 15% of the total exposure and the U.S. was 7%.
Chart C25 shows loans and acceptances by type of borrower (see T62). Excluding loans to households, the
largest industry exposures were financial services (5.6% including banks and non-banks), real estate and
construction (5.3%), wholesale and retail (4.5%), and energy (2.7%).
Risk mitigation
To mitigate exposures in its performing corporate portfolios, the Bank uses diversification by company, industry,
and country, with loan sales and credit derivatives used sparingly. In 2019, loan sales totaled $8 million,
compared to $25 million in 2018. The largest volume of loan sales in 2019 related to loans in the Energy industry.
As at October 31, 2019, credit derivatives used to mitigate exposures in the portfolios totaled $13 million (notional
amount) unchanged from October 31, 2018. The Bank actively monitors industry and country concentrations. As
is the case with all industry exposures, the Bank continues to closely follow developing trends and takes additional
steps to mitigate risk as warranted.
Overview of loan portfolio
The Bank has a well-diversified portfolio by product, business and geography. Details of certain portfolios of
current focus are highlighted below.
Real estate secured lending
A large portion of the Bank’s lending portfolio is comprised of residential mortgages and consumer loans, which
are well diversified by borrower. As at October 31, 2019, these loans accounted for $385 billion or 63% of the
Bank’s total loans and acceptances outstanding (October 31, 2018 – $366 billion or 64%). Of these, $289 billion
or 75% are real estate secured loans (October 31, 2018 – $274 billion or 75%). The tables below provide more
details by portfolios.
C24 Well diversified in Canada and internationally...
loans and acceptances, October 2019
C25 �and in household and business lending
loans and acceptances, October 2019
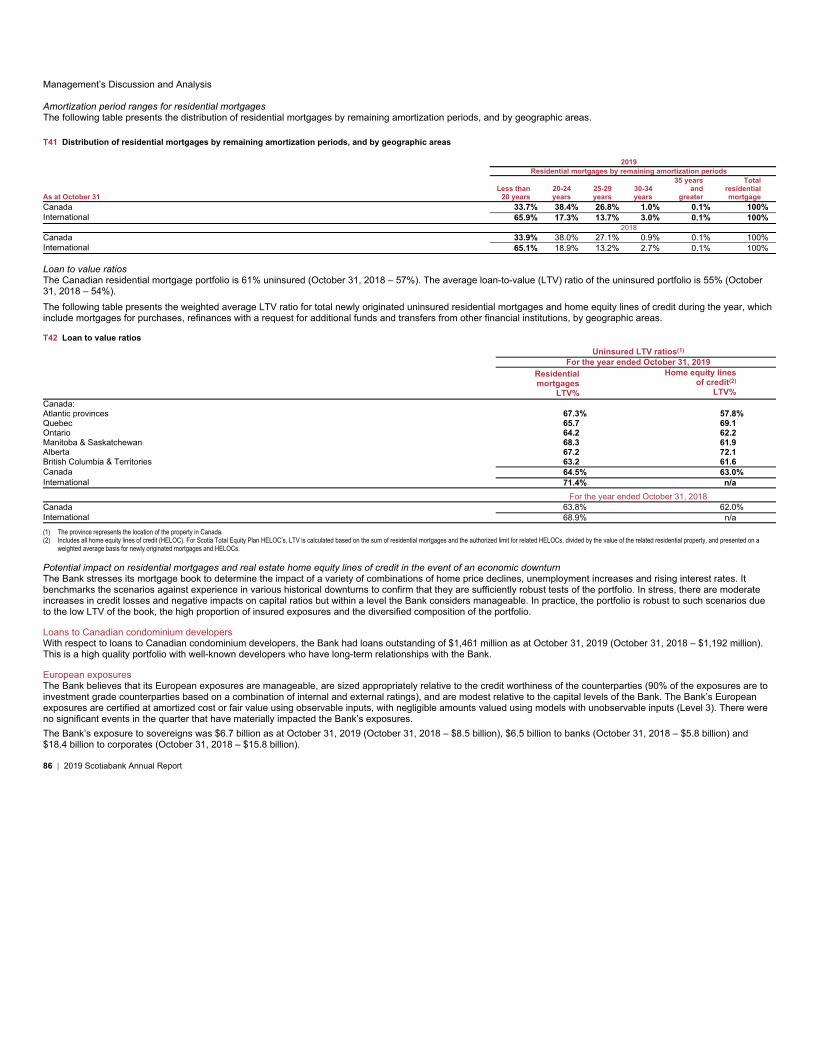
Management’s Discussion and Analysis
Amortization period ranges for residential mortgages
The following table presents the distribution of residential mortgages by remaining amortization periods, and by geographic areas.
T41 Distribution of residential mortgages by remaining amortization periods, and by geographic areas
2019
Residential mortgages by remaining amortization periods
As at October 31
Less than
20 years
20-24
years
25-29
years
30-34
years
35 years
and
greater
Total
residential
mortgage
Canada 33.7% 38.4% 26.8% 1.0% 0.1% 100%
International 65.9% 17.3% 13.7% 3.0% 0.1% 100%
2018
Canada 33.9% 38.0% 27.1% 0.9% 0.1% 100%
International 65.1% 18.9% 13.2% 2.7% 0.1% 100%
Loan to value ratios
The Canadian residential mortgage portfolio is 61% uninsured (October 31, 2018 – 57%). The average loan-to-value (LTV) ratio of the uninsured portfolio is 55% (October
31, 2018 – 54%).
The following table presents the weighted average LTV ratio for total newly originated uninsured residential mortgages and home equity lines of credit during the year, which
include mortgages for purchases, refinances with a request for additional funds and transfers from other financial institutions, by geographic areas.
T42 Loan to value ratios
Uninsured LTV ratios(1)
For the year ended October 31, 2019
Residential
mortgages
LTV%
Home equity lines
of credit(2)
LTV%
Canada:
Atlantic provinces 67.3% 57.8%
Quebec 65.7 69.1
Ontario 64.2 62.2
Manitoba & Saskatchewan 68.3 61.9
Alberta 67.2 72.1
British Columbia & Territories 63.2 61.6
Canada 64.5% 63.0%
International 71.4% n/a
For the year ended October 31, 2018
Canada 63.8% 62.0%
International 68.9% n/a
(1) The province represents the location of the property in Canada.
(2) Includes all home equity lines of credit (HELOC). For Scotia Total Equity Plan HELOC’s, LTV is calculated based on the sum of residential mortgages and the authorized limit for related HELOCs, divided by the value of the related residential property, and presented on a
weighted average basis for newly originated mortgages and HELOCs.
Potential impact on residential mortgages and real estate home equity lines of credit in the event of an economic downturn
The Bank stresses its mortgage book to determine the impact of a variety of combinations of home price declines, unemployment increases and rising interest rates. It
benchmarks the scenarios against experience in various historical downturns to confirm that they are sufficiently robust tests of the portfolio. In stress, there are moderate
increases in credit losses and negative impacts on capital ratios but within a level the Bank considers manageable. In practice, the portfolio is robust to such scenarios due
to the low LTV of the book, the high proportion of insured exposures and the diversified composition of the portfolio.
Loans to Canadian condominium developers
With respect to loans to Canadian condominium developers, the Bank had loans outstanding of $1,461 million as at October 31, 2019 (October 31, 2018 – $1,192 million).
This is a high quality portfolio with well-known developers who have long-term relationships with the Bank.
European exposures
The Bank believes that its European exposures are manageable, are sized appropriately relative to the credit worthiness of the counterparties (90% of the exposures are to
investment grade counterparties based on a combination of internal and external ratings), and are modest relative to the capital levels of the Bank. The Bank’s European
exposures are certified at amortized cost or fair value using observable inputs, with negligible amounts valued using models with unobservable inputs (Level 3). There were
no significant events in the quarter that have materially impacted the Bank’s exposures.
The Bank’s exposure to sovereigns was $6.7 billion as at October 31, 2019 (October 31, 2018 – $8.5 billion), $6.5 billion to banks (October 31, 2018 – $5.8 billion) and
$18.4 billion to corporates (October 31, 2018 – $15.8 billion).
86 | 2019 Scotiabank Annual Report

Management’s Discussion and Analysis | Risk Management
In addition to exposures detailed in the table below, the Bank had indirect exposures consisting of securities exposures to non-European entities whose parent company is
domiciled in Europe of $0.5 billion as at October 31, 2019 (October 31, 2018 – $0.7 billion).
The Bank’s current European exposure is distributed as follows:
T43 Bank’s exposure distribution by country
As at October 31 2019 2018
($ millions)
Loans and
loan
equivalents(1)
Deposits
with
financial
institutions Securities(2)
SFT and
derivatives(3)
Funded
Total
Undrawn
Commitments(4) Total Total
Greece $ 54 $ – $ – $ – $ 54 $ – $ 54 $ 146
Ireland 762 510 72 200 1,544 1,216 2,760 2,612
Italy 9 – (16) 4 (3) 170 167 148
Portugal – – – 17 17 – 17 2
Spain 1,083 2 75 148 1,308 256 1,564 1,701
Total GIIPS $ 1,908 $ 512 $ 131 $ 369 $ 2,920 $ 1,642 $ 4,562 $ 4,609
U.K. $ 10,568 $ 2,320 $ 1,675 $ 2,503 $ 17,066 $ 6,764 $ 23,830 $ 20,003
Germany 953 374 987 63 2,377 825 3,202 4,285
France 1,327 61 83 35 1,506 1,687 3,193 4,199
Netherlands 858 89 865 144 1,956 1,345 3,301 2,525
Switzerland 839 20 45 177 1,081 829 1,910 1,492
Other 1,773 423 1,959 579 4,734 2,462 7,196 7,988
Total Non-GIIPS $ 16,318 $ 3,287 $ 5,614 $ 3,501 $ 28,720 $ 13,912 $ 42,632 $ 40,492
Total Europe $ 18,226 $ 3,799 $ 5,745 $ 3,870 $ 31,640 $ 15,554 $ 47,194 $ 45,101
As at October 31, 2018 $ 15,684 $ 6,196 $ 6,364 $ 1,839 $ 30,083 $ 15,018 $ 45,101
(1) Individual allowances for credit losses are $3. Letters of credit and guarantees are included as funded exposure as they have been issued. Included in loans and loans equivalent are letters of credit and guarantees which total $4,008 as at October 31, 2019 (October 31, 2018
– $3,867).
(2) Exposures for securities are calculated taking into account derivative positions where the security is the underlying reference asset and short trading positions, with net short positions in brackets.
(3) SFT comprise of securities purchased under resale agreements, obligations related to securities sold under repurchase agreements and securities lending and borrowing transactions. Gross and net funded exposures represent all net positive positions after taking into account
collateral. Collateral held against derivatives was $1,349 and collateral held against SFT was $27,508.
(4) Undrawn commitments represent an estimate of the contractual amount that may be drawn upon by the obligor and include commitments to issue letters of credit on behalf of other banks in a syndicated bank lending arrangement.
2019 Scotiabank Annual Report | 87
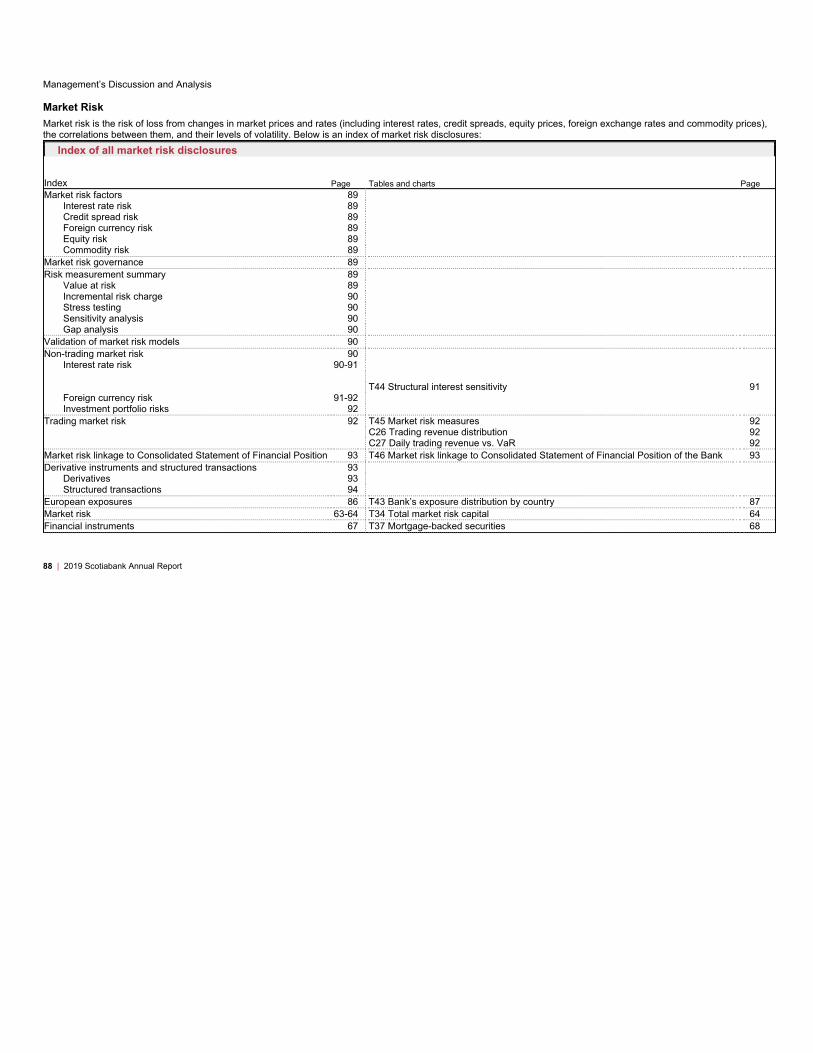
Management’s Discussion and Analysis
Market Risk
Market risk is the risk of loss from changes in market prices and rates (including interest rates, credit spreads, equity prices, foreign exchange rates and commodity prices),
the correlations between them, and their levels of volatility. Below is an index of market risk disclosures:
Index of all market risk disclosures
Index Page Tables and charts Page
Market risk factors 89
Interest rate risk 89
Credit spread risk 89
Foreign currency risk 89
Equity risk 89
Commodity risk 89
Market risk governance 89
Risk measurement summary 89
Value at risk 89
Incremental risk charge 90
Stress testing 90
Sensitivity analysis 90
Gap analysis 90
Validation of market risk models 90
Non-trading market risk 90
Interest rate risk 90-91
T44 Structural interest sensitivity 91
Foreign currency risk 91-92
Investment portfolio risks 92
Trading market risk 92 T45 Market risk measures 92
C26 Trading revenue distribution 92
C27 Daily trading revenue vs. VaR 92
Market risk linkage to Consolidated Statement of Financial Position 93 T46 Market risk linkage to Consolidated Statement of Financial Position of the Bank 93
Derivative instruments and structured transactions 93
Derivatives 93
Structured transactions 94
European exposures 86 T43 Bank’s exposure distribution by country 87
Market risk 63-64 T34 Total market risk capital 64
Financial instruments 67 T37 Mortgage-backed securities 68
88 | 2019 Scotiabank Annual Report

Management’s Discussion and Analysis | Risk Management
Market risk factors
Interest rate risk
The risk of loss due to changes in the level and/or the volatility of interest rates. This risk affects instruments such as, but not limited to, debt securities, loans, mortgages,
deposits and derivatives.
Interest rate risks are managed through sensitivity, gap, stress testing, annual income and VaR limits and mitigated through portfolio diversification and hedges using interest
rate derivatives and debt securities.
Credit spread risk
The risk of loss due to changes in the market price and volatility of credit, or the creditworthiness of issuers. This risk is mainly concentrated in loan and debt securities
portfolios. Risk is managed through sensitivity, jump-to-default, stress testing and VaR limits and mitigated through hedges using credit derivatives.
Foreign currency risk
The risk of loss resulting from changes in currency exchange rates and exchange rate volatility. Foreign currency denominated debt and other securities as well as future
cash flows in foreign currencies are exposed to this type of risk. Risk is managed through maximum net trading position, sensitivity, stress testing and VaR limits and
mitigated through hedges using foreign exchange positions or derivatives.
Equity risk
The risk of loss due to changes in prices, volatility or any other equity related risk factor of individual equity or equity linked securities. This risk affects instruments such as,
but not limited to, equities, exchange traded funds, mutual funds, derivatives and other equity linked products. Risk is managed through sensitivity, stress testing and VaR
limits and mitigated through hedges using physical equity and derivatives instruments.
Commodity risk
The risk of loss due to changes in prices or volatility of precious metal, base metal, energy and agriculture products. Both physical commodity and derivatives positions are
exposed to this risk. Risk is managed through aggregate and net trading position, sensitivity, stress testing and VaR limits and mitigated through hedges using physical
commodity and derivative positions.
The following maps risk factors to trading and non-trading activities:
Non-trading Funding Investments Trading
Interest rate risk
Foreign currency risk
Interest rate risk
Credit spread risk
Foreign currency risk
Equity risk
Interest rate risk
Credit spread risk
Foreign currency risk
Equity risk
Commodity risk
Market risk governance
Overview
The Board of Directors reviews and approves market risk policies and limits annually. The Bank’s Asset-Liability Committee (ALCO) and Market Risk Management and
Policy Committee (MRMPC) oversee the application of the framework set by the Board, and monitor the Bank’s market risk exposures and the activities that give rise to
these exposures. The MRMPC establishes specific operating policies and sets limits at the product, portfolio, business unit and business line levels, and for the Bank in total.
Limits are reviewed at least annually.
Global Risk Management provides independent oversight of all significant market risks, supporting the MRMPC and ALCO with analysis, risk measurement, monitoring,
reporting, proposals for standards and support for new product development. To ensure compliance with policies and limits, market risk exposures are independently
monitored on a continuing basis, either by Global Risk Management, the back offices, or Finance. They provide senior management, business units, the ALCO, and the
MRMPC with a series of daily, weekly and monthly reports of market risk exposures by business line and risk type.
The Bank uses a variety of metrics and models to measure and control market risk exposures. These measurements are selected based on an assessment of the nature of
risks in a particular activity. The principal measurement techniques are Value at Risk (VaR), Incremental Risk Charge, stress testing, sensitivity analysis and gap analysis.
The use and attributes of each of these techniques are noted in the Risk Measurement Summary.
Risk measurement summary
Value at risk (VaR)
VaR is a statistical method of measuring potential loss due to market risk based upon a common confidence interval and time horizon. The Bank calculates VaR daily using
a 99% confidence level, and a one-day holding period for its trading portfolios. This means that once in every 100 days, the trading positions are expected to lose more than
the VaR estimate. VaR has two components: general market risk and debt specific risk. The Bank calculates general market risk VaR using historical simulation based on
300 days of market data. Obligor specific risk on debt instruments and credit derivatives not captured in general market risk VaR is calculated through the debt specific risk
VaR, which uses historical resampling. In addition, the Bank calculates a Stressed VaR measure which follows the same basic methodology as VaR but is calibrated to a
one year stressed period. The stressed period is determined based on analysis of the trading book’s risk profile against historical market data. Stressed VaR complements
VaR in that it evaluates the impact of market volatility that is outside the VaR’s historical set.
All material risk factors are captured in VaR. Where historical data is not available, proxies are used to establish the relevant volatility for VaR and Stressed VaR until
sufficient data is available. Changes in VaR between reporting periods are generally due to changes in positions, volatilities and/or correlations between asset classes. VaR
is also used to evaluate risks arising in certain funding and investment portfolios. Backtesting is also an important and necessary part of the VaR process. The Bank
backtests the actual trading profit and loss against the VaR result to validate the quality and accuracy of the Bank’s VaR model. The Board reviews VaR results quarterly.
2019 Scotiabank Annual Report | 89

Management’s Discussion and Analysis
Incremental Risk Charge (IRC)
Basel market risk capital requirements includes IRC which captures the following:
Default risk: This is the potential for direct losses due to an obligor’s (equity/bond issuer or counterparty) default.
Credit migration risk: This is the potential for direct losses due to a credit rating downgrade or upgrade.
A Monte Carlo model is used to perform default and migration simulations for the obligors underlying credit derivative and bond portfolios. IRC is calculated at the 99.9th
percentile with a one year liquidity horizon. The Board reviews IRC results quarterly.
Stress testing
A limitation of VaR and Stressed VaR is that they only reflect the recent history of market volatility and a specific one year stressed period, respectively. To complement
these measures, stress testing examines the impact that abnormally large changes in market factors and periods of prolonged inactivity might have on trading portfolios.
Stress testing scenarios are designed to include large shifts in risk factors as well as historical and theoretical multi risk market events. Historical scenarios capture severe
movements over periods that are significantly longer than the one-day holding period captured in VaR, such as the 2008 Credit Crisis or the 1998 Russian Financial Crisis.
Similar to Stressed VaR, stress testing provides management with information on potential losses due to tail events. In addition, the results from the stress testing program
are used to verify that the Bank’s market risk capital is sufficient to absorb these potential losses.
The Bank subjects its trading portfolios to a series of daily, weekly and monthly stress tests. The Bank also evaluates risk in its investment portfolios monthly, using stress
tests based on risk factor sensitivities and specific market events. The stress testing program is an essential component of the Bank’s comprehensive risk management
framework which complements the VaR methodology and other risk measures and controls employed by the Bank.
Sensitivity analysis
In trading portfolios, sensitivity analysis is used to measure the effect of changes in risk factors, including prices and volatility, on financial products and portfolios. These
measures apply across product types and geographies and are used for limit monitoring and management reporting.
In non-trading portfolios, sensitivity analysis assesses the effect of changes in interest rates on current earnings and on the economic value of shareholders’ equity. It is
applied globally to each of the major currencies within the Bank’s operations. The Bank’s sensitivity analysis for limit and disclosure purposes is measured through positive
and negative parallel shifts in the underlying interest rate curves. These calculations are based on a constant balance sheet and make no assumptions for management
actions that may mitigate the risks. The Bank also performs sensitivity analysis using various non-parallel interest rate curve shifts, for example: curve steepeners, curve
flatteners and curve twists.
Gap analysis
Gap analysis is used to assess the interest rate sensitivity of re-pricing mismatches in the Bank’s non-trading operations. Under gap analysis, interest rate sensitive assets,
liabilities and off-balance sheet instruments are assigned to defined time periods based on expected re-pricing dates. Products with a contractual maturity are assigned an
interest rate gap term based on the shorter of the contractual maturity date and the next re-pricing date. Products with no contractual maturity are assigned an interest rate
gap based on observed historical consumer behaviour.
Validation of market risk models
Prior to the implementation of new market risk models, rigorous validation and testing is conducted. Validation is conducted when the model is initially developed and when
any significant changes are made to the model. The models are also subject to ongoing validation, the frequency of which is determined by model risk ratings. Models may
also be triggered for earlier revalidation when there have been significant structural changes in the market or changes to the composition of the portfolio. Model validation
includes backtesting, and additional analysis such as:
• Theoretical review or tests to demonstrate whether assumptions made within the internal model are appropriate; and
• Impact tests including stress testing that would occur under historical and hypothetical market conditions.
The validation process is governed by the Bank’s Model Risk Management Policy.
Non-trading market risk
Funding and investment activities
Market risk arising from the Bank’s funding and investment activities is identified, managed and controlled through the Bank’s asset-liability management processes. The
Asset-Liability Committee meets monthly to review risks and opportunities, and evaluate performance including the effectiveness of hedging strategies.
Interest rate risk
Interest rate risk arising from the Bank’s lending, funding and investment activities is managed in accordance with Board-approved policies and global limits, which are
designed to control the risk to net interest income and economic value of shareholders’ equity. The annual income limit measures the effect of a specified change in interest
rates on the Bank’s annual net interest income over the next twelve months, while the economic value limit measures the impact of a specified change in interest rates on
the present value of the Bank’s net assets. These limits are set according to the documented risk appetite of the Bank. Board-level limit utilization is reported to both the
Asset-Liability Committee and the Board on a regular basis. Any limit exceptions are reported according to the Limit Monitoring and Compliance Policy of the Bank.
Net interest income and the economic value of equity result from the differences between yields earned on the Bank’s non-trading assets and interest rate paid on its
liabilities. The difference in yields partly reflects mismatch between the maturity and re-pricing characteristics of the assets and liabilities. This mismatch is inherent in the
non-trading operations of the Bank and exposes it to adverse changes in the level of interest rates. The Asset-Liability Committee provides strategic direction for the
management of structural interest rate risk within the risk appetite framework authorized by the Board of Directors. The asset/liability management strategy is executed by
Group Treasury with the objective of protecting and enhancing net interest income within established risk tolerances.
90 | 2019 Scotiabank Annual Report

Management’s Discussion and Analysis | Risk Management
Simulation modeling, sensitivity analysis and VaR are used to assess exposures and for limit monitoring and planning purposes. The Bank’s interest rate risk exposure
calculations are generally based on the earlier of contractual re-pricing or maturity of on-balance sheet and off-balance sheet assets and liabilities, although certain assets
and liabilities such as credit cards and deposits without a fixed maturity are assigned a maturity profile based on the longevity of the exposure. Expected prepayments from
loans and cashable investment products are also incorporated into the exposure calculations.
T44 shows the after-tax impact of an immediate and sustained 100 basis point shock over a one year period on annual income and economic value of shareholders’ equity.
The interest rate sensitivities tabulated are based on a static balance sheet. There are no assumptions made for management actions that may mitigate risk. Based on the
Bank’s interest rate positions at year-end 2019, an immediate and sustained 100 basis point increase in interest rates across all currencies and maturities would decrease
after-tax net interest income by approximately $273 million over the next 12 months, assuming no further management actions. During fiscal 2019, this measure ranged
between $66 million and $275 million.
This same increase in interest rates would result in an after-tax decrease in the present value of the Bank’s net assets of approximately $1,448 million. During fiscal 2019,
this measure ranged between $363 million and $1,657 million. The directional sensitivity of these two key metrics is largely determined by the difference in time horizons
(annual income captures the impact over the next twelve months only, whereas economic value considers the potential impact of interest rate changes on the present value
of all future cash flows). The annual income and economic value results are compared to the authorized Board limits. Both interest rate sensitivities remained within the
Bank’s approved consolidated limits in the reporting period.
T44 Structural interest sensitivity
2019 2018
As at October 31 ($ millions)
Economic
Value of
Shareholders’
Equity
Annual
Income
Economic
Value of
Shareholders’
Equity
Annual
Income
After-tax impact of
100bp increase in rates
Non-trading risk $ (1,448) $ (273) $ (870) $ (105)
100bp decrease in rates
Non-trading risk $ 1,173 $ 267 $ 797 $ 101
Foreign currency risk
Foreign currency risk in the Bank’s unhedged funding and investment activities arises primarily from the Bank’s net investments in foreign operations as well as foreign
currency earnings in its domestic and remitting foreign branch operations.
The Bank’s foreign currency exposure to its net investments in foreign operations is controlled by a Board-approved limit. This limit considers factors such as potential
volatility to shareholders’ equity as well as the potential impact on capital ratios from foreign exchange fluctuations. On a quarterly basis, the Asset-Liability Committee
reviews the Bank’s foreign currency net investment exposures and determines the appropriate hedging strategies. These may include funding the investments in the same
currency or using other financial instruments, including derivatives.
Foreign currency translation gains and losses from net investments in foreign operations, net of related hedging activities and tax effects, are recorded in accumulated other
comprehensive income within shareholders’ equity. However, the Bank’s regulatory capital ratios are not materially affected by these foreign exchange fluctuations because
the risk-weighted assets of the foreign operations tend to move in a similar direction.
The Bank is also subject to foreign currency translation risk on the earnings of its domestic and remitting foreign branch operations. The Bank forecasts foreign currency
revenues and expenses, which are primarily denominated in U.S. dollars, over a number of future fiscal quarters. The Asset-Liability Committee also assesses economic
data trends and forecasts to determine if some or all of the estimated future foreign currency revenues and expenses should be hedged. Hedging instruments normally
include foreign currency spot and forward contracts, as well as foreign currency options and swaps. Certain of these economic hedges may not qualify for hedge accounting
resulting in a potential for a mismatch in the timing of the recognition of economic hedge gains/losses and the underlying foreign earnings translation gains/losses. In
accordance with IFRS, foreign currency translation gains and losses relating to monetary and non-monetary items are recorded directly in earnings.
2019 Scotiabank Annual Report | 91
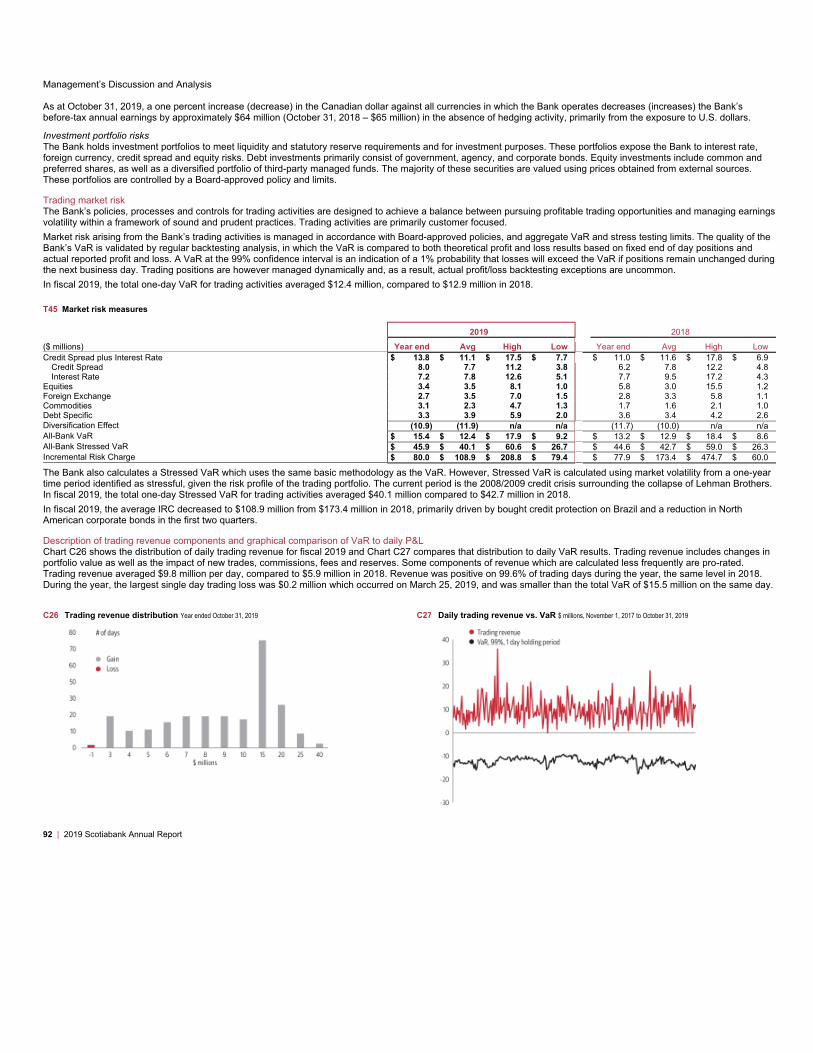
Management’s Discussion and Analysis
As at October 31, 2019, a one percent increase (decrease) in the Canadian dollar against all currencies in which the Bank operates decreases (increases) the Bank’s
before-tax annual earnings by approximately $64 million (October 31, 2018 – $65 million) in the absence of hedging activity, primarily from the exposure to U.S. dollars.
Investment portfolio risks
The Bank holds investment portfolios to meet liquidity and statutory reserve requirements and for investment purposes. These portfolios expose the Bank to interest rate,
foreign currency, credit spread and equity risks. Debt investments primarily consist of government, agency, and corporate bonds. Equity investments include common and
preferred shares, as well as a diversified portfolio of third-party managed funds. The majority of these securities are valued using prices obtained from external sources.
These portfolios are controlled by a Board-approved policy and limits.
Trading market risk
The Bank’s policies, processes and controls for trading activities are designed to achieve a balance between pursuing profitable trading opportunities and managing earnings
volatility within a framework of sound and prudent practices. Trading activities are primarily customer focused.
Market risk arising from the Bank’s trading activities is managed in accordance with Board-approved policies, and aggregate VaR and stress testing limits. The quality of the
Bank’s VaR is validated by regular backtesting analysis, in which the VaR is compared to both theoretical profit and loss results based on fixed end of day positions and
actual reported profit and loss. A VaR at the 99% confidence interval is an indication of a 1% probability that losses will exceed the VaR if positions remain unchanged during
the next business day. Trading positions are however managed dynamically and, as a result, actual profit/loss backtesting exceptions are uncommon.
In fiscal 2019, the total one-day VaR for trading activities averaged $12.4 million, compared to $12.9 million in 2018.
T45 Market risk measures
2019 2018
($ millions) Year end Avg High Low Year end Avg High Low
Credit Spread plus Interest Rate $ 13.8 $ 11.1 $ 17.5 $ 7.7 $ 11.0 $ 11.6 $ 17.8 $ 6.9
Credit Spread 8.0 7.7 11.2 3.8 6.2 7.8 12.2 4.8
Interest Rate 7.2 7.8 12.6 5.1 7.7 9.5 17.2 4.3
Equities 3.4 3.5 8.1 1.0 5.8 3.0 15.5 1.2
Foreign Exchange 2.7 3.5 7.0 1.5 2.8 3.3 5.8 1.1
Commodities 3.1 2.3 4.7 1.3 1.7 1.6 2.1 1.0
Debt Specific 3.3 3.9 5.9 2.0 3.6 3.4 4.2 2.6
Diversification Effect (10.9) (11.9) n/a n/a (11.7) (10.0) n/a n/a
All-Bank VaR $ 15.4 $ 12.4 $ 17.9 $ 9.2 $ 13.2 $ 12.9 $ 18.4 $ 8.6
All-Bank Stressed VaR $ 45.9 $ 40.1 $ 60.6 $ 26.7 $ 44.6 $ 42.7 $ 59.0 $ 26.3
Incremental Risk Charge $ 80.0 $ 108.9 $ 208.8 $ 79.4 $ 77.9 $ 173.4 $ 474.7 $ 60.0
The Bank also calculates a Stressed VaR which uses the same basic methodology as the VaR. However, Stressed VaR is calculated using market volatility from a one-year
time period identified as stressful, given the risk profile of the trading portfolio. The current period is the 2008/2009 credit crisis surrounding the collapse of Lehman Brothers.
In fiscal 2019, the total one-day Stressed VaR for trading activities averaged $40.1 million compared to $42.7 million in 2018.
In fiscal 2019, the average IRC decreased to $108.9 million from $173.4 million in 2018, primarily driven by bought credit protection on Brazil and a reduction in North
American corporate bonds in the first two quarters.
Description of trading revenue components and graphical comparison of VaR to daily P&L
Chart C26 shows the distribution of daily trading revenue for fiscal 2019 and Chart C27 compares that distribution to daily VaR results. Trading revenue includes changes in
portfolio value as well as the impact of new trades, commissions, fees and reserves. Some components of revenue which are calculated less frequently are pro-rated.
Trading revenue averaged $9.8 million per day, compared to $5.9 million in 2018. Revenue was positive on 99.6% of trading days during the year, the same level in 2018.
During the year, the largest single day trading loss was $0.2 million which occurred on March 25, 2019, and was smaller than the total VaR of $15.5 million on the same day.
92 | 2019 Scotiabank Annual Report
C26 Trading revenue distribution Year ended October 31, 2019 C27 Daily trading revenue vs. VaR $ millions, November 1, 2017 to October 31, 2019
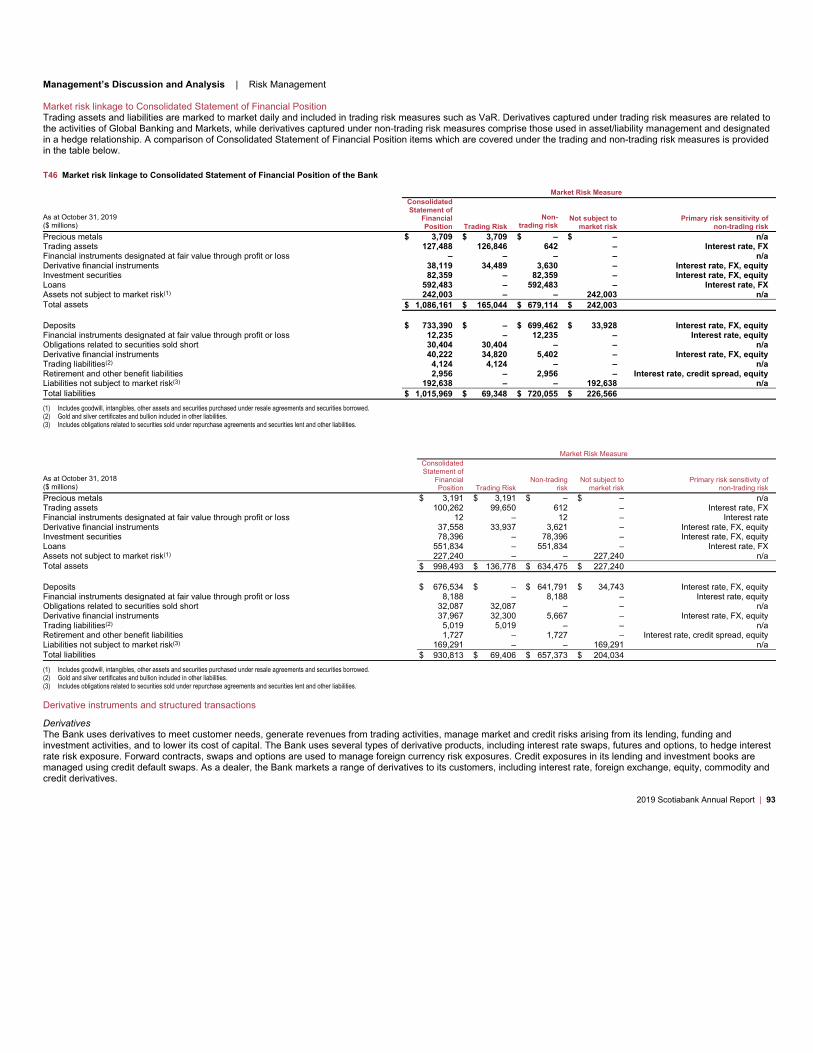
Management’s Discussion and Analysis | Risk Management
Market risk linkage to Consolidated Statement of Financial Position
Trading assets and liabilities are marked to market daily and included in trading risk measures such as VaR. Derivatives captured under trading risk measures are related to
the activities of Global Banking and Markets, while derivatives captured under non-trading risk measures comprise those used in asset/liability management and designated
in a hedge relationship. A comparison of Consolidated Statement of Financial Position items which are covered under the trading and non-trading risk measures is provided
in the table below.
T46 Market risk linkage to Consolidated Statement of Financial Position of the Bank
Market Risk Measure
As at October 31, 2019
($ millions)
Consolidated
Statement of
Financial
Position Trading Risk
Non-
trading risk
Not subject to
market risk
Primary risk sensitivity of
non-trading risk
Precious metals $ 3,709 $ 3,709 $ – $ – n/a
Trading assets 127,488 126,846 642 – Interest rate, FX
Financial instruments designated at fair value through profit or loss – – – – n/a
Derivative financial instruments 38,119 34,489 3,630 – Interest rate, FX, equity
Investment securities 82,359 – 82,359 – Interest rate, FX, equity
Loans 592,483 – 592,483 – Interest rate, FX
Assets not subject to market risk(1) 242,003 – – 242,003 n/a
Total assets $ 1,086,161 $ 165,044 $ 679,114 $ 242,003
Deposits $ 733,390 $ – $ 699,462 $ 33,928 Interest rate, FX, equity
Financial instruments designated at fair value through profit or loss 12,235 – 12,235 – Interest rate, equity
Obligations related to securities sold short 30,404 30,404 – – n/a
Derivative financial instruments 40,222 34,820 5,402 – Interest rate, FX, equity
Trading liabilities(2) 4,124 4,124 – – n/a
Retirement and other benefit liabilities 2,956 – 2,956 – Interest rate, credit spread, equity
Liabilities not subject to market risk(3) 192,638 – – 192,638 n/a
Total liabilities $ 1,015,969 $ 69,348 $ 720,055 $ 226,566
(1) Includes goodwill, intangibles, other assets and securities purchased under resale agreements and securities borrowed.
(2) Gold and silver certificates and bullion included in other liabilities.
(3) Includes obligations related to securities sold under repurchase agreements and securities lent and other liabilities.
Market Risk Measure
As at October 31, 2018
($ millions)
Consolidated
Statement of
Financial
Position Trading Risk
Non-trading
risk
Not subject to
market risk
Primary risk sensitivity of
non-trading risk
Precious metals $ 3,191 $ 3,191 $ – $ – n/a
Trading assets 100,262 99,650 612 – Interest rate, FX
Financial instruments designated at fair value through profit or loss 12 – 12 – Interest rate
Derivative financial instruments 37,558 33,937 3,621 – Interest rate, FX, equity
Investment securities 78,396 – 78,396 – Interest rate, FX, equity
Loans 551,834 – 551,834 – Interest rate, FX
Assets not subject to market risk(1) 227,240 – – 227,240 n/a
Total assets $ 998,493 $ 136,778 $ 634,475 $ 227,240
Deposits $ 676,534 $ – $ 641,791 $ 34,743 Interest rate, FX, equity
Financial instruments designated at fair value through profit or loss 8,188 – 8,188 – Interest rate, equity
Obligations related to securities sold short 32,087 32,087 – – n/a
Derivative financial instruments 37,967 32,300 5,667 – Interest rate, FX, equity
Trading liabilities(2) 5,019 5,019 – – n/a
Retirement and other benefit liabilities 1,727 – 1,727 – Interest rate, credit spread, equity
Liabilities not subject to market risk(3) 169,291 – – 169,291 n/a
Total liabilities $ 930,813 $ 69,406 $ 657,373 $ 204,034
(1) Includes goodwill, intangibles, other assets and securities purchased under resale agreements and securities borrowed.
(2) Gold and silver certificates and bullion included in other liabilities.
(3) Includes obligations related to securities sold under repurchase agreements and securities lent and other liabilities.
Derivative instruments and structured transactions
Derivatives
The Bank uses derivatives to meet customer needs, generate revenues from trading activities, manage market and credit risks arising from its lending, funding and
investment activities, and to lower its cost of capital. The Bank uses several types of derivative products, including interest rate swaps, futures and options, to hedge interest
rate risk exposure. Forward contracts, swaps and options are used to manage foreign currency risk exposures. Credit exposures in its lending and investment books are
managed using credit default swaps. As a dealer, the Bank markets a range of derivatives to its customers, including interest rate, foreign exchange, equity, commodity and
credit derivatives.
2019 Scotiabank Annual Report | 93

Management’s Discussion and Analysis
Market risk arising from derivatives transactions is subject to the control, reporting and analytical techniques noted above. Additional controls and analytical techniques are
applied to address certain market-related risks that are unique to derivative products.
Structured transactions
Structured transactions are specialized transactions that may involve combinations of cash, other financial assets and derivatives designed to meet the specific risk
management or financial requirements of customers. These transactions are carefully evaluated by the Bank to identify and address the credit, market, legal, tax,
reputational and other risks, and are subject to a cross-functional review and sign-off by Trading Management, Global Risk Management, Taxation, Finance and Legal
departments. Large structured transactions are also subject to review by senior risk management committees and evaluated in accordance with the procedures described
below in Reputational Risk.
The market risk in these transactions is usually minimal, and returns are earned by providing structuring expertise and by taking credit risk. Once executed, structured
transactions are subject to the same ongoing credit reviews and market risk analysis as other types of derivatives transactions. This review and analysis includes careful
monitoring of the quality of the reference assets, and ongoing valuation of the derivatives and reference assets.
Liquidity Risk
Liquidity risk is the risk that the Bank is unable to meet its financial obligations in a timely manner at reasonable prices. Financial obligations include liabilities
to depositors, payments due under derivative contracts, settlement of securities borrowing and repurchase transactions, and lending and investment
commitments.
Effective liquidity risk management is essential to maintain the confidence of depositors and counterparties, manage the Bank’s cost of funds and to support core business
activities, even under adverse circumstances.
Liquidity risk is managed within the framework of policies and limits that are approved by the Board of Directors. The Board receives reports on risk exposures and
performance against approved limits. The Asset-Liability Committee (ALCO) provides senior management oversight of liquidity risk.
The key elements of the liquidity risk framework are:
• Measurement and modeling – the Bank’s liquidity model measures and forecasts cash inflows and outflows, including off-balance sheet cash flows on a daily basis. Risk
is managed by a set of key limits over the maximum net cash outflow by currency over specified short-term horizons (cash gaps), a minimum level of core liquidity, and
liquidity stress tests.
• Reporting – Global Risk Management provides independent oversight of all significant liquidity risks, supporting the ALCO with analysis, risk measurement, stress testing,
monitoring and reporting.
• Stress testing – the Bank performs liquidity stress testing on a regular basis, to evaluate the effect of both industry-wide and Bank-specific disruptions on the Bank’s
liquidity position. Liquidity stress testing has many purposes including:
– Helping the Bank understand the potential behavior of various on-balance sheet and off-balance sheet positions in circumstances of stress; and
– Based on this knowledge, facilitating the development of risk mitigation and contingency plans.
The Bank’s liquidity stress tests consider the effect of changes in funding assumptions, depositor behavior and the market value of liquid assets. The Bank performs
industry standard stress tests, the results of which are reviewed at senior levels of the organization and are considered in making liquidity management decisions.
• Contingency planning – the Bank maintains a liquidity contingency plan that specifies an approach for analyzing and responding to actual and potential liquidity events.
The plan outlines an appropriate governance structure for the management and monitoring of liquidity events, processes for effective internal and external
communication, and identifies potential counter measures to be considered at various stages of an event. A contingency plan is maintained both at the parent-level as
well as for major subsidiaries.
• Funding diversification – the Bank actively manages the diversification of its deposit liabilities by source, type of depositor, instrument, term and geography.
• Core liquidity – the Bank maintains a pool of highly liquid, unencumbered assets that can be readily sold or pledged to secure borrowings under stressed market
conditions or due to Bank-specific events. The Bank also maintains liquid assets to support its intra-day settlement obligations in payment, depository and clearing
systems.
Liquid assets
Liquid assets are a key component of liquidity management and the Bank holds these types of assets in sufficient quantity to meet potential needs for liquidity management.
Liquid assets can be used to generate cash either through sale, repurchase transactions or other transactions where these assets can be used as collateral to generate
cash, or by allowing the asset to mature. Liquid assets include deposits at central banks, deposits with financial institutions, call and other short-term loans, marketable
securities, precious metals and securities received as collateral from securities financing and derivative transactions. Liquid assets do not include borrowing capacity from
central bank facilities.
Marketable securities are securities traded in active markets, which can be converted to cash within a timeframe that is in accordance with the Bank’s liquidity management
framework. Assets are assessed considering a number of factors, including the expected time it would take to convert them to cash.
Marketable securities included in liquid assets are comprised of securities specifically held as a liquidity buffer or for asset liability management purposes; trading securities,
which are primarily held by Global Banking and Markets; and collateral received for securities financing and derivative transactions.
The Bank maintains large holdings of unencumbered liquid assets to support its operations. These assets generally can be sold or pledged to meet the Bank’s obligations.
As at October 31, 2019, unencumbered liquid assets were $211 billion (October 31, 2018 – $202 billion). Securities including NHA mortgage-backed securities, comprised
80% of liquid assets (October 31, 2018 – 71%). Other unencumbered liquid assets, comprising cash
94 | 2019 Scotiabank Annual Report
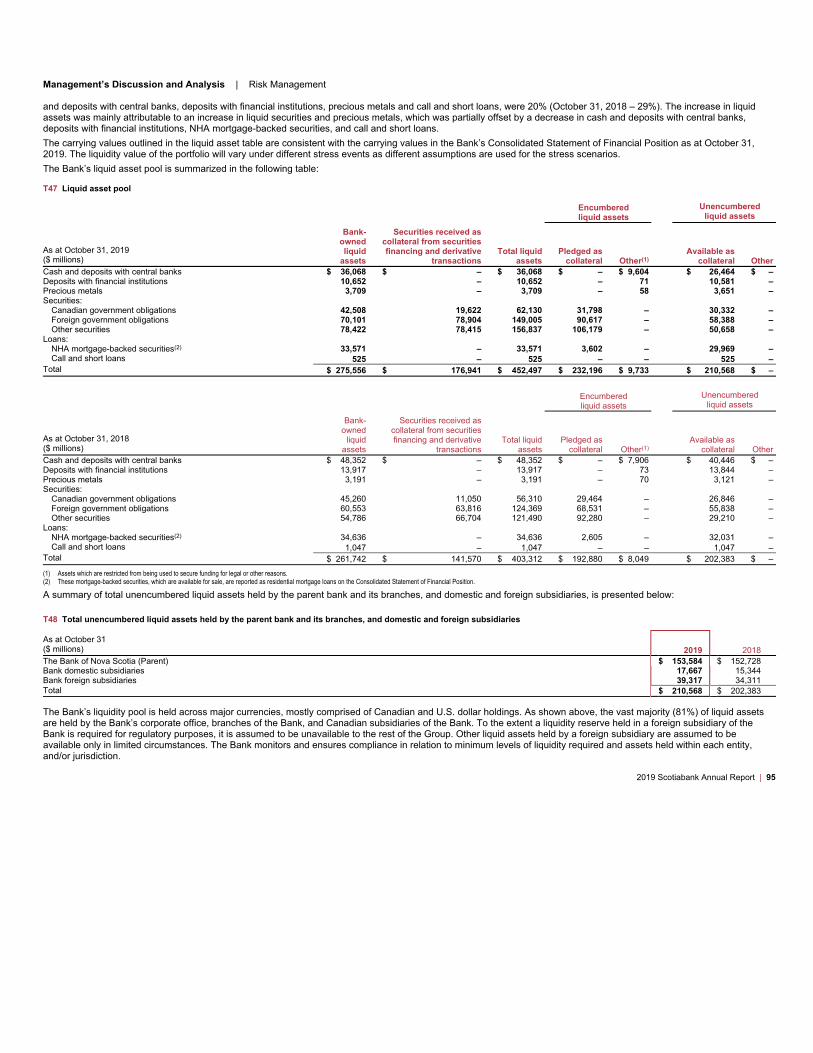
Management’s Discussion and Analysis | Risk Management
and deposits with central banks, deposits with financial institutions, precious metals and call and short loans, were 20% (October 31, 2018 – 29%). The increase in liquid
assets was mainly attributable to an increase in liquid securities and precious metals, which was partially offset by a decrease in cash and deposits with central banks,
deposits with financial institutions, NHA mortgage-backed securities, and call and short loans.
The carrying values outlined in the liquid asset table are consistent with the carrying values in the Bank’s Consolidated Statement of Financial Position as at October 31,
2019. The liquidity value of the portfolio will vary under different stress events as different assumptions are used for the stress scenarios.
The Bank’s liquid asset pool is summarized in the following table:
T47 Liquid asset pool
Encumbered
liquid assets
Unencumbered
liquid assets
As at October 31, 2019
($ millions)
Bank-
owned
liquid
assets
Securities received as
collateral from securities
financing and derivative
transactions
Total liquid
assets
Pledged as
collateral Other(1)
Available as
collateral Other
Cash and deposits with central banks $ 36,068 $ – $ 36,068 $ – $ 9,604 $ 26,464 $ –
Deposits with financial institutions 10,652 – 10,652 – 71 10,581 –
Precious metals 3,709 – 3,709 – 58 3,651 –
Securities:
Canadian government obligations 42,508 19,622 62,130 31,798 – 30,332 –
Foreign government obligations 70,101 78,904 149,005 90,617 – 58,388 –
Other securities 78,422 78,415 156,837 106,179 – 50,658 –
Loans:
NHA mortgage-backed securities(2) 33,571 – 33,571 3,602 – 29,969 –
Call and short loans 525 – 525 – – 525 –
Total $ 275,556 $ 176,941 $ 452,497 $ 232,196 $ 9,733 $ 210,568 $ –
Encumbered
liquid assets
Unencumbered
liquid assets
As at October 31, 2018
($ millions)
Bank-
owned
liquid
assets
Securities received as
collateral from securities
financing and derivative
transactions
Total liquid
assets
Pledged as
collateral Other(1)
Available as
collateral Other
Cash and deposits with central banks $ 48,352 $ – $ 48,352 $ – $ 7,906 $ 40,446 $ –
Deposits with financial institutions 13,917 – 13,917 – 73 13,844 –
Precious metals 3,191 – 3,191 – 70 3,121 –
Securities:
Canadian government obligations 45,260 11,050 56,310 29,464 – 26,846 –
Foreign government obligations 60,553 63,816 124,369 68,531 – 55,838 –
Other securities 54,786 66,704 121,490 92,280 – 29,210 –
Loans:
NHA mortgage-backed securities(2) 34,636 – 34,636 2,605 – 32,031 –
Call and short loans 1,047 – 1,047 – – 1,047 –
Total $ 261,742 $ 141,570 $ 403,312 $ 192,880 $ 8,049 $ 202,383 $ –
(1) Assets which are restricted from being used to secure funding for legal or other reasons.
(2) These mortgage-backed securities, which are available for sale, are reported as residential mortgage loans on the Consolidated Statement of Financial Position.
A summary of total unencumbered liquid assets held by the parent bank and its branches, and domestic and foreign subsidiaries, is presented below:
T48 Total unencumbered liquid assets held by the parent bank and its branches, and domestic and foreign subsidiaries
As at October 31
($ millions) 2019 2018
The Bank of Nova Scotia (Parent) $ 153,584 $ 152,728
Bank domestic subsidiaries 17,667 15,344
Bank foreign subsidiaries 39,317 34,311
Total $ 210,568 $ 202,383
The Bank’s liquidity pool is held across major currencies, mostly comprised of Canadian and U.S. dollar holdings. As shown above, the vast majority (81%) of liquid assets
are held by the Bank’s corporate office, branches of the Bank, and Canadian subsidiaries of the Bank. To the extent a liquidity reserve held in a foreign subsidiary of the
Bank is required for regulatory purposes, it is assumed to be unavailable to the rest of the Group. Other liquid assets held by a foreign subsidiary are assumed to be
available only in limited circumstances. The Bank monitors and ensures compliance in relation to minimum levels of liquidity required and assets held within each entity,
and/or jurisdiction.
2019 Scotiabank Annual Report | 95
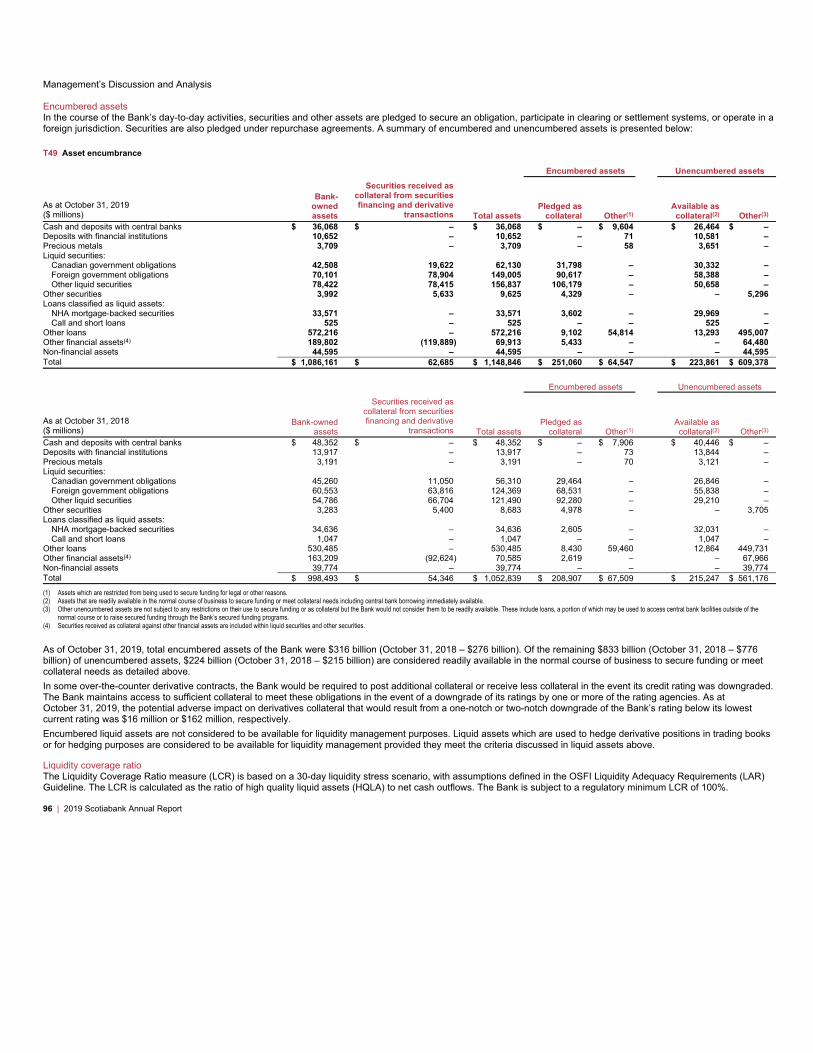
Management’s Discussion and Analysis
Encumbered assets
In the course of the Bank’s day-to-day activities, securities and other assets are pledged to secure an obligation, participate in clearing or settlement systems, or operate in a
foreign jurisdiction. Securities are also pledged under repurchase agreements. A summary of encumbered and unencumbered assets is presented below:
T49 Asset encumbrance
Encumbered assets Unencumbered assets
As at October 31, 2019
($ millions)
Bank-
owned
assets
Securities received as
collateral from securities
financing and derivative
transactions Total assets
Pledged as
collateral Other(1)
Available as
collateral(2) Other(3)
Cash and deposits with central banks $ 36,068 $ – $ 36,068 $ – $ 9,604 $ 26,464 $ –
Deposits with financial institutions 10,652 – 10,652 – 71 10,581 –
Precious metals 3,709 – 3,709 – 58 3,651 –
Liquid securities:
Canadian government obligations 42,508 19,622 62,130 31,798 – 30,332 –
Foreign government obligations 70,101 78,904 149,005 90,617 – 58,388 –
Other liquid securities 78,422 78,415 156,837 106,179 – 50,658 –
Other securities 3,992 5,633 9,625 4,329 – – 5,296
Loans classified as liquid assets:
NHA mortgage-backed securities 33,571 – 33,571 3,602 – 29,969 –
Call and short loans 525 – 525 – – 525 –
Other loans 572,216 – 572,216 9,102 54,814 13,293 495,007
Other financial assets(4) 189,802 (119,889) 69,913 5,433 – – 64,480
Non-financial assets 44,595 – 44,595 – – – 44,595
Total $ 1,086,161 $ 62,685 $ 1,148,846 $ 251,060 $ 64,547 $ 223,861 $ 609,378
Encumbered assets Unencumbered assets
As at October 31, 2018
($ millions)
Bank-owned
assets
Securities received as
collateral from securities
financing and derivative
transactions Total assets
Pledged as
collateral Other(1)
Available as
collateral(2) Other(3)
Cash and deposits with central banks $ 48,352 $ – $ 48,352 $ – $ 7,906 $ 40,446 $ –
Deposits with financial institutions 13,917 – 13,917 – 73 13,844 –
Precious metals 3,191 – 3,191 – 70 3,121 –
Liquid securities:
Canadian government obligations 45,260 11,050 56,310 29,464 – 26,846 –
Foreign government obligations 60,553 63,816 124,369 68,531 – 55,838 –
Other liquid securities 54,786 66,704 121,490 92,280 – 29,210 –
Other securities 3,283 5,400 8,683 4,978 – – 3,705
Loans classified as liquid assets:
NHA mortgage-backed securities 34,636 – 34,636 2,605 – 32,031 –
Call and short loans 1,047 – 1,047 – – 1,047 –
Other loans 530,485 – 530,485 8,430 59,460 12,864 449,731
Other financial assets(4) 163,209 (92,624) 70,585 2,619 – – 67,966
Non-financial assets 39,774 – 39,774 – – – 39,774
Total $ 998,493 $ 54,346 $ 1,052,839 $ 208,907 $ 67,509 $ 215,247 $ 561,176
(1) Assets which are restricted from being used to secure funding for legal or other reasons.
(2) Assets that are readily available in the normal course of business to secure funding or meet collateral needs including central bank borrowing immediately available.
(3) Other unencumbered assets are not subject to any restrictions on their use to secure funding or as collateral but the Bank would not consider them to be readily available. These include loans, a portion of which may be used to access central bank facilities outside of the
normal course or to raise secured funding through the Bank’s secured funding programs.
(4) Securities received as collateral against other financial assets are included within liquid securities and other securities.
As of October 31, 2019, total encumbered assets of the Bank were $316 billion (October 31, 2018 – $276 billion). Of the remaining $833 billion (October 31, 2018 – $776
billion) of unencumbered assets, $224 billion (October 31, 2018 – $215 billion) are considered readily available in the normal course of business to secure funding or meet
collateral needs as detailed above.
In some over-the-counter derivative contracts, the Bank would be required to post additional collateral or receive less collateral in the event its credit rating was downgraded.
The Bank maintains access to sufficient collateral to meet these obligations in the event of a downgrade of its ratings by one or more of the rating agencies. As at
October 31, 2019, the potential adverse impact on derivatives collateral that would result from a one-notch or two-notch downgrade of the Bank’s rating below its lowest
current rating was $16 million or $162 million, respectively.
Encumbered liquid assets are not considered to be available for liquidity management purposes. Liquid assets which are used to hedge derivative positions in trading books
or for hedging purposes are considered to be available for liquidity management provided they meet the criteria discussed in liquid assets above.
Liquidity coverage ratio
The Liquidity Coverage Ratio measure (LCR) is based on a 30-day liquidity stress scenario, with assumptions defined in the OSFI Liquidity Adequacy Requirements (LAR)
Guideline. The LCR is calculated as the ratio of high quality liquid assets (HQLA) to net cash outflows. The Bank is subject to a regulatory minimum LCR of 100%.
96 | 2019 Scotiabank Annual Report

Management’s Discussion and Analysis | Risk Management
OSFI’s LAR stipulates that banks must maintain an adequate level of unencumbered HQLA that can be converted into cash to meet liquidity needs over a 30 calendar day
horizon under a pre-defined significantly severe liquidity stress scenario. The LCR-prescribed liquidity stress scenario includes assumptions for asset haircuts, deposit
run-off, wholesale rollover rates, and outflow rates for commitments.
HQLA are grouped into three categories: Level 1, Level 2A and Level 2B, based on guidelines from the LAR. Level 1 HQLA receive no haircuts, and includes cash, deposits
with central banks, central bank reserves available to the Bank in times of stress, and securities with a 0% risk weight. Level 2A and 2B include HQLA of lesser quality and
attracts haircuts ranging from 15%-50%.
The total weighted values for net cash outflows for the next 30 days are derived by applying the assumptions specified in the LAR Guideline to specific items, including
loans, deposits, maturing debt, derivative transactions and commitments to extend credit.
The following table presents the Bank’s average LCR for the quarter ended October 31, 2019 based on the average daily position in the quarter.
T50 Bank’s average LCR
For the quarter ended October 31, 2019 ($ millions)(1)
Total
unweighted
value
(Average)(2)
Total
weighted
value
(Average)(3)
High-quality liquid assets
Total high-quality liquid assets (HQLA) * $ 165,088
Cash outflows
Retail deposits and deposits from small business customers, of which: $ 181,137 13,017
Stable deposits 75,337 2,437
Less stable deposits 105,800 10,580
Unsecured wholesale funding, of which: 209,636 102,755
Operational deposits (all counterparties) and deposits in networks of cooperative banks 67,035 15,865
Non-operational deposits (all counterparties) 119,271 63,560
Unsecured debt 23,330 23,330
Secured wholesale funding * 37,512
Additional requirements, of which: 207,152 41,614
Outflows related to derivative exposures and other collateral requirements 29,740 17,637
Outflows related to loss of funding on debt products 3,544 3,544
Credit and liquidity facilities 173,868 20,433
Other contractual funding obligations 1,278 1,162
Other contingent funding obligations(4) 506,926 8,760
Total cash outflows * $ 204,820
Cash inflows
Secured lending (e.g. reverse repos) $ 142,514 $ 27,352
Inflows from fully performing exposures 25,507 16,797
Other cash inflows 28,546 28,546
Total cash inflows $ 196,567 $ 72,695
Total
adjusted
value(5)
Total HQLA * $ 165,088
Total net cash outflows * $ 132,125
Liquidity coverage ratio (%) * 125%
For the quarter ended October 31, 2018 ($ millions)
Total
adjusted
value(5)
Total HQLA * $ 144,349
Total net cash outflows * $ 116,735
Liquidity coverage ratio (%) * 124%
* Disclosure is not required under regulatory guideline.
(1) Based on the average daily positions of the 63 business days in the quarter.
(2) Unweighted values represent outstanding balances maturing or callable within the next 30 days.
(3) Weighted values represent balances calculated after the application of HQLA haircuts or inflow and outflow rates, as prescribed by the OSFI LAR guidelines.
(4) Total unweighted value includes uncommitted credit and liquidity facilities, guarantees and letters of credit, outstanding debt securities with remaining maturity greater than 30 days, and other contractual cash outflows.
(5) Total adjusted value represents balances calculated after the application of both haircuts and inflow and outflow rates and any applicable caps.
HQLA continues to be substantially comprised of Level 1 assets. The Bank’s average LCR for the quarter ended October 31, 2019 was in line with the quarter ended
October 31, 2018.
The Bank’s significant operating currencies are Canadian and U.S. dollars. The Bank monitors its significant currency exposures in accordance with its liquidity risk
management framework and risk appetite.
2019 Scotiabank Annual Report | 97

Management’s Discussion and Analysis
Funding
The Bank ensures that its funding sources are well diversified. Funding concentrations are regularly monitored and analyzed by type. The sources of funding are capital,
deposits from retail and commercial clients sourced through the Canadian and international branch network, deposits from financial institutions as well as wholesale debt
issuances.
Capital and personal deposits are key components of the Bank’s core funding and these amounted to $303 billion as at October 31, 2019 (October 31, 2018 – $289 billion).
The increase since October 31, 2018, was primarily due to deposit growth, internal capital generation and subordinated debentures issuance, net of common share
repurchases and redemptions of preferred shares and subordinated debentures. A portion of commercial deposits, particularly those of an operating or relationship nature,
would be considered part of the Bank’s core funding. Furthermore, core funding is augmented by longer term wholesale debt issuances (original maturity over 1 year) of
$164 billion (October 31, 2018 – $157 billion). Longer term wholesale debt issuances include senior notes, mortgage securitizations, asset-backed securities and covered
bonds.
The Bank operates in many different currencies and countries. From a funding perspective, the most significant currencies are Canadian and U.S. dollars. With respect to
the Bank’s operations outside Canada, there are different funding strategies depending on the nature of the activities in each country. For those countries where the Bank
operates a branch banking subsidiary, the strategy is for the subsidiary to be substantially self-funding in its local market. For other subsidiaries or branches outside Canada
where local deposit gathering capability is not sufficient, funding is provided through the wholesale funding activities of the Bank.
From an overall funding perspective the Bank’s objective is to achieve an appropriate balance between the cost and the stability of funding. Diversification of funding sources
is a key element of the funding strategy.
The Bank’s wholesale debt diversification strategy is primarily executed via the Bank’s main wholesale funding centres, located in Toronto, New York, London and
Singapore. The majority of these funds are sourced in Canadian and U.S. dollars. Where required, these funds are swapped to fund assets in different currencies. The
funding strategy deployed by wholesale funding centres and the management of associated risks, such as geographic and currency risk, are managed centrally within the
framework of policies and limits that are approved by the Board of Directors.
In the normal course, the Bank uses a mix of unsecured and secured wholesale funding instruments across a variety of markets. The choice of instruments and markets is
based on a number of factors, including relative cost and market capacity as well as an objective of maintaining a diversified mix of sources of funding. Market conditions can
change over time, impacting cost and capacity in particular markets or instruments. Changing market conditions can include periods of stress where the availability of
funding in particular markets or instruments is constrained. In these circumstances the Bank would increase its focus on sources of funding in functioning markets and
secured funding instruments. Should a period of extreme stress exist such that all wholesale funding sources are constrained, the Bank maintains a pool of liquid assets to
mitigate its liquidity risk. This pool includes cash, deposits with central banks and securities.
In Canada, the Bank raises short- and longer-term wholesale debt through the issuance of senior unsecured notes. Additional longer-term wholesale debt may be generated
through the Bank’s Canadian Debt and Equity Shelf, the securitization of Canadian insured residential mortgages through CMHC securitization programs (such as Canada
Mortgage Bonds), uninsured residential mortgages through the Bank’s Covered Bond Program, unsecured personal lines of credit through the Halifax Receivables Trust
(previously Hollis Receivables Term Trust II) program, retail credit card receivables through the Trillium Credit Card Trust II program and retail indirect auto loan receivables
through the Securitized Term Auto Receivables Trust program. While the Bank includes CMHC securitization programs in its view of wholesale debt issuance, this source of
funding does not entail the run-off risk that can be experienced in funding raised from capital markets.
Outside of Canada, short-term wholesale debt may be raised through the issuance of negotiable certificates of deposit in the United States, Hong Kong, the United Kingdom,
and Australia and the issuance of commercial paper in the United States. The Bank operates longer-term wholesale debt issuance registered programs in the United States,
such as its SEC Registered Debt and Equity Shelf, and non-registered programs, such as the securitization of retail indirect auto loan receivables through the Securitized
Term Auto Receivables Trust program and the securitization of retail credit card receivables through the Trillium Credit Card Trust II program. The Bank’s Covered Bond
Program is listed with the U.K. Listing Authority, and the Bank may issue under the program in Europe, the United States, Australia and Switzerland. The Bank also raises
longer-term funding across a variety of currencies through its Australian Medium Term Note Programme, European Medium Term Note Programme and Singapore Medium
Term Note Programme. The Bank’s European Medium Term Note Programme is listed with the U.K. Listing Authority, Swiss Stock Exchange and the Tokyo Pro-Bond
Market. The Bank’s Singapore Medium Term Note Programme is listed with the Singapore Exchange and the Taiwan Exchange.
The Department of Finance’s bail-in regulations under the Canada Deposit Insurance Corporation (CDIC) Act and the Bank Act, became effective September 23, 2018.
Senior long-term debt issued by the Bank on or after September 23, 2018, that has an original term greater than 400 days and is marketable, subject to certain exceptions, is
subject to the Canadian Bank Recapitalization (Bail-in) regime. Under the Bail-in regime, in circumstances when the Superintendent of Financial Institutions has determined
that a bank may no longer be viable, the Governor in Council may, upon a recommendation of the Minister of Finance that they are of the opinion that it is in the public
interest to do so, grant an order directing the CDIC to convert all or a portion of certain shares and liabilities of that bank into common shares. As at October 31, 2019, issued
and outstanding liabilities of $11 billion were subject to conversion under the bail-in regime.
98 | 2019 Scotiabank Annual Report

Management’s Discussion and Analysis | Risk Management
The table below provides the remaining contractual maturities of funding raised through wholesale funding. In the Consolidated Statement of Financial Position, these
liabilities are primarily included in Business & Government Deposits.
T51 Wholesale funding(1)
As at October 31,
2019 ($millions)
Less than
1 month
1-3
months
3-6
months
6-9
months
9-12
months
Sub-Total
< 1 Year 1-2 years 2-5 years >5 years Total
Deposits from banks(2) $ 3,284 $ 596 $ 566 $ 198 $ 268 $ 4,912 $ – $ – $ – $ 4,912
Bearer deposit notes, commercial paper and short-term
certificate of deposits 6,590 18,923 27,866 24,778 13,497 91,654 2,139 717 62 94,572
Asset-backed commercial paper(3) 1,096 3,069 1,324 – – 5,489 – – – 5,489
Senior notes(4)(5) 1,372 3,842 2,533 5,080 3,520 16,347 14,114 25,609 11,636 67,706
Bail-inable notes(5) – – – 26 – 26 1,314 6,568 2,920 10,828
Asset-backed securities 2 12 1,290 – 791 2,095 2,466 1,176 210 5,947
Covered bonds – 545 1,844 1,882 – 4,271 8,979 10,171 2,379 25,800
Mortgage securitization(6) – 601 771 663 353 2,388 4,376 12,675 4,486 23,925
Subordinated debentures(7) – – – – – – 78 156 9,121 9,355
Total wholesale funding sources $ 12,344 $ 27,588 $ 36,194 $ 32,627 $ 18,429 $ 127,182 $ 33,466 $ 57,072 $ 30,814 $ 248,534
Of Which:
Unsecured funding $ 11,246 $ 23,361 $ 30,965 $ 30,082 $ 17,285 $ 112,939 $ 17,645 $ 33,050 $ 23,739 $ 187,373
Secured funding 1,098 4,227 5,229 2,545 1,144 14,243 15,821 24,022 7,075 61,161
As at October 31,
2018 ($millions)
Less than
1 month
1-3
months
3-6
months
6-9
months
9-12
months
Sub-Total
< 1 Year 1-2 years 2-5 years >5 years Total
Deposits from banks(2) $ 1,720 $ 196 $ 211 $ 212 $ 116 $ 2,455 $ 29 $ 145 $ 32 $ 2,661
Bearer deposit notes, commercial paper and short-term
certificate of deposits 8,807 14,201 21,517 15,961 7,580 68,066 5,487 666 56 74,275
Asset-backed commercial paper(3) 2,088 4,697 165 – – 6,950 – – – 6,950
Senior notes(4)(5) 180 2,714 4,070 6,214 5,168 18,346 15,179 36,765 14,298 84,588
Asset-backed securities 6 15 47 500 – 568 2,714 1,944 304 5,530
Covered bonds – 2,910 1,491 – 1,975 6,376 4,312 16,779 1,772 29,239
Mortgage securitization(6) – 765 316 567 508 2,156 2,388 12,966 4,646 22,156
Subordinated debentures(7) – – – – – – – 237 7,539 7,776
Total wholesale funding sources $ 12,801 $ 25,498 $ 27,817 $ 23,454 $ 15,347 $ 104,917 $ 30,109 $ 69,502 $ 28,647 $ 233,175
Of Which:
Unsecured funding $ 10,707 $ 17,111 $ 25,798 $ 22,387 $ 12,864 $ 88,867 $ 20,695 $ 37,813 $ 21,925 $ 169,300
Secured funding 2,094 8,387 2,019 1,067 2,483 16,050 9,414 31,689 6,722 63,875
(1) Wholesale funding sources exclude repo transactions and bankers acceptances, which are disclosed in the T56 Contractual maturities. Amounts are based on remaining term to maturity.
(2) Only includes commercial bank deposits.
(3) Wholesale funding sources also exclude asset-backed commercial paper issued by certain ABCP conduits that are not consolidated for financial reporting purposes.
(4) Not subject to bail-in.
(5) Includes Structured notes issued to institutional investors.
(6) Represents residential mortgages funded through Canadian Federal Government agency sponsored programs. Funding accessed through such programs does not impact the funding capacity of the Bank in its own name.
(7) Although subordinated debentures are a component of regulatory capital, they are included in this table in accordance with EDTF recommended disclosures.
Wholesale funding generally bears a higher risk of run-off in a stressed environment than other sources of funding. The Bank mitigates this risk through funding
diversification, ongoing engagement with investors and by maintaining a large holding of unencumbered liquid assets. Unencumbered liquid assets of $211 billion as at
October 31, 2019 (October 31, 2018 – $202 billion) were well in excess of wholesale funding sources that mature in the next twelve months.
Contractual maturities and obligations
The table below provides the maturity of assets and liabilities as well as the off-balance sheet commitments as at October 31, 2019, based on the contractual maturity date.
From a liquidity risk perspective the Bank considers factors other than contractual maturity in the assessment of liquid assets or in determining expected future cash flows. In
particular, for securities with a fixed maturity date, the ability and time horizon to raise cash from these securities is more relevant to liquidity management than contractual
maturity. For other assets and deposits the Bank uses assumptions about rollover rates
2019 Scotiabank Annual Report | 99
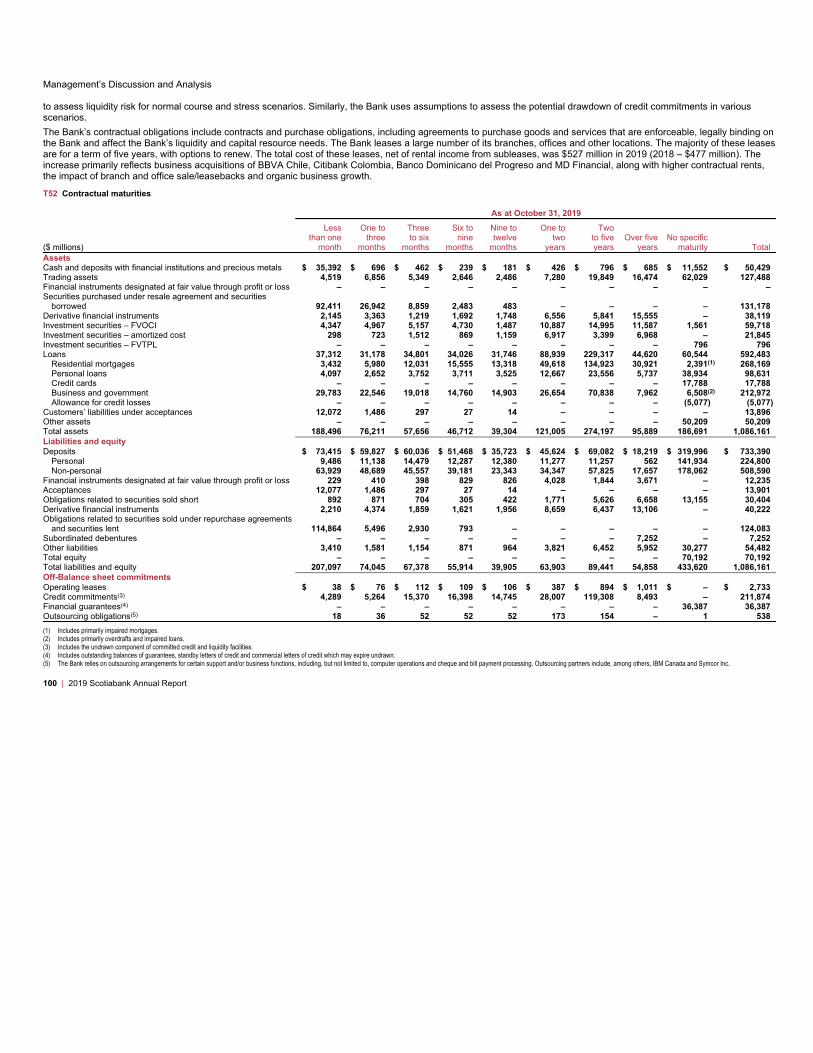
Management’s Discussion and Analysis
to assess liquidity risk for normal course and stress scenarios. Similarly, the Bank uses assumptions to assess the potential drawdown of credit commitments in various
scenarios.
The Bank’s contractual obligations include contracts and purchase obligations, including agreements to purchase goods and services that are enforceable, legally binding on
the Bank and affect the Bank’s liquidity and capital resource needs. The Bank leases a large number of its branches, offices and other locations. The majority of these leases
are for a term of five years, with options to renew. The total cost of these leases, net of rental income from subleases, was $527 million in 2019 (2018 – $477 million). The
increase primarily reflects business acquisitions of BBVA Chile, Citibank Colombia, Banco Dominicano del Progreso and MD Financial, along with higher contractual rents,
the impact of branch and office sale/leasebacks and organic business growth.
T52 Contractual maturities
As at October 31, 2019
($ millions)
Less
than one
month
One to
three
months
Three
to six
months
Six to
nine
months
Nine to
twelve
months
One to
two
years
Two
to five
years
Over five
years
No specific
maturity Total
Assets
Cash and deposits with financial institutions and precious metals $ 35,392 $ 696 $ 462 $ 239 $ 181 $ 426 $ 796 $ 685 $ 11,552 $ 50,429
Trading assets 4,519 6,856 5,349 2,646 2,486 7,280 19,849 16,474 62,029 127,488
Financial instruments designated at fair value through profit or loss – – – – – – – – – –
Securities purchased under resale agreement and securities
borrowed 92,411 26,942 8,859 2,483 483 – – – – 131,178
Derivative financial instruments 2,145 3,363 1,219 1,692 1,748 6,556 5,841 15,555 – 38,119
Investment securities – FVOCI 4,347 4,967 5,157 4,730 1,487 10,887 14,995 11,587 1,561 59,718
Investment securities – amortized cost 298 723 1,512 869 1,159 6,917 3,399 6,968 – 21,845
Investment securities – FVTPL – – – – – – – – 796 796
Loans 37,312 31,178 34,801 34,026 31,746 88,939 229,317 44,620 60,544 592,483
Residential mortgages 3,432 5,980 12,031 15,555 13,318 49,618 134,923 30,921 2,391(1) 268,169
Personal loans 4,097 2,652 3,752 3,711 3,525 12,667 23,556 5,737 38,934 98,631
Credit cards – – – – – – – – 17,788 17,788
Business and government 29,783 22,546 19,018 14,760 14,903 26,654 70,838 7,962 6,508(2) 212,972
Allowance for credit losses – – – – – – – – (5,077) (5,077)
Customers’ liabilities under acceptances 12,072 1,486 297 27 14 – – – – 13,896
Other assets – – – – – – – – 50,209 50,209
Total assets 188,496 76,211 57,656 46,712 39,304 121,005 274,197 95,889 186,691 1,086,161
Liabilities and equity
Deposits $ 73,415 $ 59,827 $ 60,036 $ 51,468 $ 35,723 $ 45,624 $ 69,082 $ 18,219 $ 319,996 $ 733,390
Personal 9,486 11,138 14,479 12,287 12,380 11,277 11,257 562 141,934 224,800
Non-personal 63,929 48,689 45,557 39,181 23,343 34,347 57,825 17,657 178,062 508,590
Financial instruments designated at fair value through profit or loss 229 410 398 829 826 4,028 1,844 3,671 – 12,235
Acceptances 12,077 1,486 297 27 14 – – – – 13,901
Obligations related to securities sold short 892 871 704 305 422 1,771 5,626 6,658 13,155 30,404
Derivative financial instruments 2,210 4,374 1,859 1,621 1,956 8,659 6,437 13,106 – 40,222
Obligations related to securities sold under repurchase agreements
and securities lent 114,864 5,496 2,930 793 – – – – – 124,083
Subordinated debentures – – – – – – – 7,252 – 7,252
Other liabilities 3,410 1,581 1,154 871 964 3,821 6,452 5,952 30,277 54,482
Total equity – – – – – – – – 70,192 70,192
Total liabilities and equity 207,097 74,045 67,378 55,914 39,905 63,903 89,441 54,858 433,620 1,086,161
Off-Balance sheet commitments
Operating leases $ 38 $ 76 $ 112 $ 109 $ 106 $ 387 $ 894 $ 1,011 $ – $ 2,733
Credit commitments(3) 4,289 5,264 15,370 16,398 14,745 28,007 119,308 8,493 – 211,874
Financial guarantees(4) – – – – – – – – 36,387 36,387
Outsourcing obligations(5) 18 36 52 52 52 173 154 – 1 538
(1) Includes primarily impaired mortgages.
(2) Includes primarily overdrafts and impaired loans.
(3) Includes the undrawn component of committed credit and liquidity facilities.
(4) Includes outstanding balances of guarantees, standby letters of credit and commercial letters of credit which may expire undrawn.
(5) The Bank relies on outsourcing arrangements for certain support and/or business functions, including, but not limited to, computer operations and cheque and bill payment processing. Outsourcing partners include, among others, IBM Canada and Symcor Inc.
100 | 2019 Scotiabank Annual Report

Management’s Discussion and Analysis | Risk Management
As at October 31, 2018
($ millions)
Less
than one
month
One to
three
months
Three
to six
months
Six to
nine
months
Nine to
twelve
months
One to
two
years
Two to five
years
Over
five
years
No
specific
maturity Total
Assets
Cash and deposits with financial institutions and precious metals $ 54,254 $ 920 $ 284 $ 101 $ 117 $ 326 $ 726 $ 223 $ 8,509 $ 65,460
Trading assets 4,792 5,311 3,326 5,463 2,309 7,934 12,765 18,130 40,232 100,262
Financial instruments designated at fair value through profit or loss – – – – 12 – – – – 12
Securities purchased under resale agreement and securities
borrowed 74,522 21,223 5,743 673 337 549 539 432 – 104,018
Derivative financial instruments 3,178 5,517 2,024 2,327 1,446 6,447 6,071 10,548 – 37,558
Investment securities – FVOCI 3,925 6,436 5,852 3,284 3,243 13,139 15,206 4,758 1,305 57,148
Investment securities – amortized cost 452 1,429 1,160 1,501 1,500 4,302 9,465 934 – 20,743
Investment securities – FVTPL – – – – – – – – 505 505
Loans 40,463 27,581 28,920 27,246 28,064 93,191 214,017 34,985 57,367 551,834
Residential mortgages 11,496 4,697 8,774 12,014 12,781 53,629 126,934 21,366 1,666 (1) 253,357
Personal loans 4,204 2,701 3,528 3,431 3,558 11,712 23,338 5,468 38,079 96,019
Credit cards – – – – – – – – 16,485 16,485
Business and government 24,763 20,183 16,618 11,801 11,725 27,850 63,745 8,151 6,202 (2) 191,038
Allowance for credit losses – – – – – – – – (5,065) (5,065)
Customers’ liabilities under acceptances 13,829 2,082 338 50 30 – – – – 16,329
Other assets – – – – – – – – 44,624 44,624
Total assets 195,415 70,499 47,647 40,645 37,058 125,888 258,789 70,010 152,542 998,493
Liabilities and equity
Deposits $ 56,965 $ 53,331 $ 48,661 $ 39,716 $ 32,753 $ 45,262 $ 78,295 $ 18,313 $ 303,238 $ 676,534
Personal 8,797 9,415 12,536 9,563 10,241 13,472 11,953 261 138,307 214,545
Non-personal 48,168 43,916 36,125 30,153 22,512 31,790 66,342 18,052 164,931 461,989
Financial instruments designated at fair value through profit or loss 22 77 360 410 523 3,090 1,646 1,969 91 8,188
Acceptances 13,838 2,082 338 50 30 – – – – 16,338
Obligations related to securities sold short 910 972 870 305 1,013 3,896 8,685 7,388 8,048 32,087
Derivative financial instruments 2,520 4,288 1,613 2,716 1,583 6,773 7,699 10,775 – 37,967
Obligations related to securities sold under repurchase agreements
and securities lent 96,157 3,466 1,634 – – – – – – 101,257
Subordinated debentures – – – – – – – 5,698 – 5,698
Other liabilities 2,720 592 1,302 422 757 1,784 6,167 5,978 33,022 52,744
Total equity – – – – – – – – 67,680 67,680
Total liabilities and equity 173,132 64,808 54,778 43,619 36,659 60,805 102,492 50,121 412,079 998,493
Off-Balance sheet commitments
Operating leases $ 36 $ 72 $ 106 $ 104 $ 102 $ 378 $ 818 $ 880 $ – $ 2,496
Credit commitments(3) 4,232 5,588 13,438 15,182 22,619 23,906 105,988 6,486 – 197,439
Financial guarantees(4) – – – – – – – – 36,423 36,423
Outsourcing obligations(5) 18 36 52 52 52 207 311 – 1 729
(1) Includes primarily impaired mortgages.
(2) Includes primarily overdrafts and impaired loans.
(3) Includes the undrawn component of committed credit and liquidity facilities.
(4) Includes outstanding balances of guarantees, standby letters of credit and commercial letters of credit which may expire undrawn.
(5) The Bank relies on outsourcing arrangements for certain support and/or business functions, including, but not limited to, computer operations and cheque and bill payment processing. Outsourcing partners include, among others, IBM Canada and Symcor Inc.
2019 Scotiabank Annual Report | 101

Management’s Discussion and Analysis
Other Risks
Operational Risk
Operational risk is the risk of loss, resulting from people, inadequate or failed processes and systems, or from external events. Operational risk includes legal
risk but excludes strategic risk and reputational risk. Operational risk in some form exists in each of the Bank’s businesses and support activities and can result
in financial loss, regulatory sanctions and damage to the Bank’s reputation. Operational risk is inherent in all the Bank’s activities, including the practices and
controls used to manage other risks. Failure to manage operational risk can result in direct or indirect financial loss, but also in regulatory sanctions and
reputational impact.
Governance and organization
The Bank’s Operational Risk Management Framework sets out an integrated approach to identify, assess, control, mitigate and report operational risks across the Bank. The
following are key components of the Bank’s Operational Risk Management Framework:
• The Bank’s Risk and Control Self-Assessment program, which includes formal reviews of significant units, operations and processes to identify and assess operational
risks. This program provides a basis for management to ensure that key risks have been identified and that controls are functioning effectively. Business line
management attests to the accuracy of each assessment and develops action plans to mitigate residual risk exposure, as appropriate.
• The Bank’s scenario analysis program provides a forward looking view of key risks and provides management with insights into how plausible but highly unlikely
operational risk events might occur. Scenario analysis will also assist in the selection of severity distributions in the Bank’s Advanced Measurement Approach (AMA)
capital model (discussed below).
• The Bank’s Key Risk Indicator (KRI) program provides information on the level of exposure to a given operational risk at a particular point in time and can help to monitor
potential shifts in risk conditions or new emerging risks and/or measure residual risk exposure and effectiveness of controls.
• The Business Environment and Internal Control Factors (BEICF) program incorporates the impact of key business environment and internal control factors into the
regulatory capital allocated to divisions by utilizing a BEICF scorecard. The scorecard is used to adjust capital calculations produced using the Bank’s AMA capital model
and due to its forward-looking nature, it also assists with identifying new trends and emerging risks.
• The Bank’s New Initiatives Risk Management Policy which describes the general principles applicable to the review, approval and implementation of new products and
services within Scotiabank and is intended to provide overarching guidance.
• The Bank’s centralized operational loss event database, which captures key information on operational losses and near-misses.
• The Bank’s monitoring of industry events, which identifies significant losses incurred at other financial institutions and provides a reference for reviewing and assessing
the Bank’s own risk exposure.
• The Bank’s training programs, including the mandatory Anti-Money Laundering, Operational Risk and Information Security courses and examinations which work to
ensure employees are aware of relevant risks and are equipped to safeguard the Bank’s customers and assets.
• Operational risk reporting is provided to the Bank’s senior executive management and the Board of Directors, and includes information relating to key events, results,
trends and themes across the operational risk tools. The combination of these information sources provides both a backward and forward-looking view of operational risk
at the Bank.
Operational risk capital
There are two methods for the calculation of operational risk regulatory capital available to the Bank under the Basel framework – The Standardized Approach and the
Advanced Measurement Approach (AMA). In 2016, OSFI approved the Bank’s application to use the Advanced Measurement Approach (AMA) for operational risk, subject
to a capital floor. In 2017, the Bank formally began utilizing AMA to report regulatory capital. In keeping with updated OSFI requirements in Chapter 8 of the Capital
Adequacy Requirements Guideline, all banks currently approved to use the Advanced Measurement Approach (AMA) will be required to use a revised Basel III Standardized
Approach when the revised requirements are implemented in Canada.
Information Technology (IT) & Cybersecurity Risk
IT Risk refers to the effect of uncertainty on the Bank’s objectives associated with the use, ownership, operation, involvement, influence and adoption of IT
within an enterprise. Cybersecurity risk is a subset of unique IT Risks faced as a result of using interconnected systems and digital technologies.
IT and Cybersecurity risks continue to evolve across the financial industry. The increasing use of online delivery channels and mobile devices to perform financial
transactions leave the bank vulnerable to operational disruptions due to multiple factors such as: human errors, frauds, infrastructure failures, issues with our business
partners, among others. Those events may increase costs or may negatively impact the Bank’s operational environment, our customers and other third parties.
The Board of Directors approves the IT and Cyber Risk Management, Cybersecurity and Information Security policies, which along with the respective frameworks are
focused on safeguarding the Bank’s and its customers’ information, ensuring the Bank’s IT environment is reliable, secure, resilient and robust in supporting our business
objectives.
Significant efforts are directed on risk management activities including the Cybersecurity program in line with the industry standards and best practices. The Bank continues
to expand its capabilities to defend against potential threats and minimize the impact to the business, including the regular testing activities to reinforce the Bank’s resilience
to events caused by factors out of the Bank’s control. The dependency on third parties and the potential risks they bring to the continuity of our business activities is a key
area of focus. The Bank has a governance framework to mitigate those risks. The Bank will expect more regulatory oversight of IT and Cybersecurity risk management
practices going forward.
102 | 2019 Scotiabank Annual Report
Management’s Discussion and Analysis | Risk Management
The Bank continuously monitors the metrics and Key Risk Indicators, which are regularly reported to the Board of Directors, its Risk Committee and other internal
committees who oversee the performance of the associated risk thresholds. Material issues are escalated to the executive management committees to ensure appropriate
remediation. Information security awareness campaigns are conducted periodically, including annual mandatory training sessions on information security and operational risk
to all our employees, reinforcing our risk culture.
Compliance Risk
Compliance Risk is the risk that a business activity may not be conducted in conformity with applicable Regulations, internal policies and procedures and
ethical standards expected by regulators, customers, investors, employees and other stakeholders. “Regulations” means all Governmental Acts, laws, rules,
regulations, regulatory guidelines and industry or self-regulatory organizational codes of conduct, rules and by-laws.
The Bank conducts business in many jurisdictions around the world and provides a wide variety of financial products and services through its various lines of business and
operations. It is subject to, and must comply with, many and changing Regulations by governmental agencies, supervisory authorities and self-regulatory organizations in all
the jurisdictions in which the Bank operates. The regulatory bar is constantly rising with Regulations being more vigorously enforced and new Regulations being enacted.
The bar of public expectations is also constantly rising. Regulators and customers expect the Bank and its employees will operate its business in compliance with applicable
laws and will refrain from unethical practices.
Compliance risk is managed on an enterprise-wide basis throughout the Bank via the operation of the Scotiabank Compliance Program (“the Program”) which includes the
appointment of a Chief Compliance Officer (CCO) for the Bank and is responsible for overseeing Compliance Risk Management within the Bank. The CCO is responsible for
assessing the adequacy of, adherence to and effectiveness of the Program, as well as for the development and application of written compliance policies and procedures
that are kept up to date and approved by senior management, assessing and documenting compliance risks, developing and maintaining a written compliance training
program, which in each case is performed either directly or indirectly by other departments within the Bank in coordination with Global Compliance. This program and these
ancillary activities are subject to Internal Audit’s periodic review to assess the effectiveness of the Program.
The Board-approved Compliance Risk Summary Framework describes the general policies and principles applicable to compliance risk management within Scotiabank and
encompasses the Bank’s Regulatory Compliance Management Framework as contemplated by OSFI Guideline E-13. The Compliance Risk Summary Framework is an
integral part of the enterprise-wide framework, policies and procedures that collectively articulate the Bank’s governance and control structure. Other more specifically
focused compliance risk management policies and procedures may be developed within the Compliance Risk Summary Framework where necessary or appropriate.
Money Laundering, Terrorist Financing and Sanctions Risk
Money Laundering, Terrorist Financing (ML/TF) and Sanctions risk is the susceptibility of Scotiabank to be used by individuals or organizations to launder the
proceeds of crime, finance terrorism, or violate economic sanctions. It also includes the risk that Scotiabank does not conform to applicable Anti-Money
Laundering (“AML”) / Anti-Terrorist Financing (“ATF”) or Sanctions legislation, or does not apply adequate controls reasonably designed to detect and deter
ML/TF and sanctions violations or to file any required regulatory reports.
Money laundering, terrorist financing, and sanctions risks are managed throughout the Bank via the operation of the Bank’s AML Risk program (“the Program”). The Board
appointed Chief Anti-Money Laundering Officer is responsible for the Program, development and application of written policies, procedures, and standards that are kept up to
date and approved by senior management, assessing and documenting money laundering, terrorist-financing or sanctions risks, developing and maintaining an ongoing and
tailored training program, and regular review of the effectiveness of the Program. The review of effectiveness is supplemented by an independent assessment conducted by
Internal Audit. The Chief Anti-Money Laundering Officer has unfettered access to, and direct communication with, the Bank’s Senior Management and the Board.
The Bank’s business units conduct an annual self-assessment of their ML/TF and sanctions risks, as well as self-assessments of their control measures designed to manage
such risks. The process is overseen by the Bank’s AML Risk unit and the results shared with the Bank’s Senior Management and its Board. All active employees are
provided with mandatory AML/ATF and Sanctions training on an annual basis.
The Bank performs Customer Due Diligence sufficiently to form a reasonable belief that it knows the true-identity of its customers, including in the case of an entity, its
material ultimate beneficial owners. The Bank will not maintain anonymous accounts, nor will it maintain accounts for shell banks. Consistent with a risk-based approach, the
Bank assesses the risks of its customers and, where appropriate, conducts enhanced due diligence on those who are considered higher risk. The Bank also conducts
ongoing risk tailored monitoring of its customers to detect and report suspicious transactions and activity, and conducts customer and transaction screening against terrorist,
sanctions, and other designated watch-lists.
Reputational Risk
Reputational risk is the risk that negative publicity regarding Scotiabank’s conduct, business practices or associations, whether true or not, will adversely affect
its revenues, operations or customer base, or require costly litigation or other defensive measures.
Negative publicity about an institution’s business practices may involve any aspect of its operations, but usually relates to questions of business ethics and integrity, or
quality of products and services. Such negative publicity has an impact on the Bank’s brand and reputation.
Negative publicity and related reputational risk frequently arise as a by-product of some other kind of risk management control failure such as compliance and operational
risks. In some cases, reputational risk can arise through no direct fault of an institution, but indirectly as a ripple-effect of an association or problems arising within the
industry or external environment.
Reputational risk is managed and controlled throughout the Bank by the Scotiabank Code of Conduct (Code), governance practices and risk management programs,
policies, procedures and training. Many relevant checks and balances are outlined in greater detail under other risk management sections, particularly Operational Risk,
where reference is made to the Bank’s well-established compliance program. All directors, officers and employees have a responsibility to conduct their activities in
accordance with the Code, and in a manner that minimizes reputational risk and safeguards the Bank’s reputation. While all employees, officers and directors are expected
to protect the reputation of Scotiabank by complying with the Code, the activities of the Legal, Global Tax, Corporate Secretary, Global Communications, AML Risk, Global
Compliance and Global Risk Management departments, and the Reputational Risk Committee, are particularly oriented to the management of reputational risk.
2019 Scotiabank Annual Report | 103

Management’s Discussion and Analysis
In providing credit, advice, or products to customers, or entering into associations, the Bank considers whether the transaction, relationship or association might give rise to
reputational risk. The Bank has a Reputational Risk Policy, as well as policy and procedures for managing reputational and legal risk related to structured finance
transactions. Global Risk Management plays a significant role in the identification and management of reputational risk related to credit underwriting. In addition, the
Reputational Risk Committee is available to support Global Risk Management, as well as other risk management committees and business units, with their assessment of
reputational risk associated with transactions, business initiatives, new products and services and sales practice issues.
The Reputational Risk Committee considers a broad array of factors when assessing transactions, so that the Bank meets, and will be seen to meet, high ethical standards.
These factors include the extent, and outcome, of legal and regulatory due diligence pertinent to the transaction; the economic intent of the transaction; the effect of the
transaction on the transparency of a customer’s financial reporting; the need for customer or public disclosure; conflicts of interest; fairness issues; and public perception.
The Reputational Risk Committee also holds regular quarterly meetings to review activities in the quarter, review metrics and discuss any emerging trends or themes.
The Reputational Risk Committee may impose conditions on customer transactions, including customer disclosure requirements to promote transparency in financial
reporting, so that transactions meet Bank standards. In the event the Committee recommends not proceeding with a transaction and the sponsor of the transaction wishes to
proceed, the transaction is referred to the Risk Policy Committee.
Environmental Risk
Environmental risk refers to the possibility that environmental concerns involving Scotiabank or its customers could affect the Bank’s performance. The Bank
considers climate change as a type of Environmental Risk.
To safeguard the Bank and the interests of its stakeholders, Scotiabank has an environmental policy, which is approved by the Bank’s Board of Directors. The policy guides
day-to-day operations, lending practices, supplier agreements, the management of real estate holdings and external reporting practices. It is supplemented by specific
policies and practices relating to individual business lines.
Environmental risks associated with the business operations of each borrower and any real property offered as security are considered in the Bank’s credit evaluation
procedures. This includes an environmental risk assessment where applicable, and commentary on the potential impact of climate change (including physical or transition
risk impacts) on the borrower. Global Risk Management has primary responsibility for establishing the related policies, processes and standards associated with mitigating
environmental risk in the Bank’s lending activities. Decisions are taken in the context of the risk management framework.
In the area of project finance, the Equator Principles have been integrated into the Bank’s internal processes and procedures since 2006. The Equator Principles help
financial institutions determine, assess, manage and report environmental and social risk. The principles apply to project finance loans and advisory assignments where total
capital costs exceed US$10 million, and to certain project-related corporate loans. The Equator Principles provide safeguards for sensitive projects to ensure protection of
natural habitats and the rights of indigenous peoples, as well as safeguards against the use of child and forced labour.
The Bank’s Environmental Policy plays a prominent role in guiding the reduction of the Bank’s environmental footprint. The Real Estate Department adheres to an
Environmental Compliance Policy to ensure responsible management of the Bank’s real estate holdings from an environmental perspective. In addition, a variety of reduction
measures are in place for energy, paper and waste in the Bank’s corporate offices and branch networks. Internal tracking systems are in place with respect to energy use,
greenhouse gas emissions (GHG) and paper consumption. Since 2012, GHG emissions data for the branch network and corporate offices has been externally verified.
To continue operations in an environmentally responsible manner, the Bank monitors policy and legislative requirements through ongoing dialogue with government, industry
and stakeholders in countries where it operates. Scotiabank has been meeting with environmental organizations, industry associations and socially responsible investment
organizations with respect to the role that banks can play to help address issues such as climate change, protection of biodiversity, promotion of sustainable forestry
practices, implementing the recommendations of the Task Force on Climate-related Financial Disclosure, and other environmental issues important to its customers and
communities where it operates. The Bank has an ongoing process of reviewing its practices in these areas.
Scotiabank has a number of environmentally focused products and services, including: an EcoEnergy Financing program designed to support personal and small business
customers who wish to install small-scale renewable energy projects; and an auto loan product for hybrid, electric and clean diesel vehicles. As well, Scotiabank has the
Commodities Derivatives group, which assists corporate clients by providing liquidity and hedge solutions in the carbon market.
Environmental Reporting
Scotiabank is also a signatory to, and participant in the Carbon Disclosure Project, which provides corporate disclosure to the investment community on greenhouse gas
emissions and climate change management. Further information is available in the Bank’s annual Corporate Social Responsibility Report.
Climate Change Risks – Taskforce on Climate Related Financial Disclosures (TCFD)
In 2018, Scotiabank announced its support of the Financial Stability Board (FSB) Task Force on Climate-related Financial Disclosures (TCFD). The implementation of the
recommendations across Scotiabank is a multi-year journey.
In 2019 the Board of Directors approved an updated climate change strategy. Scotiabank’s Climate Commitments detail the Bank’s approach to addressing the risks and
opportunities arising from climate change. These five commitments are detailed in an external position statement.
Governance
Board Oversight
As the topic of climate change requires a multidisciplinary approach, the risks and opportunities it poses to the Bank are addressed by the Board of Directors and its
committees. The Board of Directors approved the Bank’s Climate Change Strategy in October 2019. In addition, the following committees provide ongoing oversight.
• Risk Committee: Provides oversight of key risks, including those affected by climate change. This includes review (and, where appropriate, recommendation to the Board
for approval) of risk appetite limits and policy oriented documents addressing credit risk, environmental risk, and operational risk as well as reporting on potentially
material climate change risks.
104 | 2019 Scotiabank Annual Report
Management’s Discussion and Analysis | Risk Management
• Corporate Governance Committee: Provides oversight of the Sustainable Business strategy, of which climate change is a key priority, and the annual Sustainable
Business report.
• Audit Conduct and Review Committee: Provides oversight of climate change-related disclosure in the Bank’s financial reporting, including its Annual Report.
Management’s Role
The management of climate change risk is ultimately overseen by the Group Head and Chief Risk Officer, who reports directly to the CEO and has unfettered access to the
Risk Committee of the Board. This is aided through a Climate Change Committee, chaired by the Bank’s head of its Senior Credit Committee and made up of senior officers
across the business lines and control/stewardship functions. The Committee meets quarterly and is accountable for monitoring of progress against targets.
Supporting the Committee are cross-functional Working Groups that meet more frequently and support the day-to-day implementation and tracking of the climate change
strategy. This includes the Bank’s own operations, as well as managing climate change risks and opportunities with clients. Climate change considerations are integrated
into credit applications and industry reviews, through climate-related risk policies and procedures, specialized tools and training to banking officers and credit adjudicators.
Strategy
Scotiabank recognizes that climate change is significantly impacting natural systems and communities across the globe and poses a significant risk to the global economy
and society as a whole. Efforts to address climate change will require significant mobilization of capital from public and private sources worldwide.
Through Scotiabank’s Climate Commitments the Bank committed to mobilizing $100 billion by 2025 to reduce the impacts of climate change. This includes lending,
investing, finance and advisory, as well as investments in the Bank’s direct operations and communities where it operates, and will help the Bank capitalize on the financial
opportunity of the transition to a low-carbon economy. This commitment is supported by the Scotiabank Green and Transition Taxonomy and includes the creation of new
products and services, including the issuance of our inaugural Green Bond (USD$500 million 3.5 year senior unsecured). It has also led to enhanced integration of climate
risk assessments in the credit adjudication process and further commitments to decarbonize the Bank’s own operations.
Risk Management
The Bank considers environmental risk (including climate-related risks) as a principal risk type. Climate-related risk refers to the possibility that climate change issues
associated with Scotiabank or its customers could ultimately affect Bank performance by giving rise to credit, reputational, operational or legal risk. Climate-related risks
could be in the form of physical or transition risk. Examples of physical risk considerations include severe weather (e.g. floods, hurricanes, extreme cold or heat). Examples
of transition risk considerations include policy/regulatory actions such as subsidies, taxes or increased fuel costs, as well as changing market conditions.
For over a decade, the Bank has utilized and refined a comprehensive environmental risk management process. The identification, assessment and management of climate
change risk is done through due diligence as part of the overall existing environmental risk assessment and credit adjudication processes.
Highlights in 2019 include the following:
– Integrated new Climate Commitments into environmental risk framework
• The existing framework was expanded to better identify transition and physical risks and opportunities for business lending.
– Integration of climate change risk assessment (CCRA) at the sector and borrower-levels
• A sector sensitivity methodology was developed that identifies key physical and transition risk drivers to determine potential material risks and opportunities which
were added to industry reviews for 28 economic sectors. This was aided by a climate change risk and vulnerability analysis of the banking loan book.
• The Bank standardized the process of performing CCRAs for all business borrowers, updated internal systems to track CCRAs, and provided training for banking and
credit officers.
– Knowledge building on climate change risk and scenario-analysis
• A module on climate change risk was incorporated into the mandatory environmental risk training for all banking officers and credit adjudicators.
• The Bank is developing a methodology for stress testing the Bank’s business loan portfolio according to various internationally recognized climate change scenarios
and models.
– External collaboration with peers
• Scotiabank is a participant in industry groups to develop consistent methodologies and metrics for TCFD reporting.
• Scotiabank is a participant in the United National Environment Program – Finance Initiative (UNEP FI) TCFD pilot to harmonize industry-wide approaches for climate
scenario analysis in bank lending portfolios.
• Scotiabank is involved in the initiative to create a standard climate change financing taxonomy for Canada, run by the Canadian Standards Authority.
Metrics and Targets
Scotiabank sets, monitors and reports on climate change related performance and targets annually in Scotiabank’s Sustainable Business Report. The Bank also reports to
CDP (formerly the Carbon Disclosure Project). As part of Scotiabank’s Climate Commitments, the Bank is tracking the initiatives that underlie its commitment as part of the
metrics and targets it has adopted pursuant to these Commitments.
The targets and performance include:
• Target to reduce Scope 1 and 2 greenhouse gas emissions globally by 10% by 2021 (based on 2016 levels). Data will be available in our 2019 Sustainable Business
Report. As of fiscal 2018, we are 90% of the way towards achieving this target.
• Set an Internal Carbon Price of $15/tonne CO2 for Scope 1 and 2 emissions. This was achieved in fiscal 2018 and fiscal 2019. Funds were utilized to address energy
efficiency initiatives including HVAC installation and solar panels at select branches in the Caribbean.
2019 Scotiabank Annual Report | 105

Management’s Discussion and Analysis
The implementation of CCRA in the business loan book will provide the Bank with the data necessary to support stress testing and scenario planning. The data obtained will
help the Bank to determine the right metrics before setting targets, such as those related to credit exposures in high-carbon sectors.
Strategic Risk
Strategic risk is the risk that the enterprise, business lines or corporate functions will make strategic choices that are ineffective or insufficiently resilient to
changes in the business environment, or poorly execute such strategies.
The Board of Directors is ultimately responsible for oversight of strategic risk, by adopting a strategic planning process and approving, on an annual basis, a Strategic Plan
for the Bank.
The Bank conducts a comprehensive annual strategic planning process through a series of coordinated efforts between the entire Executive Management Team which
culminates in a written submission to the Board. The Board reviews this material along with other relevant presentations by the President and Chief Executive Officer and
Management. These efforts address a wide range of relevant considerations including the strategic plans of the Business Lines, an evaluation by Global Risk Management
that the Business Line strategies can be achieved within the Bank’s Risk Appetite, progress reports (quantitative and qualitative) against previously agreed-upon strategic
commitments, updates from the major Corporate Functions and a 3-year financial outlook for the Bank. Collectively, these written submissions are referred to as the
Strategic Plan. [The assessment of Strategic Risk is a judgment made by management that the Bank is operating within the parameters of the Board-approved Strategic
Plan, including quantitative and qualitative considerations.].
The Bank makes continuous efforts to ensure that all employees are aware of the Bank’s overall strategic direction, and that employees are also aware of the strategies and
objectives for their respective business line or corporate function. On an ongoing basis, the business lines and corporate functions identify, manage and assess the internal
and external considerations – including risk factors – that could affect the achievement of their strategic objectives. These matters are considered on an enterprise-wide
basis by the Bank’s Executive Management Team, which makes adjustments, as required.
Data Risk
Data risk is the risk, whether direct or indirect, to data that is used to support the Bank’s ability to make informed decisions and develop accurate reporting and
analytics for the Bank, including the Board, senior management and regulators, or for customer facing and/or marketing purposes. Risks to which the Bank is
exposed include data management, data taxonomy, metadata, breaches or data that is incomplete, inaccurate, invalid, untimely and/or inaccessible.
Data is considered one of the Bank’s most strategic assets and the volume, value and type of data found within the Bank has exponentially increased in recent years.
Enhanced rigor towards data management is a concentrated focus for the Bank with the increase in regulatory demands. The Data Executive Committee approves the Data
Management Policy and Governance Framework. The goals of the policy and framework are to ensure oversight and management of critical Bank-wide data, and to provide
governance, oversight, control structure and accountabilities to enable greater enterprise coordination and consistency.
The Enterprise Data Governance team, in partnership with the Data Office oversees and standardizes data management and data governance practices in establishing
reliable, reusable and scalable data and is responsible for enterprise-wide management of data risk. Since data is produced and consumed by different business lines and
geographies across the Bank, an effective, collaborative and holistic approach to data risk management is required to minimize reputational, regulatory and financial risk.
106 | 2019 Scotiabank Annual Report
Management’s Discussion and Analysis | Controls and Accounting Policies
Controls and Accounting Policies
Controls and Procedures
Management’s responsibility for financial information contained in this annual report is described on page 136.
Disclosure controls and procedures
The Bank’s disclosure controls and procedures are designed to provide reasonable assurance that information is accumulated and communicated to the Bank’s
management, including the President and Chief Executive Officer and the Executive Vice President and Chief Financial Officer, as appropriate, to allow timely decisions
regarding required disclosure.
As of October 31, 2019, the Bank’s management, with the participation of the President and Chief Executive Officer and the Executive Vice President and Chief Financial
Officer, evaluated the effectiveness of its disclosure controls and procedures, as defined under the rules adopted by the U.S. Securities and Exchange Commission (SEC)
and the Canadian securities regulatory authorities, and have concluded that the Bank’s disclosure controls and procedures are effective.
Internal control over financial reporting
Management of the Bank is responsible for establishing and maintaining adequate internal control over financial reporting. These controls include policies and procedures
that:
• pertain to the maintenance of records that, in reasonable detail, accurately and fairly reflect the transactions and dispositions of the assets of the Bank;
• provide reasonable assurance that transactions are recorded as necessary to permit preparation of financial statements in accordance with International Financial
Reporting Standards (IFRS) as issued by the International Accounting Standards Board (IASB), and that receipts and expenditures are being made only in accordance
with authorizations of management and directors of the Bank; and
• provide reasonable assurance regarding prevention or timely detection of unauthorized acquisition, use or disposition of the Bank’s assets that could have a material
effect on the financial statements.
All control systems contain inherent limitations, no matter how well designed. As a result, the Bank’s management acknowledges that its internal control over financial
reporting will not prevent or detect all misstatements due to error or fraud. In addition, management’s evaluation of controls can provide only reasonable, not absolute,
assurance that all control issues that may result in material misstatements, if any, have been detected.
Management assessed the effectiveness of internal control over financial reporting, using the Internal Control-Integrated Framework 2013 issued by the Committee of
Sponsoring Organizations of the Treadway Commission (COSO), and based on that assessment concluded that internal control over financial reporting was effective as of
October 31, 2019.
Changes in internal control over financial reporting
There have been no changes in the Bank’s internal control over financial reporting that have materially affected, or are reasonably likely to materially affect, the Bank’s
internal control over financial reporting.
Critical Accounting Estimates
The Bank’s accounting policies are integral to understanding and interpreting the financial results reported in this annual report. Note 3 to the consolidated financial
statements, summarizes the significant accounting policies used in preparing the Bank’s consolidated financial statements. Certain of these policies require management to
make estimates, assumptions and subjective judgements that are difficult, complex, and often relate to matters that are inherently uncertain. The policies discussed below
are considered to be particularly important to the presentation of the Bank’s financial position and results of operations, because changes in the estimates, assumptions and
judgements could have a material impact on the Bank’s consolidated financial statements. These estimates, assumptions and judgements are adjusted in the normal course
of business to reflect changing underlying circumstances.
Allowance for credit losses
Effective in 2018, the allowance for credit losses, using an expected credit loss approach as required under IFRS 9, is estimated using complex models and incorporates
inputs, assumptions and techniques that involve a high degree of management judgment. Under IFRS 9 expected credit loss methodology, an allowance is recorded for
expected credit losses on financial assets regardless of whether there has been an actual loss event. The Bank recognizes an allowance at an amount equal to 12 month
expected credit losses, if the credit risk at the reporting date has not increased significantly since initial recognition (Stage 1). When a financial asset experiences a
significant increase in credit risk subsequent to origination but is not considered to be in default, it is included in Stage 2 and subject to lifetime expected credit losses.
Financial assets that are in default are included in Stage 3. Similar to Stage 2, the allowance for credit losses for Stage 3 financial assets captures the lifetime expected
credit losses.
The main drivers in allowance for credit loss changes that are subject to significant judgment include the following:
• Determination of point-in-time parameters such as probability of default (PD), loss given default (LGD) and exposure at default (EAD).
• Forecast of macroeconomic variables for multiple scenarios and probability weighting of the scenarios.
• Assessment of significant increase in credit risk.
Measurement of expected credit losses
The probability of default (PD), exposure at default (EAD), and loss given default (LGD) inputs used to estimate expected credit losses are modelled based on
macroeconomic variables that are most closely related with credit losses in the relevant portfolio.
2019 Scotiabank Annual Report | 107

Management’s Discussion and Analysis
Details of these statistical parameters/inputs are as follows:
• PD – The probability of default is an estimate of the likelihood of default over a given time horizon. A default may only happen at a certain time over the remaining
estimated life, if the facility has not been previously derecognized and is still in the portfolio.
• EAD – The exposure at default is an estimate of the exposure at a future default date, taking into account expected changes in the exposure after the reporting date,
including repayments of principal and interest, whether scheduled by contract or otherwise, expected drawdowns on committed facilities, and accrued interest from
missed payments.
• LGD – The loss given default is an estimate of the loss arising in the case where a default occurs at a given time. It is based on the difference between the contractual
cash flows due and those that the lender would expect to receive, including from the realization of any collateral. It is usually expressed as a percentage of the EAD.
Forward-looking macroeconomic scenarios
The Bank uses a broad range of forward-looking economic information as inputs to its models of expected credit losses and the related allowance. These include real GDP,
unemployment rates, central-bank interest rates, and house-price indices. The allowance is determined using three probability-weighted, forward-looking scenarios. The
Bank considers both internal and external sources of information and data in order to create unbiased projections and forecasts. The Bank prepares the scenarios using
forecasts generated by Scotiabank Economics (SE). The forecasts are generated using both internally and externally developed models whose outputs are modified by SE
as necessary to formulate a ‘base case’ view of the most probable future direction of economic developments; SE also develops a representative range of other alternative
possible forecast scenarios. More specifically, the process involves the development of two additional economic scenarios to which relative probabilities are assigned. The
development of the baseline and alternative scenarios is overseen by a governance committee that consists of internal stakeholders from across the bank. The final baseline
and alternative scenarios reflect significant review and oversight, and may incorporate some judgment both in the determination of the scenarios’ forecasts and the
probability weights that are assigned to them. Qualitative adjustments or overlays may also be made as temporary adjustments using expert credit judgment in
circumstances where, in the Bank’s view, the existing regulatory guidance, inputs, assumptions, and/or modelling techniques do not capture all relevant risk factors. The use
of management overlays may require significant judgment that may impact the amount of allowance recognized.
Significant Increase in credit risk (SIR)
The assessment of SIR since origination of a financial asset considers borrower-specific quantitative and qualitative information without consideration of collateral, and the
impact of forward-looking information. Quantitative models may not always be able to capture all reasonable and supportable information that may indicate a significant
increase in credit risk. Qualitative factors may be assessed to supplement the gap. Examples of situations include changes in adjudication criteria for a particular group of
borrowers; changes in portfolio composition and natural disaster events impacting certain portfolios.
For retail exposures, a significant increase in credit risk cannot be assessed using forward looking information at an individual account level. Therefore, the assessment must
be done at the segment level. Segment migration thresholds exist for each PD model by product which considers the proportionate change in PD as well as the absolute
change in PD. The thresholds used for PD migration are reviewed and assessed at least annually, unless there is a significant change in credit risk management practices in
which case the review is brought forward.
For Non-retail exposures the Bank uses an internal risk rating scale (IG codes) for its non-retail exposures. All non-retail exposures have an IG code assigned that reflects
the probability of default of the borrower. Both borrower specific and non-borrower specific (i.e. macroeconomic) forward looking information is considered and reflected in
the IG rating. Significant increase in credit risk is evaluated based on the migration of the exposures among IG codes.
Fair value of financial instruments
All financial instruments are measured at fair value on initial recognition. Subsequent measurement of a financial instrument depends on its classification. The contractual
cash flow characteristics of a financial instrument and the business model under which it is held determines such classification. Non-trading loans and receivables, certain
securities and most financial liabilities are carried at amortized cost unless classified or designated as fair value through profit and loss or fair value through other
comprehensive income at inception.
Fair value of a financial asset or liability is the price that would be received to sell an asset or paid to transfer a liability in an orderly transaction between market participants
in the principal, or in its absence, the most advantageous market to which the Bank has access at the measurement date.
The best evidence of fair value for a financial instrument is the quoted price in an active market. Unadjusted quoted market prices for identical instruments represent a
Level 1 valuation. Quoted prices are not always available for over-the-counter transactions, as well as transactions in inactive or illiquid markets. In these instances, internal
models that maximize the use of observable inputs are used to estimate fair value. The chosen valuation technique incorporates all the factors that market participants would
take into account in pricing a transaction. When all significant inputs are observable, the valuation is classified as Level 2. Financial instruments traded in a less active
market have been valued using indicative market prices, present value of cash flows or other valuation techniques. Fair value estimates normally do not consider forced or
liquidation sales. Where financial instruments trade in inactive markets or when using models where observable parameters do not exist, greater management judgement is
required for valuation purposes such as multiple of the underlying earnings, pricing by third party providers, discount rates, volatilities and correlations. Valuations that
require the significant use of unobservable inputs are considered Level 3. The calculation of estimated fair value is based on market conditions at a specific point in time and
therefore may not be reflective of future fair values.
The Bank has controls and processes in place to ensure that the valuation of financial instruments is appropriately determined. Global Risk Management (GRM) is
responsible for the design and application of the Bank’s risk management framework. GRM is independent from the Bank’s business units and is overseen by Executive
Management and the Board of Directors. Senior management committees within GRM oversee and establish standards for risk management processes that are critical in
ensuring that appropriate valuation methodologies and policies are in place for determining fair value.
Where possible, valuations are based on quoted prices or observable inputs obtained from active markets. GRM oversees a monthly Independent Price Verification (IPV)
process in order to assess the reliability and accuracy of prices and inputs used in the determination of fair value. The IPV process is performed by price verification groups
that are independent from the business. The Bank maintains an approved list of pricing sources
108 | 2019 Scotiabank Annual Report
Management’s Discussion and Analysis | Controls and Accounting Policies
that are used in the IPV process. These sources include, but are not limited to, brokers, dealers and consensus pricing services. The valuation policies relating to the IPV
process require that all pricing or rate sources used be external to the Bank. On a periodic basis, an independent assessment of pricing or rate sources is also performed by
GRM to determine market presence or market representative levels.
Where quoted prices are not readily available, such as for transactions in inactive or illiquid markets, internal models that maximize the use of observable inputs are used to
estimate fair value. An independent senior management committee within GRM oversees the vetting, approval and ongoing validation of valuation models used in
determining fair value. Risk policies associated with model development are approved by Executive Management and/or key risk committees.
In determining fair value for certain instruments or portfolios of instruments, valuation adjustments or reserves may be required to arrive at a more accurate representation of
fair value. The Bank’s policy of applying valuation reserves to a portfolio of instruments is approved by a senior management committee. These reserves include adjustments
for credit risk, bid-offer spreads, unobservable parameters, constraints on prices in inactive or illiquid markets and when applicable funding costs. The methodology for the
calculation of valuation reserves are reviewed at least annually by senior management.
Valuation adjustments recorded against the fair value of financial assets and financial liabilities totaled $175 million as at October 31, 2019, (2018 – $138 million), net of any
write-offs. These valuation adjustments are due mainly to credit risk considerations and bid-offer spreads on derivative transactions.
As at October 31, 2019, a funding valuation adjustment (FVA) of $108 million pre-tax (2018 – $57 million) was recorded relating to uncollateralized derivative instruments.
The Bank discloses the classification of all financial instruments carried at fair value in a hierarchy based on the determination of fair value. The valuation hierarchy is as
follows:
• Level 1 – fair value is based on unadjusted quoted prices in active markets for identical instruments,
• Level 2 – fair value is based on models using significant market-observable inputs other than quoted prices for the instruments, or
• Level 3 – fair value is based on models using significant inputs that are not based on observable market data.
The Bank’s assets and liabilities which are carried at fair value as classified by the valuation hierarchy are reflected in Note 7. The percentage of each asset and liability
category by fair value hierarchy level are outlined as follows:
T53 Fair value hierarchy of financial instruments carried at fair value
Assets Liabilities
Fair value hierarchy
As at October 31, 2019
Trading
assets
(incl. precious
metals)
Investment
securities Derivatives
Obligations
related to
securities
sold short Derivatives
Level 1 69% 61% 2% 88% 1%
Level 2 31% 37% 98% 12% 99%
Level 3 –% 2% –% –% –%
100% 100% 100% 100% 100%
Employee benefits
The Bank provides pension and other benefit plans for eligible employees in Canada and internationally. Pension benefits are offered in the form of defined benefit pension
plans (generally based on an employee’s length of service and average earnings at retirement), and in the form of defined contribution pension plans (where the Bank’s
contribution is fixed and there is no legal or constructive obligation to pay further amounts). Other benefits include post-retirement health care, dental care and life insurance,
along with other long-term employee benefits such as long-term disability benefits.
The employee benefit expenses and the related benefit obligation are calculated using actuarial methods and certain actuarial assumptions. These assumptions are based
on management’s best estimate and are reviewed and approved annually. The most significant assumption is the discount rate used to determine the defined benefit
obligation, which is set by reference to the yields on high quality corporate bonds that have durations that match the terms of the Bank’s obligations. Separate discount rates
are used to determine the annual benefit expense in Canada and the US. These rates are determined with reference to the yields on high quality corporate bonds with
durations that match the various components of the annual benefit expense. The discount rate used to determine the annual benefit expense for all other plans is the same
as the rate used to determine the defined benefit obligation. If the assumed discount rates were 1% lower, the benefit expense for 2019 would have been $117 million
higher. Other key assumptions include future compensation, health care costs, employee turnover, retirement age and mortality. When making these estimates,
management considers expectations of future economic trends and business conditions, including inflation rates as well as other factors, such as plan specific experience
and best practices.
The Bank uses a measurement date of October 31, and based on this measurement date, the Bank reported a deficit of $1,268 million (2018 – $231 million) in its principal
pension plans and a deficit of $1,264 million (2018 – $1,134 million) in its principal other benefit plans, which are typically unfunded, as at October 31, 2019, as disclosed in
Note 28 to the consolidated financial statements.
Actual experience that differs from assumptions made by management will result in a net actuarial gain or loss recognized immediately in other comprehensive income
except for other long-term employee benefits where they are recognized in the Consolidated Statement of Income.
Note 28 contains details of the Bank’s employee benefit plans, such as the disclosure of pension and other benefit amounts, management’s key assumptions, and a
sensitivity analysis of changes in these assumptions on the employee benefit obligation and expense.
Corporate income taxes
Management exercises judgment in determining the provision for income taxes and deferred income tax assets and liabilities. The provision is based on management’s
expectations regarding the income tax consequences of transactions and events during the period. Management interprets the tax legislation for each jurisdiction in which
the Bank operates and makes assumptions about the expected timing of the reversal of
2019 Scotiabank Annual Report | 109

Management’s Discussion and Analysis
deferred income tax assets and liabilities. If management’s interpretations of the legislation differ from those of the tax authorities or if the actual timing of the reversals of the
deferred income tax assets and liabilities is not as anticipated, the provision for income taxes could increase or decrease in future periods.
Total deferred tax assets related to the Bank’s unused income tax losses from operations arising in prior years were $286 million as at October 31, 2019 (2018 – $338
million). The tax related to temporary differences, unused tax losses and unused tax credits for which no deferred tax asset is recognized in the Consolidated Statement of
Financial Position amounted to $40 million (2018 – $14 million). The amount related to unrecognized tax losses was $16 million, which will expire as follows: $4 million in
2020, $11 million in 2023, and $1 million with no expiry date.
The Bank maintains provisions for uncertain tax positions that it believes appropriately reflect the risk of tax positions under discussion, audit, dispute, or appeal with tax
authorities, or which are otherwise considered to involve uncertainty. These provisions are made using the Bank’s best estimate of the amount expected to be paid based on
an assessment of all relevant factors, which are reviewed at the end of each reporting period.
Since 2016, the Bank has received reassessments totalling $575 million of tax and interest as a result of the Canada Revenue Agency denying the tax deductibility of certain
Canadian dividends received during the 2011-2013 taxation years. In October 2019, the Bank was reassessed for $223 million of tax and interest in respect of certain
Canadian dividends received during the 2014 taxation year. The circumstances of the dividends subject to these reassessments are similar to those prospectively addressed
by rules introduced in 2015 and 2018. The Bank is confident that its tax filing position was appropriate and in accordance with the relevant provisions of the Income Tax Act
(Canada) and intends to vigourously defend its position.
Note 27 of the 2019 consolidated financial statements contains further details with respect to the Bank’s provisions for income taxes.
Structured entities
In the normal course of business, the Bank enters into arrangements with structured entities on behalf of its customers and for its own purposes. These structured entities
can be generally categorized as multi-seller commercial paper conduits, Bank funding vehicles and structured finance entities. Further details are provided in the Off-balance
sheet arrangements section.
Management is required to exercise judgement to determine whether a structured entity should be consolidated. This evaluation involves understanding the arrangements,
determining whether decisions about the relevant activities are made by means of voting rights or other contractual arrangements, and determining whether the Bank
controls the structured entity.
The Bank controls an investee when it is exposed, or has rights, to variable returns from its involvement with the investee and has the ability to affect those returns through
its power over the investee. The three elements of control are:
• power over the investee;
• exposure, or rights, to variable returns from involvement with the investee; and
• the ability to use power over the investee to affect the amount of the Bank’s returns.
This definition of control applies to circumstances:
• when voting rights or similar rights give the Bank power, including situations where the Bank holds less than a majority of voting rights or involving potential voting rights;
• when an investee is designed so that voting rights are not the dominant factor in deciding who controls the investee (i.e., relevant activities are directed by contractual
arrangements);
• involving agency relationships; and
• when the Bank has control over specified assets of an investee.
The Bank does not control an investee when it is acting in an agent’s capacity. The Bank assesses whether it is an agent by determining whether it is primarily engaged to
act on behalf and for the benefit of another party or parties. Factors that the Bank considers in this assessment include the scope of its decision-making authority over the
investee, the rights held by other parties, the remuneration to which it is entitled, and the Bank’s exposure to variability of returns from other interests that it holds in the
investee.
The analysis uses both qualitative and quantitative analytical techniques and involves the use of a number of assumptions about the business environment in which the
structured entity operates and the amount and timing of future cash flows.
The Bank reassesses whether it controls an investee if facts and circumstances indicate that one or more of the three elements of control change.
Management is required to exercise judgement to determine if a change in control event has occurred.
During 2019, there were no change in control events that caused the Bank to change its control conclusion of its multi-seller conduits or other structured entities.
As described in Note 15 to the consolidated financial statements and in the discussion of off-balance sheet arrangements, the Bank does not control the two Canadian-
based multi-seller conduits that it sponsors and they are not required to be consolidated on the Bank’s Consolidated Statement of Financial Position. The Bank controls its
U.S.-based multi-seller conduit and consolidates it on the Bank’s Consolidated Statement of Financial Position.
Goodwill
For the purpose of impairment testing, goodwill acquired in a business combination is, on the acquisition date, allocated to each of the Bank’s group of cash-generating units
(CGU) that are expected to benefit from the particular acquisition.
Goodwill is not amortized but tested for impairment annually and when circumstances indicate that the carrying value may be impaired.
Goodwill is reviewed at each reporting date to determine whether there is any indication of impairment. Each CGU to which goodwill is allocated for impairment testing
purposes reflects the lowest level at which goodwill is monitored for internal management purposes.
The Bank determines the carrying value of the CGU using a regulatory capital approach based on credit, market, and operational risks, and leverage, consistent with the
Bank’s capital attribution for business line performance measurement. An impairment loss is recognized if the
110 | 2019 Scotiabank Annual Report

Management’s Discussion and Analysis | Controls and Accounting Policies
carrying amount of a CGU exceeds its recoverable amount. The recoverable amount is the greater of fair value less costs of disposal and value in use. If either fair value
less costs of disposal or value in use exceeds the carrying amount, there is no need to determine the other. The recoverable amount for the CGU has been determined using
the fair value less costs of disposal method. In arriving at such value an appropriate valuation model is used which considers various factors including normalized net
income, price earnings multiples and control premium. These calculations are corroborated by valuation multiples, quoted share prices for publicly traded subsidiaries or
other available fair value indicators. An impairment loss, in respect of goodwill, is not reversed.
Significant judgement is applied in determining the recoverable amounts of the CGU and assessing whether certain events or circumstances constitute objective evidence of
impairment.
Goodwill was assessed for annual impairment based on the methodology as at July 31, 2019, and no impairment was determined to exist. Additionally, there were no
impairment indicators noted as of October 31, 2019.
Indefinite life intangible assets
Intangible assets with indefinite useful lives are not amortized but tested for impairment annually and when circumstances indicate that the carrying value may be impaired.
Intangible assets are reviewed at each reporting date to determine whether there is any indication of impairment.
The recoverable amount is the greater of fair value less costs of disposal and value in use. If either fair value less costs of disposal or value in use exceeds the carrying
amount, there is no need to determine the other. Value in use method is used by the Bank to determine the recoverable amount of the intangible asset. In determining value
in use, an appropriate valuation model is used which considers factors such as management-approved cash flow projections, discount rate and terminal growth rate. An
impairment loss is recognized if the carrying amount of the intangible asset exceeds its recoverable amount. Impairment losses recognized in prior periods are reassessed at
each reporting period for any indication that the loss has decreased or no longer exists. An impairment loss is reversed if there has been a change in the estimates used to
determine the recoverable amount. An impairment loss is reversed only to the extent that the intangible asset’s carrying amount does not exceed the carrying amount that
would have been determined if no impairment loss had been recognized.
The recoverable amount is significantly impacted by the discount rate and the terminal value. Significant judgement is applied in determining the intangible asset’s
recoverable amount and assessing whether certain events or circumstances constitute objective evidence of impairment.
Intangible assets were assessed for annual impairment based on the methodology as at July 31, 2019, and no impairment was determined to exist. Additionally, there were
no impairment indicators noted as of October 31, 2019.
Derecognition of financial assets
Financial assets are derecognized when the contractual rights to the cash flows from the asset have expired, which occurs with repayment by the borrower or upon
substantial modification of the asset terms. Assets are also derecognized when the Bank transfers the contractual rights to receive the cash flows from the financial asset, or
has assumed an obligation to pay those cash flows to an independent third-party, and the Bank has transferred substantially all the risks and rewards of ownership of that
asset to an independent third-party.
Management has to apply judgement in determining whether a modification of the terms of the financial asset is considered to be substantial. For loans, this includes the
nature of the modification and the extent of changes to terms including interest rate, authorized amount, term or type of underlying collateral.
Management also has to apply judgement in determining, based on specific facts and circumstances, whether the Bank has retained or transferred substantially all the risks
and rewards of ownership of the financial asset. Where substantially all the risks and rewards of ownership of the financial asset are neither retained nor transferred, the
Bank derecognizes the transferred asset only if it has lost control over that asset. If the Bank retains control over the asset, it will continue to recognize the asset to the
extent of its continuing involvement.
The majority of assets transferred under repurchase agreements, securities lending agreements, securitizations of fully insured Canadian residential mortgages, and
securitizations of personal lines of credit, credit cards and auto loans do not qualify for derecognition. The Bank continues to record the transferred assets on the
Consolidated Statement of Financial Position as secured financings. Further information on derecognition of financial assets can be found in Note 14 of the consolidated
financial statements.
Provisions
The Bank recognizes a provision if, as a result of a past event, the Bank has a present legal or constructive obligation that can be estimated reliably, and it is probable that
an outflow of economic benefits will be required to settle the obligation. Probable in this context means more likely than not. Significant judgement is required in determining
whether a present obligation exists and in estimating the probability, timing, and amount of any future outflows.
Litigation and other
In the ordinary course of business, the Bank and its subsidiaries are routinely defendants in, or parties to a number of pending and threatened legal actions and regulatory
proceedings, including actions brought on behalf of various classes of claimants. In view of the inherent difficulty of predicting the outcome of such matters, the Bank cannot
state what the eventual outcome of such matters will be.
Legal provisions are established when it becomes probable that the Bank will incur an expense related to a legal action and the amount can be reliably estimated. Such
provisions are recorded at the best estimate of the amount required to settle any obligation related to these legal actions as at the balance sheet date, taking into account the
risks and uncertainties surrounding the obligation. Management and internal and external experts are involved in estimating any amounts that may be required. The actual
costs of resolving these claims may vary significantly from the amount of the legal provisions. The Bank’s estimate involves significant judgement, given the varying stages of
the proceedings, the fact that the Bank’s liability, if any, has yet to be determined and the fact that the underlying matters will change from time to time. As such, there is a
possibility that the ultimate resolution of those legal actions may be material to the Bank’s consolidated results of operations for any particular reporting period.
Future Accounting Developments
The Bank actively monitors developments and changes in accounting standards from the IASB, as well as requirements from the other regulatory bodies, including OSFI.
The Bank is currently assessing the measurement impact of the adoption of new standards issued by the IASB will have on its consolidated financial statements and also
evaluating the alternative elections available on transition.
2019 Scotiabank Annual Report | 111

Management’s Discussion and Analysis
Effective November 1, 2019
Leases
In January 2016, the IASB issued IFRS 16 Leases (“IFRS 16”), which replaces IAS 17, Leases (“IAS 17”), requiring a lessee to recognize an asset for the right to use the
leased item and a liability for the present value of its future lease payments. IFRS 16 will generally result in all operating leases being recorded on the Bank’s balance sheet
as a right-of-use (“ROU”) asset with a corresponding lease liability. The Bank will also recognize amortization expense on the ROU asset in non-interest expenses and
interest expense on the lease liability in interest expenses, in the statement of income. IFRS 16 substantially carries forward the lessor accounting requirements in IAS 17.
The two main areas of judgment with regards to quantification of the ROU asset and lease liability are the determination of lease term and the discount rate.
Determining lease term
The Bank’s expectation of exercising the option to renew a lease will be determined by assessing if the Bank is “reasonably certain” to exercise that option. The Bank will be
reasonably certain to exercise an option when factors create a significant economic incentive to do so. This assessment will require a significant level of judgement as it is
based on current expectations of future decisions.
The lease term will have an impact on the calculation of the ROU asset and the lease liability; the longer the lease term, the higher the ROU asset and the related lease
liability. Changes in the economic environment may impact the Bank’s assessment of lease term, and any changes in the estimate of lease terms may have a material
impact on the Bank’s ROU assets and lease liabilities.
Discount rate
At commencement date, the Bank will measure the lease liability at the present value of the future lease payments, discounted using the Bank’s incremental borrowing rate.
The Bank will consider a broad range of factors to determine the appropriate discount rate. These will include the Bank’s credit risk, term of the lease, the economic
environment and geographical location in which the lease is entered into.
Elections and estimated impact
The Bank will apply IFRS 16 on a modified retrospective basis by adjusting the consolidated balance sheet as at November 1, 2019, the date of initial application, with no
restatement of comparative periods. The Bank will elect certain transition elections that include:
• Measure the ROU asset at the date of initial application as equal to lease liability with certain adjustments.
• Not apply IFRS 16 to operating leases with a remaining lease term of less than 12 months (short-term leases) or low value assets.
• Not apply IFRS 16 to leases of intangible assets.
The adoption of IFRS 16 as at November 1, 2019 is expected to result in an increase to total assets of approximately $3.7 billion, substantially representing real estate
leases and an increase in lease liabilities of approximately $3.7 billion. The Bank estimates that the adoption of IFRS 16 will also decrease its CET1 capital ratio by
approximately 10 bps.
IFRIC 23 Uncertainty over income tax treatments
On June 7, 2017, the IASB issued IFRIC 23 which clarifies application of recognition and measurement requirements in IAS 12 income taxes when there is uncertainty over
income tax treatments. The impact on the Bank’s consolidated financial statements is not material.
Employee Benefits
On February 7, 2018, the IASB issued narrow-scope amendments to pension accounting. The amendments relate to when a plan amendment, curtailment or settlement has
occurred. In such instances, the Bank is required to use updated assumptions to determine current service cost and net interest for the remainder of the reporting period
after the change to the plan. For the Bank, the narrow scope amendments are to be applied prospectively to plan amendments, curtailments and settlements occurring after
November 1, 2019.
Effective November 1, 2020
Definition of business
On October 22, 2018, the IASB issued a narrow-scope amendment to IFRS 3 Business Combination. The amendments will help companies determine whether an
acquisition is of a business or a group of assets. Distinguishing between a business and a group of assets is important because an acquirer recognizes goodwill only when
acquiring a business. The amendments apply to transactions for which the acquisition date is on or after the beginning of the first annual reporting period beginning on or
after January 1, 2020. Earlier adoption is permitted. The amendments will apply prospectively to new transactions.
Interest Rate Benchmark Reform
The IASB issued amendments to IFRS 9, IAS 39 and IFRS 7 on September 26, 2019, to amend certain requirements for hedge accounting in order to support the provision
of useful information by entities during the period of uncertainty arising from the phase out of interest rate benchmarks (e.g. interbank offered rates – IBORs). The
amendments aim to provide relief for financial instruments qualifying for hedge accounting which are affected during the period of uncertainty leading up to contractual rate
replacement. The amendments would no longer apply once uncertainties arising from IBOR reform are no longer present. The amendments require providing specific
disclosure for the affected hedging relationships. The amendments are effective for the Bank from November 1, 2020. Early application is permitted. The Bank is currently
assessing the impact and extent of disclosure requirements.
Effective November 1, 2021
Insurance contracts
On May 18, 2017, the IASB issued IFRS 17 Insurance Contracts, which provides a comprehensive principle-based framework for the measurement and presentation of all
insurance contracts. The new standard will replace IFRS 4 Insurance Contracts and requires insurance contracts to be measured using current fulfillment cash flows and for
revenue to be recognized as the service is provided over the coverage period. The standard is required to be adopted retrospectively, if this is impractical, the modified
retrospective or fair value method may be used.
112 | 2019 Scotiabank Annual Report

Management’s Discussion and Analysis | Controls and Accounting Policies
The IASB issued an exposure draft on June 26, 2019 proposing some amendments to IFRS 17, including a proposal to defer the effective date, by one year, to annual
periods on or after January 1, 2022. The Bank continues to monitor developments related to the standard and industry discussions on the application of the standard.
The project to implement IFRS 17 is a multi-year project consisting of technology upgrades and policy and process changes. The project structure and governance has been
established along with a Project Management Office to assist the Executive Steering and Project Operations Committees. The committees are comprised of representatives
from Global Finance, Global Insurance Actuarial Services, Information Technology and the Insurance Business Operation. The Bank has completed a preliminary gap
analysis of the differences between IFRS 4 and IFRS 17, an initial contract scoping assessment and project plan. The Bank has determined that it will require new
technology to manage the insurance business and prepare additional disclosures, for the separate insurance legal entity financial statements, under the new standard.
During 2020 the Bank will continue to evaluate the impact to existing IT systems and processes and formulate the accounting policies under IFRS 17 in order to perform an
initial quantification of the impact to the new standard.
Regulatory Developments
The Bank continues to monitor and respond to global regulatory developments relating to a broad spectrum of topics, in order to ensure that control and business units are
responsive on a timely basis and business impacts, if any, are minimized. The following provides a high-level summary of some of the key regulatory developments that
have the potential of impacting the Bank’s operations.
United Kingdom and European Regulatory Reform
The UK gave formal notice of intention to withdraw from the EU on March 29, 2017. Negotiation of the terms of withdrawal are ongoing and the final date for the UK to leave
the EU has been extended until January 31, 2020. Withdrawal may be earlier if the UK Parliament ratifies the agreement that has already been negotiated with the EU or if
an amended agreement is negotiated and ratified by both the EU and the UK. Political agreement has been reached on a transition period, which would extend until at least
December 31, 2020, providing additional time in which to ensure readiness, subject to the overall withdrawal agreement being concluded and ratified. If this occurs, then all
EU legislation will continue to apply in the UK during such transition period.
There remains a possibility that the UK will leave the EU on or before January 31, 2020 without having a withdrawal agreement in place (a so-called “hard” Brexit).
The UK’s exit from the EU may result in significant changes in law(s), which may impact the Bank’s business, financial condition and/or results of operations and could
adversely impact the Bank’s cost of funding in Europe. The Bank continually monitors developments to prepare for changes that have the potential to impact its operations in
the UK and elsewhere in Europe and is developing and revising its contingency plans accordingly.
Regulatory Initiatives Impacting Financial Services in Canada
In April 2019, Parliament approved changes to the Canada Deposit Insurance Corporation Act that will strengthen and modernize deposit protection. The changes will occur
in two phases on April 30, 2020 and April 30, 2021. Some of the changes include extending CDIC coverage to foreign currency deposits and deposits with terms greater
than 5 years, eliminating coverage for travellers’ cheques and introducing new requirements for deposits held in trust.
On October 3, 2019, the Canadian Securities Administrators published reforms focused on advisor conduct, including enhanced standards for conflicts of interest, suitability,
“Know Your Client” and “Know Your Product”. Investment Industry Regulatory Organization of Canada (IIROC) published its new “Plain Language” Rulebook in August 2019,
which is intended to make the rules easier to understand as well as introducing a number of substantive changes. These changes will impact the Bank’s Wealth
Management businesses and the Bank is developing new processes and working with its advisors to comply with the new Rulebook, which will go into force in June 2020,
and the CSA reforms, which will go into force on December 31, 2019 with a staggered implementation of December 2020 and 2021.
In 2019, the Financial Consumer Agency of Canada (FCAC) released a new voluntary principles-based Code of Conduct for the delivery of banking services to seniors,
defined as an individual in Canada who is 60 years of age or older and who is transacting for non-business purposes.
The Code is to be adopted on publication, with additional timelines starting in January 2020. The FCAC will monitor compliance with the Code. Industry consultation
continues with the Canadian Bankers Association (CBA) and Department of Finance regarding the interpretation of the new Federal Consumer Protection Framework (Bill
C-86). The new consumer protection framework and regulations are expected to be implemented by the fall of 2021, although no date has been formally set.
Basel Committee on Banking Supervision – Finalized Basel III reforms
In December 2017, the Group of Governors and Heads of Supervision (GHOS), the oversight body of the Basel Committee on Banking Supervision (BCBS), announced that
they have agreed on an output floor of 72.5% and have finalized the remaining Basel III reforms.
The final Basel III reform package includes: a revised standardized approach for credit risk; revisions to the internal ratings-based approach for credit risk; revisions to the
credit valuation adjustment (CVA) framework, including the removal of the internally modelled approach and the introduction of a revised standardized approach; a revised
standardized approach for operational risk, which will replace the existing standardized approaches and the advanced measurement approaches; revisions to the
measurement of the leverage ratio and a leverage ratio buffer for global systemically important banks (G-SIBs), which will take the form of a Tier 1 capital buffer set at 50%
of a G-SIB’s risk-weighted capital buffer; and an aggregate output floor, which will ensure that banks’ risk-weighted assets (RWAs) generated by internal models are no
lower than 72.5% of RWAs as calculated by the Basel III framework’s standardized approaches. Banks will also be required to disclose their RWAs based on these
standardized approaches. Implementation of the new Basel III standards will be required in 2022. This includes the Fundamental Review of the Trading Book (FRTB) rules,
which represents a delay from 2020. There is a phase-in period for the 72.5% output floor from January 1, 2022 until January 2027.
In July 2018, OSFI issued a discussion paper seeking views from interested stakeholders on its proposed policy direction and its timelines for implementation of the final
Basel III reforms in Canada. OSFI supports the changes proposed within the final Basel III reforms and intends to implement them domestically, while also considering the
adjustments required to recognize the unique characteristics of the Canadian market, improving risk sensitivity and providing the right incentives, while promoting the safety
and soundness of deposit taking institutions in
2019 Scotiabank Annual Report | 113

Management’s Discussion and Analysis
consideration of level playing field and competitiveness issues. As part of these adjustments, OSFI is considering eliminating the BCBS’ transitional provisions for the output
floor, setting the output floor at 72.5% commencing the first quarter of 2022. Responses to the questions raised within the discussion paper were due to OSFI by October 19,
2018. The Bank will continue to monitor and prepare for developments impacting regulatory capital requirements.
Regulatory Capital Pillar 3 Disclosure Requirements
In February 2018, the Basel Committee on Banking Supervision (BCBS) issued an update to its Pillar 3 disclosure requirements framework, as the third phase of the
Committee’s disclosure project, which builds on the first and second phases, published by the Committee in January 2015 and March 2017, respectively. The third phase is
primarily to address changes in disclosure requirements from the Basel III reforms finalized in December 2017, as well as other disclosure requirements related to asset
encumbrance, capital distribution constraints, and the scope of disclosure requirements across resolution groups.
The Bank’s supplementary regulatory capital disclosures as at October 31, 2019 meet OSFI’s April 2017 disclosure guideline for the Committee’s first phase of the revised
Pillar 3 disclosure requirements. OSFI’s disclosure guidelines for the implementation of the second and third phases of the Committee disclosure project are awaited.
In May 2018, OSFI issued its disclosure guidelines on Total Loss Absorbing Capacity (TLAC) Disclosure Requirements and Capital Disclosure Requirements (formerly the
advisory entitled Public Capital Disclosure Requirements related to Basel III Pillar 3). Together, these guidelines are a key element of a TLAC regime designed to ensure
Canada’s largest banks maintain a minimum capacity to absorb losses and enhance stability within the financial sector. These disclosure guidelines were effective for
quarterly reporting commencing the first quarter of 2019.
Regulatory developments relating to liquidity
The Net Stable Funding Ratio (NSFR) is aimed at reducing structural funding risk by requiring banks to fund their activities with sufficiently stable sources of funding. The
NSFR becomes a minimum standard in OSFI’s liquidity framework in January 2020 with public disclosure required by the first quarter of 2021.
Interest Rate Benchmark Reform
In July, 2017, the UK Financial Conduct Authority (FCA), which began regulating the London Interbank Offered Rate (LIBOR) in 2013, announced that after December 31,
2021, it would stop making efforts to sustain the rate. This decision follows regulatory efforts to reform LIBOR and other interbank offered rates, which have been under
increased scrutiny due to thinning underlying markets. As the administrator of LIBOR, the FCA, and regulators in other jurisdictions, have urged users of LIBOR to transition
away from LIBOR and other interbank offered rates in favour of alternative risk-free rates (RFRs). The UK, Europe, the United States, Japan and Switzerland, have all
recommended alternatives to LIBOR, based on either secured or unsecured overnight funding markets.
Some of those alternative rates, such as the Sterling Overnight Index Average (SONIA), the alternative to GBP LIBOR, and the Swiss Average Rate Overnight (SARON), the
alternative for CHF LIBOR, were already widely used in those jurisdictions; others, like the Secured Overnight Financing Rate (SOFR), the rate recommended as the
alternative to USD LIBOR, was newly introduced in 2018. These rates are inherently different from LIBOR and other interbank offered rates, lacking both a term structure
and a credit component. These rate differences add complexity to the transition from LIBOR and other IBORs to their overnight alternatives, and mean that in some markets,
such as those based on new rates like SOFR, have been slower to develop. In Canada, the Canadian Overnight Repo Rate (CORRA) has been recommended as the
alternative to the Canadian Dollar Offered Rate (CDOR) for both derivative and cash products. Already available in the market, CORRA is currently being enhanced and
reformed by its administrator, the Bank of Canada.
The Bank has established an enterprise wide program, aimed at ensuring a smooth transition from LIBOR and other IBORs to RFRs. The program has been focused on
identifying and quantifying our exposures to various interest rate benchmarks, providing the capability to trade products referencing alternative RFRs and evaluating our
existing contract amendment language in the event LIBOR ceases to exist. The Bank is reviewing contracts that reference IBORs with consideration to those extending past
2021. In addition, the Bank is assessing technology to ensure that it is fit for purpose and the Bank is working on consistent messaging to clients. The Bank’s approach
contemplates transition risks as part of a comprehensive program of change to ensure that systems, processes and strategy provides for a smooth transition from the use of
legacy rates and supports trading in alternative reference rates.
The International Accounting Standards Board (IASB) has approached the impact of Interest Rate Benchmark Reform on financial reporting in two phases. Phase one
addresses issues affecting financial reporting in the period before the replacement of an existing interest rate benchmark with an alternative RFR; and phase two focuses on
issues that might affect financial reporting when an existing interest rate benchmark is replaced with an RFR. The IASB has finalized phase one and published the relief in
September 2019, which will be effective for the Bank on November 1, 2020, with early application permitted. The IASB has started the discussions on phase two and the
Bank is closely monitoring these developments to better assess the accounting implications.
Use of the Advance Measurement Approach for Operational Risk Capital
In July 2019, OSFI revised its capital requirements for operational risk in consideration of the final Basel III revisions published by the Basel Committee on Banking
Supervision in December 2017. Effective Q1 2021, institutions will be required to use the revised Basel III Standardized Approach for operational risk.
In the interim, for fiscal year 2020, institutions currently approved for the Basel II Advanced Measurement Approach (AMA) for operational risk capital are to report using the
existing Basel II Standardized Approach (TSA). As the Bank’s AMA requirements are floored at TSA requirements, the impact from the adoption of the interim 2020
requirement is not material to the Bank.
Regulatory Developments Relating to Interest Rate Risk
In May 2019, OSFI updated its guidelines on Interest Rate Risk in the Banking Book (IRRBB), a risk control framework to identify, assess and manage interest rate risk. The
Bank will apply the updated guidelines starting in January 2020, consistent with OSFI’s requirement.
114 | 2019 Scotiabank Annual Report
Management’s Discussion and Analysis | Controls and Accounting Policies
Volcker Rule Amendments
The proposed Volcker rule amendments have now been approved by each of the five U.S. regulators responsible for this legislation (i.e. FDIC, OCC, Federal Reserve,
CFTC & SEC). As anticipated, the final amendments will reduce the regulatory burden on certain financial institutions, including foreign banking organizations such as the
Bank. The amendments take effect on January 1, 2020, with full compliance required by January 1, 2021.
Canadian Anti-Money Laundering (AML) Regulations
In July 2019, amendments to Canada’s Proceeds of Crime (Money Laundering) and Terrorist Financing Act regulations were released following extensive industry
consultation. Amendments will take effect in a phased approach, with the majority coming into effect by June 2021. These changes aim to improve the effectiveness of
Canada’s anti-money laundering and counter-terrorism financing regime, and to improve compliance with international standards. New regulations will require the Bank to
implement changes to processes, technology and data, to satisfy Financial Transactions and Reports Analysis Centre of Canada (FINTRAC) reporting requirements. The
Bank is proactively working to implement the new regime with the aim to protect the Canadian financial system and our communities.
Related Party Transactions
Compensation of key management personnel
Key management personnel are those persons having authority and responsibility for planning, directing and controlling the activities of the Bank, directly or indirectly, and
comprise the directors of the Bank, the President and Chief Executive Officer, certain direct reports of the President and Chief Executive Officer and Group Heads.
T54 Compensation of the Bank key management personnel
For the year ended October 31 ($ millions) 2019 2018
Salaries and cash incentives(1) $ 17 $ 18
Equity-based payment(2) 25 27
Pension and other benefits(1) 5 4
Total $ 47 $ 49
(1) Expensed during the year.
(2) Awarded during the year.
Directors can use some or all of their director fees earned to buy common shares of the Bank at market rates through the Director’s Share Purchase Plan. Non-officer
directors may elect to receive all or a portion of their fees in the form of deferred stock units which vest immediately. Refer to Note 26 – Share-based payments for further
details of these plans.
T55 Loans and deposits of key management personnel
Loans are currently granted to key management personnel at market terms and conditions.
As at October 31 ($ millions) 2019 2018
Loans $ 14 $ 13
Deposits $ 9 $ 6
The Bank’s committed credit exposure to companies controlled by directors totaled $18.9 million as at October 31, 2019 (October 31, 2018 – $132.4 million) while actual
utilized accounts were $3.3 million (October 31, 2018 – $23.9 million).
Transactions with associates and joint ventures
In the ordinary course of business, the Bank provides normal banking services and enters into transactions with its associated and other related corporations on terms
similar to those offered to non-related parties. If these transactions are eliminated on consolidation, they are not disclosed as related party transactions. Transactions
between the Bank and its associated companies and joint ventures also qualify as related party transactions and are as follows:
T56 Transactions with associates and joint ventures
As at and for the year ended October 31 ($ millions) 2019 2018
Net income / (loss) $ (68) $ (64)
Loans 327 702
Deposits 194 151
Guarantees and commitments $ 16 $ 123
Scotiabank principal pension plan
The Bank manages assets of $4.1 billion (October 31, 2018 – $3.8 billion) which is a portion of the Scotiabank principal pension plan assets and earned $7.2 million
(October 31, 2018 – $5.0 million) in fees.
Oversight and governance
The oversight responsibilities of the Audit and Conduct Review Committee (ACRC) with respect to related party transactions include reviewing policies and practices for
identifying transactions with related parties that may materially affect the Bank, and reviewing the procedures for ensuring compliance with the Bank Act for related party
transactions. The Bank Act requirements encompass a broader definition of related party transactions than is set out in IFRS. The Bank has various procedures in place to
ensure that related party information is identified and reported to the ACRC on a semi-annual basis. The ACRC is provided with detailed reports that reflect the Bank’s
compliance with its established procedures.
The Bank’s Internal Audit department carries out audit procedures as necessary to provide the ACRC with reasonable assurance that the Bank’s policies and procedures to
identify, authorize and report related party transactions are appropriately designed and operating effectively.
2019 Scotiabank Annual Report | 115
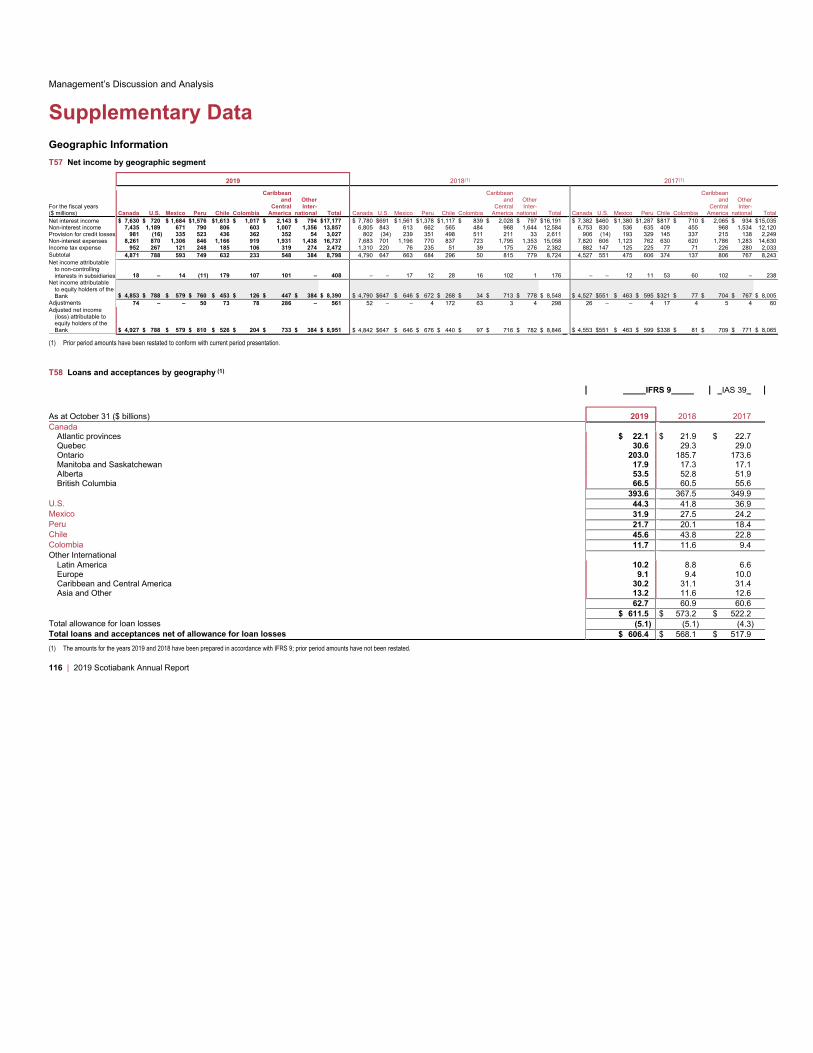
Management’s Discussion and Analysis
Supplementary Data
Geographic Information
T57 Net income by geographic segment
2019 2018(1) 2017(1)
For the fiscal years
($ millions) Canada U.S. Mexico Peru Chile Colombia
Caribbean
and
Central
America
Other
Inter-
national Total Canada U.S. Mexico Peru Chile Colombia
Caribbean
and
Central
America
Other
Inter-
national Total Canada U.S. Mexico Peru Chile Colombia
Caribbean
and
Central
America
Other
Inter-
national Total
Net interest income $ 7,630 $ 720 $ 1,684 $1,576 $1,613 $ 1,017 $ 2,143 $ 794 $17,177 $ 7,780 $691 $1,561 $1,378 $1,117 $ 839 $ 2,028 $ 797 $16,191 $ 7,382 $460 $1,380 $1,287 $817 $ 710 $ 2,065 $ 934 $15,035
Non-interest income 7,435 1,189 671 790 806 603 1,007 1,356 13,857 6,805 843 613 662 565 484 968 1,644 12,584 6,753 830 536 635 409 455 968 1,534 12,120
Provision for credit losses 981 (16) 335 523 436 362 352 54 3,027 802 (34) 239 351 498 511 211 33 2,611 906 (14) 193 329 145 337 215 138 2,249
Non-interest expenses 8,261 870 1,306 846 1,166 919 1,931 1,438 16,737 7,683 701 1,196 770 837 723 1,795 1,353 15,058 7,820 606 1,123 762 630 620 1,786 1,283 14,630
Income tax expense 952 267 121 248 185 106 319 274 2,472 1,310 220 76 235 51 39 175 276 2,382 882 147 125 225 77 71 226 280 2,033
Subtotal 4,871 788 593 749 632 233 548 384 8,798 4,790 647 663 684 296 50 815 779 8,724 4,527 551 475 606 374 137 806 767 8,243
Net income attributable
to non-controlling
interests in subsidiaries 18 – 14 (11) 179 107 101 – 408 – – 17 12 28 16 102 1 176 – – 12 11 53 60 102 – 238
Net income attributable
to equity holders of the
Bank $ 4,853 $ 788 $ 579 $ 760 $ 453 $ 126 $ 447 $ 384 $ 8,390 $ 4,790 $647 $ 646 $ 672 $ 268 $ 34 $ 713 $ 778 $ 8,548 $ 4,527 $551 $ 463 $ 595 $321 $ 77 $ 704 $ 767 $ 8,005
Adjustments 74 – – 50 73 78 286 – 561 52 – – 4 172 63 3 4 298 26 – – 4 17 4 5 4 60
Adjusted net income
(loss) attributable to
equity holders of the
Bank $ 4,927 $ 788 $ 579 $ 810 $ 526 $ 204 $ 733 $ 384 $ 8,951 $ 4,842 $647 $ 646 $ 676 $ 440 $ 97 $ 716 $ 782 $ 8,846 $ 4,553 $551 $ 463 $ 599 $338 $ 81 $ 709 $ 771 $ 8,065
(1) Prior period amounts have been restated to conform with current period presentation.
T58 Loans and acceptances by geography (1)
IFRS 9 IAS 39
As at October 31 ($ billions) 2019 2018 2017
Canada
Atlantic provinces $ 22.1 $ 21.9 $ 22.7
Quebec 30.6 29.3 29.0
Ontario 203.0 185.7 173.6
Manitoba and Saskatchewan 17.9 17.3 17.1
Alberta 53.5 52.8 51.9
British Columbia 66.5 60.5 55.6
393.6 367.5 349.9
U.S. 44.3 41.8 36.9
Mexico 31.9 27.5 24.2
Peru 21.7 20.1 18.4
Chile 45.6 43.8 22.8
Colombia 11.7 11.6 9.4
Other International
Latin America 10.2 8.8 6.6
Europe 9.1 9.4 10.0
Caribbean and Central America 30.2 31.1 31.4
Asia and Other 13.2 11.6 12.6
62.7 60.9 60.6
$ 611.5 $ 573.2 $ 522.2
Total allowance for loan losses (5.1) (5.1) (4.3)
Total loans and acceptances net of allowance for loan losses $ 606.4 $ 568.1 $ 517.9
(1) The amounts for the years 2019 and 2018 have been prepared in accordance with IFRS 9; prior period amounts have not been restated.
116 | 2019 Scotiabank Annual Report
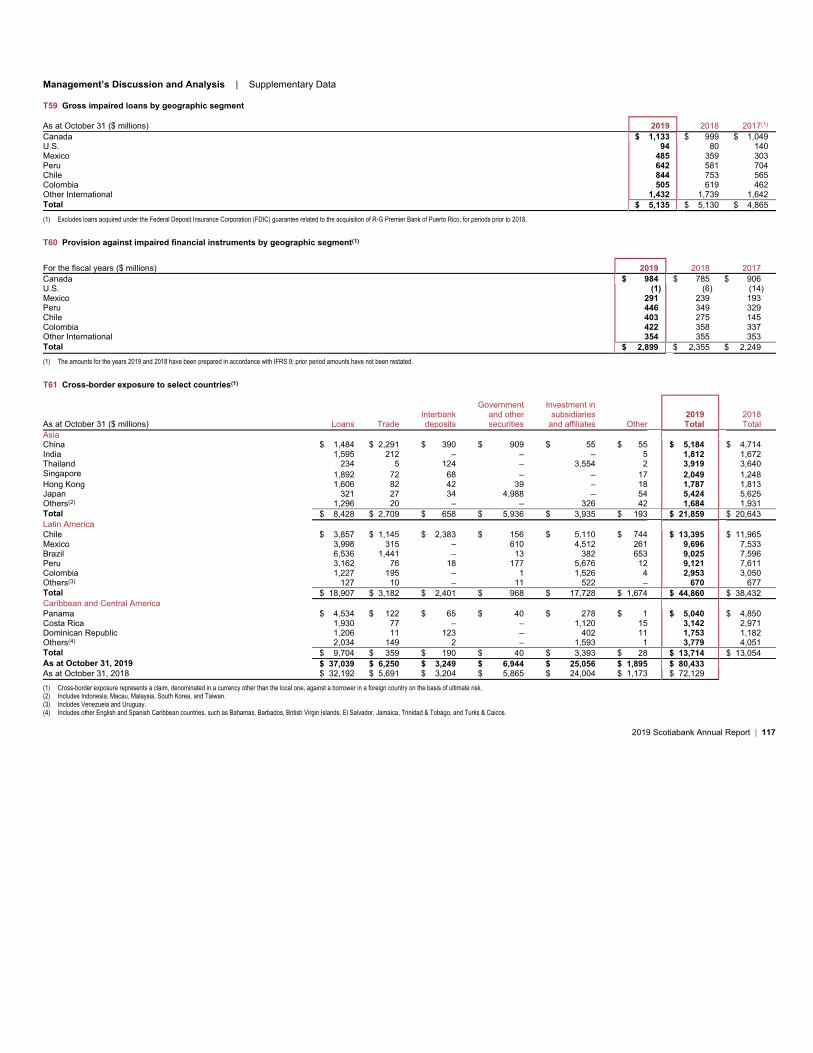
Management’s Discussion and Analysis | Supplementary Data
T59 Gross impaired loans by geographic segment
As at October 31 ($ millions) 2019 2018 2017(1)
Canada $ 1,133 $ 999 $ 1,049
U.S. 94 80 140
Mexico 485 359 303
Peru 642 581 704
Chile 844 753 565
Colombia 505 619 462
Other International 1,432 1,739 1,642
Total $ 5,135 $ 5,130 $ 4,865
(1) Excludes loans acquired under the Federal Deposit Insurance Corporation (FDIC) guarantee related to the acquisition of R-G Premier Bank of Puerto Rico, for periods prior to 2018.
T60 Provision against impaired financial instruments by geographic segment(1)
For the fiscal years ($ millions) 2019 2018 2017
Canada $ 984 $ 785 $ 906
U.S. (1) (6) (14)
Mexico 291 239 193
Peru 446 349 329
Chile 403 275 145
Colombia 422 358 337
Other International 354 355 353
Total $ 2,899 $ 2,355 $ 2,249
(1) The amounts for the years 2019 and 2018 have been prepared in accordance with IFRS 9; prior period amounts have not been restated.
T61 Cross-border exposure to select countries(1)
As at October 31 ($ millions) Loans Trade
Interbank
deposits
Government
and other
securities
Investment in
subsidiaries
and affiliates Other
2019
Total
2018
Total
Asia
China $ 1,484 $ 2,291 $ 390 $ 909 $ 55 $ 55 $ 5,184 $ 4,714
India 1,595 212 – – – 5 1,812 1,672
Thailand 234 5 124 – 3,554 2 3,919 3,640
Singapore 1,892 72 68 – – 17 2,049 1,248
Hong Kong 1,606 82 42 39 – 18 1,787 1,813
Japan 321 27 34 4,988 – 54 5,424 5,625
Others(2) 1,296 20 – – 326 42 1,684 1,931
Total $ 8,428 $ 2,709 $ 658 $ 5,936 $ 3,935 $ 193 $ 21,859 $ 20,643
Latin America
Chile $ 3,857 $ 1,145 $ 2,383 $ 156 $ 5,110 $ 744 $ 13,395 $ 11,965
Mexico 3,998 315 – 610 4,512 261 9,696 7,533
Brazil 6,536 1,441 – 13 382 653 9,025 7,596
Peru 3,162 76 18 177 5,676 12 9,121 7,611
Colombia 1,227 195 – 1 1,526 4 2,953 3,050
Others(3) 127 10 – 11 522 – 670 677
Total $ 18,907 $ 3,182 $ 2,401 $ 968 $ 17,728 $ 1,674 $ 44,860 $ 38,432
Caribbean and Central America
Panama $ 4,534 $ 122 $ 65 $ 40 $ 278 $ 1 $ 5,040 $ 4,850
Costa Rica 1,930 77 – – 1,120 15 3,142 2,971
Dominican Republic 1,206 11 123 – 402 11 1,753 1,182
Others(4) 2,034 149 2 – 1,593 1 3,779 4,051
Total $ 9,704 $ 359 $ 190 $ 40 $ 3,393 $ 28 $ 13,714 $ 13,054
As at October 31, 2019 $ 37,039 $ 6,250 $ 3,249 $ 6,944 $ 25,056 $ 1,895 $ 80,433
As at October 31, 2018 $ 32,192 $ 5,691 $ 3,204 $ 5,865 $ 24,004 $ 1,173 $ 72,129
(1) Cross-border exposure represents a claim, denominated in a currency other than the local one, against a borrower in a foreign country on the basis of ultimate risk.
(2) Includes Indonesia, Macau, Malaysia, South Korea, and Taiwan.
(3) Includes Venezuela and Uruguay.
(4) Includes other English and Spanish Caribbean countries, such as Bahamas, Barbados, British Virgin Islands, El Salvador, Jamaica, Trinidad & Tobago, and Turks & Caicos.
2019 Scotiabank Annual Report | 117

Management’s Discussion and Analysis
Credit Risk
T62 Loans and acceptances by type of borrower(1)
As at October 31 ($ billions) 2019 2018 2017
Residential mortgages $ 268.2 $ 253.4 $ 236.9
Personal loans 98.6 96.0 89.2
Credit cards 17.8 16.5 14.1
Personal $ 384.6 $ 365.9 $ 340.2
Financial services
Non-bank $ 28.8 $ 24.6 $ 20.5
Bank(2) 5.2 4.5 3.8
Wholesale and retail 27.6 25.1 21.1
Real estate and construction 32.4 29.2 24.6
Energy(3) 16.6 14.8 14.5
Transportation 9.5 9.3 8.2
Automotive 14.0 14.7 13.0
Agriculture 13.3 11.5 10.2
Hospitality and leisure 4.4 4.0 3.5
Mining 6.8 5.5 4.9
Metals 2.9 3.0 2.6
Utilities 10.8 9.7 8.1
Health care 6.1 5.4 5.6
Technology and media 13.4 12.3 9.6
Chemicals(3) 2.4 1.9 2.1
Food and beverage 8.5 7.9 6.3
Forest products 3.1 1.9 1.7
Other(4) 16.0 16.9 17.0
Sovereign(5) 5.1 5.1 4.7
Business and government $ 226.9 $ 207.3 $ 182.0
$ 611.5 $ 573.2 $ 522.2
Total allowance for loan losses (5.1) (5.1) (4.3)
Total loans and acceptances net of allowance for loan losses $ 606.4 $ 568.1 $ 517.9
(1) The amounts for the years ended October 31, 2019 and October 31, 2018 have been prepared in accordance with IFRS 9; prior year amounts have not been restated.
(2) Deposit taking institutions and securities firms.
(3) Prior periods have been restated to conform to the current presentation.
(4) Other related to $1.1 in financing products, $2.8 in services and $3.4 in wealth management (2018 – $2.3, $2.6, and $2.7 respectively).
(5) Includes central banks, regional and local governments, and supra-national agencies.
T63 Off-balance sheet credit instruments
As at October 31 ($ billions) 2019 2018 2017
Commitments to extend credit(1) $ 211.9 $ 197.4 $ 185.7
Standby letters of credit and letters of guarantee 35.6 35.4 35.5
Securities lending, securities purchase commitments and other 52.2 53.7 42.0
Total $ 299.7 $ 286.5 $ 263.2
(1) Excludes commitments which are unconditionally cancellable at the Bank’s discretion at any time.
118 | 2019 Scotiabank Annual Report
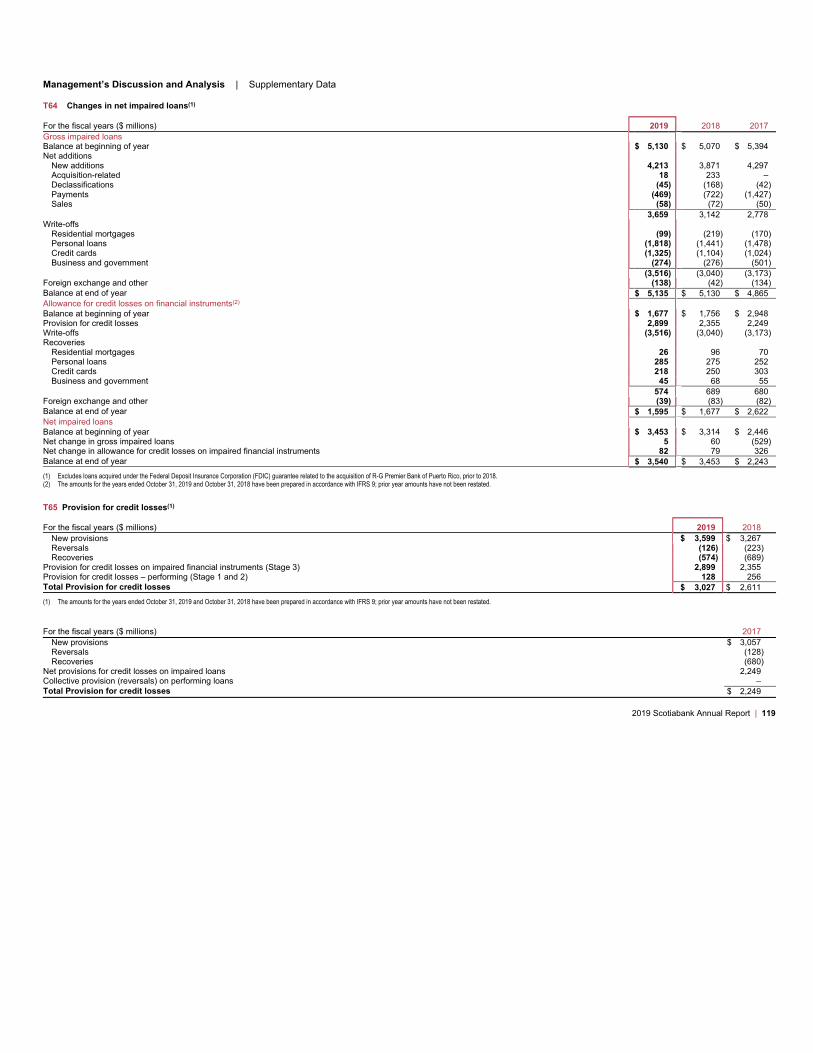
Management’s Discussion and Analysis | Supplementary Data
T64 Changes in net impaired loans(1)
For the fiscal years ($ millions) 2019 2018 2017
Gross impaired loans
Balance at beginning of year $ 5,130 $ 5,070 $ 5,394
Net additions
New additions 4,213 3,871 4,297
Acquisition-related 18 233 –
Declassifications (45) (168) (42)
Payments (469) (722) (1,427)
Sales (58) (72) (50)
3,659 3,142 2,778
Write-offs
Residential mortgages (99) (219) (170)
Personal loans (1,818) (1,441) (1,478)
Credit cards (1,325) (1,104) (1,024)
Business and government (274) (276) (501)
(3,516) (3,040) (3,173)
Foreign exchange and other (138) (42) (134)
Balance at end of year $ 5,135 $ 5,130 $ 4,865
Allowance for credit losses on financial instruments(2)
Balance at beginning of year $ 1,677 $ 1,756 $ 2,948
Provision for credit losses 2,899 2,355 2,249
Write-offs (3,516) (3,040) (3,173)
Recoveries
Residential mortgages 26 96 70
Personal loans 285 275 252
Credit cards 218 250 303
Business and government 45 68 55
574 689 680
Foreign exchange and other (39) (83) (82)
Balance at end of year $ 1,595 $ 1,677 $ 2,622
Net impaired loans
Balance at beginning of year $ 3,453 $ 3,314 $ 2,446
Net change in gross impaired loans 5 60 (529)
Net change in allowance for credit losses on impaired financial instruments 82 79 326
Balance at end of year $ 3,540 $ 3,453 $ 2,243
(1) Excludes loans acquired under the Federal Deposit Insurance Corporation (FDIC) guarantee related to the acquisition of R-G Premier Bank of Puerto Rico, prior to 2018.
(2) The amounts for the years ended October 31, 2019 and October 31, 2018 have been prepared in accordance with IFRS 9; prior year amounts have not been restated.
T65 Provision for credit losses(1)
For the fiscal years ($ millions) 2019 2018
New provisions $ 3,599 $ 3,267
Reversals (126) (223)
Recoveries (574) (689)
Provision for credit losses on impaired financial instruments (Stage 3) 2,899 2,355
Provision for credit losses – performing (Stage 1 and 2) 128 256
Total Provision for credit losses $ 3,027 $ 2,611
(1) The amounts for the years ended October 31, 2019 and October 31, 2018 have been prepared in accordance with IFRS 9; prior year amounts have not been restated.
For the fiscal years ($ millions) 2017
New provisions $ 3,057
Reversals (128)
Recoveries (680)
Net provisions for credit losses on impaired loans 2,249
Collective provision (reversals) on performing loans –
Total Provision for credit losses $ 2,249
2019 Scotiabank Annual Report | 119
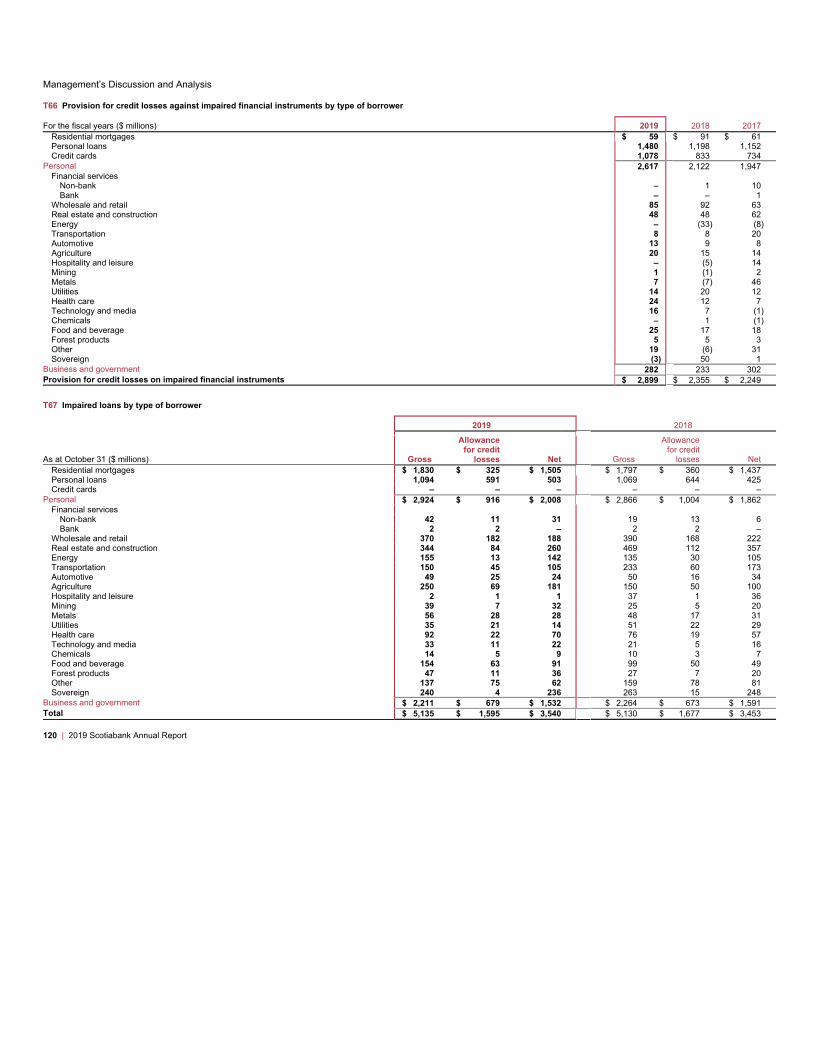
Management’s Discussion and Analysis
T66 Provision for credit losses against impaired financial instruments by type of borrower
For the fiscal years ($ millions) 2019 2018 2017
Residential mortgages $ 59 $ 91 $ 61
Personal loans 1,480 1,198 1,152
Credit cards 1,078 833 734
Personal 2,617 2,122 1,947
Financial services
Non-bank – 1 10
Bank – – 1
Wholesale and retail 85 92 63
Real estate and construction 48 48 62
Energy – (33) (8)
Transportation 8 8 20
Automotive 13 9 8
Agriculture 20 15 14
Hospitality and leisure – (5) 14
Mining 1 (1) 2
Metals 7 (7) 46
Utilities 14 20 12
Health care 24 12 7
Technology and media 16 7 (1)
Chemicals – 1 (1)
Food and beverage 25 17 18
Forest products 5 5 3
Other 19 (6) 31
Sovereign (3) 50 1
Business and government 282 233 302
Provision for credit losses on impaired financial instruments $ 2,899 $ 2,355 $ 2,249
T67 Impaired loans by type of borrower
2019 2018
As at October 31 ($ millions) Gross
Allowance
for credit
losses Net Gross
Allowance
for credit
losses Net
Residential mortgages $ 1,830 $ 325 $ 1,505 $ 1,797 $ 360 $ 1,437
Personal loans 1,094 591 503 1,069 644 425
Credit cards – – – – – –
Personal $ 2,924 $ 916 $ 2,008 $ 2,866 $ 1,004 $ 1,862
Financial services
Non-bank 42 11 31 19 13 6
Bank 2 2 – 2 2 –
Wholesale and retail 370 182 188 390 168 222
Real estate and construction 344 84 260 469 112 357
Energy 155 13 142 135 30 105
Transportation 150 45 105 233 60 173
Automotive 49 25 24 50 16 34
Agriculture 250 69 181 150 50 100
Hospitality and leisure 2 1 1 37 1 36
Mining 39 7 32 25 5 20
Metals 56 28 28 48 17 31
Utilities 35 21 14 51 22 29
Health care 92 22 70 76 19 57
Technology and media 33 11 22 21 5 16
Chemicals 14 5 9 10 3 7
Food and beverage 154 63 91 99 50 49
Forest products 47 11 36 27 7 20
Other 137 75 62 159 78 81
Sovereign 240 4 236 263 15 248
Business and government $ 2,211 $ 679 $ 1,532 $ 2,264 $ 673 $ 1,591
Total $ 5,135 $ 1,595 $ 3,540 $ 5,130 $ 1,677 $ 3,453
120 | 2019 Scotiabank Annual Report

Management’s Discussion and Analysis | Supplementary Data
T68 Total credit risk exposures by geography(1)(2)
2019 2018
Non-Retail
As at October 31 ($ millions) Drawn Undrawn
Other
exposures(3) Retail Total Total
Canada $ 112,412 $ 45,419 $ 33,232 $ 358,170 $ 549,233 $ 521,803
U.S. 95,268 37,529 43,239 – 176,036 178,139
Chile 23,476 1,309 4,077 24,659 53,521 53,152
Mexico 21,392 1,189 2,871 12,517 37,969 33,294
Peru 19,246 745 3,139 9,824 32,954 28,495
Colombia 5,382 397 637 7,257 13,673 13,649
Other International
Europe 23,050 6,656 16,179 – 45,885 42,613
Caribbean and Central America 17,841 1,849 1,476 17,470 38,636 38,302
Latin America (other) 10,478 999 239 686 12,402 11,368
Other 23,699 4,069 5,403 44 33,215 28,419
Total $ 352,244 $ 100,161 $ 110,492 $ 430,627 $ 993,524 $ 949,234
As at October 31, 2018 $ 341,493 $ 92,303 $ 105,232 $ 410,206 $ 949,234
(1) Geographic segmentation is based upon the location of the ultimate risk of the credit exposure. Includes all credit risk portfolios and excludes equities and other assets.
(2) Amounts represent exposure at default.
(3) Includes off-balance sheet lending instruments such as letters of credit, letters of guarantee, derivatives, securitization and repo-style transactions after collateral.
T69 AIRB credit risk exposures by maturity(1)(2)
2019 2018
Residual maturity as at October 31 ($ millions) Drawn Undrawn
Other
exposures(3) Total Total
Non-retail
Less than 1 year $ 144,421 $ 30,058 $ 65,738 $ 240,217 $ 235,630
One to 5 years 122,302 63,091 27,516 212,909 208,800
Over 5 years 23,960 3,142 7,205 34,307 17,618
Total non-retail $ 290,683 $ 96,291 $ 100,459 $ 487,433 $ 462,048
Retail
Less than 1 year $ 40,732 $ 21,004 $ – $ 61,736 $ 50,941
One to 5 years 192,344 – – 192,344 188,922
Over 5 years 15,488 – – 15,488 15,259
Revolving credits(4)39,084 29,839 – 68,923 68,467
Total retail $ 287,648 $ 50,843 $ – $ 338,491 $ 323,589
Total $ 578,331 $ 147,134 $ 100,459 $ 825,924 $ 785,637
As at October 31, 2018 $ 549,472 $ 134,884 $ 101,281 $ 785,637
(1) Remaining term to maturity of the credit exposure. Includes all credit risk portfolios and excludes equity securities and other assets.
(2) Exposure at default, before credit risk mitigation.
(3) Off-balance sheet lending instruments, such as letters of credit, letters of guarantee, securitization, derivatives and repo-style transactions after collateral.
(4) Credit cards and lines of credit with unspecified maturity.
2019 Scotiabank Annual Report | 121
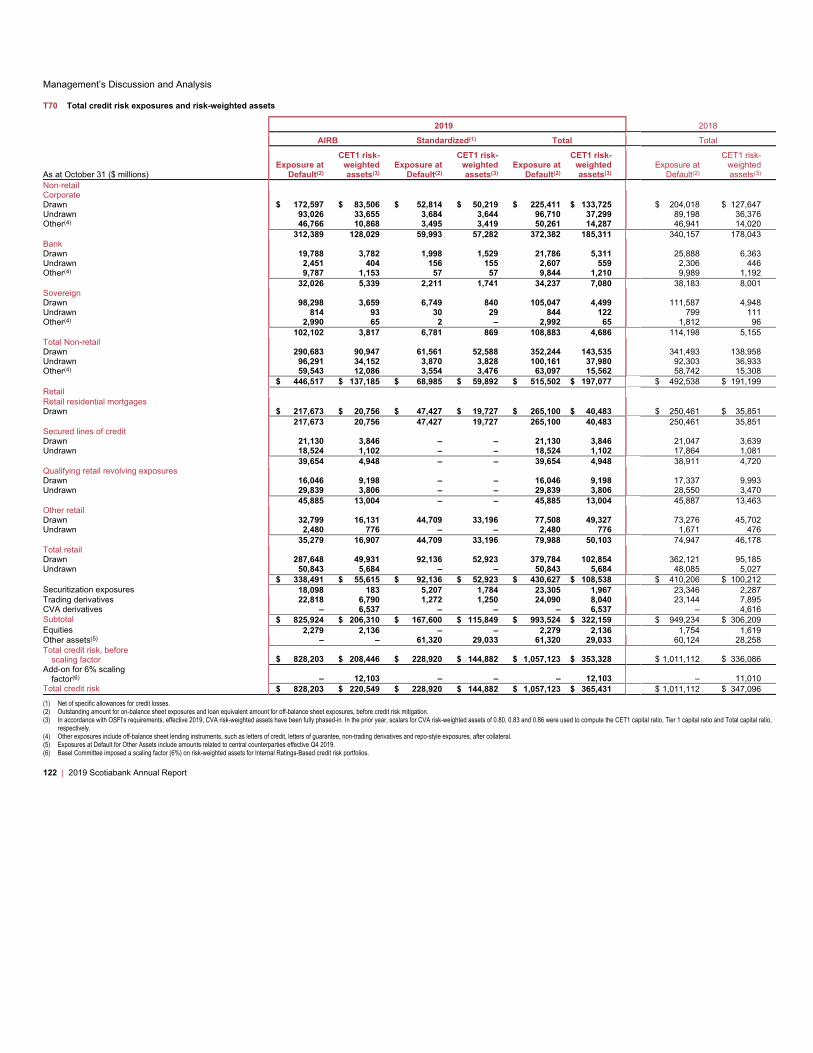
Management’s Discussion and Analysis
T70 Total credit risk exposures and risk-weighted assets
2019 2018
AIRB Standardized(1) Total Total
As at October 31 ($ millions)
Exposure at
Default(2)
CET1 risk-
weighted
assets(3)
Exposure at
Default(2)
CET1 risk-
weighted
assets(3)
Exposure at
Default(2)
CET1 risk-
weighted
assets(3)
Exposure at
Default(2)
CET1 risk-
weighted
assets(3)
Non-retail
Corporate
Drawn $ 172,597 $ 83,506 $ 52,814 $ 50,219 $ 225,411 $ 133,725 $ 204,018 $ 127,647
Undrawn 93,026 33,655 3,684 3,644 96,710 37,299 89,198 36,376
Other(4) 46,766 10,868 3,495 3,419 50,261 14,287 46,941 14,020
312,389 128,029 59,993 57,282 372,382 185,311 340,157 178,043
Bank
Drawn 19,788 3,782 1,998 1,529 21,786 5,311 25,888 6,363
Undrawn 2,451 404 156 155 2,607 559 2,306 446
Other(4) 9,787 1,153 57 57 9,844 1,210 9,989 1,192
32,026 5,339 2,211 1,741 34,237 7,080 38,183 8,001
Sovereign
Drawn 98,298 3,659 6,749 840 105,047 4,499 111,587 4,948
Undrawn 814 93 30 29 844 122 799 111
Other(4) 2,990 65 2 – 2,992 65 1,812 96
102,102 3,817 6,781 869 108,883 4,686 114,198 5,155
Total Non-retail
Drawn 290,683 90,947 61,561 52,588 352,244 143,535 341,493 138,958
Undrawn 96,291 34,152 3,870 3,828 100,161 37,980 92,303 36,933
Other(4) 59,543 12,086 3,554 3,476 63,097 15,562 58,742 15,308
$ 446,517 $ 137,185 $ 68,985 $ 59,892 $ 515,502 $ 197,077 $ 492,538 $ 191,199
Retail
Retail residential mortgages
Drawn $ 217,673 $ 20,756 $ 47,427 $ 19,727 $ 265,100 $ 40,483 $ 250,461 $ 35,851
217,673 20,756 47,427 19,727 265,100 40,483 250,461 35,851
Secured lines of credit
Drawn 21,130 3,846 – – 21,130 3,846 21,047 3,639
Undrawn 18,524 1,102 – – 18,524 1,102 17,864 1,081
39,654 4,948 – – 39,654 4,948 38,911 4,720
Qualifying retail revolving exposures
Drawn 16,046 9,198 – – 16,046 9,198 17,337 9,993
Undrawn 29,839 3,806 – – 29,839 3,806 28,550 3,470
45,885 13,004 – – 45,885 13,004 45,887 13,463
Other retail
Drawn 32,799 16,131 44,709 33,196 77,508 49,327 73,276 45,702
Undrawn 2,480 776 – – 2,480 776 1,671 476
35,279 16,907 44,709 33,196 79,988 50,103 74,947 46,178
Total retail
Drawn 287,648 49,931 92,136 52,923 379,784 102,854 362,121 95,185
Undrawn 50,843 5,684 – – 50,843 5,684 48,085 5,027
$ 338,491 $ 55,615 $ 92,136 $ 52,923 $ 430,627 $ 108,538 $ 410,206 $ 100,212
Securitization exposures 18,098 183 5,207 1,784 23,305 1,967 23,346 2,287
Trading derivatives 22,818 6,790 1,272 1,250 24,090 8,040 23,144 7,895
CVA derivatives – 6,537 – – – 6,537 – 4,616
Subtotal $ 825,924 $ 206,310 $ 167,600 $ 115,849 $ 993,524 $ 322,159 $ 949,234 $ 306,209
Equities 2,279 2,136 – – 2,279 2,136 1,754 1,619
Other assets(5) – – 61,320 29,033 61,320 29,033 60,124 28,258
Total credit risk, before
scaling factor $ 828,203 $ 208,446 $ 228,920 $ 144,882 $ 1,057,123 $ 353,328 $ 1,011,112 $ 336,086
Add-on for 6% scaling
factor(6) – 12,103 – – – 12,103 – 11,010
Total credit risk $ 828,203 $ 220,549 $ 228,920 $ 144,882 $ 1,057,123 $ 365,431 $ 1,011,112 $ 347,096
(1) Net of specific allowances for credit losses.
(2) Outstanding amount for on-balance sheet exposures and loan equivalent amount for off-balance sheet exposures, before credit risk mitigation.
(3) In accordance with OSFI’s requirements, effective 2019, CVA risk-weighted assets have been fully phased-in. In the prior year, scalars for CVA risk-weighted assets of 0.80, 0.83 and 0.86 were used to compute the CET1 capital ratio, Tier 1 capital ratio and Total capital ratio,
respectively.
(4) Other exposures include off-balance sheet lending instruments, such as letters of credit, letters of guarantee, non-trading derivatives and repo-style exposures, after collateral.
(5) Exposures at Default for Other Assets include amounts related to central counterparties effective Q4 2019.
(6) Basel Committee imposed a scaling factor (6%) on risk-weighted assets for Internal Ratings-Based credit risk portfolios.
122 | 2019 Scotiabank Annual Report
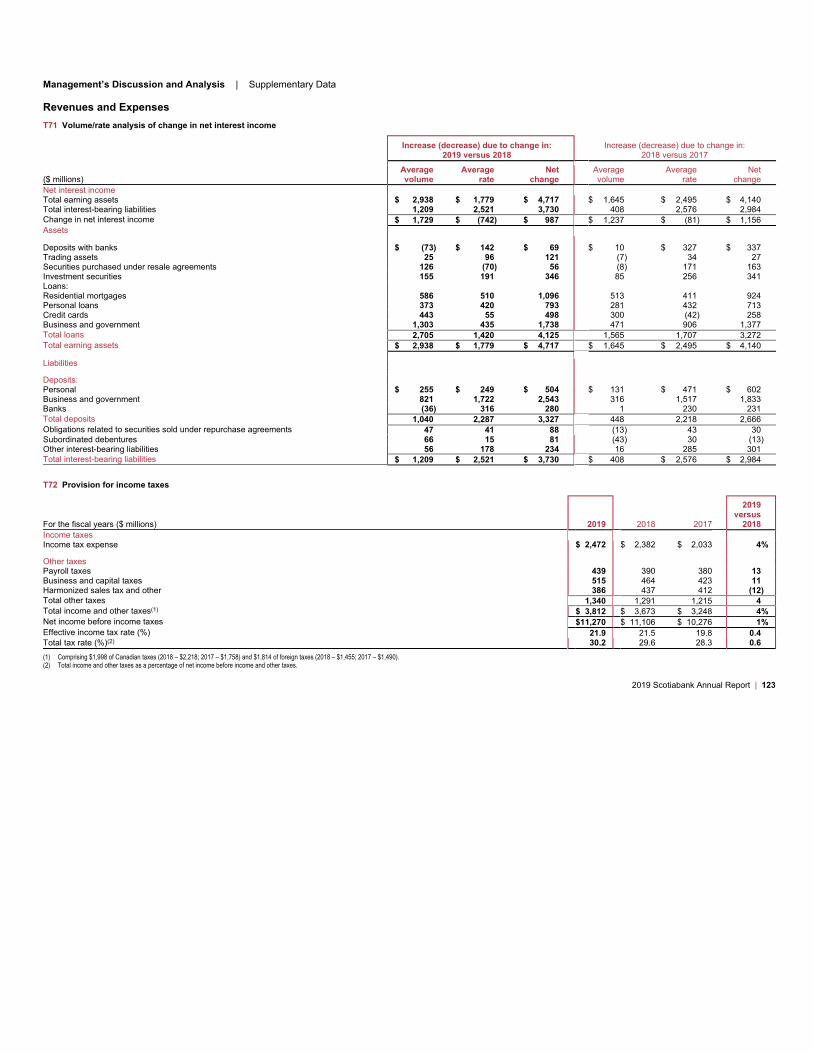
Management’s Discussion and Analysis | Supplementary Data
Revenues and Expenses
T71 Volume/rate analysis of change in net interest income
Increase (decrease) due to change in:
2019 versus 2018
Increase (decrease) due to change in:
2018 versus 2017
($ millions)
Average
volume
Average
rate
Net
change
Average
volume
Average
rate
Net
change
Net interest income
Total earning assets $ 2,938 $ 1,779 $ 4,717 $ 1,645 $ 2,495 $ 4,140
Total interest-bearing liabilities 1,209 2,521 3,730 408 2,576 2,984
Change in net interest income $ 1,729 $ (742) $ 987 $ 1,237 $ (81) $ 1,156
Assets
Deposits with banks $ (73) $ 142 $ 69 $ 10 $ 327 $ 337
Trading assets 25 96 121 (7) 34 27
Securities purchased under resale agreements 126 (70) 56 (8) 171 163
Investment securities 155 191 346 85 256 341
Loans:
Residential mortgages 586 510 1,096 513 411 924
Personal loans 373 420 793 281 432 713
Credit cards 443 55 498 300 (42) 258
Business and government 1,303 435 1,738 471 906 1,377
Total loans 2,705 1,420 4,125 1,565 1,707 3,272
Total earning assets $ 2,938 $ 1,779 $ 4,717 $ 1,645 $ 2,495 $ 4,140
Liabilities
Deposits:
Personal $ 255 $ 249 $ 504 $ 131 $ 471 $ 602
Business and government 821 1,722 2,543 316 1,517 1,833
Banks (36) 316 280 1 230 231
Total deposits 1,040 2,287 3,327 448 2,218 2,666
Obligations related to securities sold under repurchase agreements 47 41 88 (13) 43 30
Subordinated debentures 66 15 81 (43) 30 (13)
Other interest-bearing liabilities 56 178 234 16 285 301
Total interest-bearing liabilities $ 1,209 $ 2,521 $ 3,730 $ 408 $ 2,576 $ 2,984
T72 Provision for income taxes
For the fiscal years ($ millions) 2019 2018 2017
2019
versus
2018
Income taxes
Income tax expense $ 2,472 $ 2,382 $ 2,033 4%
Other taxes
Payroll taxes 439 390 380 13
Business and capital taxes 515 464 423 11
Harmonized sales tax and other 386 437 412 (12)
Total other taxes 1,340 1,291 1,215 4
Total income and other taxes(1)$ 3,812 $ 3,673 $ 3,248 4%
Net income before income taxes $11,270 $ 11,106 $ 10,276 1%
Effective income tax rate (%) 21.9 21.5 19.8 0.4
Total tax rate (%)(2) 30.2 29.6 28.3 0.6
(1) Comprising $1,998 of Canadian taxes (2018 – $2,218; 2017 – $1,758) and $1,814 of foreign taxes (2018 – $1,455; 2017 – $1,490).
(2) Total income and other taxes as a percentage of net income before income and other taxes.
2019 Scotiabank Annual Report | 123
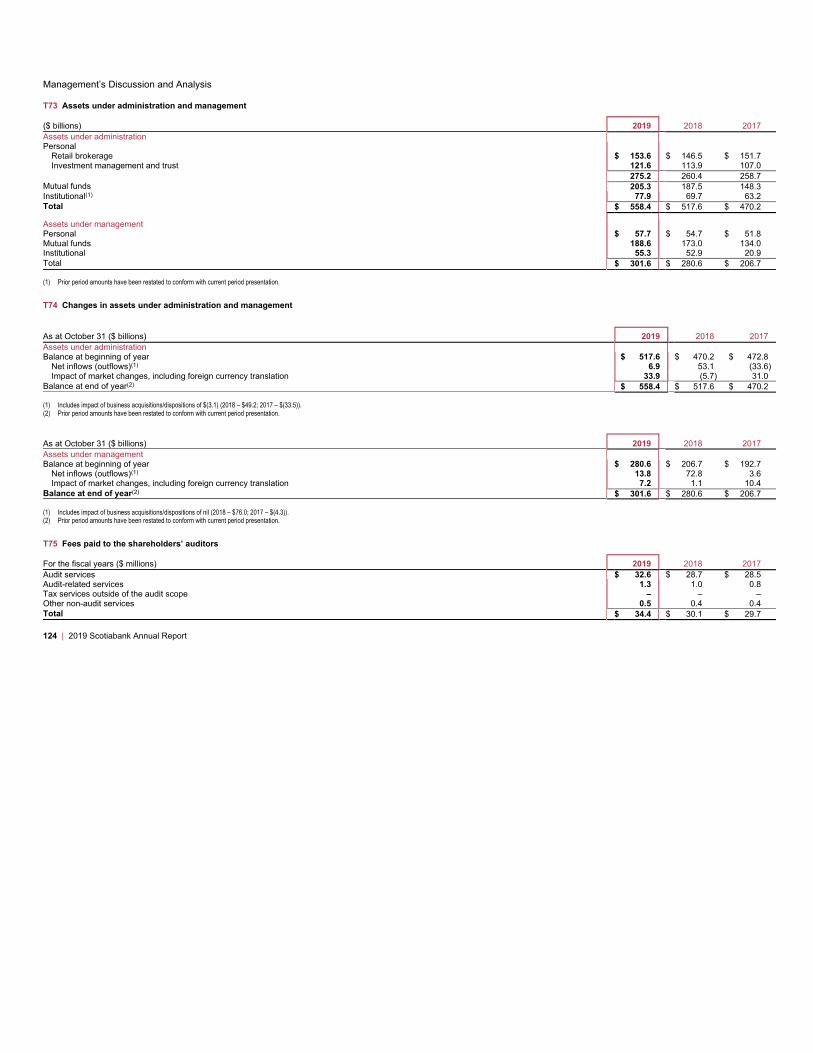
Management’s Discussion and Analysis
T73 Assets under administration and management
($ billions) 2019 2018 2017
Assets under administration
Personal
Retail brokerage $ 153.6 $ 146.5 $ 151.7
Investment management and trust 121.6 113.9 107.0
275.2 260.4 258.7
Mutual funds 205.3 187.5 148.3
Institutional(1) 77.9 69.7 63.2
Total $ 558.4 $ 517.6 $ 470.2
Assets under management
Personal $ 57.7 $ 54.7 $ 51.8
Mutual funds 188.6 173.0 134.0
Institutional 55.3 52.9 20.9
Total $ 301.6 $ 280.6 $ 206.7
(1) Prior period amounts have been restated to conform with current period presentation.
T74 Changes in assets under administration and management
As at October 31 ($ billions) 2019 2018 2017
Assets under administration
Balance at beginning of year $ 517.6 $ 470.2 $ 472.8
Net inflows (outflows)(1) 6.9 53.1 (33.6)
Impact of market changes, including foreign currency translation 33.9 (5.7) 31.0
Balance at end of year(2)$ 558.4 $ 517.6 $ 470.2
(1) Includes impact of business acquisitions/dispositions of $(3.1) (2018 – $49.2; 2017 – $(33.5)).
(2) Prior period amounts have been restated to conform with current period presentation.
As at October 31 ($ billions) 2019 2018 2017
Assets under management
Balance at beginning of year $ 280.6 $ 206.7 $ 192.7
Net inflows (outflows)(1) 13.8 72.8 3.6
Impact of market changes, including foreign currency translation 7.2 1.1 10.4
Balance at end of year(2)$ 301.6 $ 280.6 $ 206.7
(1) Includes impact of business acquisitions/dispositions of nil (2018 – $76.0; 2017 – $(4.3)).
(2) Prior period amounts have been restated to conform with current period presentation.
T75 Fees paid to the shareholders’ auditors
For the fiscal years ($ millions) 2019 2018 2017
Audit services $ 32.6 $ 28.7 $ 28.5
Audit-related services 1.3 1.0 0.8
Tax services outside of the audit scope – – –
Other non-audit services 0.5 0.4 0.4
Total $ 34.4 $ 30.1 $ 29.7
124 | 2019 Scotiabank Annual Report
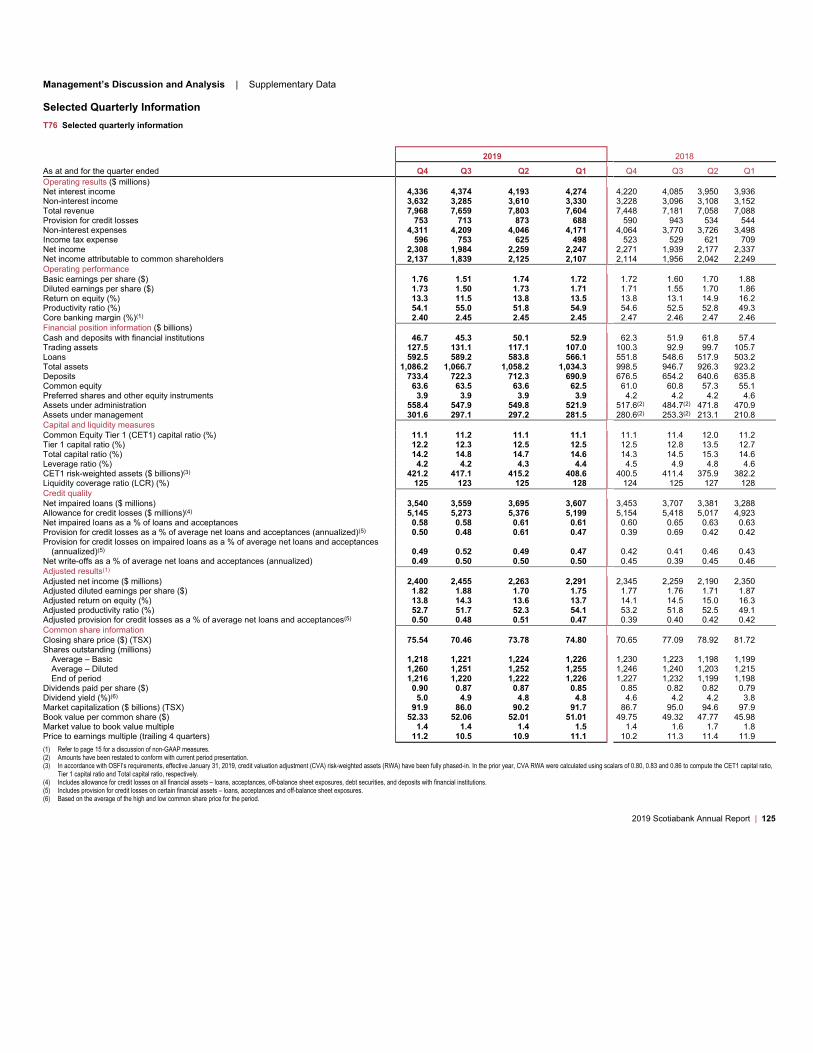
Management’s Discussion and Analysis | Supplementary Data
Selected Quarterly Information
T76 Selected quarterly information
2019 2018
As at and for the quarter ended Q4 Q3 Q2 Q1 Q4 Q3 Q2 Q1
Operating results ($ millions)
Net interest income 4,336 4,374 4,193 4,274 4,220 4,085 3,950 3,936
Non-interest income 3,632 3,285 3,610 3,330 3,228 3,096 3,108 3,152
Total revenue 7,968 7,659 7,803 7,604 7,448 7,181 7,058 7,088
Provision for credit losses 753 713 873 688 590 943 534 544
Non-interest expenses 4,311 4,209 4,046 4,171 4,064 3,770 3,726 3,498
Income tax expense 596 753 625 498 523 529 621 709
Net income 2,308 1,984 2,259 2,247 2,271 1,939 2,177 2,337
Net income attributable to common shareholders 2,137 1,839 2,125 2,107 2,114 1,956 2,042 2,249
Operating performance
Basic earnings per share ($) 1.76 1.51 1.74 1.72 1.72 1.60 1.70 1.88
Diluted earnings per share ($) 1.73 1.50 1.73 1.71 1.71 1.55 1.70 1.86
Return on equity (%) 13.3 11.5 13.8 13.5 13.8 13.1 14.9 16.2
Productivity ratio (%) 54.1 55.0 51.8 54.9 54.6 52.5 52.8 49.3
Core banking margin (%)(1) 2.40 2.45 2.45 2.45 2.47 2.46 2.47 2.46
Financial position information ($ billions)
Cash and deposits with financial institutions 46.7 45.3 50.1 52.9 62.3 51.9 61.8 57.4
Trading assets 127.5 131.1 117.1 107.0 100.3 92.9 99.7 105.7
Loans 592.5 589.2 583.8 566.1 551.8 548.6 517.9 503.2
Total assets 1,086.2 1,066.7 1,058.2 1,034.3 998.5 946.7 926.3 923.2
Deposits 733.4 722.3 712.3 690.9 676.5 654.2 640.6 635.8
Common equity 63.6 63.5 63.6 62.5 61.0 60.8 57.3 55.1
Preferred shares and other equity instruments 3.9 3.9 3.9 3.9 4.2 4.2 4.2 4.6
Assets under administration 558.4 547.9 549.8 521.9 517.6(2) 484.7(2) 471.8 470.9
Assets under management 301.6 297.1 297.2 281.5 280.6(2) 253.3(2) 213.1 210.8
Capital and liquidity measures
Common Equity Tier 1 (CET1) capital ratio (%) 11.1 11.2 11.1 11.1 11.1 11.4 12.0 11.2
Tier 1 capital ratio (%) 12.2 12.3 12.5 12.5 12.5 12.8 13.5 12.7
Total capital ratio (%) 14.2 14.8 14.7 14.6 14.3 14.5 15.3 14.6
Leverage ratio (%) 4.2 4.2 4.3 4.4 4.5 4.9 4.8 4.6
CET1 risk-weighted assets ($ billions)(3) 421.2 417.1 415.2 408.6 400.5 411.4 375.9 382.2
Liquidity coverage ratio (LCR) (%) 125 123 125 128 124 125 127 128
Credit quality
Net impaired loans ($ millions) 3,540 3,559 3,695 3,607 3,453 3,707 3,381 3,288
Allowance for credit losses ($ millions)(4) 5,145 5,273 5,376 5,199 5,154 5,418 5,017 4,923
Net impaired loans as a % of loans and acceptances 0.58 0.58 0.61 0.61 0.60 0.65 0.63 0.63
Provision for credit losses as a % of average net loans and acceptances (annualized)(5) 0.50 0.48 0.61 0.47 0.39 0.69 0.42 0.42
Provision for credit losses on impaired loans as a % of average net loans and acceptances
(annualized)(5) 0.49 0.52 0.49 0.47 0.42 0.41 0.46 0.43
Net write-offs as a % of average net loans and acceptances (annualized) 0.49 0.50 0.50 0.50 0.45 0.39 0.45 0.46
Adjusted results(1)
Adjusted net income ($ millions) 2,400 2,455 2,263 2,291 2,345 2,259 2,190 2,350
Adjusted diluted earnings per share ($) 1.82 1.88 1.70 1.75 1.77 1.76 1.71 1.87
Adjusted return on equity (%) 13.8 14.3 13.6 13.7 14.1 14.5 15.0 16.3
Adjusted productivity ratio (%) 52.7 51.7 52.3 54.1 53.2 51.8 52.5 49.1
Adjusted provision for credit losses as a % of average net loans and acceptances(5) 0.50 0.48 0.51 0.47 0.39 0.40 0.42 0.42
Common share information
Closing share price ($) (TSX) 75.54 70.46 73.78 74.80 70.65 77.09 78.92 81.72
Shares outstanding (millions)
Average – Basic 1,218 1,221 1,224 1,226 1,230 1,223 1,198 1,199
Average – Diluted 1,260 1,251 1,252 1,255 1,246 1,240 1,203 1,215
End of period 1,216 1,220 1,222 1,226 1,227 1,232 1,199 1,198
Dividends paid per share ($) 0.90 0.87 0.87 0.85 0.85 0.82 0.82 0.79
Dividend yield (%)(6) 5.0 4.9 4.8 4.8 4.6 4.2 4.2 3.8
Market capitalization ($ billions) (TSX) 91.9 86.0 90.2 91.7 86.7 95.0 94.6 97.9
Book value per common share ($) 52.33 52.06 52.01 51.01 49.75 49.32 47.77 45.98
Market value to book value multiple 1.4 1.4 1.4 1.5 1.4 1.6 1.7 1.8
Price to earnings multiple (trailing 4 quarters) 11.2 10.5 10.9 11.1 10.2 11.3 11.4 11.9
(1) Refer to page 15 for a discussion of non-GAAP measures.
(2) Amounts have been restated to conform with current period presentation.
(3) In accordance with OSFI’s requirements, effective January 31, 2019, credit valuation adjustment (CVA) risk-weighted assets (RWA) have been fully phased-in. In the prior year, CVA RWA were calculated using scalars of 0.80, 0.83 and 0.86 to compute the CET1 capital ratio,
Tier 1 capital ratio and Total capital ratio, respectively.
(4) Includes allowance for credit losses on all financial assets – loans, acceptances, off-balance sheet exposures, debt securities, and deposits with financial institutions.
(5) Includes provision for credit losses on certain financial assets – loans, acceptances and off-balance sheet exposures.
(6) Based on the average of the high and low common share price for the period.
2019 Scotiabank Annual Report | 125
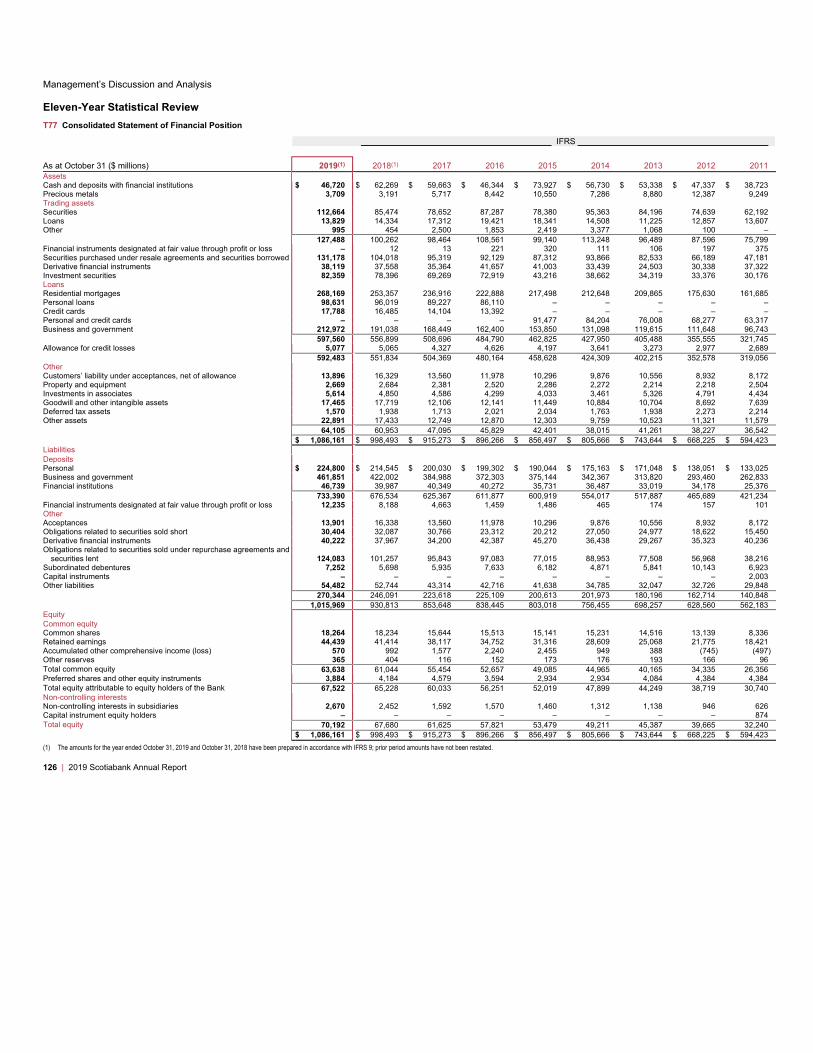
Management’s Discussion and Analysis
Eleven-Year Statistical Review
T77 Consolidated Statement of Financial Position
IFRS
As at October 31 ($ millions) 2019(1) 2018(1) 2017 2016 2015 2014 2013 2012 2011
Assets
Cash and deposits with financial institutions $ 46,720 $ 62,269 $ 59,663 $ 46,344 $ 73,927 $ 56,730 $ 53,338 $ 47,337 $ 38,723
Precious metals 3,709 3,191 5,717 8,442 10,550 7,286 8,880 12,387 9,249
Trading assets
Securities 112,664 85,474 78,652 87,287 78,380 95,363 84,196 74,639 62,192
Loans 13,829 14,334 17,312 19,421 18,341 14,508 11,225 12,857 13,607
Other 995 454 2,500 1,853 2,419 3,377 1,068 100 –
127,488 100,262 98,464 108,561 99,140 113,248 96,489 87,596 75,799
Financial instruments designated at fair value through profit or loss – 12 13 221 320 111 106 197 375
Securities purchased under resale agreements and securities borrowed 131,178 104,018 95,319 92,129 87,312 93,866 82,533 66,189 47,181
Derivative financial instruments 38,119 37,558 35,364 41,657 41,003 33,439 24,503 30,338 37,322
Investment securities 82,359 78,396 69,269 72,919 43,216 38,662 34,319 33,376 30,176
Loans
Residential mortgages 268,169 253,357 236,916 222,888 217,498 212,648 209,865 175,630 161,685
Personal loans 98,631 96,019 89,227 86,110 – – – – –
Credit cards 17,788 16,485 14,104 13,392 – – – – –
Personal and credit cards – – – – 91,477 84,204 76,008 68,277 63,317
Business and government 212,972 191,038 168,449 162,400 153,850 131,098 119,615 111,648 96,743
597,560 556,899 508,696 484,790 462,825 427,950 405,488 355,555 321,745
Allowance for credit losses 5,077 5,065 4,327 4,626 4,197 3,641 3,273 2,977 2,689
592,483 551,834 504,369 480,164 458,628 424,309 402,215 352,578 319,056
Other
Customers’ liability under acceptances, net of allowance 13,896 16,329 13,560 11,978 10,296 9,876 10,556 8,932 8,172
Property and equipment 2,669 2,684 2,381 2,520 2,286 2,272 2,214 2,218 2,504
Investments in associates 5,614 4,850 4,586 4,299 4,033 3,461 5,326 4,791 4,434
Goodwill and other intangible assets 17,465 17,719 12,106 12,141 11,449 10,884 10,704 8,692 7,639
Deferred tax assets 1,570 1,938 1,713 2,021 2,034 1,763 1,938 2,273 2,214
Other assets 22,891 17,433 12,749 12,870 12,303 9,759 10,523 11,321 11,579
64,105 60,953 47,095 45,829 42,401 38,015 41,261 38,227 36,542
$ 1,086,161 $ 998,493 $ 915,273 $ 896,266 $ 856,497 $ 805,666 $ 743,644 $ 668,225 $ 594,423
Liabilities
Deposits
Personal $ 224,800 $ 214,545 $ 200,030 $ 199,302 $ 190,044 $ 175,163 $ 171,048 $ 138,051 $ 133,025
Business and government 461,851 422,002 384,988 372,303 375,144 342,367 313,820 293,460 262,833
Financial institutions 46,739 39,987 40,349 40,272 35,731 36,487 33,019 34,178 25,376
733,390 676,534 625,367 611,877 600,919 554,017 517,887 465,689 421,234
Financial instruments designated at fair value through profit or loss 12,235 8,188 4,663 1,459 1,486 465 174 157 101
Other
Acceptances 13,901 16,338 13,560 11,978 10,296 9,876 10,556 8,932 8,172
Obligations related to securities sold short 30,404 32,087 30,766 23,312 20,212 27,050 24,977 18,622 15,450
Derivative financial instruments 40,222 37,967 34,200 42,387 45,270 36,438 29,267 35,323 40,236
Obligations related to securities sold under repurchase agreements and
securities lent 124,083 101,257 95,843 97,083 77,015 88,953 77,508 56,968 38,216
Subordinated debentures 7,252 5,698 5,935 7,633 6,182 4,871 5,841 10,143 6,923
Capital instruments – – – – – – – – 2,003
Other liabilities 54,482 52,744 43,314 42,716 41,638 34,785 32,047 32,726 29,848
270,344 246,091 223,618 225,109 200,613 201,973 180,196 162,714 140,848
1,015,969 930,813 853,648 838,445 803,018 756,455 698,257 628,560 562,183
Equity
Common equity
Common shares 18,264 18,234 15,644 15,513 15,141 15,231 14,516 13,139 8,336
Retained earnings 44,439 41,414 38,117 34,752 31,316 28,609 25,068 21,775 18,421
Accumulated other comprehensive income (loss) 570 992 1,577 2,240 2,455 949 388 (745) (497)
Other reserves 365 404 116 152 173 176 193 166 96
Total common equity 63,638 61,044 55,454 52,657 49,085 44,965 40,165 34,335 26,356
Preferred shares and other equity instruments 3,884 4,184 4,579 3,594 2,934 2,934 4,084 4,384 4,384
Total equity attributable to equity holders of the Bank 67,522 65,228 60,033 56,251 52,019 47,899 44,249 38,719 30,740
Non-controlling interests
Non-controlling interests in subsidiaries 2,670 2,452 1,592 1,570 1,460 1,312 1,138 946 626
Capital instrument equity holders – – – – – – – – 874
Total equity 70,192 67,680 61,625 57,821 53,479 49,211 45,387 39,665 32,240
$ 1,086,161 $ 998,493 $ 915,273 $ 896,266 $ 856,497 $ 805,666 $ 743,644 $ 668,225 $ 594,423
(1) The amounts for the year ended October 31, 2019 and October 31, 2018 have been prepared in accordance with IFRS 9; prior period amounts have not been restated.
126 | 2019 Scotiabank Annual Report
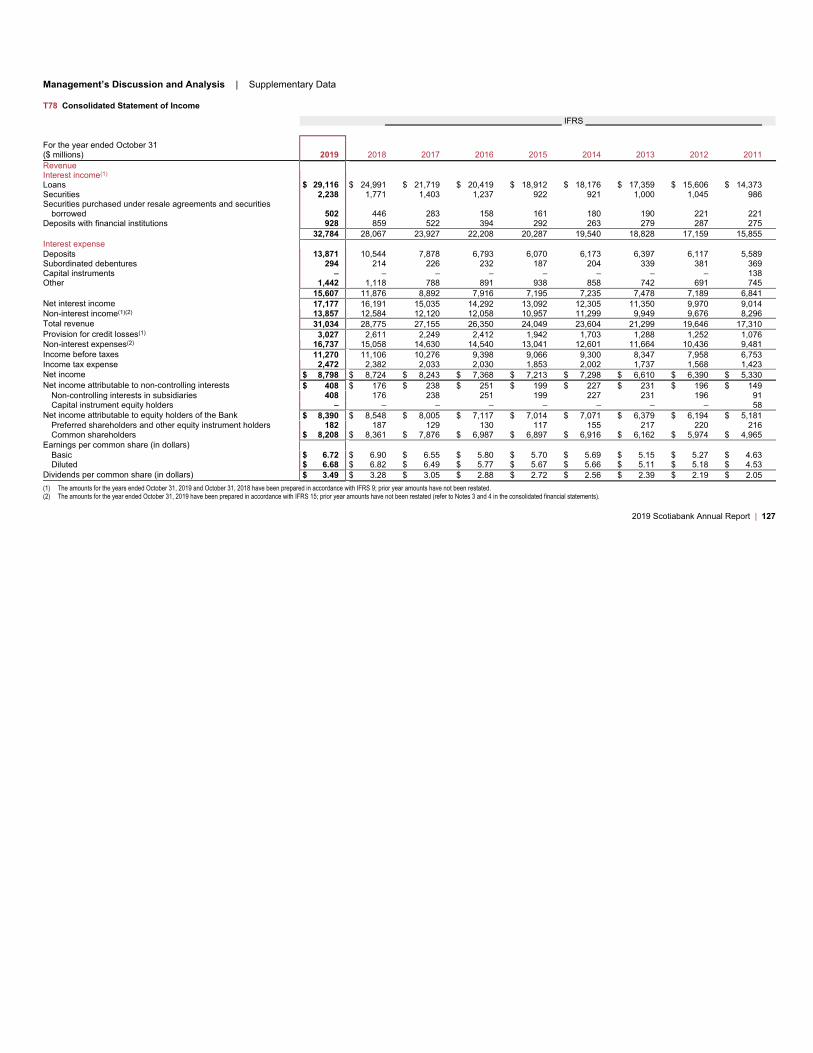
Management’s Discussion and Analysis | Supplementary Data
T78 Consolidated Statement of Income
IFRS
For the year ended October 31
($ millions) 2019 2018 2017 2016 2015 2014 2013 2012 2011
Revenue
Interest income(1)
Loans $ 29,116 $ 24,991 $ 21,719 $ 20,419 $ 18,912 $ 18,176 $ 17,359 $ 15,606 $ 14,373
Securities 2,238 1,771 1,403 1,237 922 921 1,000 1,045 986
Securities purchased under resale agreements and securities
borrowed 502 446 283 158 161 180 190 221 221
Deposits with financial institutions 928 859 522 394 292 263 279 287 275
32,784 28,067 23,927 22,208 20,287 19,540 18,828 17,159 15,855
Interest expense
Deposits 13,871 10,544 7,878 6,793 6,070 6,173 6,397 6,117 5,589
Subordinated debentures 294 214 226 232 187 204 339 381 369
Capital instruments – – – – – – – – 138
Other 1,442 1,118 788 891 938 858 742 691 745
15,607 11,876 8,892 7,916 7,195 7,235 7,478 7,189 6,841
Net interest income 17,177 16,191 15,035 14,292 13,092 12,305 11,350 9,970 9,014
Non-interest income(1)(2) 13,857 12,584 12,120 12,058 10,957 11,299 9,949 9,676 8,296
Total revenue 31,034 28,775 27,155 26,350 24,049 23,604 21,299 19,646 17,310
Provision for credit losses(1)3,027 2,611 2,249 2,412 1,942 1,703 1,288 1,252 1,076
Non-interest expenses(2) 16,737 15,058 14,630 14,540 13,041 12,601 11,664 10,436 9,481
Income before taxes 11,270 11,106 10,276 9,398 9,066 9,300 8,347 7,958 6,753
Income tax expense 2,472 2,382 2,033 2,030 1,853 2,002 1,737 1,568 1,423
Net income $ 8,798 $ 8,724 $ 8,243 $ 7,368 $ 7,213 $ 7,298 $ 6,610 $ 6,390 $ 5,330
Net income attributable to non-controlling interests $ 408 $ 176 $ 238 $ 251 $ 199 $ 227 $ 231 $ 196 $ 149
Non-controlling interests in subsidiaries 408 176 238 251 199 227 231 196 91
Capital instrument equity holders – – – – – – – – 58
Net income attributable to equity holders of the Bank $ 8,390 $ 8,548 $ 8,005 $ 7,117 $ 7,014 $ 7,071 $ 6,379 $ 6,194 $ 5,181
Preferred shareholders and other equity instrument holders 182 187 129 130 117 155 217 220 216
Common shareholders $ 8,208 $ 8,361 $ 7,876 $ 6,987 $ 6,897 $ 6,916 $ 6,162 $ 5,974 $ 4,965
Earnings per common share (in dollars)
Basic $ 6.72 $ 6.90 $ 6.55 $ 5.80 $ 5.70 $ 5.69 $ 5.15 $ 5.27 $ 4.63
Diluted $ 6.68 $ 6.82 $ 6.49 $ 5.77 $ 5.67 $ 5.66 $ 5.11 $ 5.18 $ 4.53
Dividends per common share (in dollars) $ 3.49 $ 3.28 $ 3.05 $ 2.88 $ 2.72 $ 2.56 $ 2.39 $ 2.19 $ 2.05
(1) The amounts for the years ended October 31, 2019 and October 31, 2018 have been prepared in accordance with IFRS 9; prior year amounts have not been restated.
(2) The amounts for the year ended October 31, 2019 have been prepared in accordance with IFRS 15; prior year amounts have not been restated (refer to Notes 3 and 4 in the consolidated financial statements).
2019 Scotiabank Annual Report | 127
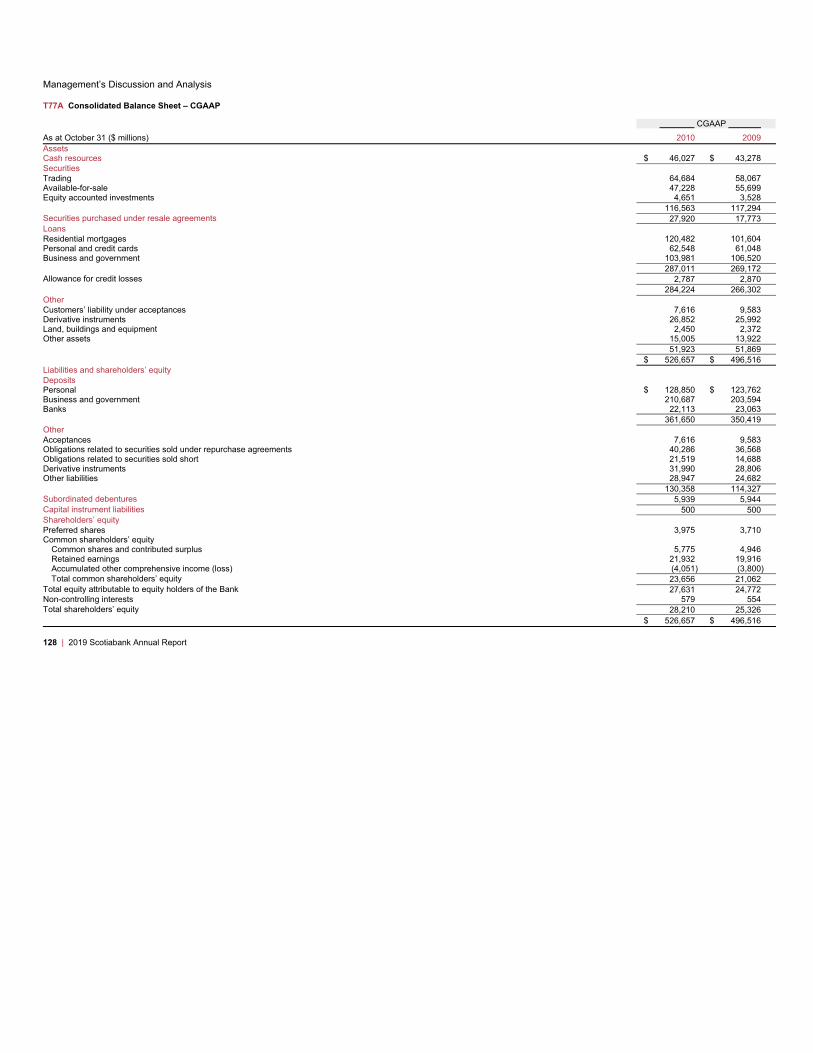
Management’s Discussion and Analysis
T77A Consolidated Balance Sheet – CGAAP
CGAAP
As at October 31 ($ millions) 2010 2009
Assets
Cash resources $ 46,027 $ 43,278
Securities
Trading 64,684 58,067
Available-for-sale 47,228 55,699
Equity accounted investments 4,651 3,528
116,563 117,294
Securities purchased under resale agreements 27,920 17,773
Loans
Residential mortgages 120,482 101,604
Personal and credit cards 62,548 61,048
Business and government 103,981 106,520
287,011 269,172
Allowance for credit losses 2,787 2,870
284,224 266,302
Other
Customers’ liability under acceptances 7,616 9,583
Derivative instruments 26,852 25,992
Land, buildings and equipment 2,450 2,372
Other assets 15,005 13,922
51,923 51,869
$ 526,657 $ 496,516
Liabilities and shareholders’ equity
Deposits
Personal $ 128,850 $ 123,762
Business and government 210,687 203,594
Banks 22,113 23,063
361,650 350,419
Other
Acceptances 7,616 9,583
Obligations related to securities sold under repurchase agreements 40,286 36,568
Obligations related to securities sold short 21,519 14,688
Derivative instruments 31,990 28,806
Other liabilities 28,947 24,682
130,358 114,327
Subordinated debentures 5,939 5,944
Capital instrument liabilities 500 500
Shareholders’ equity
Preferred shares 3,975 3,710
Common shareholders’ equity
Common shares and contributed surplus 5,775 4,946
Retained earnings 21,932 19,916
Accumulated other comprehensive income (loss) (4,051) (3,800)
Total common shareholders’ equity 23,656 21,062
Total equity attributable to equity holders of the Bank 27,631 24,772
Non-controlling interests 579 554
Total shareholders’ equity 28,210 25,326
$ 526,657 $ 496,516
128 | 2019 Scotiabank Annual Report
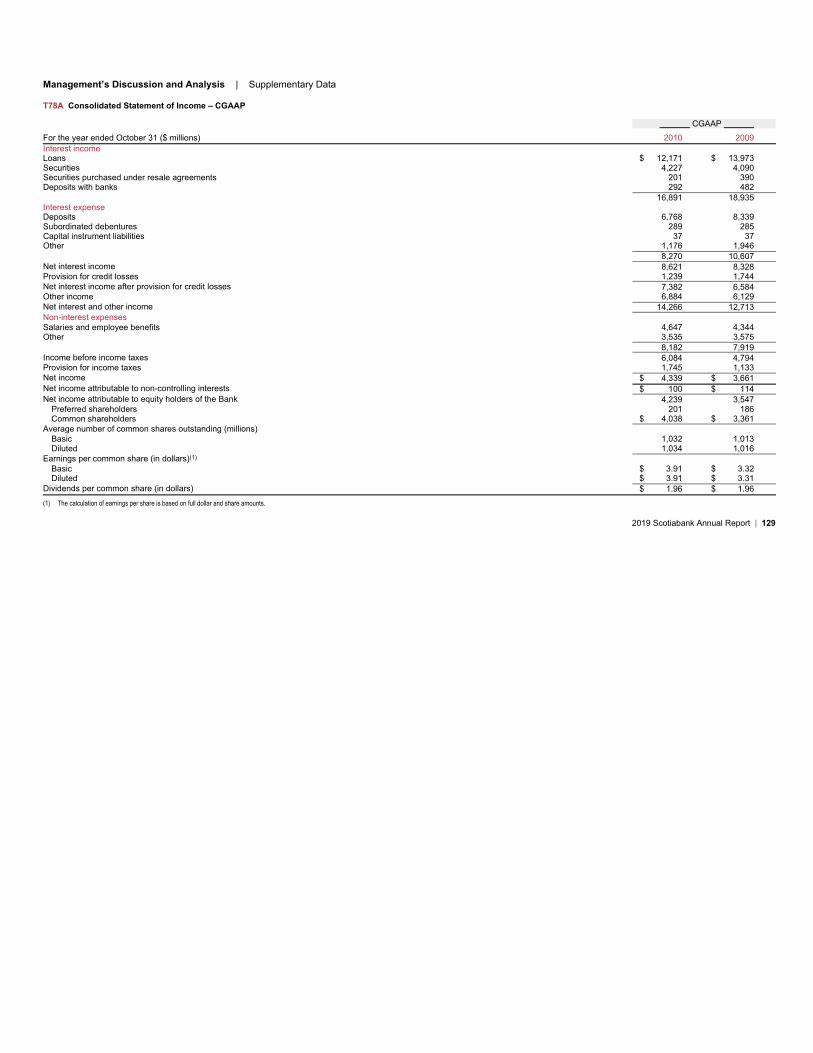
Management’s Discussion and Analysis | Supplementary Data
T78A Consolidated Statement of Income – CGAAP
CGAAP
For the year ended October 31 ($ millions) 2010 2009
Interest income
Loans $ 12,171 $ 13,973
Securities 4,227 4,090
Securities purchased under resale agreements 201 390
Deposits with banks 292 482
16,891 18,935
Interest expense
Deposits 6,768 8,339
Subordinated debentures 289 285
Capital instrument liabilities 37 37
Other 1,176 1,946
8,270 10,607
Net interest income 8,621 8,328
Provision for credit losses 1,239 1,744
Net interest income after provision for credit losses 7,382 6,584
Other income 6,884 6,129
Net interest and other income 14,266 12,713
Non-interest expenses
Salaries and employee benefits 4,647 4,344
Other 3,535 3,575
8,182 7,919
Income before income taxes 6,084 4,794
Provision for income taxes 1,745 1,133
Net income $ 4,339 $ 3,661
Net income attributable to non-controlling interests $ 100 $ 114
Net income attributable to equity holders of the Bank 4,239 3,547
Preferred shareholders 201 186
Common shareholders $ 4,038 $ 3,361
Average number of common shares outstanding (millions)
Basic 1,032 1,013
Diluted 1,034 1,016
Earnings per common share (in dollars)(1)
Basic $ 3.91 $ 3.32
Diluted $ 3.91 $ 3.31
Dividends per common share (in dollars) $ 1.96 $ 1.96
(1) The calculation of earnings per share is based on full dollar and share amounts.
2019 Scotiabank Annual Report | 129
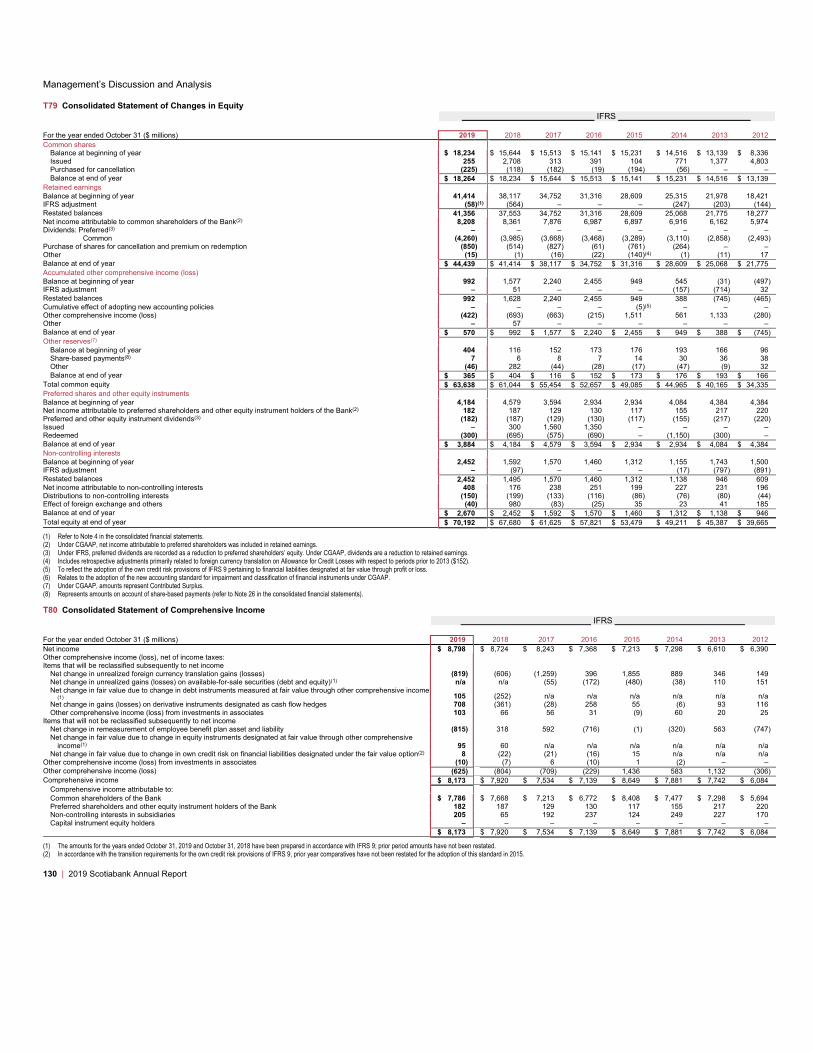
Management’s Discussion and Analysis
T79 Consolidated Statement of Changes in Equity
IFRS
For the year ended October 31 ($ millions) 2019 2018 2017 2016 2015 2014 2013 2012
Common shares
Balance at beginning of year $ 18,234 $ 15,644 $ 15,513 $ 15,141 $ 15,231 $ 14,516 $ 13,139 $ 8,336
Issued 255 2,708 313 391 104 771 1,377 4,803
Purchased for cancellation (225) (118) (182) (19) (194) (56) – –
Balance at end of year $ 18,264 $ 18,234 $ 15,644 $ 15,513 $ 15,141 $ 15,231 $ 14,516 $ 13,139
Retained earnings
Balance at beginning of year 41,414 38,117 34,752 31,316 28,609 25,315 21,978 18,421
IFRS adjustment (58)(1) (564) – – – (247) (203) (144)
Restated balances 41,356 37,553 34,752 31,316 28,609 25,068 21,775 18,277
Net income attributable to common shareholders of the Bank(2) 8,208 8,361 7,876 6,987 6,897 6,916 6,162 5,974
Dividends: Preferred(3) – – – – – – – –
Common (4,260) (3,985) (3,668) (3,468) (3,289) (3,110) (2,858) (2,493)
Purchase of shares for cancellation and premium on redemption (850) (514) (827) (61) (761) (264) – –
Other (15) (1) (16) (22) (140)(4) (1) (11) 17
Balance at end of year $ 44,439 $ 41,414 $ 38,117 $ 34,752 $ 31,316 $ 28,609 $ 25,068 $ 21,775
Accumulated other comprehensive income (loss)
Balance at beginning of year 992 1,577 2,240 2,455 949 545 (31) (497)
IFRS adjustment – 51 – – – (157) (714) 32
Restated balances 992 1,628 2,240 2,455 949 388 (745) (465)
Cumulative effect of adopting new accounting policies – – – – (5)(5) – – –
Other comprehensive income (loss) (422) (693) (663) (215) 1,511 561 1,133 (280)
Other – 57 – – – – – –
Balance at end of year $ 570 $ 992 $ 1,577 $ 2,240 $ 2,455 $ 949 $ 388 $ (745)
Other reserves(7)
Balance at beginning of year 404 116 152 173 176 193 166 96
Share-based payments(8) 7 6 8 7 14 30 36 38
Other (46) 282 (44) (28) (17) (47) (9) 32
Balance at end of year $ 365 $ 404 $ 116 $ 152 $ 173 $ 176 $ 193 $ 166
Total common equity $ 63,638 $ 61,044 $ 55,454 $ 52,657 $ 49,085 $ 44,965 $ 40,165 $ 34,335
Preferred shares and other equity instruments
Balance at beginning of year 4,184 4,579 3,594 2,934 2,934 4,084 4,384 4,384
Net income attributable to preferred shareholders and other equity instrument holders of the Bank(2) 182 187 129 130 117 155 217 220
Preferred and other equity instrument dividends(3) (182) (187) (129) (130) (117) (155) (217) (220)
Issued – 300 1,560 1,350 – – – –
Redeemed (300) (695) (575) (690) – (1,150) (300) –
Balance at end of year $ 3,884 $ 4,184 $ 4,579 $ 3,594 $ 2,934 $ 2,934 $ 4,084 $ 4,384
Non-controlling interests
Balance at beginning of year 2,452 1,592 1,570 1,460 1,312 1,155 1,743 1,500
IFRS adjustment – (97) – – – (17) (797) (891)
Restated balances 2,452 1,495 1,570 1,460 1,312 1,138 946 609
Net income attributable to non-controlling interests 408 176 238 251 199 227 231 196
Distributions to non-controlling interests (150) (199) (133) (116) (86) (76) (80) (44)
Effect of foreign exchange and others (40) 980 (83) (25) 35 23 41 185
Balance at end of year $ 2,670 $ 2,452 $ 1,592 $ 1,570 $ 1,460 $ 1,312 $ 1,138 $ 946
Total equity at end of year $ 70,192 $ 67,680 $ 61,625 $ 57,821 $ 53,479 $ 49,211 $ 45,387 $ 39,665
(1) Refer to Note 4 in the consolidated financial statements.
(2) Under CGAAP, net income attributable to preferred shareholders was included in retained earnings.
(3) Under IFRS, preferred dividends are recorded as a reduction to preferred shareholders’ equity. Under CGAAP, dividends are a reduction to retained earnings.
(4) Includes retrospective adjustments primarily related to foreign currency translation on Allowance for Credit Losses with respect to periods prior to 2013 ($152).
(5) To reflect the adoption of the own credit risk provisions of IFRS 9 pertaining to financial liabilities designated at fair value through profit or loss.
(6) Relates to the adoption of the new accounting standard for impairment and classification of financial instruments under CGAAP.
(7) Under CGAAP, amounts represent Contributed Surplus.
(8) Represents amounts on account of share-based payments (refer to Note 26 in the consolidated financial statements).
T80 Consolidated Statement of Comprehensive Income
IFRS
For the year ended October 31 ($ millions) 2019 2018 2017 2016 2015 2014 2013 2012
Net income $ 8,798 $ 8,724 $ 8,243 $ 7,368 $ 7,213 $ 7,298 $ 6,610 $ 6,390
Other comprehensive income (loss), net of income taxes:
Items that will be reclassified subsequently to net income
Net change in unrealized foreign currency translation gains (losses) (819) (606) (1,259) 396 1,855 889 346 149
Net change in unrealized gains (losses) on available-for-sale securities (debt and equity)(1) n/a n/a (55) (172) (480) (38) 110 151
Net change in fair value due to change in debt instruments measured at fair value through other comprehensive income
(1) 105 (252) n/a n/a n/a n/a n/a n/a
Net change in gains (losses) on derivative instruments designated as cash flow hedges 708 (361) (28) 258 55 (6) 93 116
Other comprehensive income (loss) from investments in associates 103 66 56 31 (9) 60 20 25
Items that will not be reclassified subsequently to net income
Net change in remeasurement of employee benefit plan asset and liability (815) 318 592 (716) (1) (320) 563 (747)
Net change in fair value due to change in equity instruments designated at fair value through other comprehensive
income(1) 95 60 n/a n/a n/a n/a n/a n/a
Net change in fair value due to change in own credit risk on financial liabilities designated under the fair value option(2) 8 (22) (21) (16) 15 n/a n/a n/a
Other comprehensive income (loss) from investments in associates (10) (7) 6 (10) 1 (2) – –
Other comprehensive income (loss) (625) (804) (709) (229) 1,436 583 1,132 (306)
Comprehensive income $ 8,173 $ 7,920 $ 7,534 $ 7,139 $ 8,649 $ 7,881 $ 7,742 $ 6,084
Comprehensive income attributable to:
Common shareholders of the Bank $ 7,786 $ 7,668 $ 7,213 $ 6,772 $ 8,408 $ 7,477 $ 7,298 $ 5,694
Preferred shareholders and other equity instrument holders of the Bank 182 187 129 130 117 155 217 220
Non-controlling interests in subsidiaries 205 65 192 237 124 249 227 170
Capital instrument equity holders – – – – – – – –
$ 8,173 $ 7,920 $ 7,534 $ 7,139 $ 8,649 $ 7,881 $ 7,742 $ 6,084
(1) The amounts for the years ended October 31, 2019 and October 31, 2018 have been prepared in accordance with IFRS 9; prior period amounts have not been restated.
(2) In accordance with the transition requirements for the own credit risk provisions of IFRS 9, prior year comparatives have not been restated for the adoption of this standard in 2015.
130 | 2019 Scotiabank Annual Report
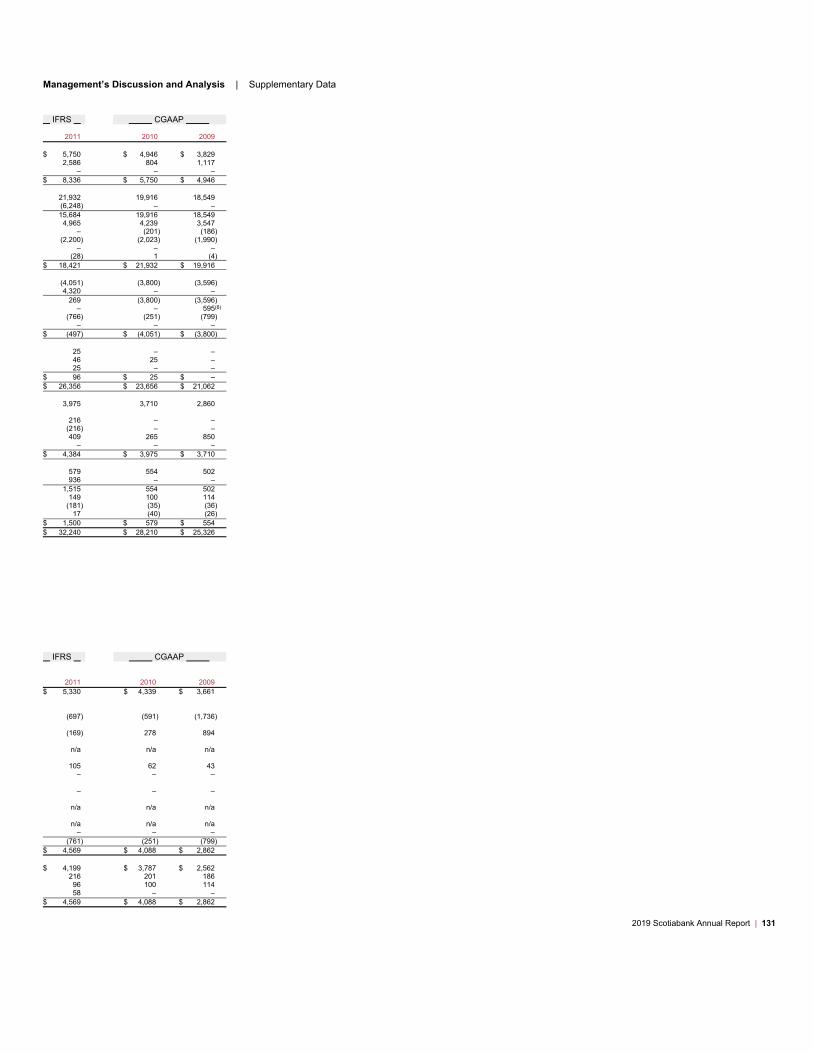
Management’s Discussion and Analysis | Supplementary Data
IFRS CGAAP
2011 2010 2009
$ 5,750 $ 4,946 $ 3,829
2,586 804 1,117
– – –
$ 8,336 $ 5,750 $ 4,946
21,932 19,916 18,549
(6,248) – –
15,684 19,916 18,549
4,965 4,239 3,547
– (201) (186)
(2,200) (2,023) (1,990)
– – –
(28) 1 (4)
$ 18,421 $ 21,932 $ 19,916
(4,051) (3,800) (3,596)
4,320 – –
269 (3,800) (3,596)
– – 595(6)
(766) (251) (799)
– – –
$ (497) $ (4,051) $ (3,800)
25 – –
46 25 –
25 – –
$ 96 $ 25 $ –
$ 26,356 $ 23,656 $ 21,062
3,975 3,710 2,860
216 – –
(216) – –
409 265 850
– – –
$ 4,384 $ 3,975 $ 3,710
579 554 502
936 – –
1,515 554 502
149 100 114
(181) (35) (36)
17 (40) (26)
$ 1,500 $ 579 $ 554
$ 32,240 $ 28,210 $ 25,326
IFRS CGAAP
2011 2010 2009
$ 5,330 $ 4,339 $ 3,661
(697) (591) (1,736)
(169) 278 894
n/a n/a n/a
105 62 43
– – –
– – –
n/a n/a n/a
n/a n/a n/a
– – –
(761) (251) (799)
$ 4,569 $ 4,088 $ 2,862
$ 4,199 $ 3,787 $ 2,562
216 201 186
96 100 114
58 – –
$ 4,569 $ 4,088 $ 2,862
2019 Scotiabank Annual Report | 131
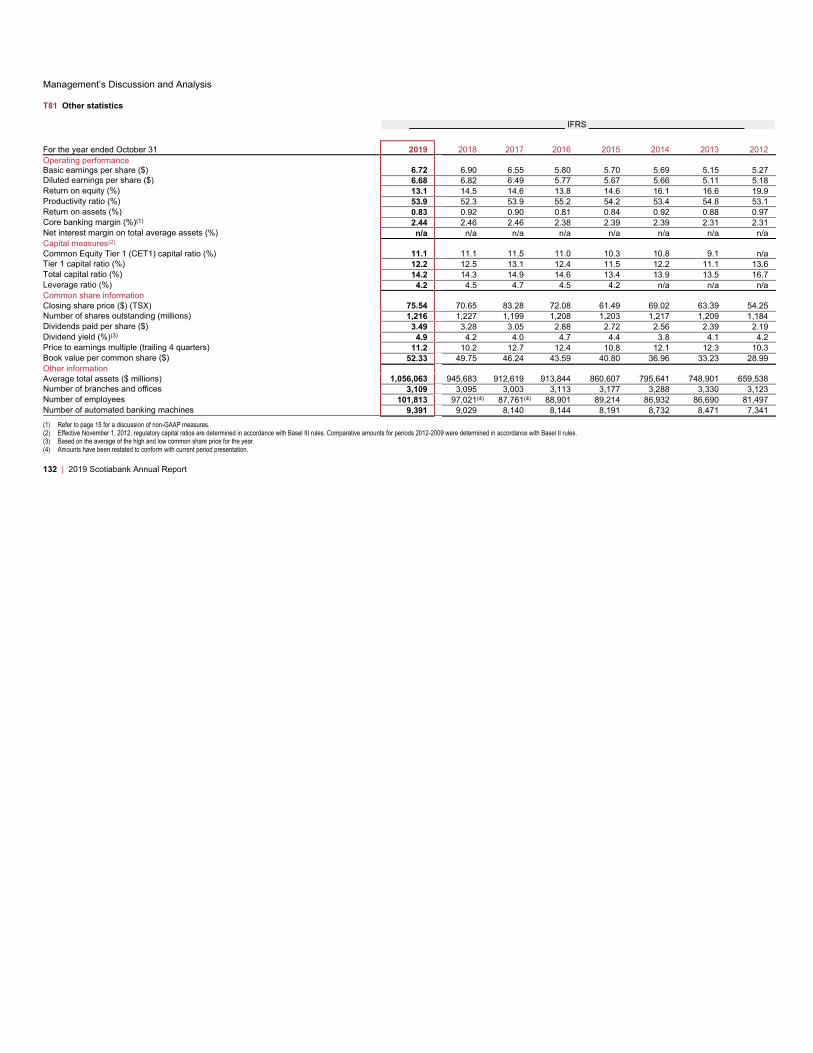
Management’s Discussion and Analysis
T81 Other statistics
IFRS
For the year ended October 31 2019 2018 2017 2016 2015 2014 2013 2012
Operating performance
Basic earnings per share ($) 6.72 6.90 6.55 5.80 5.70 5.69 5.15 5.27
Diluted earnings per share ($) 6.68 6.82 6.49 5.77 5.67 5.66 5.11 5.18
Return on equity (%) 13.1 14.5 14.6 13.8 14.6 16.1 16.6 19.9
Productivity ratio (%) 53.9 52.3 53.9 55.2 54.2 53.4 54.8 53.1
Return on assets (%) 0.83 0.92 0.90 0.81 0.84 0.92 0.88 0.97
Core banking margin (%)(1)2.44 2.46 2.46 2.38 2.39 2.39 2.31 2.31
Net interest margin on total average assets (%) n/a n/a n/a n/a n/a n/a n/a n/a
Capital measures(2)
Common Equity Tier 1 (CET1) capital ratio (%) 11.1 11.1 11.5 11.0 10.3 10.8 9.1 n/a
Tier 1 capital ratio (%) 12.2 12.5 13.1 12.4 11.5 12.2 11.1 13.6
Total capital ratio (%) 14.2 14.3 14.9 14.6 13.4 13.9 13.5 16.7
Leverage ratio (%) 4.2 4.5 4.7 4.5 4.2 n/a n/a n/a
Common share information
Closing share price ($) (TSX) 75.54 70.65 83.28 72.08 61.49 69.02 63.39 54.25
Number of shares outstanding (millions) 1,216 1,227 1,199 1,208 1,203 1,217 1,209 1,184
Dividends paid per share ($) 3.49 3.28 3.05 2.88 2.72 2.56 2.39 2.19
Dividend yield (%)(3)4.9 4.2 4.0 4.7 4.4 3.8 4.1 4.2
Price to earnings multiple (trailing 4 quarters) 11.2 10.2 12.7 12.4 10.8 12.1 12.3 10.3
Book value per common share ($) 52.33 49.75 46.24 43.59 40.80 36.96 33.23 28.99
Other information
Average total assets ($ millions) 1,056,063 945,683 912,619 913,844 860,607 795,641 748,901 659,538
Number of branches and offices 3,109 3,095 3,003 3,113 3,177 3,288 3,330 3,123
Number of employees 101,813 97,021(4) 87,761(4) 88,901 89,214 86,932 86,690 81,497
Number of automated banking machines 9,391 9,029 8,140 8,144 8,191 8,732 8,471 7,341
(1) Refer to page 15 for a discussion of non-GAAP measures.
(2) Effective November 1, 2012, regulatory capital ratios are determined in accordance with Basel III rules. Comparative amounts for periods 2012-2009 were determined in accordance with Basel II rules.
(3) Based on the average of the high and low common share price for the year.
(4) Amounts have been restated to conform with current period presentation.
132 | 2019 Scotiabank Annual Report
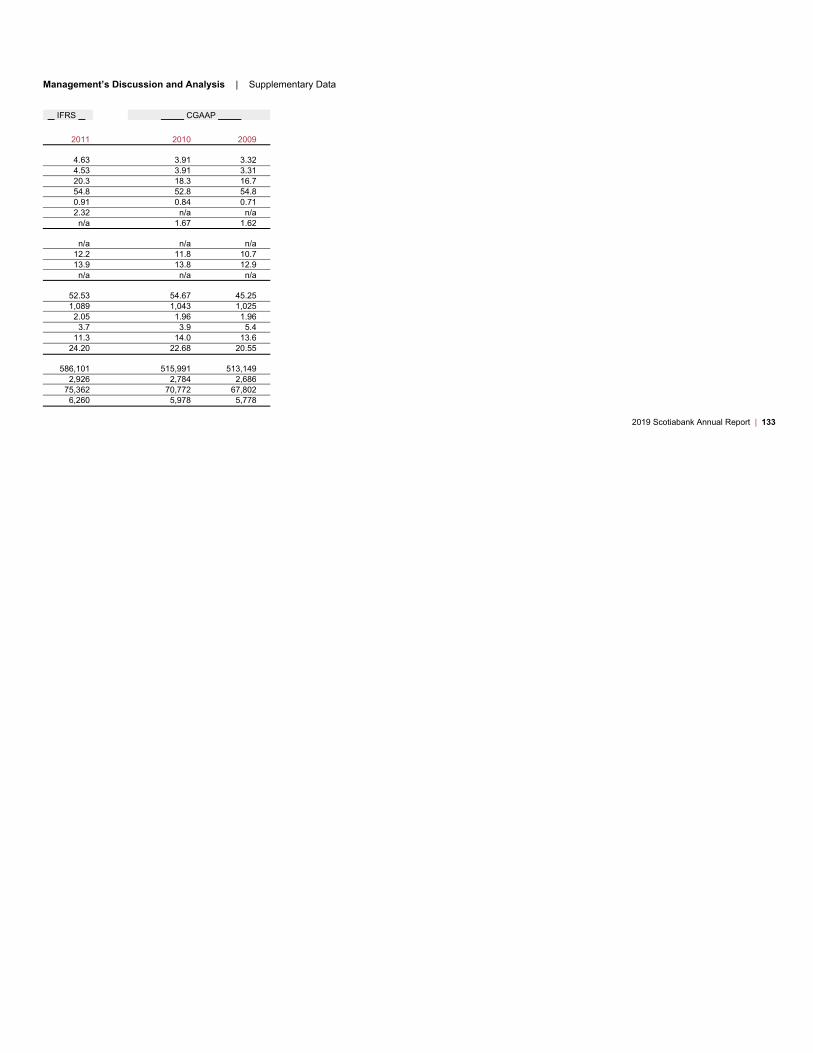
Management’s Discussion and Analysis | Supplementary Data
IFRS CGAAP
2011 2010 2009
4.63 3.91 3.32
4.53 3.91 3.31
20.3 18.3 16.7
54.8 52.8 54.8
0.91 0.84 0.71
2.32 n/a n/a
n/a 1.67 1.62
n/a n/a n/a
12.2 11.8 10.7
13.9 13.8 12.9
n/a n/a n/a
52.53 54.67 45.25
1,089 1,043 1,025
2.05 1.96 1.96
3.7 3.9 5.4
11.3 14.0 13.6
24.20 22.68 20.55
586,101 515,991 513,149
2,926 2,784 2,686
75,362 70,772 67,802
6,260 5,978 5,778
2019 Scotiabank Annual Report | 133
Consolidated
Financial Statements
Table of Contents
2019 Scotiabank Annual Report | 135
136 Management’s Responsibility for
Financial Information
137 Independent Auditors’ Reports of
Registered Public Accounting Firm
142 Consolidated Statement of
Financial Position
143 Consolidated Statement of Income
144 Consolidated Statement of
Comprehensive Income
145 Consolidated Statement of Changes
in Equity
146 Consolidated Statement of Cash Flows
147 Notes to the 2019 Consolidated
Financial Statements

Consolidated Financial Statements
Management’s Responsibility for Financial Information
The management of The Bank of Nova Scotia (the Bank) is responsible for the integrity and fair presentation of the financial information contained in this Annual Report. The
consolidated financial statements have been prepared in accordance with International Financial Reporting Standards as issued by the International Accounting Standards
Board. The consolidated financial statements also comply with the accounting requirements of the Bank Act.
The consolidated financial statements, where necessary, include amounts which are based on the best estimates and judgment of management. Financial information
presented elsewhere in this Annual Report is consistent with that shown in the consolidated financial statements.
Management has always recognized the importance of the Bank maintaining and reinforcing the highest possible standards of conduct in all of its actions, including the
preparation and dissemination of statements fairly presenting the financial condition of the Bank. In this regard, management has developed and maintains a system of
accounting and reporting which provides for the necessary internal controls to ensure that transactions are properly authorized and recorded, assets are safeguarded against
unauthorized use or disposition, and liabilities are recognized. The system is augmented by written policies and procedures, the careful selection and training of qualified
staff, the establishment of organizational structures providing an appropriate and well-defined division of responsibilities, and the communication of policies and guidelines of
Scotiabank’s Code of Conduct throughout the Bank.
Management, under the supervision of and the participation of the President and Chief Executive Officer and the Executive Vice President and Chief Financial Officer,
have a process in place to evaluate disclosure controls and procedures and internal control over financial reporting in line with Canadian and U.S. securities regulations.
The system of internal controls is further supported by a professional staff of internal auditors who conduct periodic audits of all aspects of the Bank’s operations. As
well, the Bank’s Chief Auditor has full and free access to, and meets periodically with the Audit and Conduct Review Committee of the Board of Directors. In addition,
the Bank’s compliance function maintains policies, procedures and programs directed at ensuring compliance with regulatory requirements, including conflict of interest
rules.
The Office of the Superintendent of Financial Institutions Canada, which is mandated to protect the rights and interests of the depositors and creditors of the Bank,
examines and enquires into the business and affairs of the Bank, as deemed necessary, to determine whether the provisions of the Bank Act are being complied with, and
that the Bank is in a sound financial condition.
The Audit and Conduct Review Committee, composed entirely of outside directors, reviews the consolidated financial statements with both management and the
independent auditors before such statements are approved by the Board of Directors and submitted to the shareholders of the Bank.
The Audit and Conduct Review Committee reviews and reports its findings to the Board of Directors on all related party transactions that may have a material impact on
the Bank.
KPMG LLP, the independent auditors appointed by the shareholders of the Bank, have audited the consolidated financial position of the Bank as at October 31, 2019
and October 31, 2018 and its consolidated financial performance and its consolidated cash flows for each of the years in the three-year period ended October 31, 2019
prepared in accordance with International Financial Reporting Standards as issued by the International Accounting Standards Board in accordance with Canadian Generally
Accepted Auditing Standards and the standards of the Public Company Accounting Oversight Board (United States) and the effectiveness of internal control over financial
reporting and have expressed their opinions upon completion of such audits in the reports to the shareholders. The Shareholders’ Auditors have full and free access to, and
meet periodically with, the Audit and Conduct Review Committee to discuss their audits, including any findings as to the integrity of the Bank’s accounting, financial reporting
and related matters.
Toronto, Canada
November 26, 2019
136 | 2019 Scotiabank Annual Report
Brian J. Porter
President and Chief Executive Officer
Raj Viswanathan
Executive Vice President and Chief Financial Officer

(This page intentionally left blank)
2019 Scotiabank Annual Report | 137

(This page intentionally left blank)
138 | 2019 Scotiabank Annual Report

(This page intentionally left blank)
2019 Scotiabank Annual Report | 139

Consolidated Financial Statements
Report of Independent Registered Public Accounting Firm
To the Shareholders of The Bank of Nova Scotia
Opinion on the Consolidated Financial Statements
We have audited the accompanying consolidated statements of financial position of The Bank of Nova Scotia (the Bank) as at October 31, 2019 and 2018, the related
consolidated statements of income, comprehensive income, changes in equity and cash flows for each of the years in the three-year period ended October 31, 2019, and the
related notes (collectively, the consolidated financial statements). In our opinion, the consolidated financial statements present fairly, in all material respects, the financial
position of the Bank as at October 31, 2019 and 2018, and its financial performance and its cash flows for each of the years in the three-year period ended October 31, 2019
in conformity with International Financial Reporting Standards (IFRS) as issued by the International Accounting Standards Board.
We also have audited, in accordance with the standards of the Public Company Accounting Oversight Board (United States) (PCAOB), the Bank’s internal control over
financial reporting as of October 31, 2019, based on criteria established in Internal Control – Integrated Framework (2013) issued by the Committee of Sponsoring
Organizations of the Treadway Commission, and our report dated November 26, 2019 expressed an unqualified opinion on the effectiveness of the Bank’s internal control
over financial reporting.
Basis for Opinion
These consolidated financial statements are the responsibility of the Bank’s management. Our responsibility is to express an opinion on these consolidated financial
statements based on our audits. We are a public accounting firm registered with the PCAOB and are required to be independent with respect to the Bank in accordance with
the U.S. federal securities laws and the applicable rules and regulations of the Securities and Exchange Commission and the PCAOB.
We conducted our audits in accordance with the standards of the PCAOB. Those standards require that we plan and perform the audit to obtain reasonable assurance about
whether the consolidated financial statements are free of material misstatement, whether due to error or fraud. Our audits included performing procedures to assess the risks
of material misstatement of the consolidated financial statements, whether due to error or fraud, and performing procedures that respond to those risks. Such procedures
included examining, on a test basis, evidence regarding the amounts and disclosures in the consolidated financial statements. Our audits also included evaluating the
accounting principles used and significant estimates made by management, as well as evaluating the overall presentation of the consolidated financial statements. We
believe that our audits provide a reasonable basis for our opinion.
Critical Audit Matters
The critical audit matters communicated below are matters arising from the current period audit of the consolidated financial statements that were communicated or required
to be communicated to the Audit and Conduct Review Committee and that: (1) relate to accounts or disclosures that are material to the consolidated financial statements and
(2) involved our especially challenging, subjective, or complex judgments. The communication of critical audit matters does not alter in any way our opinion on the
consolidated financial statements, taken as a whole, and we are not, by communicating the critical audit matters below, providing separate opinions on the critical audit
matters or on the accounts or disclosures to which they relate.
(i) Assessment of Allowance for Credit Losses on Financial Assets (ACL)
As discussed in Notes 3 and 13 to the consolidated financial statements, the Bank’s ACL for credit losses was $5,077 million as at October 31, 2019. The Bank applies a
three-stage approach to measure the ACL, using an expected credit loss (ECL) approach as required under IFRS 9 Financial Instruments. The estimation of the ACL
involves the use of complex models and incorporates inputs, assumptions and techniques that involve significant management judgment. The ACL reflects a probability-
weighted outcome that considers multiple economic scenarios based on the Bank’s view of forecast economic conditions, and is determined as a function of the Bank’s
assessment of the probability of default (PD), loss given default (LGD) and exposure at default (EAD) associated with the financial asset. When the Bank determines that
there has been a significant increase in credit risk subsequent to origination or where the financial asset is in default, lifetime ACL is recorded; otherwise, ACL equal to 12
month expected credit losses is recorded. Qualitative adjustments or overlays may also be recorded by the Bank using expert credit judgment where the inputs, assumptions
and/or modelling techniques do not capture all relevant risk factors.
We identified the assessment of the ACL as a critical audit matter. There is a high degree of measurement uncertainty associated with the ACL as a result of the judgments
relating to the inputs, assumptions, adjustments and techniques and complex models involved, as described above. Assessing the ACL required significant auditor attention
and complex auditor judgment, involving our credit risk, economics, and information technology specialists, as well as knowledge and experience in the industry.
The primary procedures we performed to address this critical audit matter included the following. With the involvement of our credit risk, economics, and information
technology professionals with specialized skills, industry knowledge and relevant experience, we tested certain internal controls over the Bank’s ACL process. These
included controls related to: (1) validation of the models that determine PD, LGD and EAD; (2) the Bank’s monitoring over the determination of the ACL; (3) information
technology controls over the data inputs into the ACL models and the ACL calculation; (4) the assessment to identify whether there has been a significant increase in credit
risk; (5) the review of the macroeconomic variables and probability weighting of scenarios used in the ACL models; and (6) the assessment of qualitative adjustments.
Additionally for non-retail loans, we tested the controls related to loan reviews, including the determination of loan risk grades and write-offs. We involved credit risk,
economics, and information technology professionals with specialized skills, industry knowledge and relevant experience who assisted in: (1) evaluating the methodology
and key inputs used in determining PD, LGD and EAD parameters produced by the models; (2) evaluating macroeconomic variables and probability weighting of scenarios
used in the ACL models, including consideration of alternative inputs for certain variables; (3) recalculating a sample of ECL models and related inputs; and (4) assessing the
qualitative adjustments applied to the ACL. Additionally for a sample of non-retail loans, we evaluated the Bank’s assigned credit risk ratings to loans against the Bank’s
borrower risk rating scale, and the Bank’s judgment on whether there was a significant increase in credit risk, and the related ACL.
(ii) Assessment of the Measurement of Fair Value of Certain Difficult-to-value Financial Instruments
As discussed in Notes 3 and 7 to the consolidated financial statements, the Bank measures $229,830 million of financial assets and $83,005 million of financial liabilities as
at October 31, 2019 at fair value on a recurring basis. Included in these amounts are certain difficult-to-value financial instruments for which the Bank determines fair value
using internal models and third party pricing that use significant
140 | 2019 Scotiabank Annual Report

Consolidated Financial Statements
unobservable inputs. Unobservable inputs require the use of significant management judgment. The key unobservable inputs used in the Bank’s internal models to value
such difficult-to-value financial instruments include net asset value, volatility and correlation.
We identified the assessment of the measurement of fair value for difficult-to-value financial instruments as a critical audit matter. Due to the significant measurement
uncertainty associated with the fair value of difficult-to-value financial assets and financial liabilities, there was a high degree of subjectivity and judgment in evaluating the
methodology used in developing the models. Subjective auditor judgment was also required to evaluate the models’ significant inputs and assumptions which were not
directly observable in financial markets, such as net asset value, volatility and correlation.
The primary procedures we performed to address this critical audit matter included the following. We tested certain internal controls over the Bank’s process to determine the
fair value of its difficult-to-value financial instruments with the involvement of valuation and information technology professionals with specialized skills, industry knowledge
and relevant experience. These included controls related to: (1) development and ongoing validation of the models and methodologies; (2) review of significant unobservable
model inputs and assumptions; (3) independent price verification; and (4) segregation of duties and access controls. We tested, with involvement of valuation professionals
with specialized skills, industry knowledge and relevant experience, the fair value of a sample of difficult-to-value financial instruments. Depending on the nature of the
financial instruments, we did this by comparing the key unobservable inputs to external information or by developing an independent estimate of fair value and comparing it
to the fair value determined by the Bank.
(iii) Assessment of Uncertain Tax Provisions
As discussed in Notes 3 and 27 to the consolidated financial statements, in determining the provision for income taxes, the Bank records its best estimate of the amount
required to settle uncertain tax positions based on its assessment of relevant factors.
We identified the assessment of uncertain tax provisions as a critical audit matter. There is a high degree of subjectivity and complex auditor judgment required in assessing
the Bank’s interpretation of tax law and its estimate of the ultimate resolution of tax positions.
The primary procedures we performed to address this critical audit matter included the following. We tested certain internal controls over the Bank’s income tax uncertainties
process with the involvement of taxation professionals with specialized skills, industry knowledge and relevant experience. This included controls related to the
(1) identification of tax uncertainties, including the interpretation of tax law and (2) determination of the best estimate of the provision required to settle these tax
uncertainties. Since tax law is complex and often subject to interpretation, we involved tax professionals with specialized skills and knowledge, who assisted in:
(1) evaluating the Bank’s interpretations of tax laws and the assessment of certain tax uncertainties, including, if applicable, the measurement thereof; (2) reading advice
obtained by the Bank from external specialists; and (3) inspecting correspondence with taxation authorities.
Chartered Professional Accountants, Licensed Public Accountants
We have served as the Bank’s auditor since 2006 and as joint auditor for 14 years prior to that.
Toronto, Canada
November 26, 2019
2019 Scotiabank Annual Report | 141
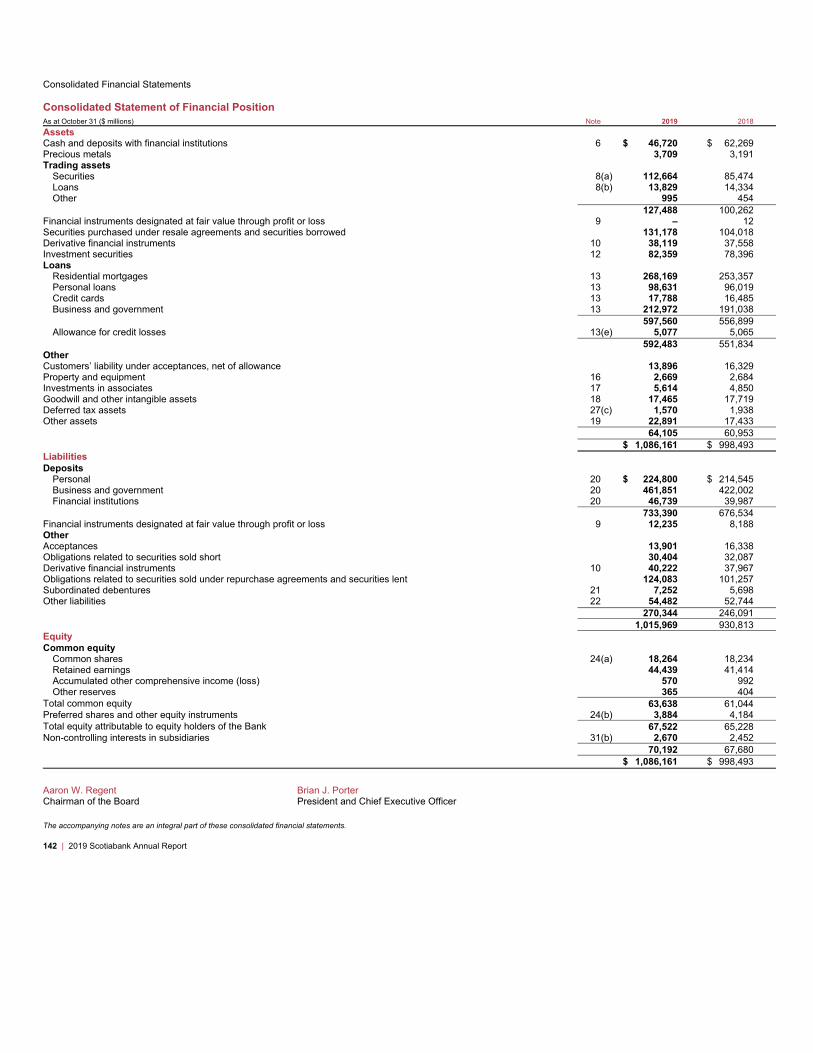
Consolidated Financial Statements
Consolidated Statement of Financial Position
As at October 31 ($ millions) Note 2019 2018
Assets
Cash and deposits with financial institutions 6 $ 46,720 $ 62,269
Precious metals 3,709 3,191
Trading assets
Securities 8(a) 112,664 85,474
Loans 8(b) 13,829 14,334
Other 995 454
127,488 100,262
Financial instruments designated at fair value through profit or loss 9 – 12
Securities purchased under resale agreements and securities borrowed 131,178 104,018
Derivative financial instruments 10 38,119 37,558
Investment securities 12 82,359 78,396
Loans
Residential mortgages 13 268,169 253,357
Personal loans 13 98,631 96,019
Credit cards 13 17,788 16,485
Business and government 13 212,972 191,038
597,560 556,899
Allowance for credit losses 13(e) 5,077 5,065
592,483 551,834
Other
Customers’ liability under acceptances, net of allowance 13,896 16,329
Property and equipment 16 2,669 2,684
Investments in associates 17 5,614 4,850
Goodwill and other intangible assets 18 17,465 17,719
Deferred tax assets 27(c) 1,570 1,938
Other assets 19 22,891 17,433
64,105 60,953
$ 1,086,161 $ 998,493
Liabilities
Deposits
Personal 20 $ 224,800 $ 214,545
Business and government 20 461,851 422,002
Financial institutions 20 46,739 39,987
733,390 676,534
Financial instruments designated at fair value through profit or loss 9 12,235 8,188
Other
Acceptances 13,901 16,338
Obligations related to securities sold short 30,404 32,087
Derivative financial instruments 10 40,222 37,967
Obligations related to securities sold under repurchase agreements and securities lent 124,083 101,257
Subordinated debentures 21 7,252 5,698
Other liabilities 22 54,482 52,744
270,344 246,091
1,015,969 930,813
Equity
Common equity
Common shares 24(a) 18,264 18,234
Retained earnings 44,439 41,414
Accumulated other comprehensive income (loss) 570 992
Other reserves 365 404
Total common equity 63,638 61,044
Preferred shares and other equity instruments 24(b) 3,884 4,184
Total equity attributable to equity holders of the Bank 67,522 65,228
Non-controlling interests in subsidiaries 31(b) 2,670 2,452
70,192 67,680
$ 1,086,161 $ 998,493
Aaron W. Regent Brian J. Porter
Chairman of the Board President and Chief Executive Officer
The accompanying notes are an integral part of these consolidated financial statements.
142 | 2019 Scotiabank Annual Report
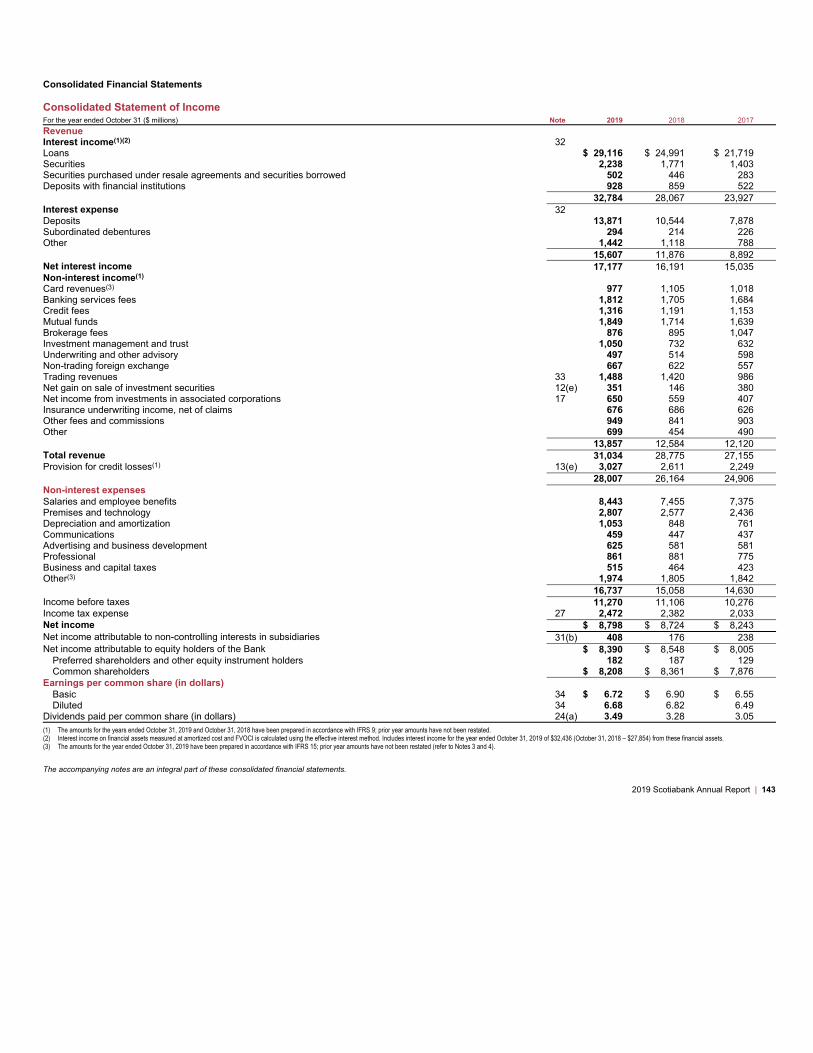
Consolidated Financial Statements
Consolidated Statement of Income
For the year ended October 31 ($ millions) Note 2019 2018 2017
Revenue
Interest income(1)(2) 32
Loans $ 29,116 $ 24,991 $ 21,719
Securities 2,238 1,771 1,403
Securities purchased under resale agreements and securities borrowed 502 446 283
Deposits with financial institutions 928 859 522
32,784 28,067 23,927
Interest expense 32
Deposits 13,871 10,544 7,878
Subordinated debentures 294 214 226
Other 1,442 1,118 788
15,607 11,876 8,892
Net interest income 17,177 16,191 15,035
Non-interest income(1)
Card revenues(3) 977 1,105 1,018
Banking services fees 1,812 1,705 1,684
Credit fees 1,316 1,191 1,153
Mutual funds 1,849 1,714 1,639
Brokerage fees 876 895 1,047
Investment management and trust 1,050 732 632
Underwriting and other advisory 497 514 598
Non-trading foreign exchange 667 622 557
Trading revenues 33 1,488 1,420 986
Net gain on sale of investment securities 12(e) 351 146 380
Net income from investments in associated corporations 17 650 559 407
Insurance underwriting income, net of claims 676 686 626
Other fees and commissions 949 841 903
Other 699 454 490
13,857 12,584 12,120
Total revenue 31,034 28,775 27,155
Provision for credit losses(1) 13(e) 3,027 2,611 2,249
28,007 26,164 24,906
Non-interest expenses
Salaries and employee benefits 8,443 7,455 7,375
Premises and technology 2,807 2,577 2,436
Depreciation and amortization 1,053 848 761
Communications 459 447 437
Advertising and business development 625 581 581
Professional 861 881 775
Business and capital taxes 515 464 423
Other(3) 1,974 1,805 1,842
16,737 15,058 14,630
Income before taxes 11,270 11,106 10,276
Income tax expense 27 2,472 2,382 2,033
Net income $ 8,798 $ 8,724 $ 8,243
Net income attributable to non-controlling interests in subsidiaries 31(b) 408 176 238
Net income attributable to equity holders of the Bank $ 8,390 $ 8,548 $ 8,005
Preferred shareholders and other equity instrument holders 182 187 129
Common shareholders $ 8,208 $ 8,361 $ 7,876
Earnings per common share (in dollars)
Basic 34 $ 6.72 $ 6.90 $ 6.55
Diluted 34 6.68 6.82 6.49
Dividends paid per common share (in dollars) 24(a) 3.49 3.28 3.05
(1) The amounts for the years ended October 31, 2019 and October 31, 2018 have been prepared in accordance with IFRS 9; prior year amounts have not been restated.
(2) Interest income on financial assets measured at amortized cost and FVOCI is calculated using the effective interest method. Includes interest income for the year ended October 31, 2019 of $32,436 (October 31, 2018 – $27,854) from these financial assets.
(3) The amounts for the year ended October 31, 2019 have been prepared in accordance with IFRS 15; prior year amounts have not been restated (refer to Notes 3 and 4).
The accompanying notes are an integral part of these consolidated financial statements.
2019 Scotiabank Annual Report | 143
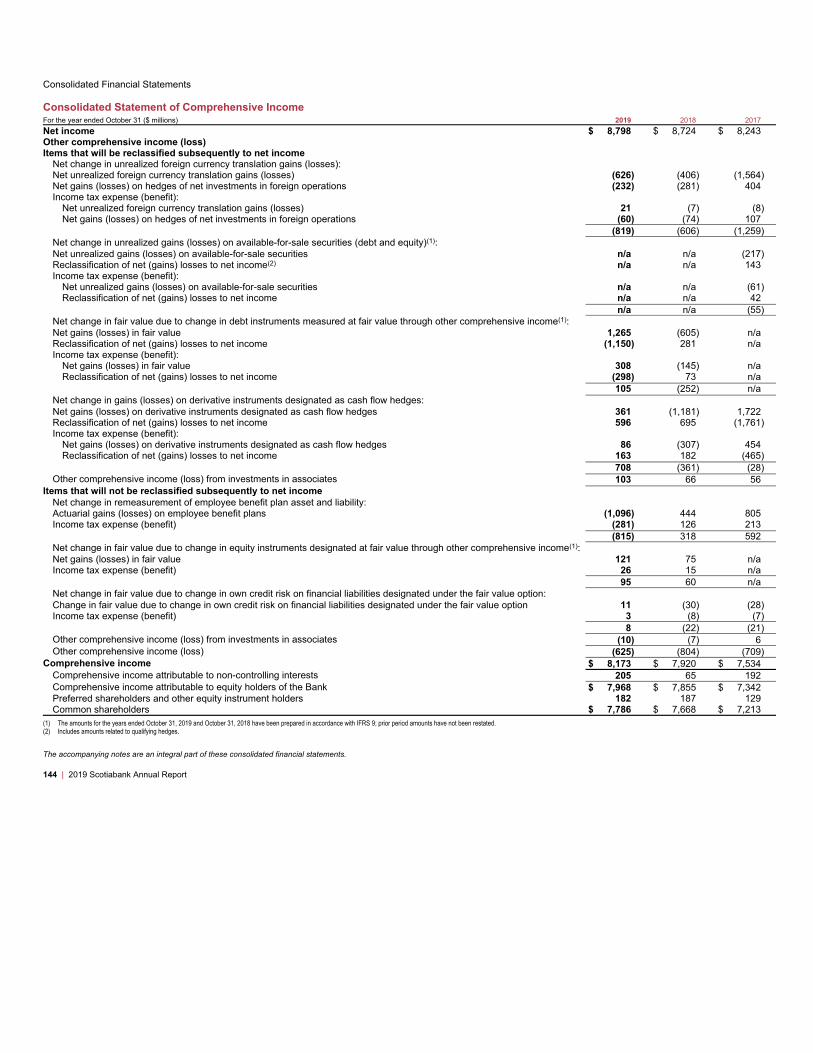
Consolidated Financial Statements
Consolidated Statement of Comprehensive Income
For the year ended October 31 ($ millions) 2019 2018 2017
Net income $ 8,798 $ 8,724 $ 8,243
Other comprehensive income (loss)
Items that will be reclassified subsequently to net income
Net change in unrealized foreign currency translation gains (losses):
Net unrealized foreign currency translation gains (losses) (626) (406) (1,564)
Net gains (losses) on hedges of net investments in foreign operations (232) (281) 404
Income tax expense (benefit):
Net unrealized foreign currency translation gains (losses) 21 (7) (8)
Net gains (losses) on hedges of net investments in foreign operations (60) (74) 107
(819) (606) (1,259)
Net change in unrealized gains (losses) on available-for-sale securities (debt and equity)(1):
Net unrealized gains (losses) on available-for-sale securities n/a n/a (217)
Reclassification of net (gains) losses to net income(2) n/a n/a 143
Income tax expense (benefit):
Net unrealized gains (losses) on available-for-sale securities n/a n/a (61)
Reclassification of net (gains) losses to net income n/a n/a 42
n/a n/a (55)
Net change in fair value due to change in debt instruments measured at fair value through other comprehensive income(1):
Net gains (losses) in fair value 1,265 (605) n/a
Reclassification of net (gains) losses to net income (1,150) 281 n/a
Income tax expense (benefit):
Net gains (losses) in fair value 308 (145) n/a
Reclassification of net (gains) losses to net income (298) 73 n/a
105 (252) n/a
Net change in gains (losses) on derivative instruments designated as cash flow hedges:
Net gains (losses) on derivative instruments designated as cash flow hedges 361 (1,181) 1,722
Reclassification of net (gains) losses to net income 596 695 (1,761)
Income tax expense (benefit):
Net gains (losses) on derivative instruments designated as cash flow hedges 86 (307) 454
Reclassification of net (gains) losses to net income 163 182 (465)
708 (361) (28)
Other comprehensive income (loss) from investments in associates 103 66 56
Items that will not be reclassified subsequently to net income
Net change in remeasurement of employee benefit plan asset and liability:
Actuarial gains (losses) on employee benefit plans (1,096) 444 805
Income tax expense (benefit) (281) 126 213
(815) 318 592
Net change in fair value due to change in equity instruments designated at fair value through other comprehensive income(1):
Net gains (losses) in fair value 121 75 n/a
Income tax expense (benefit) 26 15 n/a
95 60 n/a
Net change in fair value due to change in own credit risk on financial liabilities designated under the fair value option:
Change in fair value due to change in own credit risk on financial liabilities designated under the fair value option 11 (30) (28)
Income tax expense (benefit) 3 (8) (7)
8 (22) (21)
Other comprehensive income (loss) from investments in associates (10) (7) 6
Other comprehensive income (loss) (625) (804) (709)
Comprehensive income $ 8,173 $ 7,920 $ 7,534
Comprehensive income attributable to non-controlling interests 205 65 192
Comprehensive income attributable to equity holders of the Bank $ 7,968 $ 7,855 $ 7,342
Preferred shareholders and other equity instrument holders 182 187 129
Common shareholders $ 7,786 $ 7,668 $ 7,213
(1) The amounts for the years ended October 31, 2019 and October 31, 2018 have been prepared in accordance with IFRS 9; prior period amounts have not been restated.
(2) Includes amounts related to qualifying hedges.
The accompanying notes are an integral part of these consolidated financial statements.
144 | 2019 Scotiabank Annual Report
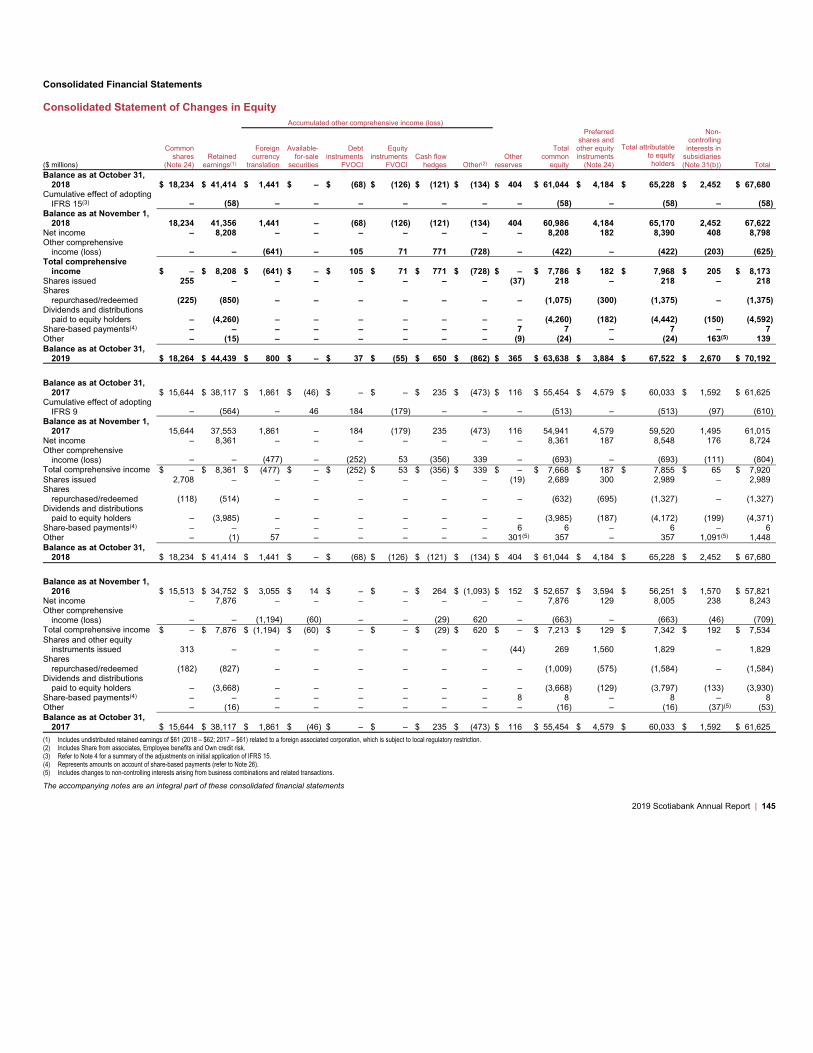
Consolidated Financial Statements
Consolidated Statement of Changes in Equity
Accumulated other comprehensive income (loss)
($ millions)
Common
shares
(Note 24)
Retained
earnings(1)
Foreign
currency
translation
Available-
for-sale
securities
Debt
instruments
FVOCI
Equity
instruments
FVOCI
Cash flow
hedges Other(2)
Other
reserves
Total
common
equity
Preferred
shares and
other equity
instruments
(Note 24)
Total attributable
to equity
holders
Non-
controlling
interests in
subsidiaries
(Note 31(b)) Total
Balance as at October 31,
2018 $ 18,234 $ 41,414 $ 1,441 $ – $ (68) $ (126) $ (121) $ (134) $ 404 $ 61,044 $ 4,184 $ 65,228 $ 2,452 $ 67,680
Cumulative effect of adopting
IFRS 15(3) – (58) – – – – – – – (58) – (58) – (58)
Balance as at November 1,
2018 18,234 41,356 1,441 – (68) (126) (121) (134) 404 60,986 4,184 65,170 2,452 67,622
Net income – 8,208 – – – – – – – 8,208 182 8,390 408 8,798
Other comprehensive
income (loss) – – (641) – 105 71 771 (728) – (422) – (422) (203) (625)
Total comprehensive
income $ – $ 8,208 $ (641) $ – $ 105 $ 71 $ 771 $ (728) $ – $ 7,786 $ 182 $ 7,968 $ 205 $ 8,173
Shares issued 255 – – – – – – – (37) 218 – 218 – 218
Shares
repurchased/redeemed (225) (850) – – – – – – – (1,075) (300) (1,375) – (1,375)
Dividends and distributions
paid to equity holders – (4,260) – – – – – – – (4,260) (182) (4,442) (150) (4,592)
Share-based payments(4) – – – – – – – – 7 7 – 7 – 7
Other – (15) – – – – – – (9) (24) – (24) 163(5) 139
Balance as at October 31,
2019 $ 18,264 $ 44,439 $ 800 $ – $ 37 $ (55) $ 650 $ (862) $ 365 $ 63,638 $ 3,884 $ 67,522 $ 2,670 $ 70,192
Balance as at October 31,
2017 $ 15,644 $ 38,117 $ 1,861 $ (46) $ – $ – $ 235 $ (473) $ 116 $ 55,454 $ 4,579 $ 60,033 $ 1,592 $ 61,625
Cumulative effect of adopting
IFRS 9 – (564) – 46 184 (179) – – – (513) – (513) (97) (610)
Balance as at November 1,
2017 15,644 37,553 1,861 – 184 (179) 235 (473) 116 54,941 4,579 59,520 1,495 61,015
Net income – 8,361 – – – – – – – 8,361 187 8,548 176 8,724
Other comprehensive
income (loss) – – (477) – (252) 53 (356) 339 – (693) – (693) (111) (804)
Total comprehensive income $ – $ 8,361 $ (477) $ – $ (252) $ 53 $ (356) $ 339 $ – $ 7,668 $ 187 $ 7,855 $ 65 $ 7,920
Shares issued 2,708 – – – – – – – (19) 2,689 300 2,989 – 2,989
Shares
repurchased/redeemed (118) (514) – – – – – – – (632) (695) (1,327) – (1,327)
Dividends and distributions
paid to equity holders – (3,985) – – – – – – – (3,985) (187) (4,172) (199) (4,371)
Share-based payments(4) – – – – – – – – 6 6 – 6 – 6
Other – (1) 57 – – – – – 301(5) 357 – 357 1,091(5) 1,448
Balance as at October 31,
2018 $ 18,234 $ 41,414 $ 1,441 $ – $ (68) $ (126) $ (121) $ (134) $ 404 $ 61,044 $ 4,184 $ 65,228 $ 2,452 $ 67,680
Balance as at November 1,
2016 $ 15,513 $ 34,752 $ 3,055 $ 14 $ – $ – $ 264 $ (1,093) $ 152 $ 52,657 $ 3,594 $ 56,251 $ 1,570 $ 57,821
Net income – 7,876 – – – – – – – 7,876 129 8,005 238 8,243
Other comprehensive
income (loss) – – (1,194) (60) – – (29) 620 – (663) – (663) (46) (709)
Total comprehensive income $ – $ 7,876 $ (1,194) $ (60) $ – $ – $ (29) $ 620 $ – $ 7,213 $ 129 $ 7,342 $ 192 $ 7,534
Shares and other equity
instruments issued 313 – – – – – – – (44) 269 1,560 1,829 – 1,829
Shares
repurchased/redeemed (182) (827) – – – – – – – (1,009) (575) (1,584) – (1,584)
Dividends and distributions
paid to equity holders – (3,668) – – – – – – – (3,668) (129) (3,797) (133) (3,930)
Share-based payments(4) – – – – – – – – 8 8 – 8 – 8
Other – (16) – – – – – – – (16) – (16) (37)(5) (53)
Balance as at October 31,
2017 $ 15,644 $ 38,117 $ 1,861 $ (46) $ – $ – $ 235 $ (473) $ 116 $ 55,454 $ 4,579 $ 60,033 $ 1,592 $ 61,625
(1) Includes undistributed retained earnings of $61 (2018 – $62; 2017 – $61) related to a foreign associated corporation, which is subject to local regulatory restriction.
(2) Includes Share from associates, Employee benefits and Own credit risk.
(3) Refer to Note 4 for a summary of the adjustments on initial application of IFRS 15.
(4) Represents amounts on account of share-based payments (refer to Note 26).
(5) Includes changes to non-controlling interests arising from business combinations and related transactions.
The accompanying notes are an integral part of these consolidated financial statements
2019 Scotiabank Annual Report | 145
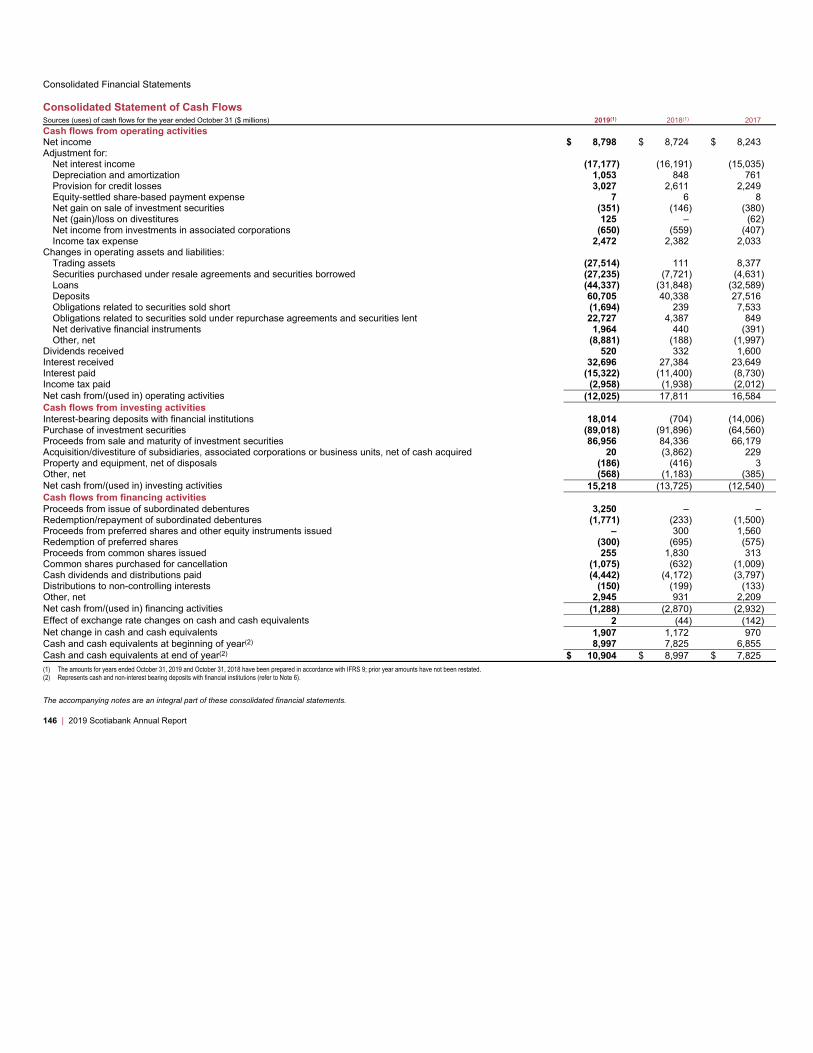
Consolidated Financial Statements
Consolidated Statement of Cash Flows
Sources (uses) of cash flows for the year ended October 31 ($ millions) 2019(1) 2018(1) 2017
Cash flows from operating activities
Net income $ 8,798 $ 8,724 $ 8,243
Adjustment for:
Net interest income (17,177) (16,191) (15,035)
Depreciation and amortization 1,053 848 761
Provision for credit losses 3,027 2,611 2,249
Equity-settled share-based payment expense 7 6 8
Net gain on sale of investment securities (351) (146) (380)
Net (gain)/loss on divestitures 125 – (62)
Net income from investments in associated corporations (650) (559) (407)
Income tax expense 2,472 2,382 2,033
Changes in operating assets and liabilities:
Trading assets (27,514) 111 8,377
Securities purchased under resale agreements and securities borrowed (27,235) (7,721) (4,631)
Loans (44,337) (31,848) (32,589)
Deposits 60,705 40,338 27,516
Obligations related to securities sold short (1,694) 239 7,533
Obligations related to securities sold under repurchase agreements and securities lent 22,727 4,387 849
Net derivative financial instruments 1,964 440 (391)
Other, net (8,881) (188) (1,997)
Dividends received 520 332 1,600
Interest received 32,696 27,384 23,649
Interest paid (15,322) (11,400) (8,730)
Income tax paid (2,958) (1,938) (2,012)
Net cash from/(used in) operating activities (12,025) 17,811 16,584
Cash flows from investing activities
Interest-bearing deposits with financial institutions 18,014 (704) (14,006)
Purchase of investment securities (89,018) (91,896) (64,560)
Proceeds from sale and maturity of investment securities 86,956 84,336 66,179
Acquisition/divestiture of subsidiaries, associated corporations or business units, net of cash acquired 20 (3,862) 229
Property and equipment, net of disposals (186) (416) 3
Other, net (568) (1,183) (385)
Net cash from/(used in) investing activities 15,218 (13,725) (12,540)
Cash flows from financing activities
Proceeds from issue of subordinated debentures 3,250 – –
Redemption/repayment of subordinated debentures (1,771) (233) (1,500)
Proceeds from preferred shares and other equity instruments issued – 300 1,560
Redemption of preferred shares (300) (695) (575)
Proceeds from common shares issued 255 1,830 313
Common shares purchased for cancellation (1,075) (632) (1,009)
Cash dividends and distributions paid (4,442) (4,172) (3,797)
Distributions to non-controlling interests (150) (199) (133)
Other, net 2,945 931 2,209
Net cash from/(used in) financing activities (1,288) (2,870) (2,932)
Effect of exchange rate changes on cash and cash equivalents 2 (44) (142)
Net change in cash and cash equivalents 1,907 1,172 970
Cash and cash equivalents at beginning of year(2) 8,997 7,825 6,855
Cash and cash equivalents at end of year(2)$ 10,904 $ 8,997 $ 7,825
(1) The amounts for years ended October 31, 2019 and October 31, 2018 have been prepared in accordance with IFRS 9; prior year amounts have not been restated.
(2) Represents cash and non-interest bearing deposits with financial institutions (refer to Note 6).
The accompanying notes are an integral part of these consolidated financial statements.
146 | 2019 Scotiabank Annual Report
Notes to the
2019 Consolidated
Financial Statements
Table of Contents
2019 Scotiabank Annual Report | 147
Page Note
148 1 Reporting entity
148 2 Basis of preparation
149 3 Significant accounting policies
166 4 Transition to IFRS 15
166 5 Future accounting developments
167 6 Cash and deposits with financial institutions
168 7 Fair value of financial instruments
174 8 Trading assets
175 9 Financial instruments designated at fair value through profit or
loss
176 10 Derivative financial instruments
184 11 Offsetting financial assets and financial liabilities
185 12 Investment securities
189 13 Loans, impaired loans and allowance for credit losses
197 14 Derecognition of financial assets
197 15 Structured entities
200 16 Property and equipment
201 17 Investments in associates
201 18 Goodwill and other intangible assets
203 19 Other assets
Page Note
203 20 Deposits
204 21 Subordinated debentures
204 22 Other liabilities
204 23 Provisions
205 24 Common shares, preferred shares and other equity instruments
208 25 Capital management
208 26 Share-based payments
211 27 Corporate income taxes
213 28 Employee benefits
218 29 Operating segments
221 30 Related party transactions
223 31 Principal subsidiaries and non-controlling interests in subsidiaries
224 32 Interest income and expense
224 33 Trading revenues
225 34 Earnings per share
225 35 Guarantees, commitments and pledged assets
227 36 Financial instruments – risk management
234 37 Acquisitions and divestitures

Consolidated Financial Statements
1 Reporting Entity
The Bank of Nova Scotia (the Bank) is a chartered Schedule I bank under the Bank Act (Canada) (the Bank Act) and is regulated by the Office of the Superintendent of
Financial Institutions (OSFI). The Bank is a global financial services provider offering a diverse range of products and services, including personal, commercial, corporate
and investment banking. The head office of the Bank is located at 1709 Hollis Street, Halifax, Nova Scotia, Canada and its executive offices are at Scotia Plaza, 44 King
Street West, Toronto, Canada. The common shares of the Bank are listed on the Toronto Stock Exchange and the New York Stock Exchange.
2 Basis of Preparation
Statement of compliance
These consolidated financial statements were prepared in accordance with International Financial Reporting Standards (IFRS) as issued by International Accounting
Standards Board (IASB) and accounting requirements of OSFI in accordance with Section 308 of the Bank Act. Section 308 states that, except as otherwise specified by
OSFI, the financial statements are to be prepared in accordance with IFRS.
The consolidated financial statements for the year ended October 31, 2019 have been approved by the Board of Directors for issue on November 26, 2019.
Certain comparative amounts have been restated to conform with the basis of presentation in the current year.
Basis of measurement
The consolidated financial statements have been prepared on the historical cost basis except for the following material items that are measured at fair value in the
Consolidated Statement of Financial Position:
• Financial assets and liabilities measured at fair value through profit or loss
• Financial assets and liabilities designated at fair value through profit or loss
• Derivative financial instruments
• Available-for-sale investment securities (applicable prior to November 1, 2017)
• Equity instruments designated at fair value through other comprehensive income (effective November 1, 2017)
• Debt instruments measured at fair value through other comprehensive income (effective November 1, 2017)
Functional and presentation currency
These consolidated financial statements are presented in Canadian dollars, which is the Bank’s functional currency. All financial information presented in Canadian dollars
has been rounded to the nearest million unless otherwise stated.
Management’s use of estimates, assumptions and judgments
The Bank’s accounting policies require estimates, assumptions and judgments that relate to matters that are inherently uncertain. The Bank has established procedures to
ensure that accounting policies are applied consistently. Estimates and underlying assumptions are reviewed on an ongoing basis. Revisions to accounting estimates are
recognized in the year in which the estimates are revised and in any future years affected.
Use of estimates and assumptions
The preparation of these consolidated financial statements, in conformity with IFRS, requires management to make estimates and assumptions that affect the reported
amount of assets and liabilities at the date of the consolidated financial statements, other comprehensive income and income and expenses during the reporting period.
Estimates made by management are based on historical experience and other assumptions that are believed to be reasonable. Key areas of estimation uncertainty include
those relating to the allowance for credit losses, the fair value of financial instruments (including derivatives), corporate income taxes, employee benefits, goodwill and
intangible assets, the fair value of all identifiable assets and liabilities as a result of business combinations, impairment of non-financial assets, derecognition of financial
assets and liabilities and provisions. While management makes its best estimates and assumptions, actual results could differ from these and other estimates.
Significant judgments
In the preparation of these consolidated financial statements, management is required to make significant judgments in the classification and presentation of transactions
and instruments and accounting for involvement with other entities.
148 | 2019 Scotiabank Annual Report
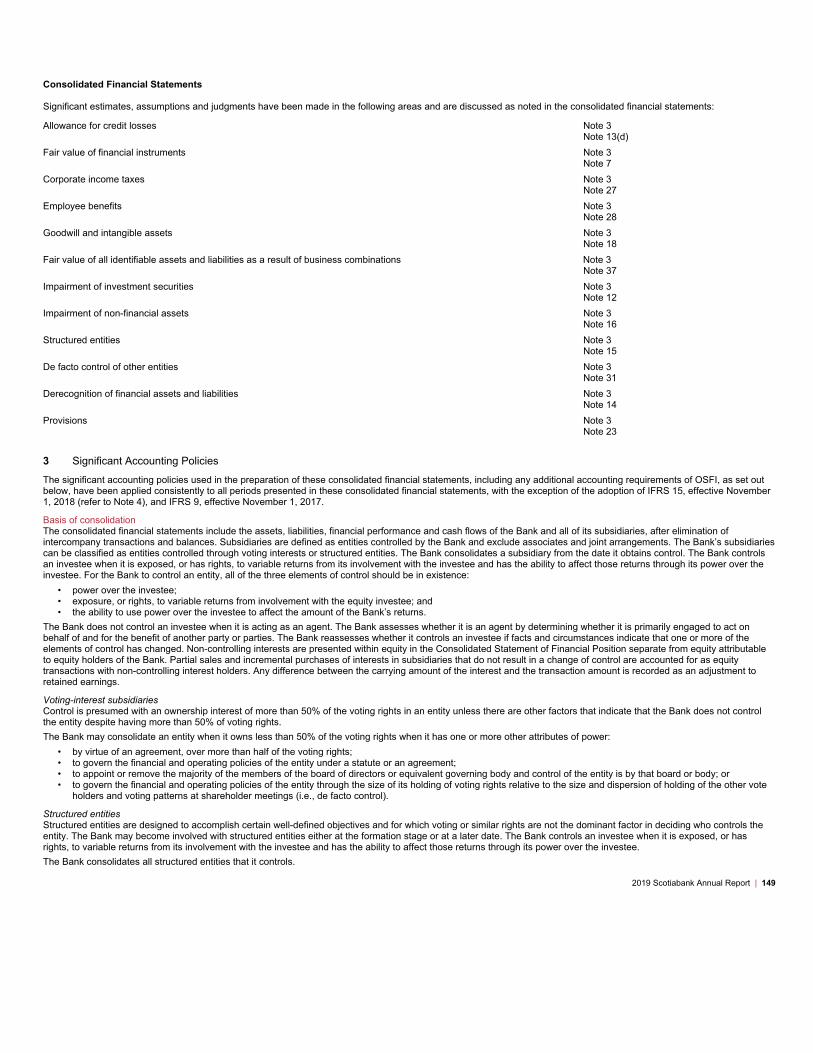
Consolidated Financial Statements
Significant estimates, assumptions and judgments have been made in the following areas and are discussed as noted in the consolidated financial statements:
Allowance for credit losses Note 3
Note 13(d)
Fair value of financial instruments Note 3
Note 7
Corporate income taxes Note 3
Note 27
Employee benefits Note 3
Note 28
Goodwill and intangible assets Note 3
Note 18
Fair value of all identifiable assets and liabilities as a result of business combinations Note 3
Note 37
Impairment of investment securities Note 3
Note 12
Impairment of non-financial assets Note 3
Note 16
Structured entities Note 3
Note 15
De facto control of other entities Note 3
Note 31
Derecognition of financial assets and liabilities Note 3
Note 14
Provisions Note 3
Note 23
3 Significant Accounting Policies
The significant accounting policies used in the preparation of these consolidated financial statements, including any additional accounting requirements of OSFI, as set out
below, have been applied consistently to all periods presented in these consolidated financial statements, with the exception of the adoption of IFRS 15, effective November
1, 2018 (refer to Note 4), and IFRS 9, effective November 1, 2017.
Basis of consolidation
The consolidated financial statements include the assets, liabilities, financial performance and cash flows of the Bank and all of its subsidiaries, after elimination of
intercompany transactions and balances. Subsidiaries are defined as entities controlled by the Bank and exclude associates and joint arrangements. The Bank’s subsidiaries
can be classified as entities controlled through voting interests or structured entities. The Bank consolidates a subsidiary from the date it obtains control. The Bank controls
an investee when it is exposed, or has rights, to variable returns from its involvement with the investee and has the ability to affect those returns through its power over the
investee. For the Bank to control an entity, all of the three elements of control should be in existence:
• power over the investee;
• exposure, or rights, to variable returns from involvement with the equity investee; and
• the ability to use power over the investee to affect the amount of the Bank’s returns.
The Bank does not control an investee when it is acting as an agent. The Bank assesses whether it is an agent by determining whether it is primarily engaged to act on
behalf of and for the benefit of another party or parties. The Bank reassesses whether it controls an investee if facts and circumstances indicate that one or more of the
elements of control has changed. Non-controlling interests are presented within equity in the Consolidated Statement of Financial Position separate from equity attributable
to equity holders of the Bank. Partial sales and incremental purchases of interests in subsidiaries that do not result in a change of control are accounted for as equity
transactions with non-controlling interest holders. Any difference between the carrying amount of the interest and the transaction amount is recorded as an adjustment to
retained earnings.
Voting-interest subsidiaries
Control is presumed with an ownership interest of more than 50% of the voting rights in an entity unless there are other factors that indicate that the Bank does not control
the entity despite having more than 50% of voting rights.
The Bank may consolidate an entity when it owns less than 50% of the voting rights when it has one or more other attributes of power:
• by virtue of an agreement, over more than half of the voting rights;
• to govern the financial and operating policies of the entity under a statute or an agreement;
• to appoint or remove the majority of the members of the board of directors or equivalent governing body and control of the entity is by that board or body; or
• to govern the financial and operating policies of the entity through the size of its holding of voting rights relative to the size and dispersion of holding of the other vote
holders and voting patterns at shareholder meetings (i.e., de facto control).
Structured entities
Structured entities are designed to accomplish certain well-defined objectives and for which voting or similar rights are not the dominant factor in deciding who controls the
entity. The Bank may become involved with structured entities either at the formation stage or at a later date. The Bank controls an investee when it is exposed, or has
rights, to variable returns from its involvement with the investee and has the ability to affect those returns through its power over the investee.
The Bank consolidates all structured entities that it controls.
2019 Scotiabank Annual Report | 149

Consolidated Financial Statements
Investments in associates
An associate is an entity in which the Bank has significant influence, but not control, over the operating and financial policies of the entity. Significant influence is ordinarily
presumed to exist when the Bank holds between 20% and 50% of the voting rights. The Bank may also be able to exercise significant influence through board
representation. The effects of potential voting rights that are currently exercisable or convertible are considered in assessing whether the Bank has significant influence.
Investments in associates are recognized initially at cost, which includes the purchase price and other costs directly attributable to the purchase. Associates are accounted
for using the equity method which reflects the Bank’s share of the increase or decrease of the post-acquisition earnings and other movements in the associate’s equity.
If there is a loss of significant influence and the investment ceases to be an associate, equity accounting is discontinued from the date of loss of significant influence. If the
retained interest on the date of loss of significant influence is a financial asset, it is measured at fair value and the difference between the fair value and the carrying value is
recorded as an unrealized gain or loss in the Consolidated Statement of Income.
Investments in associates are evaluated for impairment at the end of each financial reporting period, or more frequently if events or changes in circumstances indicate the
existence of objective evidence of impairment.
For purposes of applying the equity method for an investment that has a different reporting period from the Bank, adjustments are made for the effects of any significant
events or transactions that occur between the reporting date of the investment and the reporting date of the Bank.
Joint arrangements
A joint arrangement is an arrangement over which two or more parties have joint control. Joint control exists only when decisions about the relevant activities (i.e., those that
significantly affect the returns of the arrangement) require the unanimous consent of the parties sharing the control of the arrangement. Investments in joint arrangements
are classified as either joint operations or joint ventures depending on the contractual rights and obligations of each investor, rather than the legal structure of the joint
arrangement.
Similar to accounting for investment in associates, for joint ventures, investments are recognized initially at cost and accounted for using the equity method which reflects the
Bank’s share of the increase or decrease of the post-acquisition earnings and other movements in the joint venture’s equity. Investments in joint ventures are evaluated for
impairment at the end of each financial reporting period, or more frequently if events or changes in circumstances indicate the existence of objective evidence of impairment.
If there is a loss of joint control and it does not result in the Bank having significant influence over the joint venture, equity accounting is discontinued from the date of loss of
joint control. If the retained interest in the former joint venture on the date of loss of joint control is a financial asset, it is measured at fair value and the difference between
the fair value and the carrying value is recorded as an unrealized gain or loss in the Consolidated Statement of Income.
Translation of foreign currencies
The financial statements of each of the Bank’s foreign operations are measured using its functional currency, being the currency of the primary economic environment of the
foreign operation.
Translation gains and losses related to the Bank’s monetary items are recognized in non-interest income in the Consolidated Statement of Income. Revenues and expenses
denominated in foreign currencies are translated using average exchange rates, except for depreciation and amortization of buildings, equipment and leasehold
improvements of the Bank, purchased in foreign currency, which are translated using historical rates. Foreign currency non-monetary items that are measured at historical
cost are translated into the functional currency at historical rates. Foreign currency non-monetary items measured at fair value are translated into functional currency using
the rate of exchange at the date the fair value was determined. Foreign currency gains and losses on non-monetary items are recognized in the Consolidated Statement of
Income or Consolidated Statement of Comprehensive Income consistent with the gain or loss on the non-monetary item.
Unrealized gains and losses arising upon translation of foreign operations, together with any gains or losses arising from hedges of those net investment positions to the
extent effective, are credited or charged to net change in unrealized foreign currency translation gains/losses in other comprehensive income in the Consolidated Statement
of Comprehensive Income. On disposal or meeting the definition of partial disposal of a foreign operation, an appropriate portion of the translation differences previously
recognized in other comprehensive income are recognized in the Consolidated Statement of Income.
Financial assets and liabilities
Recognition and initial measurement
The Bank, on the date of origination or purchase, recognizes loans, debt and equity securities, deposits and subordinated debentures at the fair value of consideration paid.
Regular-way purchases and sales of financial assets are recognized on the settlement date. All other financial assets and liabilities, including derivatives, are initially
recognized on the trade date at which the Bank becomes a party to the contractual provisions of the instrument.
The initial measurement of a financial asset or liability is at fair value plus transaction costs that are directly attributable to its purchase or issuance. For instruments
measured at fair value through profit or loss, transaction costs are recognized immediately in profit or loss.
Classification and measurement, derecognition, and impairment of financial instruments effective November 1, 2017
Classification and measurement
Classification and measurement of financial assets
Financial assets are classified into one of the following measurement categories:
• Amortized cost;
• Fair value through other comprehensive income (FVOCI);
• Fair value through profit or loss (FVTPL);
• Elected at fair value through other comprehensive income (Equities only); or
• Designated at FVTPL
150 | 2019 Scotiabank Annual Report

Consolidated Financial Statements
Financial assets include both debt and equity instruments.
Debt instruments
Debt instruments, including loans and debt securities, are classified into one of the following measurement categories:
• Amortized cost;
• Fair value through other comprehensive income (FVOCI);
• Fair value through profit or loss (FVTPL); or
• Designated at FVTPL
Classification of debt instruments is determined based on:
(i) The business model under which the asset is held; and
(ii) The contractual cash flow characteristics of the instrument.
Business model assessment
Business model assessment involves determining how financial assets are managed in order to generate cash flows. The Bank’s business model assessment is based on
the following categories:
• Held to collect: The objective of the business model is to hold assets and collect contractual cash flows. Any sales of the asset are incidental to the objective of
the model.
• Held to collect and for sale: Both collecting contractual cash flows and sales are integral to achieving the objectives of the business model.
• Other business model: The business model is neither held-to-collect nor held-to-collect and for sale.
The Bank assesses business model at a portfolio level reflective of how groups of assets are managed together to achieve a particular business objective. For the
assessment of a business model, the Bank takes into consideration the following factors:
• How the performance of assets in a portfolio is evaluated and reported to group heads and other key decision makers within the Bank’s business lines;
• How compensation is determined for the Bank’s business lines’ management that manages the assets;
• Whether the assets are held for trading purposes i.e., assets that the Bank acquires or incurs principally for the purpose of selling or repurchasing in the near
term, or holds as part of a portfolio that is managed together for short-term profit or position taking;
• The risks that affect the performance of assets held within a business model and how those risks are managed; and
• The frequency and volume of sales in prior periods and expectations about future sales activity.
Contractual cash flow characteristics assessment
The contractual cash flow characteristics assessment involves assessing the contractual features of an instrument to determine if they give rise to cash flows that are
consistent with a basic lending arrangement. Contractual cash flows are consistent with a basic lending arrangement if they represent cash flows that are solely payments of
principal and interest on the principal amount outstanding (SPPI).
Principal is defined as the fair value of the instrument at initial recognition. Principal may change over the life of the instrument due to repayments or amortization of
premium/discount.
Interest is defined as the consideration for the time value of money and the credit risk associated with the principal amount outstanding and for other basic lending risks and
costs (liquidity risk and administrative costs), and a profit margin.
If the Bank identifies any contractual features that could significantly modify the cash flows of the instrument such that they are no longer consistent with a basic lending
arrangement, the related financial asset is classified and measured at FVTPL.
Debt instruments measured at amortized cost
Debt instruments are measured at amortized cost if they are held within a business model whose objective is to hold for collection of contractual cash flows where those
cash flows represent solely payments of principal and interest. After initial measurement, debt instruments in this category are carried at amortized cost. Interest income on
these instruments is recognized in interest income using the effective interest rate method. The effective interest rate is the rate that discounts estimated future cash
payments or receipts through the expected life of the financial asset to the gross carrying amount of a financial asset. Amortized cost is calculated by taking into account any
discount or premium on acquisition, transaction costs and fees that are an integral part of the effective interest rate.
Impairment on debt instruments measured at amortized cost is calculated using the expected credit loss approach. Loans and debt securities measured at amortized cost
are presented net of the allowance for credit losses (ACL) in the statement of financial position.
Debt instruments measured at FVOCI
Debt instruments are measured at FVOCI if they are held within a business model whose objective is to hold for collection of contractual cash flows and for selling financial
assets, where the assets’ cash flows represent payments that are solely payments of principal and interest. Subsequent to initial recognition, unrealized gains and losses on
debt instruments measured at FVOCI are recorded in other comprehensive income (OCI), unless the instrument is designated in a fair value hedge relationship. When
designated in a fair value hedge relationship, any changes in fair value due to changes in the hedged risk are recognized in Non-interest income in the Consolidated
Statement of Income. Upon derecognition, realized gains and losses are reclassified from OCI and recorded in Non-interest income in the Consolidated Statement of Income
on an average cost basis. Foreign exchange gains and losses that relate to the amortized cost of the debt instrument are recognized in the Consolidated Statement of
Income. Premiums, discounts and related transaction costs are amortized over the expected life of the instrument to Interest income in the Consolidated Statement of
Income using the effective interest rate method.
Impairment on debt instruments measured at FVOCI is calculated using the expected credit loss approach. The ACL on debt instruments measured at FVOCI does not
reduce the carrying amount of the asset in the Consolidated Statement of Financial Position, which remains at its fair value. Instead, an amount equal to the allowance that
would arise if the assets were measured at amortised cost is recognised in OCI with a corresponding charge to Provision for credit losses in the Consolidated Statement of
Income. The accumulated allowance recognised in OCI is recycled to the Consolidated Statement of Income upon derecognition of the debt instrument.
2019 Scotiabank Annual Report | 151

Consolidated Financial Statements
Debt instruments measured at FVTPL
Debt instruments are measured at FVTPL if assets:
(i) Are held for trading purposes;
(ii) Are held as part of a portfolio managed on a fair value basis; or
(iii) Whose cash flows do not represent payments that are solely payments of principal and interest.
These instruments are measured at fair value in the Consolidated Statement of Financial Position, with transaction costs recognized immediately in the Consolidated
Statement of Income as part of Non-interest income. Realized and unrealized gains and losses are recognized as part of Non-interest income in the Consolidated Statement
of Income.
Debt instruments designated at FVTPL
Financial assets classified in this category are those that have been designated by the Bank upon initial recognition, and once designated, the designation is irrevocable. The
FVTPL designation is available only for those financial assets for which a reliable estimate of fair value can be obtained. Financial assets are designated at FVTPL if doing
so eliminates or significantly reduces an accounting mismatch which would otherwise arise.
Financial assets designated at FVTPL are recorded in the Consolidated Statement of Financial Position at fair value. Changes in fair value are recognized in Non-interest
income in the Consolidated Statement of Income.
Equity instruments
Equity instruments are classified into one of the following measurement categories:
• Fair value through profit or loss (FVTPL); or
• Elected at fair value through other comprehensive income (FVOCI).
Equity instruments measured at FVTPL
Equity instruments are measured at FVTPL, unless an election is made to designate them at FVOCI upon purchase, with transaction costs recognized immediately in the
Consolidated Statement of Income as part of Non-interest income. Subsequent to initial recognition the changes in fair value and dividends received are recognized as part
of Non-interest income in the Consolidated Statement of Income.
Equity instruments measured at FVOCI
At initial recognition, there is an irrevocable option for the Bank to classify non-trading equity instruments at FVOCI. This election is used for certain equity investments for
strategic or longer term investment purposes. This election is made on an instrument-by-instrument basis and is not available to equity instruments that are held for trading
purposes.
Gains and losses on these instruments including when derecognized/sold are recorded in OCI and are not subsequently reclassified to the Consolidated Statement of
Income. As such, there is no specific impairment requirement. Dividends received are recorded in Interest income in the Consolidated Statement of Income. Any transaction
costs incurred upon purchase of the security are added to the cost basis of the security and are not reclassified to the Consolidated Statement of Income on sale of the
security.
Classification and measurement of financial liabilities
Financial liabilities are classified into one of the following measurement categories:
• Fair value through profit or loss (FVTPL);
• Amortized cost; or
• Designated at FVTPL.
Financial liabilities measured at FVTPL
Financial liabilities measured at FVTPL are held principally for the purpose of repurchasing in the near term, or form part of a portfolio of identified financial instruments that
are managed together and for which there is evidence of a recent actual pattern of short term profit-taking. Financial liabilities are recognized on a trade date basis and are
accounted for at fair value, with changes in fair value and any gains or losses recognized in the Consolidated Statement of Income as part of the non-interest income.
Transaction costs are expensed as incurred.
Financial liabilities measured at amortized cost
Deposits, subordinated notes and debentures are accounted for at amortized cost. Interest on deposits, calculated using the effective interest rate method, is recognized as
interest expense. Interest on subordinated notes and debentures, including capitalized transaction costs, is recognized using the effective interest rate method as interest
expense.
Financial liabilities designated at FVTPL
Financial liabilities classified in this category are those that have been designated by the Bank upon initial recognition, and once designated, the designation is irrevocable.
The FVTPL designation is available only for those financial liabilities for which a reliable estimate of fair value can be obtained.
Financial liabilities are designated at FVTPL when one of the following criteria is met:
• The designation eliminates or significantly reduces an accounting mismatch which would otherwise arise; or
• A group of financial liabilities are managed and their performance is evaluated on a fair value basis, in accordance with a documented risk management strategy;
or
• The financial liability contains one or more embedded derivatives which significantly modify the cash flows otherwise required.
Financial liabilities designated at FVTPL are recorded in the Consolidated Statement of Financial Position at fair value. Any changes in fair value are recognized in
Non-interest income in the Consolidated Statement of Income, except for changes in fair value arising from changes in the Bank’s own credit risk which are recognized in the
OCI. Changes in fair value due to changes in the Bank’s own credit risk are not subsequently reclassified to Consolidated Statement of Income upon
derecognition/extinguishment of the liabilities.
152 | 2019 Scotiabank Annual Report

Consolidated Financial Statements
Determination of fair value
Fair value of a financial asset or liability is the price that would be received to sell an asset or paid to transfer a liability in an orderly transaction between market participants
in the principal, or in its absence, the most advantageous market to which the Bank has access at the measurement date.
The Bank values instruments carried at fair value using quoted market prices, where available. Unadjusted quoted market prices for identical instruments represent a Level 1
valuation. When quoted market prices are not available, the Bank maximizes the use of observable inputs within valuation models. When all significant inputs are
observable, the valuation is classified as Level 2. Valuations that require the significant use of unobservable inputs are considered Level 3.
Inception gains and losses are only recognized where the valuation is dependent only on observable market data, otherwise, they are deferred and amortized over the life of
the related contract or until the valuation inputs become observable.
IFRS 13 permits a measurement exception that allows an entity to determine the fair value of a group of financial assets and liabilities with offsetting risks based on the sale
or transfer of its net exposure to a particular risk (or risks). The Bank has adopted this exception through an accounting policy choice. Consequently, the fair values of certain
portfolios of financial instruments are determined based on the net exposure of those instruments to particular market, credit or funding risk.
In determining fair value for certain instruments or portfolios of instruments, valuation adjustments or reserves may be required to arrive at a more accurate representation of
fair value. These adjustments include those made for credit risk, bid-offer spreads, unobservable parameters, constraints on prices in inactive or illiquid markets and when
applicable funding costs.
Derecognition of financial assets and liabilities
Derecognition of financial assets
The derecognition criteria are applied to the transfer of part of an asset, rather than the asset as a whole, only if such part comprises specifically identified cash flows from
the asset, a fully proportionate share of the cash flows from the asset, or a fully proportionate share of specifically identified cash flows from the asset.
A financial asset is derecognized when the contractual rights to the cash flows from the asset has expired; or the Bank transfers the contractual rights to receive the cash
flows from the financial asset; or has assumed an obligation to pay those cash flows to an independent third-party; or the Bank has transferred substantially all the risks and
rewards of ownership of that asset to an independent third-party. Management determines whether substantially all the risk and rewards of ownership have been transferred
by quantitatively comparing the variability in cash flows before and after the transfer. If the variability in cash flows remains significantly similar subsequent to the transfer, the
Bank has retained substantially all of the risks and rewards of ownership.
Where substantially all the risks and rewards of ownership of the financial asset are neither retained nor transferred, the Bank derecognizes the transferred asset only if it
has lost control over that asset. Control over the asset is represented by the practical ability to sell the transferred asset. If the Bank retains control over the asset, it will
continue to recognize the asset to the extent of its continuing involvement. At times such continuing involvement may be in the form of investment in senior or subordinated
tranches of notes issued by non-consolidated structured entities.
On derecognition of a financial asset, the difference between the carrying amount and the sum of (i) the consideration received (including any new asset obtained less any
new liability assumed) and (ii) any cumulative gain or loss that had been recognized in other comprehensive income is recognized in the Consolidated Statement of Income.
Transfers of financial assets that do not qualify for derecognition are reported as secured financings in the Consolidated Statement of Financial Position.
Derecognition of financial liabilities
A financial liability is derecognized when the obligation under the liability is discharged, canceled or expires. If an existing financial liability is replaced by another from the
same counterparty on substantially different terms, or the terms of the existing liability are substantially modified, such an exchange or modification is treated as a
derecognition of the original liability and the recognition of a new liability at fair value. The difference in the respective carrying amount of the existing liability and the new
liability is recognized as a gain/loss in the Consolidated Statement of Income.
Impairment
Scope
The Bank applies a three-stage approach to measure allowance for credit losses, using an expected credit loss approach as required under IFRS 9, for the following
categories of financial instruments that are not measured at fair value through profit or loss:
• Amortized cost financial assets;
• Debt securities classified as at FVOCI;
• Off-balance sheet loan commitments; and
• Financial guarantee contracts.
Expected credit loss impairment model
The Bank’s allowance for credit losses calculations are outputs of models with a number of underlying assumptions regarding the choice of variable inputs and their
interdependencies. The expected credit loss impairment model reflects the present value of all cash shortfalls related to default events either (i) over the following twelve
months or (ii) over the expected life of a financial instrument depending on credit deterioration from inception. The allowance for credit losses reflects an unbiased,
probability-weighted outcome which considers multiple scenarios based on reasonable and supportable forecasts.
This impairment model measures credit loss allowances using a three-stage approach based on the extent of credit deterioration since origination:
• Stage 1 – Where there has not been a significant increase in credit risk (SIR) since initial recognition of a financial instrument, an amount equal to 12 months
expected credit loss is recorded. The expected credit loss is computed using a probability of default occurring over the next 12 months. For those instruments
with a remaining maturity of less than 12 months, a probability of default corresponding to remaining term to maturity is used.
2019 Scotiabank Annual Report | 153

Consolidated Financial Statements
• Stage 2 – When a financial instrument experiences a SIR subsequent to origination but is not considered to be in default, it is included in Stage 2. This requires
the computation of expected credit loss based on the probability of default over the remaining estimated life of the financial instrument.
• Stage 3 – Financial instruments that are considered to be in default are included in this stage. Similar to Stage 2, the allowance for credit losses captures the
lifetime expected credit losses.
Measurement of expected credit loss
The probability of default (PD), exposure at default (EAD), and loss given default (LGD) inputs used to estimate expected credit losses are modelled based on
macroeconomic variables that are most closely related with credit losses in the relevant portfolio.
Details of these statistical parameters/inputs are as follows:
• PD – The probability of default is an estimate of the likelihood of default over a given time horizon. A default may only happen at a certain time over the
remaining estimated life, if the facility has not been previously derecognized and is still in the portfolio.
• EAD – The exposure at default is an estimate of the exposure at a future default date, taking into account expected changes in the exposure after the reporting
date, including repayments of principal and interest, whether scheduled by contract or otherwise, expected drawdowns on committed facilities, and accrued
interest from missed payments.
• LGD – The loss given default is an estimate of the loss arising in the case where a default occurs at a given time. It is based on the difference between the
contractual cash flows due and those that the lender would expect to receive, including from the realization of any collateral. It is usually expressed as a
percentage of the EAD.
Forward-looking information
The estimation of expected credit losses for each stage and the assessment of significant increases in credit risk consider information about past events and current
conditions as well as reasonable and supportable forecasts of future events and economic conditions. The estimation and application of forward-looking information may
require significant judgment.
Macroeconomic factors
In its models, the Bank relies on a broad range of forward-looking economic information as inputs, such as: GDP growth, unemployment rates, central-bank interest rates,
and house-price indices. The inputs and models used for calculating expected credit losses may not always capture all characteristics of the market at the date of the
financial statements. Qualitative adjustments or overlays may be made as temporary adjustments using expert credit judgment.
Multiple forward-looking scenarios
The Bank determines its allowance for credit losses using three probability-weighted forward-looking scenarios. The Bank considers both internal and external sources of
information and data in order to achieve an unbiased projections and forecasts. The Bank prepares the scenarios using forecasts generated by Scotiabank Economics (SE).
The forecasts are created using internal and external models which are modified by SE as necessary to formulate a ‘base case’ view of the most probable future direction of
relevant economic variables as well as a representative range of other possible forecast scenarios. The process involves the development of two additional economic
scenarios and consideration of the relative probabilities of each outcome.
The ‘base case’ represents the most likely outcome and is aligned with information used by the Bank for other purposes such as strategic planning and budgeting. The other
scenarios represent more optimistic and more pessimistic outcomes. The Bank has identified and documented key drivers of credit risk and credit losses for each portfolio of
financial instruments and, using an analysis of historical data, has estimated relationships between macroeconomic variables, credit risk, and credit losses.
Assessment of significant increase in credit risk (SIR)
At each reporting date, the Bank assesses whether there has been a significant increase in credit risk for exposures since initial recognition by comparing the risk of default
occurring over the remaining expected life from the reporting date and the date of initial recognition. The assessment considers borrower-specific quantitative and qualitative
information without consideration of collateral, and the impact of forward-looking macroeconomic factors.
The common assessments for SIR on retail and non-retail portfolios include macroeconomic outlook, management judgement, and delinquency and monitoring. Forward-
looking macroeconomic factors are a key component of the macroeconomic outlook. The importance and relevance of each specific macroeconomic factor depends on the
type of product, characteristics of the financial instruments and the borrower and the geographical region. Quantitative models may not always be able to capture all
reasonable and supportable information that may indicate a significant increase in credit risk. Qualitative factors may be assessed to supplement the gap. Examples of
situations include changes in adjudication criteria for a particular group of borrowers; changes in portfolio composition; and natural disasters impacting certain portfolios. With
regards to delinquency and monitoring, there is a rebuttable presumption that the credit risk of the financial instrument has increased since initial recognition when
contractual payments are more than 30 days overdue.
Retail portfolio – For retail exposures, a significant increase in credit risk cannot be assessed using forward looking information at an individual account level. Therefore, the
assessment must be done at the segment level. Segment migration thresholds exist for each PD model by product which considers the proportionate change in PD as well
as the absolute change in PD. The thresholds used for PD migration are reviewed and assessed at least annually, unless there is a significant change in credit risk
management practices in which case the review is brought forward.
Non-retail portfolio – The Bank uses a risk rating scale (IG codes) for its non-retail exposures. All non-retail exposures have an IG code assigned that reflects the probability
of default of the borrower. Both borrower specific and non-borrower specific (i.e. macroeconomic) forward looking information is considered and reflected in the IG rating.
Significant increase in credit risk is evaluated based on the migration of the exposures among IG codes.
Expected life
When measuring expected credit loss, the Bank considers the maximum contractual period over which the Bank is exposed to credit risk. All contractual terms are
considered when determining the expected life, including prepayment, and extension and rollover options. For certain revolving credit facilities, such as credit cards, the
expected life is estimated based on the period over which the Bank is exposed to credit risk and how the credit losses are mitigated by management actions.
154 | 2019 Scotiabank Annual Report

Consolidated Financial Statements
Presentation of allowance for credit losses in the Statement of Financial Position
• Financial assets measured at amortized cost: as a deduction from the gross carrying amount of the financial assets;
• Debt instruments measured at fair value through other comprehensive income: no allowance is recognized in the Statement of Financial Position because the
carrying value of these assets is their fair value. However, the allowance determined is presented in the accumulated other comprehensive income;
• Off-balance sheet credit risks include undrawn lending commitments, letters of credit and letters of guarantee: as a provision in other liabilities.
Modified financial assets
If the terms of a financial asset are modified or an existing financial asset is replaced with a new one, an assessment is made to determine if the existing financial asset
should be derecognized. Where a modification does not result in derecognition, the date of origination continues to be used to determine SIR. Where a modification results in
derecognition, the new financial asset is recognized at its fair value on the modification date. The modification date is also the date of origination for this new asset.
The Bank may modify the contractual terms of loans for either commercial or credit reasons. The terms of a loan in good standing may be modified for commercial reasons
to provide competitive pricing to borrowers. Loans are also modified for credit reasons where the contractual terms are modified to grant a concession to a borrower that may
be experiencing financial difficulty.
For all financial assets modifications of the contractual terms may result in derecognition of the original asset when the changes to the terms of the loans are considered
substantial. These terms include interest rate, authorized amount, term, or type of underlying collateral. The original loan is derecognized and the new loan is recognized at
its fair value. The difference between the carrying value of the derecognized asset and the fair value of the new asset is recognized in the Income Statement.
For all loans, performing and credit-impaired, where the modification of terms did not result in the derecognition of the loan, the gross carrying amount of the modified loan is
recalculated based on the present value of the modified cash flows discounted at the original effective interest rate and any gain or loss from the modification is recorded in
the provision for credit losses line in the income statement.
Definition of default
The Bank considers a financial instrument to be in default as a result of one or more loss events that occurred after the date of initial recognition of the instrument and the
loss event has a negative impact on the estimated future cash flows of the instrument that can be reliably estimated. This includes events that indicate:
• significant financial difficulty of the borrower;
• default or delinquency in interest or principal payments;
• high probability of the borrower entering a phase of bankruptcy or a financial reorganization;
• measurable decrease in the estimated future cash flows from the loan or the underlying assets that back the loan.
The Bank considers that default has occurred and classifies the financial asset as impaired when it is more than 90 days past due, with the exception of credit card
receivables that are treated as defaulted when 180 days past due, unless reasonable and supportable information demonstrates that a more lagging default criterion is
appropriate.
Write-off policy
The Bank writes off an impaired financial asset (and the related impairment allowance), either partially or in full, when there is no realistic prospect of recovery. Where
financial assets are secured, write-off is generally after receipt of any proceeds from the realization of security. In circumstances where the net realizable value of any
collateral has been determined and there is no reasonable expectation of further recovery, write-off may be earlier. Credit card receivables 180 days past due are written-off.
In subsequent periods, any recoveries of amounts previously written off are credited to the provision for credit losses in the Consolidated Statement of Income.
Purchased loans
All purchased loans are initially measured at fair value on the date of acquisition. As a result no allowance for credit losses would be recorded in the Consolidated Statement
of Financial Position on the date of acquisition. Purchased loans may fit into either of the two categories: Performing loans or Purchased Credit Impaired (PCI) loans.
Purchased performing loans follow the same accounting as originated performing loans and are reflected in Stage 1 on the date of the acquisition. They will be subject to a
12-month allowance for credit losses which is recorded as a provision for credit losses in the Consolidated Statement of Income. The fair value adjustment set up for these
loans on the date of acquisition is amortized into interest income over the life of these loans.
PCI loans are reflected in Stage 3 and are always subject to lifetime allowance for credit losses. Any changes in the expected cash flows since the date of acquisition are
recorded as a charge/recovery in the provision for credit losses in the Consolidated Statement of Income at the end of all reporting periods subsequent to the date of
acquisition.
Classification and measurement, derecognition, and impairment of financial instruments effective prior to November 1, 2017
Trading assets and liabilities
Trading assets and liabilities are measured at fair value in the Consolidated Statement of Financial Position, with transaction costs recognized immediately in the
Consolidated Statement of Income as part of non-interest income – trading revenues. Gains and losses realized on disposal and unrealized gains and losses due to fair
value changes on trading assets and liabilities, other than certain derivatives, are recognized as part of non-interest income – trading revenues in the Consolidated
Statement of Income. Trading assets and liabilities are not reclassified subsequent to their initial recognition.
Investment securities
Investment securities are comprised of available-for-sale and held-to-maturity securities.
Available-for-sale investment securities
Available-for-sale investment securities include equity and debt securities. Equity investments classified as available-for-sale are those which are neither classified as
held-for-trading nor designated at fair value through profit or loss. Debt securities in this category are those which are
2019 Scotiabank Annual Report | 155

Consolidated Financial Statements
intended to be held for an indefinite period of time and which may be sold in response to needs for liquidity or in response to changes in the market conditions.
Available-for-sale investment securities are recorded at fair value with unrealized gains and losses recorded in other comprehensive income. When realized, these gains and
losses are reclassified from the Consolidated Statement of Comprehensive Income and recorded in the Consolidated Statement of Income on an average cost basis. For
non-monetary investment securities designated as available-for-sale, the gain or loss recognized in other comprehensive income includes any related foreign exchange
gains or losses. Foreign exchange gains and losses that relate to the amortized cost of an available-for-sale debt security are recognized in the Consolidated Statement of
Income.
Premiums, discounts and related transaction costs on available-for-sale debt securities are amortized over the expected life of the instrument to interest income – securities
in the Consolidated Statement of Income using the effective interest method.
Transaction costs on available-for-sale equity securities are initially capitalized and then recognized as part of the net realized gain/loss on subsequent sale of the instrument
in the Consolidated Statement of Income.
Held-to-maturity investment securities
Held-to-maturity investment securities are non-derivative assets with fixed or determinable payments and fixed maturity that the Bank has the positive intent and ability to
hold to maturity, and which do not meet the definition of a loan, are not held-for-trading, and are not designated at fair value through profit or loss or as available-for-sale.
After initial measurement, held-to-maturity investment securities are carried at amortized cost using the effective interest method, less impairment. Amortized cost is
calculated by taking into account any discount or premium on acquisition, transaction costs and fees that are an integral part of the effective interest rate. The amortization is
included in interest income – securities in the Consolidated Statement of Income.
A sale or reclassification of a more than an insignificant amount of held-to-maturity investments would result in the reclassification of all held-to-maturity investments as
available-for-sale, and would prevent the Bank from classifying investment securities as held-to-maturity for the current and the following two financial years. However, sales
and reclassifications in any of the following circumstances would not trigger a reclassification:
• Sales or reclassifications that are so close to maturity that changes in the market rate of interest would not have a significant effect on the financial asset’s fair
value;
• Sales or reclassifications after the Bank has collected substantially all of the asset’s original principal; or
• Sales or reclassifications attributable to non-recurring isolated events beyond the Bank’s control that could not have been reasonably anticipated.
Impairment of investment securities
Investment securities are evaluated for impairment at the end of each reporting period, or more frequently if events or changes in circumstances indicate the existence of
objective evidence of impairment.
In the case of equity instruments classified as available-for-sale, a significant or prolonged decline in the fair value of the security below its original cost is objective evidence
of impairment. In the case of debt instruments classified as available-for-sale and held-to-maturity investment securities, impairment is assessed based on the same criteria
as impairment of loans.
When a decline in value of available-for-sale debt or equity instrument is due to impairment, the carrying value of the security continues to reflect fair value. Losses arising
from impairment are reclassified from accumulated other comprehensive income and included in net gain on investment securities within non-interest income in the
Consolidated Statement of Income.
The losses arising from impairment of held-to-maturity investment securities are recognized in net gain on investment securities within non-interest income in the
Consolidated Statement of Income.
Reversals of impairment losses on available-for-sale debt instruments resulting from increases in fair value related to events occurring after the date of impairment are
included in net gain on investment securities within non-interest income in the Consolidated Statement of Income, to a maximum of the original impairment charge.
Reversals of impairment on available-for-sale equity instruments are not recognized in the Consolidated Statement of Income; increases in fair value of such instruments
after impairment are recognized in accumulated other comprehensive income.
Reversals of impairment losses on held-to-maturity investment securities are included in net gain on investment securities within non-interest income in the Consolidated
Statement of Income, to a maximum of the amortized cost of the investment before the original impairment charge.
Financial assets and liabilities designated at fair value through profit or loss
Financial assets and financial liabilities classified in this category are those that have been designated by the Bank on initial recognition. The Bank may only designate an
instrument at fair value through profit or loss when one of the following criteria is met, and designation is determined on an instrument by instrument basis:
• The designation eliminates or significantly reduces the inconsistent treatment that would otherwise arise from measuring the assets or liabilities on a different
basis; or
• The assets and liabilities are part of a group of financial assets, financial liabilities or both which are managed together and their performance evaluated on a fair
value basis, in accordance with a documented risk management or investment strategy and the information about the group is provided to key management
personnel and it can be demonstrated that significant financial risks are eliminated or significantly reduced; or
• The financial instrument contains one or more embedded derivatives which significantly modify the cash flows otherwise required.
Financial assets and financial liabilities designated at fair value through profit or loss are recorded in the Consolidated Statement of Financial Position at fair value. For
assets designated at fair value through profit or loss, changes in fair value are recognized in the Consolidated Statement of Income. For liabilities designated at fair value
through profit or loss, changes in fair value arising from changes in the Bank’s own credit risk are recognized in the Consolidated Statement of Other Comprehensive Income
(OCI), without subsequent reclassification to the Consolidated Statement of Income, unless doing so would create or increase an accounting mismatch. All other changes in
fair value are recognized in the Consolidated Statement of Income.
156 | 2019 Scotiabank Annual Report

Consolidated Financial Statements
Loans
Loans include loans and advances originated or purchased by the Bank which are not classified as held-for-trading, held-to-maturity or designated at fair value. Debt
securities, which are not trading securities or have not been designated as available-for-sale securities and that are not quoted in an active market, are also classified as
loans.
Loans originated by the Bank are recognized when cash is advanced to a borrower. Loans purchased are recognized when cash consideration is paid by the Bank. Loans
are measured at amortized cost using the effective interest method, less any impairment losses. Loans are stated net of allowance for credit losses.
Derecognition of financial assets and liabilities
Derecognition of financial assets
The derecognition criteria are applied to the transfer of part of an asset, rather than the asset as a whole, only if such part comprises specifically identified cash flows from
the asset, a fully proportionate share of the cash flows from the asset, or a fully proportionate share of specifically identified cash flows from the asset.
A financial asset is derecognized when the contractual rights to the cash flows from the asset has expired; or the Bank transfers the contractual rights to receive the cash
flows from the financial asset; or has assumed an obligation to pay those cash flows to an independent third-party; or the Bank has transferred substantially all the risks and
rewards of ownership of that asset to an independent third-party. Management determines whether substantially all the risk and rewards of ownership have been transferred
by quantitatively comparing the variability in cash flows before and after the transfer. If the variability in cash flows remains significantly similar subsequent to the transfer, the
Bank has retained substantially all of the risks and rewards of ownership.
Where substantially all the risks and rewards of ownership of the financial asset are neither retained nor transferred, the Bank derecognizes the transferred asset only if it
has lost control over that asset. Control over the asset is represented by the practical ability to sell the transferred asset. If the Bank retains control over the asset, it will
continue to recognize the asset to the extent of its continuing involvement. At times such continuing involvement may be in the form of investment in senior or subordinated
tranches of notes issued by non-consolidated structured entities.
On derecognition of a financial asset, the difference between the carrying amount and the sum of (i) the consideration received (including any new asset obtained less any
new liability assumed) and (ii) any cumulative gain or loss that had been recognized in other comprehensive income is recognized in the Consolidated Statement of Income.
Transfers of financial assets that do not qualify for derecognition are reported as secured financings in the Consolidated Statement of Financial Position.
Derecognition of financial liabilities
A financial liability is derecognized when the obligation under the liability is discharged, canceled or expires. If an existing financial liability is replaced by another from the
same counterparty on substantially different terms, or the terms of the existing liability are substantially modified, such an exchange or modification is treated as a
derecognition of the original liability and the recognition of a new liability at fair value. The difference in the respective carrying amount of the existing liability and the new
liability is recognized as a gain/loss in the Consolidated Statement of Income.
Loan impairment and allowance for credit losses:
The Bank considers a loan to be impaired when there is objective evidence of impairment as a result of one or more loss events that occurred after the date of initial
recognition of the loan and the loss event has an impact on the estimated future cash flows of the loan that can be reliably estimated.
Objective evidence is represented by observable data that comes to the attention of the Bank and includes events that indicate:
• significant financial difficulty of the borrower;
• a default or delinquency in interest or principal payments;
• a high probability of the borrower entering a phase of bankruptcy or a financial reorganization;
• a measurable decrease in the estimated future cash flows from the loan or the underlying assets that back the loan.
If a payment on a loan is contractually 90 days in arrears, the loan will be classified as impaired, if not already classified as such, unless the loan is fully secured, the
collection of the debt is in process, and the collection efforts are reasonably expected to result in repayment of the loan or in restoring it to a current status within 180 days
from the date a payment has become contractually in arrears. Finally, a loan that is contractually 180 days in arrears is classified as impaired in all situations, except when it
is guaranteed or insured by the Canadian government, the provinces or a Canadian government agency; such loans are classified as impaired if the loan is contractually in
arrears for 365 days. Any credit card loan that has a payment that is contractually 180 days in arrears is written off.
Losses expected as a result of future events are not recognized.
The Bank considers evidence of impairment for loans and advances at both an individual and collective level.
Individual impairment allowance
For all loans that are considered individually significant, the Bank assesses on a case-by-case basis at each reporting period whether an individual allowance for loan losses
is required.
For those loans where objective evidence of impairment exists and the Bank has determined the loan to be impaired, impairment losses are determined based on the Bank’s
aggregate exposure to the customer considering the following factors:
• the customer’s ability to generate sufficient cash flow to service debt obligations;
• the extent of other creditors’ commitments ranking ahead of, or pari passu with, the Bank and the likelihood of other creditors continuing to support the company;
• the complexity of determining the aggregate amount and ranking of all creditor claims and the extent to which legal and insurance uncertainties are evident; and
• the realizable value of security (or other credit mitigants) and likelihood of successful repossession.
2019 Scotiabank Annual Report | 157

Consolidated Financial Statements
Impairment losses are calculated by discounting the expected future cash flows of a loan at its original effective interest rate, and comparing the resultant present value with
the loan’s current carrying amount. This results in interest income being recognized using the original effective interest rate.
Collective impairment allowance
For loans that have not been individually assessed as being impaired, the Bank pools them into groups to assess them on a collective basis. Collective allowances are
calculated for impaired loans and performing loans. Allowances related to performing loans estimate probable incurred losses that are inherent in the portfolio but have not
yet been specifically identified as impaired.
Internal risk rating parameters are used in the calculation of the collective impairment allowance. For non-retail loan portfolios, internal risk rating parameters form the basis
for calculating the quantitative portion of the collective allowance for performing loans:
• Probability of Default rates (PD) which are based upon the internal risk rating for each borrower;
• Loss Given Default rates (LGD); and
• Exposure at Default factors (EAD).
Funded exposures are multiplied by the borrower’s PD and by the relevant LGD parameter.
Committed but undrawn exposures are multiplied by the borrower’s PD, by the relevant LGD parameter, and by the relevant EAD parameter. A model stress component is
also applied to recognize uncertainty in the credit risk parameters and the fact that current actual loss rates may differ from the long-term averages included in the model.
Retail loans
Retail loans represented by residential mortgages, credit cards and other personal loans are considered by the Bank to be homogeneous groups of loans that are not
considered individually significant. All homogeneous groups of loans are assessed for impairment on a collective basis.
Mortgages are collectively assessed for impairment, taking into account number of days past due, historical loss experience and incorporating both quantitative and
qualitative factors including the current business and economic environment and the realizable value of collateral to determine the appropriate level of the collective
impairment allowance.
A roll rate methodology is used to determine impairment losses on a collective basis for credit cards and other personal loans because individual loan assessment is
impracticable. Under this methodology, loans with similar credit characteristics are grouped into ranges according to the number of days past due and statistical analysis is
used to estimate the likelihood that loans in each range will progress through the various stages of delinquency and ultimately prove irrecoverable. This methodology
employs statistical analyses of historical data and experience of delinquency and default to estimate the amount of loans that will eventually be written off as a result of the
events not identifiable on an individual loan basis. When the portfolio size is small or when information is insufficient or not reliable enough to adopt a roll rate methodology,
the Bank adopts a basic formulaic approach based on historical loss rate experience.
Performing loans
Over and above the individually assessed and retail roll rate allowances, loans that were subject to individual assessment for which no evidence of impairment existed, are
grouped together according to their credit risk characteristics for the purpose of reassessing them on a collective basis. This reflects impairment losses that the Bank has
incurred as a result of events that have occurred but where the individual loss has not been identified.
The collective impairment allowance for such loans is determined after taking into account:
• historical loss experience in portfolios of similar credit risk characteristics (for example, by industry sector, loan grade or product);
• the estimated period between impairment occurring and the loss being identified and evidenced by the establishment of an appropriate allowance against the
individual loan; and
• management’s experienced judgment as to whether current economic and credit conditions are such that the actual level of inherent losses at the reporting date is
likely to be greater or less than that suggested by historical experience. As soon as information becomes available which identifies losses on individual loans within
the group, those loans are removed from the group and assessed on an individual basis for impairment.
Provision for credit losses on off-balance sheet positions
A provision is set up for the Bank’s off-balance sheet positions and recorded in other liabilities on the Consolidated Statement of Financial Position. The process to determine
the provision for off-balance sheet positions is similar to the methodology used for loans. Any change in the provision is recorded in the Consolidated Statement of Income
as provision for credit losses.
Write-off of loans
Loans (and the related impairment allowance accounts) are normally written off, either partially or in full, when there is no realistic prospect of recovery. Where loans are
secured, write-off is generally after receipt of any proceeds from the realization of security. In circumstances where the net realizable value of any collateral has been
determined and there is no reasonable expectation of further recovery, write-off may be earlier.
Reversals of impairment
If the amount of an impairment loss related to loans decreases in a subsequent period, and the decrease can be related objectively to an event occurring after the
impairment was recognized, the excess is written back by reducing the loan impairment allowance account accordingly. The write-back is recognized in the provision for
credit losses in the Consolidated Statement of Income.
Restructured loans
Restructured loans include loans where the Bank has renegotiated the original terms of a loan by granting a concession to the borrower (concessions). These concessions
include interest rate adjustments, deferral or extension of principal or interest payments and forgiveness of a portion of principal or interest. Once the terms of the loan have
been renegotiated and agreed upon with the borrower the loan is considered a restructured loan. The investment in the loan is reduced as of the date of the restructuring to
the amount of the net expected cash flows receivable under the modified terms, discounted at the original effective interest rate inherent in the loan. The loan is no longer
considered past due and the reduction in the carrying value of the loan is recognized as a charge for loan impairment in the Consolidated Statement of Income in
158 | 2019 Scotiabank Annual Report

Consolidated Financial Statements
the period in which the loan is restructured. In other cases, restructuring may be considered substantial enough to result in recognition of a new loan.
Offsetting of financial instruments
Financial assets and financial liabilities with the same counterparty are offset, with the net amount reported in the Consolidated Statement of Financial Position, only if there
is currently a legally enforceable right to offset the recognized amounts and there is an intention to settle on a net basis, or to realize the assets and settle the liabilities
simultaneously. When financial assets and financial liabilities are offset in the Consolidated Statement of Financial Position, the related income and expense items will also
be offset in the Consolidated Statement of Income, unless specifically prohibited by an applicable accounting standard.
Cash and deposits with financial institutions
Cash and deposits with financial institutions comprises cash, cash equivalents, demand deposits with banks and other financial institutions, highly liquid investments that are
readily convertible to cash, subject to insignificant risk of changes in value. These investments are those with less than three months’ maturity from the date of acquisition.
Precious metals
Precious metals are carried at fair value less costs to sell, and any changes in fair value less costs to sell are credited or charged to non-interest income – trading revenues
in the Consolidated Statement of Income.
Securities purchased and sold under resale agreements
Securities purchased under resale agreements (reverse repurchase agreements) involve the Bank to purchase securities from a counterparty with an agreement entered to
resell the securities at a fixed price at a future date. Since the Bank is reselling the securities at a fixed price at a future date, the risks and rewards have not been transferred
to the Bank. The Bank has the right to liquidate the securities purchased in the event of counterparty default.
Whereas, securities sold under agreements to repurchase (repurchase agreements) involve the Bank to sell securities to a counterparty with an agreement entered
simultaneously to purchase the securities back at a fixed price at a future date. Since the Bank is purchasing the securities back at a fixed price at a future date, the risks and
rewards have not been transferred from the Bank. The counterparty has the right to use the collateral pledged by the Bank in the event of default.
These agreements are treated as collateralized financing arrangements and are initially recognized at amortized cost. The party disbursing the cash takes possession of the
securities serving as collateral for the financing and having a market value equal to, or in excess of, the principal amount loaned. The securities received under reverse
repurchase agreements and securities delivered under repurchase agreements are not recognized on, or derecognized from, the Consolidated Statement of Financial
Position, unless the risks and rewards of ownership are obtained or relinquished. The related interest income and interest expense are recorded on an accrual basis using
the effective interest rate method in interest income on the Consolidated Statement of Income.
Obligations related to securities sold short
Obligations related to securities sold short arise in dealing and market-making activities where debt securities and equity shares are sold without possessing such securities.
Similarly, if securities purchased under an agreement to resell are subsequently sold to third parties, the obligation to return the securities is recorded as a short sale within
obligations related to securities sold short in the Consolidated Statement of Financial Position. These trading liabilities are measured at fair value with any gains or losses
included in non-interest income – trading revenues in the Consolidated Statement of Income. Interest expense accruing on debt securities sold short is recorded in interest
expense – other, in the Consolidated Statement of Income.
Securities lending and borrowing
Securities lending and borrowing transactions are usually collateralized by securities or cash. The transfer of the securities to counterparties is only reflected on the
Consolidated Statement of Financial Position if the risks and rewards of ownership are also transferred. For cash collateral advanced or received, the Bank presents these
transactions as securities sold under repurchase agreement or securities purchased under reverse repurchase agreement, respectively. Interest on cash collateral advanced
or received is presented in interest income – securities purchased under resale agreements and securities borrowed or interest expense – other, respectively. Fees received
and paid are reported as fee and commission revenues and expenses in the Consolidated Statement of Income, respectively.
Securities borrowed are not recognized on the Consolidated Statement of Financial Position, unless they are then sold to third parties, in which case the obligation to return
the securities is recorded as a trading liability and measured at fair value with any gains or losses included in non-interest income – trading revenues, in the Consolidated
Statement of Income.
Derivative instruments
Derivative instruments are contracts whose value is derived from interest rates, foreign exchange rates, commodities, equity prices or other financial variables. Most
derivative instruments can be characterized as interest rate contracts, foreign exchange and gold contracts, commodity contracts, equity contracts or credit contracts.
Derivative instruments are either exchange-traded contracts or negotiated over-the-counter contracts. Negotiated over-the-counter contracts include swaps, forwards and
options.
The Bank enters into these derivative contracts for trading purposes, as well as to manage its risk exposures (i.e., to manage the Bank’s non-trading interest rate, foreign
currency and other exposures). Trading activities are undertaken to meet the needs of the Bank’s customers, as well as for the Bank’s own account to generate income from
trading operations.
Derivatives embedded in other financial liabilities or host contracts are treated as separate derivatives when the following conditions are met:
• their economic characteristics and risks are not closely related to those of the host contract;
• a separate instrument with the same terms as the embedded derivative would meet the definition of a derivative; and
• the combined contract is not held for trading or designated at fair value through profit or loss.
2019 Scotiabank Annual Report | 159

Consolidated Financial Statements
Where an embedded derivative is separable from the host contract but the fair value, as at the acquisition or reporting date, cannot be reliably measured separately, the
entire combined contract is measured at fair value. All embedded derivatives are presented on a combined basis with the host contracts although they are separated for
measurement purposes when conditions requiring separation are met. Subsequent changes in fair value of embedded derivatives are recognized in non-interest income in
the Consolidated Statement of Income.
All derivatives, including embedded derivatives that must be separately accounted for, are recorded at fair value in the Consolidated Statement of Financial Position. The
determination of the fair value of derivatives includes consideration of credit risk, estimated funding costs and ongoing direct costs over the life of the instruments. Inception
gains or losses on derivatives are only recognized where the valuation is dependent only on observable market data, otherwise, they are deferred and amortized over the life
of the related contract, or until the valuation inputs become observable.
The gains and losses resulting from changes in fair values of trading derivatives are included in non-interest income – trading revenues in the Consolidated Statement of
Income.
Changes in the fair value of non-trading derivatives that do not qualify for hedge accounting are recorded in the Consolidated Statement of Income in non-interest income –
other. Where derivative instruments are used to manage the volatility of share-based payment expense, these derivatives are carried at fair value with changes in the fair
value in relation to units hedged included in non-interest expenses – salaries and employee benefits in the Consolidated Statement of Income.
Changes in the fair value of derivatives that qualify for hedge accounting are recorded as non-interest income – other in the Consolidated Statement of Income for fair value
hedges and other comprehensive income in the Consolidated Statement of Comprehensive Income for cash flow hedges and net investment hedges.
Hedge accounting
The Bank has elected to continue to apply the hedge accounting requirements of IAS 39. However, the Bank has implemented the additional hedge accounting disclosures
that are required by the IFRS 9 related amendments to IFRS 7 “Financial Instruments: Disclosures”.
The Bank formally documents all hedging relationships and its risk management objective and strategy for undertaking these hedge transactions at inception. The hedge
documentation includes identification of the asset, liability, firm commitment or highly probable forecasted transaction being hedged, the nature of the risk being hedged, the
hedging instrument used and the method used to assess the effectiveness of the hedge. The Bank also formally assesses, both at each hedge’s inception and on an
ongoing basis, whether the hedging instruments are highly effective in offsetting changes in fair value or cash flows of the hedged items. Hedge ineffectiveness is measured
and recorded in non-interest income – other in the Consolidated Statement of Income.
There are three types of hedges: (i) fair value hedges, (ii) cash flow hedges and (iii) net investment hedges.
Fair value hedges
For fair value hedges, the change in fair value of the hedging instrument is offset in the Consolidated Statement of Income by the change in fair value of the hedged item
attributable to the hedged risk. For hedges that are discontinued, the hedged item is no longer adjusted for changes in fair value. The cumulative fair value adjustment of the
hedged item is amortized to non-interest income over its remaining term to maturity or written off to non-interest income directly if the hedged item ceases to exist. The Bank
utilizes fair value hedges primarily to convert fixed rate financial instruments to floating rate financial instruments. Hedged items include debt securities, loans, deposit
liabilities and subordinated debentures. Hedging instruments include single-currency interest rate swaps and cross-currency interest rate swaps.
Cash flow hedges
For cash flow hedges, the change in fair value of the hedging instrument, to the extent effective, is recorded in other comprehensive income until the corresponding gains
and losses on the hedged item is recognized in income. For hedges that are discontinued, the cumulative unrealized gain or loss recognized in other comprehensive income
is reclassified to non-interest income and/or salaries and employee benefits as the variability in the cash flows of hedged item affects income. However, if the hedged item is
derecognized or the forecasted transaction is no longer expected to occur, the unrealized gain or loss is reclassified immediately to non-interest income and/or salaries and
employee benefits. The Bank utilizes cash flow hedges primarily to hedge the variability in cash flows relating to floating rate financial instruments and highly probable
forecasted revenues and expenses. Hedged items include debt securities, loans, deposit liabilities, subordinated debentures and highly probable forecasted transactions.
Hedging instruments include single-currency interest rate swaps, cross-currency interest rate swaps, total return swaps, foreign currency forwards and foreign currency
assets or liabilities.
Net investment hedges
For net investment hedges, the change in fair value of the hedging instrument, to the extent effective, is recorded in other comprehensive income until the corresponding
cumulative translation adjustments on the hedged net investment are recognized in income. The Bank designates foreign currency liabilities and foreign currency forwards
as hedging instruments to manage the foreign currency exposure and impact on capital ratios arising from foreign operations.
Property and equipment
Land, buildings and equipment
Land is carried at cost. Buildings (including building fittings), equipment, and leasehold improvements are carried at cost less accumulated depreciation and accumulated
impairment losses, if any. Cost includes expenditures that are directly attributable to the acquisition of the asset. Depreciation is calculated using the straight-line method
over the estimated useful life of the related asset less any residual value as follows: buildings – 40 years, building fittings – 15 years, equipment 3 to 10 years, and leasehold
improvements – lease term determined by the Bank. Depreciation expense is included in the Consolidated Statement of Income under non-interest expenses – depreciation
and amortization. Depreciation methods, useful lives and residual values are reassessed at each financial year-end and adjusted as appropriate.
When major components of building and equipment have different useful lives, they are accounted for separately and depreciated over each component’s estimated useful
life.
Net gains and losses on disposal are included in non-interest income – other in the Consolidated Statement of Income in the year of disposal.
160 | 2019 Scotiabank Annual Report
Consolidated Financial Statements
Investment property
Investment property is property held either for rental income or for capital appreciation or for both. The Bank holds certain investment properties which are presented in
property and equipment on the Consolidated Statement of Financial Position.
Investment property is carried at cost less accumulated depreciation and any accumulated impairment losses. Depreciation is calculated using the straight-line method over
the estimated useful life of 40 years. Depreciation methods, useful lives and residual values are reassessed at each financial year-end and adjusted as appropriate.
Assets held-for-sale
Non-current non-financial assets (and disposal groups) are classified as held-for-sale if their carrying amount will be recovered principally through a sale transaction rather
than through continuing use. These assets meet the criteria for classification as held-for-sale if they are available for immediate sale in their present condition and their sale
is considered highly probable to occur within one year.
Non-current non-financial assets classified as held-for-sale are measured at the lower of their carrying amount and fair value (less costs to sell) and are presented within
other assets in the Consolidated Statement of Financial Position. Any subsequent write-down to fair value less costs to sell is recognized in the Consolidated Statement of
Income, in non-interest income. Any subsequent increase in the fair value less costs to sell, to the extent this does not exceed the cumulative write-down, is also recognized
in non-interest income, together with any realized gains or losses on disposal.
Non-financial assets acquired in exchange for loans as part of an orderly realization are recorded as assets held-for-sale or assets held-for-use. If the acquired asset does
not meet the requirement to be considered held-for-sale, the asset is considered held-for-use, measured initially at cost which equals the carrying value of the loan and
accounted for in the same manner as a similar asset acquired in the normal course of business.
Business combinations and goodwill
The Bank follows the acquisition method of accounting for the acquisition of subsidiaries. The Bank considers the date on which control is obtained and it legally transfers the
consideration for the acquired assets and assumed liabilities of the subsidiary to be the date of acquisition. The cost of an acquisition is measured at the fair value of the
consideration paid. The fair value of the consideration transferred by the Bank in a business combination is calculated as the sum of the acquisition date fair value of the
assets transferred by the Bank, the liabilities incurred by the Bank to former owners of the acquiree, and the equity interests, including any options, issued by the Bank. The
Bank recognizes the acquisition date fair values of any previously held investment in the subsidiary and contingent consideration as part of the consideration transferred in
exchange for the acquisition. A gain or loss on any previously held investments of an acquiree is recognized in non-interest income – other in the Consolidated Statement of
Income.
In general, all identifiable assets acquired (including intangible assets) and liabilities assumed (including any contingent liabilities) are measured at the acquisition date fair
value. The Bank records identifiable intangible assets irrespective of whether the assets have been recognized by the acquiree before the business combination.
Non-controlling interests, if any, are recognized at their proportionate share of the fair value of identifiable assets and liabilities, unless otherwise indicated. Where the Bank
has an obligation to purchase a non-controlling interest for cash or another financial asset, a portion of the non-controlling interest is recognized as a financial liability based
on management’s best estimate of the present value of the redemption amount. Where the Bank has a corresponding option to settle the purchase of a non-controlling
interest by issuing its own common shares, no financial liability is recorded.
Any excess of the cost of acquisition over the Bank’s share of the net fair value of the identifiable assets acquired and liabilities assumed is recorded as goodwill. If the cost
of acquisition is less than the fair value of the Bank’s share of the identifiable assets acquired and liabilities assumed, the resulting gain is recognized immediately in
non-interest income – other in the Consolidated Statement of Income.
During the measurement period (which is within one year from the acquisition date), the Bank may, on a retrospective basis, adjust the amounts recognized at the acquisition
date to reflect new information obtained about facts and circumstances that existed as of the acquisition date.
The Bank accounts for acquisition-related costs as expenses in the periods in which the costs are incurred and the services are received.
Subsequent to acquisition, the Bank accounts for the following assets and liabilities recognized in a business combination as described below:
• Contingent liabilities, until resolved, are measured at the higher of the amount that would be recognized as a provision or the amount initially recognized, with any
change recognized in the Consolidated Statement of Income.
• Indemnification assets are measured on the same basis as the item to which the indemnification relates.
• Contingent consideration classified as a liability is measured at fair value, with any change recognized in the Consolidated Statement of Income.
• Liabilities to non-controlling interest holders when remeasured at the end of each reporting period, a corresponding change is recorded in equity.
After initial recognition of goodwill in a business combination, goodwill in aggregate is measured at cost less any accumulated impairment losses. Goodwill is not amortized
but tested for impairment annually and when circumstances indicate that the carrying value may be impaired.
Goodwill is reviewed at each reporting date to determine whether there is any indication of impairment. For the purpose of impairment testing, goodwill acquired in a
business combination is, on the acquisition date, allocated to each of the Bank’s group of cash-generating units (CGUs) that is expected to benefit from the combination.
CGUs to which goodwill has been allocated are aggregated so that the level at which impairment is tested reflects the lowest level at which goodwill is monitored for internal
management purposes. Goodwill impairment, at a standalone subsidiary level, may not in itself result in an impairment at the consolidated Bank level.
The Bank determines the carrying value of the CGU using a regulatory capital approach based on credit, market, and operational risks, and leverage, consistent with the
Bank’s capital attribution for business line performance measurement. The recoverable amount is the greater of fair value less costs of disposal and value in use. If either fair
value less costs of disposal or value in use exceeds the carrying amount, there is no need to determine the other. The recoverable amount of the CGU has been determined
using the fair value less costs of disposal method. The estimation of fair value less costs of disposal involves significant judgment in the determination of inputs. In
determining fair value less costs of disposal, an appropriate valuation model is used which considers various factors including normalized net income, control premiums and
price earnings multiples. These calculations are corroborated by valuation multiples, quoted share prices for publicly traded subsidiaries or other available fair value
indicators. An impairment loss is recognized if the carrying amount of the CGU exceeds the recoverable amount. An impairment loss, in respect of goodwill, is not reversed.
2019 Scotiabank Annual Report | 161

Consolidated Financial Statements
Intangible assets
Intangible assets represent identifiable non-monetary assets and are acquired either separately or through a business combination or generated internally. The Bank’s
intangible assets are mainly comprised of computer software, customer relationships, contract intangibles, core deposit intangibles and fund management contracts.
The cost of a separately acquired intangible asset includes its purchase price and directly attributable costs of preparing the asset for its intended use. Intangibles acquired
as part of a business combination are initially recognized at fair value.
In respect of internally generated intangible assets, cost includes all directly attributable costs necessary to create, produce, and prepare the asset to be capable of operating
in the manner intended by management.
After initial recognition, an intangible asset is carried at its cost less any accumulated amortization and accumulated impairment losses.
Intangible assets that have finite useful lives are initially measured at cost and are amortized on a straight-line basis over their useful lives as follows: computer software – 5
to 10 years; and other intangible assets – 5 to 20 years. Amortization expense is included in the Consolidated Statement of Income under operating expenses – depreciation
and amortization. As intangible assets are considered to be non-financial assets, the impairment model for non-financial assets is applied. Intangible assets with indefinite
useful lives are not amortized but are tested for impairment annually and when circumstances indicate that the carrying value may be impaired.
Impairment of non-financial assets
The carrying amount of the Bank’s non-financial assets, other than goodwill and indefinite life intangible assets and deferred tax assets which are separately addressed, is
reviewed at each reporting date to determine whether there is any indication of impairment. For the purpose of impairment testing, non-financial assets that cannot be tested
individually are grouped together into the smallest group of assets that generate cash inflows from continuing use that are largely independent from the cash inflows of other
assets or groups of assets.
If any indication of impairment exists then the asset’s recoverable amount is estimated. The recoverable amount of an asset or CGU is the greater of its value in use and its
fair value less costs of disposal. The Bank’s corporate assets do not generate separate cash inflows. If there is an indication that a corporate asset may be impaired, then
the recoverable amount is determined for the CGU to which the corporate asset belongs.
An impairment loss is recognized if the carrying amount of an asset or a CGU exceeds its recoverable amount. Impairment losses of continuing operations are recognized in
the Consolidated Statement of Income in those expense categories consistent with the nature of the impaired asset. Impairment losses recognized in prior periods are
reassessed at each reporting date for any indication that the loss had decreased or no longer exists. An impairment loss is reversed if there has been a change in the
estimates used to determine the recoverable amount. An impairment loss is reversed only to the extent that the asset’s carrying amount does not exceed the carrying
amount that would have been determined, net of depreciation or amortization, if no impairment loss had been recognized. Such reversal is recognized in the Consolidated
Statement of Income.
Significant judgment is applied in determining the non-financial asset’s recoverable amount and assessing whether certain events or circumstances constitute objective
evidence of impairment.
Corporate income taxes
The Bank follows the balance sheet liability method for corporate income taxes. Under this method, deferred tax assets and liabilities represent the cumulative amount of tax
applicable to temporary differences which are the differences between the carrying amount of the assets and liabilities, and their values for tax purposes. Deferred tax assets
are recognized only to the extent it is probable that sufficient taxable profits will be available against which the benefit of these deferred tax assets can be utilized.
Deferred tax assets and liabilities are measured using enacted or substantively enacted tax rates expected to apply to taxable income in the years in which those temporary
differences are expected to be recovered or settled.
Deferred and current tax assets and liabilities are only offset when they arise in the same tax reporting group and where the Bank has both the legal right and the intention to
settle on a net basis or to realize the asset and settle the liability simultaneously.
The Bank maintains provisions for uncertain tax positions that it believes appropriately reflect the risk of tax positions under discussion, audit, dispute, or appeal with tax
authorities, or which are otherwise considered to involve uncertainty. These provisions are made using the Bank’s best estimate of the amount expected to be paid based on
an assessment of all relevant factors, which are reviewed at the end of each reporting period.
Income tax is recognized in the Consolidated Statement of Income except where it relates to items recognized in other comprehensive income or directly in equity, in which
case income tax is recognized in the same line as the related item.
Leases
Bank as a lessor
Assets leased to customers under agreements which transfer substantially all the risks and rewards of ownership, with or without ultimate legal title, are classified as finance
leases and presented within loans in the Consolidated Statement of Financial Position. When assets held are subject to a finance lease, the leased assets are derecognized
and a receivable is recognized which is equal to the present value of the minimum lease payments, discounted at the interest rate implicit in the lease. Initial direct costs
incurred in negotiating and arranging a finance lease are incorporated into the receivable through the discount rate applied to the lease. Finance lease income is recognized
over the lease term based on a pattern reflecting a constant periodic rate of return on the net investment in the finance lease. Finance lease income is included in the
Consolidated Statement of Income under interest income from loans.
Assets leased to customers under agreements which do not transfer substantially all the risks and rewards of ownership are classified as operating leases. The leased
assets are included within property and equipment on the Bank’s Consolidated Statement of Financial Position. Rental income is recognized on a straight-line basis over the
period of the lease in non-interest income – other in the Consolidated Statement of Income. Initial direct costs incurred in negotiating and arranging an operating lease are
added to the carrying amount of the leased asset and recognized as an expense on a straight-line basis over the lease term.
Bank as a lessee
Assets held under finance leases are initially recognized as property and equipment in the Consolidated Statement of Financial Position at an amount equal to the fair value
of the leased asset or, if lower, the present value of the minimum lease payments. The corresponding finance lease
162 | 2019 Scotiabank Annual Report

Consolidated Financial Statements
obligation is included in other liabilities in the Consolidated Statement of Financial Position. The discount rate used in calculating the present value of the minimum lease
payments is the interest rate implicit in the lease. Contingent rentals are recognized as expense in the periods in which they are incurred.
Operating lease rentals payable are recognized as an expense on a straight-line basis over the lease term, which commences when the lessee controls the physical use of
the asset. Lease incentives are treated as a reduction of rental expense and are also recognized over the lease term on a straight-line basis. Contingent rentals arising under
operating leases are recognized as an expense in the period in which they are incurred.
Sale and lease-back
Where the Bank enters into a sale lease-back transaction for a non-financial asset at fair market value that results in the Bank retaining an operating lease (where the
buyer/lessor retains substantially all risks and rewards of ownership), any gains and losses are recognized immediately in net income. Where the sale lease-back transaction
results in a finance lease, any gain on sale is deferred and recognized in net income over the remaining term of the lease.
Leasehold improvements
Leasehold improvements are investments made to customize buildings and offices occupied under operating lease contracts to make them suitable for their intended
purpose. The present value of estimated reinstatement costs to bring a leased property into its original condition at the end of the lease, if required, is capitalized as part of
the total leasehold improvements costs. At the same time, a corresponding liability is recognized to reflect the obligation incurred. Reinstatement costs are recognized in net
income through depreciation of the capitalized leasehold improvements over their estimated useful life.
Provisions
A provision, including for restructuring, is recognized if, as a result of a past event, the Bank has a present legal or constructive obligation that can be estimated reliably, and
it is probable that an outflow of economic benefits will be required to settle the obligation.
The amount recognized as a provision is the Bank’s best estimate of the consideration required to settle the present obligation, taking into account the risks and uncertainties
surrounding the obligation. If the effect of the time value of money is considered material, provisions are determined by discounting the expected future cash flows at a
pre-tax rate that reflects current market assessments of the time value of money and, where appropriate, the risks specific to the liability. The increase in the provision due to
the passage of time is recorded as interest expense – other in the Consolidated Statement of Income.
Insurance contracts
Gross premiums for life insurance contracts are recognized as income when due. Gross premiums for non-life insurance business, primarily property and casualty, are
recognized as income over the term of the insurance contracts. Unearned premiums represent the portion of premiums written in the current year that relate to the period of
risk after the reporting date. Insurance claims recoveries are accounted as income in the same period as the related claims.
Gross insurance claims for life insurance contracts reflect the cost of all claims arising during the year. Gross insurance claims for property and casualty insurance contracts
include paid claims and movements in outstanding claim liabilities. Insurance premiums ceded to reinsurers are accounted as an expense in the same period as the
premiums for the direct insurance contracts to which they relate.
Guarantees
A guarantee is a contract that contingently requires the Bank to make specified payments to reimburse the holder for a loss it incurs because a specified debtor failed to
make payment when due in accordance with the original or modified terms of a debt instrument. Guarantees include standby letters of credit, letters of guarantee,
indemnifications, credit enhancements and other similar contracts. Guarantees that qualify as a derivative are accounted for in accordance with the policy for derivative
instruments. For guarantees that do not qualify as a derivative, a liability is recorded for the fair value of the obligation assumed at inception. The fair value of the obligation
at inception is generally based on the discounted cash flow of the premium to be received for the guarantee, resulting in a corresponding asset. Subsequent to initial
recognition, such guarantees are measured at the higher of the initial amount, less amortization to recognize any fee income earned over the period, and the best estimate of
the amount required to settle any financial obligation arising as a result of the guarantee. Any increase in the liability is reported in the Consolidated Statement of Income.
Employee benefits
The Bank provides pension and other benefit plans for eligible employees in Canada and internationally. Pension benefits are offered in the form of defined benefit pension
plans (generally based on an employee’s length of service and average earnings at retirement), and in the form of defined contribution pension plans (where the Bank’s
contribution is fixed and there is no legal or constructive obligation to pay further amounts). Other benefits provided include post-retirement health care, dental care and life
insurance, along with other long-term employee benefits such as long-term disability benefits.
Defined benefit pension plans and other post-retirement benefit plans
The cost of these employee benefits is actuarially determined each year using the projected unit credit method. The calculation uses management’s best estimate of a
number of assumptions – including the discount rate, future compensation, health care costs, mortality, as well as the retirement age of employees. The most significant
assumption is the discount rate used to determine the defined benefit obligation, which is set by reference to the yields on high quality corporate bonds that have durations
that match the terms of the Bank’s obligations. Separate discount rates are used to determine the annual benefit expense in Canada and the US. These rates are
determined with reference to the yields on high quality corporate bonds with durations that match the various components of the annual benefit expense. The discount rate
used to determine the annual benefit expense for all other plans is the same as the rate used to determine the defined benefit obligation at the beginning of the period.
The Bank’s net asset or liability in respect of employee benefit plans is calculated separately for each plan as the difference between the present value of future benefits
earned in respect of service for prior periods and the fair value of plan assets. The net asset or liability is included in other assets and other liabilities, as appropriate, in the
Consolidated Statement of Financial Position. When the net amount in the Consolidated Statement of Financial Position is an asset, the recognized asset is limited to the
present value of any economic benefits available in the form of refunds from the plan or reductions in future contributions to the plan.
2019 Scotiabank Annual Report | 163

Consolidated Financial Statements
The current service cost, net interest expense (income), past service cost (credit), and administrative expense are recognized in net income. Net interest expense (income)
is calculated by applying the discount rate at the beginning of the annual period to the net defined benefit asset or liability. When the benefits of a plan are improved
(reduced), a past service cost (credit) is recognized immediately in net income.
Remeasurements comprising of actuarial gains and losses, the effect of the asset ceiling and the return on plan assets in excess of the interest income on the fair value of
assets are recognized immediately in the Consolidated Statement of Financial Position with a charge or credit to the Statement of Other Comprehensive Income (OCI) in the
period in which they occur. Amounts recorded in OCI are not recycled to the Consolidated Statement of Income.
Other long-term employee benefits
Other long-term employee benefits are accounted for similarly to defined benefit pension plans and other post-retirement benefit plans described above, except that
remeasurements are recognized in the Consolidated Statement of Income in the period in which they arise.
Defined contribution plans
The cost of such plans are equal to contributions payable by the Bank to employees’ accounts for service rendered during the period and expensed.
Short-term employee benefits
Short-term employee benefits are expensed as the related service is provided and a liability is measured on an undiscounted basis net of payments made.
Interest and similar income and expenses
For all non-trading interest-bearing financial instruments, interest income or expense is recorded in net interest income using the effective interest rate. This is the rate that
exactly discounts estimated future cash payments or receipts through the expected life of the financial instrument or a shorter period, where appropriate, to the net carrying
amount of the financial asset or financial liability. The calculation takes into account all the contractual terms of the financial instrument (for example, prepayment options)
and includes any fees or incremental costs that are directly attributable to the instrument and are an integral part of the effective interest rate, but not future credit losses.
For trading financial instruments, mark-to-market changes including related interest income or expense are recorded in non-interest income – trading revenues.
The carrying amount of interest-bearing financial instruments, measured at amortized cost or classified as FVOCI, is adjusted if the Bank revises its estimates of payments
or receipts. The adjusted carrying amount is calculated based on the original effective interest rate and the change in carrying amount is recorded as non-interest income in
the Consolidated Statement of Income.
Once the carrying value of a financial asset or a group of similar financial assets has been reduced due to an impairment loss, interest income continues to be recognized
based on net effective interest rate inherent in the investment.
Loan origination costs are deferred and amortized into interest income using the effective interest method over the expected term of the loan. Loan fees are recognized in
interest income over the appropriate lending or commitment period. Mortgage prepayment fees are recognized in interest income when received, unless they relate to a
minor modification to the terms of the mortgage, in which case the fees are deferred and amortized using the effective interest method over the remaining period of the
original mortgage.
Loan syndication fees are deferred and amortized in interest income over the term of the loan where the yield the Bank retains is less than that of the comparable lenders in
the syndicate.
Loan commitment fees for loans that are likely to be drawn down and other credit related fees are deferred (together with any incremental costs) and recognized as part of
the effective interest on the loan. When it is unlikely that a loan will be drawn down, the loan commitment fees are recognized in non-interest income.
Fee and commission revenues
Revenue is recognized once the Bank’s customer has obtained control of the service. The transfer of control occurs when the Bank’s customer has the ability to direct the
use of and obtain the benefits of the banking services and the contractual performance obligation to the customer has been satisfied. The Bank records revenue gross of
expenses where it is the principal in performing a service to the customer and net of expenses where the Bank it is an agent for these services. The assessment of principal
or agent requires judgement on the basis of whether the Bank controls the services before they are transferred to the customer. From time to time, the Bank may receive
variable consideration such as performance fees. These fees are only recognized when it is highly probable that the Bank will not need to reverse a significant amount of
revenue once the uncertainty relating to the actual consideration received is resolved. Judgement is required to estimate these fees.
Card revenues include interchange fees, annual fees and other card related fees. Interchange fees are recognized in connection with the customer’s purchase of goods and
services and are calculated as a percentage of the transaction amount as established by the payment network. Interchange fees are recognized on the transaction date. The
Bank presents interchange fees net of network association costs incurred and reward costs for associated cards. Annual fees are recognized in income over 12 months.
Other card fees are transaction-based and are recognized on the transaction date.
The Bank operates various loyalty points programs, which allow customers to accumulate points when they use the Bank’s products and services. The points to be
redeemed require management judgement to estimate the liability. The liability is reduced by the cost of points redeemed and subject to remeasurement to reflect the
expected cost of redemption. Where the customer has the option to redeem points for statement credits, the cost of the loyalty program is presented net of card fees. Where
points can only be redeemed for goods or services, a portion of the interchange revenue is allocated to the loyalty rewards recognized when rewards are redeemed. The
associated cost of these points is recorded in non-interest expense.
Banking services fees consist of fees earned on personal, business and government deposit activities. Personal deposit-related fees consist of account maintenance and
various transaction-based services. Business and government deposit-related fees consist of commercial deposit and treasury management services and other cash
management services. These fees are recognized on the transaction date or over time as services are provided to the customer.
164 | 2019 Scotiabank Annual Report

Consolidated Financial Statements
Credit fees include fees earned for providing letters of credit and guarantee, loan commitments, bankers’ acceptances, and for arranging loan syndications. These fees are
recognized on the transaction date or over time as services are provided based on contractual agreements with the customer.
Mutual funds fees include management and administration fees which are earned in the Bank’s wealth management business. These fees are calculated as a percentage of
the fund’s net asset value and recognized as the service is provided. From time to time, the Bank may also recognize performance fees from some funds. These fees are
only recognized to the extent that it is highly probable that a significant reversal of revenue will not occur.
Brokerage fees relate to fees earned for providing full-service and discount brokerage services to clients. These fees are contractually agreed and can be asset-based or
linked to individual transactions. Such fees are recognized as the service is provided to clients or on the trade date.
Investment management and trust fees include administration, trust services and other investment services provided to clients. These fees are contractually agreed upon
and can be linked to portfolio values or individual transactions. Such fees are recognized as the service is provided to clients to the extent that it is highly probable that a
significant reversal of revenue will not occur.
Underwriting and other advisory fees relate to fees earned for services provided to clients in relation to the placement of debt and equities. Such fees also include services to
clients for mergers, acquisitions, financial restructurings and other corporate finance activities. These fees are recognized when the service has been performed and/or
contractual milestones are completed. Performance and completion fees are variable consideration and generally contingent on the successful completion of a transaction.
Other fees and commissions include commissions earned on the sale of third party insurance products to the Bank’s customers. Such fees and commissions are recognized
when the performance obligation is completed.
Fee and commission expenses
Fee and commission expenses relate to transaction and service fees which are expensed as the services are received.
Dividend income
Dividend income on equity securities is recognized when the Bank’s right to receive payment is established, which is on the ex-dividend date for listed equity securities.
Share-based payments
Share-based payments awarded to employees are recognized as compensation expense in the Consolidated Statement of Income over the vesting period based on the
number of awards expected to vest including the impact of expected forfeitures. For awards that are delivered in tranches, each tranche is considered a separate award and
accounted for separately.
Stock appreciation rights and other awards that must be settled for cash are classified as liabilities. Liability-classified awards are re-measured to fair value at each reporting
date while they remain outstanding, with any changes in fair value recognized in compensation expense in the period. The liability is expensed over the vesting period which
incorporates the re-measurement of the fair value and a revised forfeiture rate that anticipates units expected to vest.
Employee stock options with tandem stock appreciation rights give the employee the right to exercise for shares or settle in cash. These options are classified as liabilities
and are re-measured to fair value at each reporting date while they remain outstanding. If an option is exercised, thereby cancelling the tandem stock appreciation right, both
the exercise price proceeds together with the accrued liability and associated taxes are credited to equity – common shares in the Consolidated Statement of Financial
Position.
Plain vanilla options and other awards that must be settled for shares are classified as equity awards. Equity-classified awards are expensed based on the grant date fair
value with a corresponding increase to equity – other reserves in the Consolidated Statement of Financial Position. If an option is exercised, both the exercise price proceeds
together with the amount recorded in other reserves is credited to equity – common shares in the Consolidated Statement of Financial Position.
For tandem stock appreciation rights, stock appreciation rights and plain vanilla options, the Bank estimates fair value using an option pricing model. The option pricing
model requires inputs such as the exercise price of the option, the current share price, the risk free interest rate, expected dividends, expected volatility (calculated using an
equal weighting of implied and historical volatility) and specific employee exercise behaviour patterns based on statistical data. For other awards, fair value is the quoted
market price of the Bank’s common shares at the reporting date.
Where derivatives are used to economically hedge share-based payment expense, related mark-to-market gains and losses are included in non-interest expenses – salaries
and employee benefits in the Consolidated Statement of Income.
A voluntary renouncement of a tandem stock appreciation right where an employee retains the corresponding option for shares with no change in the overall fair value of the
award, results in a reclassification of the accrued liability and associated tax to equity – other reserves in the Consolidated Statement of Financial Position. This
reclassification is measured at the fair value of the renounced awards as of the renouncement date. Subsequent to the voluntary renouncement, these awards are accounted
for as plain vanilla options, based on the fair value as of the renouncement date.
Customer loyalty programs
The following accounting policy was applicable prior to November 1, 2018.
The Bank operates loyalty points programs, which allow customers to accumulate points when they use the Bank’s products and services. The points can then be redeemed
for free or discounted products or services, subject to certain conditions.
Consideration received is allocated between the products sold or services rendered and points issued, with the consideration allocated to points equal to their fair value. The
fair value of points is generally based on equivalent retail prices for the mix of awards expected to be redeemed. The fair value of the points issued is deferred in other
liabilities and recognized as banking revenues when the points are redeemed or lapsed. Management judgment is involved in determining the redemption rate to be used in
the estimate of points to be redeemed.
2019 Scotiabank Annual Report | 165

Consolidated Financial Statements
Dividends on shares
Dividends on common and preferred shares and other equity instruments are recognized as a liability and deducted from equity when they are declared and no longer at the
discretion of the Bank.
Segment reporting
Management’s internal view is the basis for the determination of operating segments. The operating segments are those whose operating results are regularly reviewed by
the Bank’s chief operating decision-maker to make decisions about resources to be allocated to the segment and assess its performance. The Bank has three operating
segments: Canadian Banking, International Banking, and Global Banking and Markets. The other category represents smaller operating segments, including Group Treasury
and other corporate items, which are not allocated to an operating segment. These segments offer different products and services and are managed separately based on the
Bank’s management and internal reporting structure.
The results of these business segments are based upon the internal financial reporting systems of the Bank. The accounting policies used in these segments are generally
consistent with those followed in the preparation of the consolidated financial statements by the Bank. The only notable accounting measurement difference is the grossing
up of revenues which are tax-exempt and income from associate corporations to an equivalent before-tax basis for those affected segments. This change in measurement
enables comparison of income arising from taxable and tax-exempt sources.
Because of the complexity of the Bank, various estimates and allocation methodologies are used in the preparation of the business segment financial information. The
funding value of assets and liabilities is transfer-priced at wholesale market rates, and corporate expenses are allocated to each segment on an equitable basis using various
parameters. As well, capital is apportioned to the business segments on a risk-based methodology. Transactions between segments are recorded within segment results as
if conducted with a third-party and are eliminated on consolidation.
Earnings per share (EPS)
Basic EPS is computed by dividing net income for the period attributable to the Bank’s common shareholders by the weighted-average number of common shares
outstanding during the period.
Diluted EPS is calculated by dividing adjusted net income for the period attributable to common shareholders by the weighted-average number of diluted common shares
outstanding for the period. In the calculation of diluted earnings per share, earnings are adjusted for changes in income or expenses that would result from the issuance of
dilutive shares. The weighted-average number of diluted common shares outstanding for the period reflects the potential dilution that would occur if options, securities or
other contracts that entitle their holders to obtain common shares had been outstanding from the beginning of the period (or a later date) to the end of the period (or an
earlier date). Instruments determined to have an antidilutive impact for the period are excluded from the calculation of diluted EPS.
Earnings are adjusted by the after-tax amount of distributions related to dilutive capital instruments recognized in the period. For tandem stock appreciation rights that are
carried as liabilities, the after-tax re-measurement included in salaries and employee benefits expense, net of related hedges, is adjusted to reflect the expense had these
rights been equity-classified.
The number of additional shares for inclusion in diluted EPS for share-based payment options is determined using the treasury share method. Under this method, the net
number of incremental common shares is determined by assuming that in-the-money stock options are exercised and the proceeds are used to purchase common shares at
the average market price during the period.
The number of additional shares associated with capital instruments that potentially result in the issuance of common shares is based on the terms of the contract. On
occurrence of contingencies as specified in the Non-Viability Contingent Capital (NVCC) Instruments, the number of additional common shares associated with the NVCC
subordinated debentures, NVCC subordinated additional Tier 1 capital securities and NVCC preferred shares is based on an automatic conversion formula as set out in the
respective prospectus supplements.
4 Transition to IFRS 15
On November 1, 2018, the Bank adopted IFRS 15, Revenue from Contracts with Customers (“IFRS 15”), which specifies how and when revenue is recognized, but does not
impact income recognition related to financial instruments in scope of IFRS 9. The new standard replaces the previous standard IAS 18 Revenue and provides a single,
principles-based five-step model to be applied to all contracts with customers and to determine whether the performance obligation is to provide the service itself (i.e., act as
a principal) or to arrange another party to provide the service (i.e., act as an agent).
The Bank adopted IFRS 15 using the modified retrospective approach and accordingly, comparative periods have not been restated. The Bank recorded a cumulative-effect
adjustment to decrease opening retained earnings on November 1, 2018 of $58 million (net of tax). This adjustment primarily relates to certain costs that are no longer
eligible for deferral under the new standard and the remeasurement of certain liabilities at fulfilment cost. For the year ended October 31, 2019, the impact of IFRS 15 was a
decrease in non-interest income and non-interest expenses of approximately $209 million, primarily representing certain loyalty rewards previously recorded in non-interest
expenses and now being recorded as a reduction to non-interest income.
5 Future Accounting Developments
The Bank actively monitors developments and changes in accounting standards from the IASB, as well as requirements from the other regulatory bodies, including OSFI.
The Bank is currently assessing the measurement impact of the adoption of new standards issued by the IASB will have on its consolidated financial statements and also
evaluating the alternative elections available on transition.
Effective November 1, 2019
Leases
In January 2016, the IASB issued IFRS 16 Leases (IFRS 16), which replaces IAS 17, Leases (IAS 17), requiring a lessee to recognize an asset for the right to use the
leased item and a liability for the present value of its future lease payments. IFRS 16 will generally result in all operating leases being recorded on the Bank’s balance sheet
as a right-of-use (ROU) asset with a corresponding lease liability. The Bank will also recognize amortization
166 | 2019 Scotiabank Annual Report

Consolidated Financial Statements
expense on the ROU asset in non-interest expenses and interest expense on the lease liability in interest expenses, in the statement of income. IFRS 16 substantially carries
forward the lessor accounting requirements in IAS 17.
The Bank will apply IFRS 16 on a modified retrospective basis by adjusting the consolidated balance sheet as at November 1, 2019, the date of initial application, with no
restatement of comparative periods. The Bank will elect certain transition elections that include:
• Measure the ROU asset at the date of initial application as equal to lease liability with certain adjustments.
• Not apply IFRS 16 to operating leases with a remaining lease term of less than 12 months (short-term leases) or low value assets.
• Not apply IFRS 16 to leases of intangible assets.
The adoption of IFRS 16 as at November 1, 2019 is expected to result in an increase to total assets of approximately $3.7 billion, substantially representing real estate
leases and an increase in lease liabilities of approximately $3.7 billion. The Bank estimates that the adoption of IFRS 16 will also decrease its CET1 capital ratio by
approximately 10 bps.
IFRIC 23 Uncertainty over income tax treatments
On June 7, 2017, the IASB issued IFRIC 23 that is effective for the Bank beginning November 1, 2019. The interpretation clarifies the accounting for uncertainties over
income taxes. The interpretation clarifies application of recognition and measurement requirements in IAS 12 Income Taxes when there is uncertainty over income tax
treatments. The impact on the Bank’s consolidated financial statements is not material.
Employee Benefits
On February 7, 2018, the IASB issued narrow-scope amendments to pension accounting that is effective for the Bank beginning November 1, 2019. The amendments relate
to when a plan amendment, curtailment or settlement has occurred. In such instances, the Bank is required to use updated assumptions to determine current service cost
and net interest for the remainder of the reporting period after the change to the plan. For the Bank, the narrow-scope amendments are to be applied prospectively to plan
amendments, curtailments and settlements occurring after November 1, 2019.
Effective November 1, 2020
Definition of business
On October 22, 2018, the IASB issued a narrow-scope amendment to IFRS 3 Business Combination. The amendments will help companies determine whether an
acquisition is of a business or a group of assets. Distinguishing between a business and a group of assets is important because an acquirer recognizes goodwill only when
acquiring a business. The amendments apply to transactions for which the acquisition date is on or after the beginning of the first annual reporting period beginning on or
after January 1, 2020. Earlier adoption is permitted. The amendments will apply prospectively to new transactions.
Interest Rate Benchmark Reform
The IASB issued amendments to IFRS 9, IAS 39 and IFRS 7 on September 26, 2019, to amend certain requirements for hedge accounting in order to support the provision
of useful information by entities during the period of uncertainty arising from the phase out of interest rate benchmarks (e.g. interbank offered rates – IBORs). The
amendments aim to provide relief for financial instruments qualifying for hedge accounting which are affected during the period of uncertainty leading up to contractual rate
replacement. The amendments would no longer apply once uncertainties arising from IBOR reform are no longer present. The amendments require providing specific
disclosures for the affected hedging relationships. The amendments are effective for the Bank from November 1, 2020. Early application is permitted. The Bank is currently
assessing the impact and extent of disclosure requirements.
Effective November 1, 2021
Insurance Contracts
On May 18, 2017, the IASB issued IFRS 17 Insurance Contracts, which provides a comprehensive principle-based framework for the measurement and presentation of all
insurance contracts. The new standard will replace IFRS 4 Insurance Contracts and requires insurance contracts to be measured using current fulfillment cash flows and for
revenue to be recognized as the service is provided over the coverage period. The standard is required to be adopted retrospectively, if this is impractical, the modified
retrospective or fair value method may be used.
The IASB issued an exposure draft on June 26, 2019 proposing some amendments to IFRS 17, including a proposal to defer the effective date, by one year, to annual
periods on or after January 1, 2022. The Bank continues to monitor developments related to the standard and industry discussions on the application of the standard.
The project to implement IFRS 17 is a multi-year project consisting of technology upgrades and policy and process changes. The project structure and governance has been
established along with a Project Management Office to assist the Executive Steering and Project Operations Committees. The committees comprise of representatives from
Global Finance, Global Insurance Actuarial Services, Information Technology and the Insurance Business Operation. The Bank has completed a preliminary gap analysis of
the differences between IFRS 4 and IFRS 17, an initial contract scoping assessment and project plan. The Bank has determined that it will require new technology to
manage the insurance business and prepare additional disclosures, for the separate insurance legal entity financial statements, under the new standard. During 2020 the
Bank will continue to evaluate the impact to existing IT systems and processes and formulate the accounting policies under IFRS 17 in order to perform an initial
quantification of the impact to the new standard.
6 Cash and Deposits with Financial Institutions
As at October 31 ($ millions) 2019 2018
Cash and non-interest-bearing deposits with financial institutions $ 10,904 $ 8,997
Interest-bearing deposits with financial institutions 35,816 53,272
Total $ 46,720(1) $ 62,269(1)
(1) Net of impairment allowances of $3 (2018 – $3).
The Bank is required to maintain balances with central banks, other regulatory authorities and certain counterparties and these amounted to $9,401 million (2018 –
$8,886 million).
2019 Scotiabank Annual Report | 167

Consolidated Financial Statements
7 Fair Value of Financial Instruments
Determination of fair value
The calculation of fair value is based on market conditions at a specific point in time and therefore may not be reflective of future fair values. The Bank has controls and
processes in place to ensure that the valuation of financial instruments is appropriately determined.
The best evidence of fair value for a financial instrument is the quoted price in an active market. Unadjusted quoted market prices for identical instruments represent a
Level 1 valuation. Where possible, valuations are based on quoted prices or observable inputs obtained from active markets. Independent Price Verification (IPV) is
undertaken to assess the reliability and accuracy of prices and inputs used in the determination of fair value. The IPV process is performed by price verification groups that
are independent from the business. The Bank maintains a list of pricing sources that are used in the IPV process. These sources include, but are not limited to, brokers,
dealers and consensus pricing services. The valuation policies relating to the IPV process require that all pricing or rate sources used be external to the Bank. On a periodic
basis, an independent assessment of pricing or rate sources is performed to determine market presence or market representative levels.
Quoted prices are not always available for over-the-counter transactions, as well as transactions in inactive or illiquid markets. In these instances, internal models that
maximize the use of observable inputs are used to estimate fair value. The chosen valuation technique incorporates all the factors that market participants would take into
account in pricing a transaction. When all significant inputs to models are observable, the valuation is classified as Level 2. Financial instruments traded in a less active
market are valued using indicative market prices, present value of cash-flows or other valuation techniques. Fair value estimates normally do not consider forced or
liquidation sales.
Where financial instruments trade in inactive markets or when using models where observable parameters do not exist, greater management judgment is required for
valuation purposes. Valuations that require the significant use of unobservable inputs are considered Level 3.
The specific inputs and valuation techniques used in determining the fair value of financial instruments are noted below. For Level 3 instruments, additional information is
disclosed in the Level 3 sensitivity analysis on page 173.
The fair values of cash and deposits with banks, securities purchased under resale agreements and securities borrowed, customers’ liability under acceptances, obligations
related to securities sold under repurchase agreements and securities lent, acceptances, and obligations related to securities sold short are assumed to approximate their
carrying values, either due to their short-term nature or because they are frequently repriced to current market rates.
Trading loans
Trading loans as they relate to precious metals (primarily gold and silver) are valued using a discounted cash flow model incorporating market-observable inputs, including
precious metals spot and forward prices and interest rate curves (Level 2). Other trading loans that serve as hedges to loan-based credit total return swaps are valued using
consensus prices from Bank approved independent pricing services (Level 2).
Government issued or guaranteed securities
The fair values of government issued or guaranteed debt securities are primarily based on unadjusted quoted prices in active markets, where available (Level 1). Where
quoted prices are not available, the fair value is determined by utilizing recent transaction prices, broker quotes, or pricing services (Level 2).
For securities that are not actively traded, the Bank uses a discounted cash flow method, using the effective yield of a similar instrument adjusted for instrument-specific risk
factors such as credit spread and contracted features (Level 2).
Corporate and other debt
Corporate and other debt securities are valued using unadjusted quoted prices from independent market data providers or third-party broker quotes (Level 1). Where prices
are not available consistently, the last available data is used and verified with a yield-based valuation approach (Level 2). In some instances, interpolated yields of similar
bonds are used to price securities (Level 2). The Bank uses pricing models with observable inputs from market sources such as credit spread, interest rate curves, and
recovery rates (Level 2). These inputs are verified through an IPV process on a monthly basis.
For certain securities where there is no active market, no consensus market pricing and no indicative or executable independent third-party quotes, the Bank uses pricing by
third-party providers or internal pricing models and cannot readily observe the market inputs used to price such instruments (Level 3).
Mortgage-backed securities
The fair value of residential mortgage-backed securities is primarily determined using third-party broker quotes and independent market data providers, where the market is
more active (Level 2). Where the market is inactive, an internal price-based model is used (Level 3).
Equity securities
The fair value of equity securities is based on unadjusted quoted prices in active markets, where available (Level 1). Where equity securities are less frequently traded, the
most recent exchange-quoted pricing is used to determine fair value. Where there is a wide bid-offer spread, fair value is determined based on quoted market prices for
similar securities (Level 2).
Where quoted prices in active markets are not readily available, such as for private equity securities, the fair value is determined as a multiple of the underlying earnings or
percentage of underlying assets obtained from third-party general partner statements (Level 3).
Income funds
The fair value of income funds is based on observable unadjusted quoted prices where available (Level 1). Where quoted or active market prices are unavailable, the last
available Net Asset Value, fund statements and other financial information available from third-party fund managers at the fund level are used in arriving at the fair value
(Level 2).
168 | 2019 Scotiabank Annual Report

Consolidated Financial Statements
Derivatives
Fair values of exchange-traded derivatives are based on unadjusted quoted market prices (Level 1). Fair values of over-the-counter (OTC) derivatives or inactive exchange-
traded derivatives are determined using pricing models, which take into account input factors such as current market and contractual prices of the underlying instruments, as
well as time value and yield curve or volatility factors underlying the positions (Level 2). The determination of the fair value of derivatives includes consideration of credit risk,
estimated funding costs and ongoing direct costs over the life of the instruments.
Derivative products valued using a valuation technique with market-observable inputs mainly include interest rate swaps and options, currency swaps and forward foreign
exchange contracts. The most frequently applied valuation techniques include forward pricing and swap models, using present value calculations. The models incorporate
various inputs including foreign exchange spot and forward rates and interest rate curves (Level 2).
Derivative products valued using a valuation technique with significant unobservable inputs are long dated contracts (interest rate swaps, currency swaps, forward foreign
exchange contracts, option contracts and certain credit default swaps) and other derivative products that reference a basket of assets, commodities or currencies. These
models incorporate certain significant non-observable inputs such as volatility and correlation (Level 3).
Loans
The estimated fair value of loans carried at amortized cost reflects changes in the general level of interest rates and credit worthiness of borrowers that have occurred since
the loans were originated or purchased. The particular valuation methods used are as follows:
• Canadian fixed rate residential mortgages are fair valued by discounting the expected future contractual cash flows, taking into account expected prepayments and
using management’s best estimate of average market interest rates currently offered for mortgages with similar remaining terms (Level 3).
• For fixed rate business and government loans, fair value is determined by discounting the expected future contractual cash flows of these loans at interest rates
estimated by using the appropriate currency swap curves for the remaining term, adjusted for a credit mark of the expected losses in the portfolio (Level 3).
• For all other fixed rate loans, fair value is determined by discounting the expected future contractual cash flows of these loans at interest rates estimated by using the
appropriate currency swap curves for the remaining term (Level 3).
• For all floating rate loans fair value is assumed to equal book value.
The fair value of loans is not adjusted for the value of any credit protection the Bank has purchased to mitigate credit risk.
Deposits
The fair values of deposits payable on demand or after notice or floating rate deposits payable on a fixed date is assumed to equal book value.
The estimated fair values of Canadian personal fixed rate deposits payable on a fixed date are fair valued by discounting the expected future contractual cash outflows,
using management’s best estimate of average market interest rates currently offered for deposits with similar remaining terms (Level 2).
Deposits under the Canada Mortgage Bond (CMB) program are fair valued by discounting expected future contractual cash flows using market observable inputs (Level 2).
For all other fixed rate deposits, fair value is determined by discounting the expected future contractual cash flows of these deposits at interest rates estimated by using the
appropriate currency swap curves for the remaining term (Level 2).
For structured notes containing embedded features that are bifurcated from the Plain Vanilla notes, the fair value of the embedded derivatives is determined using option
pricing models with inputs similar to other interest rate or equity derivative contracts (Level 2). The fair value of certain embedded derivatives is determined using net asset
values (Level 3).
Subordinated debentures and other liabilities
The fair values of subordinated debentures, including debentures issued by subsidiaries which are included in other liabilities, are determined by reference to quoted market
prices where available or market prices for debt with similar terms and risks (Level 2). The fair values of other liabilities is determined by the discounted contractual cash flow
method with appropriate currency swap curves for the remaining term (Level 2).
2019 Scotiabank Annual Report | 169
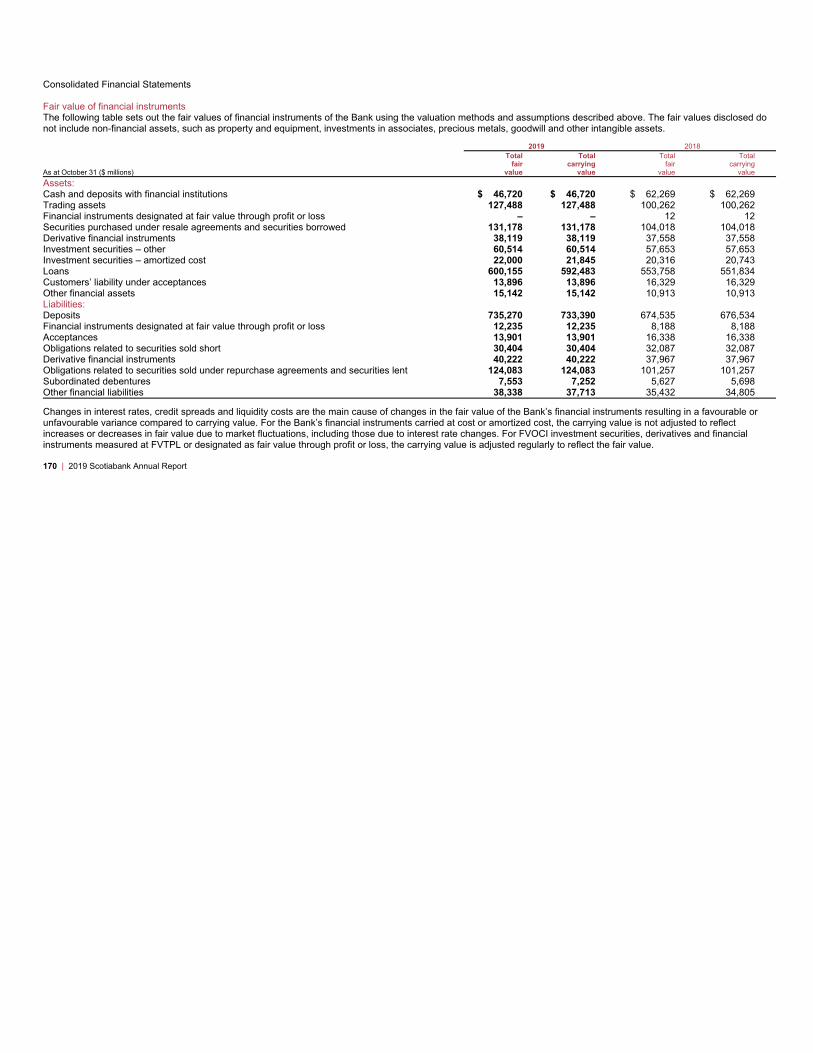
Consolidated Financial Statements
Fair value of financial instruments
The following table sets out the fair values of financial instruments of the Bank using the valuation methods and assumptions described above. The fair values disclosed do
not include non-financial assets, such as property and equipment, investments in associates, precious metals, goodwill and other intangible assets.
2019 2018
As at October 31 ($ millions)
Total
fair
value
Total
carrying
value
Total
fair
value
Total
carrying
value
Assets:
Cash and deposits with financial institutions $ 46,720 $ 46,720 $ 62,269 $ 62,269
Trading assets 127,488 127,488 100,262 100,262
Financial instruments designated at fair value through profit or loss – – 12 12
Securities purchased under resale agreements and securities borrowed 131,178 131,178 104,018 104,018
Derivative financial instruments 38,119 38,119 37,558 37,558
Investment securities – other 60,514 60,514 57,653 57,653
Investment securities – amortized cost 22,000 21,845 20,316 20,743
Loans 600,155 592,483 553,758 551,834
Customers’ liability under acceptances 13,896 13,896 16,329 16,329
Other financial assets 15,142 15,142 10,913 10,913
Liabilities:
Deposits 735,270 733,390 674,535 676,534
Financial instruments designated at fair value through profit or loss 12,235 12,235 8,188 8,188
Acceptances 13,901 13,901 16,338 16,338
Obligations related to securities sold short 30,404 30,404 32,087 32,087
Derivative financial instruments 40,222 40,222 37,967 37,967
Obligations related to securities sold under repurchase agreements and securities lent 124,083 124,083 101,257 101,257
Subordinated debentures 7,553 7,252 5,627 5,698
Other financial liabilities 38,338 37,713 35,432 34,805
Changes in interest rates, credit spreads and liquidity costs are the main cause of changes in the fair value of the Bank’s financial instruments resulting in a favourable or
unfavourable variance compared to carrying value. For the Bank’s financial instruments carried at cost or amortized cost, the carrying value is not adjusted to reflect
increases or decreases in fair value due to market fluctuations, including those due to interest rate changes. For FVOCI investment securities, derivatives and financial
instruments measured at FVTPL or designated as fair value through profit or loss, the carrying value is adjusted regularly to reflect the fair value.
170 | 2019 Scotiabank Annual Report
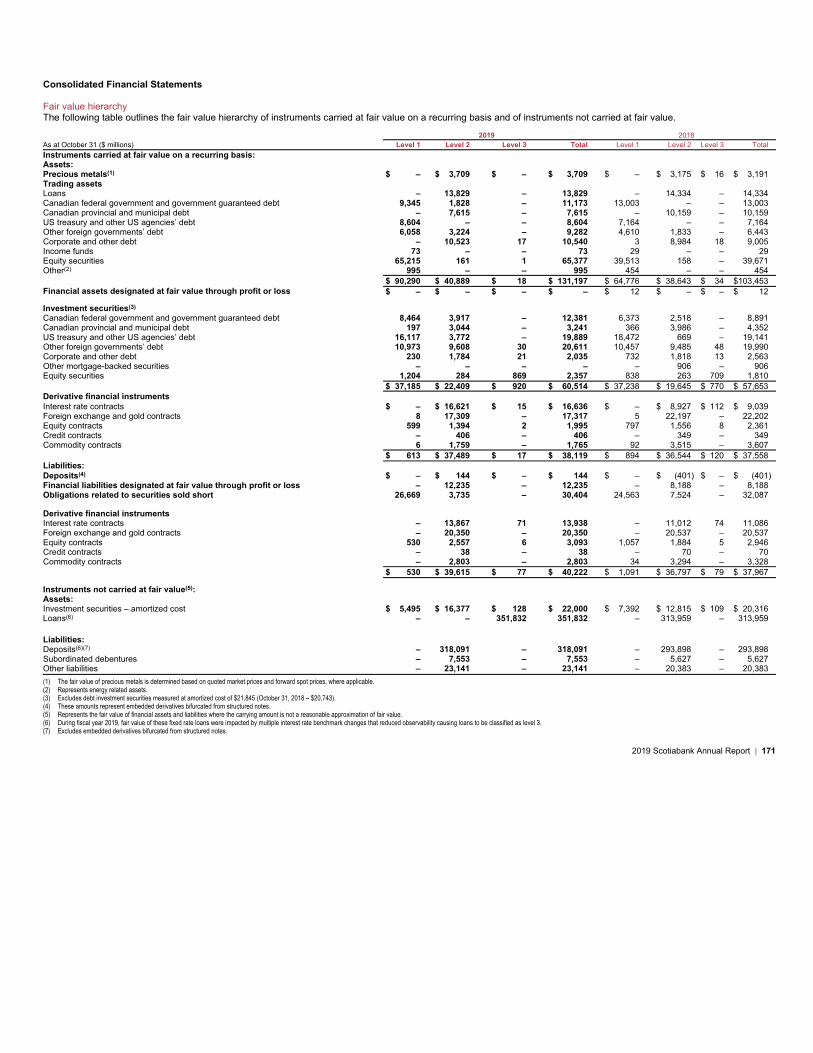
Consolidated Financial Statements
Fair value hierarchy
The following table outlines the fair value hierarchy of instruments carried at fair value on a recurring basis and of instruments not carried at fair value.
2019 2018
As at October 31 ($ millions) Level 1 Level 2 Level 3 Total Level 1 Level 2 Level 3 Total
Instruments carried at fair value on a recurring basis:
Assets:
Precious metals(1) $ – $ 3,709 $ – $ 3,709 $ – $ 3,175 $ 16 $ 3,191
Trading assets
Loans – 13,829 – 13,829 – 14,334 – 14,334
Canadian federal government and government guaranteed debt 9,345 1,828 – 11,173 13,003 – – 13,003
Canadian provincial and municipal debt – 7,615 – 7,615 – 10,159 – 10,159
US treasury and other US agencies’ debt 8,604 – – 8,604 7,164 – – 7,164
Other foreign governments’ debt 6,058 3,224 – 9,282 4,610 1,833 – 6,443
Corporate and other debt – 10,523 17 10,540 3 8,984 18 9,005
Income funds 73 – – 73 29 – – 29
Equity securities 65,215 161 1 65,377 39,513 158 – 39,671
Other(2) 995 – – 995 454 – – 454
$ 90,290 $ 40,889 $ 18 $ 131,197 $ 64,776 $ 38,643 $ 34 $103,453
Financial assets designated at fair value through profit or loss $ – $ – $ – $ – $ 12 $ – $ – $ 12
Investment securities(3)
Canadian federal government and government guaranteed debt 8,464 3,917 – 12,381 6,373 2,518 – 8,891
Canadian provincial and municipal debt 197 3,044 – 3,241 366 3,986 – 4,352
US treasury and other US agencies’ debt 16,117 3,772 – 19,889 18,472 669 – 19,141
Other foreign governments’ debt 10,973 9,608 30 20,611 10,457 9,485 48 19,990
Corporate and other debt 230 1,784 21 2,035 732 1,818 13 2,563
Other mortgage-backed securities – – – – – 906 – 906
Equity securities 1,204 284 869 2,357 838 263 709 1,810
$ 37,185 $ 22,409 $ 920 $ 60,514 $ 37,238 $ 19,645 $ 770 $ 57,653
Derivative financial instruments
Interest rate contracts $ – $ 16,621 $ 15 $ 16,636 $ – $ 8,927 $ 112 $ 9,039
Foreign exchange and gold contracts 8 17,309 – 17,317 5 22,197 – 22,202
Equity contracts 599 1,394 2 1,995 797 1,556 8 2,361
Credit contracts – 406 – 406 – 349 – 349
Commodity contracts 6 1,759 – 1,765 92 3,515 – 3,607
$ 613 $ 37,489 $ 17 $ 38,119 $ 894 $ 36,544 $ 120 $ 37,558
Liabilities:
Deposits(4) $ – $ 144 $ – $ 144 $ – $ (401) $ – $ (401)
Financial liabilities designated at fair value through profit or loss – 12,235 – 12,235 – 8,188 – 8,188
Obligations related to securities sold short 26,669 3,735 – 30,404 24,563 7,524 – 32,087
Derivative financial instruments
Interest rate contracts – 13,867 71 13,938 – 11,012 74 11,086
Foreign exchange and gold contracts – 20,350 – 20,350 – 20,537 – 20,537
Equity contracts 530 2,557 6 3,093 1,057 1,884 5 2,946
Credit contracts – 38 – 38 – 70 – 70
Commodity contracts – 2,803 – 2,803 34 3,294 – 3,328
$ 530 $ 39,615 $ 77 $ 40,222 $ 1,091 $ 36,797 $ 79 $ 37,967
Instruments not carried at fair value(5):
Assets:
Investment securities – amortized cost $ 5,495 $ 16,377 $ 128 $ 22,000 $ 7,392 $ 12,815 $ 109 $ 20,316
Loans(6) – – 351,832 351,832 – 313,959 – 313,959
Liabilities:
Deposits(6)(7) – 318,091 – 318,091 – 293,898 – 293,898
Subordinated debentures – 7,553 – 7,553 – 5,627 – 5,627
Other liabilities – 23,141 – 23,141 – 20,383 – 20,383
(1) The fair value of precious metals is determined based on quoted market prices and forward spot prices, where applicable.
(2) Represents energy related assets.
(3) Excludes debt investment securities measured at amortized cost of $21,845 (October 31, 2018 – $20,743).
(4) These amounts represent embedded derivatives bifurcated from structured notes.
(5) Represents the fair value of financial assets and liabilities where the carrying amount is not a reasonable approximation of fair value.
(6) During fiscal year 2019, fair value of these fixed rate loans were impacted by multiple interest rate benchmark changes that reduced observability causing loans to be classified as level 3.
(7) Excludes embedded derivatives bifurcated from structured notes.
2019 Scotiabank Annual Report | 171
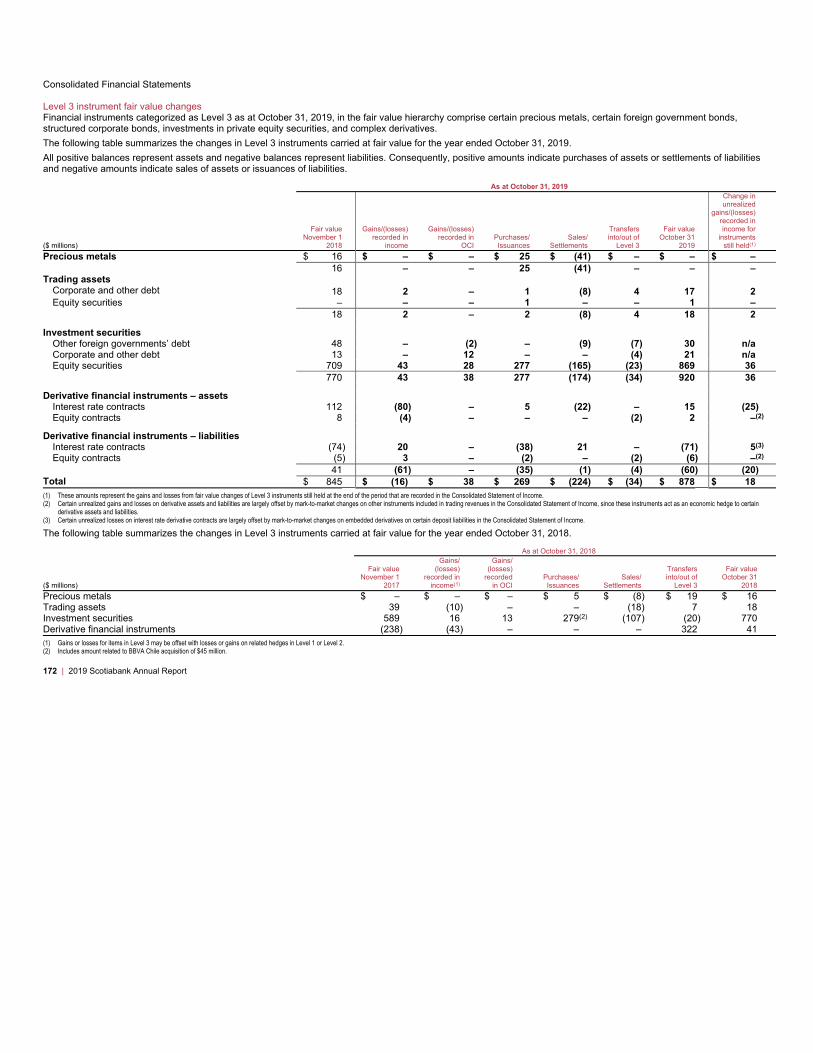
Consolidated Financial Statements
Level 3 instrument fair value changes
Financial instruments categorized as Level 3 as at October 31, 2019, in the fair value hierarchy comprise certain precious metals, certain foreign government bonds,
structured corporate bonds, investments in private equity securities, and complex derivatives.
The following table summarizes the changes in Level 3 instruments carried at fair value for the year ended October 31, 2019.
All positive balances represent assets and negative balances represent liabilities. Consequently, positive amounts indicate purchases of assets or settlements of liabilities
and negative amounts indicate sales of assets or issuances of liabilities.
As at October 31, 2019
($ millions)
Fair value
November 1
2018
Gains/(losses)
recorded in
income
Gains/(losses)
recorded in
OCI
Purchases/
Issuances
Sales/
Settlements
Transfers
into/out of
Level 3
Fair value
October 31
2019
Change in
unrealized
gains/(losses)
recorded in
income for
instruments
still held(1)
Precious metals $ 16 $ – $ – $ 25 $ (41) $ – $ – $ –
16 – – 25 (41) – – –
Trading assets
Corporate and other debt 18 2 – 1 (8) 4 17 2
Equity securities – – – 1 – – 1 –
18 2 – 2 (8) 4 18 2
Investment securities
Other foreign governments’ debt 48 – (2) – (9) (7) 30 n/a
Corporate and other debt 13 – 12 – – (4) 21 n/a
Equity securities 709 43 28 277 (165) (23) 869 36
770 43 38 277 (174) (34) 920 36
Derivative financial instruments – assets
Interest rate contracts 112 (80) – 5 (22) – 15 (25)
Equity contracts 8 (4) – – – (2) 2 –(2)
Derivative financial instruments – liabilities
Interest rate contracts (74) 20 – (38) 21 – (71) 5(3)
Equity contracts (5) 3 – (2) – (2) (6) –(2)
41 (61) – (35) (1) (4) (60) (20)
Total $ 845 $ (16) $ 38 $ 269 $ (224) $ (34) $ 878 $ 18
(1) These amounts represent the gains and losses from fair value changes of Level 3 instruments still held at the end of the period that are recorded in the Consolidated Statement of Income.
(2) Certain unrealized gains and losses on derivative assets and liabilities are largely offset by mark-to-market changes on other instruments included in trading revenues in the Consolidated Statement of Income, since these instruments act as an economic hedge to certain
derivative assets and liabilities.
(3) Certain unrealized losses on interest rate derivative contracts are largely offset by mark-to-market changes on embedded derivatives on certain deposit liabilities in the Consolidated Statement of Income.
The following table summarizes the changes in Level 3 instruments carried at fair value for the year ended October 31, 2018.
As at October 31, 2018
($ millions)
Fair value
November 1
2017
Gains/
(losses)
recorded in
income(1)
Gains/
(losses)
recorded
in OCI
Purchases/
Issuances
Sales/
Settlements
Transfers
into/out of
Level 3
Fair value
October 31
2018
Precious metals $ – $ – $ – $ 5 $ (8) $ 19 $ 16
Trading assets 39 (10) – – (18) 7 18
Investment securities 589 16 13 279(2) (107) (20) 770
Derivative financial instruments (238) (43) – – – 322 41
(1) Gains or losses for items in Level 3 may be offset with losses or gains on related hedges in Level 1 or Level 2.
(2) Includes amount related to BBVA Chile acquisition of $45 million.
172 | 2019 Scotiabank Annual Report
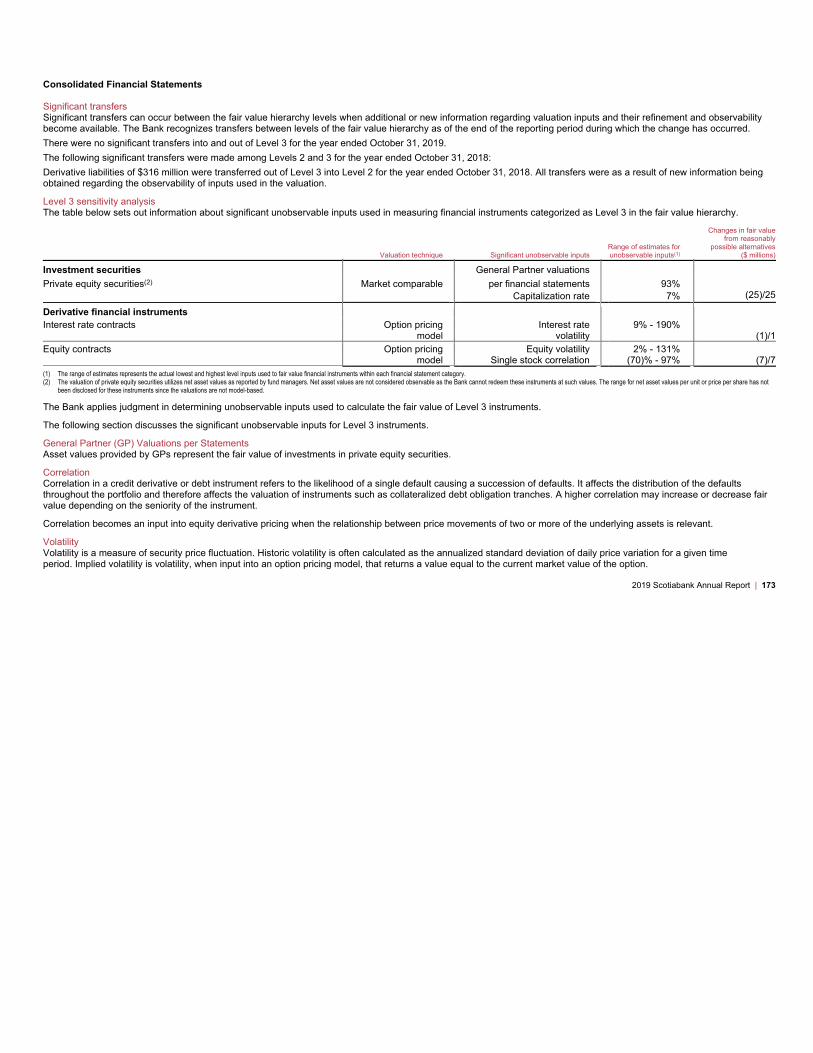
Consolidated Financial Statements
Significant transfers
Significant transfers can occur between the fair value hierarchy levels when additional or new information regarding valuation inputs and their refinement and observability
become available. The Bank recognizes transfers between levels of the fair value hierarchy as of the end of the reporting period during which the change has occurred.
There were no significant transfers into and out of Level 3 for the year ended October 31, 2019.
The following significant transfers were made among Levels 2 and 3 for the year ended October 31, 2018:
Derivative liabilities of $316 million were transferred out of Level 3 into Level 2 for the year ended October 31, 2018. All transfers were as a result of new information being
obtained regarding the observability of inputs used in the valuation.
Level 3 sensitivity analysis
The table below sets out information about significant unobservable inputs used in measuring financial instruments categorized as Level 3 in the fair value hierarchy.
Valuation technique Significant unobservable inputs
Range of estimates for
unobservable inputs(1)
Changes in fair value
from reasonably
possible alternatives
($ millions)
Investment securities General Partner valuations
Private equity securities(2) Market comparable per financial statements 93%
(25)/25Capitalization rate 7%
Derivative financial instruments
Interest rate contracts Option pricing Interest rate 9% - 190%
(1)/1model volatility
Equity contracts Option pricing Equity volatility 2% - 131%
(7)/7model Single stock correlation (70)% - 97%
(1) The range of estimates represents the actual lowest and highest level inputs used to fair value financial instruments within each financial statement category.
(2) The valuation of private equity securities utilizes net asset values as reported by fund managers. Net asset values are not considered observable as the Bank cannot redeem these instruments at such values. The range for net asset values per unit or price per share has not
been disclosed for these instruments since the valuations are not model-based.
The Bank applies judgment in determining unobservable inputs used to calculate the fair value of Level 3 instruments.
The following section discusses the significant unobservable inputs for Level 3 instruments.
General Partner (GP) Valuations per Statements
Asset values provided by GPs represent the fair value of investments in private equity securities.
Correlation
Correlation in a credit derivative or debt instrument refers to the likelihood of a single default causing a succession of defaults. It affects the distribution of the defaults
throughout the portfolio and therefore affects the valuation of instruments such as collateralized debt obligation tranches. A higher correlation may increase or decrease fair
value depending on the seniority of the instrument.
Correlation becomes an input into equity derivative pricing when the relationship between price movements of two or more of the underlying assets is relevant.
Volatility
Volatility is a measure of security price fluctuation. Historic volatility is often calculated as the annualized standard deviation of daily price variation for a given time
period. Implied volatility is volatility, when input into an option pricing model, that returns a value equal to the current market value of the option.
2019 Scotiabank Annual Report | 173
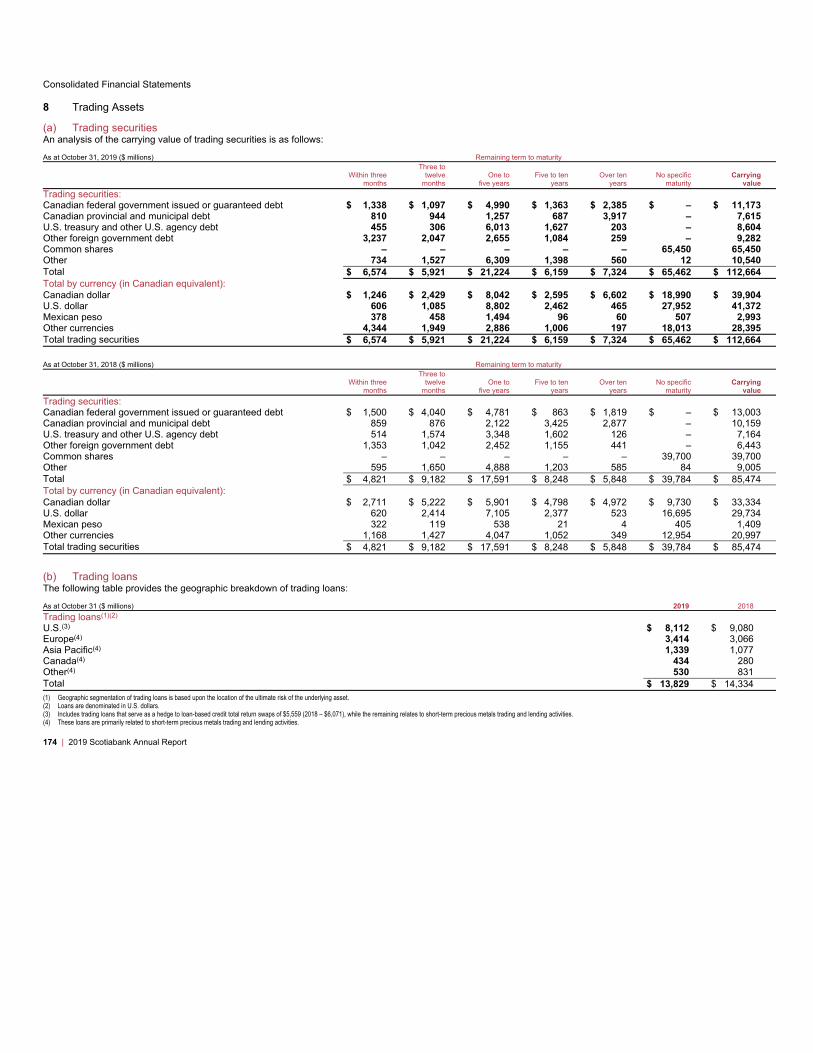
Consolidated Financial Statements
8 Trading Assets
(a) Trading securities
An analysis of the carrying value of trading securities is as follows:
As at October 31, 2019 ($ millions) Remaining term to maturity
Within three
months
Three to
twelve
months
One to
five years
Five to ten
years
Over ten
years
No specific
maturity
Carrying
value
Trading securities:
Canadian federal government issued or guaranteed debt $ 1,338 $ 1,097 $ 4,990 $ 1,363 $ 2,385 $ – $ 11,173
Canadian provincial and municipal debt 810 944 1,257 687 3,917 – 7,615
U.S. treasury and other U.S. agency debt 455 306 6,013 1,627 203 – 8,604
Other foreign government debt 3,237 2,047 2,655 1,084 259 – 9,282
Common shares – – – – – 65,450 65,450
Other 734 1,527 6,309 1,398 560 12 10,540
Total $ 6,574 $ 5,921 $ 21,224 $ 6,159 $ 7,324 $ 65,462 $ 112,664
Total by currency (in Canadian equivalent):
Canadian dollar $ 1,246 $ 2,429 $ 8,042 $ 2,595 $ 6,602 $ 18,990 $ 39,904
U.S. dollar 606 1,085 8,802 2,462 465 27,952 41,372
Mexican peso 378 458 1,494 96 60 507 2,993
Other currencies 4,344 1,949 2,886 1,006 197 18,013 28,395
Total trading securities $ 6,574 $ 5,921 $ 21,224 $ 6,159 $ 7,324 $ 65,462 $ 112,664
As at October 31, 2018 ($ millions) Remaining term to maturity
Within three
months
Three to
twelve
months
One to
five years
Five to ten
years
Over ten
years
No specific
maturity
Carrying
value
Trading securities:
Canadian federal government issued or guaranteed debt $ 1,500 $ 4,040 $ 4,781 $ 863 $ 1,819 $ – $ 13,003
Canadian provincial and municipal debt 859 876 2,122 3,425 2,877 – 10,159
U.S. treasury and other U.S. agency debt 514 1,574 3,348 1,602 126 – 7,164
Other foreign government debt 1,353 1,042 2,452 1,155 441 – 6,443
Common shares – – – – – 39,700 39,700
Other 595 1,650 4,888 1,203 585 84 9,005
Total $ 4,821 $ 9,182 $ 17,591 $ 8,248 $ 5,848 $ 39,784 $ 85,474
Total by currency (in Canadian equivalent):
Canadian dollar $ 2,711 $ 5,222 $ 5,901 $ 4,798 $ 4,972 $ 9,730 $ 33,334
U.S. dollar 620 2,414 7,105 2,377 523 16,695 29,734
Mexican peso 322 119 538 21 4 405 1,409
Other currencies 1,168 1,427 4,047 1,052 349 12,954 20,997
Total trading securities $ 4,821 $ 9,182 $ 17,591 $ 8,248 $ 5,848 $ 39,784 $ 85,474
(b) Trading loans
The following table provides the geographic breakdown of trading loans:
As at October 31 ($ millions) 2019 2018
Trading loans(1)(2)
U.S.(3) $ 8,112 $ 9,080
Europe(4) 3,414 3,066
Asia Pacific(4) 1,339 1,077
Canada(4) 434 280
Other(4) 530 831
Total $ 13,829 $ 14,334
(1) Geographic segmentation of trading loans is based upon the location of the ultimate risk of the underlying asset.
(2) Loans are denominated in U.S. dollars.
(3) Includes trading loans that serve as a hedge to loan-based credit total return swaps of $5,559 (2018 – $6,071), while the remaining relates to short-term precious metals trading and lending activities.
(4) These loans are primarily related to short-term precious metals trading and lending activities.
174 | 2019 Scotiabank Annual Report

Consolidated Financial Statements
9 Financial Instruments Designated at Fair Value Through Profit or Loss
In accordance with its risk management strategy, the Bank has elected to designate certain investments and senior note liabilities at fair value through profit or loss to reduce
an accounting mismatch between fair value changes in these instruments and fair value changes in related derivatives, and where a hybrid financial liability contains one or
more embedded derivatives that are not closely related to the host contract. Changes in fair value of financial liabilities arising from the Bank’s own credit risk are recognized
in other comprehensive income, without subsequent reclassification to net income.
The cumulative fair value adjustment due to own credit risk is determined at a point in time by comparing the present value of expected future cash flows over the term of
these liabilities discounted at the Bank’s effective funding rate, and the present value of expected future cash flows discounted under a benchmark rate.
The following table presents the fair value of financial assets and liabilities designated at fair value through profit or loss and their changes in fair value.
Fair value Change in fair value Cumulative change in FV(1)
As at For the year ended
October 31 ($ millions) 2019 2018 2019 2018 2019 2018
Assets
Investment securities(2) $ – $ 12 $ – $ – $ – $ –
Liabilities
Senior note liabilities(3) $ 12,235 $ 8,188 $ (1,230) $ 869 $ (452) $ 778
(1) The cumulative change in fair value is measured from the instruments’ date of initial recognition.
(2) Changes in fair value are recorded in non-interest income – other.
(3) Changes in fair value attributable to changes in the Bank’s own credit risk are recorded in other comprehensive income. Other changes in fair value are recorded in non-interest income – trading revenues.
The following tables present the changes in fair value attributable to changes in the Bank’s own credit risk for financial liabilities designated at fair value through profit or loss
as well as their contractual maturity and carrying amounts.
Senior Note Liabilities
($ millions)
Contractual
maturity
amount(1)
Carrying
Value
Difference
between
carrying value
and
contractual
maturity
amount
Changes in fair value
for the period
attributable to
changes in own
credit risk recorded
in other
comprehensive
income
Cumulative changes
in fair value
attributable to
changes in own
credit risk(1)
As at October 31, 2019 $ 11,783 $ 12,235 $ (452) $ 11 $ (55)
As at October 31, 2018 $ 8,966 $ 8,188 $ 778 $ (30) $ (66)
(1) The cumulative change in fair value is measured from the instruments’ date of initial recognition.
2019 Scotiabank Annual Report | 175
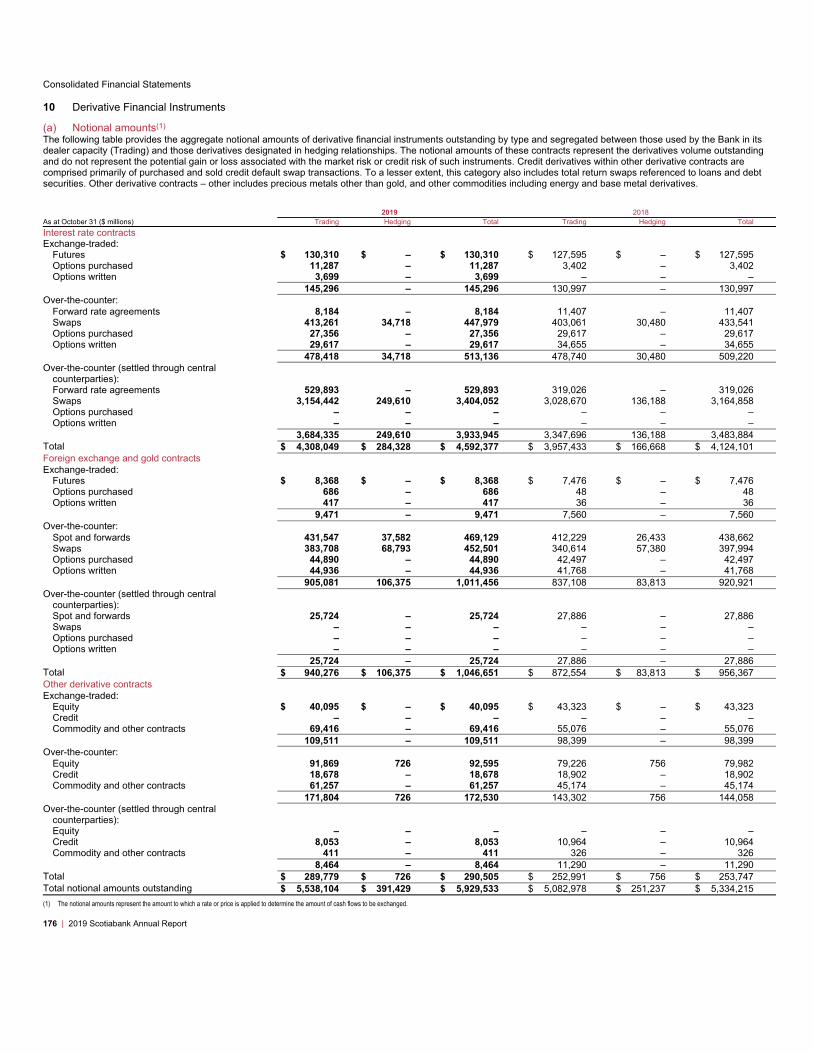
Consolidated Financial Statements
10 Derivative Financial Instruments
(a) Notional amounts(1)
The following table provides the aggregate notional amounts of derivative financial instruments outstanding by type and segregated between those used by the Bank in its
dealer capacity (Trading) and those derivatives designated in hedging relationships. The notional amounts of these contracts represent the derivatives volume outstanding
and do not represent the potential gain or loss associated with the market risk or credit risk of such instruments. Credit derivatives within other derivative contracts are
comprised primarily of purchased and sold credit default swap transactions. To a lesser extent, this category also includes total return swaps referenced to loans and debt
securities. Other derivative contracts – other includes precious metals other than gold, and other commodities including energy and base metal derivatives.
2019 2018
As at October 31 ($ millions) Trading Hedging Total Trading Hedging Total
Interest rate contracts
Exchange-traded:
Futures $ 130,310 $ – $ 130,310 $ 127,595 $ – $ 127,595
Options purchased 11,287 – 11,287 3,402 – 3,402
Options written 3,699 – 3,699 – – –
145,296 – 145,296 130,997 – 130,997
Over-the-counter:
Forward rate agreements 8,184 – 8,184 11,407 – 11,407
Swaps 413,261 34,718 447,979 403,061 30,480 433,541
Options purchased 27,356 – 27,356 29,617 – 29,617
Options written 29,617 – 29,617 34,655 – 34,655
478,418 34,718 513,136 478,740 30,480 509,220
Over-the-counter (settled through central
counterparties):
Forward rate agreements 529,893 – 529,893 319,026 – 319,026
Swaps 3,154,442 249,610 3,404,052 3,028,670 136,188 3,164,858
Options purchased – – – – – –
Options written – – – – – –
3,684,335 249,610 3,933,945 3,347,696 136,188 3,483,884
Total $ 4,308,049 $ 284,328 $ 4,592,377 $ 3,957,433 $ 166,668 $ 4,124,101
Foreign exchange and gold contracts
Exchange-traded:
Futures $ 8,368 $ – $ 8,368 $ 7,476 $ – $ 7,476
Options purchased 686 – 686 48 – 48
Options written 417 – 417 36 – 36
9,471 – 9,471 7,560 – 7,560
Over-the-counter:
Spot and forwards 431,547 37,582 469,129 412,229 26,433 438,662
Swaps 383,708 68,793 452,501 340,614 57,380 397,994
Options purchased 44,890 – 44,890 42,497 – 42,497
Options written 44,936 – 44,936 41,768 – 41,768
905,081 106,375 1,011,456 837,108 83,813 920,921
Over-the-counter (settled through central
counterparties):
Spot and forwards 25,724 – 25,724 27,886 – 27,886
Swaps – – – – – –
Options purchased – – – – – –
Options written – – – – – –
25,724 – 25,724 27,886 – 27,886
Total $ 940,276 $ 106,375 $ 1,046,651 $ 872,554 $ 83,813 $ 956,367
Other derivative contracts
Exchange-traded:
Equity $ 40,095 $ – $ 40,095 $ 43,323 $ – $ 43,323
Credit – – – – – –
Commodity and other contracts 69,416 – 69,416 55,076 – 55,076
109,511 – 109,511 98,399 – 98,399
Over-the-counter:
Equity 91,869 726 92,595 79,226 756 79,982
Credit 18,678 – 18,678 18,902 – 18,902
Commodity and other contracts 61,257 – 61,257 45,174 – 45,174
171,804 726 172,530 143,302 756 144,058
Over-the-counter (settled through central
counterparties):
Equity – – – – – –
Credit 8,053 – 8,053 10,964 – 10,964
Commodity and other contracts 411 – 411 326 – 326
8,464 – 8,464 11,290 – 11,290
Total $ 289,779 $ 726 $ 290,505 $ 252,991 $ 756 $ 253,747
Total notional amounts outstanding $ 5,538,104 $ 391,429 $ 5,929,533 $ 5,082,978 $ 251,237 $ 5,334,215
(1) The notional amounts represent the amount to which a rate or price is applied to determine the amount of cash flows to be exchanged.
176 | 2019 Scotiabank Annual Report

Consolidated Financial Statements
(b) Remaining term to maturity
The following table summarizes the remaining term to maturity of the notional amounts of the Bank’s derivative financial instruments by type:
As at October 31, 2019 ($ millions) Within one year One to five years Over five years Total
Interest rate contracts
Futures $ 81,584 $ 48,087 $ 639 $ 130,310
Forward rate agreements 414,294 117,694 6,089 538,077
Swaps 1,182,231 1,781,124 888,676 3,852,031
Options purchased 19,633 16,813 2,197 38,643
Options written 8,408 19,148 5,760 33,316
1,706,150 1,982,866 903,361 4,592,377
Foreign exchange and gold contracts
Futures 6,574 1,762 32 8,368
Spot and forwards 465,712 25,605 3,536 494,853
Swaps 104,706 206,695 141,100 452,501
Options purchased 39,105 6,218 253 45,576
Options written 40,628 4,493 232 45,353
656,725 244,773 145,153 1,046,651
Other derivative contracts
Equity 75,388 54,045 3,257 132,690
Credit 13,562 11,418 1,751 26,731
Commodity and other contracts 93,950 36,603 531 131,084
182,900 102,066 5,539 290,505
Total $ 2,545,775 $ 2,329,705 $ 1,054,053 $ 5,929,533
As at October 31, 2018 ($ millions) Within one year One to five years Over five years Total
Interest rate contracts
Futures $ 72,068 $ 55,519 $ 8 $ 127,595
Forward rate agreements 227,761 92,717 9,955 330,433
Swaps 1,316,741 1,448,580 833,078 3,598,399
Options purchased 6,644 22,985 3,390 33,019
Options written 4,211 24,718 5,726 34,655
1,627,425 1,644,519 852,157 4,124,101
Foreign exchange and gold contracts
Futures 3,005 4,100 371 7,476
Spot and forwards 438,760 26,241 1,547 466,548
Swaps 90,987 195,484 111,523 397,994
Options purchased 39,505 2,851 189 42,545
Options written 39,395 2,199 210 41,804
611,652 230,875 113,840 956,367
Other derivative contracts
Equity 84,333 34,890 4,082 123,305
Credit 13,056 13,798 3,012 29,866
Commodity and other contracts 70,292 29,958 326 100,576
167,681 78,646 7,420 253,747
Total $ 2,406,758 $ 1,954,040 $ 973,417 $ 5,334,215
(c) Credit risk
As with other financial assets, derivative instruments are subject to credit risk. Credit risk arises from the possibility that counterparties may default on their obligations to the
Bank. However, whereas the credit risk of other financial assets is represented by the principal amount net of any applicable allowance for credit losses, the credit risk
associated with derivatives is normally a small fraction of the notional amount of the derivative instrument.
Derivative contracts generally expose the Bank to credit loss if changes in market rates affect a counterparty’s position unfavourably and the counterparty defaults on
payment. Accordingly, exposure to credit risk of derivatives is represented by the positive fair value of the instrument.
Negotiated over-the-counter derivatives generally present greater credit exposure than exchange-traded contracts. The net change in the exchange-traded contracts is
normally settled daily in cash with the exchange. Holders of these contracts look to the exchange for performance under the contract.
The Bank strives to limit credit risk by dealing with counterparties that it believes are creditworthy, and investment grade counterparties account for a significant portion of the
credit risk exposure arising from the Bank’s derivative transactions as at October 31, 2019. To control credit risk associated with derivatives, the Bank uses similar credit risk
management activities and procedures to the approaches used in the lending business in assessing and adjudicating exposure. The Bank utilizes a risk metric, potential
future exposure (PFE) for derivatives, to measure utilization against established credit limits to the counterparty. PFE measures the effect that changes in the market have
on derivative exposures throughout
2019 Scotiabank Annual Report | 177

Consolidated Financial Statements
the lifetime of the counterparties’ trades. Additionally, PFE considers risk mitigants such as netting and collateralization. PFE limits and utilization for derivatives
counterparties are authorized and monitored by the Bank’s risk management unit.
The Bank obtains the benefit of netting by entering into master netting arrangements with counterparties (typically industry standard International Swaps and Derivatives
Association (ISDA) agreements), which allow for a single net settlement of all transactions covered by that agreement in the event of a default or early termination of the
transactions. In this manner, the credit risk associated with favourable contracts is eliminated by the master netting arrangement to the extent that unfavourable contracts
with the same counterparty are not settled before favourable contracts.
Collateralization is typically documented by way of an ISDA Credit Support Annex (CSA), the terms of which may vary according to each party’s view of the other party’s
creditworthiness. CSAs can require one party to post initial margin at the onset of each transaction. CSAs also allow for variation margin to be called if total uncollateralized
mark-to-market exposure exceeds an agreed upon threshold. Such variation margin provisions can be one way (only one party will ever post collateral) or bi-lateral (either
party may post collateral depending upon which party is in-the-money). The CSA will also detail the types of collateral that are acceptable to each party, and the adjustments
that will be applied against each collateral type. The terms of the ISDA master netting agreements and CSAs are taken into consideration in the calculation of counterparty
credit risk exposure (see also page 83 of the 2019 Annual Report).
Derivative instruments used by the Bank include credit derivatives in its investment and loan portfolios: credit protection is sold as an alternative to acquiring exposure to
bond or loan assets, and bought to manage or mitigate credit exposures.
The following table summarizes the credit exposure of the Bank’s derivative financial instruments. The credit risk amount (CRA) represents the estimated replacement cost,
or positive fair value, for all contracts. CRA takes into account master netting or collateral arrangements that have been made1. CRA does not reflect actual or expected
losses.
The credit equivalent amount (CEA) is the exposure at default (EAD) prescribed in the Capital Adequacy Requirements (CAR) Guidelines of the Office of the Superintendent
of Financial Institutions (OSFI). The risk-weighted asset is calculated by multiplying the CEA by the capital requirement (K) times 12.5, where K is a function of the probability
of default (PD), loss given default (LGD), maturity and prescribed correlation factors. Other derivative contracts – other includes precious metals other than gold, and other
commodities, including energy and base metal derivatives.
2019 2018
As at October 31 ($ millions) Notional amount
Credit risk
amount
(CRA)(1)
Credit
equivalent
amount
(CEA)(1)
CET1
Risk
Weighted
Assets(2) Notional amount
Credit risk
amount
(CRA)(1)
Credit
equivalent
amount
(CEA)(1)
CET1
Risk
Weighted
Assets(2)
Interest rate contracts
Futures $ 130,310 $ – $ 39 $ – $ 127,595 $ – $ 93 $ –
Forward rate agreements 538,077 49 249 127 330,433 36 157 82
Swaps 3,852,031 5,345 6,369 2,145 3,598,399 96 4,436 1,125
Options purchased 38,643 42 43 19 33,019 36 138 63
Options written 33,316 – 26 10 34,655 – 2 1
4,592,377 5,436 6,726 2,301 4,124,101 168 4,826 1,271
Foreign exchange and gold contracts
Futures 8,368 – 39 – 7,476 – 85 –
Spot and forwards 494,853 3,594 4,990 1,797 466,548 2,571 5,440 2,006
Swaps 452,501 2,188 7,015 2,678 397,994 4,297 8,232 2,604
Options purchased 45,576 755 284 157 42,545 712 240 76
Options written 45,353 – 35 8 41,804 – 20 5
1,046,651 6,537 12,363 4,640 956,367 7,580 14,017 4,691
Other derivative contracts
Equity 132,690 698 7,882 1,166 123,305 455 4,927 1,505
Credit 26,731 167 295 98 29,866 239 420 119
Commodity and other contracts 131,084 693 4,775 513 100,576 1,182 8,052 830
290,505 1,558 12,952 1,777 253,747 1,876 13,399 2,454
Credit Valuation Adjustment(2)– – – 6,537 – – – 4,616
Total derivatives $ 5,929,533 $ 13,531 $ 32,041 $ 15,255 $ 5,334,215 $ 9,624 $ 32,242 $ 13,032
Amount settled through central counterparties(3)
Exchange-traded 264,278 – 5,811 128 236,956 – 7,300 153
Over-the-counter 3,968,133 – 1,084 22 3,523,060 – 781 16
$ 4,232,411 $ – $ 6,895 $ 150 $ 3,760,016 $ – $ 8,081 $ 169
(1) The amounts presented are net of collateral and master netting agreements at the product level. The total amounts relating to netting and collateral were $24,588 (2018 – $27,934) for CRA, and $62,521 (2018 – $63,831) for CEA.
(2) In accordance with OSFI’s requirements, effective 2019, Credit Valuation Adjustment (CVA) to CET1 RWA for derivatives have been fully phased-in. In the prior year, the CVA was 0.80.
(3) Amounts are included under total derivatives above. Amounts include exposures settled directly through central counterparties and exposures settled through clearing members of central counterparties.
1 Regulatory haircuts prescribed by the OSFI CAR Guidelines are applied to the collateral balances of the CRA measure.
178 | 2019 Scotiabank Annual Report
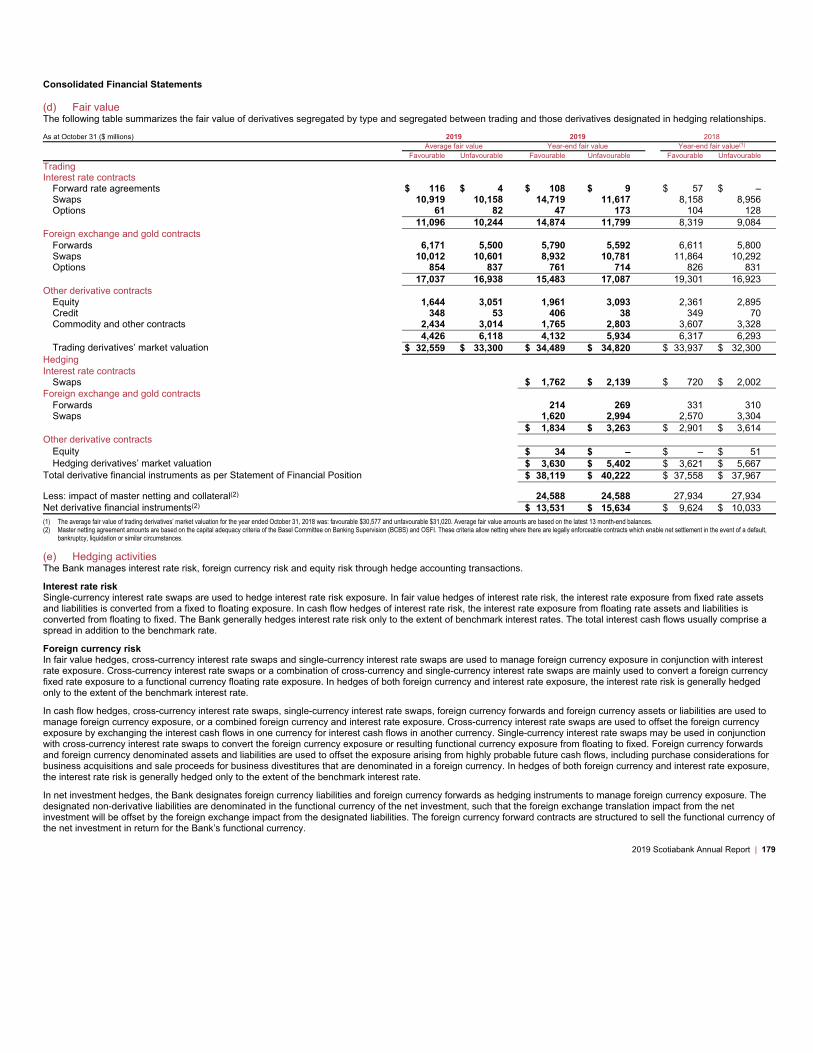
Consolidated Financial Statements
(d) Fair value
The following table summarizes the fair value of derivatives segregated by type and segregated between trading and those derivatives designated in hedging relationships.
As at October 31 ($ millions) 2019 2019 2018
Average fair value Year-end fair value Year-end fair value(1)
Favourable Unfavourable Favourable Unfavourable Favourable Unfavourable
Trading
Interest rate contracts
Forward rate agreements $ 116 $ 4 $ 108 $ 9 $ 57 $ –
Swaps 10,919 10,158 14,719 11,617 8,158 8,956
Options 61 82 47 173 104 128
11,096 10,244 14,874 11,799 8,319 9,084
Foreign exchange and gold contracts
Forwards 6,171 5,500 5,790 5,592 6,611 5,800
Swaps 10,012 10,601 8,932 10,781 11,864 10,292
Options 854 837 761 714 826 831
17,037 16,938 15,483 17,087 19,301 16,923
Other derivative contracts
Equity 1,644 3,051 1,961 3,093 2,361 2,895
Credit 348 53 406 38 349 70
Commodity and other contracts 2,434 3,014 1,765 2,803 3,607 3,328
4,426 6,118 4,132 5,934 6,317 6,293
Trading derivatives’ market valuation $ 32,559 $ 33,300 $ 34,489 $ 34,820 $ 33,937 $ 32,300
Hedging
Interest rate contracts
Swaps $ 1,762 $ 2,139 $ 720 $ 2,002
Foreign exchange and gold contracts
Forwards 214 269 331 310
Swaps 1,620 2,994 2,570 3,304
$ 1,834 $ 3,263 $ 2,901 $ 3,614
Other derivative contracts
Equity $ 34 $ – $ – $ 51
Hedging derivatives’ market valuation $ 3,630 $ 5,402 $ 3,621 $ 5,667
Total derivative financial instruments as per Statement of Financial Position $ 38,119 $ 40,222 $ 37,558 $ 37,967
Less: impact of master netting and collateral(2) 24,588 24,588 27,934 27,934
Net derivative financial instruments(2)$ 13,531 $ 15,634 $ 9,624 $ 10,033
(1) The average fair value of trading derivatives’ market valuation for the year ended October 31, 2018 was: favourable $30,577 and unfavourable $31,020. Average fair value amounts are based on the latest 13 month-end balances.
(2) Master netting agreement amounts are based on the capital adequacy criteria of the Basel Committee on Banking Supervision (BCBS) and OSFI. These criteria allow netting where there are legally enforceable contracts which enable net settlement in the event of a default,
bankruptcy, liquidation or similar circumstances.
(e) Hedging activities
The Bank manages interest rate risk, foreign currency risk and equity risk through hedge accounting transactions.
Interest rate risk
Single-currency interest rate swaps are used to hedge interest rate risk exposure. In fair value hedges of interest rate risk, the interest rate exposure from fixed rate assets
and liabilities is converted from a fixed to floating exposure. In cash flow hedges of interest rate risk, the interest rate exposure from floating rate assets and liabilities is
converted from floating to fixed. The Bank generally hedges interest rate risk only to the extent of benchmark interest rates. The total interest cash flows usually comprise a
spread in addition to the benchmark rate.
Foreign currency risk
In fair value hedges, cross-currency interest rate swaps and single-currency interest rate swaps are used to manage foreign currency exposure in conjunction with interest
rate exposure. Cross-currency interest rate swaps or a combination of cross-currency and single-currency interest rate swaps are mainly used to convert a foreign currency
fixed rate exposure to a functional currency floating rate exposure. In hedges of both foreign currency and interest rate exposure, the interest rate risk is generally hedged
only to the extent of the benchmark interest rate.
In cash flow hedges, cross-currency interest rate swaps, single-currency interest rate swaps, foreign currency forwards and foreign currency assets or liabilities are used to
manage foreign currency exposure, or a combined foreign currency and interest rate exposure. Cross-currency interest rate swaps are used to offset the foreign currency
exposure by exchanging the interest cash flows in one currency for interest cash flows in another currency. Single-currency interest rate swaps may be used in conjunction
with cross-currency interest rate swaps to convert the foreign currency exposure or resulting functional currency exposure from floating to fixed. Foreign currency forwards
and foreign currency denominated assets and liabilities are used to offset the exposure arising from highly probable future cash flows, including purchase considerations for
business acquisitions and sale proceeds for business divestitures that are denominated in a foreign currency. In hedges of both foreign currency and interest rate exposure,
the interest rate risk is generally hedged only to the extent of the benchmark interest rate.
In net investment hedges, the Bank designates foreign currency liabilities and foreign currency forwards as hedging instruments to manage foreign currency exposure. The
designated non-derivative liabilities are denominated in the functional currency of the net investment, such that the foreign exchange translation impact from the net
investment will be offset by the foreign exchange impact from the designated liabilities. The foreign currency forward contracts are structured to sell the functional currency of
the net investment in return for the Bank’s functional currency.
2019 Scotiabank Annual Report | 179
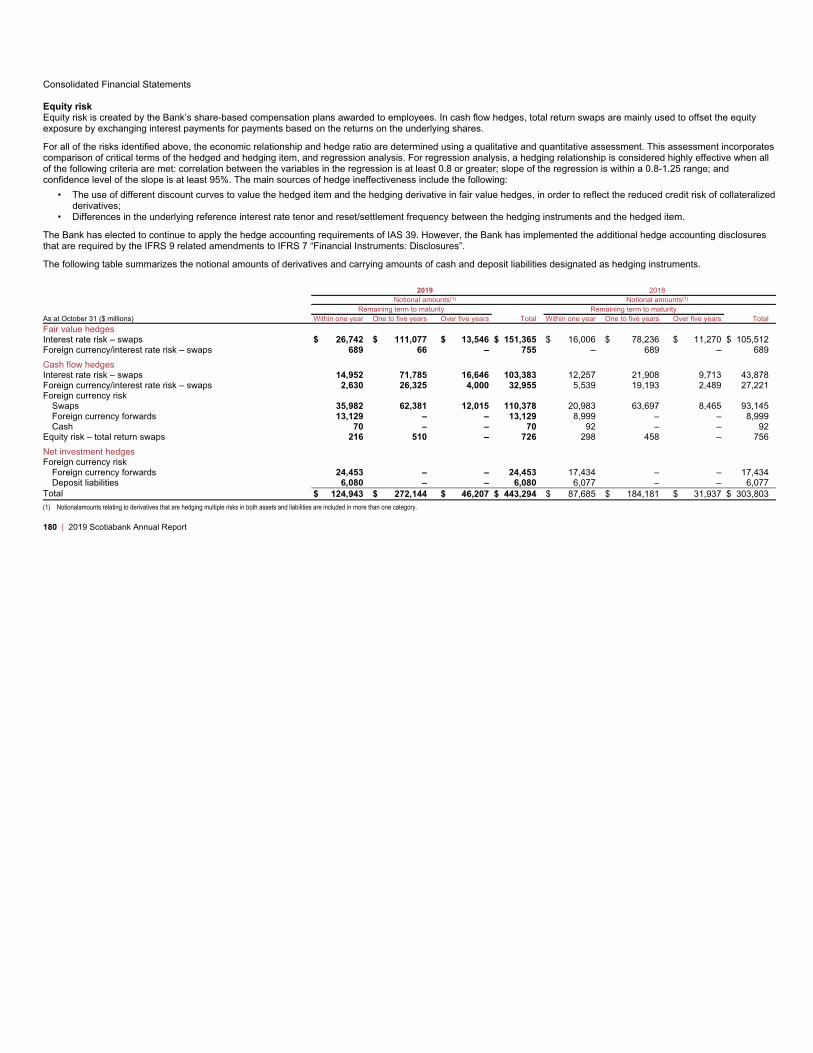
Consolidated Financial Statements
Equity risk
Equity risk is created by the Bank’s share-based compensation plans awarded to employees. In cash flow hedges, total return swaps are mainly used to offset the equity
exposure by exchanging interest payments for payments based on the returns on the underlying shares.
For all of the risks identified above, the economic relationship and hedge ratio are determined using a qualitative and quantitative assessment. This assessment incorporates
comparison of critical terms of the hedged and hedging item, and regression analysis. For regression analysis, a hedging relationship is considered highly effective when all
of the following criteria are met: correlation between the variables in the regression is at least 0.8 or greater; slope of the regression is within a 0.8-1.25 range; and
confidence level of the slope is at least 95%. The main sources of hedge ineffectiveness include the following:
• The use of different discount curves to value the hedged item and the hedging derivative in fair value hedges, in order to reflect the reduced credit risk of collateralized
derivatives;
• Differences in the underlying reference interest rate tenor and reset/settlement frequency between the hedging instruments and the hedged item.
The Bank has elected to continue to apply the hedge accounting requirements of IAS 39. However, the Bank has implemented the additional hedge accounting disclosures
that are required by the IFRS 9 related amendments to IFRS 7 “Financial Instruments: Disclosures”.
The following table summarizes the notional amounts of derivatives and carrying amounts of cash and deposit liabilities designated as hedging instruments.
2019 2018
Notional amounts(1) Notional amounts(1)
Remaining term to maturity Remaining term to maturity
As at October 31 ($ millions) Within one year One to five years Over five years Total Within one year One to five years Over five years Total
Fair value hedges
Interest rate risk – swaps $ 26,742 $ 111,077 $ 13,546 $ 151,365 $ 16,006 $ 78,236 $ 11,270 $ 105,512
Foreign currency/interest rate risk – swaps 689 66 – 755 – 689 – 689
Cash flow hedges
Interest rate risk – swaps 14,952 71,785 16,646 103,383 12,257 21,908 9,713 43,878
Foreign currency/interest rate risk – swaps 2,630 26,325 4,000 32,955 5,539 19,193 2,489 27,221
Foreign currency risk
Swaps 35,982 62,381 12,015 110,378 20,983 63,697 8,465 93,145
Foreign currency forwards 13,129 – – 13,129 8,999 – – 8,999
Cash 70 – – 70 92 – – 92
Equity risk – total return swaps 216 510 – 726 298 458 – 756
Net investment hedges
Foreign currency risk
Foreign currency forwards 24,453 – – 24,453 17,434 – – 17,434
Deposit liabilities 6,080 – – 6,080 6,077 – – 6,077
Total $ 124,943 $ 272,144 $ 46,207 $ 443,294 $ 87,685 $ 184,181 $ 31,937 $ 303,803
(1) Notionalamounts relating to derivatives that are hedging multiple risks in both assets and liabilities are included in more than one category.
180 | 2019 Scotiabank Annual Report

Consolidated Financial Statements
The following table shows the average rate or price of significant hedging instruments.
2019 2018
Average rate or price(1) Average rate or price(1)
As at October 31 Fixed interest rate FX rate Price Fixed interest rate FX rate Price
Fair value hedges
Interest rate risk – swaps 2.11% n/a n/a 2.04% n/a n/a
Foreign currency/interest rate risk – swaps
CAD-USD 2.22% 1.29 n/a 2.22% 1.29 n/a
CAD-EUR 3.02% 1.33 n/a 3.02% 1.33 n/a
Cash flow hedges
Interest rate risk – swaps 2.22% n/a n/a 2.37% n/a n/a
Foreign currency/interest rate risk – swaps
CAD-USD 1.85% 1.28 n/a 1.75% 1.27 n/a
Foreign currency risk
Swaps
CAD-USD n/a 1.31 n/a n/a 1.30 n/a
CAD-EUR n/a 1.48 n/a n/a 1.48 n/a
CAD-GBP n/a 1.71 n/a n/a 1.74 n/a
Foreign currency forwards
CAD-USD n/a 1.32 n/a n/a 1.30 n/a
Equity price risk – total return swaps n/a n/a $ 76.35 n/a n/a $ 73.87
Net investment hedges
Foreign currency risk – foreign currency forwards
CAD-USD n/a 1.33 n/a n/a 1.29 n/a
MXN-CAD n/a 15.58 n/a n/a 15.77 n/a
PEN-CAD n/a 2.56 n/a n/a 2.59 n/a
THB-CAD n/a 23.56 n/a n/a 24.57 n/a
(1) The average rate or price is calculated in aggregate for all of the Bank’s hedge relationships, including hedges of assets and liabilities. The majority of the Bank’s hedges have a remaining term to maturity of less than 5 years.
For fair value hedges, the following table contains information related to items designated as hedging instruments, hedged items and ineffectiveness.
Carrying amount of the
hedging instruments(1) Hedge Ineffectiveness(2)
Accumulated amount of fair
value hedge adjustment gains/
(losses) on the hedged
item(4)
For the year ended
October 31, 2019 ($ millions) Assets Liabilities
Gains/(losses) on
hedging instrument
used to calculate
hedge
ineffectiveness
Gains/
(losses) on
hedged item
used to calculate
hedge
ineffectiveness
Ineffectiveness
recorded in
non-interest
income – other
Carrying amount
of the hedged
item(3)
Active
hedges
Discontinued
hedges
Fair value hedges
Interest rate risk – swaps $ 760 $ (1,296) $ 582 $ (562) $ 20
Investment securities (879) 892 13 $ 25,576 $ 682 $ 112
Loans (491) 491 – 57,711 294 (112)
Deposit liabilities 1,872 (1,865) 7 (54,727) (324) (252)
Subordinated debentures 80 (80) – (5,500) (48) 27
Foreign currency/interest
rate risk – swaps 8 (23) 5 (5) –
Investment securities 2 (2) – 247 4 –
Deposit liabilities 3 (3) – (267) – –
Total $ 768 $ (1,319) $ 587 $ (567) $ 20 $ 23,040 $ 608 $ (225)
(1) Comprises unrealized gains/losses and are recorded within derivative financial instruments in assets and liabilities, respectively in the Consolidated Statement of Financial Position.
(2) Includes ineffectiveness related to hedges discontinued during the year ended October 31, 2019.
(3) This represents the carrying value on the Consolidated Statement of Financial Position and comprises amortized cost before allowance for credit losses, plus fair value hedge adjustment, except for investment securities which are carried at fair value.
(4) This represents the accumulated fair value hedge adjustment and is a component of the carrying amount of the hedged item.
2019 Scotiabank Annual Report | 181
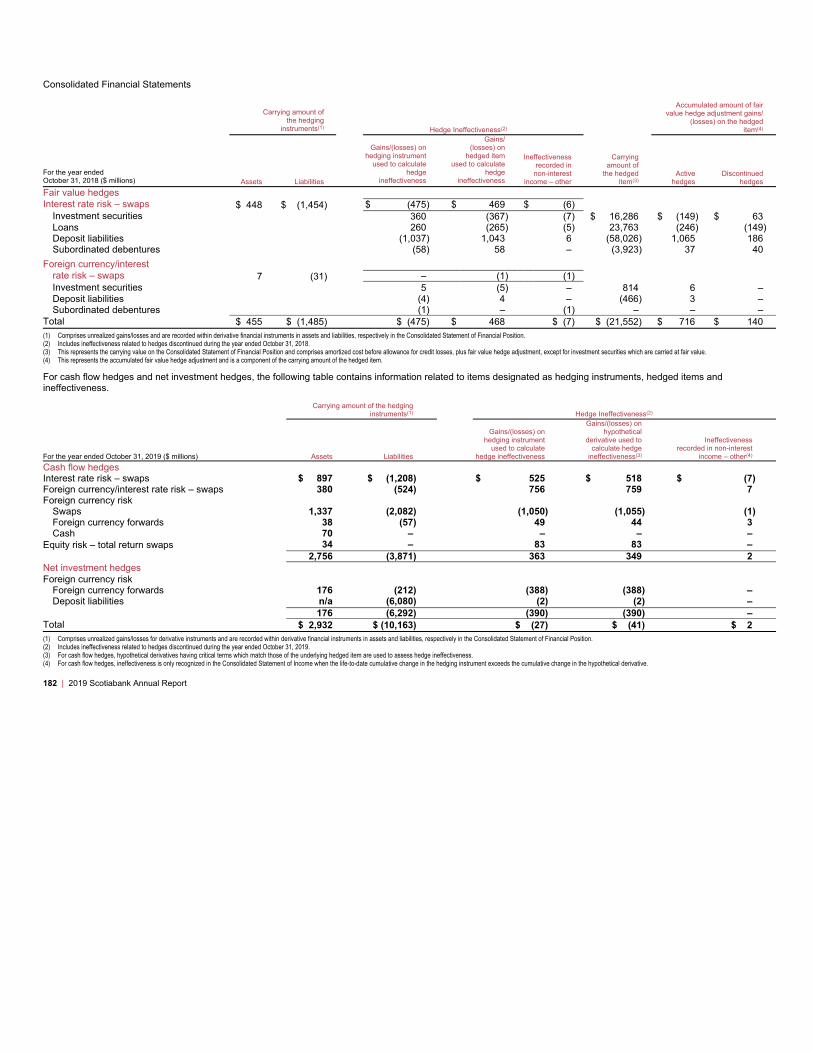
Consolidated Financial Statements
Carrying amount of
the hedging
instruments(1)Hedge Ineffectiveness(2)
Accumulated amount of fair
value hedge adjustment gains/
(losses) on the hedged
item(4)
For the year ended
October 31, 2018 ($ millions) Assets Liabilities
Gains/(losses) on
hedging instrument
used to calculate
hedge
ineffectiveness
Gains/
(losses) on
hedged item
used to calculate
hedge
ineffectiveness
Ineffectiveness
recorded in
non-interest
income – other
Carrying
amount of
the hedged
item(3)
Active
hedges
Discontinued
hedges
Fair value hedges
Interest rate risk – swaps $ 448 $ (1,454) $ (475) $ 469 $ (6)
Investment securities 360 (367) (7) $ 16,286 $ (149) $ 63
Loans 260 (265) (5) 23,763 (246) (149)
Deposit liabilities (1,037) 1,043 6 (58,026) 1,065 186
Subordinated debentures (58) 58 – (3,923) 37 40
Foreign currency/interest
rate risk – swaps 7 (31) – (1) (1)
Investment securities 5 (5) – 814 6 –
Deposit liabilities (4) 4 – (466) 3 –
Subordinated debentures (1) – (1) – – –
Total $ 455 $ (1,485) $ (475) $ 468 $ (7) $ (21,552) $ 716 $ 140
(1) Comprises unrealized gains/losses and are recorded within derivative financial instruments in assets and liabilities, respectively in the Consolidated Statement of Financial Position.
(2) Includes ineffectiveness related to hedges discontinued during the year ended October 31, 2018.
(3) This represents the carrying value on the Consolidated Statement of Financial Position and comprises amortized cost before allowance for credit losses, plus fair value hedge adjustment, except for investment securities which are carried at fair value.
(4) This represents the accumulated fair value hedge adjustment and is a component of the carrying amount of the hedged item.
For cash flow hedges and net investment hedges, the following table contains information related to items designated as hedging instruments, hedged items and
ineffectiveness.
Carrying amount of the hedging
instruments(1) Hedge Ineffectiveness(2)
For the year ended October 31, 2019 ($ millions) Assets Liabilities
Gains/(losses) on
hedging instrument
used to calculate
hedge ineffectiveness
Gains/(losses) on
hypothetical
derivative used to
calculate hedge
ineffectiveness(3)
Ineffectiveness
recorded in non-interest
income – other(4)
Cash flow hedges
Interest rate risk – swaps $ 897 $ (1,208) $ 525 $ 518 $ (7)
Foreign currency/interest rate risk – swaps 380 (524) 756 759 7
Foreign currency risk
Swaps 1,337 (2,082) (1,050) (1,055) (1)
Foreign currency forwards 38 (57) 49 44 3
Cash 70 – – – –
Equity risk – total return swaps 34 – 83 83 –
2,756 (3,871) 363 349 2
Net investment hedges
Foreign currency risk
Foreign currency forwards 176 (212) (388) (388) –
Deposit liabilities n/a (6,080) (2) (2) –
176 (6,292) (390) (390) –
Total $ 2,932 $ (10,163) $ (27) $ (41) $ 2
(1) Comprises unrealized gains/losses for derivative instruments and are recorded within derivative financial instruments in assets and liabilities, respectively in the Consolidated Statement of Financial Position.
(2) Includes ineffectiveness related to hedges discontinued during the year ended October 31, 2019.
(3) For cash flow hedges, hypothetical derivatives having critical terms which match those of the underlying hedged item are used to assess hedge ineffectiveness.
(4) For cash flow hedges, ineffectiveness is only recognized in the Consolidated Statement of Income when the life-to-date cumulative change in the hedging instrument exceeds the cumulative change in the hypothetical derivative.
182 | 2019 Scotiabank Annual Report

Consolidated Financial Statements
Carrying amount of the
hedging instruments(1)Hedge Ineffectiveness(2)
For the year ended October 31, 2018 ($ millions) Assets Liabilities
Gains/(losses) on
hedging instrument
used to calculate
hedge ineffectiveness
Gains/(losses) on
hypothetical
derivative used to
calculate hedge
ineffectiveness(3)
Ineffectiveness
recorded in non-interest
income – other(4)
Cash flow hedges
Interest rate risk – swaps $ 961 $ (1,350) $ (339) $ (341) $ 2
Foreign currency/interest rate risk – swaps 101 (955) (530) (549) (6)
Foreign currency risk
Swaps 1,773 (1,516) (563) (562) (6)
Foreign currency forwards 143 (14) 332 332 –
Cash 92 – 1 1 –
Equity risk – total return swaps – (51) (92) (92) –
3,070 (3,886) (1,191) (1,211) (10)
Net investment hedges
Foreign currency risk
Foreign currency forwards 188 (296) (160) (160) –
Deposit liabilities n/a (6,077) (121) (121) –
188 (6,373) (281) (281) –
Total $ 3,258 $ (10,259) $ (1,472) $ (1,492) $ (10)
(1) Comprises unrealized gains/losses for derivative instruments and are recorded within derivative financial instruments in assets and liabilities, respectively in the Consolidated Statement of Financial Position.
(2) Includes ineffectiveness related to hedges discontinued during the year ended October 31, 2018.
(3) For cash flow hedges, hypothetical derivatives having critical terms which match those of the underlying hedged item are used to assess hedge ineffectiveness.
(4) For cash flow hedges, ineffectiveness is only recognized in the Consolidated Statement of Income when the life-to-date cumulative change in the hedging instrument exceeds the cumulative change in the hypothetical derivative.
For cash flow hedges and net investment hedges, the following table contains information regarding the impacts on the Consolidated Statement of Other Comprehensive
Income on a pre-tax basis.
AOCI as at
November 1,
2018
Net gains/
(losses)
recognized in
OCI
Amount
reclassified
to net
income as
the hedged
item affects
net income(1)
Amount
reclassified to
net income for
hedges of
forecasted
transactions
that are no
longer
expected to
occur(1)
Net gains/
(losses)
included in
non-financial
asset/liability
as a result of a
hedged
forecasted
transaction
AOCI as at
October 31,
2019
Balance in cash flow hedge
reserve/unrealized foreign
currency translation account
as at October 31, 2019
For the year ended
October 31, 2019 ($ millions)
Active
hedges
Discountinued
hedges
Cash flow hedges
Interest rate risk $ (154) $ 532 $ 85 $ – $ – $ 463 $ (148) $ 611
Foreign currency/interest rate risk (450) 749 (91) – – 208 260 (52)
Foreign currency risk 445 (1,003) 672 (4) (11) 99 91 8
Equity risk (7) 83 (55) – – 21 21 –
(166) 361 611 (4) (11) 791 224 567
Net investment hedges
Foreign currency risk (3,251) (390) 158 – – (3,483) (3,408) (75)
Total $ (3,417) $ (29) $ 769 $ (4) $ (11) $ (2,692) $(3,184) $ 492
(1) Amounts reclassified from the cash flow hedge and net investment hedge reserves to net income are recorded in non-interest income-other.
2019 Scotiabank Annual Report | 183
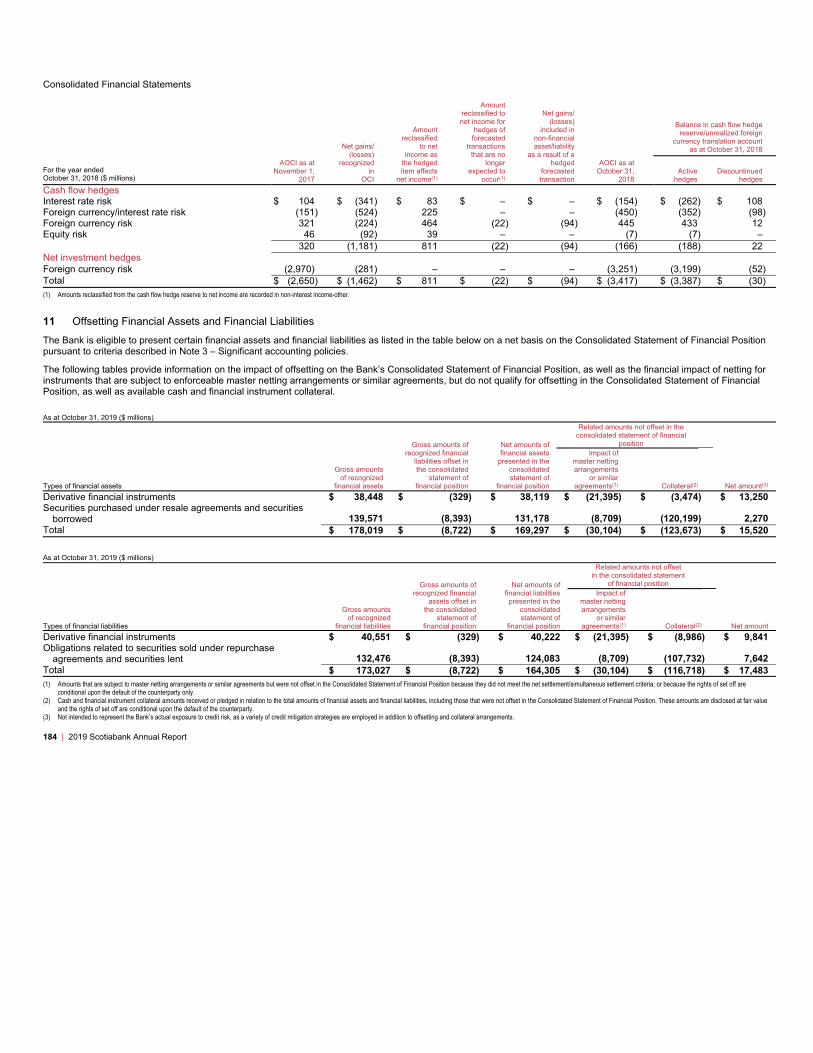
Consolidated Financial Statements
AOCI as at
November 1,
2017
Net gains/
(losses)
recognized
in
OCI
Amount
reclassified
to net
income as
the hedged
item affects
net income(1)
Amount
reclassified to
net income for
hedges of
forecasted
transactions
that are no
longer
expected to
occur(1)
Net gains/
(losses)
included in
non-financial
asset/liability
as a result of a
hedged
forecasted
transaction
AOCI as at
October 31,
2018
Balance in cash flow hedge
reserve/unrealized foreign
currency translation account
as at October 31, 2018
For the year ended
October 31, 2018 ($ millions)
Active
hedges
Discountinued
hedges
Cash flow hedges
Interest rate risk $ 104 $ (341) $ 83 $ – $ – $ (154) $ (262) $ 108
Foreign currency/interest rate risk (151) (524) 225 – – (450) (352) (98)
Foreign currency risk 321 (224) 464 (22) (94) 445 433 12
Equity risk 46 (92) 39 – – (7) (7) –
320 (1,181) 811 (22) (94) (166) (188) 22
Net investment hedges
Foreign currency risk (2,970) (281) – – – (3,251) (3,199) (52)
Total $ (2,650) $ (1,462) $ 811 $ (22) $ (94) $ (3,417) $ (3,387) $ (30)
(1) Amounts reclassified from the cash flow hedge reserve to net income are recorded in non-interest income-other.
11 Offsetting Financial Assets and Financial Liabilities
The Bank is eligible to present certain financial assets and financial liabilities as listed in the table below on a net basis on the Consolidated Statement of Financial Position
pursuant to criteria described in Note 3 – Significant accounting policies.
The following tables provide information on the impact of offsetting on the Bank’s Consolidated Statement of Financial Position, as well as the financial impact of netting for
instruments that are subject to enforceable master netting arrangements or similar agreements, but do not qualify for offsetting in the Consolidated Statement of Financial
Position, as well as available cash and financial instrument collateral.
As at October 31, 2019 ($ millions)
Types of financial assets
Gross amounts
of recognized
financial assets
Gross amounts of
recognized financial
liabilities offset in
the consolidated
statement of
financial position
Net amounts of
financial assets
presented in the
consolidated
statement of
financial position
Related amounts not offset in the
consolidated statement of financial
position
Net amount(3)
Impact of
master netting
arrangements
or similar
agreements(1) Collateral(2)
Derivative financial instruments $ 38,448 $ (329) $ 38,119 $ (21,395) $ (3,474) $ 13,250
Securities purchased under resale agreements and securities
borrowed 139,571 (8,393) 131,178 (8,709) (120,199) 2,270
Total $ 178,019 $ (8,722) $ 169,297 $ (30,104) $ (123,673) $ 15,520
As at October 31, 2019 ($ millions)
Types of financial liabilities
Gross amounts
of recognized
financial liabilities
Gross amounts of
recognized financial
assets offset in
the consolidated
statement of
financial position
Net amounts of
financial liabilities
presented in the
consolidated
statement of
financial position
Related amounts not offset
in the consolidated statement
of financial position
Net amount
Impact of
master netting
arrangements
or similar
agreements(1) Collateral(2)
Derivative financial instruments $ 40,551 $ (329) $ 40,222 $ (21,395) $ (8,986) $ 9,841
Obligations related to securities sold under repurchase
agreements and securities lent 132,476 (8,393) 124,083 (8,709) (107,732) 7,642
Total $ 173,027 $ (8,722) $ 164,305 $ (30,104) $ (116,718) $ 17,483
(1) Amounts that are subject to master netting arrangements or similar agreements but were not offset in the Consolidated Statement of Financial Position because they did not meet the net settlement/simultaneous settlement criteria; or because the rights of set off are
conditional upon the default of the counterparty only.
(2) Cash and financial instrument collateral amounts received or pledged in relation to the total amounts of financial assets and financial liabilities, including those that were not offset in the Consolidated Statement of Financial Position. These amounts are disclosed at fair value
and the rights of set off are conditional upon the default of the counterparty.
(3) Not intended to represent the Bank’s actual exposure to credit risk, as a variety of credit mitigation strategies are employed in addition to offsetting and collateral arrangements.
184 | 2019 Scotiabank Annual Report
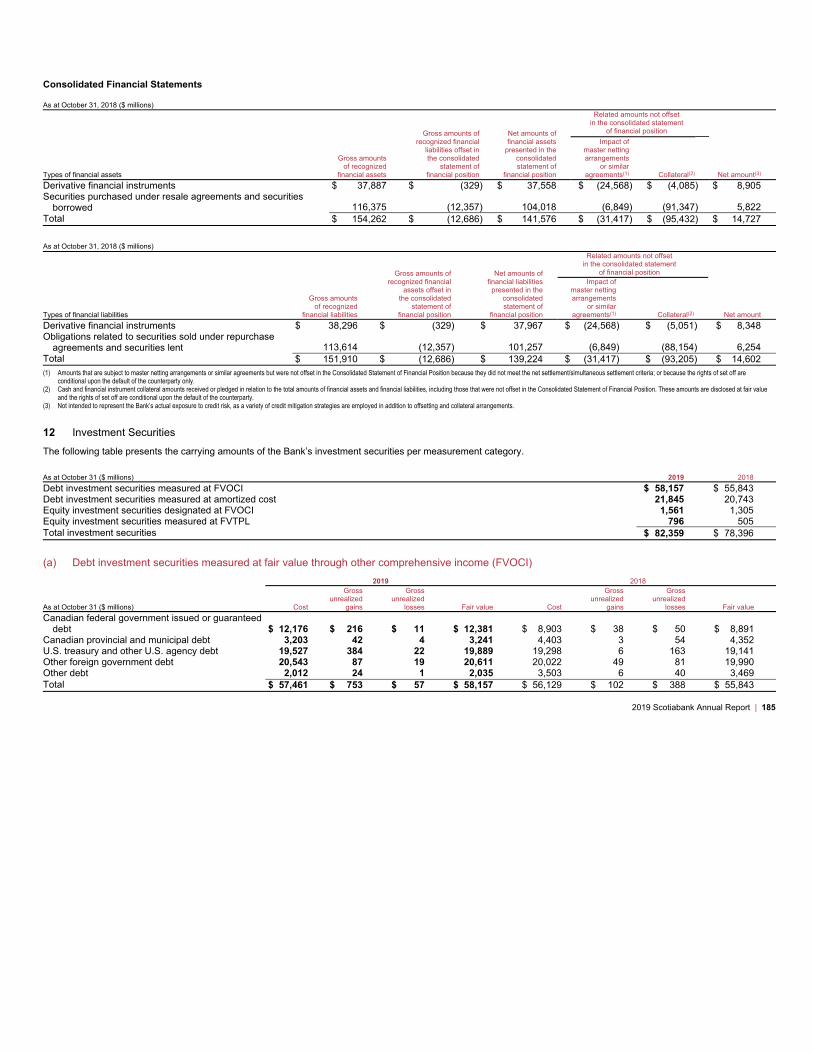
Consolidated Financial Statements
As at October 31, 2018 ($ millions)
Types of financial assets
Gross amounts
of recognized
financial assets
Gross amounts of
recognized financial
liabilities offset in
the consolidated
statement of
financial position
Net amounts of
financial assets
presented in the
consolidated
statement of
financial position
Related amounts not offset
in the consolidated statement
of financial position
Net amount(3)
Impact of
master netting
arrangements
or similar
agreements(1) Collateral(2)
Derivative financial instruments $ 37,887 $ (329) $ 37,558 $ (24,568) $ (4,085) $ 8,905
Securities purchased under resale agreements and securities
borrowed 116,375 (12,357) 104,018 (6,849) (91,347) 5,822
Total $ 154,262 $ (12,686) $ 141,576 $ (31,417) $ (95,432) $ 14,727
As at October 31, 2018 ($ millions)
Types of financial liabilities
Gross amounts
of recognized
financial liabilities
Gross amounts of
recognized financial
assets offset in
the consolidated
statement of
financial position
Net amounts of
financial liabilities
presented in the
consolidated
statement of
financial position
Related amounts not offset
in the consolidated statement
of financial position
Impact of
master netting
arrangements
or similar
agreements(1) Collateral(2) Net amount
Derivative financial instruments $ 38,296 $ (329) $ 37,967 $ (24,568) $ (5,051) $ 8,348
Obligations related to securities sold under repurchase
agreements and securities lent 113,614 (12,357) 101,257 (6,849) (88,154) 6,254
Total $ 151,910 $ (12,686) $ 139,224 $ (31,417) $ (93,205) $ 14,602
(1) Amounts that are subject to master netting arrangements or similar agreements but were not offset in the Consolidated Statement of Financial Position because they did not meet the net settlement/simultaneous settlement criteria; or because the rights of set off are
conditional upon the default of the counterparty only.
(2) Cash and financial instrument collateral amounts received or pledged in relation to the total amounts of financial assets and financial liabilities, including those that were not offset in the Consolidated Statement of Financial Position. These amounts are disclosed at fair value
and the rights of set off are conditional upon the default of the counterparty.
(3) Not intended to represent the Bank’s actual exposure to credit risk, as a variety of credit mitigation strategies are employed in addition to offsetting and collateral arrangements.
12 Investment Securities
The following table presents the carrying amounts of the Bank’s investment securities per measurement category.
As at October 31 ($ millions) 2019 2018
Debt investment securities measured at FVOCI $ 58,157 $ 55,843
Debt investment securities measured at amortized cost 21,845 20,743
Equity investment securities designated at FVOCI 1,561 1,305
Equity investment securities measured at FVTPL 796 505
Total investment securities $ 82,359 $ 78,396
(a) Debt investment securities measured at fair value through other comprehensive income (FVOCI)
2019 2018
As at October 31 ($ millions) Cost
Gross
unrealized
gains
Gross
unrealized
losses Fair value Cost
Gross
unrealized
gains
Gross
unrealized
losses Fair value
Canadian federal government issued or guaranteed
debt $ 12,176 $ 216 $ 11 $ 12,381 $ 8,903 $ 38 $ 50 $ 8,891
Canadian provincial and municipal debt 3,203 42 4 3,241 4,403 3 54 4,352
U.S. treasury and other U.S. agency debt 19,527 384 22 19,889 19,298 6 163 19,141
Other foreign government debt 20,543 87 19 20,611 20,022 49 81 19,990
Other debt 2,012 24 1 2,035 3,503 6 40 3,469
Total $ 57,461 $ 753 $ 57 $ 58,157 $ 56,129 $ 102 $ 388 $ 55,843
2019 Scotiabank Annual Report | 185

Consolidated Financial Statements
(b) Debt investment securities measured at amortized cost
2019 2018
As at October 31 ($ millions) Fair Value
Carrying
value(1) Fair Value
Carrying
value(1)
Canadian federal and provincial government issued or guaranteed debt $ 7,575 $ 7,580 $ 6,530 $ 6,681
U.S. treasury and other U.S. agency debt 9,419 9,279 4,321 4,462
Other foreign government debt 1,979 1,970 3,086 3,131
Corporate debt 3,027 3,016 6,379 6,469
Total $ 22,000 $ 21,845 $ 20,316 $ 20,743
(1) Balances are net of impairment allowances of $0 (2018 – $1).
(c) Equity investment securities designated at fair value through other comprehensive income (FVOCI)
The Bank has designated certain equity securities at FVOCI shown in the following table as these investments are held for strategic purposes.
As at October 31, 2019 ($ millions) Cost
Gross
unrealized
gains
Gross
unrealized
losses Fair value
Preferred equity instruments $ 146 $ – $ 53 $ 93
Common shares 1,262 223 17 1,468
Total $ 1,408 $ 223 $ 70 $ 1,561
As at October 31, 2018 ($ millions) Cost
Gross
unrealized
gains
Gross
unrealized
losses Fair value
Preferred equity instruments $ 334 $ – $ 54 $ 280
Common shares 937 126 38 1,025
Total $ 1,271 $ 126 $ 92 $ 1,305
Dividend income on equity securities designated at FVOCI of $56 million for the year ended October 31, 2019 (2018 – $42 million) has been recognized in interest income.
During the year ended October 31, 2019, the Bank has disposed of certain equity securities designated at FVOCI with a fair value of $314 million (2018 – $290 million).
These dispositions has resulted in a cumulative loss of $(36) million (2018 – $(41) million) that remains in OCI.
186 | 2019 Scotiabank Annual Report
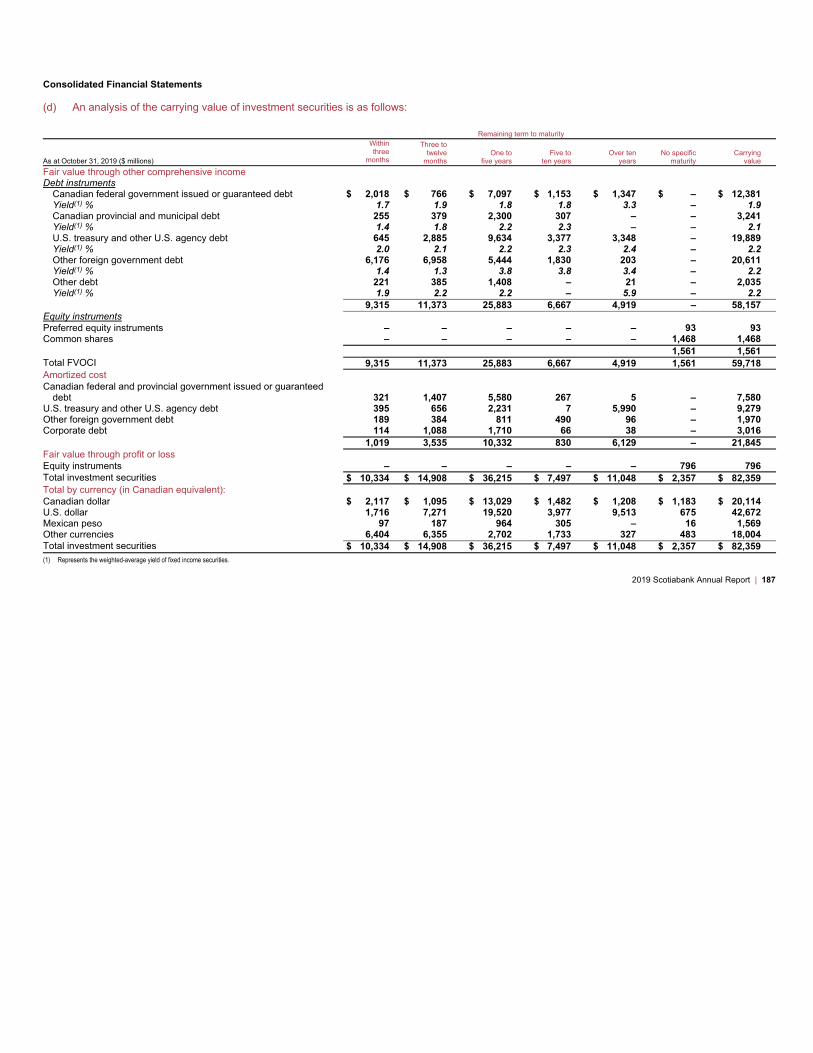
Consolidated Financial Statements
(d) An analysis of the carrying value of investment securities is as follows:
Remaining term to maturity
As at October 31, 2019 ($ millions)
Within
three
months
Three to
twelve
months
One to
five years
Five to
ten years
Over ten
years
No specific
maturity
Carrying
value
Fair value through other comprehensive income
Debt instruments
Canadian federal government issued or guaranteed debt $ 2,018 $ 766 $ 7,097 $ 1,153 $ 1,347 $ – $ 12,381
Yield(1) % 1.7 1.9 1.8 1.8 3.3 – 1.9
Canadian provincial and municipal debt 255 379 2,300 307 – – 3,241
Yield(1) % 1.4 1.8 2.2 2.3 – – 2.1
U.S. treasury and other U.S. agency debt 645 2,885 9,634 3,377 3,348 – 19,889
Yield(1) % 2.0 2.1 2.2 2.3 2.4 – 2.2
Other foreign government debt 6,176 6,958 5,444 1,830 203 – 20,611
Yield(1) % 1.4 1.3 3.8 3.8 3.4 – 2.2
Other debt 221 385 1,408 – 21 – 2,035
Yield(1) % 1.9 2.2 2.2 – 5.9 – 2.2
9,315 11,373 25,883 6,667 4,919 – 58,157
Equity instruments
Preferred equity instruments – – – – – 93 93
Common shares – – – – – 1,468 1,468
1,561 1,561
Total FVOCI 9,315 11,373 25,883 6,667 4,919 1,561 59,718
Amortized cost
Canadian federal and provincial government issued or guaranteed
debt 321 1,407 5,580 267 5 – 7,580
U.S. treasury and other U.S. agency debt 395 656 2,231 7 5,990 – 9,279
Other foreign government debt 189 384 811 490 96 – 1,970
Corporate debt 114 1,088 1,710 66 38 – 3,016
1,019 3,535 10,332 830 6,129 – 21,845
Fair value through profit or loss
Equity instruments – – – – – 796 796
Total investment securities $ 10,334 $ 14,908 $ 36,215 $ 7,497 $ 11,048 $ 2,357 $ 82,359
Total by currency (in Canadian equivalent):
Canadian dollar $ 2,117 $ 1,095 $ 13,029 $ 1,482 $ 1,208 $ 1,183 $ 20,114
U.S. dollar 1,716 7,271 19,520 3,977 9,513 675 42,672
Mexican peso 97 187 964 305 – 16 1,569
Other currencies 6,404 6,355 2,702 1,733 327 483 18,004
Total investment securities $ 10,334 $ 14,908 $ 36,215 $ 7,497 $ 11,048 $ 2,357 $ 82,359
(1) Represents the weighted-average yield of fixed income securities.
2019 Scotiabank Annual Report | 187

Consolidated Financial Statements
Remaining term to maturity
As at October 31, 2018 ($ millions)
Within
three
months
Three to
twelve
months
One to five
years
Five to
ten years
Over ten
years
No specific
maturity
Carrying
value
Fair value through other comprehensive income
Debt instruments
Canadian federal government issued or guaranteed debt $ 1,439 $ 407 $ 5,878 $ 105 $ 1,062 $ – $ 8,891
Yield(1) % 0.6 1.5 2.0 2.6 3.5 – 1.9
Canadian provincial and municipal debt 1,092 1,107 2,084 64 5 – 4,352
Yield(1) % 1.7 1.8 1.8 3.2 2.9 – 1.8
U.S. treasury and other U.S. agency debt 322 3,517 13,485 1,654 163 – 19,141
Yield(1) % 1.8 2.0 2.4 3.1 3.2 – 2.4
Other foreign government debt 6,884 6,379 5,349 1,053 325 – 19,990
Yield(1) % 1.3 1.7 3.7 3.8 4.3 – 2.3
Other debt 718 872 1,553 141 185 – 3,469
Yield(1) % 1.5 1.8 2.0 2.6 2.6 – 1.9
10,455 12,282 28,349 3,017 1,740 – 55,843
Equity instruments
Preferred equity instruments – – – – – 280 280
Common shares – – – – – 1,025 1,025
1,305 1,305
Total FVOCI 10,455 12,282 28,349 3,017 1,740 1,305 57,148
Amortized cost
Canadian federal and provincial government issued or guaranteed
debt 692 868 5,121 – – – 6,681
U.S. treasury and other U.S. agency debt 197 988 3,266 – 11 – 4,462
Other foreign government debt 354 1,193 966 502 116 – 3,131
Corporate debt 637 1,113 4,414 246 59 – 6,469
1,880 4,162 13,767 748 186 – 20,743
Fair value through profit or loss
Equity instruments – – – – – 505 505
Total investment securities $ 12,335 $ 16,444 $ 42,116 $ 3,765 $ 1,926 $ 1,810 $ 78,396
Total by currency (in Canadian equivalent):
Canadian dollar $ 2,918 $ 1,828 $ 11,478 $ 357 $ 1,102 $ 967 $ 18,650
U.S. dollar 1,797 8,384 26,137 2,053 354 366 39,091
Mexican peso 640 541 892 282 — 15 2,370
Other currencies 6,980 5,691 3,609 1,073 470 462 18,285
Total investment securities $ 12,335 $ 16,444 $ 42,116 $ 3,765 $ 1,926 $ 1,810 $ 78,396
(1) Represents the weighted-average yield of fixed income securities.
(e) Net gain on sale of investment securities
The following table presents the net gain on sale of investment securities:
For the year ended October 31 ($ millions) 2019(1) 2018(1) 2017
Net realized gains $ n/a $ n/a $ 399
Debt instruments measured at amortized cost 34 – –
Debt investment securities measured at fair value through other comprehensive income (FVOCI) 317 146 n/a
Total net realized gains on investment securities 351 146 399
Impairment losses – – 19(2)
Net gain on sale of investment securities $ 351 $ 146 $ 380
(1) Theamounts for years ended October 31, 2019 and October 31, 2018 have been prepared in accordance with IFRS 9; prior period amounts have not been restated.
(2) In2017, impairment losses were comprised of $14 from equity securities and $5 from other debt securities.
188 | 2019 Scotiabank Annual Report

Consolidated Financial Statements
13 Loans, Impaired Loans and Allowance for Credit Losses
(a) Loans at amortized cost
2019 2018
As at October 31 ($ millions)
Gross
loans
Allowance
for credit
losses
Net
carrying
amount
Gross
loans
Allowance
for credit
losses
Net
carrying
amount
Residential mortgages $ 268,169 $ 680 $ 267,489 $ 253,357 $ 678 $ 252,679
Personal loans 98,631 2,065 96,566 96,019 2,109 93,910
Credit cards 17,788 1,255 16,533 16,485 1,213 15,272
Business and government 212,972 1,077 211,895 191,038 1,065 189,973
Total $ 597,560 $ 5,077 $ 592,483 $ 556,899 $ 5,065 $ 551,834
(b) Loans and acceptances outstanding by geography(1)
As at October 31 ($ millions) 2019 2018
Canada:
Residential mortgages $ 226,609 $ 213,083
Personal loans 75,478 72,935
Credit cards 7,758 7,361
Business and government 69,933 57,918
379,778 351,297
United States:
Personal loans 715 1,193
Business and government 43,615 40,613
44,330 41,806
Mexico:
Residential mortgages 8,915 7,651
Personal loans 3,741 3,298
Credit cards 815 674
Business and government 18,326 15,399
31,797 27,022
Chile:
Residential mortgages 16,105 15,313
Personal loans 5,833 6,023
Credit cards 2,737 2,592
Business and government 20,955 19,876
45,630 43,804
Peru:
Residential mortgages 2,863 2,947
Personal loans 4,847 3,888
Credit cards 2,192 1,575
Business and government 11,804 11,707
21,706 20,117
Colombia:
Residential mortgages 2,322 2,189
Personal loans 2,800 3,138
Credit cards 2,213 2,255
Business and government 4,338 3,996
11,673 11,578
Other International:
Residential mortgages 11,355 12,174
Personal loans 5,217 5,544
Credit cards 2,073 2,028
Business and government 44,001 41,529
62,646 61,275
Total loans 597,560 556,899
Acceptances(2)13,896 16,329
Total loans and acceptances(3)611,456 573,228
Allowance for credit losses (5,083) (5,073)
Total loans and acceptances net of allowances for loan losses $ 606,373 $ 568,155
(1) Geographic segmentation is based on the location of the property for residential mortgages; otherwise, the residence of the borrower.
(2) 1.3% of borrowers reside outside Canada.
(3) Loans and acceptances denominated in US dollars were $117,099 (2018 – $107,944), in Chilean pesos $35,721 (2018 – $37,515), Mexican pesos $25,060 (2018 – $21,561), and in other foreign currencies $52,741 (2018 – $49,223).
2019 Scotiabank Annual Report | 189
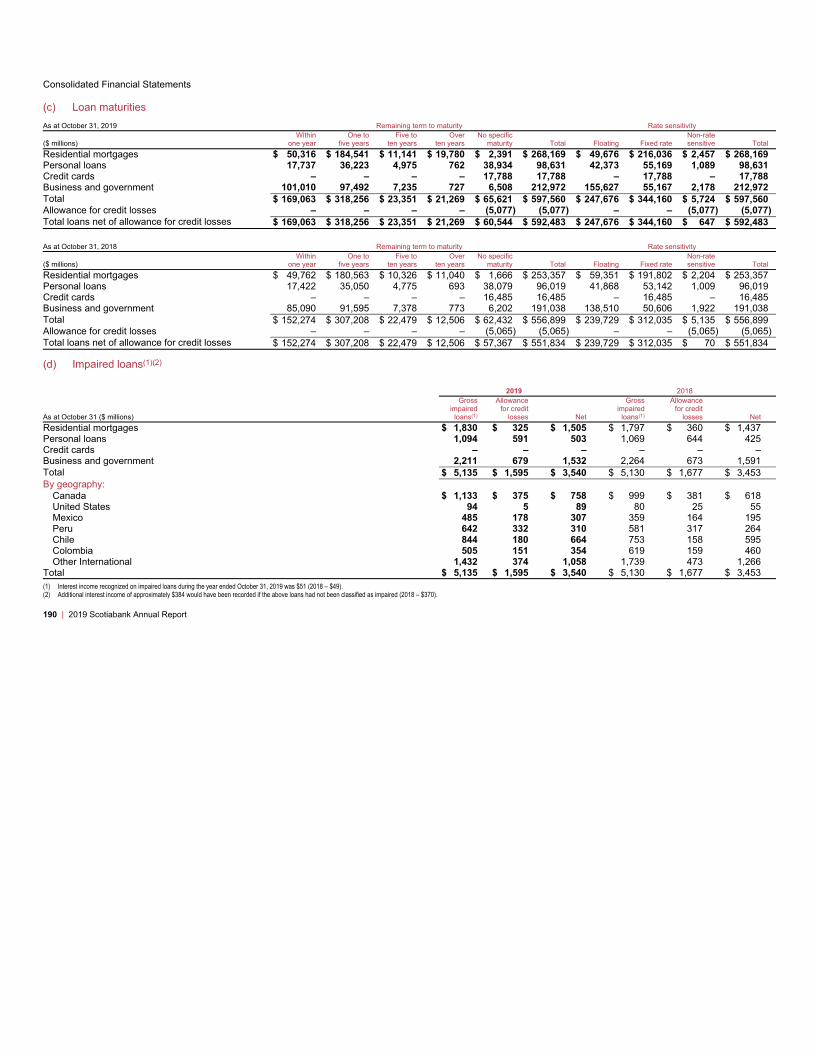
Consolidated Financial Statements
(c) Loan maturities
As at October 31, 2019 Remaining term to maturity Rate sensitivity
($ millions)
Within
one year
One to
five years
Five to
ten years
Over
ten years
No specific
maturity Total Floating Fixed rate
Non-rate
sensitive Total
Residential mortgages $ 50,316 $ 184,541 $ 11,141 $ 19,780 $ 2,391 $ 268,169 $ 49,676 $ 216,036 $ 2,457 $ 268,169
Personal loans 17,737 36,223 4,975 762 38,934 98,631 42,373 55,169 1,089 98,631
Credit cards – – – – 17,788 17,788 – 17,788 – 17,788
Business and government 101,010 97,492 7,235 727 6,508 212,972 155,627 55,167 2,178 212,972
Total $ 169,063 $ 318,256 $ 23,351 $ 21,269 $ 65,621 $ 597,560 $ 247,676 $ 344,160 $ 5,724 $ 597,560
Allowance for credit losses – – – – (5,077) (5,077) – – (5,077) (5,077)
Total loans net of allowance for credit losses $ 169,063 $ 318,256 $ 23,351 $ 21,269 $ 60,544 $ 592,483 $ 247,676 $ 344,160 $ 647 $ 592,483
As at October 31, 2018 Remaining term to maturity Rate sensitivity
($ millions)
Within
one year
One to
five years
Five to
ten years
Over
ten years
No specific
maturity Total Floating Fixed rate
Non-rate
sensitive Total
Residential mortgages $ 49,762 $ 180,563 $ 10,326 $ 11,040 $ 1,666 $ 253,357 $ 59,351 $ 191,802 $ 2,204 $ 253,357
Personal loans 17,422 35,050 4,775 693 38,079 96,019 41,868 53,142 1,009 96,019
Credit cards – – – – 16,485 16,485 – 16,485 – 16,485
Business and government 85,090 91,595 7,378 773 6,202 191,038 138,510 50,606 1,922 191,038
Total $ 152,274 $ 307,208 $ 22,479 $ 12,506 $ 62,432 $ 556,899 $ 239,729 $ 312,035 $ 5,135 $ 556,899
Allowance for credit losses – – – – (5,065) (5,065) – – (5,065) (5,065)
Total loans net of allowance for credit losses $ 152,274 $ 307,208 $ 22,479 $ 12,506 $ 57,367 $ 551,834 $ 239,729 $ 312,035 $ 70 $ 551,834
(d) Impaired loans(1)(2)
2019 2018
As at October 31 ($ millions)
Gross
impaired
loans(1)
Allowance
for credit
losses Net
Gross
impaired
loans(1)
Allowance
for credit
losses Net
Residential mortgages $ 1,830 $ 325 $ 1,505 $ 1,797 $ 360 $ 1,437
Personal loans 1,094 591 503 1,069 644 425
Credit cards – – – – – –
Business and government 2,211 679 1,532 2,264 673 1,591
Total $ 5,135 $ 1,595 $ 3,540 $ 5,130 $ 1,677 $ 3,453
By geography:
Canada $ 1,133 $ 375 $ 758 $ 999 $ 381 $ 618
United States 94 5 89 80 25 55
Mexico 485 178 307 359 164 195
Peru 642 332 310 581 317 264
Chile 844 180 664 753 158 595
Colombia 505 151 354 619 159 460
Other International 1,432 374 1,058 1,739 473 1,266
Total $ 5,135 $ 1,595 $ 3,540 $ 5,130 $ 1,677 $ 3,453
(1) Interest income recognized on impaired loans during the year ended October 31, 2019 was $51 (2018 – $49).
(2) Additional interest income of approximately $384 would have been recorded if the above loans had not been classified as impaired (2018 – $370).
190 | 2019 Scotiabank Annual Report
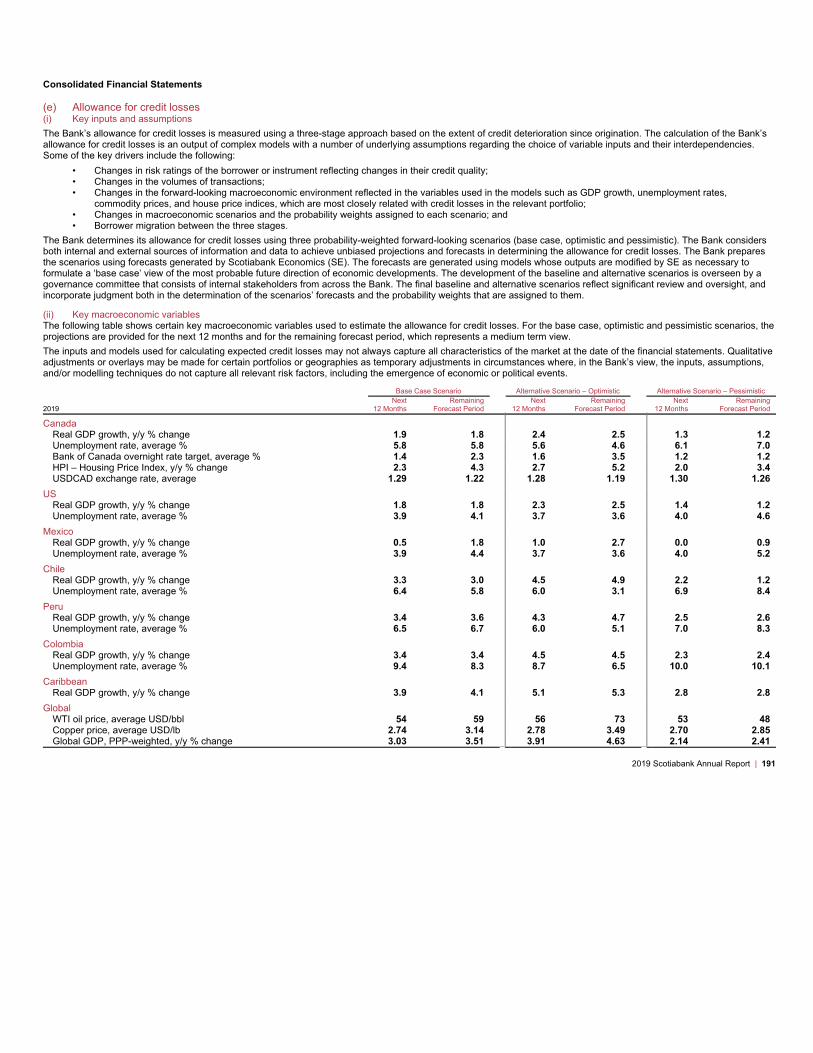
Consolidated Financial Statements
(e) Allowance for credit losses
(i) Key inputs and assumptions
The Bank’s allowance for credit losses is measured using a three-stage approach based on the extent of credit deterioration since origination. The calculation of the Bank’s
allowance for credit losses is an output of complex models with a number of underlying assumptions regarding the choice of variable inputs and their interdependencies.
Some of the key drivers include the following:
• Changes in risk ratings of the borrower or instrument reflecting changes in their credit quality;
• Changes in the volumes of transactions;
• Changes in the forward-looking macroeconomic environment reflected in the variables used in the models such as GDP growth, unemployment rates,
commodity prices, and house price indices, which are most closely related with credit losses in the relevant portfolio;
• Changes in macroeconomic scenarios and the probability weights assigned to each scenario; and
• Borrower migration between the three stages.
The Bank determines its allowance for credit losses using three probability-weighted forward-looking scenarios (base case, optimistic and pessimistic). The Bank considers
both internal and external sources of information and data to achieve unbiased projections and forecasts in determining the allowance for credit losses. The Bank prepares
the scenarios using forecasts generated by Scotiabank Economics (SE). The forecasts are generated using models whose outputs are modified by SE as necessary to
formulate a ‘base case’ view of the most probable future direction of economic developments. The development of the baseline and alternative scenarios is overseen by a
governance committee that consists of internal stakeholders from across the Bank. The final baseline and alternative scenarios reflect significant review and oversight, and
incorporate judgment both in the determination of the scenarios’ forecasts and the probability weights that are assigned to them.
(ii) Key macroeconomic variables
The following table shows certain key macroeconomic variables used to estimate the allowance for credit losses. For the base case, optimistic and pessimistic scenarios, the
projections are provided for the next 12 months and for the remaining forecast period, which represents a medium term view.
The inputs and models used for calculating expected credit losses may not always capture all characteristics of the market at the date of the financial statements. Qualitative
adjustments or overlays may be made for certain portfolios or geographies as temporary adjustments in circumstances where, in the Bank’s view, the inputs, assumptions,
and/or modelling techniques do not capture all relevant risk factors, including the emergence of economic or political events.
Base Case Scenario Alternative Scenario – Optimistic Alternative Scenario – Pessimistic
2019
Next
12 Months
Remaining
Forecast Period
Next
12 Months
Remaining
Forecast Period
Next
12 Months
Remaining
Forecast Period
Canada
Real GDP growth, y/y % change 1.9 1.8 2.4 2.5 1.3 1.2
Unemployment rate, average % 5.8 5.8 5.6 4.6 6.1 7.0
Bank of Canada overnight rate target, average % 1.4 2.3 1.6 3.5 1.2 1.2
HPI – Housing Price Index, y/y % change 2.3 4.3 2.7 5.2 2.0 3.4
USDCAD exchange rate, average 1.29 1.22 1.28 1.19 1.30 1.26
US
Real GDP growth, y/y % change 1.8 1.8 2.3 2.5 1.4 1.2
Unemployment rate, average % 3.9 4.1 3.7 3.6 4.0 4.6
Mexico
Real GDP growth, y/y % change 0.5 1.8 1.0 2.7 0.0 0.9
Unemployment rate, average % 3.9 4.4 3.7 3.6 4.0 5.2
Chile
Real GDP growth, y/y % change 3.3 3.0 4.5 4.9 2.2 1.2
Unemployment rate, average % 6.4 5.8 6.0 3.1 6.9 8.4
Peru
Real GDP growth, y/y % change 3.4 3.6 4.3 4.7 2.5 2.6
Unemployment rate, average % 6.5 6.7 6.0 5.1 7.0 8.3
Colombia
Real GDP growth, y/y % change 3.4 3.4 4.5 4.5 2.3 2.4
Unemployment rate, average % 9.4 8.3 8.7 6.5 10.0 10.1
Caribbean
Real GDP growth, y/y % change 3.9 4.1 5.1 5.3 2.8 2.8
Global
WTI oil price, average USD/bbl 54 59 56 73 53 48
Copper price, average USD/lb 2.74 3.14 2.78 3.49 2.70 2.85
Global GDP, PPP-weighted, y/y % change 3.03 3.51 3.91 4.63 2.14 2.41
2019 Scotiabank Annual Report | 191
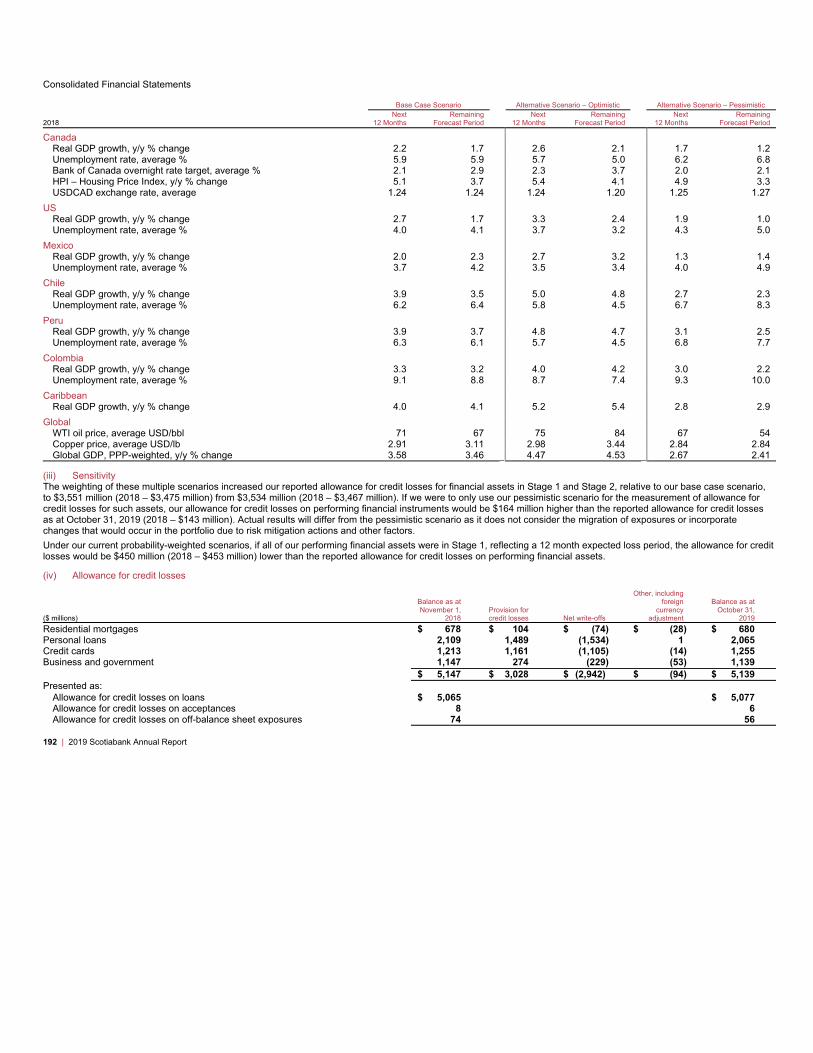
Consolidated Financial Statements
Base Case Scenario Alternative Scenario – Optimistic Alternative Scenario – Pessimistic
2018
Next
12 Months
Remaining
Forecast Period
Next
12 Months
Remaining
Forecast Period
Next
12 Months
Remaining
Forecast Period
Canada
Real GDP growth, y/y % change 2.2 1.7 2.6 2.1 1.7 1.2
Unemployment rate, average % 5.9 5.9 5.7 5.0 6.2 6.8
Bank of Canada overnight rate target, average % 2.1 2.9 2.3 3.7 2.0 2.1
HPI – Housing Price Index, y/y % change 5.1 3.7 5.4 4.1 4.9 3.3
USDCAD exchange rate, average 1.24 1.24 1.24 1.20 1.25 1.27
US
Real GDP growth, y/y % change 2.7 1.7 3.3 2.4 1.9 1.0
Unemployment rate, average % 4.0 4.1 3.7 3.2 4.3 5.0
Mexico
Real GDP growth, y/y % change 2.0 2.3 2.7 3.2 1.3 1.4
Unemployment rate, average % 3.7 4.2 3.5 3.4 4.0 4.9
Chile
Real GDP growth, y/y % change 3.9 3.5 5.0 4.8 2.7 2.3
Unemployment rate, average % 6.2 6.4 5.8 4.5 6.7 8.3
Peru
Real GDP growth, y/y % change 3.9 3.7 4.8 4.7 3.1 2.5
Unemployment rate, average % 6.3 6.1 5.7 4.5 6.8 7.7
Colombia
Real GDP growth, y/y % change 3.3 3.2 4.0 4.2 3.0 2.2
Unemployment rate, average % 9.1 8.8 8.7 7.4 9.3 10.0
Caribbean
Real GDP growth, y/y % change 4.0 4.1 5.2 5.4 2.8 2.9
Global
WTI oil price, average USD/bbl 71 67 75 84 67 54
Copper price, average USD/lb 2.91 3.11 2.98 3.44 2.84 2.84
Global GDP, PPP-weighted, y/y % change 3.58 3.46 4.47 4.53 2.67 2.41
(iii) Sensitivity
The weighting of these multiple scenarios increased our reported allowance for credit losses for financial assets in Stage 1 and Stage 2, relative to our base case scenario,
to $3,551 million (2018 – $3,475 million) from $3,534 million (2018 – $3,467 million). If we were to only use our pessimistic scenario for the measurement of allowance for
credit losses for such assets, our allowance for credit losses on performing financial instruments would be $164 million higher than the reported allowance for credit losses
as at October 31, 2019 (2018 – $143 million). Actual results will differ from the pessimistic scenario as it does not consider the migration of exposures or incorporate
changes that would occur in the portfolio due to risk mitigation actions and other factors.
Under our current probability-weighted scenarios, if all of our performing financial assets were in Stage 1, reflecting a 12 month expected loss period, the allowance for credit
losses would be $450 million (2018 – $453 million) lower than the reported allowance for credit losses on performing financial assets.
(iv) Allowance for credit losses
($ millions)
Balance as at
November 1,
2018
Provision for
credit losses Net write-offs
Other, including
foreign
currency
adjustment
Balance as at
October 31,
2019
Residential mortgages $ 678 $ 104 $ (74) $ (28) $ 680
Personal loans 2,109 1,489 (1,534) 1 2,065
Credit cards 1,213 1,161 (1,105) (14) 1,255
Business and government 1,147 274 (229) (53) 1,139
$ 5,147 $ 3,028 $ (2,942) $ (94) $ 5,139
Presented as:
Allowance for credit losses on loans $ 5,065 $ 5,077
Allowance for credit losses on acceptances 8 6
Allowance for credit losses on off-balance sheet exposures 74 56
192 | 2019 Scotiabank Annual Report

Consolidated Financial Statements
($ millions)
Balance as at
November 1,
2017
Provision for
credit losses Net write-offs
Other, including
foreign
currency
adjustment
Balance as at
October 31,
2018
Residential mortgages $ 717 $ 104 $ (123) $ (20) $ 678
Personal loans 1,879 1,411 (1,166) (15) 2,109
Credit cards 1,163 898 (854) 6 1,213
Business and government 1,261 166 (208) (72) 1,147
$ 5,020 $ 2,579 $ (2,351) $ (101) $ 5,147
Presented as:
Allowance for credit losses on loans $ 4,920 $ 5,065
Allowance for credit losses on acceptances 16 8
Allowance for credit losses on off-balance sheet exposures 84 74
Allowancefor credit losses on loans
As at October 31, 2019 ($ millions) Stage 1 Stage 2 Stage 3 Total
Residential mortgages $ 126 $ 229 $ 325 $ 680
Personal loans 609 865 591 2,065
Credit cards 424 831 – 1,255
Business and government 153 245 679 1,077
Total(1)$ 1,312 $ 2,170 $ 1,595 $ 5,077
(1) Excludes allowance for credit losses for other financial assets including acceptances, investment securities, deposits with banks and off-balance sheet credit risks which amounted to $68.
As at October 31, 2018 ($ millions) Stage 1 Stage 2 Stage 3 Total
Residential mortgages $ 112 $ 206 $ 360 $ 678
Personal loans 578 887 644 2,109
Credit cards 401 812 – 1,213
Business and government 132 260 673 1,065
Total(1)$ 1,223 $ 2,165 $ 1,677 $ 5,065
(1) Excludes allowance for credit losses for other financial assets including acceptances, investment securities, deposits with banks and off-balance sheet credit risks which amounted to $89.
2019 Scotiabank Annual Report | 193

Consolidated Financial Statements
The following table presents the changes to the allowance for credit losses on loans.
As at October 31, 2019 As at October 31, 2018
($ millions) Stage 1 Stage 2 Stage 3 Total Stage 1 Stage 2 Stage 3 Total
Residential mortgages
Balance at beginning of the year $ 112 $ 206 $ 360 $ 678 $ 103 $ 214 $ 400 $ 717
Provision for credit losses
Remeasurement(1) (88) 27 117 56 (131) 5 151 25
Newly originated or purchased financial assets 58 – – 58 88 – – 88
Derecognition of financial assets and maturities (1) (9) – (10) (2) (7) – (9)
Changes in models and methodologies – – – – – – – –
Transfer to (from):
Stage 1 61 (52) (9) – 77 (65) (12) –
Stage 2 (15) 108 (93) – (18) 106 (88) –
Stage 3 – (44) 44 – – (39) 39 –
Gross write-offs – – (100) (100) – – (219) (219)
Recoveries – – 26 26 – – 96 96
Foreign exchange and other movements(6) (1) (7) (20) (28) (5) (8) (7) (20)
Balance at end of year(2)$ 126 $ 229 $ 325 $ 680 $ 112 $ 206 $ 360 $ 678
Personal loans
Balance at beginning of the year $ 578 $ 887 $ 644 $ 2,109 $ 477 $ 802 $ 600 $ 1,879
Provision for credit losses
Remeasurement(1) (597) 561 1,246 1,210 (670) 629 1,015 974
Newly originated or purchased financial assets 460 – – 460 615 – – 615
Derecognition of financial assets and maturities (81) (100) – (181) (82) (96) – (178)
Changes in models and methodologies – – – – – – – –
Transfer to (from):
Stage 1 458 (450) (8) – 453 (442) (11) –
Stage 2 (198) 281 (83) – (189) 284 (95) –
Stage 3 (4) (321) 325 – (4) (286) 290 –
Gross write-offs – – (1,818) (1,818) – – (1,441) (1,441)
Recoveries – – 284 284 – – 275 275
Foreign exchange and other movements(6) (7) 7 1 1 (22) (4) 11 (15)
Balance at end of year(2)$ 609 $ 865 $ 591 $ 2,065 $ 578 $ 887 $ 644 $ 2,109
Credit cards
Balance at beginning of the year $ 401 $ 812 $ – $ 1,213 $ 364 $ 799 $ – $ 1,163
Provision for credit losses
Remeasurement(1) (356) 543 785 972 (276) 448 593 765
Newly originated or purchased financial assets 312 – – 312 329 – – 329
Derecognition of financial assets and maturities (59) (64) – (123) (91) (105) – (196)
Changes in models and methodologies – – – – – – – –
Transfer to (from):
Stage 1 263 (263) – – 259 (259) – –
Stage 2 (131) 131 – – (162) 162 – –
Stage 3 – (293) 293 – (1) (239) 240 –
Gross write-offs – – (1,324) (1,324) – – (1,104) (1,104)
Recoveries – – 219 219 – – 250 250
Foreign exchange and other movements(6) (6) (35) 27 (14) (21) 6 21 6
Balance at end of year(2)$ 424 $ 831 $ – $ 1,255 $ 401 $ 812 $ – $ 1,213
Business and government
Balance at beginning of the year $ 173 $ 291 $ 675 $ 1,139 $ 178 $ 307 $ 760 $ 1,245
Provision for credit losses
Remeasurement(1) (47) 50 305 308 (93) 6 264 177
Newly originated or purchased financial assets 178 – – 178 322 – – 322
Derecognition of financial assets and maturities (141) (27) (27) (195) (108) (164) (68) (340)
Changes in models and methodologies (9) (5) – (14) 3 14 – 17
Transfer to (from):
Stage 1 55 (55) – – 63 (58) (5) –
Stage 2 (15) 18 (3) – (187) 218 (31) –
Stage 3 – (7) 7 – (2) (30) 32 –
Gross write-offs – – (274) (274) – – (276) (276)
Recoveries – – 45 45 – – 68 68
Foreign exchange and other movements (3) (2) (49) (54) (3) (2) (69) (74)
Balance at end of period including off-balance sheet exposures(2)$ 191 $ 263 $ 679 $ 1,133 $ 173 $ 291 $ 675 $ 1,139
Less: Allowance for credits losses on off-balance sheet exposures(2)(3) 38 18 – 56 41 31 2 74
Balance at end of year(2)$ 153 $ 245 $ 679 $ 1,077 $ 132 $ 260 $ 673 $ 1,065
(1) Includes credit risk changes as a result of significant increases in credit risk, changes in credit risk that did not result in a transfer between stages, changes in model inputs and assumptions and changes due to drawdowns of undrawn commitments.
194 | 2019 Scotiabank Annual Report
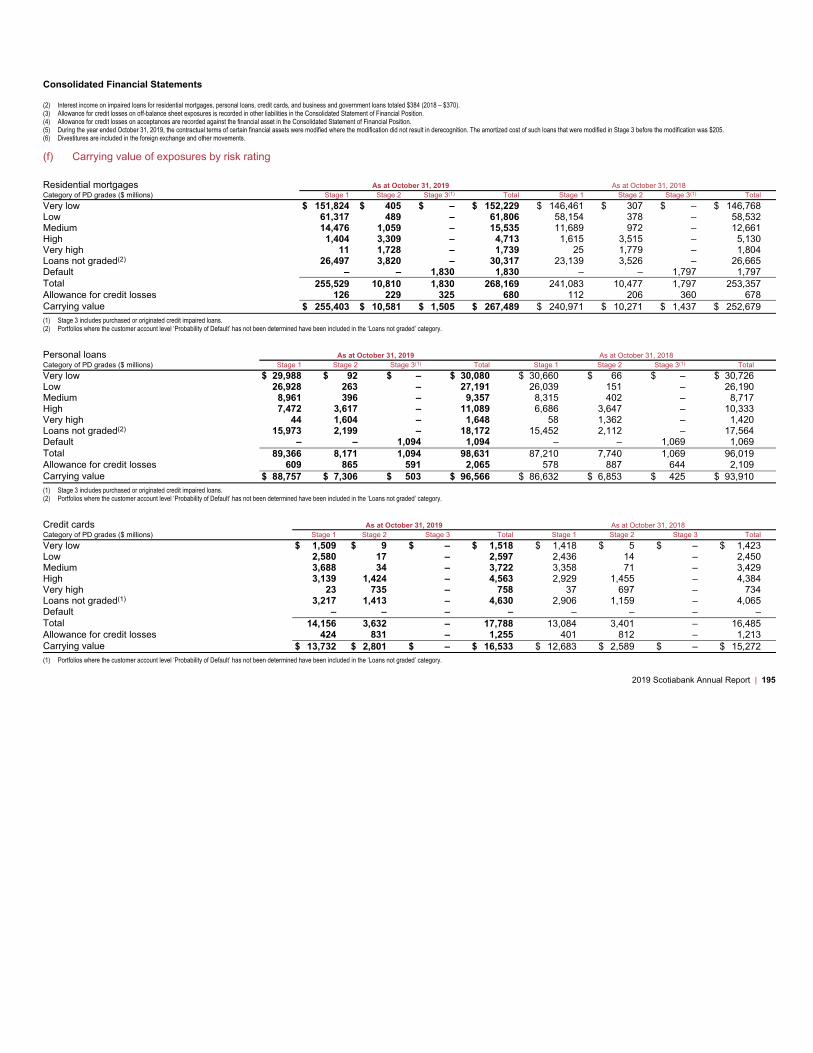
Consolidated Financial Statements
(2) Interest income on impaired loans for residential mortgages, personal loans, credit cards, and business and government loans totaled $384 (2018 – $370).
(3) Allowance for credit losses on off-balance sheet exposures is recorded in other liabilities in the Consolidated Statement of Financial Position.
(4) Allowance for credit losses on acceptances are recorded against the financial asset in the Consolidated Statement of Financial Position.
(5) During the year ended October 31, 2019, the contractual terms of certain financial assets were modified where the modification did not result in derecognition. The amortized cost of such loans that were modified in Stage 3 before the modification was $205.
(6) Divestitures are included in the foreign exchange and other movements.
(f) Carrying value of exposures by risk rating
Residential mortgages As at October 31, 2019 As at October 31, 2018
Category of PD grades ($ millions) Stage 1 Stage 2 Stage 3(1) Total Stage 1 Stage 2 Stage 3(1) Total
Very low $ 151,824 $ 405 $ – $ 152,229 $ 146,461 $ 307 $ – $ 146,768
Low 61,317 489 – 61,806 58,154 378 – 58,532
Medium 14,476 1,059 – 15,535 11,689 972 – 12,661
High 1,404 3,309 – 4,713 1,615 3,515 – 5,130
Very high 11 1,728 – 1,739 25 1,779 – 1,804
Loans not graded(2) 26,497 3,820 – 30,317 23,139 3,526 – 26,665
Default – – 1,830 1,830 – – 1,797 1,797
Total 255,529 10,810 1,830 268,169 241,083 10,477 1,797 253,357
Allowance for credit losses 126 229 325 680 112 206 360 678
Carrying value $ 255,403 $ 10,581 $ 1,505 $ 267,489 $ 240,971 $ 10,271 $ 1,437 $ 252,679
(1) Stage 3 includes purchased or originated credit impaired loans.
(2) Portfolios where the customer account level ‘Probability of Default’ has not been determined have been included in the ‘Loans not graded’ category.
Personal loans As at October 31, 2019 As at October 31, 2018
Category of PD grades ($ millions) Stage 1 Stage 2 Stage 3(1) Total Stage 1 Stage 2 Stage 3(1) Total
Very low $ 29,988 $ 92 $ – $ 30,080 $ 30,660 $ 66 $ – $ 30,726
Low 26,928 263 – 27,191 26,039 151 – 26,190
Medium 8,961 396 – 9,357 8,315 402 – 8,717
High 7,472 3,617 – 11,089 6,686 3,647 – 10,333
Very high 44 1,604 – 1,648 58 1,362 – 1,420
Loans not graded(2) 15,973 2,199 – 18,172 15,452 2,112 – 17,564
Default – – 1,094 1,094 – – 1,069 1,069
Total 89,366 8,171 1,094 98,631 87,210 7,740 1,069 96,019
Allowance for credit losses 609 865 591 2,065 578 887 644 2,109
Carrying value $ 88,757 $ 7,306 $ 503 $ 96,566 $ 86,632 $ 6,853 $ 425 $ 93,910
(1) Stage 3 includes purchased or originated credit impaired loans.
(2) Portfolios where the customer account level ‘Probability of Default’ has not been determined have been included in the ‘Loans not graded’ category.
Credit cards As at October 31, 2019 As at October 31, 2018
Category of PD grades ($ millions) Stage 1 Stage 2 Stage 3 Total Stage 1 Stage 2 Stage 3 Total
Very low $ 1,509 $ 9 $ – $ 1,518 $ 1,418 $ 5 $ – $ 1,423
Low 2,580 17 – 2,597 2,436 14 – 2,450
Medium 3,688 34 – 3,722 3,358 71 – 3,429
High 3,139 1,424 – 4,563 2,929 1,455 – 4,384
Very high 23 735 – 758 37 697 – 734
Loans not graded(1) 3,217 1,413 – 4,630 2,906 1,159 – 4,065
Default – – – – – – – –
Total 14,156 3,632 – 17,788 13,084 3,401 – 16,485
Allowance for credit losses 424 831 – 1,255 401 812 – 1,213
Carrying value $ 13,732 $ 2,801 $ – $ 16,533 $ 12,683 $ 2,589 $ – $ 15,272
(1) Portfolios where the customer account level ‘Probability of Default’ has not been determined have been included in the ‘Loans not graded’ category.
2019 Scotiabank Annual Report | 195
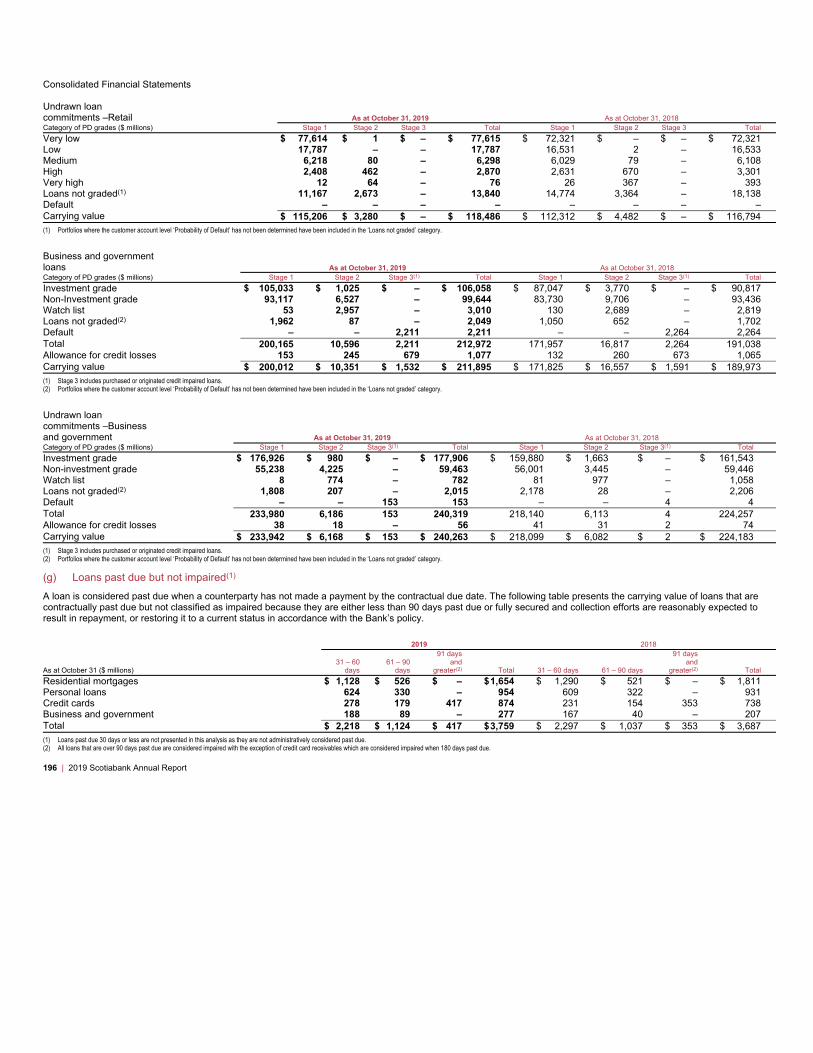
Consolidated Financial Statements
Undrawn loan
commitments –Retail As at October 31, 2019 As at October 31, 2018
Category of PD grades ($ millions) Stage 1 Stage 2 Stage 3 Total Stage 1 Stage 2 Stage 3 Total
Very low $ 77,614 $ 1 $ – $ 77,615 $ 72,321 $ – $ – $ 72,321
Low 17,787 – – 17,787 16,531 2 – 16,533
Medium 6,218 80 – 6,298 6,029 79 – 6,108
High 2,408 462 – 2,870 2,631 670 – 3,301
Very high 12 64 – 76 26 367 – 393
Loans not graded(1) 11,167 2,673 – 13,840 14,774 3,364 – 18,138
Default – – – – – – – –
Carrying value $ 115,206 $ 3,280 $ – $ 118,486 $ 112,312 $ 4,482 $ – $ 116,794
(1) Portfolios where the customer account level ‘Probability of Default’ has not been determined have been included in the ‘Loans not graded’ category.
Business and government
loans As at October 31, 2019 As at October 31, 2018
Category of PD grades ($ millions) Stage 1 Stage 2 Stage 3(1) Total Stage 1 Stage 2 Stage 3(1) Total
Investment grade $ 105,033 $ 1,025 $ – $ 106,058 $ 87,047 $ 3,770 $ – $ 90,817
Non-Investment grade 93,117 6,527 – 99,644 83,730 9,706 – 93,436
Watch list 53 2,957 – 3,010 130 2,689 – 2,819
Loans not graded(2) 1,962 87 – 2,049 1,050 652 – 1,702
Default – – 2,211 2,211 – – 2,264 2,264
Total 200,165 10,596 2,211 212,972 171,957 16,817 2,264 191,038
Allowance for credit losses 153 245 679 1,077 132 260 673 1,065
Carrying value $ 200,012 $ 10,351 $ 1,532 $ 211,895 $ 171,825 $ 16,557 $ 1,591 $ 189,973
(1) Stage 3 includes purchased or originated credit impaired loans.
(2) Portfolios where the customer account level ‘Probability of Default’ has not been determined have been included in the ‘Loans not graded’ category.
Undrawn loan
commitments –Business
and government As at October 31, 2019 As at October 31, 2018
Category of PD grades ($ millions) Stage 1 Stage 2 Stage 3(1) Total Stage 1 Stage 2 Stage 3(1) Total
Investment grade $ 176,926 $ 980 $ – $ 177,906 $ 159,880 $ 1,663 $ – $ 161,543
Non-investment grade 55,238 4,225 – 59,463 56,001 3,445 – 59,446
Watch list 8 774 – 782 81 977 – 1,058
Loans not graded(2) 1,808 207 – 2,015 2,178 28 – 2,206
Default – – 153 153 – – 4 4
Total 233,980 6,186 153 240,319 218,140 6,113 4 224,257
Allowance for credit losses 38 18 – 56 41 31 2 74
Carrying value $ 233,942 $ 6,168 $ 153 $ 240,263 $ 218,099 $ 6,082 $ 2 $ 224,183
(1) Stage 3 includes purchased or originated credit impaired loans.
(2) Portfolios where the customer account level ‘Probability of Default’ has not been determined have been included in the ‘Loans not graded’ category.
(g) Loans past due but not impaired(1)
A loan is considered past due when a counterparty has not made a payment by the contractual due date. The following table presents the carrying value of loans that are
contractually past due but not classified as impaired because they are either less than 90 days past due or fully secured and collection efforts are reasonably expected to
result in repayment, or restoring it to a current status in accordance with the Bank’s policy.
2019 2018
As at October 31 ($ millions)
31 – 60
days
61 – 90
days
91 days
and
greater(2) Total 31 – 60 days 61 – 90 days
91 days
and
greater(2) Total
Residential mortgages $ 1,128 $ 526 $ – $1,654 $ 1,290 $ 521 $ – $ 1,811
Personal loans 624 330 – 954 609 322 – 931
Credit cards 278 179 417 874 231 154 353 738
Business and government 188 89 – 277 167 40 – 207
Total $ 2,218 $ 1,124 $ 417 $3,759 $ 2,297 $ 1,037 $ 353 $ 3,687
(1) Loans past due 30 days or less are not presented in this analysis as they are not administratively considered past due.
(2) All loans that are over 90 days past due are considered impaired with the exception of credit card receivables which are considered impaired when 180 days past due.
196 | 2019 Scotiabank Annual Report
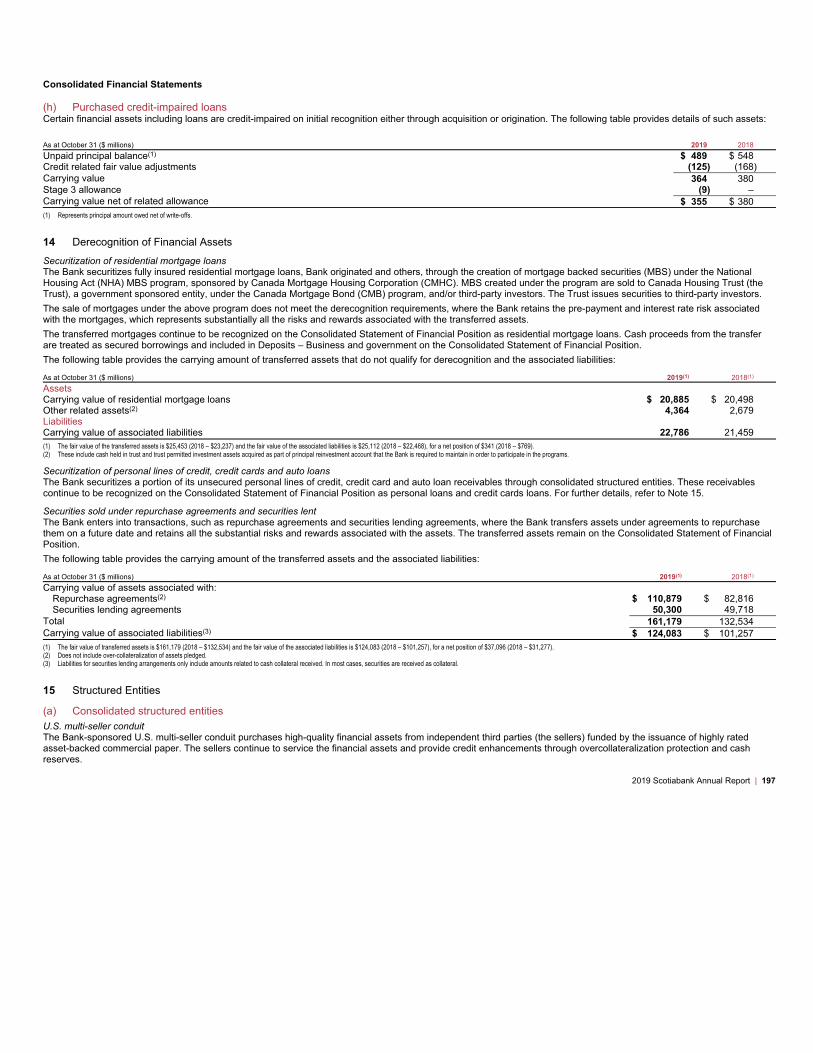
Consolidated Financial Statements
(h) Purchased credit-impaired loans
Certain financial assets including loans are credit-impaired on initial recognition either through acquisition or origination. The following table provides details of such assets:
As at October 31 ($ millions) 2019 2018
Unpaid principal balance(1) $ 489 $ 548
Credit related fair value adjustments (125) (168)
Carrying value 364 380
Stage 3 allowance (9) –
Carrying value net of related allowance $ 355 $ 380
(1) Represents principal amount owed net of write-offs.
14 Derecognition of Financial Assets
Securitization of residential mortgage loans
The Bank securitizes fully insured residential mortgage loans, Bank originated and others, through the creation of mortgage backed securities (MBS) under the National
Housing Act (NHA) MBS program, sponsored by Canada Mortgage Housing Corporation (CMHC). MBS created under the program are sold to Canada Housing Trust (the
Trust), a government sponsored entity, under the Canada Mortgage Bond (CMB) program, and/or third-party investors. The Trust issues securities to third-party investors.
The sale of mortgages under the above program does not meet the derecognition requirements, where the Bank retains the pre-payment and interest rate risk associated
with the mortgages, which represents substantially all the risks and rewards associated with the transferred assets.
The transferred mortgages continue to be recognized on the Consolidated Statement of Financial Position as residential mortgage loans. Cash proceeds from the transfer
are treated as secured borrowings and included in Deposits – Business and government on the Consolidated Statement of Financial Position.
The following table provides the carrying amount of transferred assets that do not qualify for derecognition and the associated liabilities:
As at October 31 ($ millions) 2019(1) 2018(1)
Assets
Carrying value of residential mortgage loans $ 20,885 $ 20,498
Other related assets(2) 4,364 2,679
Liabilities
Carrying value of associated liabilities 22,786 21,459
(1) The fair value of the transferred assets is $25,453 (2018 – $23,237) and the fair value of the associated liabilities is $25,112 (2018 – $22,468), for a net position of $341 (2018 – $769).
(2) These include cash held in trust and trust permitted investment assets acquired as part of principal reinvestment account that the Bank is required to maintain in order to participate in the programs.
Securitization of personal lines of credit, credit cards and auto loans
The Bank securitizes a portion of its unsecured personal lines of credit, credit card and auto loan receivables through consolidated structured entities. These receivables
continue to be recognized on the Consolidated Statement of Financial Position as personal loans and credit cards loans. For further details, refer to Note 15.
Securities sold under repurchase agreements and securities lent
The Bank enters into transactions, such as repurchase agreements and securities lending agreements, where the Bank transfers assets under agreements to repurchase
them on a future date and retains all the substantial risks and rewards associated with the assets. The transferred assets remain on the Consolidated Statement of Financial
Position.
The following table provides the carrying amount of the transferred assets and the associated liabilities:
As at October 31 ($ millions) 2019(1) 2018(1)
Carrying value of assets associated with:
Repurchase agreements(2) $ 110,879 $ 82,816
Securities lending agreements 50,300 49,718
Total 161,179 132,534
Carrying value of associated liabilities(3)$ 124,083 $ 101,257
(1) The fair value of transferred assets is $161,179 (2018 – $132,534) and the fair value of the associated liabilities is $124,083 (2018 – $101,257), for a net position of $37,096 (2018 – $31,277).
(2) Does not include over-collateralization of assets pledged.
(3) Liabilities for securities lending arrangements only include amounts related to cash collateral received. In most cases, securities are received as collateral.
15 Structured Entities
(a) Consolidated structured entities
U.S. multi-seller conduit
The Bank-sponsored U.S. multi-seller conduit purchases high-quality financial assets from independent third parties (the sellers) funded by the issuance of highly rated
asset-backed commercial paper. The sellers continue to service the financial assets and provide credit enhancements through overcollateralization protection and cash
reserves.
2019 Scotiabank Annual Report | 197

Consolidated Financial Statements
Each asset purchased by the conduit has a deal-specific liquidity facility provided by the Bank in the form of a Liquidity Asset Purchase Agreement (LAPA). The primary
purpose of the backstop liquidity facility is to provide an alternative source of financing in the event the conduit is unable to access the asset-backed commercial paper
market. The administration agent can require the Bank in its capacity as liquidity provider to perform under its asset-specific LAPA agreements, in which case the Bank is
obliged to purchase an interest in the related assets owned by the conduit. The Bank is not obligated to perform under the LAPA agreements in the event the conduit itself is
insolvent.
The Bank’s liquidity agreements with the conduit call for the Bank to fund full par value of the assets, including defaulted assets, if any, of the conduit. This facility is available
to absorb the losses on defaulted assets, if any, in excess of losses absorbed by deal-specific seller credit enhancements. Further, the Bank holds the subordinated note
issued by the conduit.
The Bank’s exposure from the U.S. conduit through the LAPA, including the obligation to purchase defaulted assets and investment in the conduit’s subordinated note, give
the Bank the obligation to absorb losses that could potentially be significant to the conduit, which in conjunction with power to direct the conduit’s activities, result in the Bank
consolidating the U.S. multi-seller conduit.
The conduit’s assets are primarily included in business and government loans on the Bank’s Consolidated Statement of Financial Position.
There are contractual restrictions on the ability of the Bank’s consolidated U.S. multi-seller conduit to transfer funds to the Bank. The Bank is restricted from accessing the
conduit’s assets under the relevant arrangements. The Bank has no rights to the assets owned by the conduit. In the normal course of business, the assets of the conduit
can only be used to settle the obligations of the conduit.
Bank funding vehicles
The Bank uses funding vehicles to facilitate cost-efficient financing of its own operations, including the issuance of covered bonds and notes. These vehicles include
Scotiabank Covered Bond Guarantor Limited Partnership, Halifax Receivables Trust, Trillium Credit Card Trust II and Securitized Term Auto Receivables Trust 2016-1,
2017-1, 2017-2, 2018-1, 2018-2 and 2019-1.
Activities of these structured entities are generally limited to holding an interest in a pool of assets or receivables generated by the Bank.
These structured entities are consolidated due to the Bank’s decision-making power and ability to use the power to affect the Bank’s returns.
Scotiabank Covered Bond Guarantor Limited Partnership
The Bank has a registered covered bond program through which it issues debt that is guaranteed by Scotiabank Covered Bond Guarantor Limited Partnership (the “LP”).
Under this program, the LP purchases uninsured residential mortgages from the Bank, which it acquires with funding provided by the Bank.
As at October 31, 2019, $26 billion (2018 – $29.1 billion) covered bonds were outstanding and included in Deposits – Business and government on the Consolidated
Statement of Financial Position. The Bank’s outstanding covered bonds are denominated in U.S. dollars, Australian dollars, British pounds, Swiss francs and Euros. As at
October 31, 2019, assets pledged in relation to these covered bonds were uninsured residential mortgages denominated in Canadian dollars of $27.2 billion (2018 – $30.7
billion).
Personal line of credit securitization trust
The Bank securitizes a portion of its Canadian unsecured personal line of credit receivables (receivables) through Halifax Receivables Trust (Halifax), a Bank-sponsored
structured entity. Halifax issues notes to third-party investors and the Bank, proceeds of which are used to purchase co-ownership interests in receivables originated by the
Bank. Recourse of the note holders is limited to the purchased interests.
The Bank is responsible for servicing the transferred receivables as well as performing administrative functions for Halifax. The subordinated notes issued by Halifax are held
by the Bank. As at October 31, 2019, $0.5 billion notes (2018 – $1 billion) were outstanding and included in Deposits – Business and government on the Consolidated
Statement of Financial Position. As at October 31, 2019, assets pledged in relation to these notes were $0.6 billion (2018 – $1.3 billion).
Credit card receivables securitization trust
The Bank securitizes a portion of its Canadian credit card receivables (receivables) through Trillium Credit Card Trust II (Trillium), a Bank-sponsored structured entity.
Trillium issues senior notes to third-party investors and subordinated notes to third party investors or the Bank. The proceeds of such issuance are used to purchase
co-ownership interests in receivables originated by the Bank. Recourse of the note holders is limited to the purchased interest.
The Bank is responsible for servicing the transferred receivables as well as performing administrative functions for Trillium. As at October 31, 2019, US $2.5 billion
($3.2 billion Canadian dollars) (2018 – US $1.2 billion, $1.6 billion Canadian dollars) Class A notes and US $109 million ($143 million Canadian dollars) (2018 – nil)
subordinated Class B and Class C notes were outstanding and included in Deposits – Business and government on the Consolidated Statement of Financial Position. As at
October 31, 2019 assets pledged in relation to these notes were credit card receivables, denominated in Canadian dollars, of $3.7 billion (2018 – $1.8 billion).
Auto loan receivables securitization trusts
The Bank securitizes a portion of its Canadian auto loan receivables (receivables) through Securitized Term Auto Receivables Trust 2016-1, 2017-1, 2017-2, 2018-1, 2018-2
and 2019-1 (START entities). Each entity is a Bank-sponsored structured entity. START entities issue Class A notes to third-party investors and may issue Class A and/or
subordinated notes to the Bank, and the proceeds of such issuances are used to purchase discrete pools of retail indirect auto loan receivables from the Bank. Recourse of
the note holders is limited to the receivables.
The Bank is responsible for servicing the transferred receivables as well as performing administrative functions for START. The subordinated notes issued by START entities
are held by the Bank. As at October 31, 2019, the aggregate Class A notes issued to third parties outstanding and included in Deposits – Business and government on the
Consolidated Statement of Financial Position were US $1.4 billion ($1.8 billion Canadian dollars) (2018 – US $1.8 billion, $2.4 billion Canadian dollars). As at October 31,
2019, assets pledged in relation to these notes were Canadian auto loan receivables denominated in Canadian dollars of $2.3 billion (2018 – $3.0 billion).
Other
Assets of other consolidated structured entities are comprised of securities, deposits with banks and other assets to meet the Bank’s and customer needs.
198 | 2019 Scotiabank Annual Report

Consolidated Financial Statements
(b) Unconsolidated structured entities
The following table provides information about other structured entities in which the Bank has a significant interest but does not control and therefore does not consolidate. A
significant interest is generally considered to exist where the Bank is exposed to 10% or more of the unconsolidated structured entities’ maximum exposure to loss.
As at October 31, 2019
($ millions)
Canadian multi-seller
conduits that the
Bank administers
Structured
finance
entities
Capital
funding
vehicles Total
Total assets (on structured entity’s financial statements) $ 2,576 $ 3,114 $ 833 $ 6,523
Assets recognized on the Bank’s financial statements
Trading assets 3 – – 3
Investment securities – 1,124 10 1,134
Loans(1) – 1,070 44 1,114
3 2,194 54 2,251
Liabilities recognized on the Bank’s financial statements
Deposits – Business and government – – 779 779
Derivative financial instruments 1 – 1
1 – 779 780
Bank’s maximum exposure to loss $ 2,579 $ 2,194 $ 54 $ 4,827
As at October 31, 2018
($ millions)
Canadian multi-seller
conduits that the
Bank administers
Structured
finance
entities
Capital
funding
vehicles Total
Total assets (on structured entity’s financial statements) $ 3,216 $ 4,488 $ 1,520 $ 9,224
Assets recognized on the Bank’s financial statements
Trading assets 3 – – 3
Investment securities – 1,054 17 1,071
Loans(1) – 978 45 1,023
3 2,032 62 2,097
Liabilities recognized on the Bank’s financial statements
Deposits – Business and government – – 1,458 1,458
Derivative financial instruments 6 – – 6
6 – 1,458 1,464
Bank’s maximum exposure to loss $ 3,219 $ 2,032 $ 62 $ 5,313
(1) Loan balances are presented net of allowance for credit losses.
The Bank’s maximum exposure to loss represents the notional amounts of guarantees, liquidity facilities, and other credit support relationships with the structured entities,
the credit risk amount for certain derivative contracts with the entities and the amount invested where the Bank holds an ownership interest in the structured entities. Of the
aggregate amount of maximum exposure to loss as at October 31, 2019, the Bank has recorded $2.2 billion (2018 – $2 billion), primarily its interest in the structured entities,
on its Consolidated Statement of Financial Position.
Canadian multi-seller conduits that the Bank administers
The Bank sponsors two Canadian multi-seller conduits. The conduits purchase assets from independent third parties (the sellers) funded by the issuance of asset-backed
commercial paper. The sellers continue to service the assets and provide credit enhancements through overcollateralization protection and cash reserves. The Bank has no
rights to these assets as they are available to support the obligations of the respective programs, but manages for a fee the commercial paper selling programs. To ensure
timely repayment of the commercial paper, each asset pool financed by the multi-seller conduits has a deal-specific LAPA with the Bank. Pursuant to the terms of the LAPA,
the Bank as the liquidity provider is obligated to purchase non-defaulted assets, transferred by the conduit at the conduit’s original cost as reflected in the table above. In
most cases, the liquidity agreements do not require the Bank to purchase defaulted assets. Additionally, the Bank has not provided any program-wide credit enhancement to
these conduits. The Bank provides additional liquidity facilities to these multi-seller conduits to a maximum amount of $1.2 billion (2018 – $0.8 billion) based on future asset
purchases by these conduits.
Although the Bank has power over the relevant activities of the conduits, it has limited exposure to variability in returns, which results in the Bank not consolidating the two
Canadian conduits.
Structured finance entities
The Bank has interests in structured entities used to assist corporate clients in accessing cost-efficient financing through their securitization structures. The Bank may act as
an administrator, an investor or a combination of both in these types of structures.
2019 Scotiabank Annual Report | 199
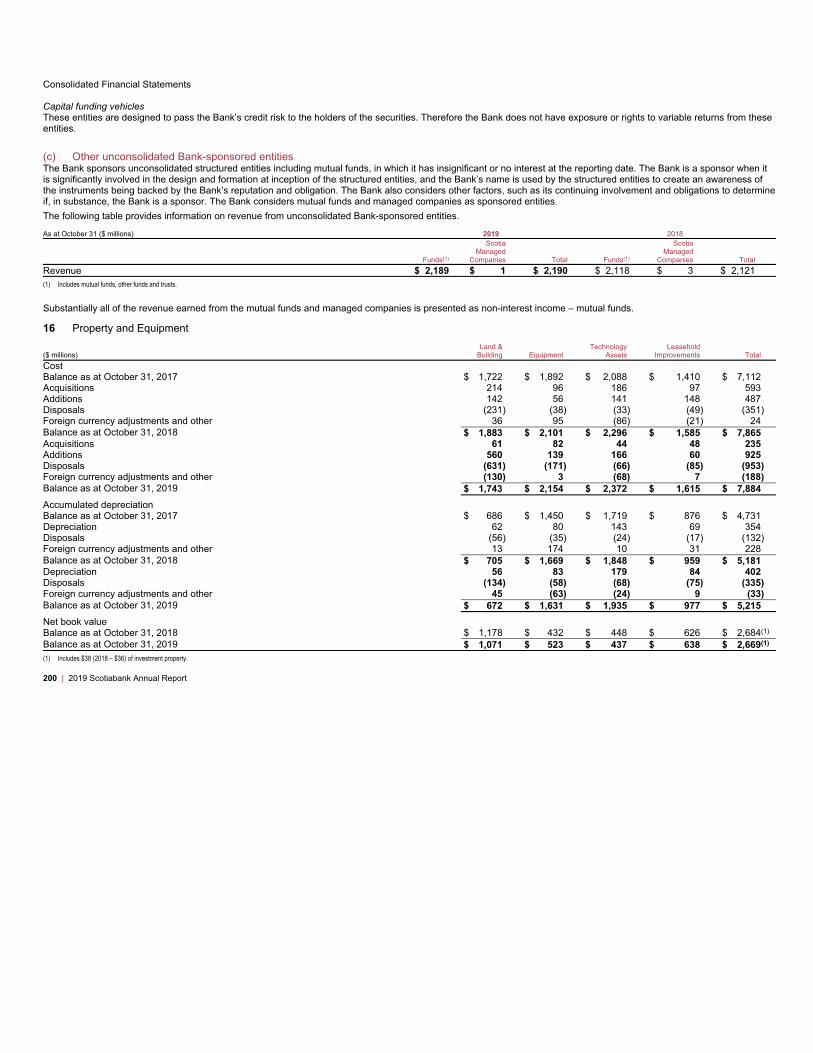
Consolidated Financial Statements
Capital funding vehicles
These entities are designed to pass the Bank’s credit risk to the holders of the securities. Therefore the Bank does not have exposure or rights to variable returns from these
entities.
(c) Other unconsolidated Bank-sponsored entities
The Bank sponsors unconsolidated structured entities including mutual funds, in which it has insignificant or no interest at the reporting date. The Bank is a sponsor when it
is significantly involved in the design and formation at inception of the structured entities, and the Bank’s name is used by the structured entities to create an awareness of
the instruments being backed by the Bank’s reputation and obligation. The Bank also considers other factors, such as its continuing involvement and obligations to determine
if, in substance, the Bank is a sponsor. The Bank considers mutual funds and managed companies as sponsored entities.
The following table provides information on revenue from unconsolidated Bank-sponsored entities.
As at October 31 ($ millions) 2019 2018
Funds(1)
Scotia
Managed
Companies Total Funds(1)
Scotia
Managed
Companies Total
Revenue $ 2,189 $ 1 $ 2,190 $ 2,118 $ 3 $ 2,121
(1) Includes mutual funds, other funds and trusts.
Substantially all of the revenue earned from the mutual funds and managed companies is presented as non-interest income – mutual funds.
16 Property and Equipment
($ millions)
Land &
Building Equipment
Technology
Assets
Leasehold
Improvements Total
Cost
Balance as at October 31, 2017 $ 1,722 $ 1,892 $ 2,088 $ 1,410 $ 7,112
Acquisitions 214 96 186 97 593
Additions 142 56 141 148 487
Disposals (231) (38) (33) (49) (351)
Foreign currency adjustments and other 36 95 (86) (21) 24
Balance as at October 31, 2018 $ 1,883 $ 2,101 $ 2,296 $ 1,585 $ 7,865
Acquisitions 61 82 44 48 235
Additions 560 139 166 60 925
Disposals (631) (171) (66) (85) (953)
Foreign currency adjustments and other (130) 3 (68) 7 (188)
Balance as at October 31, 2019 $ 1,743 $ 2,154 $ 2,372 $ 1,615 $ 7,884
Accumulated depreciation
Balance as at October 31, 2017 $ 686 $ 1,450 $ 1,719 $ 876 $ 4,731
Depreciation 62 80 143 69 354
Disposals (56) (35) (24) (17) (132)
Foreign currency adjustments and other 13 174 10 31 228
Balance as at October 31, 2018 $ 705 $ 1,669 $ 1,848 $ 959 $ 5,181
Depreciation 56 83 179 84 402
Disposals (134) (58) (68) (75) (335)
Foreign currency adjustments and other 45 (63) (24) 9 (33)
Balance as at October 31, 2019 $ 672 $ 1,631 $ 1,935 $ 977 $ 5,215
Net book value
Balance as at October 31, 2018 $ 1,178 $ 432 $ 448 $ 626 $ 2,684(1)
Balance as at October 31, 2019 $ 1,071 $ 523 $ 437 $ 638 $ 2,669(1)
(1) Includes $38 (2018 – $36) of investment property.
200 | 2019 Scotiabank Annual Report

Consolidated Financial Statements
17 Investments in Associates
The Bank had significant investments in the following associates:
2019 2018
As at October 31 ($ millions)
Country of
incorporation Nature of business
Ownership
percentage
Date of financial
statements(1)
Carrying
value
Carrying
value
Thanachart Bank Public Company Limited(2) Thailand Banking 49.00% October 31, 2019 $ 3,554 $ 2,961
Canadian Tire’s Financial Services business (CTFS)(3) Canada Financial Services 20.00% September 30, 2019 529 518
Bank of Xi’an Co. Ltd.(4) China Banking 17.99% September 30, 2019 815 772
Maduro & Curiel’s Bank N.V.(5)Curacao Banking 48.10% September 30, 2019 327 304
(1) Represents the date of the most recent financial statements. Where available, financial statements prepared by the associates’ management or other published information is used to estimate the change in the Bank’s interest since the most recent financial statements.
(2) Refer to Note 37 –Acquisitions and Divestitures.
(3) Canadian Tire has an option to sell to the Bank up to an additional 29% equity interest within the next 10 years at the then fair value, that can be settled, at the Bank’s discretion, by issuance of common shares or cash. After 10 years, for a period of six months, the Bank has
the option to sell its equity interest back to Canadian Tire at the then fair value.
(4) Based on the quoted price on the Shanghai Stock Exchange, the Bank’s investment in Bank of Xi’an Co. Ltd was $1,021 as at October 31, 2019
(5) The local regulator requires financial institutions to set aside reserves for general banking risks. These reserves are not required under IFRS, and represent undistributed retained earnings related to a foreign associated corporation, which are subject to local regulatory
restrictions. As of October 31, 2019 these reserves amounted to $61 (2018 – $62).
Summarized financial information of the Bank’s significant associates are as follows.
For the twelve months ended(1) As at October 31, 2019
($ millions) Revenue
Net
income Total assets Total liabilities
Thanachart Bank Public Company Limited $ 2,050 $ 627 $ 46,475 $ 39,827
Canadian Tire’s Financial Services business (CTFS) 1,218 364 6,370 5,382
Bank of Xi’an Co. Ltd. 1,295 496 49,556 45,225
Maduro & Curiel’s Bank N.V. 371 115 5,677 4,982
For the twelve months ended(1) As at October 31, 2018
($ millions) Revenue
Net
income
Total
assets Total liabilities
Thanachart Bank Public Company Limited $ 1,871 $ 590 $39,875 $ 34,289
Canadian Tire’s Financial Services business (CTFS) 1,143 348 6,256 5,279
Bank of Xi’an Co. Ltd. 1,123 456 45,261 41,595
Maduro & Curiel’s Bank N.V. 348 92 5,832 5,165
(1) Based on the most recent available financial statements.
18 Goodwill and Other Intangible Assets
Goodwill
The changes in the carrying amounts of goodwill by cash-generating unit (CGU) are as follows:
($ millions)
Canadian
Banking
Global
Banking and
Markets
Latin
America
Caribbean
and
Central
America Total
Balance as at October 31, 2017 $ 3,385 $ 255 $ 2,400 $ 1,203 $ 7,243
Acquisitions 1,710 – 1,164 – 2,874
Dispositions – – – – –
Foreign currency adjustments and other – 5 (110) (5) (110)
Balance as at October 31, 2018 5,095 260 3,454 1,198 10,007
Acquisitions – – – 250 250
Dispositions – – (36) (453) (489)
Foreign currency adjustments and other (2) – (146) 11 (137)
Balance as at October 31, 2019 $ 5,093 $ 260 $ 3,272 $ 1,006 $ 9,631
Impairment testing of goodwill
Goodwill acquired in business combinations is allocated to each of the Bank’s group of CGUs that are expected to benefit from the synergies of the particular acquisition.
Goodwill is assessed for impairment annually or more frequently if events or circumstances occur that may result in the recoverable amount of the CGU falling below its
carrying value.
The Bank determines the carrying value of the CGU using a regulatory capital approach based on credit, market, and operational risks, and leverage, consistent with the
Bank’s capital attribution for business line performance measurement. The recoverable amount is the higher of fair value less costs of disposal and value in use. The
recoverable amount for the CGU has been determined using the fair value less costs of disposal method. In arriving at such value for the CGU, the Bank has used price
earnings (P/E) multiples applied to normalized net income for the last four
2019 Scotiabank Annual Report | 201
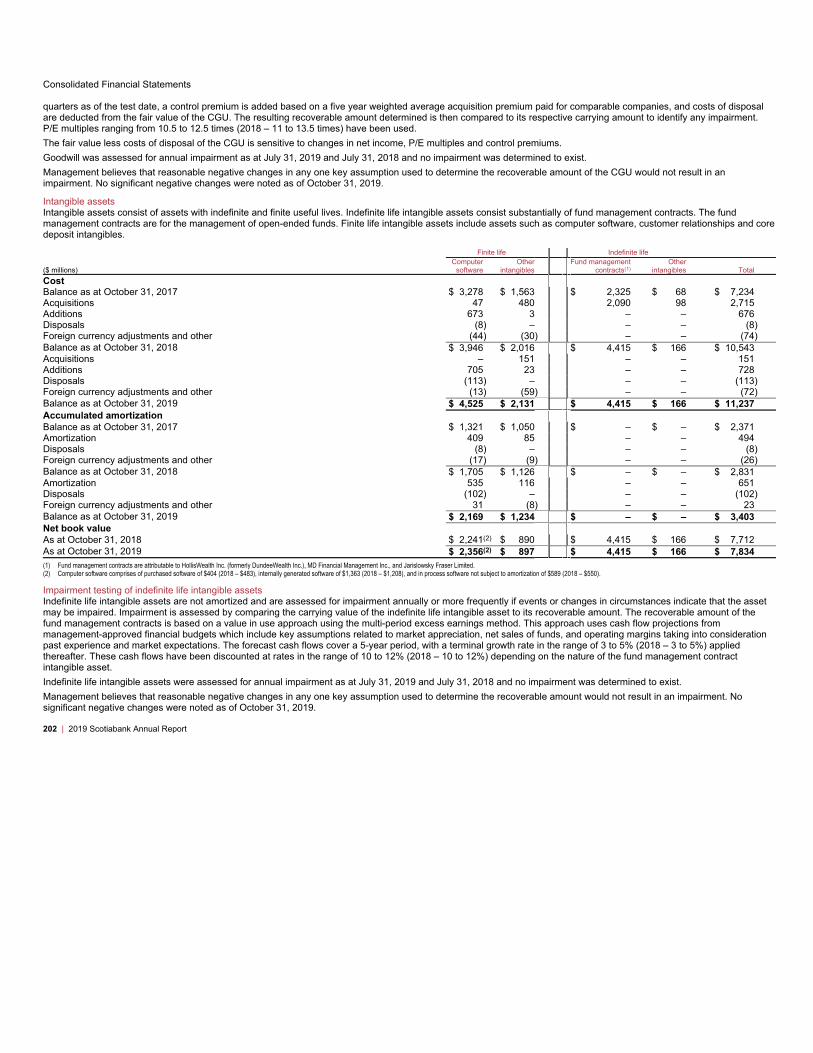
Consolidated Financial Statements
quarters as of the test date, a control premium is added based on a five year weighted average acquisition premium paid for comparable companies, and costs of disposal
are deducted from the fair value of the CGU. The resulting recoverable amount determined is then compared to its respective carrying amount to identify any impairment.
P/E multiples ranging from 10.5 to 12.5 times (2018 – 11 to 13.5 times) have been used.
The fair value less costs of disposal of the CGU is sensitive to changes in net income, P/E multiples and control premiums.
Goodwill was assessed for annual impairment as at July 31, 2019 and July 31, 2018 and no impairment was determined to exist.
Management believes that reasonable negative changes in any one key assumption used to determine the recoverable amount of the CGU would not result in an
impairment. No significant negative changes were noted as of October 31, 2019.
Intangible assets
Intangible assets consist of assets with indefinite and finite useful lives. Indefinite life intangible assets consist substantially of fund management contracts. The fund
management contracts are for the management of open-ended funds. Finite life intangible assets include assets such as computer software, customer relationships and core
deposit intangibles.
Finite life Indefinite life
($ millions)
Computer
software
Other
intangibles
Fund management
contracts(1)
Other
intangibles Total
Cost
Balance as at October 31, 2017 $ 3,278 $ 1,563 $ 2,325 $ 68 $ 7,234
Acquisitions 47 480 2,090 98 2,715
Additions 673 3 – – 676
Disposals (8) – – – (8)
Foreign currency adjustments and other (44) (30) – – (74)
Balance as at October 31, 2018 $ 3,946 $ 2,016 $ 4,415 $ 166 $ 10,543
Acquisitions – 151 – – 151
Additions 705 23 – – 728
Disposals (113) – – – (113)
Foreign currency adjustments and other (13) (59) – – (72)
Balance as at October 31, 2019 $ 4,525 $ 2,131 $ 4,415 $ 166 $ 11,237
Accumulated amortization
Balance as at October 31, 2017 $ 1,321 $ 1,050 $ – $ – $ 2,371
Amortization 409 85 – – 494
Disposals (8) – – – (8)
Foreign currency adjustments and other (17) (9) – – (26)
Balance as at October 31, 2018 $ 1,705 $ 1,126 $ – $ – $ 2,831
Amortization 535 116 – – 651
Disposals (102) – – – (102)
Foreign currency adjustments and other 31 (8) – – 23
Balance as at October 31, 2019 $ 2,169 $ 1,234 $ – $ – $ 3,403
Net book value
As at October 31, 2018 $ 2,241(2) $ 890 $ 4,415 $ 166 $ 7,712
As at October 31, 2019 $ 2,356(2) $ 897 $ 4,415 $ 166 $ 7,834
(1) Fund management contracts are attributable to HollisWealth Inc. (formerly DundeeWealth Inc.), MD Financial Management Inc., and Jarislowsky Fraser Limited.
(2) Computer software comprises of purchased software of $404 (2018 – $483), internally generated software of $1,363 (2018 – $1,208), and in process software not subject to amortization of $589 (2018 – $550).
Impairment testing of indefinite life intangible assets
Indefinite life intangible assets are not amortized and are assessed for impairment annually or more frequently if events or changes in circumstances indicate that the asset
may be impaired. Impairment is assessed by comparing the carrying value of the indefinite life intangible asset to its recoverable amount. The recoverable amount of the
fund management contracts is based on a value in use approach using the multi-period excess earnings method. This approach uses cash flow projections from
management-approved financial budgets which include key assumptions related to market appreciation, net sales of funds, and operating margins taking into consideration
past experience and market expectations. The forecast cash flows cover a 5-year period, with a terminal growth rate in the range of 3 to 5% (2018 – 3 to 5%) applied
thereafter. These cash flows have been discounted at rates in the range of 10 to 12% (2018 – 10 to 12%) depending on the nature of the fund management contract
intangible asset.
Indefinite life intangible assets were assessed for annual impairment as at July 31, 2019 and July 31, 2018 and no impairment was determined to exist.
Management believes that reasonable negative changes in any one key assumption used to determine the recoverable amount would not result in an impairment. No
significant negative changes were noted as of October 31, 2019.
202 | 2019 Scotiabank Annual Report

Consolidated Financial Statements
19 Other Assets
As at October 31 ($ millions) 2019 2018
Accrued interest $ 2,790 $ 2,800
Accounts receivable and prepaids 2,298 1,878
Current tax assets 1,534 657
Margin deposit derivatives 5,560 3,247
Segregated fund assets 2,405 2,736
Pension assets (Note 28) 422 360
Receivable from brokers, dealers and clients 1,161 2,061
Other 6,721 3,694
Total $ 22,891 $ 17,433
20 Deposits
2019 2018
Payable on demand(1)
As at October 31 ($ millions)
Interest-
bearing
Non-interest-
bearing
Payable after
notice(2)
Payable on a
fixed date(3) Total
Personal $ 6,687 $ 7,783 $ 127,464 $ 82,866 $ 224,800 $ 214,545
Business and government 100,321 25,093 43,058 293,379 461,851 422,002
Financial institutions 7,399 915 1,276 37,149 46,739 39,987
Total $ 114,407 $ 33,791 $ 171,798(4) $ 413,394 $ 733,390 $ 676,534
Recorded in:
Canada $ 87,470 $ 17,174 $ 134,205 $ 264,309 $ 503,158 $ 472,798
United States 14,379 50 7,999 53,247 75,675 59,938
United Kingdom – – 203 20,107 20,310 16,847
Mexico 10 4,321 7,435 11,906 23,672 21,151
Peru 5,505 130 4,456 8,647 18,738 15,213
Chile 3,173 4,514 136 14,891 22,714 24,180
Colombia 36 540 4,498 4,772 9,846 9,543
Other International 3,834 7,062 12,866 35,515 59,277 56,864
Total(5)$ 114,407 $ 33,791 $ 171,798 $ 413,394 $ 733,390 $ 676,534
(1) Deposits payable on demand include all deposits for which we do not have the right to notice of withdrawal, generally chequing accounts.
(2) Deposits payable after notice include all deposits for which we require notice of withdrawal, generally savings accounts.
(3) All deposits that mature on a specified date, generally term deposits, guaranteed investments certificates and similar instruments.
(4) Includes $137 (2018 – $141) of non-interest bearing deposits.
(5) Deposits denominated in U.S. dollars amount to $250,886 (2018 – $219,195), deposits denominated in Chilean pesos amount to $21,021 (2018 – $22,731), deposits denominated in Mexican pesos amount to $21,039 (2018 – $18,341) and deposits denominated in other
foreign currencies amount to $83,837 (2018 – $79,582).
The following table presents the maturity schedule for term deposits in Canada greater than $100,000(1).
($ millions)
Within three
months
Three to six
months
Six to
twelve months
One to
five years
Over
five years Total
As at October 31, 2019 $ 48,411 $ 23,797 $ 43,377 $ 91,687 $ 14,616 $ 221,888
As at October 31, 2018 $ 36,670 $ 23,913 $ 42,830 $ 99,734 $ 19,872 $ 223,019
(1) The majority of foreign term deposits are in excess of $100,000.
2019 Scotiabank Annual Report | 203
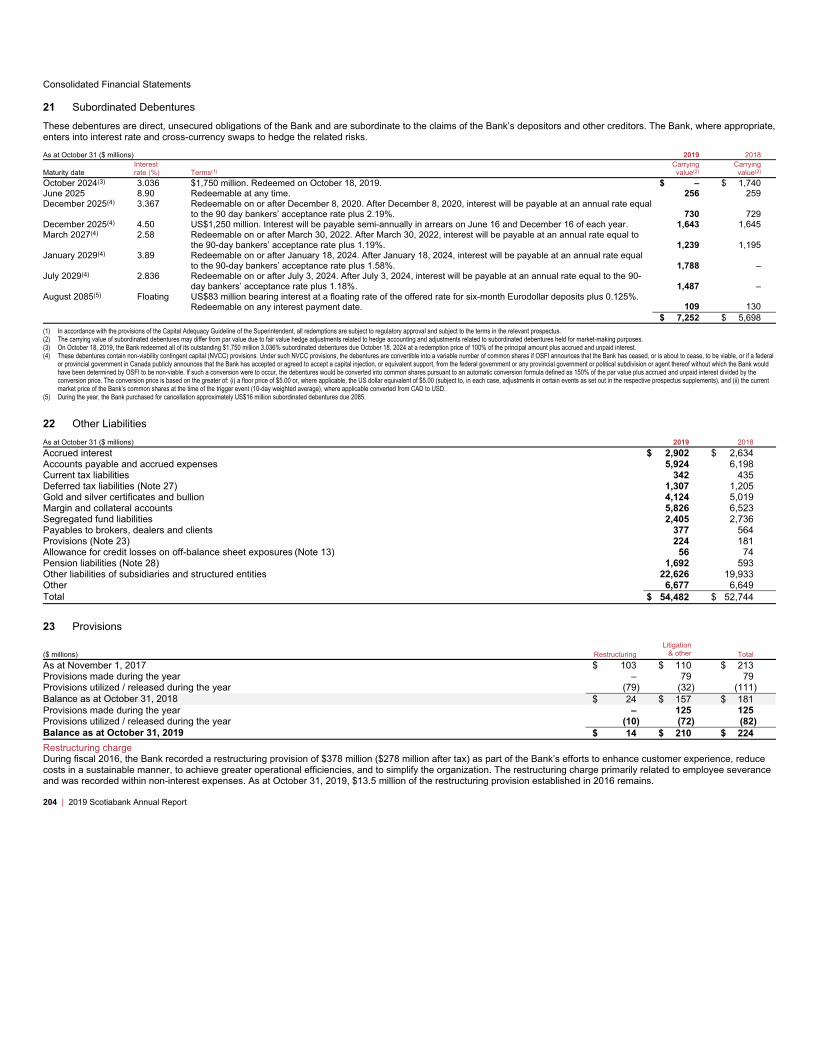
Consolidated Financial Statements
21 Subordinated Debentures
These debentures are direct, unsecured obligations of the Bank and are subordinate to the claims of the Bank’s depositors and other creditors. The Bank, where appropriate,
enters into interest rate and cross-currency swaps to hedge the related risks.
As at October 31 ($ millions) 2019 2018
Maturity date
Interest
rate (%) Terms(1)
Carrying
value(2)
Carrying
value(2)
October 2024(3) 3.036 $1,750 million. Redeemed on October 18, 2019. $ – $ 1,740
June 2025 8.90 Redeemable at any time. 256 259
December 2025(4) 3.367 Redeemable on or after December 8, 2020. After December 8, 2020, interest will be payable at an annual rate equal
to the 90 day bankers’ acceptance rate plus 2.19%. 730 729
December 2025(4) 4.50 US$1,250 million. Interest will be payable semi-annually in arrears on June 16 and December 16 of each year. 1,643 1,645
March 2027(4) 2.58 Redeemable on or after March 30, 2022. After March 30, 2022, interest will be payable at an annual rate equal to
the 90-day bankers’ acceptance rate plus 1.19%. 1,239 1,195
January 2029(4) 3.89 Redeemable on or after January 18, 2024. After January 18, 2024, interest will be payable at an annual rate equal
to the 90-day bankers’ acceptance rate plus 1.58%. 1,788 –
July 2029(4) 2.836 Redeemable on or after July 3, 2024. After July 3, 2024, interest will be payable at an annual rate equal to the 90-
day bankers’ acceptance rate plus 1.18%. 1,487 –
August 2085(5) Floating US$83 million bearing interest at a floating rate of the offered rate for six-month Eurodollar deposits plus 0.125%.
Redeemable on any interest payment date. 109 130
$ 7,252 $ 5,698
(1) In accordance with the provisions of the Capital Adequacy Guideline of the Superintendent, all redemptions are subject to regulatory approval and subject to the terms in the relevant prospectus.
(2) The carrying value of subordinated debentures may differ from par value due to fair value hedge adjustments related to hedge accounting and adjustments related to subordinated debentures held for market-making purposes.
(3) On October 18, 2019, the Bank redeemed all of its outstanding $1,750 million 3.036% subordinated debentures due October 18, 2024 at a redemption price of 100% of the principal amount plus accrued and unpaid interest.
(4) These debentures contain non-viability contingent capital (NVCC) provisions. Under such NVCC provisions, the debentures are convertible into a variable number of common shares if OSFI announces that the Bank has ceased, or is about to cease, to be viable, or if a federal
or provincial government in Canada publicly announces that the Bank has accepted or agreed to accept a capital injection, or equivalent support, from the federal government or any provincial government or political subdivision or agent thereof without which the Bank would
have been determined by OSFI to be non-viable. If such a conversion were to occur, the debentures would be converted into common shares pursuant to an automatic conversion formula defined as 150% of the par value plus accrued and unpaid interest divided by the
conversion price. The conversion price is based on the greater of: (i) a floor price of $5.00 or, where applicable, the US dollar equivalent of $5.00 (subject to, in each case, adjustments in certain events as set out in the respective prospectus supplements), and (ii) the current
market price of the Bank’s common shares at the time of the trigger event (10-day weighted average), where applicable converted from CAD to USD.
(5) During the year, the Bank purchased for cancellation approximately US$16 million subordinated debentures due 2085.
22 Other Liabilities
As at October 31 ($ millions) 2019 2018
Accrued interest $ 2,902 $ 2,634
Accounts payable and accrued expenses 5,924 6,198
Current tax liabilities 342 435
Deferred tax liabilities (Note 27) 1,307 1,205
Gold and silver certificates and bullion 4,124 5,019
Margin and collateral accounts 5,826 6,523
Segregated fund liabilities 2,405 2,736
Payables to brokers, dealers and clients 377 564
Provisions (Note 23) 224 181
Allowance for credit losses on off-balance sheet exposures (Note 13) 56 74
Pension liabilities (Note 28) 1,692 593
Other liabilities of subsidiaries and structured entities 22,626 19,933
Other 6,677 6,649
Total $ 54,482 $ 52,744
23 Provisions
($ millions) Restructuring
Litigation
& other Total
As at November 1, 2017 $ 103 $ 110 $ 213
Provisions made during the year – 79 79
Provisions utilized / released during the year (79) (32) (111)
Balance as at October 31, 2018 $ 24 $ 157 $ 181
Provisions made during the year – 125 125
Provisions utilized / released during the year (10) (72) (82)
Balance as at October 31, 2019 $ 14 $ 210 $ 224
Restructuring charge
During fiscal 2016, the Bank recorded a restructuring provision of $378 million ($278 million after tax) as part of the Bank’s efforts to enhance customer experience, reduce
costs in a sustainable manner, to achieve greater operational efficiencies, and to simplify the organization. The restructuring charge primarily related to employee severance
and was recorded within non-interest expenses. As at October 31, 2019, $13.5 million of the restructuring provision established in 2016 remains.
204 | 2019 Scotiabank Annual Report
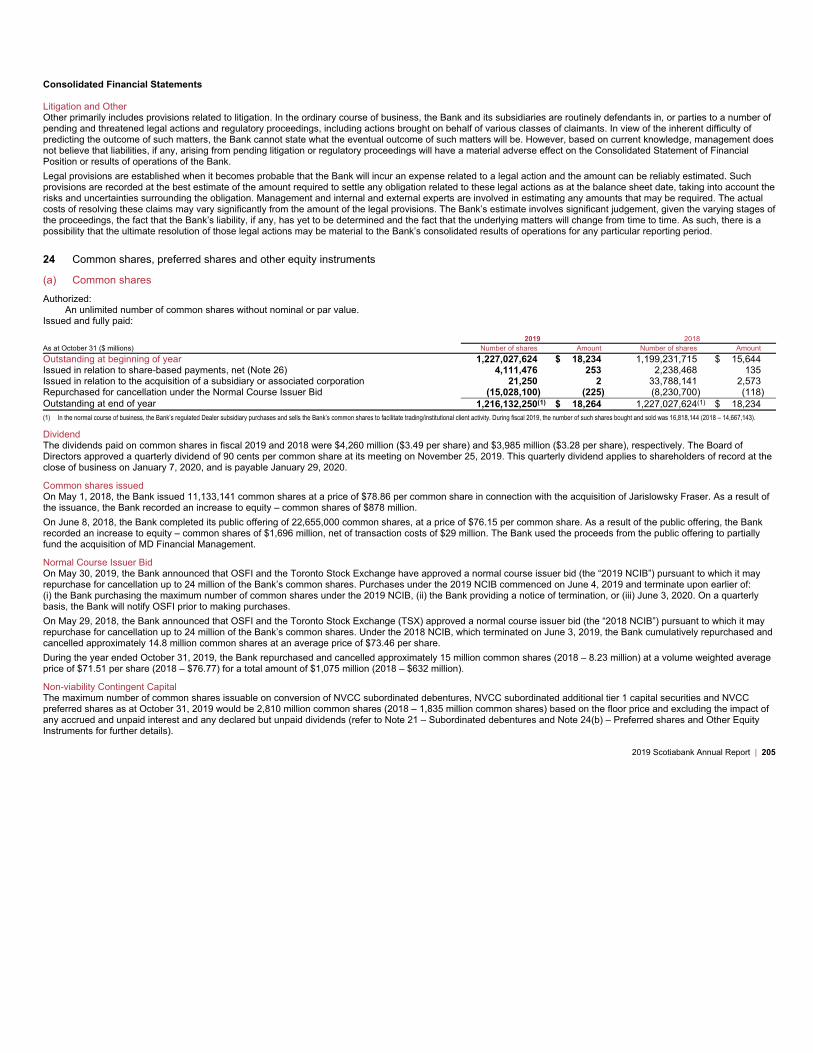
Consolidated Financial Statements
Litigation and Other
Other primarily includes provisions related to litigation. In the ordinary course of business, the Bank and its subsidiaries are routinely defendants in, or parties to a number of
pending and threatened legal actions and regulatory proceedings, including actions brought on behalf of various classes of claimants. In view of the inherent difficulty of
predicting the outcome of such matters, the Bank cannot state what the eventual outcome of such matters will be. However, based on current knowledge, management does
not believe that liabilities, if any, arising from pending litigation or regulatory proceedings will have a material adverse effect on the Consolidated Statement of Financial
Position or results of operations of the Bank.
Legal provisions are established when it becomes probable that the Bank will incur an expense related to a legal action and the amount can be reliably estimated. Such
provisions are recorded at the best estimate of the amount required to settle any obligation related to these legal actions as at the balance sheet date, taking into account the
risks and uncertainties surrounding the obligation. Management and internal and external experts are involved in estimating any amounts that may be required. The actual
costs of resolving these claims may vary significantly from the amount of the legal provisions. The Bank’s estimate involves significant judgement, given the varying stages of
the proceedings, the fact that the Bank’s liability, if any, has yet to be determined and the fact that the underlying matters will change from time to time. As such, there is a
possibility that the ultimate resolution of those legal actions may be material to the Bank’s consolidated results of operations for any particular reporting period.
24 Common shares, preferred shares and other equity instruments
(a) Common shares
Authorized:
An unlimited number of common shares without nominal or par value.
Issued and fully paid:
2019 2018
As at October 31 ($ millions) Number of shares Amount Number of shares Amount
Outstanding at beginning of year 1,227,027,624 $ 18,234 1,199,231,715 $ 15,644
Issued in relation to share-based payments, net (Note 26) 4,111,476 253 2,238,468 135
Issued in relation to the acquisition of a subsidiary or associated corporation 21,250 2 33,788,141 2,573
Repurchased for cancellation under the Normal Course Issuer Bid (15,028,100) (225) (8,230,700) (118)
Outstanding at end of year 1,216,132,250(1) $ 18,264 1,227,027,624(1) $ 18,234
(1) In the normal course of business, the Bank’s regulated Dealer subsidiary purchases and sells the Bank’s common shares to facilitate trading/institutional client activity. During fiscal 2019, the number of such shares bought and sold was 16,818,144 (2018 – 14,667,143).
Dividend
The dividends paid on common shares in fiscal 2019 and 2018 were $4,260 million ($3.49 per share) and $3,985 million ($3.28 per share), respectively. The Board of
Directors approved a quarterly dividend of 90 cents per common share at its meeting on November 25, 2019. This quarterly dividend applies to shareholders of record at the
close of business on January 7, 2020, and is payable January 29, 2020.
Common shares issued
On May 1, 2018, the Bank issued 11,133,141 common shares at a price of $78.86 per common share in connection with the acquisition of Jarislowsky Fraser. As a result of
the issuance, the Bank recorded an increase to equity – common shares of $878 million.
On June 8, 2018, the Bank completed its public offering of 22,655,000 common shares, at a price of $76.15 per common share. As a result of the public offering, the Bank
recorded an increase to equity – common shares of $1,696 million, net of transaction costs of $29 million. The Bank used the proceeds from the public offering to partially
fund the acquisition of MD Financial Management.
Normal Course Issuer Bid
On May 30, 2019, the Bank announced that OSFI and the Toronto Stock Exchange have approved a normal course issuer bid (the “2019 NCIB”) pursuant to which it may
repurchase for cancellation up to 24 million of the Bank’s common shares. Purchases under the 2019 NCIB commenced on June 4, 2019 and terminate upon earlier of:
(i) the Bank purchasing the maximum number of common shares under the 2019 NCIB, (ii) the Bank providing a notice of termination, or (iii) June 3, 2020. On a quarterly
basis, the Bank will notify OSFI prior to making purchases.
On May 29, 2018, the Bank announced that OSFI and the Toronto Stock Exchange (TSX) approved a normal course issuer bid (the “2018 NCIB”) pursuant to which it may
repurchase for cancellation up to 24 million of the Bank’s common shares. Under the 2018 NCIB, which terminated on June 3, 2019, the Bank cumulatively repurchased and
cancelled approximately 14.8 million common shares at an average price of $73.46 per share.
During the year ended October 31, 2019, the Bank repurchased and cancelled approximately 15 million common shares (2018 – 8.23 million) at a volume weighted average
price of $71.51 per share (2018 – $76.77) for a total amount of $1,075 million (2018 – $632 million).
Non-viability Contingent Capital
The maximum number of common shares issuable on conversion of NVCC subordinated debentures, NVCC subordinated additional tier 1 capital securities and NVCC
preferred shares as at October 31, 2019 would be 2,810 million common shares (2018 – 1,835 million common shares) based on the floor price and excluding the impact of
any accrued and unpaid interest and any declared but unpaid dividends (refer to Note 21 – Subordinated debentures and Note 24(b) – Preferred shares and Other Equity
Instruments for further details).
2019 Scotiabank Annual Report | 205
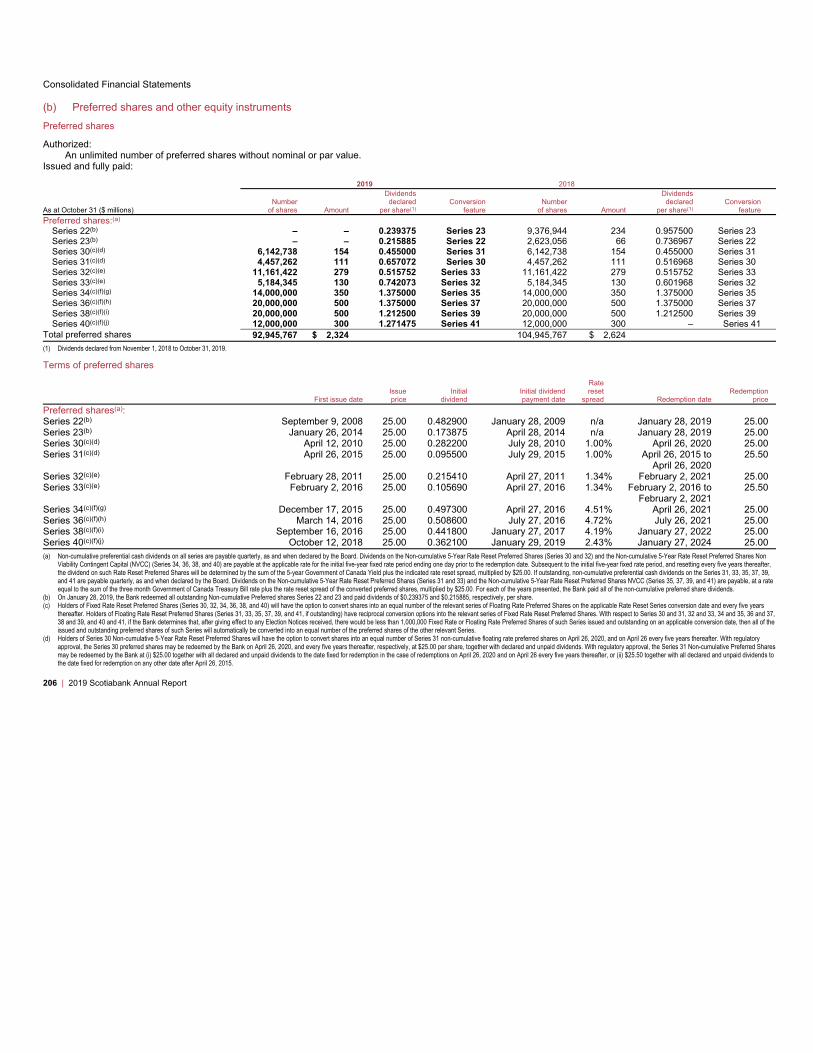
Consolidated Financial Statements
(b) Preferred shares and other equity instruments
Preferred shares
Authorized:
An unlimited number of preferred shares without nominal or par value.
Issued and fully paid:
2019 2018
As at October 31 ($ millions)
Number
of shares Amount
Dividends
declared
per share(1)
Conversion
feature
Number
of shares Amount
Dividends
declared
per share(1)
Conversion
feature
Preferred shares:(a)
Series 22(b) – – 0.239375 Series 23 9,376,944 234 0.957500 Series 23
Series 23(b) – – 0.215885 Series 22 2,623,056 66 0.736967 Series 22
Series 30(c)(d) 6,142,738 154 0.455000 Series 31 6,142,738 154 0.455000 Series 31
Series 31(c)(d) 4,457,262 111 0.657072 Series 30 4,457,262 111 0.516968 Series 30
Series 32(c)(e) 11,161,422 279 0.515752 Series 33 11,161,422 279 0.515752 Series 33
Series 33(c)(e) 5,184,345 130 0.742073 Series 32 5,184,345 130 0.601968 Series 32
Series 34(c)(f)(g) 14,000,000 350 1.375000 Series 35 14,000,000 350 1.375000 Series 35
Series 36(c)(f)(h) 20,000,000 500 1.375000 Series 37 20,000,000 500 1.375000 Series 37
Series 38(c)(f)(i) 20,000,000 500 1.212500 Series 39 20,000,000 500 1.212500 Series 39
Series 40(c)(f)(j) 12,000,000 300 1.271475 Series 41 12,000,000 300 – Series 41
Total preferred shares 92,945,767 $ 2,324 104,945,767 $ 2,624
(1) Dividends declared from November 1, 2018 to October 31, 2019.
Terms of preferred shares
First issue date
Issue
price
Initial
dividend
Initial dividend
payment date
Rate
reset
spread Redemption date
Redemption
price
Preferred shares(a):
Series 22(b) September 9, 2008 25.00 0.482900 January 28, 2009 n/a January 28, 2019 25.00
Series 23(b) January 26, 2014 25.00 0.173875 April 28, 2014 n/a January 28, 2019 25.00
Series 30(c)(d) April 12, 2010 25.00 0.282200 July 28, 2010 1.00% April 26, 2020 25.00
Series 31(c)(d) April 26, 2015 25.00 0.095500 July 29, 2015 1.00% April 26, 2015 to
April 26, 2020
25.50
Series 32(c)(e) February 28, 2011 25.00 0.215410 April 27, 2011 1.34% February 2, 2021 25.00
Series 33(c)(e) February 2, 2016 25.00 0.105690 April 27, 2016 1.34% February 2, 2016 to
February 2, 2021
25.50
Series 34(c)(f)(g) December 17, 2015 25.00 0.497300 April 27, 2016 4.51% April 26, 2021 25.00
Series 36(c)(f)(h) March 14, 2016 25.00 0.508600 July 27, 2016 4.72% July 26, 2021 25.00
Series 38(c)(f)(i) September 16, 2016 25.00 0.441800 January 27, 2017 4.19% January 27, 2022 25.00
Series 40(c)(f)(j) October 12, 2018 25.00 0.362100 January 29, 2019 2.43% January 27, 2024 25.00
(a) Non-cumulative preferential cash dividends on all series are payable quarterly, as and when declared by the Board. Dividends on the Non-cumulative 5-Year Rate Reset Preferred Shares (Series 30 and 32) and the Non-cumulative 5-Year Rate Reset Preferred Shares Non
Viability Contingent Capital (NVCC) (Series 34, 36, 38, and 40) are payable at the applicable rate for the initial five-year fixed rate period ending one day prior to the redemption date. Subsequent to the initial five-year fixed rate period, and resetting every five years thereafter,
the dividend on such Rate Reset Preferred Shares will be determined by the sum of the 5-year Government of Canada Yield plus the indicated rate reset spread, multiplied by $25.00. If outstanding, non-cumulative preferential cash dividends on the Series 31, 33, 35, 37, 39,
and 41 are payable quarterly, as and when declared by the Board. Dividends on the Non-cumulative 5-Year Rate Reset Preferred Shares (Series 31 and 33) and the Non-cumulative 5-Year Rate Reset Preferred Shares NVCC (Series 35, 37, 39, and 41) are payable, at a rate
equal to the sum of the three month Government of Canada Treasury Bill rate plus the rate reset spread of the converted preferred shares, multiplied by $25.00. For each of the years presented, the Bank paid all of the non-cumulative preferred share dividends.
(b) On January 28, 2019, the Bank redeemed all outstanding Non-cumulative Preferred shares Series 22 and 23 and paid dividends of $0.239375 and $0.215885, respectively, per share.
(c) Holders of Fixed Rate Reset Preferred Shares (Series 30, 32, 34, 36, 38, and 40) will have the option to convert shares into an equal number of the relevant series of Floating Rate Preferred Shares on the applicable Rate Reset Series conversion date and every five years
thereafter. Holders of Floating Rate Reset Preferred Shares (Series 31, 33, 35, 37, 39, and 41, if outstanding) have reciprocal conversion options into the relevant series of Fixed Rate Reset Preferred Shares. With respect to Series 30 and 31, 32 and 33, 34 and 35, 36 and 37,
38 and 39, and 40 and 41, if the Bank determines that, after giving effect to any Election Notices received, there would be less than 1,000,000 Fixed Rate or Floating Rate Preferred Shares of such Series issued and outstanding on an applicable conversion date, then all of the
issued and outstanding preferred shares of such Series will automatically be converted into an equal number of the preferred shares of the other relevant Series.
(d) Holders of Series 30 Non-cumulative 5-Year Rate Reset Preferred Shares will have the option to convert shares into an equal number of Series 31 non-cumulative floating rate preferred shares on April 26, 2020, and on April 26 every five years thereafter. With regulatory
approval, the Series 30 preferred shares may be redeemed by the Bank on April 26, 2020, and every five years thereafter, respectively, at $25.00 per share, together with declared and unpaid dividends. With regulatory approval, the Series 31 Non-cumulative Preferred Shares
may be redeemed by the Bank at (i) $25.00 together with all declared and unpaid dividends to the date fixed for redemption in the case of redemptions on April 26, 2020 and on April 26 every five years thereafter, or (ii) $25.50 together with all declared and unpaid dividends to
the date fixed for redemption on any other date after April 26, 2015.
206 | 2019 Scotiabank Annual Report
Consolidated Financial Statements
(e) Holders of Series 32 Non-cumulative 5-Year Rate Reset Preferred Shares will have the option to convert shares into an equal number of Series 33 non-cumulative floating rate preferred shares on February 2, 2021 and on February 2 every five years thereafter. With regulatory
approval, the Series 32 preferred shares may be redeemed by the Bank on February 2, 2021, and every five years thereafter, at $25.00 per share, together with declared and unpaid dividends. With regulatory approval, the Series 33 Non-cumulative Preferred Shares may be
redeemed by the Bank at (i) $25.00 together with all declared and unpaid dividends to the date fixed for redemption in the case of redemptions on February 2, 2021 and on February 2 every five years thereafter, or (ii) $25.50 together with all declared and unpaid dividends to
the date fixed redemption on any other date after February 2, 2016.
(f) These preferred shares contain NVCC provisions necessary for the shares to qualify as Tier 1 regulatory capital under Basel III.
(g) Holders of Series 34 Non-cumulative 5-Year Rate Reset Preferred Shares (NVCC) will have the option to convert shares into an equal number of Series 35 non-cumulative floating rate preferred shares on April 26, 2021, and on April 26 every five years thereafter. With
regulatory approval, Series 34 preferred shares may be redeemed by the Bank on April 26, 2021 and every five years thereafter, and for Series 35 preferred shares (NVCC), if applicable, on April 26, 2026 and every five years thereafter, at $25.00 per share, together with
declared and unpaid dividends.
(h) Holders of Series 36 Non-cumulative 5-Year Rate Reset Preferred Shares (NVCC) will have the option to convert shares into an equal number of Series 37 non-cumulative floating rate preferred shares (NVCC) on July 26, 2021, and on July 26 every five years thereafter. With
regulatory approval, Series 36 preferred shares may be redeemed by the Bank on July 26, 2021 and every five years thereafter, and for Series 37 preferred shares, if applicable, on July 26, 2026 and every five years thereafter, at $25.00 per share, together with declared and
unpaid dividends.
(i) Holders of Series 38 Non-cumulative 5-Year Rate Reset Preferred Shares (NVCC) will have the option to convert shares into an equal number of Series 39 non-cumulative floating rate preferred shares (NVCC) on January 27, 2022, and on January 27 every five years
thereafter. With regulatory approval, Series 38 preferred shares may be redeemed by the Bank on January 27, 2022 and every five years thereafter, and for Series 39 preferred shares, if applicable, on January 27, 2027 and every five years thereafter, at $25.00 per share,
together with declared and unpaid dividends.
(j) Holders of Series 40 Non-cumulative 5-Year Rate Reset Preferred Shares (NVCC) will have the option to convert shares into an equal number of Series 41 non-cumulative floating rate preferred shares (NVCC) on January 27, 2024, and on January 27 every five years
thereafter. With regulatory approval, Series 40 preferred shares may be redeemed by the Bank on January 27, 2024 and every five years thereafter, and for Series 41 preferred shares, if applicable, on January 27, 2029 and every five years thereafter, at $25.00 per share,
together with declared and unpaid dividends.
Under NVCC provisions, NVCC preferred shares Series 34, 35, 36, 37, 38, 39, 40 and 41, if outstanding, are convertible into a variable number of common shares if OSFI
announces that the Bank has ceased, or is about to cease, to be viable, or if a federal or provincial government in Canada publicly announces that the Bank has accepted or
agreed to accept a capital injection, or equivalent support, from the federal government or any provincial government or political subdivision or agent thereof without which
the Bank would have been determined by OSFI to be non-viable. If such a conversion were to occur, NVCC preferred shares Series 34, 35, 36, 37, 38, 39, 40 and 41, if
outstanding, would be converted into common shares pursuant to an automatic conversion formula defined as 100% times the share value of $25.00 plus declared and
unpaid dividends divided by the conversion price. The conversion price is based on the greater of: (i) a floor price of $5.00 or (subject to adjustments in certain events as set
out in their respective prospectus supplements), and (ii) the current market price of the Bank’s common shares at the time of the trigger event (10-day weighted average).
Other equity instruments
Other equity instruments of $1,560 million (US$1.25 billion) include USD-denominated perpetual fixed to floating rate non-cumulative subordinated additional Tier 1 capital
securities (NVCC).
The terms of the notes are described below:
• The price per note is USD $1,000, with interest paid semi-annually in arrears at 4.65% per annum, for the initial five years. Thereafter, the interest will reset quarterly
and accrue at a rate per annum equal to three-month LIBOR plus 2.648%.
• While interest is payable on a semi-annual basis for the initial five year period, and quarterly thereafter, the Bank may, at its discretion, with notice, cancel the
payments. If the Bank does not pay the interest in full to the note holders, the Bank will not declare dividends on its common or preferred shares or redeem, purchase
or otherwise retire such shares until the month commencing after the Bank resumes full interest payments on the notes.
• The notes are redeemable at par 5 years after issuance solely at the option of the Bank, or following a regulatory or tax event, as described in the offering documents.
All redemptions are subject to regulatory consent.
• The notes are the Bank’s direct unsecured obligations, ranking subordinate to all of the Bank’s subordinated indebtedness.
• NVCC provisions require the conversion of these capital instruments into a variable number of common shares if OSFI announces that the Bank has ceased, or is
about to cease, to be viable, or if a federal or provincial government in Canada publicly announces that the Bank has accepted or agreed to accept a capital injection,
or equivalent support, from the federal government or any provincial government or political subdivision or agent thereof without which the Bank would have been
determined by OSFI to be non-viable. If such a conversion were to occur, outstanding NVCC subordinated additional Tier 1 capital securities, would be converted into
common shares pursuant to an automatic conversion formula defined as 125% of the par value plus accrued and unpaid interest divided by the conversion price. The
conversion price is based on the greater of: (i) the U.S. dollar equivalent of $5.00 (subject to adjustments in certain events as set out in their respective prospectus
supplements), and (ii) the U.S. dollar equivalent of the current market price of the Bank’s common shares at the time of the trigger event (10-day weighted average).
The U.S. dollar equivalents of the floor price and the current market price are based on the mid-day CAD/USD exchange rate on the day prior to the trigger event.
The notes have been determined to be compound instruments that have both equity and liability features. At inception, the fair value of the liability component is initially
measured with any residual amount assigned to the equity component. On the date of issuance, the Bank has assigned an insignificant value to the liability component of the
notes and, as a result, the proceeds received upon issuance of the notes have been presented as equity. The Bank will continue to monitor events that could impact the
value of the liability component.
During the year ended October 31, 2019, the Bank paid interest of US$58 million (2018 – US$58 million) in respect of these notes.
2019 Scotiabank Annual Report | 207
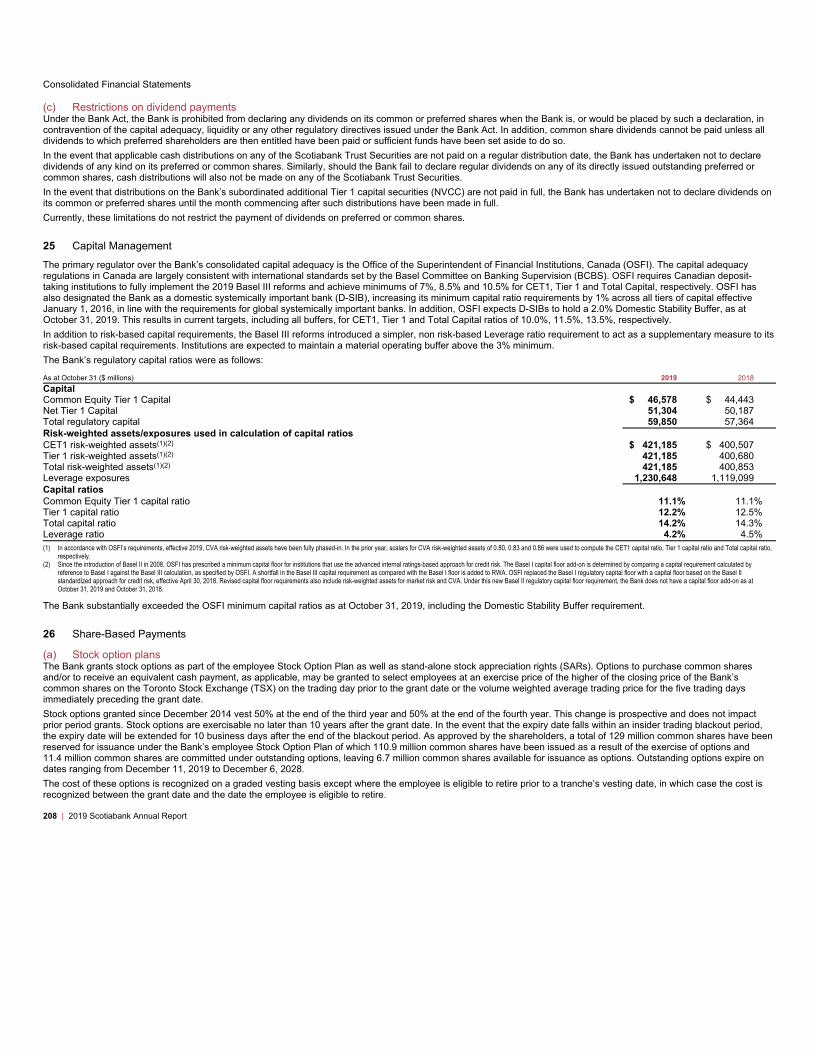
Consolidated Financial Statements
(c) Restrictions on dividend payments
Under the Bank Act, the Bank is prohibited from declaring any dividends on its common or preferred shares when the Bank is, or would be placed by such a declaration, in
contravention of the capital adequacy, liquidity or any other regulatory directives issued under the Bank Act. In addition, common share dividends cannot be paid unless all
dividends to which preferred shareholders are then entitled have been paid or sufficient funds have been set aside to do so.
In the event that applicable cash distributions on any of the Scotiabank Trust Securities are not paid on a regular distribution date, the Bank has undertaken not to declare
dividends of any kind on its preferred or common shares. Similarly, should the Bank fail to declare regular dividends on any of its directly issued outstanding preferred or
common shares, cash distributions will also not be made on any of the Scotiabank Trust Securities.
In the event that distributions on the Bank’s subordinated additional Tier 1 capital securities (NVCC) are not paid in full, the Bank has undertaken not to declare dividends on
its common or preferred shares until the month commencing after such distributions have been made in full.
Currently, these limitations do not restrict the payment of dividends on preferred or common shares.
25 Capital Management
The primary regulator over the Bank’s consolidated capital adequacy is the Office of the Superintendent of Financial Institutions, Canada (OSFI). The capital adequacy
regulations in Canada are largely consistent with international standards set by the Basel Committee on Banking Supervision (BCBS). OSFI requires Canadian deposit-
taking institutions to fully implement the 2019 Basel III reforms and achieve minimums of 7%, 8.5% and 10.5% for CET1, Tier 1 and Total Capital, respectively. OSFI has
also designated the Bank as a domestic systemically important bank (D-SIB), increasing its minimum capital ratio requirements by 1% across all tiers of capital effective
January 1, 2016, in line with the requirements for global systemically important banks. In addition, OSFI expects D-SIBs to hold a 2.0% Domestic Stability Buffer, as at
October 31, 2019. This results in current targets, including all buffers, for CET1, Tier 1 and Total Capital ratios of 10.0%, 11.5%, 13.5%, respectively.
In addition to risk-based capital requirements, the Basel III reforms introduced a simpler, non risk-based Leverage ratio requirement to act as a supplementary measure to its
risk-based capital requirements. Institutions are expected to maintain a material operating buffer above the 3% minimum.
The Bank’s regulatory capital ratios were as follows:
As at October 31 ($ millions) 2019 2018
Capital
Common Equity Tier 1 Capital $ 46,578 $ 44,443
Net Tier 1 Capital 51,304 50,187
Total regulatory capital 59,850 57,364
Risk-weighted assets/exposures used in calculation of capital ratios
CET1 risk-weighted assets(1)(2) $ 421,185 $ 400,507
Tier 1 risk-weighted assets(1)(2) 421,185 400,680
Total risk-weighted assets(1)(2) 421,185 400,853
Leverage exposures 1,230,648 1,119,099
Capital ratios
Common Equity Tier 1 capital ratio 11.1% 11.1%
Tier 1 capital ratio 12.2% 12.5%
Total capital ratio 14.2% 14.3%
Leverage ratio 4.2% 4.5%
(1) In accordance with OSFI’s requirements, effective 2019, CVA risk-weighted assets have been fully phased-in. In the prior year, scalars for CVA risk-weighted assets of 0.80, 0.83 and 0.86 were used to compute the CET1 capital ratio, Tier 1 capital ratio and Total capital ratio,
respectively.
(2) Since the introduction of Basel II in 2008, OSFI has prescribed a minimum capital floor for institutions that use the advanced internal ratings-based approach for credit risk. The Basel I capital floor add-on is determined by comparing a capital requirement calculated by
reference to Basel I against the Basel III calculation, as specified by OSFI. A shortfall in the Basel III capital requirement as compared with the Basel I floor is added to RWA. OSFI replaced the Basel I regulatory capital floor with a capital floor based on the Basel II
standardized approach for credit risk, effective April 30, 2018. Revised capital floor requirements also include risk-weighted assets for market risk and CVA. Under this new Basel II regulatory capital floor requirement, the Bank does not have a capital floor add-on as at
October 31, 2019 and October 31, 2018.
The Bank substantially exceeded the OSFI minimum capital ratios as at October 31, 2019, including the Domestic Stability Buffer requirement.
26 Share-Based Payments
(a) Stock option plans
The Bank grants stock options as part of the employee Stock Option Plan as well as stand-alone stock appreciation rights (SARs). Options to purchase common shares
and/or to receive an equivalent cash payment, as applicable, may be granted to select employees at an exercise price of the higher of the closing price of the Bank’s
common shares on the Toronto Stock Exchange (TSX) on the trading day prior to the grant date or the volume weighted average trading price for the five trading days
immediately preceding the grant date.
Stock options granted since December 2014 vest 50% at the end of the third year and 50% at the end of the fourth year. This change is prospective and does not impact
prior period grants. Stock options are exercisable no later than 10 years after the grant date. In the event that the expiry date falls within an insider trading blackout period,
the expiry date will be extended for 10 business days after the end of the blackout period. As approved by the shareholders, a total of 129 million common shares have been
reserved for issuance under the Bank’s employee Stock Option Plan of which 110.9 million common shares have been issued as a result of the exercise of options and
11.4 million common shares are committed under outstanding options, leaving 6.7 million common shares available for issuance as options. Outstanding options expire on
dates ranging from December 11, 2019 to December 6, 2028.
The cost of these options is recognized on a graded vesting basis except where the employee is eligible to retire prior to a tranche’s vesting date, in which case the cost is
recognized between the grant date and the date the employee is eligible to retire.
208 | 2019 Scotiabank Annual Report

Consolidated Financial Statements
The Stock Option Plan includes:
• Tandem stock appreciation rights
Employee stock options granted between December 2, 2005 to November 1, 2009 have Tandem SARs, which provide the employee the choice to either exercise the
stock option for shares, or to exercise the Tandem SARs and thereby receive the intrinsic value of the stock option in cash. As at October 31, 2019, nil Tandem SARs
were outstanding (2018 – 3,900).
The share-based payment liability recognized for vested Tandem SARs as at October 31, 2019 was nil (2018 – $0.1 million). The corresponding intrinsic value of this
liability as at October 31, 2019 was nil (2018 – $0.2 million).
In 2019, a benefit of $0.1 million (2018 – $0.6 million expense) was recorded in salaries and employee benefits in the Consolidated Statement of Income.
• Stock options
Employee stock options granted beginning December 2009 are equity-classified stock options which call for settlement in shares and do not have Tandem SAR
features.
The amount recorded in equity – other reserves for vested stock options as at October 31, 2019 was $133 million (2018 – $164 million).
In 2019, an expense of $6 million (2018 – $7 million) was recorded in salaries and employee benefits in the Consolidated Statement of Income. As at October 31,
2019, future unrecognized compensation cost for non-vested stock options was $5 million (2018 – $4 million) which is to be recognized over a weighted-average
period of 2.11 years (2018 – 2.07 years).
• Stock appreciation rights
Stand-alone SARs are granted instead of stock options to select employees in countries where local laws may restrict the Bank from issuing shares. When a SAR is
exercised, the Bank pays the appreciation amount in cash equal to the rise in the market price of the Bank’s common shares since the grant date.
During fiscal 2019, 70,554 SARs were granted (2018 – 53,056) and as at October 31, 2019, 805,481 SARs were outstanding (2018 – 1,073,146), of which 801,116
SARs were vested (2018 – 1,032,495).
The share-based payment liability recognized for vested SARs as at October 31, 2019 was $10 million (2018 – $14 million). The corresponding intrinsic value of this
liability as at October 31, 2019 was $16 million (2018 – $27 million).
In 2019, an expense of $2 million (2018 – benefit of $3 million) was recorded in salaries and employee benefits in the Consolidated Statement of Income. This
expense is net of gains arising from derivatives used to manage the volatility of share-based payments of $5 million (2018 – $8 million losses).
Determination of fair values
The share-based payment liability and corresponding expense for SARs and options with Tandem SAR features were quantified using the Black-Scholes option pricing
model with the following assumptions and resulting fair value per award:
As at October 31 2019 2018
Assumptions
Risk-free interest rate% 1.48% - 1.88% 2.26% - 2.34%
Expected dividend yield 4.50% 4.58%
Expected price volatility 13.00% - 26.10% 13.75% - 28.12%
Expected life of option 0.00 - 4.74 years 0.00 - 4.58 years
Fair value
Weighted-average fair value $ 13.49 $ 13.39
The share-based payment expense for stock options, i.e., without Tandem SAR features, was quantified using the Black-Scholes option pricing model on the date of grant.
The fiscal 2019 and 2018 stock option grants were fair valued using the following weighted-average assumptions and resulting fair value per award:
2019 Grant 2018 Grant
Assumptions
Risk-free interest rate % 2.01% 1.73%
Expected dividend yield 4.49% 3.62%
Expected price volatility 15.64% 15.86%
Expected life of option 6.67 years 6.64 years
Fair value
Weighted-average fair value $ 5.01 $ 7.68
The risk-free rate is based on Canadian treasury bond rates interpolated for the maturity equal to the expected life until exercise of the options. Expected dividend yield is
based on historical dividend payout. Expected price volatility is determined based on the historical volatility for compensation. For accounting purposes, an average of the
market consensus implied volatility for traded options on our common shares and the historical volatility is used.
2019 Scotiabank Annual Report | 209
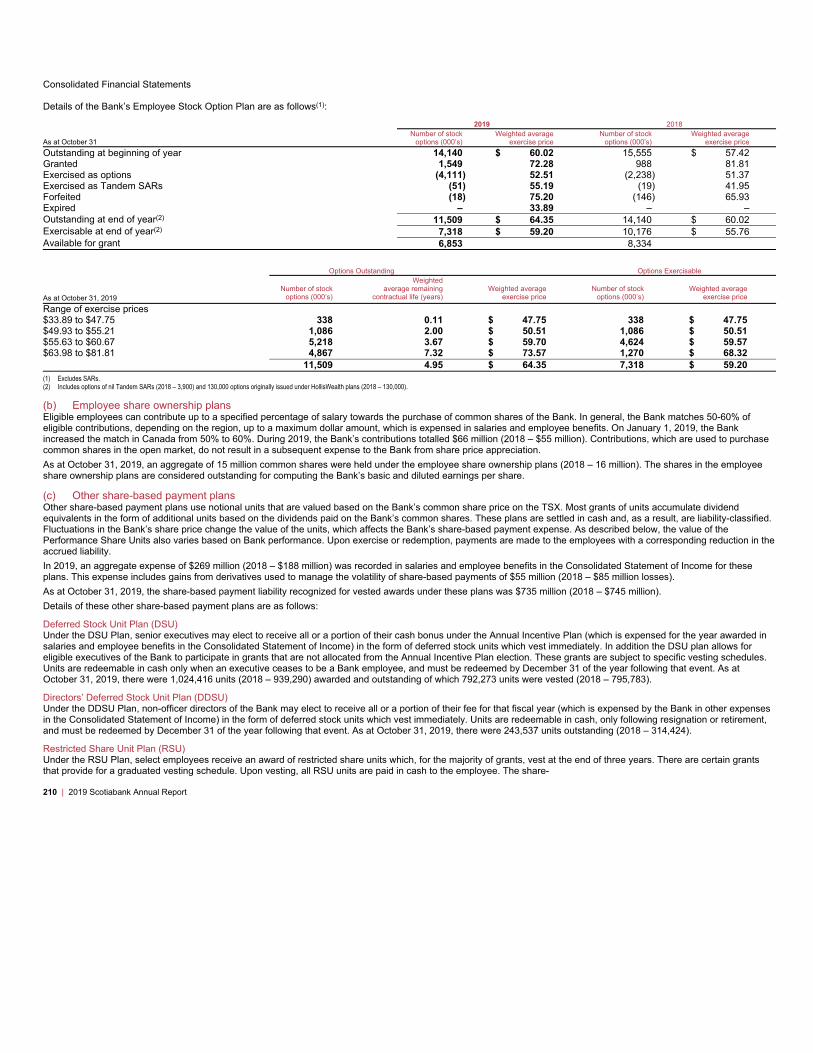
Consolidated Financial Statements
Details of the Bank’s Employee Stock Option Plan are as follows(1):
2019 2018
As at October 31
Number of stock
options (000’s)
Weighted average
exercise price
Number of stock
options (000’s)
Weighted average
exercise price
Outstanding at beginning of year 14,140 $ 60.02 15,555 $ 57.42
Granted 1,549 72.28 988 81.81
Exercised as options (4,111) 52.51 (2,238) 51.37
Exercised as Tandem SARs (51) 55.19 (19) 41.95
Forfeited (18) 75.20 (146) 65.93
Expired – 33.89 – –
Outstanding at end of year(2)11,509 $ 64.35 14,140 $ 60.02
Exercisable at end of year(2)7,318 $ 59.20 10,176 $ 55.76
Available for grant 6,853 8,334
Options Outstanding Options Exercisable
As at October 31, 2019
Number of stock
options (000’s)
Weighted
average remaining
contractual life (years)
Weighted average
exercise price
Number of stock
options (000’s)
Weighted average
exercise price
Range of exercise prices
$33.89 to $47.75 338 0.11 $ 47.75 338 $ 47.75
$49.93 to $55.21 1,086 2.00 $ 50.51 1,086 $ 50.51
$55.63 to $60.67 5,218 3.67 $ 59.70 4,624 $ 59.57
$63.98 to $81.81 4,867 7.32 $ 73.57 1,270 $ 68.32
11,509 4.95 $ 64.35 7,318 $ 59.20
(1) Excludes SARs.
(2) Includes options of nil Tandem SARs (2018 – 3,900) and 130,000 options originally issued under HollisWealth plans (2018 – 130,000).
(b) Employee share ownership plans
Eligible employees can contribute up to a specified percentage of salary towards the purchase of common shares of the Bank. In general, the Bank matches 50-60% of
eligible contributions, depending on the region, up to a maximum dollar amount, which is expensed in salaries and employee benefits. On January 1, 2019, the Bank
increased the match in Canada from 50% to 60%. During 2019, the Bank’s contributions totalled $66 million (2018 – $55 million). Contributions, which are used to purchase
common shares in the open market, do not result in a subsequent expense to the Bank from share price appreciation.
As at October 31, 2019, an aggregate of 15 million common shares were held under the employee share ownership plans (2018 – 16 million). The shares in the employee
share ownership plans are considered outstanding for computing the Bank’s basic and diluted earnings per share.
(c) Other share-based payment plans
Other share-based payment plans use notional units that are valued based on the Bank’s common share price on the TSX. Most grants of units accumulate dividend
equivalents in the form of additional units based on the dividends paid on the Bank’s common shares. These plans are settled in cash and, as a result, are liability-classified.
Fluctuations in the Bank’s share price change the value of the units, which affects the Bank’s share-based payment expense. As described below, the value of the
Performance Share Units also varies based on Bank performance. Upon exercise or redemption, payments are made to the employees with a corresponding reduction in the
accrued liability.
In 2019, an aggregate expense of $269 million (2018 – $188 million) was recorded in salaries and employee benefits in the Consolidated Statement of Income for these
plans. This expense includes gains from derivatives used to manage the volatility of share-based payments of $55 million (2018 – $85 million losses).
As at October 31, 2019, the share-based payment liability recognized for vested awards under these plans was $735 million (2018 – $745 million).
Details of these other share-based payment plans are as follows:
Deferred Stock Unit Plan (DSU)
Under the DSU Plan, senior executives may elect to receive all or a portion of their cash bonus under the Annual Incentive Plan (which is expensed for the year awarded in
salaries and employee benefits in the Consolidated Statement of Income) in the form of deferred stock units which vest immediately. In addition the DSU plan allows for
eligible executives of the Bank to participate in grants that are not allocated from the Annual Incentive Plan election. These grants are subject to specific vesting schedules.
Units are redeemable in cash only when an executive ceases to be a Bank employee, and must be redeemed by December 31 of the year following that event. As at
October 31, 2019, there were 1,024,416 units (2018 – 939,290) awarded and outstanding of which 792,273 units were vested (2018 – 795,783).
Directors’ Deferred Stock Unit Plan (DDSU)
Under the DDSU Plan, non-officer directors of the Bank may elect to receive all or a portion of their fee for that fiscal year (which is expensed by the Bank in other expenses
in the Consolidated Statement of Income) in the form of deferred stock units which vest immediately. Units are redeemable in cash, only following resignation or retirement,
and must be redeemed by December 31 of the year following that event. As at October 31, 2019, there were 243,537 units outstanding (2018 – 314,424).
Restricted Share Unit Plan (RSU)
Under the RSU Plan, select employees receive an award of restricted share units which, for the majority of grants, vest at the end of three years. There are certain grants
that provide for a graduated vesting schedule. Upon vesting, all RSU units are paid in cash to the employee. The share-
210 | 2019 Scotiabank Annual Report
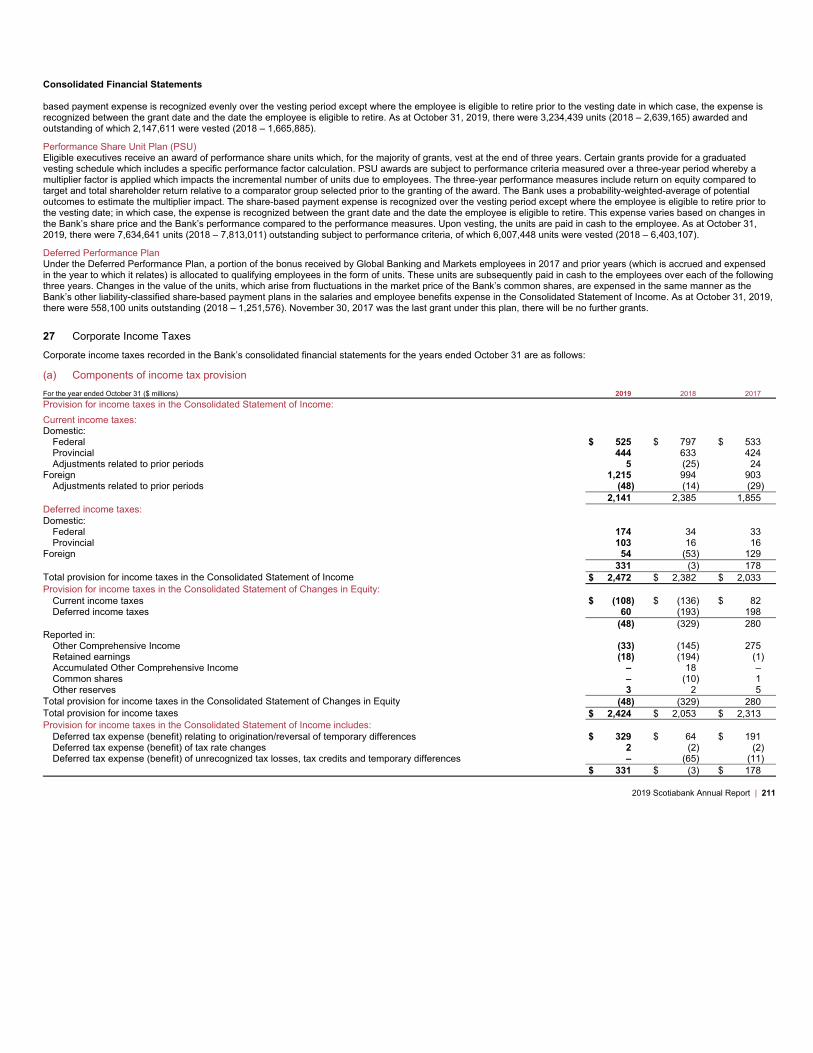
Consolidated Financial Statements
based payment expense is recognized evenly over the vesting period except where the employee is eligible to retire prior to the vesting date in which case, the expense is
recognized between the grant date and the date the employee is eligible to retire. As at October 31, 2019, there were 3,234,439 units (2018 – 2,639,165) awarded and
outstanding of which 2,147,611 were vested (2018 – 1,665,885).
Performance Share Unit Plan (PSU)
Eligible executives receive an award of performance share units which, for the majority of grants, vest at the end of three years. Certain grants provide for a graduated
vesting schedule which includes a specific performance factor calculation. PSU awards are subject to performance criteria measured over a three-year period whereby a
multiplier factor is applied which impacts the incremental number of units due to employees. The three-year performance measures include return on equity compared to
target and total shareholder return relative to a comparator group selected prior to the granting of the award. The Bank uses a probability-weighted-average of potential
outcomes to estimate the multiplier impact. The share-based payment expense is recognized over the vesting period except where the employee is eligible to retire prior to
the vesting date; in which case, the expense is recognized between the grant date and the date the employee is eligible to retire. This expense varies based on changes in
the Bank’s share price and the Bank’s performance compared to the performance measures. Upon vesting, the units are paid in cash to the employee. As at October 31,
2019, there were 7,634,641 units (2018 – 7,813,011) outstanding subject to performance criteria, of which 6,007,448 units were vested (2018 – 6,403,107).
Deferred Performance Plan
Under the Deferred Performance Plan, a portion of the bonus received by Global Banking and Markets employees in 2017 and prior years (which is accrued and expensed
in the year to which it relates) is allocated to qualifying employees in the form of units. These units are subsequently paid in cash to the employees over each of the following
three years. Changes in the value of the units, which arise from fluctuations in the market price of the Bank’s common shares, are expensed in the same manner as the
Bank’s other liability-classified share-based payment plans in the salaries and employee benefits expense in the Consolidated Statement of Income. As at October 31, 2019,
there were 558,100 units outstanding (2018 – 1,251,576). November 30, 2017 was the last grant under this plan, there will be no further grants.
27 Corporate Income Taxes
Corporate income taxes recorded in the Bank’s consolidated financial statements for the years ended October 31 are as follows:
(a) Components of income tax provision
For the year ended October 31 ($ millions) 2019 2018 2017
Provision for income taxes in the Consolidated Statement of Income:
Current income taxes:
Domestic:
Federal $ 525 $ 797 $ 533
Provincial 444 633 424
Adjustments related to prior periods 5 (25) 24
Foreign 1,215 994 903
Adjustments related to prior periods (48) (14) (29)
2,141 2,385 1,855
Deferred income taxes:
Domestic:
Federal 174 34 33
Provincial 103 16 16
Foreign 54 (53) 129
331 (3) 178
Total provision for income taxes in the Consolidated Statement of Income $ 2,472 $ 2,382 $ 2,033
Provision for income taxes in the Consolidated Statement of Changes in Equity:
Current income taxes $ (108) $ (136) $ 82
Deferred income taxes 60 (193) 198
(48) (329) 280
Reported in:
Other Comprehensive Income (33) (145) 275
Retained earnings (18) (194) (1)
Accumulated Other Comprehensive Income – 18 –
Common shares – (10) 1
Other reserves 3 2 5
Total provision for income taxes in the Consolidated Statement of Changes in Equity (48) (329) 280
Total provision for income taxes $ 2,424 $ 2,053 $ 2,313
Provision for income taxes in the Consolidated Statement of Income includes:
Deferred tax expense (benefit) relating to origination/reversal of temporary differences $ 329 $ 64 $ 191
Deferred tax expense (benefit) of tax rate changes 2 (2) (2)
Deferred tax expense (benefit) of unrecognized tax losses, tax credits and temporary differences – (65) (11)
$ 331 $ (3) $ 178
2019 Scotiabank Annual Report | 211
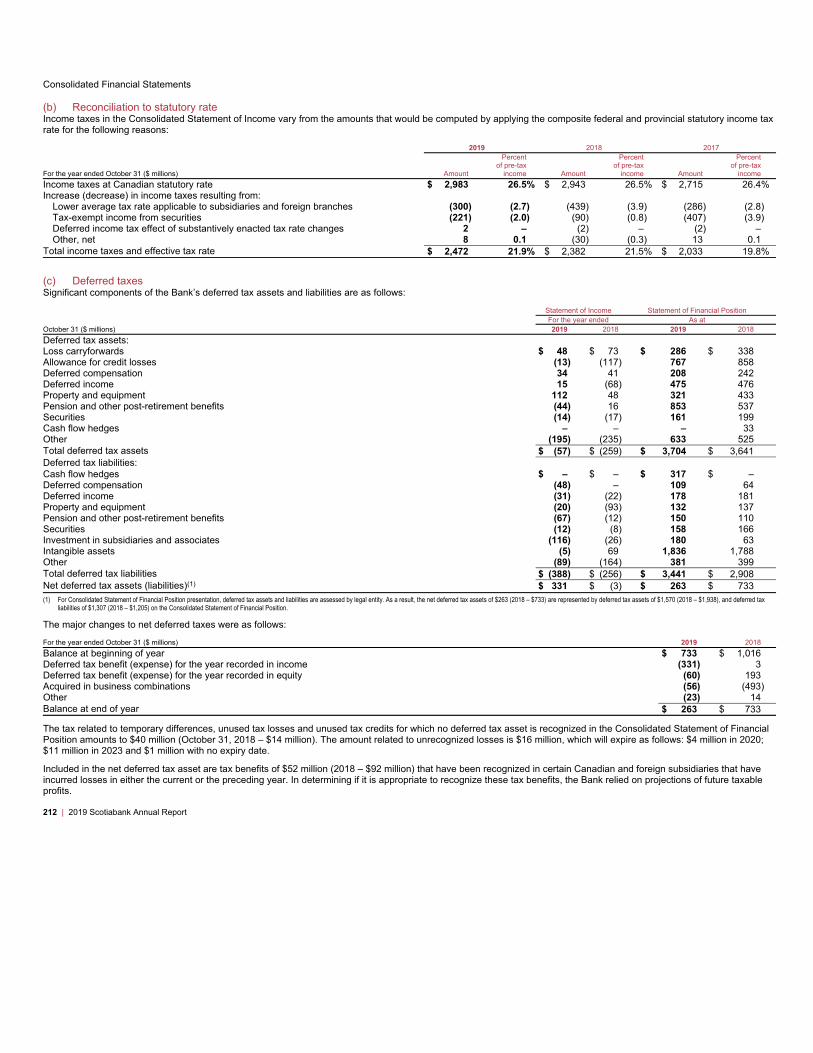
Consolidated Financial Statements
(b) Reconciliation to statutory rate
Income taxes in the Consolidated Statement of Income vary from the amounts that would be computed by applying the composite federal and provincial statutory income tax
rate for the following reasons:
2019 2018 2017
For the year ended October 31 ($ millions) Amount
Percent
of pre-tax
income Amount
Percent
of pre-tax
income Amount
Percent
of pre-tax
income
Income taxes at Canadian statutory rate $ 2,983 26.5% $ 2,943 26.5% $ 2,715 26.4%
Increase (decrease) in income taxes resulting from:
Lower average tax rate applicable to subsidiaries and foreign branches (300) (2.7) (439) (3.9) (286) (2.8)
Tax-exempt income from securities (221) (2.0) (90) (0.8) (407) (3.9)
Deferred income tax effect of substantively enacted tax rate changes 2 – (2) – (2) –
Other, net 8 0.1 (30) (0.3) 13 0.1
Total income taxes and effective tax rate $ 2,472 21.9% $ 2,382 21.5% $ 2,033 19.8%
(c) Deferred taxes
Significant components of the Bank’s deferred tax assets and liabilities are as follows:
Statement of Income Statement of Financial Position
For the year ended As at
October 31 ($ millions) 2019 2018 2019 2018
Deferred tax assets:
Loss carryforwards $ 48 $ 73 $ 286 $ 338
Allowance for credit losses (13) (117) 767 858
Deferred compensation 34 41 208 242
Deferred income 15 (68) 475 476
Property and equipment 112 48 321 433
Pension and other post-retirement benefits (44) 16 853 537
Securities (14) (17) 161 199
Cash flow hedges – – – 33
Other (195) (235) 633 525
Total deferred tax assets $ (57) $ (259) $ 3,704 $ 3,641
Deferred tax liabilities:
Cash flow hedges $ – $ – $ 317 $ –
Deferred compensation (48) – 109 64
Deferred income (31) (22) 178 181
Property and equipment (20) (93) 132 137
Pension and other post-retirement benefits (67) (12) 150 110
Securities (12) (8) 158 166
Investment in subsidiaries and associates (116) (26) 180 63
Intangible assets (5) 69 1,836 1,788
Other (89) (164) 381 399
Total deferred tax liabilities $ (388) $ (256) $ 3,441 $ 2,908
Net deferred tax assets (liabilities)(1)$ 331 $ (3) $ 263 $ 733
(1) For Consolidated Statement of Financial Position presentation, deferred tax assets and liabilities are assessed by legal entity. As a result, the net deferred tax assets of $263 (2018 – $733) are represented by deferred tax assets of $1,570 (2018 – $1,938), and deferred tax
liabilities of $1,307 (2018 – $1,205) on the Consolidated Statement of Financial Position.
The major changes to net deferred taxes were as follows:
For the year ended October 31 ($ millions) 2019 2018
Balance at beginning of year $ 733 $ 1,016
Deferred tax benefit (expense) for the year recorded in income (331) 3
Deferred tax benefit (expense) for the year recorded in equity (60) 193
Acquired in business combinations (56) (493)
Other (23) 14
Balance at end of year $ 263 $ 733
The tax related to temporary differences, unused tax losses and unused tax credits for which no deferred tax asset is recognized in the Consolidated Statement of Financial
Position amounts to $40 million (October 31, 2018 – $14 million). The amount related to unrecognized losses is $16 million, which will expire as follows: $4 million in 2020;
$11 million in 2023 and $1 million with no expiry date.
Included in the net deferred tax asset are tax benefits of $52 million (2018 – $92 million) that have been recognized in certain Canadian and foreign subsidiaries that have
incurred losses in either the current or the preceding year. In determining if it is appropriate to recognize these tax benefits, the Bank relied on projections of future taxable
profits.
212 | 2019 Scotiabank Annual Report

Consolidated Financial Statements
The amount of taxable temporary differences associated with investments in subsidiaries, associates and interests in joint ventures for which deferred tax liabilities have not
been recognized at October 31, 2019 is approximately $36 billion (2018 – $33 billion).
Reassessment of dividend deductions
Since 2016, the Bank has received reassessments totalling $575 million of tax and interest as a result of the Canada Revenue Agency denying the tax deductibility of certain
Canadian dividends received during the 2011-2013 taxation years. In October 2019, the Bank was reassessed for $223 million of tax and interest in respect of certain
Canadian dividends received during the 2014 taxation year. The circumstances of the dividends subject to these reassessments are similar to those prospectively addressed
by rules introduced in 2015 and 2018. The Bank is confident that its tax filing position was appropriate and in accordance with the relevant provisions of the Income Tax Act
(Canada) and intends to vigourously defend its position.
28 Employee Benefits
The Bank sponsors a number of employee benefit plans, including pensions (defined benefit and defined contribution) and other benefit plans (post-retirement benefits and
other long-term employee benefits) for most of its employees globally. The information presented below relates to the Bank’s principal plans; other plans operated by certain
subsidiaries of the Bank are not considered material and are not included in these disclosures.
Global pension plans
The principal pension plans include plans in Canada, the US, Mexico, the UK, Ireland, Jamaica, Trinidad & Tobago and other countries in the Caribbean in which the Bank
operates. The Bank has a strong and well defined governance structure to manage these global obligations. The investment policy for each principal plan is reviewed
periodically and all plans are in good standing with respect to legislation and local regulations.
Actuarial valuations for funding purposes for the Bank’s funded pension plans are conducted as required by applicable legislation. The purpose of the actuarial valuation is to
determine the funded status of the plans on a going-concern and statutory basis and to determine the required contributions. The plans are funded in accordance with
applicable pension legislation and the Bank’s funding policies such that future benefit promises based on plan provisions are well secured. The assumptions used for the
funding valuations are set by independent plan actuaries on the basis of the requirements of the local actuarial standards of practice and statutes.
Scotiabank Pension Plan (Canada)
The most significant pension plan is the Scotiabank Pension Plan (SPP) in Canada, a defined benefit pension plan (which includes an optional defined contribution (DC)
component for employees in Canada hired on or after January 1, 2016) which was recently amended to include a defined contribution pension plan for employees in Canada
hired on or after May 1, 2018 (the defined benefit provision of the pension plan is closed to employees hired on or after May 1, 2018). As the administrator of the SPP, the
Bank has established a well-defined governance structure and policies to maintain compliance with legislative and regulatory requirements under OSFI and the Canada
Revenue Agency. The Bank appoints a number of committees to oversee and make decisions related to the administration of the SPP. Certain committees are also
responsible for the investment of the assets of the SPP Fund and for monitoring the investment managers and performance.
• The Human Resources Committee (HRC) of the Board approves the charter of the Pension Administration and Investment Committee (PAIC), reviews reports, and
approves the investment policy. The HRC also reviews and recommends any amendments to the SPP to the Board of Directors.
• PAIC is responsible for recommending the investment policy to the HRC, for appointing and monitoring investment managers, and for reviewing auditor and actuary
reports. PAIC also monitors the administration of member pension benefits. PAIC has independent member representation on the committee.
• The Scotiabank Master Trust Committee (MTC) invests assets in accordance with the investment policy and all applicable legislation. The MTC assigns specific
mandates to investment managers.
• The Capital Accumulation Plans (CAP) Committee is responsible for the administration and investment of the DC component of the SPP including the selection and
monitoring of investment options available to DC participants.
Actuarial valuations for funding purposes for the SPP are conducted on an annual basis. The most recent funding valuation was conducted as of November 1, 2018.
Contributions are being made to the SPP in accordance with this valuation and are shown in the table in b) below. The assumptions used for the funding valuation are set by
independent plan actuaries on the basis of the requirements of the Canadian Institute of Actuaries and applicable regulation.
Other benefit plans
The principal other benefit plans include plans in Canada, the US, Mexico, Uruguay, the UK, Jamaica, Trinidad & Tobago, Colombia and other countries in the Caribbean in
which the Bank operates. The most significant other benefit plans provided by the Bank are in Canada.
Key assumptions
The financial information reported below in respect of pension and other benefit plans is based on a number of assumptions. The most significant assumption is the discount
rate used to determine the defined benefit obligation, which is set by reference to the yields on high quality corporate bonds that have durations that match the terms of the
Bank’s obligations. Separate discount rates are used to determine the annual benefit expense in Canada and the US. These rates are determined with reference to the
yields on high quality corporate bonds with durations that match the various components of the annual benefit expense. The discount rate used to determine the annual
benefit expense for all other plans continues to be the same as the rate used to determine the defined benefit obligation at the beginning of the period. Other assumptions
set by management are determined in reference to market conditions, plan-level experience, best practices and future expectations. The key weighted-average assumptions
used by the Bank for the measurement of the benefit obligation and benefit expense for all of the Bank’s principal plans are summarized in the table in f) below.
2019 Scotiabank Annual Report | 213
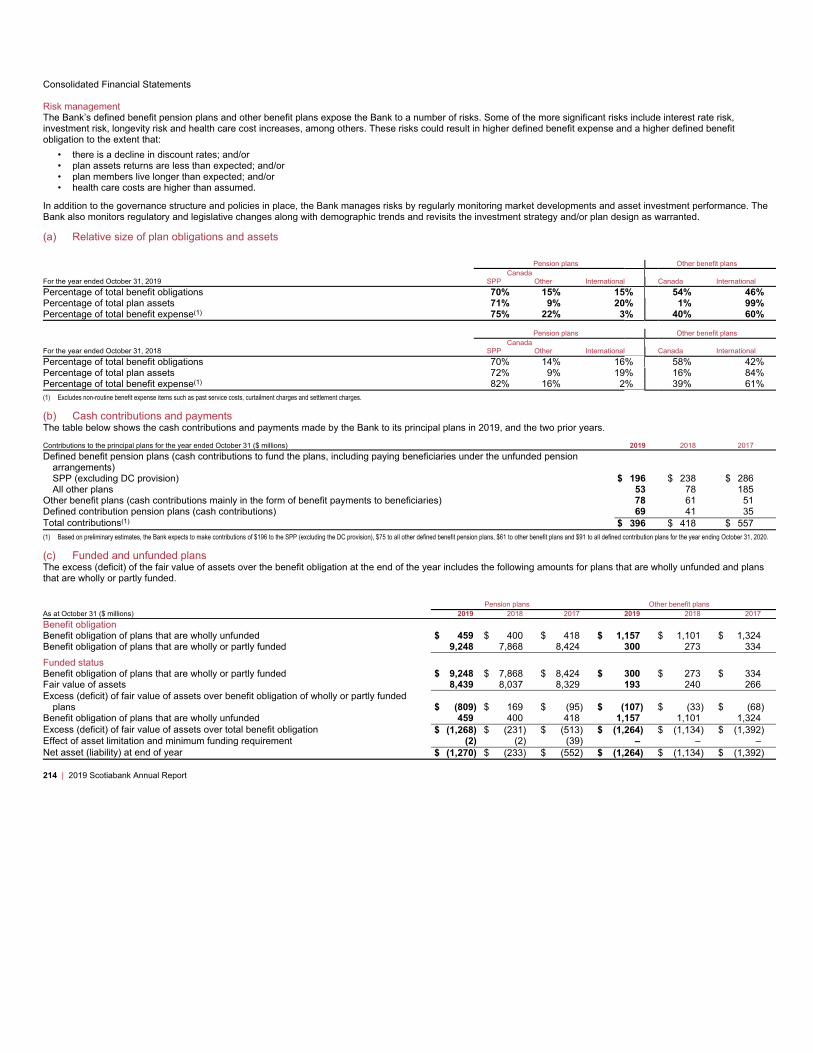
Consolidated Financial Statements
Risk management
The Bank’s defined benefit pension plans and other benefit plans expose the Bank to a number of risks. Some of the more significant risks include interest rate risk,
investment risk, longevity risk and health care cost increases, among others. These risks could result in higher defined benefit expense and a higher defined benefit
obligation to the extent that:
• there is a decline in discount rates; and/or
• plan assets returns are less than expected; and/or
• plan members live longer than expected; and/or
• health care costs are higher than assumed.
In addition to the governance structure and policies in place, the Bank manages risks by regularly monitoring market developments and asset investment performance. The
Bank also monitors regulatory and legislative changes along with demographic trends and revisits the investment strategy and/or plan design as warranted.
(a) Relative size of plan obligations and assets
Pension plans Other benefit plans
Canada
For the year ended October 31, 2019 SPP Other International Canada International
Percentage of total benefit obligations 70% 15% 15% 54% 46%
Percentage of total plan assets 71% 9% 20% 1% 99%
Percentage of total benefit expense(1) 75% 22% 3% 40% 60%
Pension plans Other benefit plans
Canada
For the year ended October 31, 2018 SPP Other International Canada International
Percentage of total benefit obligations 70% 14% 16% 58% 42%
Percentage of total plan assets 72% 9% 19% 16% 84%
Percentage of total benefit expense(1) 82% 16% 2% 39% 61%
(1) Excludes non-routine benefit expense items such as past service costs, curtailment charges and settlement charges.
(b) Cash contributions and payments
The table below shows the cash contributions and payments made by the Bank to its principal plans in 2019, and the two prior years.
Contributions to the principal plans for the year ended October 31 ($ millions) 2019 2018 2017
Defined benefit pension plans (cash contributions to fund the plans, including paying beneficiaries under the unfunded pension
arrangements)
SPP (excluding DC provision) $ 196 $ 238 $ 286
All other plans 53 78 185
Other benefit plans (cash contributions mainly in the form of benefit payments to beneficiaries) 78 61 51
Defined contribution pension plans (cash contributions) 69 41 35
Total contributions(1)$ 396 $ 418 $ 557
(1) Based on preliminary estimates, the Bank expects to make contributions of $196 to the SPP (excluding the DC provision), $75 to all other defined benefit pension plans, $61 to other benefit plans and $91 to all defined contribution plans for the year ending October 31, 2020.
(c) Funded and unfunded plans
The excess (deficit) of the fair value of assets over the benefit obligation at the end of the year includes the following amounts for plans that are wholly unfunded and plans
that are wholly or partly funded.
Pension plans Other benefit plans
As at October 31 ($ millions) 2019 2018 2017 2019 2018 2017
Benefit obligation
Benefit obligation of plans that are wholly unfunded $ 459 $ 400 $ 418 $ 1,157 $ 1,101 $ 1,324
Benefit obligation of plans that are wholly or partly funded 9,248 7,868 8,424 300 273 334
Funded status
Benefit obligation of plans that are wholly or partly funded $ 9,248 $ 7,868 $ 8,424 $ 300 $ 273 $ 334
Fair value of assets 8,439 8,037 8,329 193 240 266
Excess (deficit) of fair value of assets over benefit obligation of wholly or partly funded
plans $ (809) $ 169 $ (95) $ (107) $ (33) $ (68)
Benefit obligation of plans that are wholly unfunded 459 400 418 1,157 1,101 1,324
Excess (deficit) of fair value of assets over total benefit obligation $ (1,268) $ (231) $ (513) $ (1,264) $ (1,134) $ (1,392)
Effect of asset limitation and minimum funding requirement (2) (2) (39) – – –
Net asset (liability) at end of year $ (1,270) $ (233) $ (552) $ (1,264) $ (1,134) $ (1,392)
214 | 2019 Scotiabank Annual Report
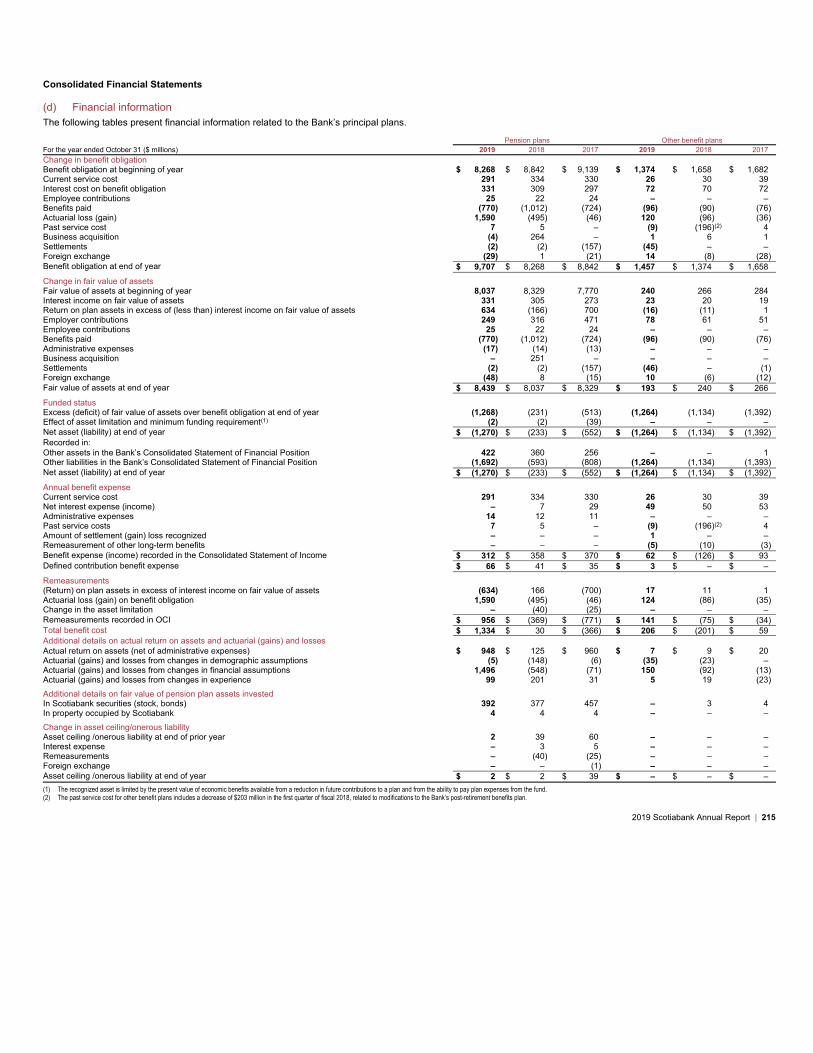
Consolidated Financial Statements
(d) Financial information
The following tables present financial information related to the Bank’s principal plans.
Pension plans Other benefit plans
For the year ended October 31 ($ millions) 2019 2018 2017 2019 2018 2017
Change in benefit obligation
Benefit obligation at beginning of year $ 8,268 $ 8,842 $ 9,139 $ 1,374 $ 1,658 $ 1,682
Current service cost 291 334 330 26 30 39
Interest cost on benefit obligation 331 309 297 72 70 72
Employee contributions 25 22 24 – – –
Benefits paid (770) (1,012) (724) (96) (90) (76)
Actuarial loss (gain) 1,590 (495) (46) 120 (96) (36)
Past service cost 7 5 – (9) (196)(2) 4
Business acquisition (4) 264 – 1 6 1
Settlements (2) (2) (157) (45) – –
Foreign exchange (29) 1 (21) 14 (8) (28)
Benefit obligation at end of year $ 9,707 $ 8,268 $ 8,842 $ 1,457 $ 1,374 $ 1,658
Change in fair value of assets
Fair value of assets at beginning of year 8,037 8,329 7,770 240 266 284
Interest income on fair value of assets 331 305 273 23 20 19
Return on plan assets in excess of (less than) interest income on fair value of assets 634 (166) 700 (16) (11) 1
Employer contributions 249 316 471 78 61 51
Employee contributions 25 22 24 – – –
Benefits paid (770) (1,012) (724) (96) (90) (76)
Administrative expenses (17) (14) (13) – – –
Business acquisition – 251 – – – –
Settlements (2) (2) (157) (46) – (1)
Foreign exchange (48) 8 (15) 10 (6) (12)
Fair value of assets at end of year $ 8,439 $ 8,037 $ 8,329 $ 193 $ 240 $ 266
Funded status
Excess (deficit) of fair value of assets over benefit obligation at end of year (1,268) (231) (513) (1,264) (1,134) (1,392)
Effect of asset limitation and minimum funding requirement(1) (2) (2) (39) – – –
Net asset (liability) at end of year $ (1,270) $ (233) $ (552) $ (1,264) $ (1,134) $ (1,392)
Recorded in:
Other assets in the Bank’s Consolidated Statement of Financial Position 422 360 256 – – 1
Other liabilities in the Bank’s Consolidated Statement of Financial Position (1,692) (593) (808) (1,264) (1,134) (1,393)
Net asset (liability) at end of year $ (1,270) $ (233) $ (552) $ (1,264) $ (1,134) $ (1,392)
Annual benefit expense
Current service cost 291 334 330 26 30 39
Net interest expense (income) – 7 29 49 50 53
Administrative expenses 14 12 11 – – –
Past service costs 7 5 – (9) (196)(2) 4
Amount of settlement (gain) loss recognized – – – 1 – –
Remeasurement of other long-term benefits – – – (5) (10) (3)
Benefit expense (income) recorded in the Consolidated Statement of Income $ 312 $ 358 $ 370 $ 62 $ (126) $ 93
Defined contribution benefit expense $ 66 $ 41 $ 35 $ 3 $ – $ –
Remeasurements
(Return) on plan assets in excess of interest income on fair value of assets (634) 166 (700) 17 11 1
Actuarial loss (gain) on benefit obligation 1,590 (495) (46) 124 (86) (35)
Change in the asset limitation – (40) (25) – – –
Remeasurements recorded in OCI $ 956 $ (369) $ (771) $ 141 $ (75) $ (34)
Total benefit cost $ 1,334 $ 30 $ (366) $ 206 $ (201) $ 59
Additional details on actual return on assets and actuarial (gains) and losses
Actual return on assets (net of administrative expenses) $ 948 $ 125 $ 960 $ 7 $ 9 $ 20
Actuarial (gains) and losses from changes in demographic assumptions (5) (148) (6) (35) (23) –
Actuarial (gains) and losses from changes in financial assumptions 1,496 (548) (71) 150 (92) (13)
Actuarial (gains) and losses from changes in experience 99 201 31 5 19 (23)
Additional details on fair value of pension plan assets invested
In Scotiabank securities (stock, bonds) 392 377 457 – 3 4
In property occupied by Scotiabank 4 4 4 – – –
Change in asset ceiling/onerous liability
Asset ceiling /onerous liability at end of prior year 2 39 60 – – –
Interest expense – 3 5 – – –
Remeasurements – (40) (25) – – –
Foreign exchange – – (1) – – –
Asset ceiling /onerous liability at end of year $ 2 $ 2 $ 39 $ – $ – $ –
(1) The recognized asset is limited by the present value of economic benefits available from a reduction in future contributions to a plan and from the ability to pay plan expenses from the fund.
(2) The past service cost for other benefit plans includes a decrease of $203 million in the first quarter of fiscal 2018, related to modifications to the Bank’s post-retirement benefits plan.
2019 Scotiabank Annual Report | 215
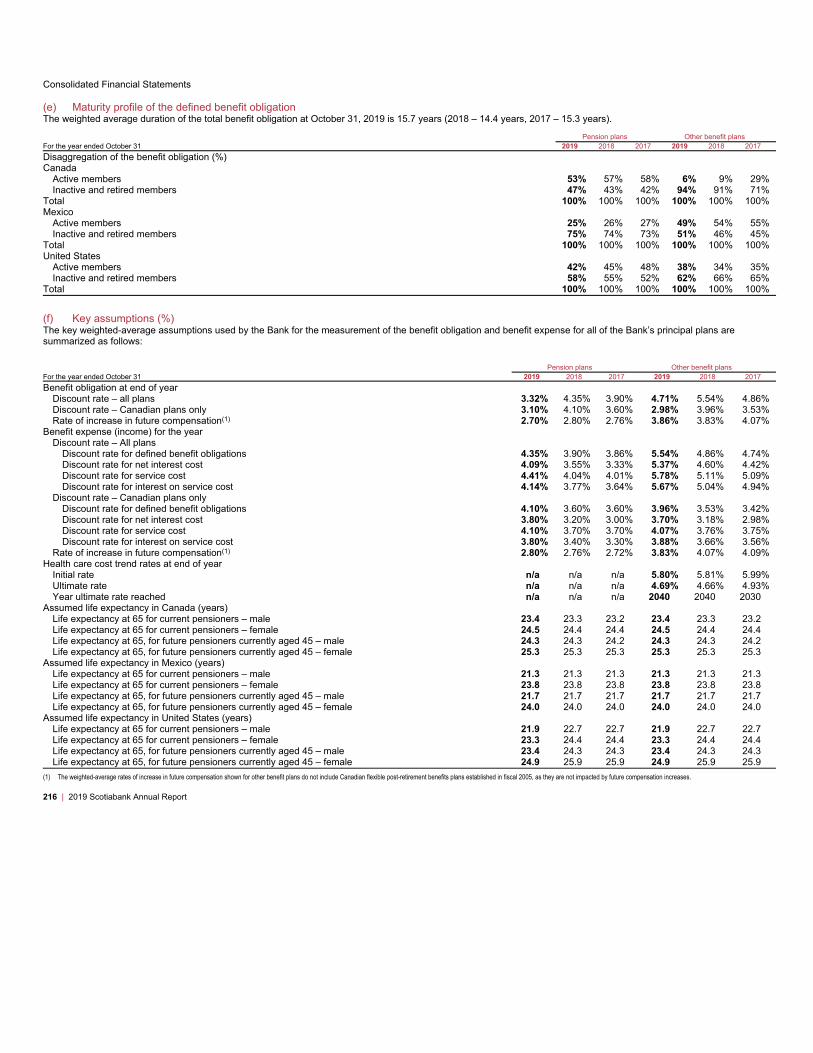
Consolidated Financial Statements
(e) Maturity profile of the defined benefit obligation
The weighted average duration of the total benefit obligation at October 31, 2019 is 15.7 years (2018 – 14.4 years, 2017 – 15.3 years).
Pension plans Other benefit plans
For the year ended October 31 2019 2018 2017 2019 2018 2017
Disaggregation of the benefit obligation (%)
Canada
Active members 53% 57% 58% 6% 9% 29%
Inactive and retired members 47% 43% 42% 94% 91% 71%
Total 100% 100% 100% 100% 100% 100%
Mexico
Active members 25% 26% 27% 49% 54% 55%
Inactive and retired members 75% 74% 73% 51% 46% 45%
Total 100% 100% 100% 100% 100% 100%
United States
Active members 42% 45% 48% 38% 34% 35%
Inactive and retired members 58% 55% 52% 62% 66% 65%
Total 100% 100% 100% 100% 100% 100%
(f) Key assumptions (%)
The key weighted-average assumptions used by the Bank for the measurement of the benefit obligation and benefit expense for all of the Bank’s principal plans are
summarized as follows:
Pension plans Other benefit plans
For the year ended October 31 2019 2018 2017 2019 2018 2017
Benefit obligation at end of year
Discount rate – all plans 3.32% 4.35% 3.90% 4.71% 5.54% 4.86%
Discount rate – Canadian plans only 3.10% 4.10% 3.60% 2.98% 3.96% 3.53%
Rate of increase in future compensation(1) 2.70% 2.80% 2.76% 3.86% 3.83% 4.07%
Benefit expense (income) for the year
Discount rate – All plans
Discount rate for defined benefit obligations 4.35% 3.90% 3.86% 5.54% 4.86% 4.74%
Discount rate for net interest cost 4.09% 3.55% 3.33% 5.37% 4.60% 4.42%
Discount rate for service cost 4.41% 4.04% 4.01% 5.78% 5.11% 5.09%
Discount rate for interest on service cost 4.14% 3.77% 3.64% 5.67% 5.04% 4.94%
Discount rate – Canadian plans only
Discount rate for defined benefit obligations 4.10% 3.60% 3.60% 3.96% 3.53% 3.42%
Discount rate for net interest cost 3.80% 3.20% 3.00% 3.70% 3.18% 2.98%
Discount rate for service cost 4.10% 3.70% 3.70% 4.07% 3.76% 3.75%
Discount rate for interest on service cost 3.80% 3.40% 3.30% 3.88% 3.66% 3.56%
Rate of increase in future compensation(1) 2.80% 2.76% 2.72% 3.83% 4.07% 4.09%
Health care cost trend rates at end of year
Initial rate n/a n/a n/a 5.80% 5.81% 5.99%
Ultimate rate n/a n/a n/a 4.69% 4.66% 4.93%
Year ultimate rate reached n/a n/a n/a 2040 2040 2030
Assumed life expectancy in Canada (years)
Life expectancy at 65 for current pensioners – male 23.4 23.3 23.2 23.4 23.3 23.2
Life expectancy at 65 for current pensioners – female 24.5 24.4 24.4 24.5 24.4 24.4
Life expectancy at 65, for future pensioners currently aged 45 – male 24.3 24.3 24.2 24.3 24.3 24.2
Life expectancy at 65, for future pensioners currently aged 45 – female 25.3 25.3 25.3 25.3 25.3 25.3
Assumed life expectancy in Mexico (years)
Life expectancy at 65 for current pensioners – male 21.3 21.3 21.3 21.3 21.3 21.3
Life expectancy at 65 for current pensioners – female 23.8 23.8 23.8 23.8 23.8 23.8
Life expectancy at 65, for future pensioners currently aged 45 – male 21.7 21.7 21.7 21.7 21.7 21.7
Life expectancy at 65, for future pensioners currently aged 45 – female 24.0 24.0 24.0 24.0 24.0 24.0
Assumed life expectancy in United States (years)
Life expectancy at 65 for current pensioners – male 21.9 22.7 22.7 21.9 22.7 22.7
Life expectancy at 65 for current pensioners – female 23.3 24.4 24.4 23.3 24.4 24.4
Life expectancy at 65, for future pensioners currently aged 45 – male 23.4 24.3 24.3 23.4 24.3 24.3
Life expectancy at 65, for future pensioners currently aged 45 – female 24.9 25.9 25.9 24.9 25.9 25.9
(1) The weighted-average rates of increase in future compensation shown for other benefit plans do not include Canadian flexible post-retirement benefits plans established in fiscal 2005, as they are not impacted by future compensation increases.
216 | 2019 Scotiabank Annual Report
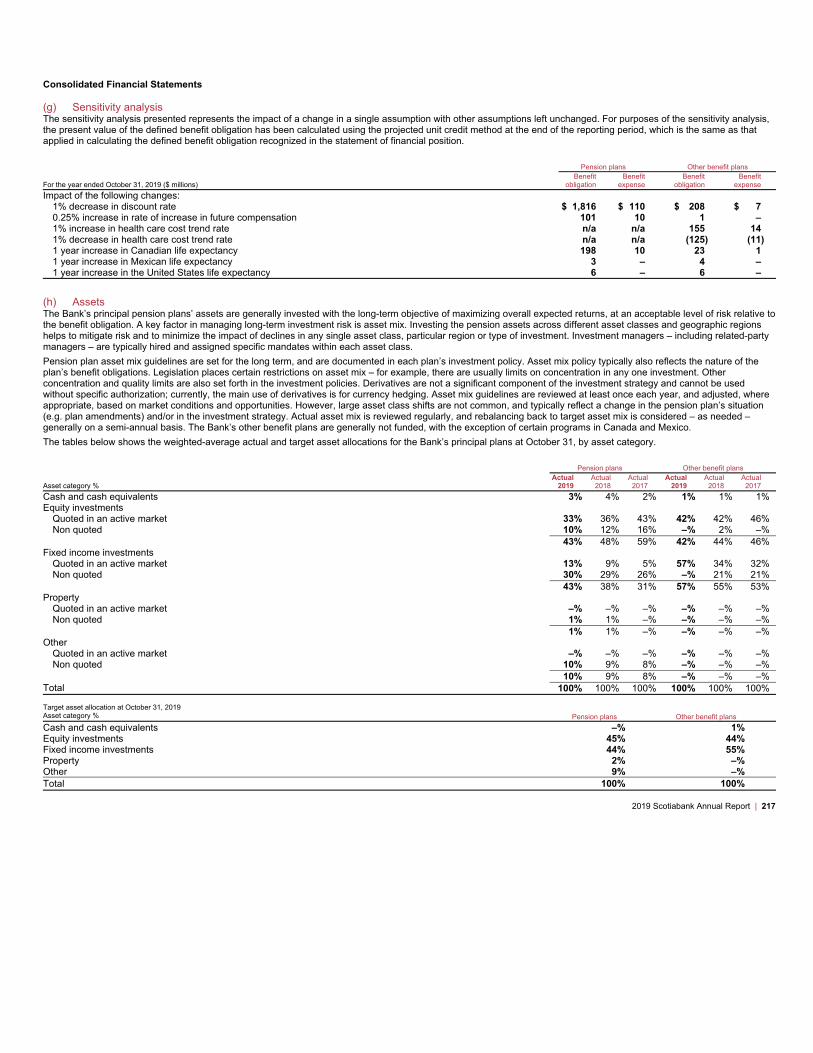
Consolidated Financial Statements
(g) Sensitivity analysis
The sensitivity analysis presented represents the impact of a change in a single assumption with other assumptions left unchanged. For purposes of the sensitivity analysis,
the present value of the defined benefit obligation has been calculated using the projected unit credit method at the end of the reporting period, which is the same as that
applied in calculating the defined benefit obligation recognized in the statement of financial position.
Pension plans Other benefit plans
For the year ended October 31, 2019 ($ millions)
Benefit
obligation
Benefit
expense
Benefit
obligation
Benefit
expense
Impact of the following changes:
1% decrease in discount rate $ 1,816 $ 110 $ 208 $ 7
0.25% increase in rate of increase in future compensation 101 10 1 –
1% increase in health care cost trend rate n/a n/a 155 14
1% decrease in health care cost trend rate n/a n/a (125) (11)
1 year increase in Canadian life expectancy 198 10 23 1
1 year increase in Mexican life expectancy 3 – 4 –
1 year increase in the United States life expectancy 6 – 6 –
(h) Assets
The Bank’s principal pension plans’ assets are generally invested with the long-term objective of maximizing overall expected returns, at an acceptable level of risk relative to
the benefit obligation. A key factor in managing long-term investment risk is asset mix. Investing the pension assets across different asset classes and geographic regions
helps to mitigate risk and to minimize the impact of declines in any single asset class, particular region or type of investment. Investment managers – including related-party
managers – are typically hired and assigned specific mandates within each asset class.
Pension plan asset mix guidelines are set for the long term, and are documented in each plan’s investment policy. Asset mix policy typically also reflects the nature of the
plan’s benefit obligations. Legislation places certain restrictions on asset mix – for example, there are usually limits on concentration in any one investment. Other
concentration and quality limits are also set forth in the investment policies. Derivatives are not a significant component of the investment strategy and cannot be used
without specific authorization; currently, the main use of derivatives is for currency hedging. Asset mix guidelines are reviewed at least once each year, and adjusted, where
appropriate, based on market conditions and opportunities. However, large asset class shifts are not common, and typically reflect a change in the pension plan’s situation
(e.g. plan amendments) and/or in the investment strategy. Actual asset mix is reviewed regularly, and rebalancing back to target asset mix is considered – as needed –
generally on a semi-annual basis. The Bank’s other benefit plans are generally not funded, with the exception of certain programs in Canada and Mexico.
The tables below shows the weighted-average actual and target asset allocations for the Bank’s principal plans at October 31, by asset category.
Pension plans Other benefit plans
Asset category %
Actual
2019
Actual
2018
Actual
2017
Actual
2019
Actual
2018
Actual
2017
Cash and cash equivalents 3% 4% 2% 1% 1% 1%
Equity investments
Quoted in an active market 33% 36% 43% 42% 42% 46%
Non quoted 10% 12% 16% –% 2% –%
43% 48% 59% 42% 44% 46%
Fixed income investments
Quoted in an active market 13% 9% 5% 57% 34% 32%
Non quoted 30% 29% 26% –% 21% 21%
43% 38% 31% 57% 55% 53%
Property
Quoted in an active market –% –% –% –% –% –%
Non quoted 1% 1% –% –% –% –%
1% 1% –% –% –% –%
Other
Quoted in an active market –% –% –% –% –% –%
Non quoted 10% 9% 8% –% –% –%
10% 9% 8% –% –% –%
Total 100% 100% 100% 100% 100% 100%
Target asset allocation at October 31, 2019
Asset category % Pension plans Other benefit plans
Cash and cash equivalents –% 1%
Equity investments 45% 44%
Fixed income investments 44% 55%
Property 2% –%
Other 9% –%
Total 100% 100%
2019 Scotiabank Annual Report | 217
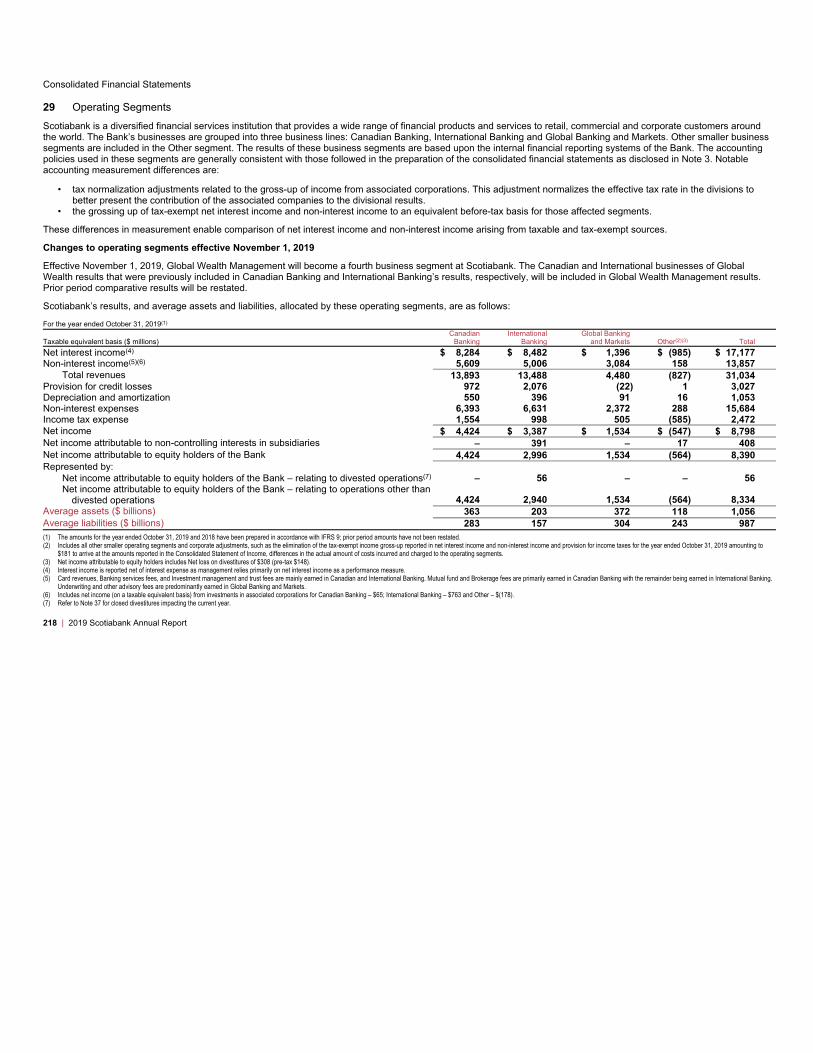
Consolidated Financial Statements
29 Operating Segments
Scotiabank is a diversified financial services institution that provides a wide range of financial products and services to retail, commercial and corporate customers around
the world. The Bank’s businesses are grouped into three business lines: Canadian Banking, International Banking and Global Banking and Markets. Other smaller business
segments are included in the Other segment. The results of these business segments are based upon the internal financial reporting systems of the Bank. The accounting
policies used in these segments are generally consistent with those followed in the preparation of the consolidated financial statements as disclosed in Note 3. Notable
accounting measurement differences are:
• tax normalization adjustments related to the gross-up of income from associated corporations. This adjustment normalizes the effective tax rate in the divisions to
better present the contribution of the associated companies to the divisional results.
• the grossing up of tax-exempt net interest income and non-interest income to an equivalent before-tax basis for those affected segments.
These differences in measurement enable comparison of net interest income and non-interest income arising from taxable and tax-exempt sources.
Changes to operating segments effective November 1, 2019
Effective November 1, 2019, Global Wealth Management will become a fourth business segment at Scotiabank. The Canadian and International businesses of Global
Wealth results that were previously included in Canadian Banking and International Banking’s results, respectively, will be included in Global Wealth Management results.
Prior period comparative results will be restated.
Scotiabank’s results, and average assets and liabilities, allocated by these operating segments, are as follows:
For the year ended October 31, 2019(1)
Taxable equivalent basis ($ millions)
Canadian
Banking
International
Banking
Global Banking
and Markets Other(2)(3) Total
Net interest income(4) $ 8,284 $ 8,482 $ 1,396 $ (985) $ 17,177
Non-interest income(5)(6) 5,609 5,006 3,084 158 13,857
Total revenues 13,893 13,488 4,480 (827) 31,034
Provision for credit losses 972 2,076 (22) 1 3,027
Depreciation and amortization 550 396 91 16 1,053
Non-interest expenses 6,393 6,631 2,372 288 15,684
Income tax expense 1,554 998 505 (585) 2,472
Net income $ 4,424 $ 3,387 $ 1,534 $ (547) $ 8,798
Net income attributable to non-controlling interests in subsidiaries – 391 – 17 408
Net income attributable to equity holders of the Bank 4,424 2,996 1,534 (564) 8,390
Represented by:
Net income attributable to equity holders of the Bank – relating to divested operations(7) – 56 – – 56
Net income attributable to equity holders of the Bank – relating to operations other than
divested operations 4,424 2,940 1,534 (564) 8,334
Average assets ($ billions) 363 203 372 118 1,056
Average liabilities ($ billions) 283 157 304 243 987
(1) The amounts for the year ended October 31, 2019 and 2018 have been prepared in accordance with IFRS 9; prior period amounts have not been restated.
(2) Includes all other smaller operating segments and corporate adjustments, such as the elimination of the tax-exempt income gross-up reported in net interest income and non-interest income and provision for income taxes for the year ended October 31, 2019 amounting to
$181 to arrive at the amounts reported in the Consolidated Statement of Income, differences in the actual amount of costs incurred and charged to the operating segments.
(3) Net income attributable to equity holders includes Net loss on divestitures of $308 (pre-tax $148).
(4) Interest income is reported net of interest expense as management relies primarily on net interest income as a performance measure.
(5) Card revenues, Banking services fees, and Investment management and trust fees are mainly earned in Canadian and International Banking. Mutual fund and Brokerage fees are primarily earned in Canadian Banking with the remainder being earned in International Banking.
Underwriting and other advisory fees are predominantly earned in Global Banking and Markets.
(6) Includes net income (on a taxable equivalent basis) from investments in associated corporations for Canadian Banking – $65; International Banking – $763 and Other – $(178).
(7) Refer to Note 37 for closed divestitures impacting the current year.
218 | 2019 Scotiabank Annual Report
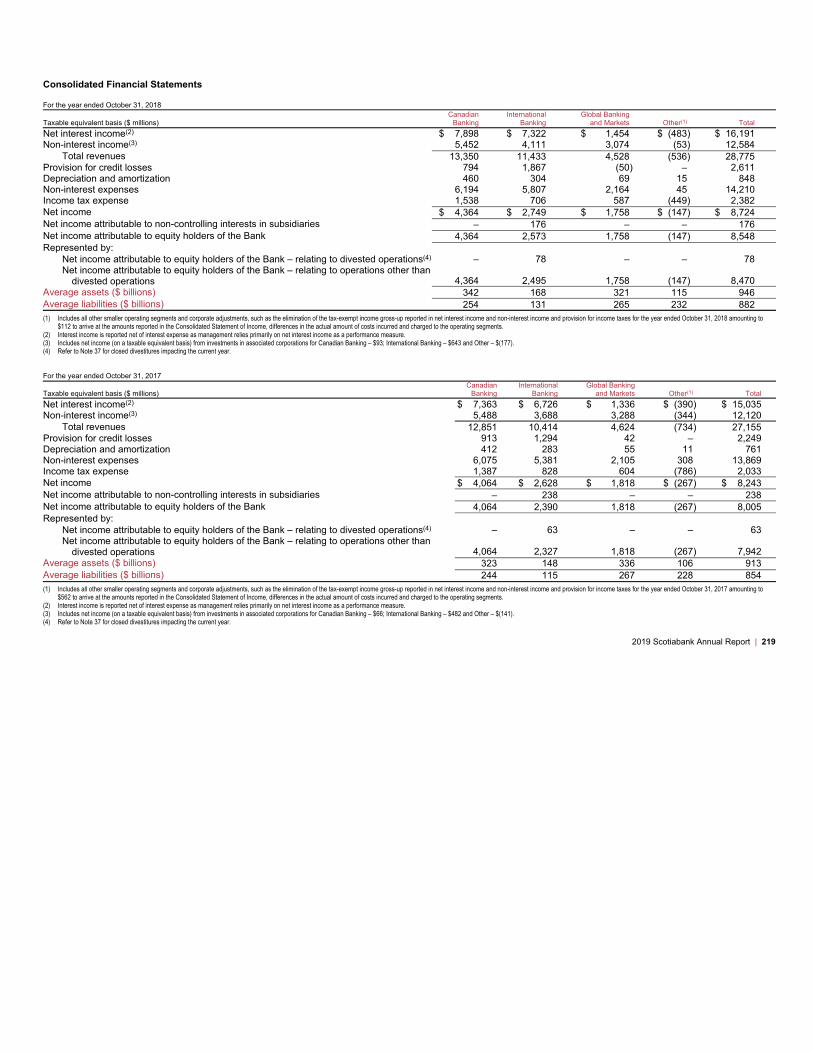
Consolidated Financial Statements
For the year ended October 31, 2018
Taxable equivalent basis ($ millions)
Canadian
Banking
International
Banking
Global Banking
and Markets Other(1) Total
Net interest income(2) $ 7,898 $ 7,322 $ 1,454 $ (483) $ 16,191
Non-interest income(3) 5,452 4,111 3,074 (53) 12,584
Total revenues 13,350 11,433 4,528 (536) 28,775
Provision for credit losses 794 1,867 (50) – 2,611
Depreciation and amortization 460 304 69 15 848
Non-interest expenses 6,194 5,807 2,164 45 14,210
Income tax expense 1,538 706 587 (449) 2,382
Net income $ 4,364 $ 2,749 $ 1,758 $ (147) $ 8,724
Net income attributable to non-controlling interests in subsidiaries – 176 – – 176
Net income attributable to equity holders of the Bank 4,364 2,573 1,758 (147) 8,548
Represented by:
Net income attributable to equity holders of the Bank – relating to divested operations(4) – 78 – – 78
Net income attributable to equity holders of the Bank – relating to operations other than
divested operations 4,364 2,495 1,758 (147) 8,470
Average assets ($ billions) 342 168 321 115 946
Average liabilities ($ billions) 254 131 265 232 882
(1) Includes all other smaller operating segments and corporate adjustments, such as the elimination of the tax-exempt income gross-up reported in net interest income and non-interest income and provision for income taxes for the year ended October 31, 2018 amounting to
$112 to arrive at the amounts reported in the Consolidated Statement of Income, differences in the actual amount of costs incurred and charged to the operating segments.
(2) Interest income is reported net of interest expense as management relies primarily on net interest income as a performance measure.
(3) Includes net income (on a taxable equivalent basis) from investments in associated corporations for Canadian Banking – $93; International Banking – $643 and Other – $(177).
(4) Refer to Note 37 for closed divestitures impacting the current year.
For the year ended October 31, 2017
Taxable equivalent basis ($ millions)
Canadian
Banking
International
Banking
Global Banking
and Markets Other(1) Total
Net interest income(2) $ 7,363 $ 6,726 $ 1,336 $ (390) $ 15,035
Non-interest income(3) 5,488 3,688 3,288 (344) 12,120
Total revenues 12,851 10,414 4,624 (734) 27,155
Provision for credit losses 913 1,294 42 – 2,249
Depreciation and amortization 412 283 55 11 761
Non-interest expenses 6,075 5,381 2,105 308 13,869
Income tax expense 1,387 828 604 (786) 2,033
Net income $ 4,064 $ 2,628 $ 1,818 $ (267) $ 8,243
Net income attributable to non-controlling interests in subsidiaries – 238 – – 238
Net income attributable to equity holders of the Bank 4,064 2,390 1,818 (267) 8,005
Represented by:
Net income attributable to equity holders of the Bank – relating to divested operations(4) – 63 – – 63
Net income attributable to equity holders of the Bank – relating to operations other than
divested operations 4,064 2,327 1,818 (267) 7,942
Average assets ($ billions) 323 148 336 106 913
Average liabilities ($ billions) 244 115 267 228 854
(1) Includes all other smaller operating segments and corporate adjustments, such as the elimination of the tax-exempt income gross-up reported in net interest income and non-interest income and provision for income taxes for the year ended October 31, 2017 amounting to
$562 to arrive at the amounts reported in the Consolidated Statement of Income, differences in the actual amount of costs incurred and charged to the operating segments.
(2) Interest income is reported net of interest expense as management relies primarily on net interest income as a performance measure.
(3) Includes net income (on a taxable equivalent basis) from investments in associated corporations for Canadian Banking – $66; International Banking – $482 and Other – $(141).
(4) Refer to Note 37 for closed divestitures impacting the current year.
2019 Scotiabank Annual Report | 219

Consolidated Financial Statements
Geographical segmentation
The following table summarizes the Bank’s financial results by geographic region. Revenues and expenses which have not been allocated back to specific operating
business lines are reflected in corporate adjustments.
For the year ended October 31,
2019 ($ millions)(1)(2) Canada
United
States Mexico Peru Chile Colombia
Caribbean and
Central America
Other
International Total
Net interest income $ 7,630 $ 720 $ 1,684 $ 1,576 $ 1,613 $ 1,017 $ 2,143 $ 794 $ 17,177
Non-interest income(2) 7,435 1,189 671 790 806 603 1,007 1,356 13,857
Total revenues(3) 15,065 1,909 2,355 2,366 2,419 1,620 3,150 2,150 31,034
Provision for credit losses 981 (16) 335 523 436 362 352 54 3,027
Non-interest expenses 8,261 870 1,306 846 1,166 919 1,931 1,438 16,737
Income tax expense 952 267 121 248 185 106 319 274 2,472
Subtotal 4,871 788 593 749 632 233 548 384 8,798
Net income attributable to non-controlling interests
in subsidiaries 18 – 14 (11) 179 107 101 – 408
Net income attributable to equity holders of the
Bank $ 4,853 $ 788 $ 579 $ 760 $ 453 $ 126 $ 447 $ 384 $ 8,390
Total average assets ($ billions) $ 607 $ 149 $ 37 $ 28 $ 51 $ 13 $ 42 $ 129 $ 1,056
(1) The amounts for the year ended October 31, 2019 and 2018 have been prepared in accordance with IFRS 9; prior period amounts have not been restated.
(2) Includes net income from investments in associated corporations for Canada – $65; Peru – $7, Caribbean and Central America – $69, and Other International – $688.
(3) Revenues are attributed to countries based on where services are performed or assets are recorded.
For the year ended October 31, 2018
($ millions)(1)(3) Canada
United
States Mexico Peru Chile Colombia
Caribbean and
Central America
Other
International Total
Net interest income $ 7,780 $ 691 $ 1,561 $ 1,378 $ 1,117 $ 839 $ 2,028 $ 797 $ 16,191
Non-interest income(1) 6,805 843 613 662 565 484 968 1,644 12,584
Total revenues(2)14,585 1,534 2,174 2,040 1,682 1,323 2,996 2,441 28,775
Provision for credit losses 802 (34) 239 351 498 511 211 33 2,611
Non-interest expenses 7,683 701 1,196 770 837 723 1,795 1,353 15,058
Income tax expense 1,310 220 76 235 51 39 175 276 2,382
Subtotal 4,790 647 663 684 296 50 815 779 8,724
Net income attributable to non-controlling interests in
subsidiaries – – 17 12 28 16 102 1 176
Net income attributable to equity holders of the Bank $ 4,790 $ 647 $ 646 $ 672 $ 268 $ 34 $ 713 $ 778 $ 8,548
Total average assets ($ billions) $ 565 $ 119 $ 32 $ 24 $ 33 $ 12 $ 40 $ 121 $ 946
(1) Includes net income from investments in associated corporations for Canada – $93, Peru – $9, Caribbean and Central America – $58, and Other International – $576.
(2) Revenues are attributed to countries based on where services are performed or assets are recorded.
(3) Prior period amounts have been restated to conform with current period presentation.
220 | 2019 Scotiabank Annual Report
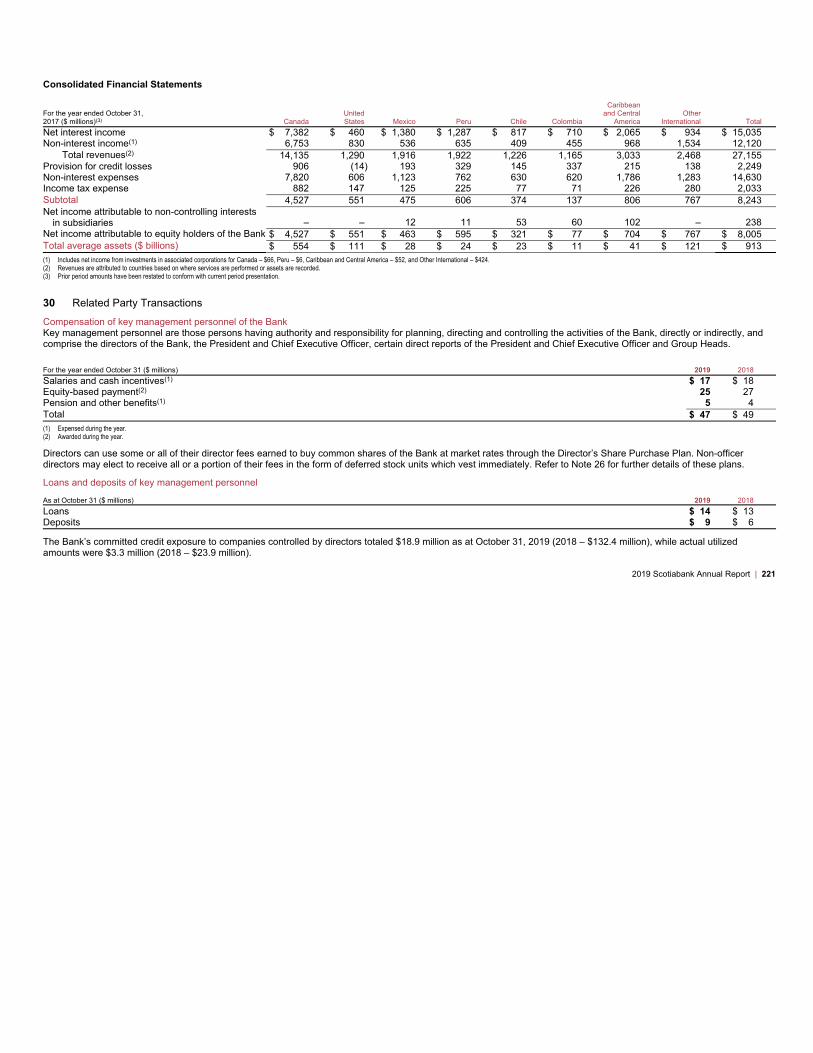
Consolidated Financial Statements
For the year ended October 31,
2017 ($ millions)(3) Canada
United
States Mexico Peru Chile Colombia
Caribbean
and Central
America
Other
International Total
Net interest income $ 7,382 $ 460 $ 1,380 $ 1,287 $ 817 $ 710 $ 2,065 $ 934 $ 15,035
Non-interest income(1) 6,753 830 536 635 409 455 968 1,534 12,120
Total revenues(2) 14,135 1,290 1,916 1,922 1,226 1,165 3,033 2,468 27,155
Provision for credit losses 906 (14) 193 329 145 337 215 138 2,249
Non-interest expenses 7,820 606 1,123 762 630 620 1,786 1,283 14,630
Income tax expense 882 147 125 225 77 71 226 280 2,033
Subtotal 4,527 551 475 606 374 137 806 767 8,243
Net income attributable to non-controlling interests
in subsidiaries – – 12 11 53 60 102 – 238
Net income attributable to equity holders of the Bank $ 4,527 $ 551 $ 463 $ 595 $ 321 $ 77 $ 704 $ 767 $ 8,005
Total average assets ($ billions) $ 554 $ 111 $ 28 $ 24 $ 23 $ 11 $ 41 $ 121 $ 913
(1) Includes net income from investments in associated corporations for Canada – $66, Peru – $6, Caribbean and Central America – $52, and Other International – $424.
(2) Revenues are attributed to countries based on where services are performed or assets are recorded.
(3) Prior period amounts have been restated to conform with current period presentation.
30 Related Party Transactions
Compensation of key management personnel of the Bank
Key management personnel are those persons having authority and responsibility for planning, directing and controlling the activities of the Bank, directly or indirectly, and
comprise the directors of the Bank, the President and Chief Executive Officer, certain direct reports of the President and Chief Executive Officer and Group Heads.
For the year ended October 31 ($ millions) 2019 2018
Salaries and cash incentives(1) $ 17 $ 18
Equity-based payment(2) 25 27
Pension and other benefits(1) 5 4
Total $ 47 $ 49
(1) Expensed during the year.
(2) Awarded during the year.
Directors can use some or all of their director fees earned to buy common shares of the Bank at market rates through the Director’s Share Purchase Plan. Non-officer
directors may elect to receive all or a portion of their fees in the form of deferred stock units which vest immediately. Refer to Note 26 for further details of these plans.
Loans and deposits of key management personnel
As at October 31 ($ millions) 2019 2018
Loans $ 14 $ 13
Deposits $ 9 $ 6
The Bank’s committed credit exposure to companies controlled by directors totaled $18.9 million as at October 31, 2019 (2018 – $132.4 million), while actual utilized
amounts were $3.3 million (2018 – $23.9 million).
2019 Scotiabank Annual Report | 221

Consolidated Financial Statements
Transactions with associates and joint ventures
In the ordinary course of business, the Bank provides normal banking services and enters into transactions with its associated and other related corporations on terms
similar to those offered to non-related parties. If these transactions are eliminated on consolidation, they are not disclosed as related party transactions. Transactions
between the Bank and its associated companies and joint ventures also qualify as related party transactions and were recorded as follows:
As at and for the year ended October 31 ($ millions) 2019 2018 2017
Net income / (loss) $ (68) $ (64) $ (46)
Loans 327 702 703
Deposits 194 151 217
Guarantees and commitments 16 123 114
Scotiabank principal pension plan
The Bank manages assets of $4.1 billion (2018 – $3.8 billion) which is a portion of the Scotiabank principal pension plan assets and earned $7.2 million (2018 – $5.0 million)
in fees.
222 | 2019 Scotiabank Annual Report
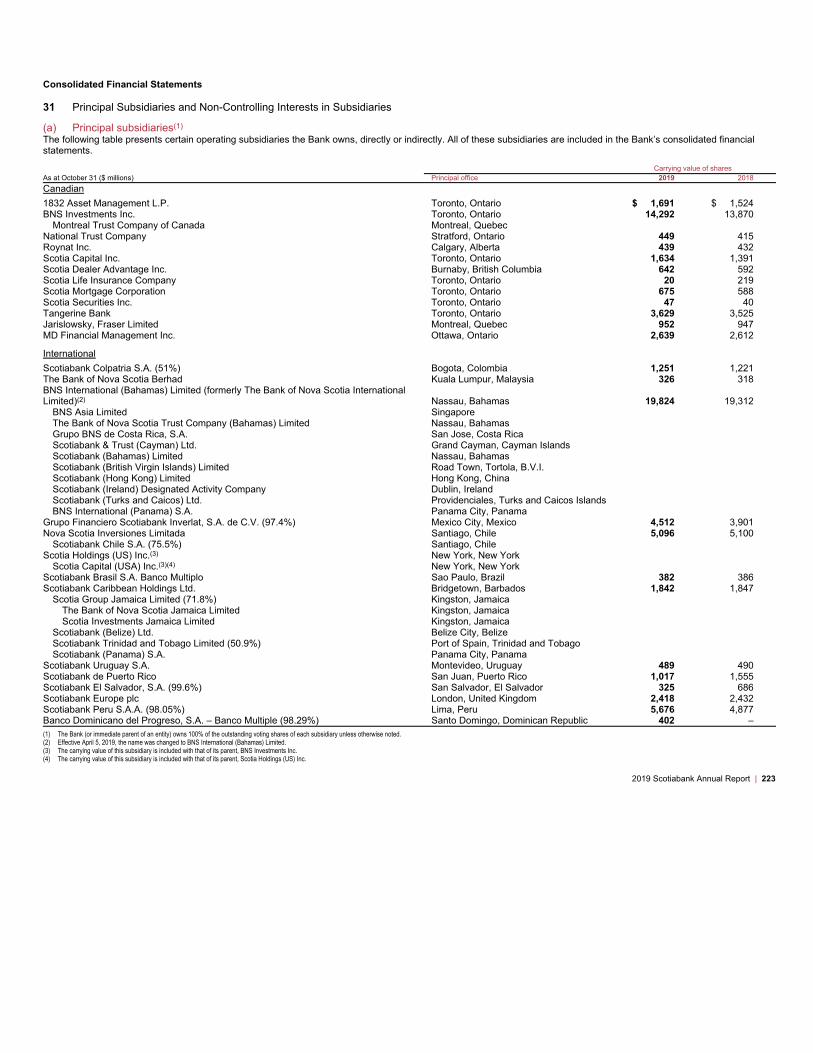
Consolidated Financial Statements
31 Principal Subsidiaries and Non-Controlling Interests in Subsidiaries
(a) Principal subsidiaries(1)
The following table presents certain operating subsidiaries the Bank owns, directly or indirectly. All of these subsidiaries are included in the Bank’s consolidated financial
statements.
Carrying value of shares
As at October 31 ($ millions) Principal office 2019 2018
Canadian
1832 Asset Management L.P. Toronto, Ontario $ 1,691 $ 1,524
BNS Investments Inc. Toronto, Ontario 14,292 13,870
Montreal Trust Company of Canada Montreal, Quebec
National Trust Company Stratford, Ontario 449 415
Roynat Inc. Calgary, Alberta 439 432
Scotia Capital Inc. Toronto, Ontario 1,634 1,391
Scotia Dealer Advantage Inc. Burnaby, British Columbia 642 592
Scotia Life Insurance Company Toronto, Ontario 20 219
Scotia Mortgage Corporation Toronto, Ontario 675 588
Scotia Securities Inc. Toronto, Ontario 47 40
Tangerine Bank Toronto, Ontario 3,629 3,525
Jarislowsky, Fraser Limited Montreal, Quebec 952 947
MD Financial Management Inc. Ottawa, Ontario 2,639 2,612
International
Scotiabank Colpatria S.A. (51%) Bogota, Colombia 1,251 1,221
The Bank of Nova Scotia Berhad Kuala Lumpur, Malaysia 326 318
BNS International (Bahamas) Limited (formerly The Bank of Nova Scotia International
Limited)(2) Nassau, Bahamas 19,824 19,312
BNS Asia Limited Singapore
The Bank of Nova Scotia Trust Company (Bahamas) Limited Nassau, Bahamas
Grupo BNS de Costa Rica, S.A. San Jose, Costa Rica
Scotiabank & Trust (Cayman) Ltd. Grand Cayman, Cayman Islands
Scotiabank (Bahamas) Limited Nassau, Bahamas
Scotiabank (British Virgin Islands) Limited Road Town, Tortola, B.V.I.
Scotiabank (Hong Kong) Limited Hong Kong, China
Scotiabank (Ireland) Designated Activity Company Dublin, Ireland
Scotiabank (Turks and Caicos) Ltd. Providenciales, Turks and Caicos Islands
BNS International (Panama) S.A. Panama City, Panama
Grupo Financiero Scotiabank Inverlat, S.A. de C.V. (97.4%) Mexico City, Mexico 4,512 3,901
Nova Scotia Inversiones Limitada Santiago, Chile 5,096 5,100
Scotiabank Chile S.A. (75.5%) Santiago, Chile
Scotia Holdings (US) Inc.(3) New York, New York
Scotia Capital (USA) Inc.(3)(4) New York, New York
Scotiabank Brasil S.A. Banco Multiplo Sao Paulo, Brazil 382 386
Scotiabank Caribbean Holdings Ltd. Bridgetown, Barbados 1,842 1,847
Scotia Group Jamaica Limited (71.8%) Kingston, Jamaica
The Bank of Nova Scotia Jamaica Limited Kingston, Jamaica
Scotia Investments Jamaica Limited Kingston, Jamaica
Scotiabank (Belize) Ltd. Belize City, Belize
Scotiabank Trinidad and Tobago Limited (50.9%) Port of Spain, Trinidad and Tobago
Scotiabank (Panama) S.A. Panama City, Panama
Scotiabank Uruguay S.A. Montevideo, Uruguay 489 490
Scotiabank de Puerto Rico San Juan, Puerto Rico 1,017 1,555
Scotiabank El Salvador, S.A. (99.6%) San Salvador, El Salvador 325 686
Scotiabank Europe plc London, United Kingdom 2,418 2,432
Scotiabank Peru S.A.A. (98.05%) Lima, Peru 5,676 4,877
Banco Dominicano del Progreso, S.A. – Banco Multiple (98.29%) Santo Domingo, Dominican Republic 402 –
(1) The Bank (or immediate parent of an entity) owns 100% of the outstanding voting shares of each subsidiary unless otherwise noted.
(2) Effective April 5, 2019, the name was changed to BNS International (Bahamas) Limited.
(3) The carrying value of this subsidiary is included with that of its parent, BNS Investments Inc.
(4) The carrying value of this subsidiary is included with that of its parent, Scotia Holdings (US) Inc.
2019 Scotiabank Annual Report | 223
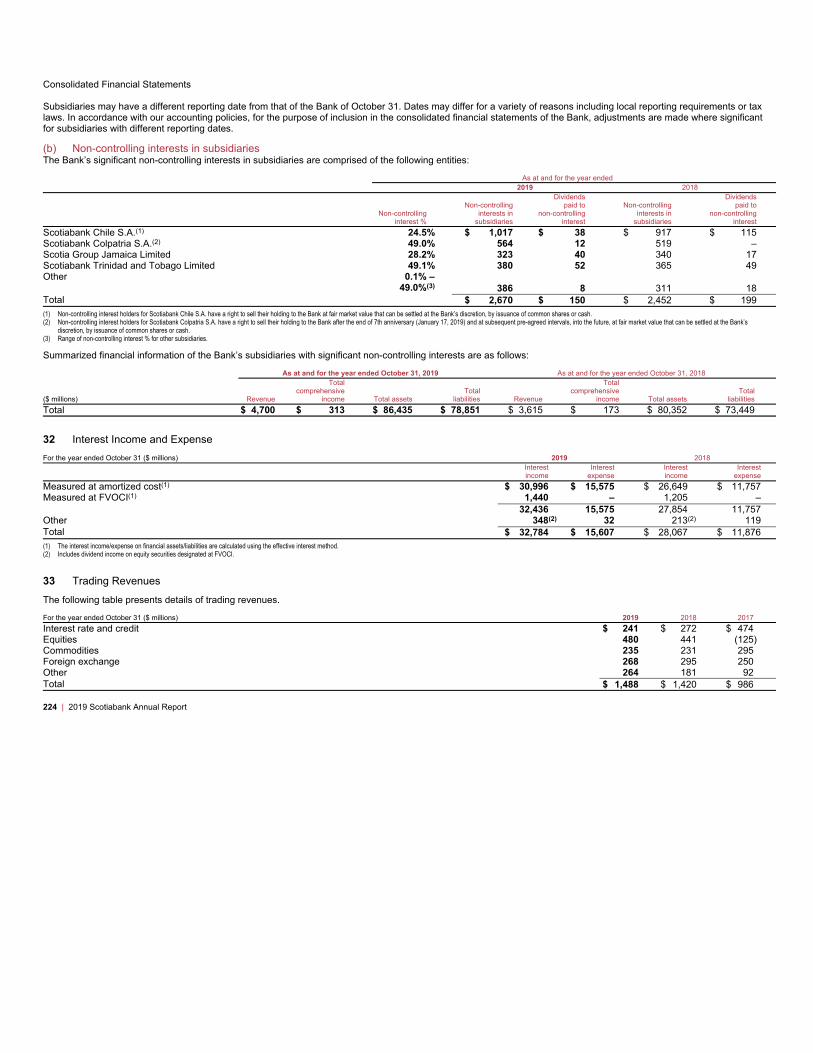
Consolidated Financial Statements
Subsidiaries may have a different reporting date from that of the Bank of October 31. Dates may differ for a variety of reasons including local reporting requirements or tax
laws. In accordance with our accounting policies, for the purpose of inclusion in the consolidated financial statements of the Bank, adjustments are made where significant
for subsidiaries with different reporting dates.
(b) Non-controlling interests in subsidiaries
The Bank’s significant non-controlling interests in subsidiaries are comprised of the following entities:
As at and for the year ended
2019 2018
Non-controlling
interest %
Non-controlling
interests in
subsidiaries
Dividends
paid to
non-controlling
interest
Non-controlling
interests in
subsidiaries
Dividends
paid to
non-controlling
interest
Scotiabank Chile S.A.(1) 24.5% $ 1,017 $ 38 $ 917 $ 115
Scotiabank Colpatria S.A.(2) 49.0% 564 12 519 –
Scotia Group Jamaica Limited 28.2% 323 40 340 17
Scotiabank Trinidad and Tobago Limited 49.1% 380 52 365 49
Other 0.1%
49.0%
–
(3)386 8 311 18
Total $ 2,670 $ 150 $ 2,452 $ 199
(1) Non-controlling interest holders for Scotiabank Chile S.A. have a right to sell their holding to the Bank at fair market value that can be settled at the Bank’s discretion, by issuance of common shares or cash.
(2) Non-controlling interest holders for Scotiabank Colpatria S.A. have a right to sell their holding to the Bank after the end of 7th anniversary (January 17, 2019) and at subsequent pre-agreed intervals, into the future, at fair market value that can be settled at the Bank’s
discretion, by issuance of common shares or cash.
(3) Range of non-controlling interest % for other subsidiaries.
Summarized financial information of the Bank’s subsidiaries with significant non-controlling interests are as follows:
As at and for the year ended October 31, 2019 As at and for the year ended October 31, 2018
($ millions) Revenue
Total
comprehensive
income Total assets
Total
liabilities Revenue
Total
comprehensive
income Total assets
Total
liabilities
Total $ 4,700 $ 313 $ 86,435 $ 78,851 $ 3,615 $ 173 $ 80,352 $ 73,449
32 Interest Income and Expense
For the year ended October 31 ($ millions) 2019 2018
Interest
income
Interest
expense
Interest
income
Interest
expense
Measured at amortized cost(1) $ 30,996 $ 15,575 $ 26,649 $ 11,757
Measured at FVOCI(1) 1,440 – 1,205 –
32,436 15,575 27,854 11,757
Other 348(2) 32 213(2) 119
Total $ 32,784 $ 15,607 $ 28,067 $ 11,876
(1) The interest income/expense on financial assets/liabilities are calculated using the effective interest method.
(2) Includes dividend income on equity securities designated at FVOCI.
33 Trading Revenues
The following table presents details of trading revenues.
For the year ended October 31 ($ millions) 2019 2018 2017
Interest rate and credit $ 241 $ 272 $ 474
Equities 480 441 (125)
Commodities 235 231 295
Foreign exchange 268 295 250
Other 264 181 92
Total $ 1,488 $ 1,420 $ 986
224 | 2019 Scotiabank Annual Report
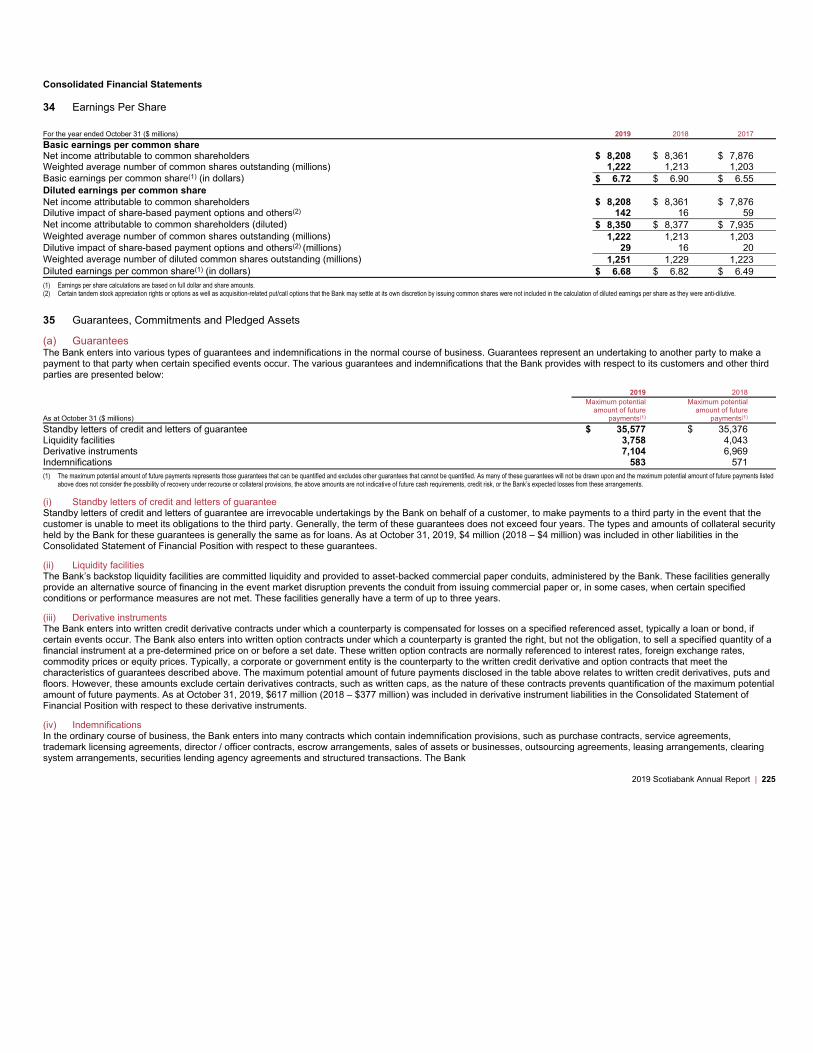
Consolidated Financial Statements
34 Earnings Per Share
For the year ended October 31 ($ millions) 2019 2018 2017
Basic earnings per common share
Net income attributable to common shareholders $ 8,208 $ 8,361 $ 7,876
Weighted average number of common shares outstanding (millions) 1,222 1,213 1,203
Basic earnings per common share(1) (in dollars) $ 6.72 $ 6.90 $ 6.55
Diluted earnings per common share
Net income attributable to common shareholders $ 8,208 $ 8,361 $ 7,876
Dilutive impact of share-based payment options and others(2) 142 16 59
Net income attributable to common shareholders (diluted) $ 8,350 $ 8,377 $ 7,935
Weighted average number of common shares outstanding (millions) 1,222 1,213 1,203
Dilutive impact of share-based payment options and others(2) (millions) 29 16 20
Weighted average number of diluted common shares outstanding (millions) 1,251 1,229 1,223
Diluted earnings per common share(1) (in dollars) $ 6.68 $ 6.82 $ 6.49
(1) Earnings per share calculations are based on full dollar and share amounts.
(2) Certain tandem stock appreciation rights or options as well as acquisition-related put/call options that the Bank may settle at its own discretion by issuing common shares were not included in the calculation of diluted earnings per share as they were anti-dilutive.
35 Guarantees, Commitments and Pledged Assets
(a) Guarantees
The Bank enters into various types of guarantees and indemnifications in the normal course of business. Guarantees represent an undertaking to another party to make a
payment to that party when certain specified events occur. The various guarantees and indemnifications that the Bank provides with respect to its customers and other third
parties are presented below:
2019 2018
As at October 31 ($ millions)
Maximum potential
amount of future
payments(1)
Maximum potential
amount of future
payments(1)
Standby letters of credit and letters of guarantee $ 35,577 $ 35,376
Liquidity facilities 3,758 4,043
Derivative instruments 7,104 6,969
Indemnifications 583 571
(1) The maximum potential amount of future payments represents those guarantees that can be quantified and excludes other guarantees that cannot be quantified. As many of these guarantees will not be drawn upon and the maximum potential amount of future payments listed
above does not consider the possibility of recovery under recourse or collateral provisions, the above amounts are not indicative of future cash requirements, credit risk, or the Bank’s expected losses from these arrangements.
(i) Standby letters of credit and letters of guarantee
Standby letters of credit and letters of guarantee are irrevocable undertakings by the Bank on behalf of a customer, to make payments to a third party in the event that the
customer is unable to meet its obligations to the third party. Generally, the term of these guarantees does not exceed four years. The types and amounts of collateral security
held by the Bank for these guarantees is generally the same as for loans. As at October 31, 2019, $4 million (2018 – $4 million) was included in other liabilities in the
Consolidated Statement of Financial Position with respect to these guarantees.
(ii) Liquidity facilities
The Bank’s backstop liquidity facilities are committed liquidity and provided to asset-backed commercial paper conduits, administered by the Bank. These facilities generally
provide an alternative source of financing in the event market disruption prevents the conduit from issuing commercial paper or, in some cases, when certain specified
conditions or performance measures are not met. These facilities generally have a term of up to three years.
(iii) Derivative instruments
The Bank enters into written credit derivative contracts under which a counterparty is compensated for losses on a specified referenced asset, typically a loan or bond, if
certain events occur. The Bank also enters into written option contracts under which a counterparty is granted the right, but not the obligation, to sell a specified quantity of a
financial instrument at a pre-determined price on or before a set date. These written option contracts are normally referenced to interest rates, foreign exchange rates,
commodity prices or equity prices. Typically, a corporate or government entity is the counterparty to the written credit derivative and option contracts that meet the
characteristics of guarantees described above. The maximum potential amount of future payments disclosed in the table above relates to written credit derivatives, puts and
floors. However, these amounts exclude certain derivatives contracts, such as written caps, as the nature of these contracts prevents quantification of the maximum potential
amount of future payments. As at October 31, 2019, $617 million (2018 – $377 million) was included in derivative instrument liabilities in the Consolidated Statement of
Financial Position with respect to these derivative instruments.
(iv) Indemnifications
In the ordinary course of business, the Bank enters into many contracts which contain indemnification provisions, such as purchase contracts, service agreements,
trademark licensing agreements, director / officer contracts, escrow arrangements, sales of assets or businesses, outsourcing agreements, leasing arrangements, clearing
system arrangements, securities lending agency agreements and structured transactions. The Bank
2019 Scotiabank Annual Report | 225
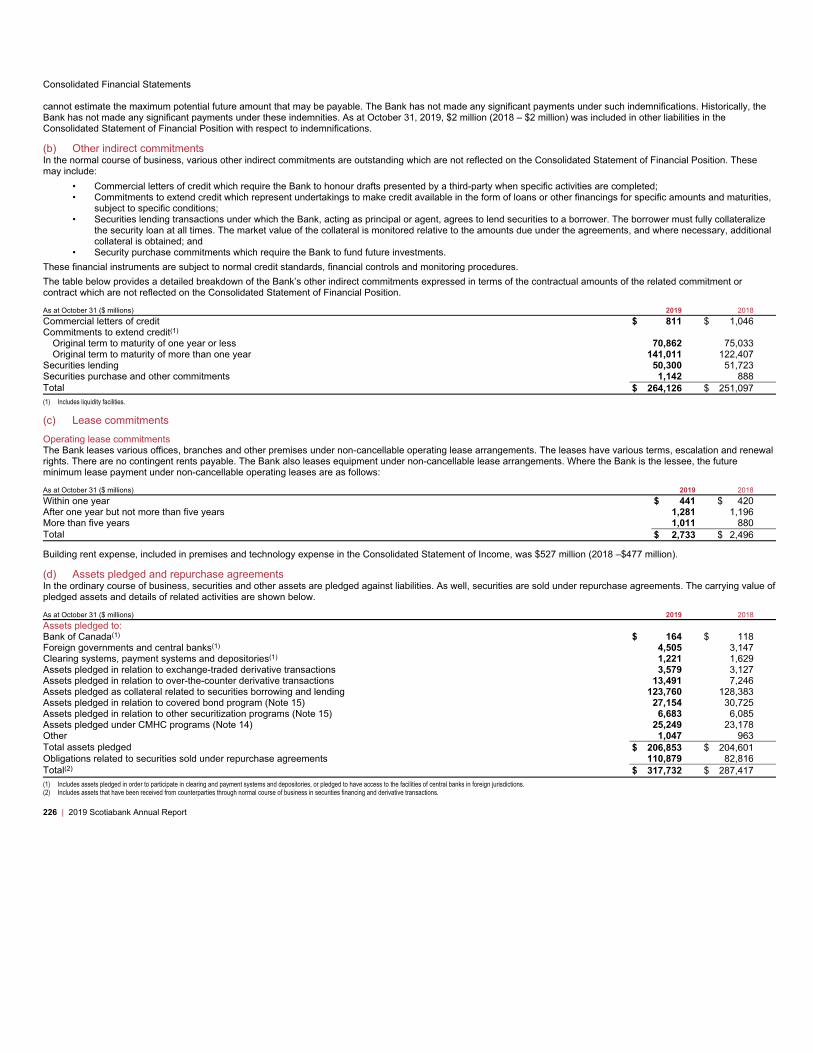
Consolidated Financial Statements
cannot estimate the maximum potential future amount that may be payable. The Bank has not made any significant payments under such indemnifications. Historically, the
Bank has not made any significant payments under these indemnities. As at October 31, 2019, $2 million (2018 – $2 million) was included in other liabilities in the
Consolidated Statement of Financial Position with respect to indemnifications.
(b) Other indirect commitments
In the normal course of business, various other indirect commitments are outstanding which are not reflected on the Consolidated Statement of Financial Position. These
may include:
• Commercial letters of credit which require the Bank to honour drafts presented by a third-party when specific activities are completed;
• Commitments to extend credit which represent undertakings to make credit available in the form of loans or other financings for specific amounts and maturities,
subject to specific conditions;
• Securities lending transactions under which the Bank, acting as principal or agent, agrees to lend securities to a borrower. The borrower must fully collateralize
the security loan at all times. The market value of the collateral is monitored relative to the amounts due under the agreements, and where necessary, additional
collateral is obtained; and
• Security purchase commitments which require the Bank to fund future investments.
These financial instruments are subject to normal credit standards, financial controls and monitoring procedures.
The table below provides a detailed breakdown of the Bank’s other indirect commitments expressed in terms of the contractual amounts of the related commitment or
contract which are not reflected on the Consolidated Statement of Financial Position.
As at October 31 ($ millions) 2019 2018
Commercial letters of credit $ 811 $ 1,046
Commitments to extend credit(1)
Original term to maturity of one year or less 70,862 75,033
Original term to maturity of more than one year 141,011 122,407
Securities lending 50,300 51,723
Securities purchase and other commitments 1,142 888
Total $ 264,126 $ 251,097
(1) Includes liquidity facilities.
(c) Lease commitments
Operating lease commitments
The Bank leases various offices, branches and other premises under non-cancellable operating lease arrangements. The leases have various terms, escalation and renewal
rights. There are no contingent rents payable. The Bank also leases equipment under non-cancellable lease arrangements. Where the Bank is the lessee, the future
minimum lease payment under non-cancellable operating leases are as follows:
As at October 31 ($ millions) 2019 2018
Within one year $ 441 $ 420
After one year but not more than five years 1,281 1,196
More than five years 1,011 880
Total $ 2,733 $ 2,496
Building rent expense, included in premises and technology expense in the Consolidated Statement of Income, was $527 million (2018 –$477 million).
(d) Assets pledged and repurchase agreements
In the ordinary course of business, securities and other assets are pledged against liabilities. As well, securities are sold under repurchase agreements. The carrying value of
pledged assets and details of related activities are shown below.
As at October 31 ($ millions) 2019 2018
Assets pledged to:
Bank of Canada(1) $ 164 $ 118
Foreign governments and central banks(1) 4,505 3,147
Clearing systems, payment systems and depositories(1) 1,221 1,629
Assets pledged in relation to exchange-traded derivative transactions 3,579 3,127
Assets pledged in relation to over-the-counter derivative transactions 13,491 7,246
Assets pledged as collateral related to securities borrowing and lending 123,760 128,383
Assets pledged in relation to covered bond program (Note 15) 27,154 30,725
Assets pledged in relation to other securitization programs (Note 15) 6,683 6,085
Assets pledged under CMHC programs (Note 14) 25,249 23,178
Other 1,047 963
Total assets pledged $ 206,853 $ 204,601
Obligations related to securities sold under repurchase agreements 110,879 82,816
Total(2)$ 317,732 $ 287,417
(1) Includes assets pledged in order to participate in clearing and payment systems and depositories, or pledged to have access to the facilities of central banks in foreign jurisdictions.
(2) Includes assets that have been received from counterparties through normal course of business in securities financing and derivative transactions.
226 | 2019 Scotiabank Annual Report

Consolidated Financial Statements
(e) Other executory contracts
Effective July 2018, the Bank has entered into an $800 million contract for naming rights of an arena for 20 years.
The Bank and its subsidiaries have also entered into other long-term executory contracts, relating to outsourced services. The significant outsourcing arrangements have
variable pricing based on utilization and are cancellable with notice.
36 Financial Instruments – Risk Management
The Bank’s principal business activities result in a balance sheet that consists primarily of financial instruments. In addition, the Bank uses derivative financial instruments for
both trading and hedging purposes. The principal financial risks that arise from transacting financial instruments include credit risk, liquidity risk and market risk. The Bank’s
framework to monitor, evaluate and manage these risks is consistent with that in place as at October 31, 2019:
• extensive risk management policies define the Bank’s risk appetite, set the limits and controls within which the Bank and its subsidiaries can operate, and reflect
the requirements of regulatory authorities. These policies are approved by the Bank’s Board of Directors, either directly or through the Risk Committee of the
Board, (the Board);
• guidelines are developed to clarify risk limits and conditions under which the Bank’s risk policies are implemented;
• processes are implemented to identify, evaluate, document, report and control risk. Standards define the breadth and quality of information required to make a
decision; and
• compliance with risk policies, limits and guidelines is measured, monitored and reported to ensure consistency against defined goals.
Further details on the fair value of financial instruments and how these amounts were determined are provided in Note 7. Note 10 provides details on the terms and
conditions of the Bank’s derivative financial instruments including notional amounts, remaining term to maturity, credit risk, and fair values of derivatives used in trading and
hedging activities.
(a) Credit risk
Credit risk is the risk of loss resulting from the failure of a borrower or counterparty to honour its financial or contractual obligations to the Bank. The Bank’s Credit Risk
Appetite and Credit Risk Policy are developed by its Global Risk Management (GRM) department and limits are reviewed and approved by the Board on an annual and
biennial basis, respectively. The Credit Risk Appetite defines target markets and risk tolerances that are developed at an all-Bank level, and then further refined at the
business line level. The objectives of the Credit Risk Appetite are to ensure that, for the Bank, including the individual business lines:
• target markets and product offerings are well defined;
• the risk parameters for new underwritings and for the portfolios as a whole are clearly specified; and
• transactions, including origination, syndication, loan sales and hedging, are managed in a manner to ensure the goals for the overall portfolio are met.
The Credit Risk Policy sets out, among other things, the credit risk rating systems and associated parameter estimates, the delegation of authority for granting credit, and the
calculation of allowance for credit losses. It forms an integral part of enterprise-wide policies and procedures that encompass governance, risk management and control
structure.
The Bank’s credit risk rating systems are designed to support the determination of key credit risk parameter estimates which measure credit and transaction risk. For non-
retail exposures, parameters are associated with each credit facility through the assignment of borrower and transaction ratings. Borrower risk is evaluated using
methodologies that are specific to particular industry sectors and/or business lines. The risk associated with facilities of a given borrower is assessed by considering the
facilities’ structural and collateral-related elements. For retail portfolios, product specific models assign accounts into homogeneous segments using internal and external
borrower/facility-level credit experience. This process provides for a meaningful differentiation of risk, and allows for appropriate and consistent estimation of loss
characteristics at the model and segment level. Further details on credit risk relating to derivatives are provided in Note 10(c).
(i) Credit risk exposures
Credit risk exposures disclosed below are presented based on the Basel framework utilized by the Bank i.e. exposures subject to credit risk capital. The Bank uses the
Advanced Internal Ratings Based approach (AIRB) for all material Canadian, U.S., European portfolios, and for a significant portion of all international corporate and
commercial portfolios. The remaining portfolios, including other individual portfolios, are treated under the standardized approach. Under the AIRB approach, the Bank uses
internal risk parameter estimates, based on historical experience, for probability of default (PD), loss given default (LGD) and exposure at default (EAD), as defined below:
• EAD: Generally represents the expected gross exposure – outstanding amount for on-balance sheet exposure and loan equivalent amount for off-balance sheet
exposure.
• PD: Measures the likelihood that a borrower will default within a 1-year time horizon, expressed as a percentage.
• LGD: Measures the severity of loss on a facility in the event of a borrower’s default, expressed as a percentage of exposure at default.
Under the standardized approach, credit risk is estimated using the risk weights as prescribed by the Basel framework either based on credit assessments by external rating
agencies or based on the counterparty type for non-retail exposures and product type for retail exposures. Standardized risk weights also takes into account other factors
such as specific provisions for defaulted exposures, eligible collateral, and loan-to-value for real estate secured retail exposures.
2019 Scotiabank Annual Report | 227
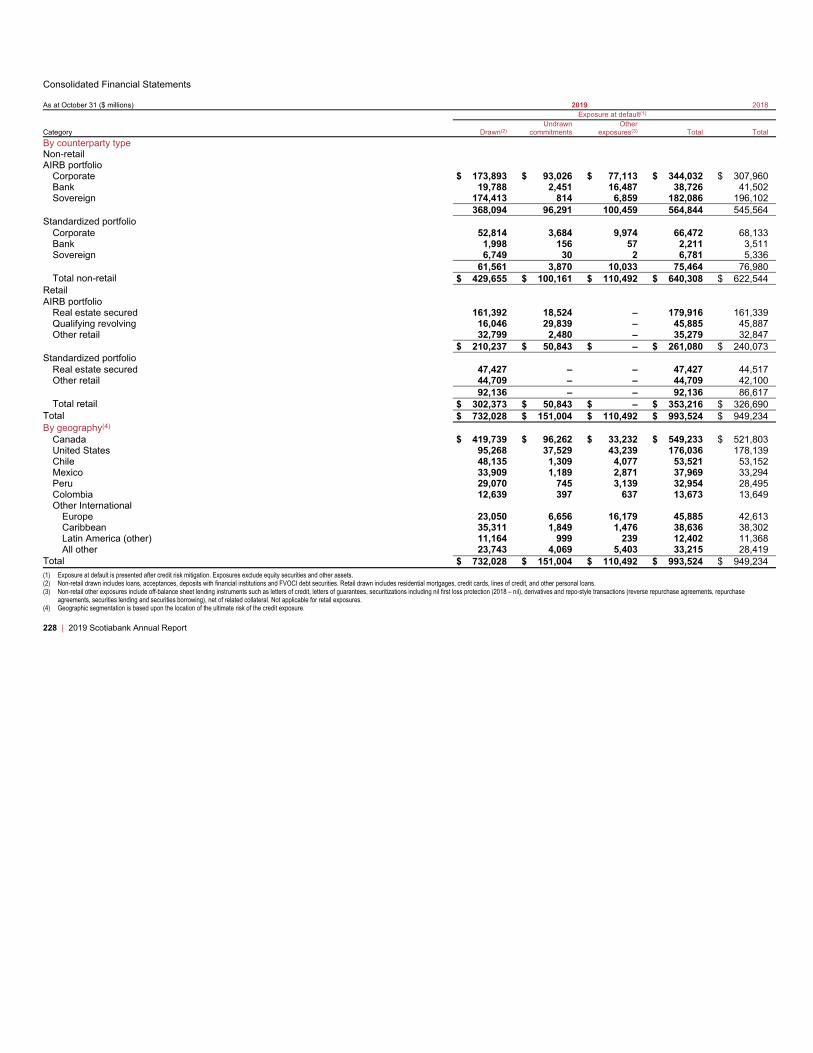
Consolidated Financial Statements
As at October 31 ($ millions) 2019 2018
Exposure at default(1)
Category Drawn(2)
Undrawn
commitments
Other
exposures(3) Total Total
By counterparty type
Non-retail
AIRB portfolio
Corporate $ 173,893 $ 93,026 $ 77,113 $ 344,032 $ 307,960
Bank 19,788 2,451 16,487 38,726 41,502
Sovereign 174,413 814 6,859 182,086 196,102
368,094 96,291 100,459 564,844 545,564
Standardized portfolio
Corporate 52,814 3,684 9,974 66,472 68,133
Bank 1,998 156 57 2,211 3,511
Sovereign 6,749 30 2 6,781 5,336
61,561 3,870 10,033 75,464 76,980
Total non-retail $ 429,655 $ 100,161 $ 110,492 $ 640,308 $ 622,544
Retail
AIRB portfolio
Real estate secured 161,392 18,524 – 179,916 161,339
Qualifying revolving 16,046 29,839 – 45,885 45,887
Other retail 32,799 2,480 – 35,279 32,847
$ 210,237 $ 50,843 $ – $ 261,080 $ 240,073
Standardized portfolio
Real estate secured 47,427 – – 47,427 44,517
Other retail 44,709 – – 44,709 42,100
92,136 – – 92,136 86,617
Total retail $ 302,373 $ 50,843 $ – $ 353,216 $ 326,690
Total $ 732,028 $ 151,004 $ 110,492 $ 993,524 $ 949,234
By geography(4)
Canada $ 419,739 $ 96,262 $ 33,232 $ 549,233 $ 521,803
United States 95,268 37,529 43,239 176,036 178,139
Chile 48,135 1,309 4,077 53,521 53,152
Mexico 33,909 1,189 2,871 37,969 33,294
Peru 29,070 745 3,139 32,954 28,495
Colombia 12,639 397 637 13,673 13,649
Other International
Europe 23,050 6,656 16,179 45,885 42,613
Caribbean 35,311 1,849 1,476 38,636 38,302
Latin America (other) 11,164 999 239 12,402 11,368
All other 23,743 4,069 5,403 33,215 28,419
Total $ 732,028 $ 151,004 $ 110,492 $ 993,524 $ 949,234
(1) Exposure at default is presented after credit risk mitigation. Exposures exclude equity securities and other assets.
(2) Non-retail drawn includes loans, acceptances, deposits with financial institutions and FVOCI debt securities. Retail drawn includes residential mortgages, credit cards, lines of credit, and other personal loans.
(3) Non-retail other exposures include off-balance sheet lending instruments such as letters of credit, letters of guarantees, securitizations including nil first loss protection (2018 – nil), derivatives and repo-style transactions (reverse repurchase agreements, repurchase
agreements, securities lending and securities borrowing), net of related collateral. Not applicable for retail exposures.
(4) Geographic segmentation is based upon the location of the ultimate risk of the credit exposure.
228 | 2019 Scotiabank Annual Report

Consolidated Financial Statements
Consolidated Statement of Financial Position asset categories cross-referenced to credit risk exposures
The table below provides mapping of on-balance sheet asset categories that are included in the various Basel III exposure categories as presented in the credit risk
exposure summary table of these consolidated financial statements. In addition, it also provides other exposures which are subject to market risk and/or other assets which
are not subject to market and credit risk with a reconciliation to the Consolidated Statement of Financial Position. The credit risk exposures on certain assets such as cash,
precious metals, investment securities (equities) and other assets are not included on the credit risk exposure summary table. Also excluded from the credit risk exposures
are certain trading assets and all assets of the Bank’s insurance subsidiaries.
Credit Risk Exposures Other Exposures
Drawn Other Exposures Market Risk Exposures
As at October 31, 2019 ($ millions) Non-retail Retail Securitization
Repo-style
Transactions
OTC
Derivatives Equity
Also
subject to
Credit Risk All Other(1) Total
Cash and deposits with financial institutions $ 43,392 $ – $ – $ – $ – $ – $ – $ – $ 3,328 $ 46,720
Precious metals – – – – – – – 3,709 – 3,709
Trading assets
Securities 21 – – – – – – 112,643 – 112,664
Loans 7,255 145 – – – – 6,779 6,429 – 13,829
Other – – – – – – – 995 – 995
Financial assets designated at fair value through profit or loss – – – – – – – – – –
Securities purchased under resale agreements and securities
borrowed – – – 131,173 – – – – 5 131,178
Derivative financial instruments – – – – 38,119 – 34,489 – – 38,119
Investment securities 78,235 – – – – 2,279 – – 1,845 82,359
Loans:
Residential mortgages(2) 80,777 187,284 – – – – – – 108 268,169
Personal loans – 97,253 1,366 – – – – – 12 98,631
Credit cards – 14,033 575 – – – – – 3,180 17,788
Business & government 202,935 3,461 6,255 – – – – – 321 212,972
Allowances for credit losses(3) (583) (708) – – – – – – (3,786) (5,077)
Customers’ liability under acceptances 13,902 – – – – – – – (6) 13,896
Property and equipment – – – – – – – – 2,669 2,669
Investment in associates – – – – – – – – 5,614 5,614
Goodwill and other intangibles assets – – – – – – – – 17,465 17,465
Other (including Deferred tax assets) 3,721 905 – 62 – – – – 19,773 24,461
Total $ 429,655 $ 302,373 $ 8,196 $ 131,235 $ 38,119 $ 2,279 $ 41,268 $ 123,776 $ 50,528 $ 1,086,161
(1) Includes the Bank’s insurance subsidiaries’ assets and all other assets which are not subject to credit and market risks.
(2) Includes $81.5 billion in mortgages guaranteed by Canada Mortgage Housing Corporation including 90% of privately insured mortgages.
(3) Amounts for AIRB exposures are reported gross of allowances and amounts for standardized exposures are reported net of allowances.
Credit Risk Exposures Other Exposures
Drawn Other Exposures Market Risk Exposures
As at October 31, 2018 ($ millions) Non-retail Retail Securitization
Repo-style
Transactions
OTC
Derivatives Equity
Also
subject to
Credit Risk All Other(1) Total
Cash and deposits with financial institutions $ 58,728 $ – $ – $ – $ – $ – $ – $ – $ 3,541 $ 62,269
Precious metals – – – – – – – 3,191 – 3,191
Trading assets
Securities 24 – – – – – – 85,450 – 85,474
Loans 7,183 12 – – – – 6,606 7,139 – 14,334
Other – – – – – – – 454 – 454
Financial assets designated at fair value through profit or loss 12 – – – – – – – – 12
Securities purchased under resale agreements and securities
borrowed – – – 104,010 – – – – 8 104,018
Derivative financial instruments – – – – 37,558 – 33,937 – – 37,558
Investment securities 75,837 – – – – 1,754 – – 805 78,396
Loans:
Residential mortgages(2) 86,417 166,752 – – – – – – 188 253,357
Personal loans – 94,392 1,613 – – – – – 14 96,019
Credit cards – 14,331 687 – – – – – 1,467 16,485
Business & government 180,164 3,193 7,748 – – – – – (67) 191,038
Allowances for credit losses(3) (560) (786) – – – – – – (3,719) (5,065)
Customers’ liability under acceptances 16,338 – – – – – – – (9) 16,329
Property and equipment – – – – – – – – 2,684 2,684
Investment in associates – – – – – – – – 4,850 4,850
Goodwill and other intangibles assets – – – – – – – – 17,719 17,719
Other (including Deferred tax assets) 866 711 – – – – – – 17,794 19,371
Total $ 425,009 $ 278,605 $ 10,048 $ 104,010 $ 37,558 $ 1,754 $ 40,543 $ 96,234 $ 45,275 $ 998,493
(1) Includes the Bank’s insurance subsidiaries’ assets and all other assets which are not subject to credit and market risks.
(2) Includes $82.2 billion in mortgages guaranteed by Canada Mortgage Housing Corporation including 90% of privately insured mortgages.
(3) Amounts for AIRB exposures are reported gross of allowances and amounts for standardized exposures are reported net of allowances.
2019 Scotiabank Annual Report | 229
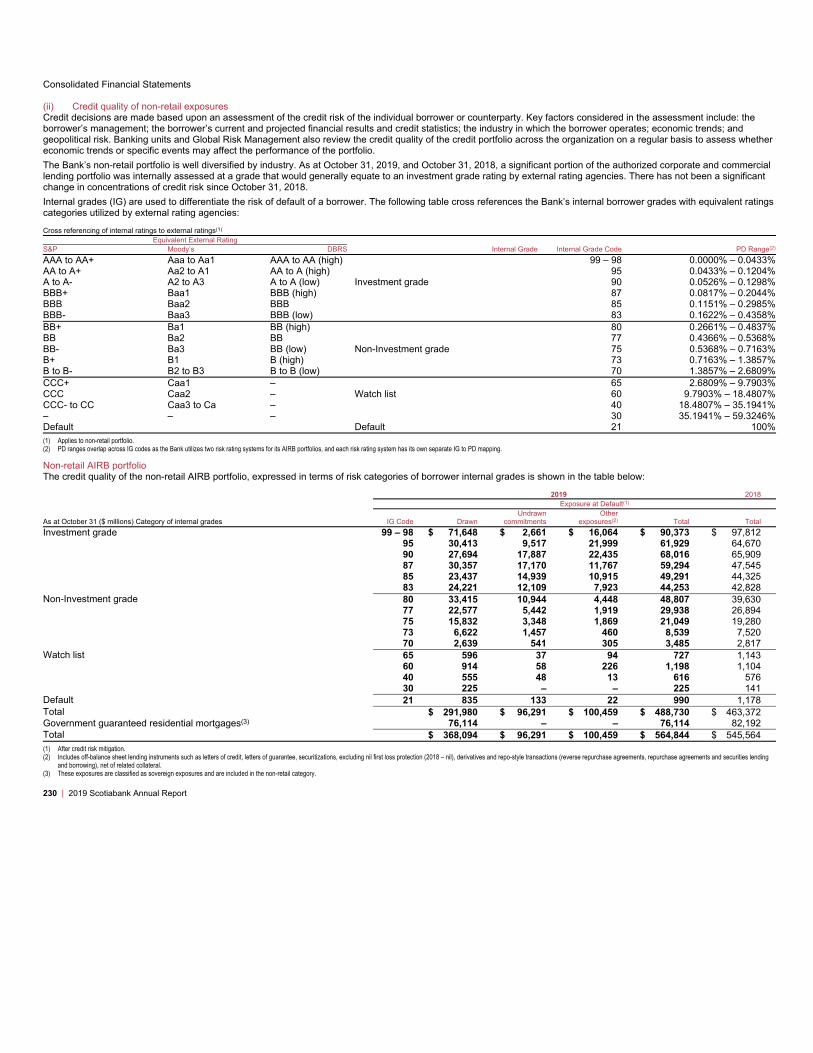
Consolidated Financial Statements
(ii) Credit quality of non-retail exposures
Credit decisions are made based upon an assessment of the credit risk of the individual borrower or counterparty. Key factors considered in the assessment include: the
borrower’s management; the borrower’s current and projected financial results and credit statistics; the industry in which the borrower operates; economic trends; and
geopolitical risk. Banking units and Global Risk Management also review the credit quality of the credit portfolio across the organization on a regular basis to assess whether
economic trends or specific events may affect the performance of the portfolio.
The Bank’s non-retail portfolio is well diversified by industry. As at October 31, 2019, and October 31, 2018, a significant portion of the authorized corporate and commercial
lending portfolio was internally assessed at a grade that would generally equate to an investment grade rating by external rating agencies. There has not been a significant
change in concentrations of credit risk since October 31, 2018.
Internal grades (IG) are used to differentiate the risk of default of a borrower. The following table cross references the Bank’s internal borrower grades with equivalent ratings
categories utilized by external rating agencies:
Cross referencing of internal ratings to external ratings(1)
Equivalent External Rating
S&P Moody’s DBRS Internal Grade Internal Grade Code PD Range(2)
AAA to AA+ Aaa to Aa1 AAA to AA (high) 99 – 98 0.0000% – 0.0433%
AA to A+ Aa2 to A1 AA to A (high) 95 0.0433% – 0.1204%
A to A- A2 to A3 A to A (low) Investment grade 90 0.0526% – 0.1298%
BBB+ Baa1 BBB (high) 87 0.0817% – 0.2044%
BBB Baa2 BBB 85 0.1151% – 0.2985%
BBB- Baa3 BBB (low) 83 0.1622% – 0.4358%
BB+ Ba1 BB (high) 80 0.2661% – 0.4837%
BB Ba2 BB 77 0.4366% – 0.5368%
BB- Ba3 BB (low) Non-Investment grade 75 0.5368% – 0.7163%
B+ B1 B (high) 73 0.7163% – 1.3857%
B to B- B2 to B3 B to B (low) 70 1.3857% – 2.6809%
CCC+ Caa1 – 65 2.6809% – 9.7903%
CCC Caa2 – Watch list 60 9.7903% – 18.4807%
CCC- to CC Caa3 to Ca – 40 18.4807% – 35.1941%
– – – 30 35.1941% – 59.3246%
Default Default 21 100%
(1) Applies to non-retail portfolio.
(2) PD ranges overlap across IG codes as the Bank utilizes two risk rating systems for its AIRB portfolios, and each risk rating system has its own separate IG to PD mapping.
Non-retail AIRB portfolio
The credit quality of the non-retail AIRB portfolio, expressed in terms of risk categories of borrower internal grades is shown in the table below:
2019 2018
Exposure at Default(1)
As at October 31 ($ millions) Category of internal grades IG Code Drawn
Undrawn
commitments
Other
exposures(2) Total Total
Investment grade 99 – 98 $ 71,648 $ 2,661 $ 16,064 $ 90,373 $ 97,812
95 30,413 9,517 21,999 61,929 64,670
90 27,694 17,887 22,435 68,016 65,909
87 30,357 17,170 11,767 59,294 47,545
85 23,437 14,939 10,915 49,291 44,325
83 24,221 12,109 7,923 44,253 42,828
Non-Investment grade 80 33,415 10,944 4,448 48,807 39,630
77 22,577 5,442 1,919 29,938 26,894
75 15,832 3,348 1,869 21,049 19,280
73 6,622 1,457 460 8,539 7,520
70 2,639 541 305 3,485 2,817
Watch list 65 596 37 94 727 1,143
60 914 58 226 1,198 1,104
40 555 48 13 616 576
30 225 – – 225 141
Default 21 835 133 22 990 1,178
Total $ 291,980 $ 96,291 $ 100,459 $ 488,730 $ 463,372
Government guaranteed residential mortgages(3) 76,114 – – 76,114 82,192
Total $ 368,094 $ 96,291 $ 100,459 $ 564,844 $ 545,564
(1) After credit risk mitigation.
(2) Includes off-balance sheet lending instruments such as letters of credit, letters of guarantee, securitizations, excluding nil first loss protection (2018 – nil), derivatives and repo-style transactions (reverse repurchase agreements, repurchase agreements and securities lending
and borrowing), net of related collateral.
(3) These exposures are classified as sovereign exposures and are included in the non-retail category.
230 | 2019 Scotiabank Annual Report

Consolidated Financial Statements
Non-retail standardized portfolio
The non-retail standardized portfolio relies on external credit ratings (e.g. S&P, Moody’s, DBRS, etc.,) of the borrower, if available, to compute regulatory capital for credit
risk. Exposures are risk-weight based on prescribed percentages and a mapping process as defined within OSFI’s Capital Adequacy Requirements Guideline. Non-retail
standardized portfolio as at October 31, 2019 comprised of drawn, undrawn and other exposures to corporate, bank and sovereign counterparties amounted to $75 billion
(October 31, 2018 – $77 billion). Within this portfolio, the majority of Corporate/Commercial exposures are to unrated counterparties, mainly in the Caribbean and Latin
American region.
(iii) Credit quality of retail exposures
The Bank’s retail portfolios consist of a number of relatively small loans to a large number of borrowers. The portfolios are distributed across Canada and a wide range of
countries. As such, the portfolios inherently have a high degree of diversification. In addition, as of October 31, 2019, 39% of the Canadian banking residential mortgage
portfolio is insured and the average loan-to-value ratio of the uninsured portion of the portfolio is 55%.
Retail AIRB portfolio
The data in the table below provides a distribution of the retail AIRB exposure within each PD range by asset class:
As at October 31 ($ millions) 2019 2018
Exposure at default(1)
Real estate secured
Category of (PD) grades PD range Mortgages HELOC
Qualifying
revolving Other retail Total Total
Exceptionally Low 0.0000% – 0.0499% $ – $ – $ 12,257 $ 535 $ 12,792 $ 12,155
Very Low 0.0500% – 0.1999% 44,045 32,487 9,188 6,720 92,440 89,544
Low 0.2000% – 0.9999% 85,350 5,381 12,169 18,284 121,184 107,036
Medium Low 1.0000% – 2.9999% 8,998 1,106 6,065 5,846 22,015 20,578
Medium 3.0000% – 9.9999% 865 344 5,000 2,830 9,039 7,211
High 10.0000% – 19.9999% 357 195 308 26 886 1,370
Extremely High 20.0000% – 99.9999% 422 73 764 848 2,107 1,591
Default 100% 225 68 134 190 617 588
Total $ 140,262 $ 39,654 $ 45,885 $ 35,279 $ 261,080 $ 240,073
(1) After credit risk mitigation.
Retail standardized portfolio
The retail standardized portfolio of $92 billion as at October 31, 2019 (2018 – $87 billion) was comprised of residential mortgages, personal loans, credit cards and lines of
credit to individuals, mainly in the Latin American and Caribbean region. Of the total retail standardized exposures, $47 billion (2018 – $45 billion) was represented by
mortgages and loans secured by residential real estate, mostly with a loan-to-value ratio of below 80%.
(iv) Collateral
Collateral held
In the normal course of business, to reduce its exposure to counterparty credit risk, the Bank receives collateral for capital markets related activities. The following are
examples of the terms and conditions customary to collateral for these types of transactions:
• The risks and rewards of the pledged assets reside with the pledgor.
• Additional collateral is required when the market value of the transaction exceeds thresholds agreed upon with the pledgor.
• The Bank is normally permitted to sell or repledge the collateral it receives, although this right is specific to each agreement under which the collateral is pledged.
• Upon satisfaction of the obligation, the Bank must return the pledged assets, unless the Bank has the right to sell or repledge the collateral it receives, in which
case the Bank must return comparable collateral to the pledgor.
As at October 31, 2019, the approximate market value of cash and securities collateral accepted that may be sold or repledged by the Bank was $167 billion (2018 – $136
billion). This collateral is held primarily in connection with reverse repurchase agreements, margin loans, securities lending and derivative transactions. The Bank also
borrows securities under standard securities borrowing agreements that it is able to re-pledge. Including these borrowed securities, the approximate market value of
securities collateral accepted that may be sold or re-pledged was $211 billion (2018 – $183 billion), of which approximately $27 billion was not sold or re-pledged (2018 –
$29 billion).
Collateral pledged
In the normal course of business, securities and other assets are pledged to secure an obligation, participate in clearing or settlement systems, or operate in a foreign
jurisdiction. Note 35(d) details the nature and extent of the Bank’s asset pledging activities. Asset pledging transactions are conducted under terms that are common and
customary to standard derivative, securities financing, and other borrowing activities. Standard risk management controls are applied with respect to asset pledging.
Assets acquired in exchange for loans
The carrying value of assets acquired in exchange for loans as at October 31, 2019 was $372 million (2018 – $426 million) mainly comprised of real estate and was
classified as either held for sale or held for use as appropriate.
(b) Liquidity risk
Liquidity risk is the risk that the Bank is unable to meet its financial obligations in a timely manner at reasonable prices. The Bank’s liquidity risk is subject to extensive risk
management controls and is managed within the framework of policies and limits approved by the Board. The Board receives reports on risk exposures and performance
against approved limits. The Asset-Liability Committee (ALCO) provides senior management oversight of liquidity risk.
2019 Scotiabank Annual Report | 231

Consolidated Financial Statements
The key elements of the Bank’s liquidity risk management framework include:
• liquidity risk measurement and management limits, including limits on maximum net cash outflow by currency over specified short-term horizons;
• prudent diversification of its wholesale funding activities by using a number of different funding programs to access the global financial markets and manage its
maturity profile, as appropriate;
• large holdings of liquid assets to support its operations, which can generally be sold or pledged to meet the Bank’s obligations;
• liquidity stress testing, including Bank-specific, global-systemic, and combination systemic/Bank-specific scenarios; and
• liquidity contingency planning.
The Bank’s foreign operations have liquidity management frameworks that are similar to the Bank’s framework. Local deposits are managed from a liquidity risk perspective
based on the local management frameworks and regulatory requirements.
(i) Commitments to extend credit
In the normal course of business, the Bank enters into commitments to extend credit in the form of loans or other financings for specific amounts and maturities, subject to
specific conditions. These commitments, which are not reflected on the Consolidated Statement of Financial Position, are subject to normal credit standards, financial
controls and monitoring procedures.
(ii) Derivative instruments
The Bank is subject to liquidity risk relating to its use of derivatives to meet customer needs, generate revenues from trading activities, manage market and credit risks
arising from its lending, funding and investment activities, and lower its cost of capital. The maturity profile of the notional amounts of the Bank’s derivative instruments is
summarized in Note 10(b).
(c) Market risk
Market risk arises from changes in market prices and rates (including interest rates, credit spreads, equity prices, foreign exchange rates and commodity prices), the
correlations between them, and their levels of volatility. Market risk is subject to extensive risk management controls, and is managed within the framework of market risk
policies and limits approved by the Board. The ALCO and Market Risk Management and Policy Committee oversee the application of the framework set by the Board, and
monitor the Bank’s market risk exposures and the activities that give rise to these exposures.
The Bank uses a variety of metrics and models to measure and control market risk exposures. The measurements used are selected based on an assessment of the nature
of risks in a particular activity. The principal measurement techniques are Value at Risk (VaR), stress testing, sensitivity analysis and simulation modeling, and gap analysis.
The Board reviews results from these metrics quarterly. Models are independently validated internally prior to implementation and are subject to formal periodic review.
VaR is a statistical measure that estimates the potential loss in value of the Bank’s trading positions due to adverse market movements over a defined time horizon with a
specified confidence level. The quality of the Bank’s VaR is validated by regular back testing analysis, in which the VaR is compared to theoretical and actual profit and loss
results. To complement VaR, the Bank also uses stress testing to examine the impact that abnormally large swings in market factors and periods of prolonged inactivity
might have on trading portfolios. The stress testing program is designed to identify key risks and ensure that the Bank’s capital can absorb potential losses from abnormal
events. The Bank subjects its trading portfolios to a series of stress tests on a daily, weekly and monthly basis.
In trading portfolios, sensitivity analysis is used to measure the effect of changes in risk factors, including prices and volatility, on financial products and portfolios. In non-
trading portfolios, sensitivity analysis assesses the effect of changes in interest rates on current earnings and on the economic value of shareholders’ equity. Simulation
modeling under various scenarios is particularly important for managing risk in the deposit, lending and investment products the Bank offers to its retail customers. Gap
analysis is used to assess the interest rate sensitivity of the Bank’s retail, wholesale banking and international operations. Under gap analysis, interest rate-sensitive assets,
liabilities and derivative instruments are assigned to defined time periods, on the earlier of contractual repricing or maturity dates on the basis of expected repricing dates.
(i) Non-trading interest rate risk
Interest rate risk is the risk of loss due to the following: changes in the level, slope and curvature of the yield curve; the volatility of interest rates; and mortgage prepayment
rates. The Bank actively manages its interest rate exposures with the objective of protecting and enhancing net interest income within established risk tolerances. Interest
rate risk arising from the Bank’s funding and investment activities is managed in accordance with Board-approved policies and global limits, which are designed to control the
risk to net interest income and economic value of shareholders’ equity. The income limit measures the effect of a specified shift in interest rates on the Bank’s annual net
income over the next twelve months, while the economic value limit measures the impact of a specified change in interest rates on the present value of the Bank’s net
assets. These calculations are based on a constant balance sheet and make no assumptions for management actions that may mitigate the risk.
Interest rate sensitivity
Based on the Bank’s interest rate positions, the following table shows the pro-forma after-tax impact on the Bank’s net interest income over the next twelve months and
economic value of shareholders’ equity of an immediate and sustained 100 basis point increase and decrease in interest rates across major currencies as defined by the
Bank.
As at October 31 ($ millions) 2019 2018
Net income Economic value of equity
Canadian
dollar
Other
currencies Total
Canadian
dollar
Other
currencies Total
Net
income
Economic value
of equity
100 bp increase $ (228) $ (45) $ (273) $ (533) $ (915) $ (1,448) $ (105) $ (870)
100 bp decrease $ 226 $ 41 $ 267 $ 360 $ 813 $ 1,173 $ 101 $ 797
232 | 2019 Scotiabank Annual Report
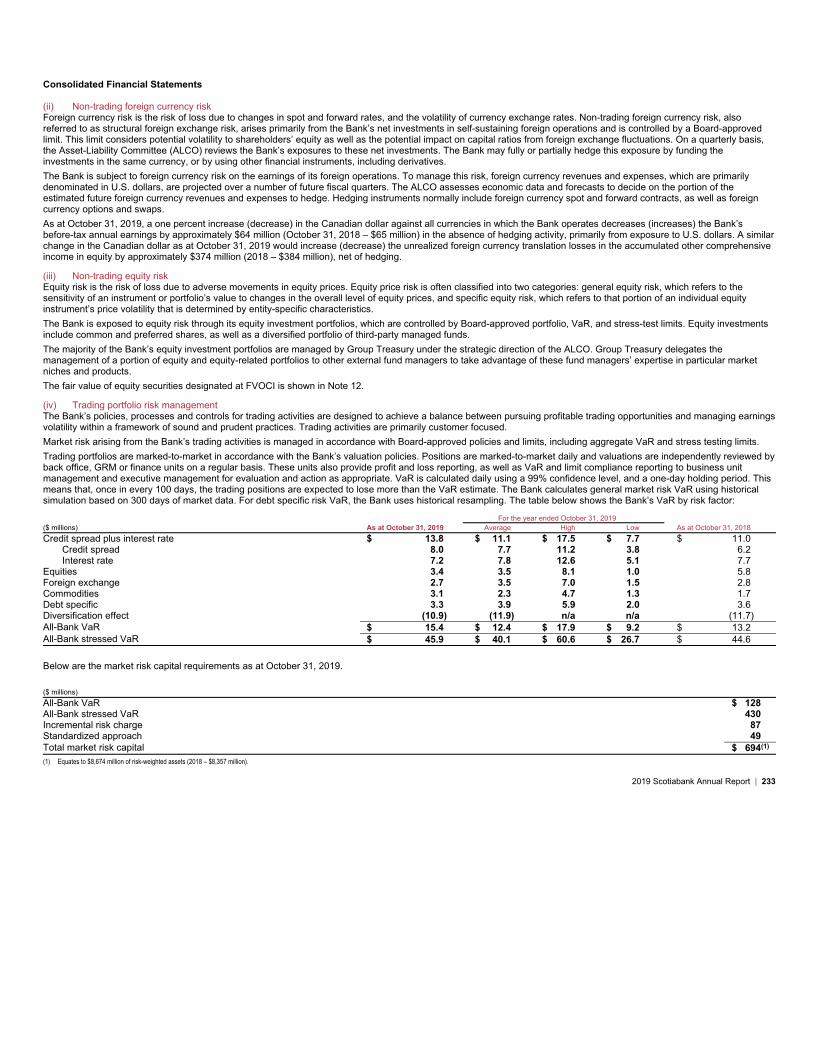
Consolidated Financial Statements
(ii) Non-trading foreign currency risk
Foreign currency risk is the risk of loss due to changes in spot and forward rates, and the volatility of currency exchange rates. Non-trading foreign currency risk, also
referred to as structural foreign exchange risk, arises primarily from the Bank’s net investments in self-sustaining foreign operations and is controlled by a Board-approved
limit. This limit considers potential volatility to shareholders’ equity as well as the potential impact on capital ratios from foreign exchange fluctuations. On a quarterly basis,
the Asset-Liability Committee (ALCO) reviews the Bank’s exposures to these net investments. The Bank may fully or partially hedge this exposure by funding the
investments in the same currency, or by using other financial instruments, including derivatives.
The Bank is subject to foreign currency risk on the earnings of its foreign operations. To manage this risk, foreign currency revenues and expenses, which are primarily
denominated in U.S. dollars, are projected over a number of future fiscal quarters. The ALCO assesses economic data and forecasts to decide on the portion of the
estimated future foreign currency revenues and expenses to hedge. Hedging instruments normally include foreign currency spot and forward contracts, as well as foreign
currency options and swaps.
As at October 31, 2019, a one percent increase (decrease) in the Canadian dollar against all currencies in which the Bank operates decreases (increases) the Bank’s
before-tax annual earnings by approximately $64 million (October 31, 2018 – $65 million) in the absence of hedging activity, primarily from exposure to U.S. dollars. A similar
change in the Canadian dollar as at October 31, 2019 would increase (decrease) the unrealized foreign currency translation losses in the accumulated other comprehensive
income in equity by approximately $374 million (2018 – $384 million), net of hedging.
(iii) Non-trading equity risk
Equity risk is the risk of loss due to adverse movements in equity prices. Equity price risk is often classified into two categories: general equity risk, which refers to the
sensitivity of an instrument or portfolio’s value to changes in the overall level of equity prices, and specific equity risk, which refers to that portion of an individual equity
instrument’s price volatility that is determined by entity-specific characteristics.
The Bank is exposed to equity risk through its equity investment portfolios, which are controlled by Board-approved portfolio, VaR, and stress-test limits. Equity investments
include common and preferred shares, as well as a diversified portfolio of third-party managed funds.
The majority of the Bank’s equity investment portfolios are managed by Group Treasury under the strategic direction of the ALCO. Group Treasury delegates the
management of a portion of equity and equity-related portfolios to other external fund managers to take advantage of these fund managers’ expertise in particular market
niches and products.
The fair value of equity securities designated at FVOCI is shown in Note 12.
(iv) Trading portfolio risk management
The Bank’s policies, processes and controls for trading activities are designed to achieve a balance between pursuing profitable trading opportunities and managing earnings
volatility within a framework of sound and prudent practices. Trading activities are primarily customer focused.
Market risk arising from the Bank’s trading activities is managed in accordance with Board-approved policies and limits, including aggregate VaR and stress testing limits.
Trading portfolios are marked-to-market in accordance with the Bank’s valuation policies. Positions are marked-to-market daily and valuations are independently reviewed by
back office, GRM or finance units on a regular basis. These units also provide profit and loss reporting, as well as VaR and limit compliance reporting to business unit
management and executive management for evaluation and action as appropriate. VaR is calculated daily using a 99% confidence level, and a one-day holding period. This
means that, once in every 100 days, the trading positions are expected to lose more than the VaR estimate. The Bank calculates general market risk VaR using historical
simulation based on 300 days of market data. For debt specific risk VaR, the Bank uses historical resampling. The table below shows the Bank’s VaR by risk factor:
For the year ended October 31, 2019
($ millions) As at October 31, 2019 Average High Low As at October 31, 2018
Credit spread plus interest rate $ 13.8 $ 11.1 $ 17.5 $ 7.7 $ 11.0
Credit spread 8.0 7.7 11.2 3.8 6.2
Interest rate 7.2 7.8 12.6 5.1 7.7
Equities 3.4 3.5 8.1 1.0 5.8
Foreign exchange 2.7 3.5 7.0 1.5 2.8
Commodities 3.1 2.3 4.7 1.3 1.7
Debt specific 3.3 3.9 5.9 2.0 3.6
Diversification effect (10.9) (11.9) n/a n/a (11.7)
All-Bank VaR $ 15.4 $ 12.4 $ 17.9 $ 9.2 $ 13.2
All-Bank stressed VaR $ 45.9 $ 40.1 $ 60.6 $ 26.7 $ 44.6
Below are the market risk capital requirements as at October 31, 2019.
($ millions)
All-Bank VaR $ 128
All-Bank stressed VaR 430
Incremental risk charge 87
Standardized approach 49
Total market risk capital $ 694(1)
(1) Equates to $8,674 million of risk-weighted assets (2018 – $8,357 million).
2019 Scotiabank Annual Report | 233

Consolidated Financial Statements
(d) Operational risk
Operational risk is the risk of loss, whether direct or indirect, to which the Bank is exposed due to inadequate or failed internal processes or systems, human error, or
external events. Operational risk includes legal and regulatory risk, business process and change risk, fiduciary or disclosure breaches, technology failure, financial crime
and environmental risk. Operational risk, in some form, exists in each of the Bank’s businesses and support activities, and can result in financial loss, regulatory sanctions
and damage to the Bank’s reputation. The Bank has developed policies, processes and assessment methodologies to ensure that operational risk is appropriately identified
and managed with effective controls with a view to safeguarding client assets and preserving shareholder value.
37 Acquisitions and divestitures
Acquisitions
Current year
Banco Dominicano del Progreso, Dominican Republic
On March 1, 2019, the Bank acquired 97.44% of the voting shares of Banco Dominicano del Progreso, a bank with operations in Dominican Republic, in exchange for total
consideration of $440 million in cash. The acquired business forms part of the International Banking business segment.
The fair value of the identifiable assets and liabilities acquired of Banco Dominicano del Progreso, Dominican Republic at the date of acquisition were:
($ millions)
Total net assets acquired(1) 176
Goodwill arising on acquisition 271
Deferred tax liabilities (3)
Non-controlling interest (4)
Total purchase consideration transferred $440
(1) Includes finite life intangible assets of $26 million relating to core-deposits and customer relationships.
Goodwill value of $271 million arising on acquisition largely reflects the synergies through combining and streamlining the Bank’s current operations in Dominican Republic
with Banco Dominicano del Progreso’s operations.
Banco Cencosud, Peru
On March 1, 2019, the Bank acquired 51% of the voting shares of Banco Cencosud, Peru in exchange for total consideration of $133 million in cash. The Bank and Banco
Cencosud will jointly manage the credit card operations and offer other products and services to customers in partnership for 15 years. On acquisition, the Bank recorded
$562 million of assets (mainly loans and intangible assets), $386 million of liabilities (mainly deposits) and a non-controlling interest of $43 million. The intangible assets
arising from acquisition of $123 million relates to the 15 year exclusivity contract. The acquired business forms part of the International Banking business segment.
Aggregate impact to Consolidated Income
For the year ended October 31, 2019, both acquisitions contributed revenue of $217 million in aggregate and a net loss of $64 million in aggregate. The primary reason for
the net loss is the recording of a provision for credit losses of $151 million ($106 million after-tax) on acquired performing financial assets, as required under IFRS 9.
Prior year
Jarislowsky, Fraser Limited, Canada
On May 1, 2018, the Bank completed the acquisition of Jarislowsky, Fraser Limited, an independent investment firm with approximately $40 billion in assets under
management on behalf of institutional and high net worth clients. The purchase price of $978 million was satisfied primarily by the issuance of 11.1 million common shares
valued at $878 million and cash of $44 million. The fair value of the common shares issued is based on the quoted price of the shares of the Bank as at May 1, 2018 which
was $78.86. Included in this purchase price is an earn-out of an amount of $56 million in additional common shares which may be paid based on achieving future growth
targets. The acquired business forms part of the Canadian Banking business segment.
234 | 2019 Scotiabank Annual Report
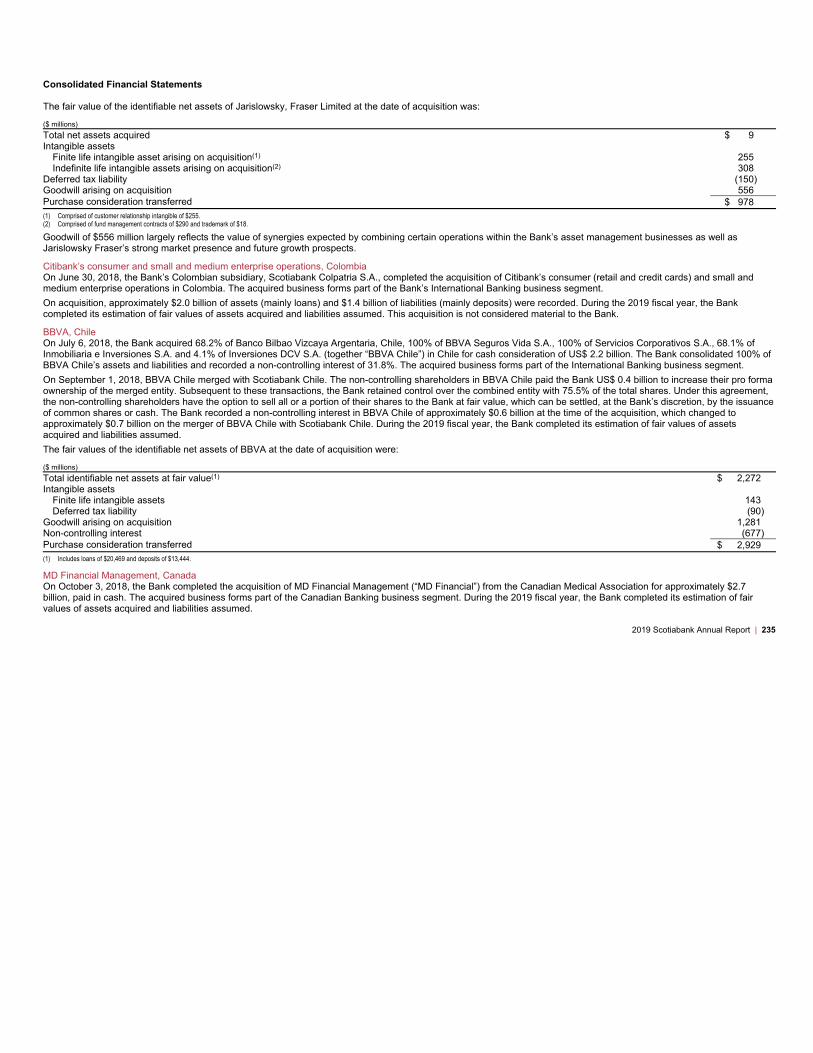
Consolidated Financial Statements
The fair value of the identifiable net assets of Jarislowsky, Fraser Limited at the date of acquisition was:
($ millions)
Total net assets acquired $ 9
Intangible assets
Finite life intangible asset arising on acquisition(1) 255
Indefinite life intangible assets arising on acquisition(2) 308
Deferred tax liability (150)
Goodwill arising on acquisition 556
Purchase consideration transferred $ 978
(1) Comprised of customer relationship intangible of $255.
(2) Comprised of fund management contracts of $290 and trademark of $18.
Goodwill of $556 million largely reflects the value of synergies expected by combining certain operations within the Bank’s asset management businesses as well as
Jarislowsky Fraser’s strong market presence and future growth prospects.
Citibank’s consumer and small and medium enterprise operations, Colombia
On June 30, 2018, the Bank’s Colombian subsidiary, Scotiabank Colpatria S.A., completed the acquisition of Citibank’s consumer (retail and credit cards) and small and
medium enterprise operations in Colombia. The acquired business forms part of the Bank’s International Banking business segment.
On acquisition, approximately $2.0 billion of assets (mainly loans) and $1.4 billion of liabilities (mainly deposits) were recorded. During the 2019 fiscal year, the Bank
completed its estimation of fair values of assets acquired and liabilities assumed. This acquisition is not considered material to the Bank.
BBVA, Chile
On July 6, 2018, the Bank acquired 68.2% of Banco Bilbao Vizcaya Argentaria, Chile, 100% of BBVA Seguros Vida S.A., 100% of Servicios Corporativos S.A., 68.1% of
Inmobiliaria e Inversiones S.A. and 4.1% of Inversiones DCV S.A. (together “BBVA Chile”) in Chile for cash consideration of US$ 2.2 billion. The Bank consolidated 100% of
BBVA Chile’s assets and liabilities and recorded a non-controlling interest of 31.8%. The acquired business forms part of the International Banking business segment.
On September 1, 2018, BBVA Chile merged with Scotiabank Chile. The non-controlling shareholders in BBVA Chile paid the Bank US$ 0.4 billion to increase their pro forma
ownership of the merged entity. Subsequent to these transactions, the Bank retained control over the combined entity with 75.5% of the total shares. Under this agreement,
the non-controlling shareholders have the option to sell all or a portion of their shares to the Bank at fair value, which can be settled, at the Bank’s discretion, by the issuance
of common shares or cash. The Bank recorded a non-controlling interest in BBVA Chile of approximately $0.6 billion at the time of the acquisition, which changed to
approximately $0.7 billion on the merger of BBVA Chile with Scotiabank Chile. During the 2019 fiscal year, the Bank completed its estimation of fair values of assets
acquired and liabilities assumed.
The fair values of the identifiable net assets of BBVA at the date of acquisition were:
($ millions)
Total identifiable net assets at fair value(1) $ 2,272
Intangible assets
Finite life intangible assets 143
Deferred tax liability (90)
Goodwill arising on acquisition 1,281
Non-controlling interest (677)
Purchase consideration transferred $ 2,929
(1) Includes loans of $20,469 and deposits of $13,444.
MD Financial Management, Canada
On October 3, 2018, the Bank completed the acquisition of MD Financial Management (“MD Financial”) from the Canadian Medical Association for approximately $2.7
billion, paid in cash. The acquired business forms part of the Canadian Banking business segment. During the 2019 fiscal year, the Bank completed its estimation of fair
values of assets acquired and liabilities assumed.
2019 Scotiabank Annual Report | 235

Consolidated Financial Statements
The fair values of the identifiable net assets of MD Financial at the date of acquisition were:
($ millions)
Total identifiable net assets at fair value $ 97
Intangible assets
Finite life intangible assets(1) 70
Indefinite life intangible assets(2) 1,880
Deferred tax liability (501)
Goodwill arising on acquisition 1,154
Purchase consideration transferred $ 2,700
(1) Comprised of customer relationship intangible.
(2) Comprised of fund management contract of $1.8 billion and acquired trademark of $80 million.
Goodwill largely reflects the value of synergies expected by combining certain operations within the Bank’s asset management businesses as well as MD Financial’s strong
market presence and future growth prospects.
Aggregate impact to Consolidated Income
For the year ended October 31, 2018, all four acquisitions contributed revenue of $394 million in aggregate and a net loss of $257 million in aggregate.
The primary reason for the net loss is the recording of a provision for credit losses of $404 million ($285 million after-tax) on acquired performing financial assets, as required
under IFRS 9.
Acquisition related costs directly related to the four acquisitions of $44 million are included in non-interest expenses in the Consolidated Statement of Income.
Divestitures
Announced divestitures impacting the current year
Insurance and banking operations in El Salvador
On February 8, 2019, the Bank announced that it has reached an agreement under which the Bank will sell its banking and insurance operations in El Salvador, including
Scotiabank El Salvador, its subsidiaries and Scotia Seguros to Imperia Intercontinental Inc. The transaction is expected to close in fiscal 2020 and is subject to regulatory
approvals and closing conditions.
As this transaction met the accounting requirements of assets held for sale, a total loss of approximately $136 million after tax, that primarily represents the carrying value of
goodwill relating to this business, was recorded in Non-interest income – Other and reported in the Other segment. The transaction will increase the Bank’s common equity
Tier 1 (CET1) ratio by approximately five basis points.
Operations in Puerto Rico and the U.S. Virgin Islands
On June 26, 2019, the Bank announced the sale of its operations in Puerto Rico and the U.S. Virgin Islands (“USVI”) to Oriental Bank, a subsidiary of OFG Bancorp. The
transaction is expected to close in fiscal 2020 and is subject to regulatory approvals and closing conditions.
As this transaction met the accounting requirements of assets held for sale, a loss of approximately $402 million after tax, that primarily represents the carrying value of
goodwill relating to this business, was recorded in Non-interest income – Other and reported in the Other segment.
Upon closing, an after-tax gain of approximately $50 million is expected to be recorded relating primarily to accumulated foreign currency translation gains and the premium
received on the USVI operations. The amounts are subject to closing adjustments including fair values and foreign exchange rates prevailing at the date of closing. The
transaction will increase the Bank’s common equity Tier 1 (CET1) ratio by approximately five basis points.
Pension fund operations in Colombia
On August 9, 2019, the Bank announced the sale of its 51% interest in AFP Colfondos to AFP Habitat. The transaction is expected to close in fiscal 2020 and is subject to
regulatory approvals and closing conditions.
As this transaction met the accounting requirements of assets held for sale, a loss of approximately $46 million after tax, that primarily represents the carrying value of
goodwill relating to this business, was recorded in Non-interest income – Other and reported in the Other segment.
Closed divestitures impacting the current year
Pension and insurance operations in the Dominican Republic
On April 30, 2019, the Bank completed the sale of Scotia Crecer AFP and Scotia Seguros, its pension and related insurance businesses in the Dominican Republic to Grupo
Rizek, upon receiving regulatory approvals and satisfying closing conditions.
All assets and liabilities of approximately $111 million and $26 million, respectively, in relation to this business have been derecognized on the date of close and a net gain of
approximately $273 million after tax was recorded in Non-interest income – Other and reported in the Other segment.
Banking operations in the Caribbean
On November 27, 2018, the Bank announced it has entered into an agreement to sell its banking operations in nine non-core markets in the Caribbean. Subsequently, the
Bank did not close operations in two markets (Antigua and Barbuda, and Guyana) while remaining seven (Anguilla, Dominica, Grenada, St. Kitts & Nevis, St. Lucia, St.
Maarten, St. Vincent & the Grenadines) were sold to Republic Financial Holdings Limited on October 31, 2019, upon receiving regulatory approvals and satisfying closing
conditions.
236 | 2019 Scotiabank Annual Report

Consolidated Financial Statements
All assets and liabilities of approximately $2,086 million and $2,069 million, respectively, in relation to these operations have been derecognized on the date of close and a
net gain of approximately $38 million after tax was recorded in Non-interest income – Other and reported in the Other segment.
Divestitures previously announced not yet impacting the Bank’s financial results
Thanachart Bank, Thailand
On August 8, 2019, the Bank announced that it has signed agreements with ING Groep N.V., Thanachart Bank Public Company Limited (“TBank”) and TMB Bank Public
Company Limited (“TMB”) that largely follow the memorandum of understanding announced on February 26, 2019. The carrying value of the Bank’s 49% interest in TBank
was $3.55 billion as at October 31, 2019.
Upon closing and pursuant to these agreements, the Bank will sell its interest in TBank in exchange for cash and shares in TMB (and ultimately the new bank resulting from
the subsequent merger of TMB and TBank (“the Merged Bank”)). Based on current values, this would result in the Bank owning approximately 6% of the Merged Bank.
The announced transaction is subject to customary closing conditions, including regulatory approvals, and other non-customary closing conditions which are particular to the
many parties involved. The transaction is expected to close in fiscal 2020.
The Bank will continue to retain 49% interest in two TBank subsidiaries that are not part of these signed agreements.
Insurance operations in the Caribbean
On November 27, 2018, the Bank announced its subsidiaries in Jamaica and Trinidad & Tobago will sell their insurance operations. The Bank will partner with the buyer to
provide an expanded suite of insurance products and services to its customers. Subsequently, the Bank and acquirer have mutually agreed not to proceed with the proposed
sale of insurance operations in Jamaica.
2019 Scotiabank Annual Report | 237

Management’s Discussion and Analysis
Management’s Report on Internal Control Over Financial Reporting
The management of The Bank of Nova Scotia (the Bank) is responsible for establishing and maintaining adequate internal control over financial reporting, and have
designed such internal control over financial reporting to provide reasonable assurance regarding the reliability of financial reporting and the preparation of financial
statements for external purposes in accordance with International Financial Reporting Standards as issued by the International Accounting Standards Board.
Management has used the Internal Control – Integrated Framework (2013) to evaluate the effectiveness of internal control over financial reporting, which is a
recognized and suitable framework developed by the Committee of Sponsoring Organizations of the Treadway Commission (COSO).
Because of its inherent limitations, internal control over financial reporting may not prevent or detect misstatements. Also, projections of any evaluation of effectiveness
to future periods are subject to the risk that controls may become inadequate because of changes in conditions, or that the degree of compliance with the policies or
procedures may deteriorate.
Management has evaluated the design and operation of the Bank’s internal control over financial reporting as of October 31, 2019, and has concluded that such internal
control over financial reporting is effective. There are no material weaknesses that have been identified by management in this regard.
KPMG LLP, the independent auditors appointed by the shareholders of the Bank, who have audited the consolidated financial statements, have also audited internal
control over financial reporting and have issued their report below.
Brian J. Porter Raj Viswanathan
President and Chief Executive Officer Executive Vice President and Chief Financial Officer
Toronto, Canada
November 26, 2019
Report of Independent Registered Public Accounting Firm
To the Shareholders of The Bank of Nova Scotia
Opinion on Internal Control Over Financial Reporting
We have audited The Bank of Nova Scotia’s internal control over financial reporting as of October 31, 2019, based on the criteria established in Internal Control – Integrated
Framework (2013) issued by the Committee of Sponsoring Organizations of the Treadway Commission.
In our opinion, The Bank of Nova Scotia (the Bank) maintained, in all material respects, effective internal control over financial reporting as of October 31, 2019, based on
the criteria established in Internal Control – Integrated Framework (2013) issued by the Committee of Sponsoring Organizations of the Treadway Commission.
We also have audited, in accordance with the standards of the Public Company Accounting Oversight Board (United States) (PCAOB), the consolidated statements of
financial position of the Bank as at October 31, 2019, and 2018, the related consolidated statements of income, comprehensive income, changes in equity and cash flows for
each of the years in the three-year period ended October 31, 2019, and the related notes (collectively, the consolidated financial statements) and our report dated
November 26, 2019 expressed an unqualified opinion on those consolidated financial statements.
Basis for Opinion
The Bank’s management is responsible for maintaining effective internal control over financial reporting and for its assessment of the effectiveness of internal control over
financial reporting, included under the heading “Management’s Report on Internal Control Over Financial Reporting” above. Our responsibility is to express an opinion on the
Bank’s internal control over financial reporting based on our audit.
We are a public accounting firm registered with the PCAOB and are required to be independent with respect to the Bank in accordance with the U.S. federal securities
laws and the applicable rules and regulations of the Securities and Exchange Commission and the PCAOB.
We conducted our audit in accordance with the standards of the PCAOB. Those standards require that we plan and perform the audit to obtain reasonable assurance
about whether effective internal control over financial reporting was maintained in all material respects. Our audit of internal control over financial reporting included obtaining
an understanding of internal control over financial reporting, assessing the risk that a material weakness exists, and testing and evaluating the design and operating
effectiveness of internal control based on the assessed risk. Our audit also included performing such other procedures as we considered necessary in the circumstances.
We believe that our audit provides a reasonable basis for our opinion.
Definition and Limitations of Internal Control Over Financial Reporting
A company’s internal control over financial reporting is a process designed to provide reasonable assurance regarding the reliability of financial reporting and the preparation
of financial statements for external purposes in accordance with generally accepted accounting principles. A company’s internal control over financial reporting includes
those policies and procedures that (1) pertain to the maintenance of records that, in reasonable detail, accurately and fairly reflect the transactions and dispositions of the
assets of the company; (2) provide reasonable assurance that transactions are recorded as necessary to permit preparation of financial statements in accordance with
generally accepted accounting principles, and that receipts and expenditures of the company are being made only in accordance with authorizations of management and
directors of the company; and (3) provide reasonable assurance regarding prevention or timely detection of unauthorized acquisition, use, or disposition of the company’s
assets that could have a material effect on the financial statements.
Because of its inherent limitations, internal control over financial reporting may not prevent or detect misstatements. Also, projections of any evaluation of effectiveness
to future periods are subject to the risk that controls may become inadequate because of changes in conditions, or that the degree of compliance with the policies or
procedures may deteriorate.
Chartered Professional Accountants, Licensed Public Accountants
Toronto, Canada
November 26, 2019
134 | 2019 Scotiabank Annual Report

Exhibit 99.5
CORPORATE GOVERNANCE
Corporate Governance Regulation
The Board of Directors and management believe that a strong, effective, independent Board plays a crucial role in building long-term sustainable growth
in shareholder value, maximizing the value shareholders receive from their investment in the Bank and protecting the interests of stakeholders. The
Board is committed to meeting high standards of corporate governance in all aspects of the Bank’s affairs.
The Bank’s corporate governance practices are regulated by many different parties, including the Bank’s primary regulator, the Office of the
Superintendent of Financial Institutions Canada, and the Board looks to evolving best practices domestically and internationally in reviewing its
corporate governance practices. Our practices:
• Meet or exceed the standards set out in the guidelines and rules of the Bank Act (Canada) (the “Bank Act”) and those of the Canadian
Securities Administrators (“CSA”) — which include National Instrument 52-110, National Instrument 52-109, National Policy 58-201 and
National Instrument 58-101, and
• Comply with applicable requirements of the New York Stock Exchange (“NYSE”) and the Sarbanes-Oxley Act of 2002, including
applicable rules of the U.S. Securities and Exchange Commission.
The Bank is not required to comply with most of the NYSE corporate governance rules. However, the Bank meets or exceeds these rules in all
significant respects, except as summarized in the Corporate Governance section of the Bank’s website (https://www.scotiabank.com/ca/en/about/inside-
scotiabank/corporate-governance/differences.html).
The Corporate Governance Policies and the committee charters are available in the Corporate Governance section of the Bank’s website and in
print to any shareholder who requests a copy from the Bank’s Corporate Secretary. Additional information on the Bank’s Audit and Conduct Review
Committee, including a copy of its charter and descriptions of its members and their applicable education and experience, can be found in Exhibit 1, the
Bank’s Annual Information Form under the heading “The Bank’s Audit and Conduct Review Committee” and in Schedule “C” thereto.
Director Independence
The Bank is committed to complying with all applicable laws, rules and regulations related to the status of its Directors. The Bank defines a Director
who does not have a direct or indirect material relationship with the Bank as independent. The Board has approved Director Independence Standards
(the “Independence Standards”), which provide a framework for the Board to assess any material relationships of the Directors with the Bank. The
Independence Standards are derived from the Bank Act Affiliated Persons Regulations, the CSA rules and the NYSE corporate governance rules. Each
year:

• The Board reviews its Directors against these standards, considering all relevant facts and circumstances, including the relationship of the
non-management Directors to the Bank — as well as any relationship to the Bank of their spouses, children, principal business affiliations
and any other relevant individuals.
• All Directors complete a detailed questionnaire to inform this review.
• All Directors certify their compliance with the Bank’s Code of Conduct, including the requirement that they declare any material interest
in matters coming before the Board.
Brian J. Porter is non-independent, due to his position as President and Chief Executive Officer.
That means, 12 of the current 13 (or 92%) Directors are independent, including Aaron W. Regent, the Chairman of the Board.
The Board also takes appropriate steps to ensure that the Board is able to function independent of management.
The independent members of the Board held an “in camera” session at all but one regularly scheduled Board meeting held in fiscal 2019. Prior to
Eduardo Pacheco’s retirement from the Board, the non-executive members of the Board held an “in camera” session at all but one regularly scheduled
Board meetings held in fiscal 2019.
The following Directors are independent: Nora A. Aufreiter, Guillermo E. Babatz, Scott B. Bonham, Charles H. Dallara, Tiff Macklem,
Michael D. Penner, Una M. Power, Aaron W. Regent, Indira V. Samarasekera, Susan L. Segal, L. Scott Thomson and Benita M. Warmbold.
Director Independence Standards
A majority of the Bank’s directors are independent, as required by the CSA’s National Policy 58- 201 — Corporate Governance Guidelines and the
NYSE listed company corporate governance rules. To be considered independent under these rules, the Board must determine that a director has no
direct or indirect material relationship with the Bank. A material relationship is a relationship that could, in the view of the Board, be reasonably
expected to interfere with the exercise of a director’s judgement independent of management. The rules permit the Board to adopt categorical standards
in making its independence determinations. The standards adopted by the Board are reproduced below. Definitions and interpretation of terms in the
standards are in accordance with applicable source rules and regulations, as amended from time to time. In applying these standards, the Board broadly
considers all relevant facts and circumstances.

1. A director will not be independent if:
• the director is, or has been within the last three years, an employee or executive officer of the Bank or a subsidiary, or an immediate family
member of the director is, or has been within the last three years, an executive officer of the Bank or a subsidiary;
• the director has received, or an immediate family member of the director has received for service as an executive officer, during any
twelve-month period within the last three years, more than the lesser of Cdn$75,000 and US$120,000 in direct compensation from the
Bank or a subsidiary, other than director and committee fees and pension or other forms of deferred compensation for prior service
(provided such compensation is not contingent in any way on continued service);
• (a) the director or an immediate family member of the director is a current partner of a firm that is the Bank’s or a subsidiary’s internal or
external auditor; (b) the director is a current employee of such firm; (c) an immediate family member of the director is a current employee
of such a firm and personally works on the Bank’s or a subsidiary’s audit, or the director’s spouse, or child or stepchild who shares a home
with the director, is an employee of such firm and participates in the firm’s audit, assurance or tax compliance (but not tax planning)
practice; or (d) the director or an immediate family member was within the last three years a partner or employee of such a firm and
personally worked on the Bank’s or a subsidiary’s audit within that time;
• the director or an immediate family member of the director, is, or has been within the last three years, employed as an executive officer of
another company where any of the Bank’s or a subsidiary’s present executive officers at the same time serves or served on that company’s
compensation committee;
• the director is currently an employee, or an immediate family member of the director is currently an executive officer, of a company that
has made payments to, or received payments from, the Bank or a subsidiary for property or services in an amount which, in any of the last
three fiscal years, exceeds the greater of US$1 million or 2% of such other company’s consolidated gross revenues (with the exception that
contributions to tax exempt organizations shall not be considered payments for this purpose); or
• the director is “affiliated” with the Bank as that term is used in the Affiliated Persons (Banks) Regulations made under the Bank Act.
An “immediate family member” includes a person’s spouse, parents, children, stepchildren, siblings, mothers and fathers-in-law, sons and
daughters-in-law, brothers and sisters-in-law, and anyone (other than domestic employees) who shares the person’s home.
2. In addition to satisfying the independence standards set forth above, members of the audit committee must satisfy the following additional
independence requirements:
• An audit committee member may not accept, directly or indirectly, any consulting, advisory or other compensatory fee from the Bank or
any subsidiary, other than compensation in his

or her capacity as a member of the Board or any committee or any fixed amount of compensation under a retirement plan (including
deferred compensation) for prior service with the Bank (provided such compensation is not contingent in any way on continued service).
• An audit committee member may not be an “affiliated” person of the Bank or any subsidiary, as defined in applicable Canadian and U.S.
securities laws.
The indirect acceptance by an audit committee member of any consulting, advisory or other compensatory fee includes acceptance of such fee by a
spouse, minor child or stepchild or a child or stepchild who shares a home with the audit committee member or by an entity in which such audit
committee member is a partner, member, an officer such as a managing director occupying a comparable position or executive officer, or occupies a
similar position (except limited partners, non-managing members and those occupying similar positions who, in each case, have no active role in
providing services to the entity) and which provides accounting, consulting, legal, investment banking or financial advisory services to the Bank or any
subsidiary.
3. In addition to satisfying the independence standards set forth above in section 1, in affirmatively determining the independence of any director
who will serve on the Bank’s compensation committee, the Board must consider all factors specifically relevant to determining whether a director
has a relationship to the Bank which is material to that director’s ability to be independent from management in connection with the duties of a
compensation committee member, including, but not limited to:
• the source of compensation of such director, including any consulting, advisory or other compensatory fee paid by the Bank or a
subsidiary to such director; and
• whether such director is affiliated with the Bank, a subsidiary of the Bank or an affiliate of a subsidiary of the Bank.
Whether directors meet these categorical independence standards will be reviewed and will be made public annually prior to their standing for
re-election to the Board. The Board will examine factors such as tenure, as well as, relationships such as the nature of the director’s banking, lending or
other business dealings with the Bank or a director’s role in a charitable organization which has received a certain level of contributions from the Bank.
For relationships not covered by the standards in section 1 above, the determination of whether the relationship is material, and therefore whether the
director would be independent, will be made by the directors who satisfy those standards. The Bank will disclose the basis for any Board determination
that a relationship is immaterial despite the fact that it does not meet the categorical standards set forth above.

Exhibit 99.6
KPMG LLP Telephone (416) 777-8500
Chartered Professional Accountants Fax (416) 777-8818
Bay Adelaide Centre www.kpmg.ca
Suite 4600
333 Bay Street
Toronto, ON M5H 2S5
CONSENT OF INDEPENDENT REGISTERED PUBLIC ACCOUNTING FIRM
To the Board of Directors of The Bank of Nova Scotia
We consent to the inclusion in this annual report on Form 40-F of:
i) our report of independent registered public accounting firm dated November 26, 2019 to the Shareholders of the Bank on the consolidated
financial statements of the Bank, which comprise the consolidated statements of financial position as at October 31, 2019 and October 31, 2018,
the related consolidated statements of income, comprehensive income, changes in equity and cash flows for each of the years in the three-year
period ended October 31, 2019, and the related notes; and
ii) our report of independent registered public accounting firm dated November 26, 2019 to the Shareholders of the Bank on the effectiveness of
internal control over financial reporting as of October 31, 2019;
each of which is contained in this annual report on Form 40-F of the Bank for the fiscal year ended October 31, 2019.
We also consent to the incorporation by reference of such reports in the Registration Statement – Form F-3 – File No. 333-228614 and the Registration
Statement – Form S-8 – File No. 333-199099 of the Bank.
Chartered Professional Accountants, Licensed Public Accountants
November 26, 2019
Toronto, Canada
KPMG LLP is a Canadian limited liability partnership and a
member firm of the KPMG network of independent member
firms affiliated with KPMG International Cooperative (“KPMG
International”), a Swiss entity. KPMG Canada provides services
to KPMG LLP.

Exhibit 99.7
CERTIFICATIONS
I, BRIAN J. PORTER, certify that:
1. I have reviewed the annual report on Form 40-F of The Bank of Nova Scotia;
2. Based on my knowledge, this report does not contain any untrue statement of a material fact or omit to state a material fact necessary to make the
statements made, in light of the circumstances under which such statements were made, not misleading with respect to the period covered by this
report;
3. Based on my knowledge, the financial statements, and other financial information included in this report, fairly present in all material respects the
financial condition, results of operations and cash flows of the issuer as of, and for, the periods presented in this report;
4. The issuer’s other certifying officer(s) and I are responsible for establishing and maintaining disclosure controls and procedures (as defined in
Exchange Act Rules 13a-15(e) and 15d-15(e)) and internal control over financial reporting (as defined in Exchange Act Rules 13a-15(f) and
15d-15(f)) for the issuer and have:
a) Designed such disclosure controls and procedures, or caused such disclosure controls and procedures to be designed under our
supervision, to ensure that material information relating to the issuer, including its consolidated subsidiaries, is made known to us by
others within those entities, particularly during the period in which this report is being prepared;
b) Designed such internal control over financial reporting, or caused such internal control over financial reporting to be designed under our
supervision, to provide reasonable assurance regarding the reliability of financial reporting and the preparation of financial statements for
external purposes in accordance with generally accepted accounting principles;
c) Evaluated the effectiveness of the issuer’s disclosure controls and procedures and presented in this report our conclusions about the
effectiveness of the disclosure controls and procedures, as of the end of the period covered by this report based on such evaluation; and
d) Disclosed in this report any change in the issuer’s internal control over financial reporting that occurred during the period covered by the
annual report that has materially affected, or is reasonably likely to materially affect, the issuer’s internal control over financial reporting;
and

5. The issuer’s other certifying officer(s) and I have disclosed, based on our most recent evaluation of internal control over financial reporting, to the
issuer’s auditors and the audit committee of the issuer’s board of directors (or persons performing the equivalent functions):
a) All significant deficiencies and material weaknesses in the design or operation of internal control over financial reporting which are
reasonably likely to adversely affect the issuer’s ability to record, process, summarize and report financial information; and
b) Any fraud, whether or not material, that involves management or other employees who have a significant role in the issuer’s internal
control over financial reporting.
Date: November 26, 2019
/s/ Brian J. Porter
Brian J. Porter
President and Chief Executive Officer

CERTIFICATIONS
I, RAJAGOPAL VISWANATHAN, certify that:
1. I have reviewed the annual report on Form 40-F of The Bank of Nova Scotia;
2. Based on my knowledge, this report does not contain any untrue statement of a material fact or omit to state a material fact necessary to make the
statements made, in light of the circumstances under which such statements were made, not misleading with respect to the period covered by this
report;
3. Based on my knowledge, the financial statements, and other financial information included in this report, fairly present in all material respects the
financial condition, results of operations and cash flows of the issuer as of, and for, the periods presented in this report;
4. The issuer’s other certifying officer(s) and I are responsible for establishing and maintaining disclosure controls and procedures (as defined in
Exchange Act Rules 13a-15(e) and 15d-15(e)) and internal control over financial reporting (as defined in Exchange Act Rules 13a-15(f) and
15d-15(f)) for the issuer and have:
a) Designed such disclosure controls and procedures, or caused such disclosure controls and procedures to be designed under our
supervision, to ensure that material information relating to the issuer, including its consolidated subsidiaries, is made known to us by
others within those entities, particularly during the period in which this report is being prepared;
b) Designed such internal control over financial reporting, or caused such internal control over financial reporting to be designed under our
supervision, to provide reasonable assurance regarding the reliability of financial reporting and the preparation of financial statements for
external purposes in accordance with generally accepted accounting principles;
c) Evaluated the effectiveness of the issuer’s disclosure controls and procedures and presented in this report our conclusions about the
effectiveness of the disclosure controls and procedures, as of the end of the period covered by this report based on such evaluation; and
d) Disclosed in this report any change in the issuer’s internal control over financial reporting that occurred during the period covered by the
annual report that has materially affected, or is reasonably likely to materially affect, the issuer’s internal control over financial reporting;
and

5. The issuer’s other certifying officer(s) and I have disclosed, based on our most recent evaluation of internal control over financial reporting, to the
issuer’s auditors and the audit committee of the issuer’s board of directors (or persons performing the equivalent functions):
a) All significant deficiencies and material weaknesses in the design or operation of internal control over financial reporting which are
reasonably likely to adversely affect the issuer’s ability to record, process, summarize and report financial information; and
b) Any fraud, whether or not material, that involves management or other employees who have a significant role in the issuer’s internal
control over financial reporting.
Date: November 26, 2019
/s/ Rajagopal Viswanathan
Rajagopal Viswanathan
Executive Vice-President and Chief Financial Officer

Exhibit 99.8
CERTIFICATION PURSUANT TO 18 U.S.C. SECTION 1350,
AS ENACTED PURSUANT TO
SECTION 906 OF THE U.S. SARBANES-OXLEY ACT OF 2002
In connection with the annual report of The Bank of Nova Scotia (the “Bank”) on Form 40-F for the year ended October 31, 2019 (the “Report”) as filed
with the U.S. Securities and Exchange Commission,
I, Brian J. Porter, President and Chief Executive Officer of the Bank, certify, pursuant to 18 U.S.C. section 1350, as enacted pursuant to section 906 of
the U.S. Sarbanes-Oxley Act of 2002, that to my knowledge:
(i) the Report fully complies with the requirements of section 13(a) or 15(d) of the U.S. Securities Exchange Act of 1934; and
(ii) the information contained in the Report fairly presents, in all material respects, the financial condition and results of operations of the
Bank.
November 26, 2019 /s/ Brian J. Porter
Brian J. Porter
President and Chief Executive Officer
CERTIFICATION PURSUANT TO 18 U.S.C. SECTION 1350,
AS ENACTED PURSUANT TO
SECTION 906 OF THE U.S. SARBANES-OXLEY ACT OF 2002
In connection with the annual report of The Bank of Nova Scotia (the “Bank”) on Form 40-F for the year ended October 31, 2019 (the “Report”) as filed
with the U.S. Securities and Exchange Commission,
I, Rajagopal Viswanathan, Executive Vice-President and Chief Financial Officer of the Bank, certify, pursuant to 18 U.S.C. section 1350, as enacted
pursuant to section 906 of the U.S. Sarbanes-Oxley Act of 2002, that to my knowledge:
(i) the Report fully complies with the requirements of section 13(a) or 15(d) of the U.S. Securities Exchange Act of 1934; and
(ii) the information contained in the Report fairly presents, in all material respects, the financial condition and results of operations of the
Bank.
November 26, 2019 /s/ Rajagopal Viswanathan
Rajagopal Viswanathan
Executive Vice-President and Chief Financial Officer