the balanced scorecard - amazon web services · total 100.0% n/a n/a n/a n/a 0.0% performance...
TRANSCRIPT

The Service Desk
Balanced ScorecardYour Overall Measure of Service Desk Performance
MetricNet Best Practices Series

MetricNet’s Service Desk Balanced Scorecard
Your Speaker: Jeff Rumburg
© MetricNet, LLC, www.metricnet.com
Co Founder and Managing Partner,
MetricNet, LLC
Winner of the 2014 Ron Muns
Lifetime Achievement Award
Former CEO, The Verity Group
Former Vice President, Gartner
Founder of the Service Desk
Benchmarking Consortium
Author of A Hands-On Guide to
Competitive Benchmarking
Harvard MBA, Stanford MS
1

The Service Desk
Balanced ScorecardYour Overall Measure of Service Desk Performance
MetricNet Best Practices Series

About MetricNet:
Your Benchmarking Partner
3
MetricNet’s Service Desk Balanced Scorecard
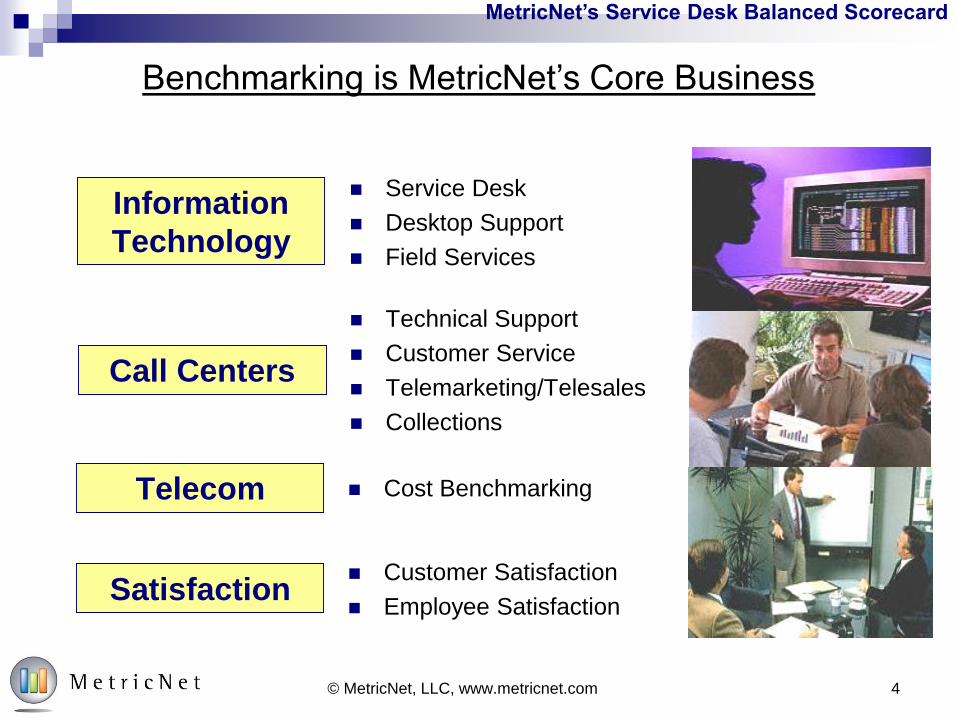
Benchmarking is MetricNet’s Core Business
Call Centers
Telecom
Information
Technology
Satisfaction
Technical Support
Customer Service
Telemarketing/Telesales
Collections
Service Desk
Desktop Support
Field Services
Cost Benchmarking
Customer Satisfaction
Employee Satisfaction
© MetricNet, LLC, www.metricnet.com 4
MetricNet’s Service Desk Balanced Scorecard
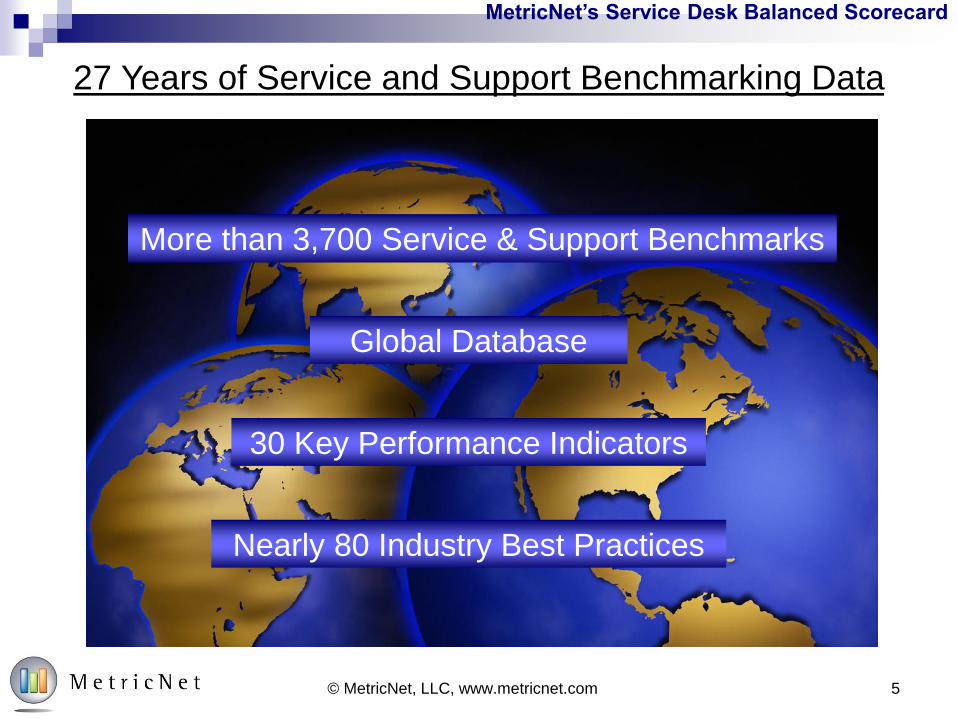
27 Years of Service and Support Benchmarking Data
More than 3,700 Service & Support Benchmarks
Global Database
30 Key Performance Indicators
Nearly 80 Industry Best Practices
© MetricNet, LLC, www.metricnet.com 5
MetricNet’s Service Desk Balanced Scorecard
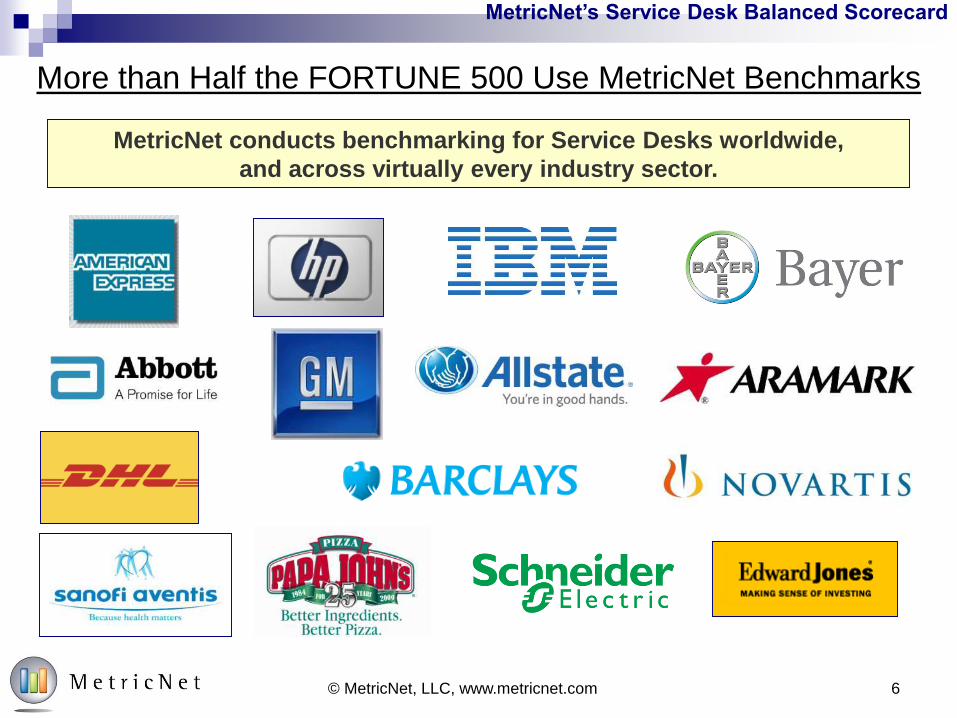
More than Half the FORTUNE 500 Use MetricNet Benchmarks
MetricNet conducts benchmarking for Service Desks worldwide,
and across virtually every industry sector.
© MetricNet, LLC, www.metricnet.com 6

The Service Desk
Balanced ScorecardYour Overall Measure of Service Desk Performance
MetricNet Best Practices Series
MetricNet’s Service Desk Balanced ScorecardMetricNet’s Service Desk Balanced Scorecard
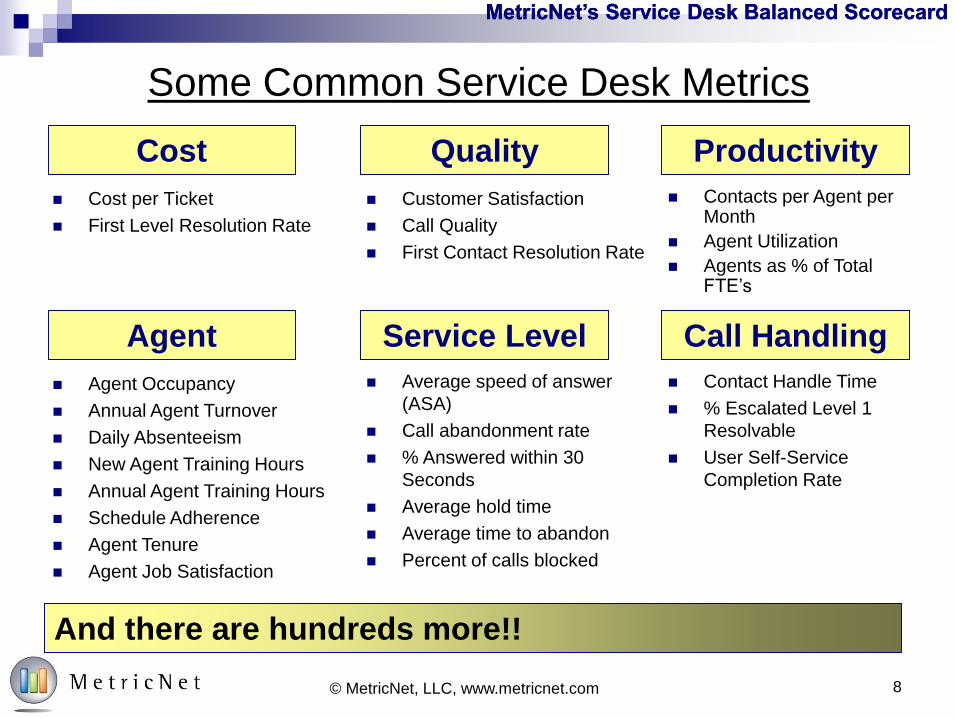
Some Common Service Desk Metrics
Cost per Ticket
First Level Resolution Rate
Cost
Service Level
Quality
Call HandlingAgent
Average speed of answer
(ASA)
Call abandonment rate
% Answered within 30
Seconds
Average hold time
Average time to abandon
Percent of calls blocked
Contacts per Agent per Month
Agent Utilization
Agents as % of Total FTE’s
Customer Satisfaction
Call Quality
First Contact Resolution Rate
Agent Occupancy
Annual Agent Turnover
Daily Absenteeism
New Agent Training Hours
Annual Agent Training Hours
Schedule Adherence
Agent Tenure
Agent Job Satisfaction
Contact Handle Time
% Escalated Level 1
Resolvable
User Self-Service
Completion Rate
And there are hundreds more!!
Productivity
8© MetricNet, LLC, www.metricnet.com
MetricNet’s Service Desk Balanced Scorecard
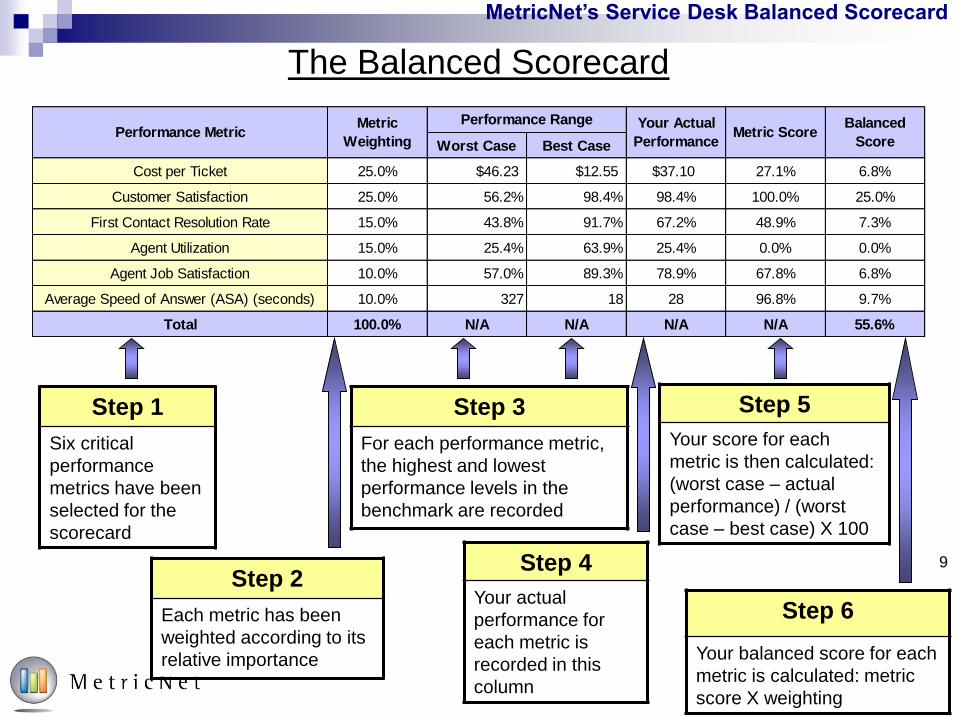
The Balanced Scorecard
Step 1
Six critical
performance
metrics have been
selected for the
scorecard
Step 2
Each metric has been
weighted according to its
relative importance
Step 3
For each performance metric,
the highest and lowest
performance levels in the
benchmark are recorded
Step 4
Your actual
performance for
each metric is
recorded in this
column
Step 5
Your score for each
metric is then calculated:
(worst case – actual
performance) / (worst
case – best case) X 100
Step 6
Your balanced score for each
metric is calculated: metric
score X weighting
9
Worst Case Best Case
Cost per Ticket 25.0% $46.23 $12.55 $37.10 27.1% 6.8%
Customer Satisfaction 25.0% 56.2% 98.4% 98.4% 100.0% 25.0%
First Contact Resolution Rate 15.0% 43.8% 91.7% 67.2% 48.9% 7.3%
Agent Utilization 15.0% 25.4% 63.9% 25.4% 0.0% 0.0%
Agent Job Satisfaction 10.0% 57.0% 89.3% 78.9% 67.8% 6.8%
Average Speed of Answer (ASA) (seconds) 10.0% 327 18 28 96.8% 9.7%
Total 100.0% N/A N/A N/A N/A 55.6%
Metric ScoreBalanced
ScorePerformance Metric
Metric
Weighting
Performance Range Your Actual
Performance
MetricNet’s Service Desk Balanced Scorecard
10© MetricNet, LLC, www.metricnet.com
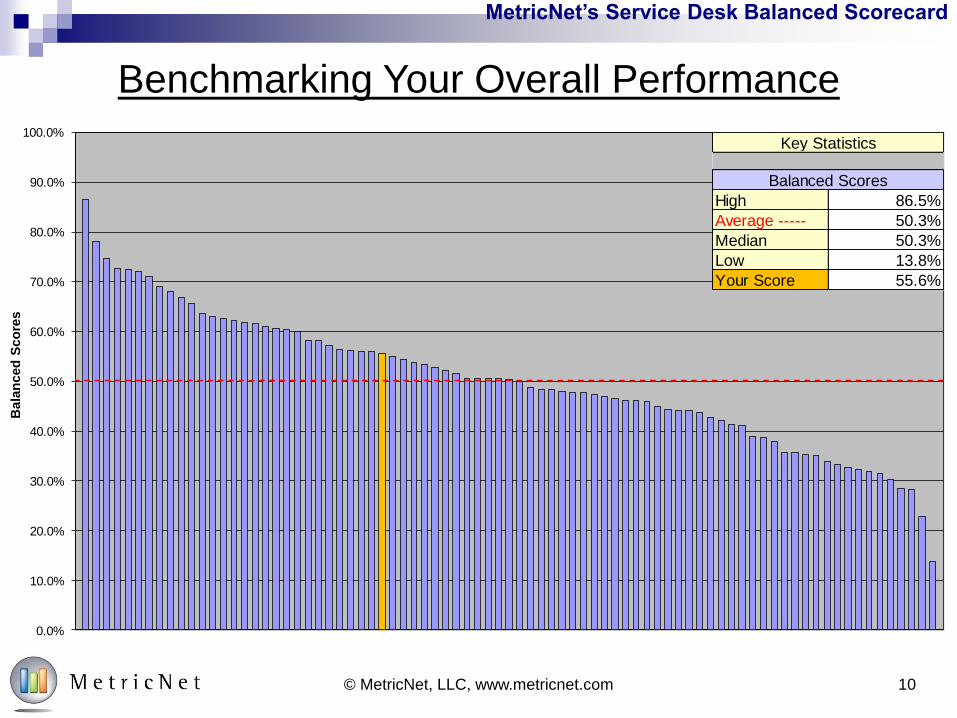
Benchmarking Your Overall Performance
0.0%
10.0%
20.0%
30.0%
40.0%
50.0%
60.0%
70.0%
80.0%
90.0%
100.0%
Ba
lan
ced
Sc
ore
s
High 86.5%
Average ----- 50.3%
Median 50.3%
Low 13.8%
Your Score 55.6%
Balanced Scores
Key Statistics
10© MetricNet, LLC, www.metricnet.com

MetricNet’s Service Desk Balanced Scorecard
The Service Desk Performance Trend
40%
45%
50%
55%
60%
65%
70%
75%
80%
85%
Jan Feb Mar Apr May Jun Jul Aug Sep Oct Nov Dec
Se
rvic
e D
es
k B
ala
nc
ed
Sc
ore
12 Month Average Monthly Score
11© MetricNet, LLC, www.metricnet.com
MetricNet’s Service Desk Balanced Scorecard
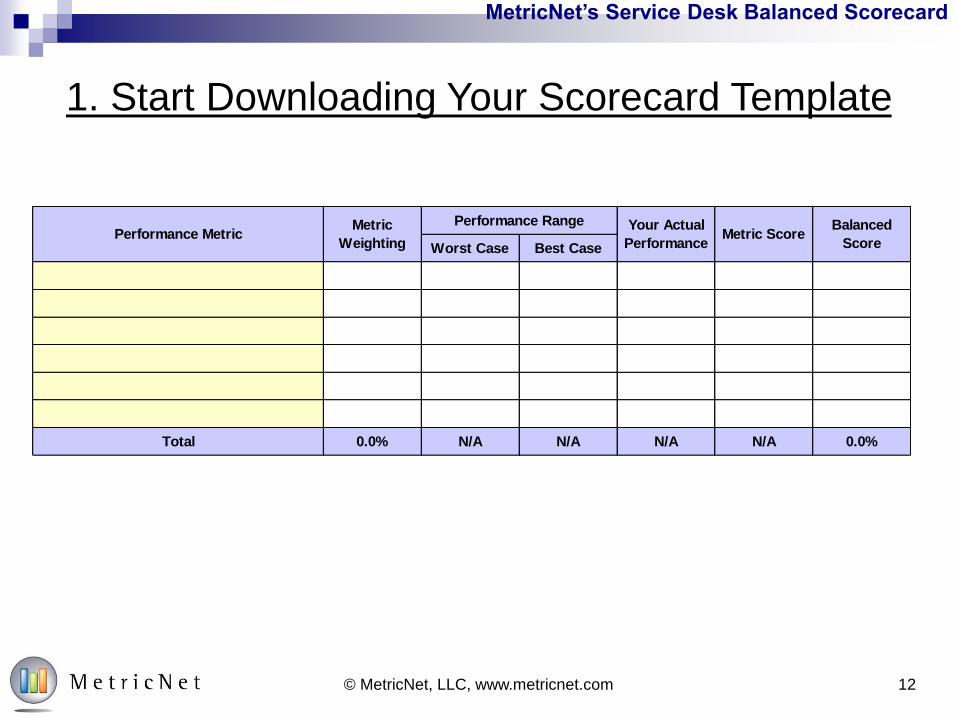
1. Start Downloading Your Scorecard Template
12© MetricNet, LLC, www.metricnet.com
Worst Case Best Case
Total 0.0% N/A N/A N/A N/A 0.0%
Performance MetricMetric
Weighting
Performance Range Your Actual
PerformanceMetric Score
Balanced
Score
MetricNet’s Service Desk Balanced Scorecard
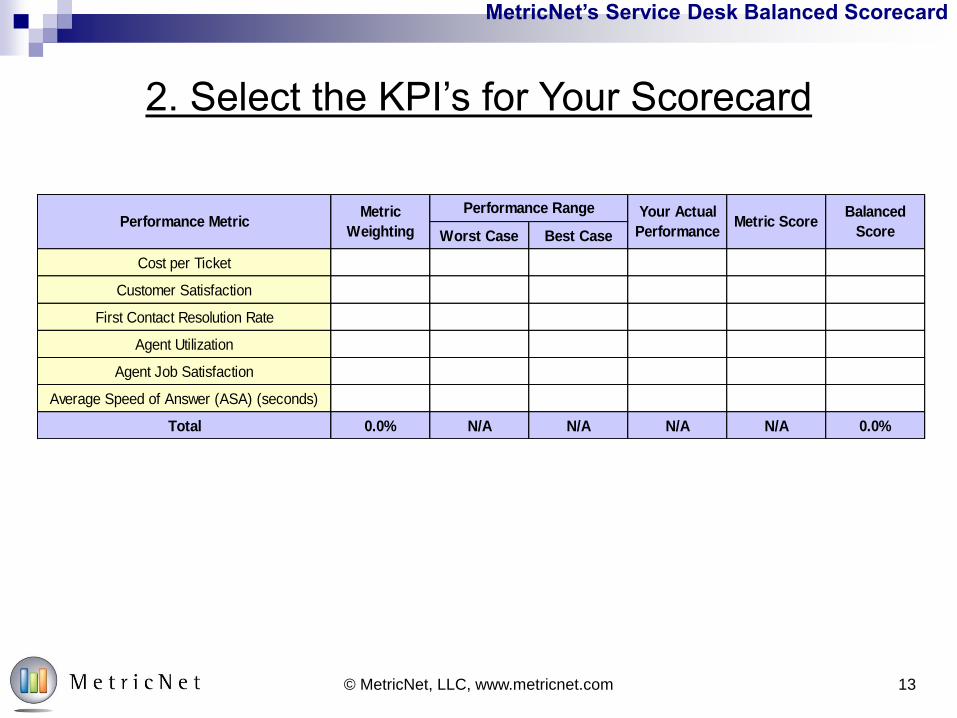
2. Select the KPI’s for Your Scorecard
13© MetricNet, LLC, www.metricnet.com
Worst Case Best Case
Cost per Ticket
Customer Satisfaction
First Contact Resolution Rate
Agent Utilization
Agent Job Satisfaction
Average Speed of Answer (ASA) (seconds)
Total 0.0% N/A N/A N/A N/A 0.0%
Metric ScoreBalanced
ScorePerformance Metric
Metric
Weighting
Performance Range Your Actual
Performance
MetricNet’s Service Desk Balanced Scorecard
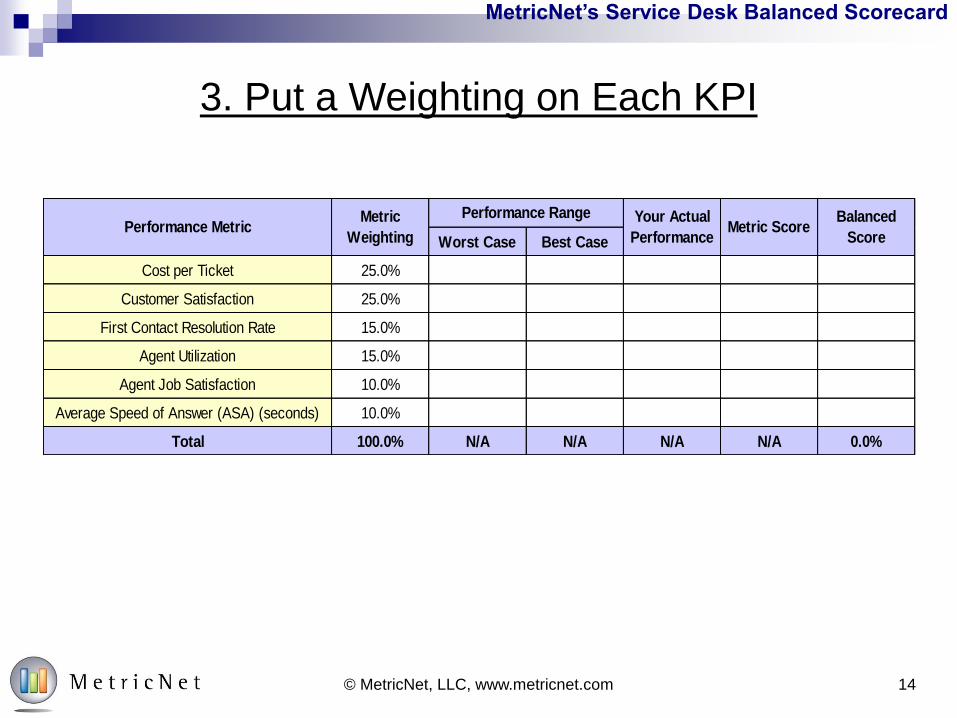
3. Put a Weighting on Each KPI
14© MetricNet, LLC, www.metricnet.com
Worst Case Best Case
Cost per Ticket 25.0%
Customer Satisfaction 25.0%
First Contact Resolution Rate 15.0%
Agent Utilization 15.0%
Agent Job Satisfaction 10.0%
Average Speed of Answer (ASA) (seconds) 10.0%
Total 100.0% N/A N/A N/A N/A 0.0%
Performance MetricMetric
Weighting
Performance Range Your Actual
PerformanceMetric Score
Balanced
Score

MetricNet’s Service Desk Balanced Scorecard
4. Enter Ranges for Each KPI in the Scorecard
15© MetricNet, LLC, www.metricnet.com
Worst Case Best Case
Cost per Ticket 25.0% $46.23 $12.55
Customer Satisfaction 25.0% 56.2% 98.4%
First Contact Resolution Rate 15.0% 43.8% 91.7%
Agent Utilization 15.0% 25.4% 63.9%
Agent Job Satisfaction 10.0% 57.0% 89.3%
Average Speed of Answer (ASA) (seconds) 10.0% 327 18
Total 100.0% N/A N/A N/A N/A 0.0%
Performance MetricMetric
Weighting
Performance Range Your Actual
PerformanceMetric Score
Balanced
Score
MetricNet’s Service Desk Balanced Scorecard
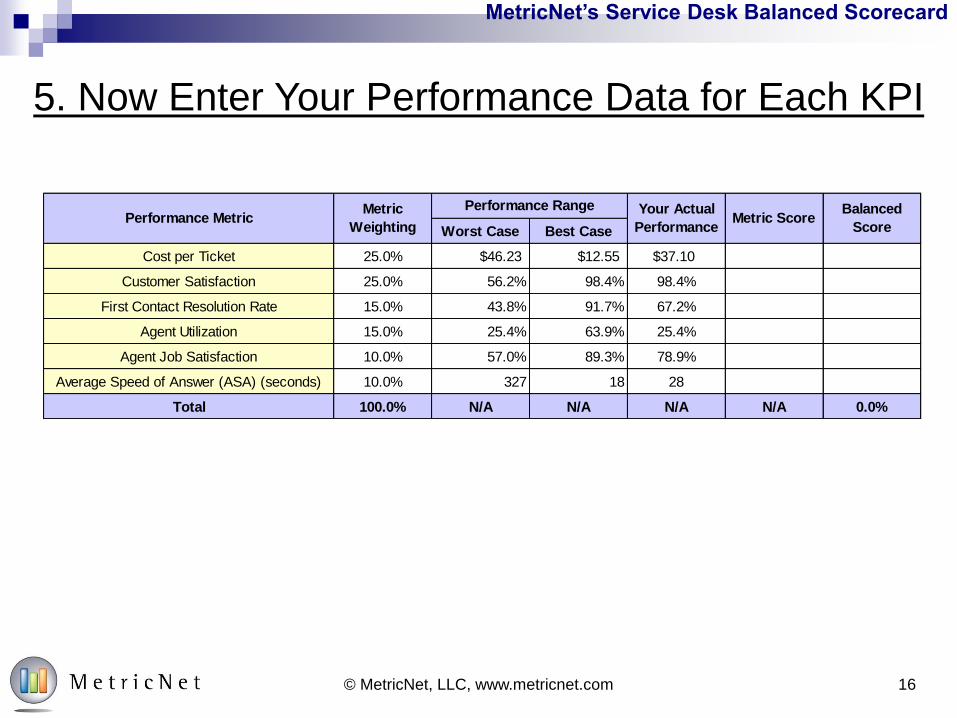
5. Now Enter Your Performance Data for Each KPI
16© MetricNet, LLC, www.metricnet.com
Worst Case Best Case
Cost per Ticket 25.0% $46.23 $12.55 $37.10
Customer Satisfaction 25.0% 56.2% 98.4% 98.4%
First Contact Resolution Rate 15.0% 43.8% 91.7% 67.2%
Agent Utilization 15.0% 25.4% 63.9% 25.4%
Agent Job Satisfaction 10.0% 57.0% 89.3% 78.9%
Average Speed of Answer (ASA) (seconds) 10.0% 327 18 28
Total 100.0% N/A N/A N/A N/A 0.0%
Performance MetricMetric
Weighting
Performance Range Your Actual
PerformanceMetric Score
Balanced
Score
MetricNet’s Service Desk Balanced Scorecard
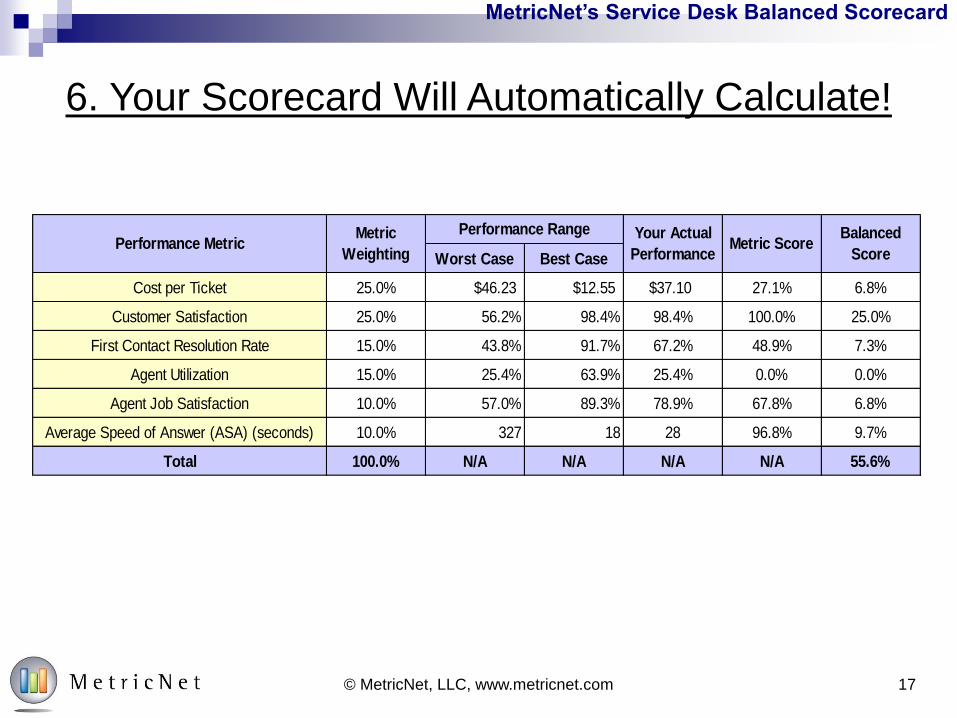
6. Your Scorecard Will Automatically Calculate!
17© MetricNet, LLC, www.metricnet.com
Worst Case Best Case
Cost per Ticket 25.0% $46.23 $12.55 $37.10 27.1% 6.8%
Customer Satisfaction 25.0% 56.2% 98.4% 98.4% 100.0% 25.0%
First Contact Resolution Rate 15.0% 43.8% 91.7% 67.2% 48.9% 7.3%
Agent Utilization 15.0% 25.4% 63.9% 25.4% 0.0% 0.0%
Agent Job Satisfaction 10.0% 57.0% 89.3% 78.9% 67.8% 6.8%
Average Speed of Answer (ASA) (seconds) 10.0% 327 18 28 96.8% 9.7%
Total 100.0% N/A N/A N/A N/A 55.6%
Performance MetricMetric
Weighting
Performance Range Your Actual
PerformanceMetric Score
Balanced
Score
MetricNet’s Service Desk Balanced Scorecard
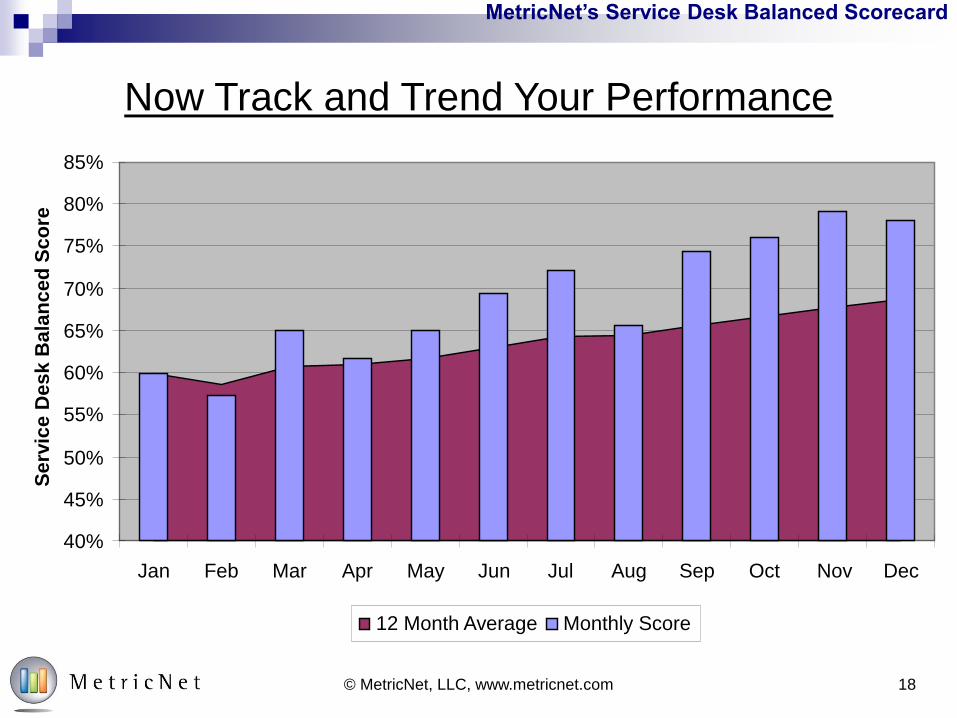
Now Track and Trend Your Performance
40%
45%
50%
55%
60%
65%
70%
75%
80%
85%
Jan Feb Mar Apr May Jun Jul Aug Sep Oct Nov Dec
Se
rvic
e D
es
k B
ala
nc
ed
Sc
ore
12 Month Average Monthly Score
18© MetricNet, LLC, www.metricnet.com

MetricNet’s Service Desk Balanced Scorecard
Let’s Take a Closer Look
19© MetricNet, LLC, www.metricnet.com
Worst Case Best Case
Cost per Ticket
Customer Satisfaction
First Contact Resolution Rate
Agent Utilization
Agent Job Satisfaction
Average Speed of Answer (ASA) (seconds)
Total 0.0% N/A N/A N/A N/A 0.0%
Metric ScoreBalanced
ScorePerformance Metric
Metric
Weighting
Performance Range Your Actual
Performance

MetricNet’s Service Desk Balanced Scorecard
Download the Balanced Scorecard Whitepaper
20© MetricNet, LLC, www.metricnet.com

MetricNet’s Service Desk Balanced Scorecard
21
www.metricnet.com 703.992.8160 [email protected]
You Can Reach MetricNet…

Thank You!
The Service Desk
Balanced ScorecardYour Overall Measure of Service Desk Performance
MetricNet Best Practices Series

About MetricNet:
Your Benchmarking Partner
24

MetricNet’s Service Desk Balanced Scorecard
Your Speaker: Jeff Rumburg
© MetricNet, LLC, www.metricnet.com
Co Founder and Managing Partner,
MetricNet, LLC
Winner of the 2014 Ron Muns
Lifetime Achievement Award
Former CEO, The Verity Group
Former Vice President, Gartner
Founder of the Service Desk
Benchmarking Consortium
Author of A Hands-On Guide to
Competitive Benchmarking
Harvard MBA, Stanford MS
25

MetricNet’s Service Desk Balanced Scorecard
Benchmarking is MetricNet’s Core Business
Call Centers
Telecom
Information
Technology
Satisfaction
Customer Service
Technical Support
Telemarketing/Telesales
Collections
Service Desk
Desktop Support
Field Support
Price Benchmarking
Customer Satisfaction
Employee Satisfaction
26© MetricNet, LLC, www.metricnet.com

MetricNet’s Service Desk Balanced Scorecard
27 Years of IT Service and Support Benchmarking Data
More than 3,700 IT Service and Support Benchmarks
Global Database
70+ Key Performance Indicators
More than 120 Industry Best Practices
27© MetricNet, LLC, www.metricnet.com
MetricNet’s Service Desk Balanced Scorecard
Meet a Sampling of Our Clients
MetricNet Conducts benchmarking for IT Service and Support
organizations worldwide, and across virtually every industry sector.
28© MetricNet, LLC, www.metricnet.com

MetricNet’s Service Desk Balanced Scorecard
29
www.metricnet.com 703.992.8160 [email protected]
You Can Reach MetricNet…

Thank You!