the baby show excel 2015 - visitor results
TRANSCRIPT

Visitor Satisfaction & Commitment
(product, brand and service health check)
March 2015

2
Key Performance Indicators (KPI’s)
3
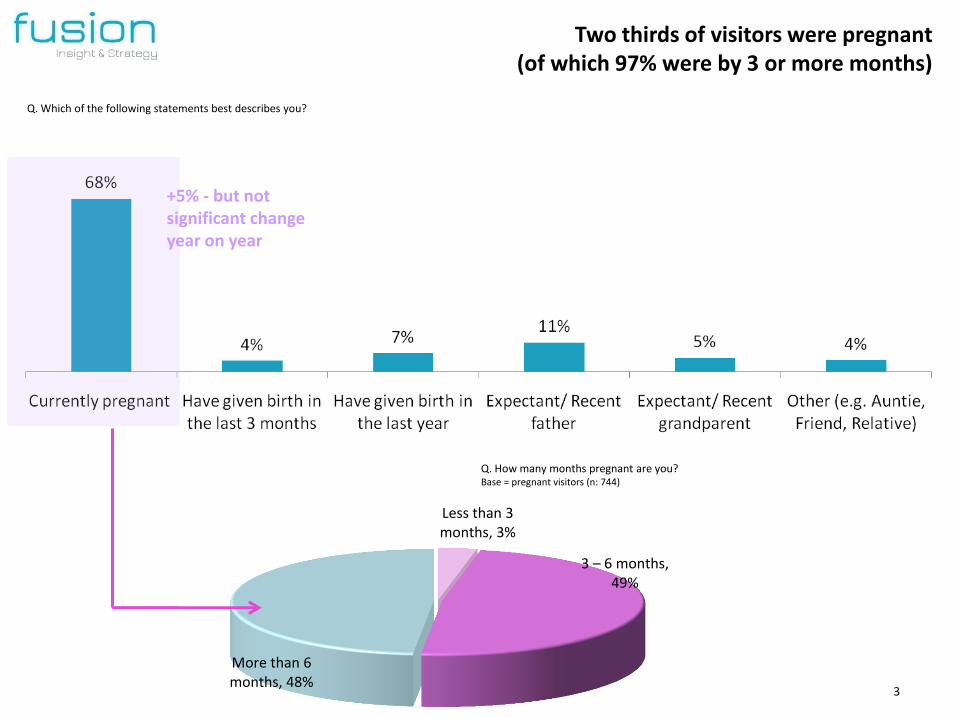
Q. How many months pregnant are you? Base = pregnant visitors (n: 744)
Less than 3 months, 3%
3 – 6 months, 49%
More than 6 months, 48%
Two thirds of visitors were pregnant (of which 97% were by 3 or more months)
Q. Which of the following statements best describes you?
+5% - but not significant change year on year

4
Significant increase on those who were very enthusiastic
(10 out of 10) – Top Box
Q. Once you found out that The Baby Show was taking place, how enthusiastic were you to attend?
58% can be regarded as VERY enthusiastic
(52% in 2014; 56% in 2013) Mean: 8.7
(vs. 8.2 in 2014)

5
87% of visitors gave a rating of excellent or good, 84% in 2014
Q. How would you rate your experience at The Baby Show?
MARKETING LEADING
(8+ out of 10)
ADEQUATE (7 out of 10)
CAUSE FOR CONCERN
(<7 out of 10)
In customer satisfaction terms…
‘MARKET LEADING’ (8.4 out of 10)
No significant difference in rating by typology: whether pregnant, recently given birth, expectant/ recent father or grand parent And no significant difference by day visited
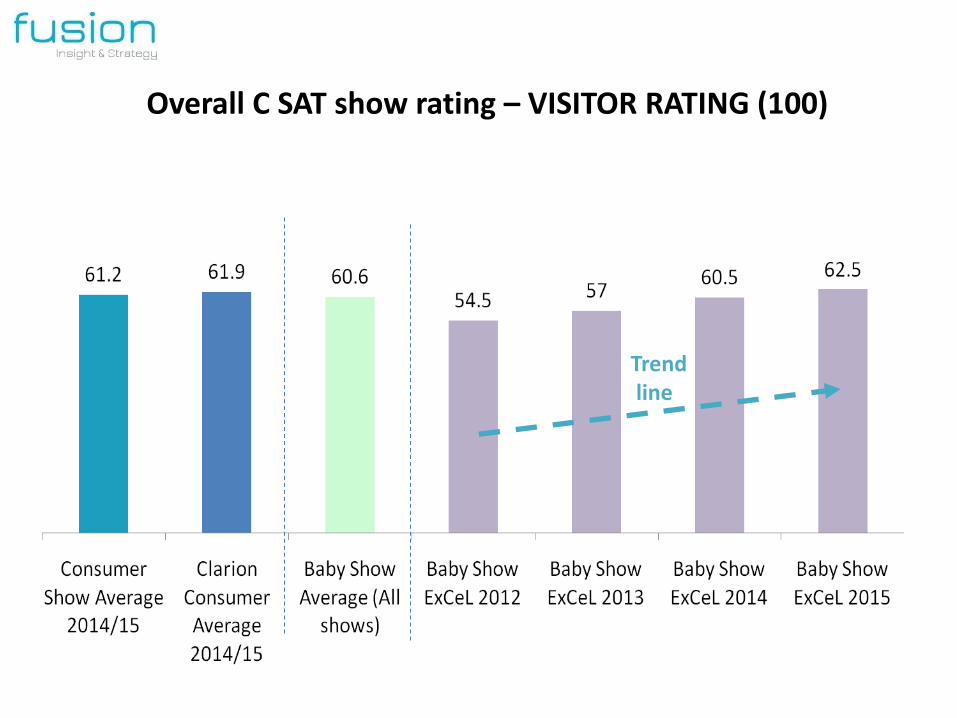
Overall C SAT show rating – VISITOR RATING (100)
Trend line
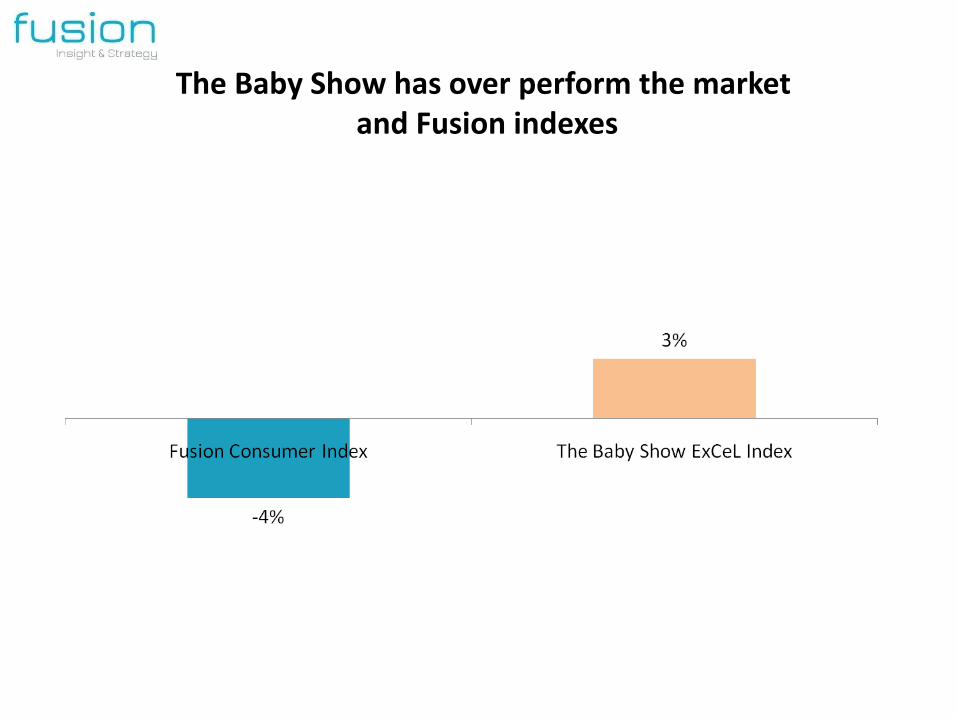
The Baby Show has over perform the market and Fusion indexes
8
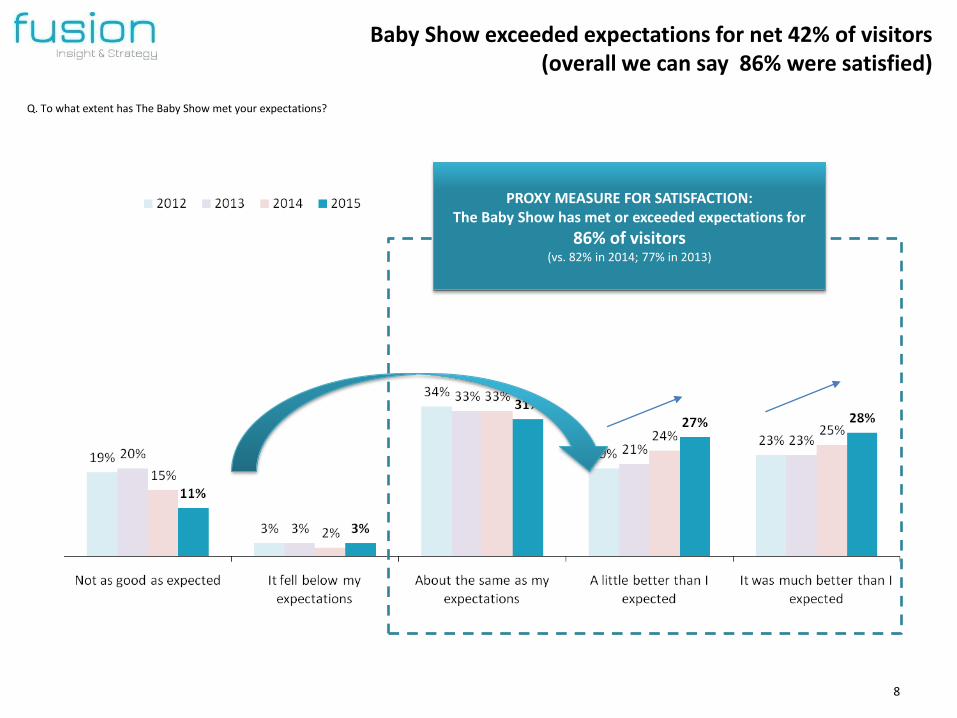
Baby Show exceeded expectations for net 42% of visitors (overall we can say 86% were satisfied)
Q. To what extent has The Baby Show met your expectations?
PROXY MEASURE FOR SATISFACTION: The Baby Show has met or exceeded expectations for
86% of visitors (vs. 82% in 2014; 77% in 2013)
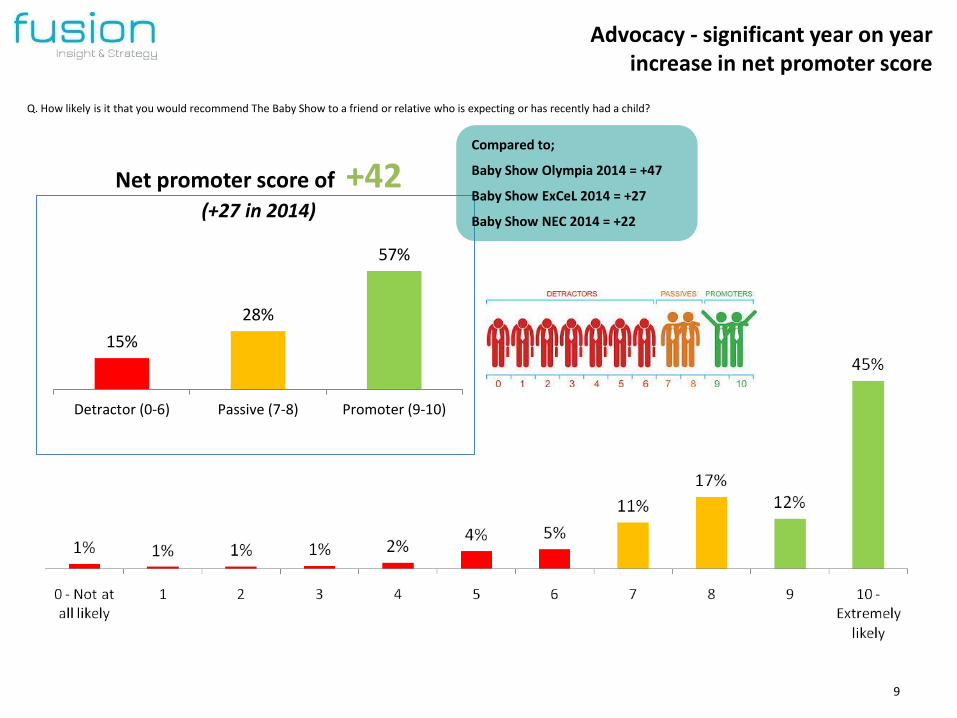
15%
28%
57%
Detractor (0-6) Passive (7-8) Promoter (9-10)
9
Net promoter score of +42 (+27 in 2014)
Advocacy - significant year on year increase in net promoter score
Q. How likely is it that you would recommend The Baby Show to a friend or relative who is expecting or has recently had a child?
Compared to;
Baby Show Olympia 2014 = +47
Baby Show ExCeL 2014 = +27
Baby Show NEC 2014 = +22

10
85% are likely to return in future (if appropriate)
Q. How likely would you be to visit The Baby Show in the future?
85% likely to return in future (82% in 2014; 80% in 2013)

11
KPI modelling

10% MERCENARIES
82% of visitors are classified as ‘apostles’, 10% ‘mercenaries’
82% APOSTLES
3% HOSTAGES
5% DISAFFECTED
Loya
lty
High
Low
Satisfaction Low High
Of which 30% ULTRA LOYALISTS*
* New measure for 2014

13
Other research results

14
32% heard about this year show by word of mouth, followed by The Baby Show website (not significantly different to 2014)
Q. How did you hear about the show THIS year?
NB: all other options 0%
Other: Emma diary, Bounty pack, Mothercare, Hospital, Friend
15
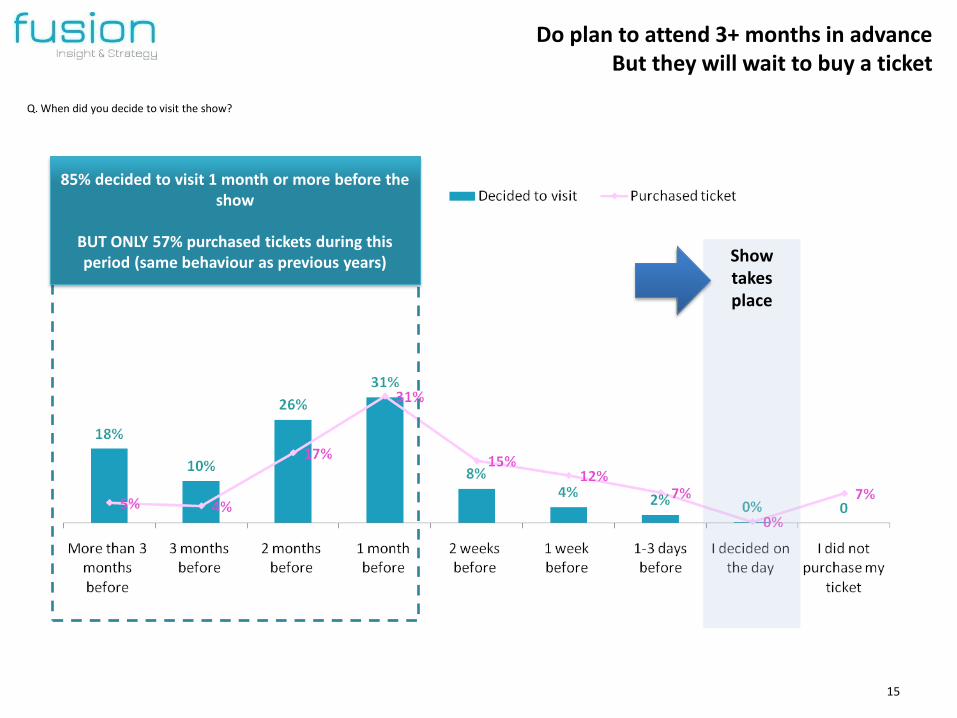
85% decided to visit 1 month or more before the show
BUT ONLY 57% purchased tickets during this period (same behaviour as previous years)
Do plan to attend 3+ months in advance But they will wait to buy a ticket
Q. When did you decide to visit the show?
Show takes place

16
Most likely to visit the show with their partner
Q. Who did you visit the show with?
17
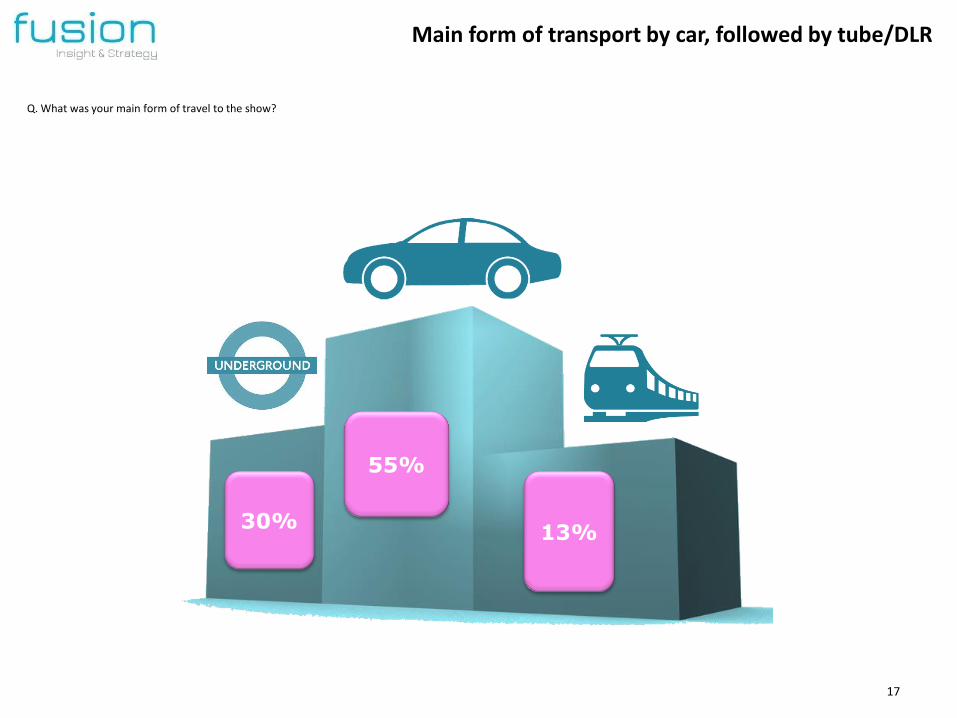
30%
55%
13%
Main form of transport by car, followed by tube/DLR
Q. What was your main form of travel to the show?

18
Significantly less people visited on Friday when compared to 2014 research
Q. How many hours did you visit the show for on each day? – EACH DAY
31% in 2014
Visitors spent on average more than 4 hours each day at the show
(Friday highest average dwell time)
4 hours 47 minutes
4 hours 3 minutes
4 hours 30 minutes
Average time spent at show
19
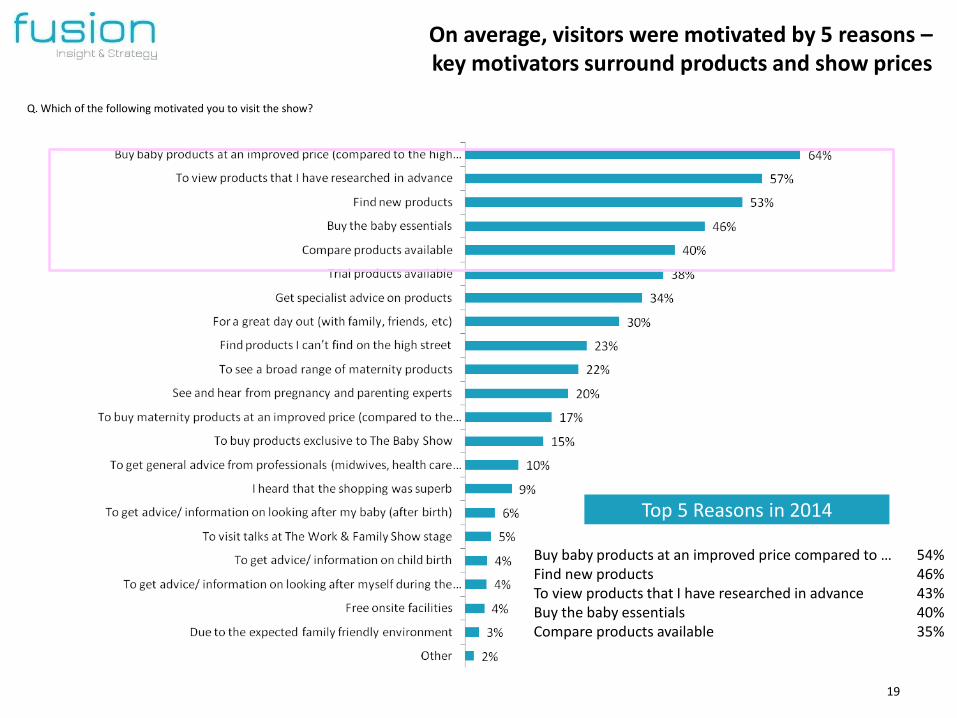
On average, visitors were motivated by 5 reasons – key motivators surround products and show prices
Q. Which of the following motivated you to visit the show?
Top 5 Reasons in 2014
Buy baby products at an improved price compared to … 54% Find new products 46% To view products that I have researched in advance 43% Buy the baby essentials 40% Compare products available 35%

20
Top 3 objectives for visiting the show by statements
Q. Which of the following motivated you to visit the show?
To buy the baby essentials
Buy baby products at an improved price (compared to the high street/internet)
To view products that I have researched in advance
Currently pregnant Have given birth in the last 3 months
For a great day out
Buy baby products at an improved price (compared to the high street/internet)
Find new products
Have given birth in the last year
Buy baby products at an improved price (compared to the high street/internet)
To view products that I have researched in advance
Expectant/ Recent father Expectant/ Recent grandparent
To buy the baby essentials
Buy baby products at an improved price (compared to the high street/internet)
Find new products
To find new products
Buy baby products at an improved price (compared to the high street/internet)
To view products that I have researched in advance
ALL visitors
Buy baby products at an improved price (compared to the high street/internet)
Find new products
To view products that I have researched in advance Find new products

21
Buy products at an improved price was the main reason for visiting the show
Q. What was the main reason for you attending this year’s Baby Show?
NB: all other options 0%

22
Strongest levels of agreement surrounding visitor experience and range of baby products
Q. Which of the following statements do you think apply to the show?
Significant (just)
Comparable to 2014
Significant
Significant

23
Almost half of the visitors used the show website followed by The Event Guide
Q. Which of the following did you use to help you get the most from your visit to The Baby Show?

24
The website was mainly used for checking exhibitor list and booking tickets
Q. What did you use the show website for?
Website used by 48% of
visitors

25
Q. Did The Baby Show event guide help you find everything you needed at the show?
Q. What did you find useful in The Baby Show event guide whilst at The Baby Show?
82% used the Baby Show guide, 78% to check the floor plan whilst at the show
9%
10%
11%
11%
20%
21%
35%
38%
78%
Show features (such as shopping drop-offand collect-by-car services)
Expert help and advice
Competitions
Exhibitor profiles (organised by standlocation and number)
Exhibitor profiles (organised alphabeticallyby company name)
Stage timetable and highlights
The Baby Show offers
Product locator list
Floor plan

26
Q. How long after The Baby Show, do you intend to keep The Baby Show event guide?
Q. Are there any changes that you would suggest to improve The Baby Show event guide?
70% kept the Baby Show guide after the show (significant increase)

27
95% of visitors made purchases at the Baby Show (same as 2014 research)
Q. Which products did you buy at the show?
Food/ Feeding products 50%
Accessories 51%
Buggies, pushchairs and prams. 33%
Car seat 33%
Top 4 products bought in 2014

4% 6% 6%
10%
17% 16%
3% 4%
13%
20%
0%
Up to £20 £21 - £40 £41 - £60 £61 - £100 £101 - £200 £201 - £500 £501 - £600 £601 - £700 £701 - £1,000 More than£1,000
Not sure / Don’t know
28
Average value of at-show purchases per visitor is £566 (£472 in 2014; £374 in 2013)
(excluding those who coded ‘Not sure/ Don’t know’ and ‘I didn’t buy any products at the show’)
Year on year increase in average spend at The Baby Show
Q. What is the estimated value of purchases you made at The Baby Show?
20% increase (significant)
29
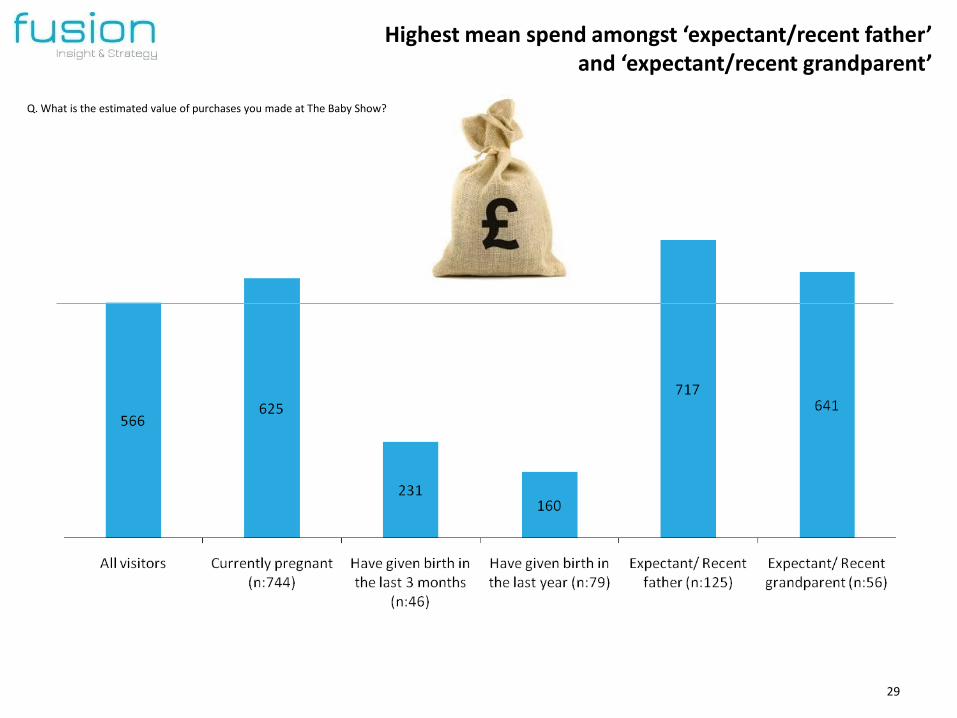
Highest mean spend amongst ‘expectant/recent father’ and ‘expectant/recent grandparent’
Q. What is the estimated value of purchases you made at The Baby Show?
30
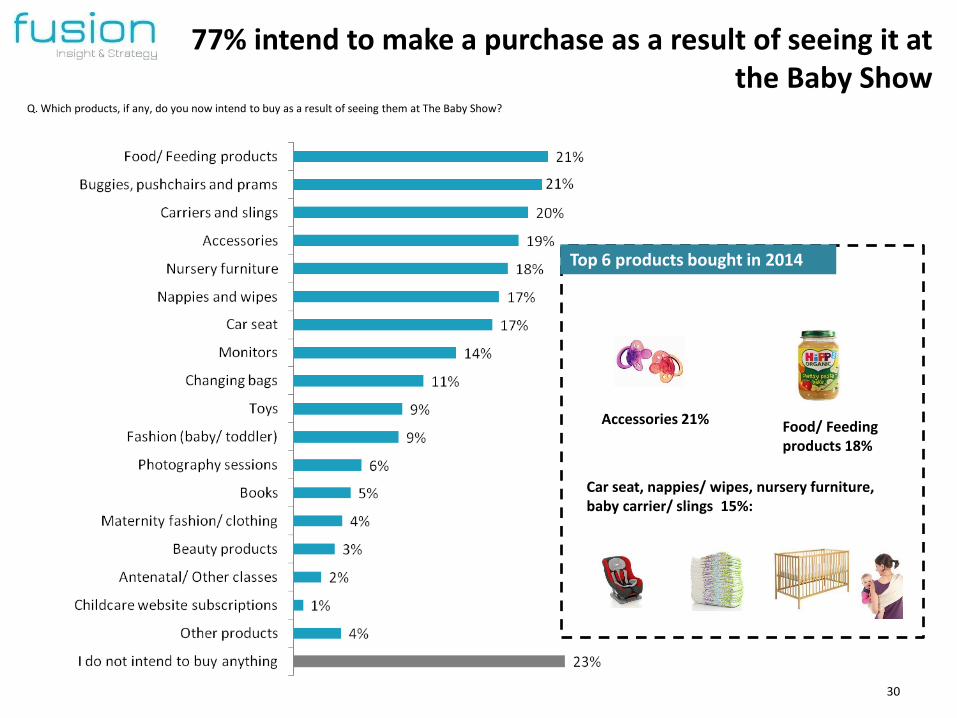
77% intend to make a purchase as a result of seeing it at the Baby Show
Q. Which products, if any, do you now intend to buy as a result of seeing them at The Baby Show?
Food/ Feeding products 18%
Accessories 21%
Car seat, nappies/ wipes, nursery furniture, baby carrier/ slings 15%:
Top 6 products bought in 2014

31
Average value of post-show purchases per visitor is £458 (£422 in 2014; £392 in 2013)
(excluding those who coded ‘Not sure/ Don’t know’ and ‘I didn’t buy any products at the show’)
Year on year increase in average spend at The Baby Show
Q. What is the estimated value of these items?
9% increase (significant)

32
Highest mean intend to spend amongst ‘expectant/recent father’
Q. What is the estimated value of these items?
33
Midwifes
Pregnancy
& birth
Baby
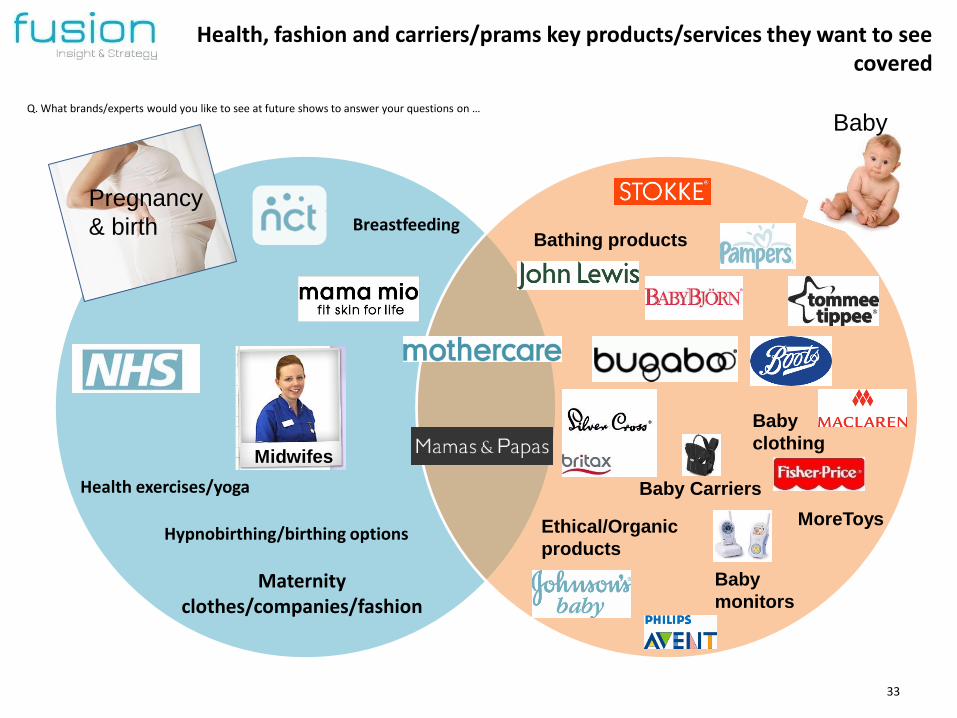
Hypnobirthing/birthing options
Health, fashion and carriers/prams key products/services they want to see covered
Q. What brands/experts would you like to see at future shows to answer your questions on …
Breastfeeding
Baby
clothing
MoreToys Ethical/Organic
products
Maternity clothes/companies/fashion
Health exercises/yoga
Baby
monitors
Bathing products
Baby Carriers

34
Visitor profile

Pregnant Profile
68% of visitors are pregnant
• 3% are less than 3 months pregnant
• 49% are 3 to 6 months pregnant
• 48% are more than 6 months pregnant
•For 83% this will be their first child
•Average age is 31 years and 5 months
•83% are currently working ahead of maternity leave
• 7% are on maternity leave
Surrounding their visits
•71% visited with their partner, 27% with their mothers
•On average they spent £625 at the show, and a further £478 after the show
•85% are either very or quite likely to visit in the future (if appropriate)

36
Q. Please can you tell us how old you are?
Q. Are you...
12%
88%
88% of visitors were female, average age amongst 33 years old

37
71% of visitors are expecting their first child
Q. How many children do you currently have?

If you have any questions, please contact: Thiago Alves Senior Business Development Manager DL: +44 (0) 20 7384 8125 E: [email protected]