the automotive industry to 2025 (and beyond) - arpa-e · the automotive industry to 2025 (and...
TRANSCRIPT

The Automotive Industry
to 2025 (and beyond)
Chris Atkinson, Sc.D.
Program Director
Advanced Research Projects Agency-Energy
RANGE Annual Meeting March 2016

The Obligatory Sankey Diagram

Energy Consumed by Transportation
3
Heavy-duty and light-duty vehicles consume ~11 million barrels per day oil
equivalent, totaling 81% of transportation sector energy consumption, or
~23% of the US primary energy usage.

US Light-Duty Vehicle Sales – 2015
‣ US passenger car and light truck sales are considered a function of
– Household income (steady – mean $72,641, median $51,939).
– Unemployment rates (actually workforce participation) (down to 5.5%).
– Interest rates (steady and low – prime rate 3.50%).
– Fuel prices (down below $2.00/gal).
‣ 57% of sales are now pickup trucks, SUVs, crossovers and minivans.
‣ Record 2015 sales for Audi (202k), BMW (346k), Jeep (865k), Honda (1,409k), Hyundai (762k), Land Rover (71k), Kia (626k), Mercedes Benz (373k), Nissan (1,351k), Porsche (52k) and Subaru (583k).
‣ Average LD vehicle age is now 11.4 years (Polk).
5

NHTSA, 2015
Vehicle Ownership and Economics
‣ Average vehicle purchase price $34,428 (Dec. 2015) (NADA).
‣ Average loan term 67 months (30% of all loans are 74-84
months) at $482/month with $28,936 financed (Experian).
‣ Average vehicle miles traveled (VMT) per year is now 12,700
(per vehicle) and 9,500 (per capita) (NHTSA).
‣ Car total cost of ownership is around $0.60/mile (vehicle cost,
financing, insurance, fuel cost).
‣ Total VMT is 3.1T miles (NHTSA).
‣ The road transportation industry is a $3.0T business in the US
alone!
7
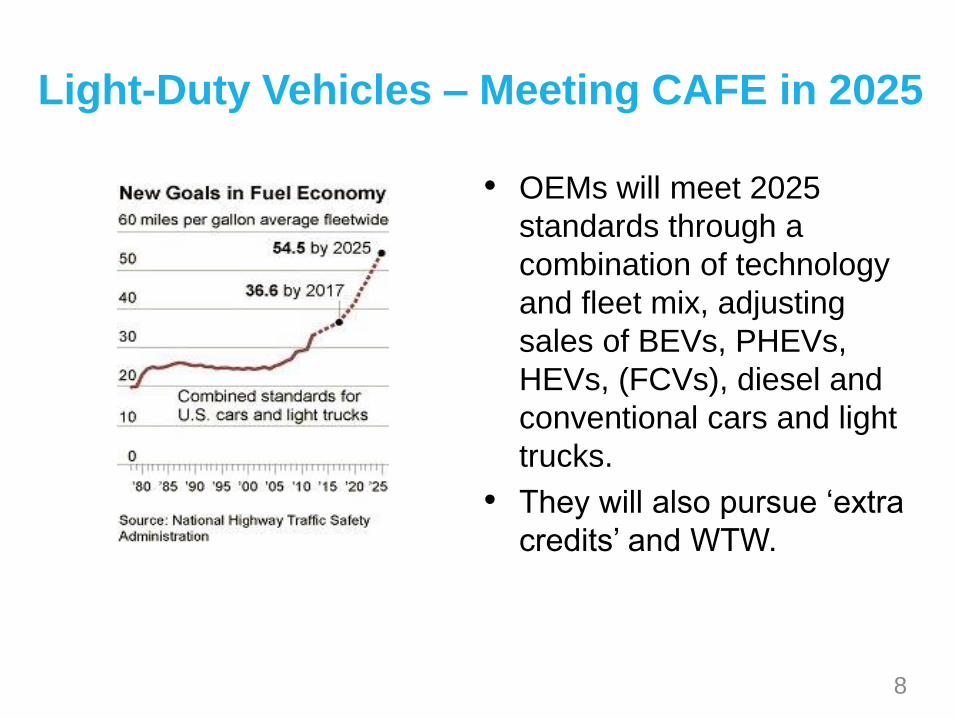
Light-Duty Vehicles – Meeting CAFE in 2025
• OEMs will meet 2025
standards through a
combination of technology
and fleet mix, adjusting
sales of BEVs, PHEVs,
HEVs, (FCVs), diesel and
conventional cars and light
trucks.
• They will also pursue ‘extra
credits’ and WTW.
8

Light-Duty Vehicles – Meeting CAFE in 2025
• OEMs will meet 2025 standards through a combination of technology and fleet mix, adjusting sales of BEVs, PHEVs, HEVs, (FCVs), diesel and conventional cars and light trucks.
• Beyond 2025……..?
• And what about the effect of connectivity and automated vehicle operation? Not reflected in regulations.
9

10
Shortfall
Fuel efficiency trend
Target 2025
Fuel E
conom
y (
MP
G)
2005 2010 2015 2020 2025 2030
0
10
2020
30
40
50
60
Fleet-Averaged Light-Duty Fuel Economy – Sales Weighted
(UMTRI)


3 Trends in Automotive Transportation
12

Trend 1 – Fuel Economy
‣ Future fuel economy of the light-duty vehicle fleet will be required to be
significantly higher than today (54.5 mpg CAFE by 2025).
13
Will be achieved by vehicle light-weighting, reducing aerodynamic and rolling losses,
engine downsizing, boosting, improved transmissions, increased electrification,
hybridization, waste energy recovery, and reductions in friction and parasitic losses.
‣ Heavy-duty fuel economy regulated by EPA/NHTSA Phase 2 GHG rules.

Trend 2 – Vehicle Connectivity
‣ Future vehicles will utilize greater levels of connectivity – V2V, V2I, V2X
– this trend is driven primarily by road traffic safety considerations.
14

Connected Vehicles – V2V, V2I, V2X.
DENSO, 2015
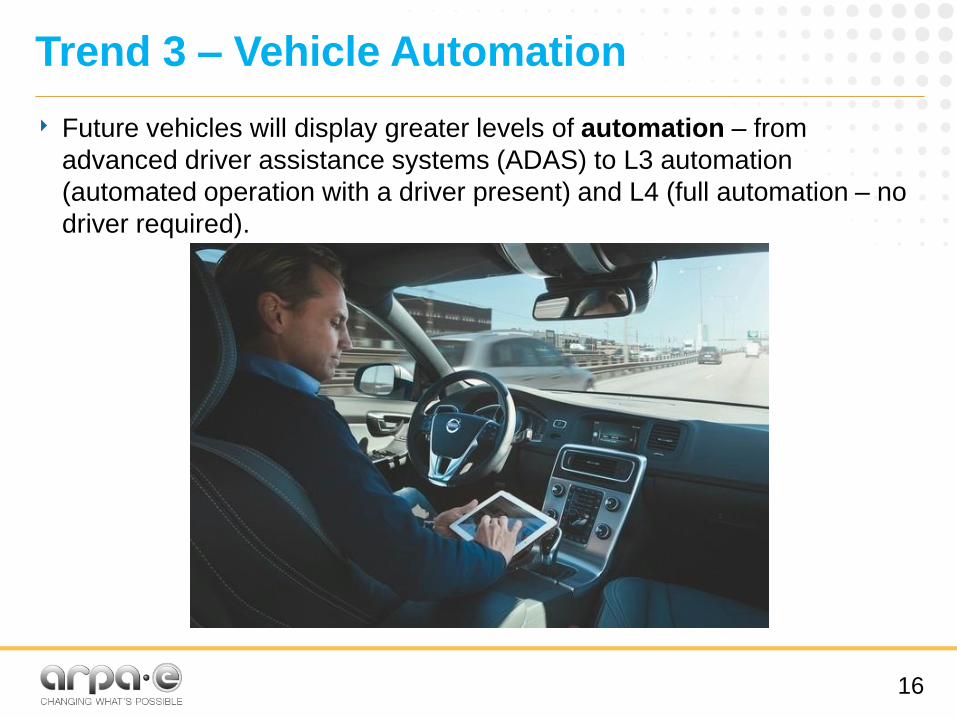
Trend 3 – Vehicle Automation
‣ Future vehicles will display greater levels of automation – from
advanced driver assistance systems (ADAS) to L3 automation
(automated operation with a driver present) and L4 (full automation – no
driver required).
16

Vehicle Safety
‣ Road safety – 32,675 fatalities in 2014 (1.07 per 100M VMT)
with 2.31 million injuries in 6.06 million crashes (1.65 million
with injuries, or 53 crashes with injury per 100M VMT).
‣ Has relied to date on passive safety (structures, air bags) –
expensive and costly in weight.
‣ New active safety mechanisms – ACC and AEB through radar.
‣ Vehicle connectivity will allow for further advances in safety –
DSRC (dedicated short range communications) will broadcast
the actions of your vehicle to all vehicles in a 150m radius.
17

Advanced Driver Assistance Systems (L3)
‣ ACC – adaptive cruise control (accelerator, brake).
‣ LKA – lane keeping assist (steering).
‣ AEB – advanced emergency braking (brake) (standard by 2022 by agreement).
‣ FCW – forward collision warning.
‣ Parking assistance/pilot.
‣ Alerts – blind spot assist, cross-traffic alerts, rear-view cameras.
‣ Semi-autonomous (MB, Volvo, Subaru, Infiniti, Nissan, Honda) and now essentially autonomous (Tesla Autopilot [L3] and Google car [L4])

Fully Automated Operation (L3/L4)
• Machine vision (LIDAR, radar (short and long range), ultrasonic, stereoscopic cameras).
• Sensor fusion.
• High computational capability.
• Machine learning, and AI (‘deep learning’).
• Advanced decision making.
• Connectivity (V2V such as DSRC and V2X).
• Navigation – maps and real-time mapping.
Requires the 99.999th percentile solution (currently at the 99th percentile?)

L4 Vehicles will demonstrate far higher energy efficiency
• Intrinsically safe vehicles “won’t crash”.
• Significant reductions in vehicle mass possible due to reduction in safety equipment required.
• Large weight de-compounding effects, also allowing for the use of lighter materials – CF, plastics, light metals?
• Opportunity for xEVs? Reduced energy storage requirements for same vehicle range.
• Automated vehicles will have more/less opportunity for recharging?

Future Potential with Vehicle Autonomy?
Autonomous Vehicle Technology – A Guide for Policymakers – Anderson et al., RAND Corporation, 2014


The Automotive Industry
‣ Is a very mature, conservative industry dominated by
– Regulation (safety),
– Regulation (emissions [optional] and now fuel efficiency),
– Customer preferences,
– While meeting strict cost and price constraints.
‣ To date regulation, incumbency and cost has protected the industry from extreme disruption.
‣ Industry has always been alert to ‘head-on’ threats
‣ But now there are a new generation of disrupters –
cf. Tesla, Apple, Google, Uber, …
Will electrification, connectivity and automated operation, and new models of ownership and usage facilitate the disruption of the industry?
23

The Disrupters
‣ Have incredibly deep pockets –
– Apple has $220B in cash, which dwarfs the market capitalization of Ford ($54B), GM ($50B), VW ($63B), Tesla ($31B) and is greater than Toyota ($164B).
– Uber (private) has a $50B value – greater than FedEx.
– Bear in mind that the traditional automotive industry operates on very thin margins, and is the “world’s greatest destroyer of capital”.
‣ Traditional barriers to entry:
– Regulation – Silicon Valley has never acknowledged regulation as a barrier to doing business.
– Capital – Apple alone has 10x the capital required to succeed.
– Engineering – not an issue with less complex powertrains (although the battery? Hence Tesla’s Gigafactory).
‣ SV operates on its own time scales (~1-2 years vs. 6-10 years of the automotive industry).
‣ Tremendous market pull for high technology products.24

For commercial success, any new powertrain technology
should be comparable to or better than the baseline in:
Criterion Explanation
Power Power density (or energy density including the fuel/energy
storage capacity) Customer acceptance
Efficiency Fuel economy (over real-world dynamic driving)
Regulation
Energy efficiency
Emissions Regulated criteria pollutants (and now CO2) Regulation
Cost Total cost of ownership (including capex and energy cost)
Reliability Mean time between failures, maintainability
Utility Acceleration, driveability, NVH, cold or off-cycle operation,
ease of use, transparency to the user, and acceptable range
Fuel acceptability Use a readily available fuel or energy source.
25

TESLA SEC Filing, 2015

Consider the Tesla Model S compared to the
Mercedes Benz S-Class:
Criterion Compared to Mercedes S-Class
Safety 1x
Regulation 0.5x
Emissions 0x (really?)
Engineering Effort 0.5x
Reliability 0.5x
Utility Performance 2x
Range 0.5x
Refueling Rate 0.01x
Economics Price 1x, Sales 1x, Profitability 0x
27
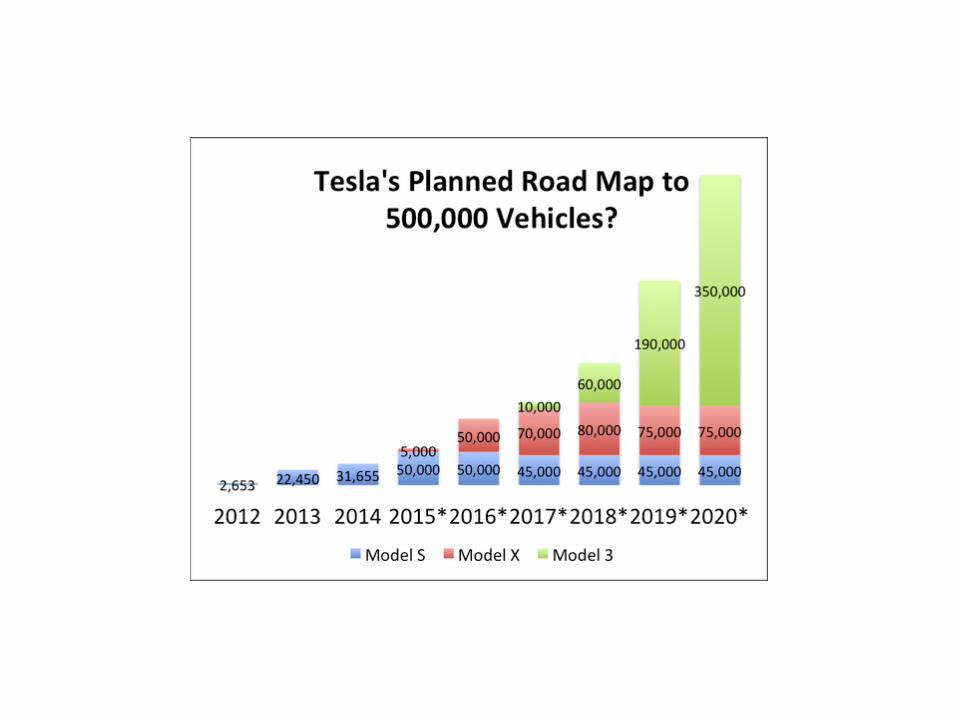
The Tesla Model S should never have been a success. Evidence of a
significant shift in consumer expectations – or just a function of the vehicle
class (a rarefied atmosphere)? Model X and Model 3 sales will tell.
Huge Shifts in the Industry
Old Model
• Vehicle hardware as the differentiating factor
• Complex powertrain
• Long development cycles
• Human operator, stand-alone
• Single vehicle with a single user
• Owner is driver and user
• OEMs are foremost
• Tightly controlled supply chain
• “One sale, once”
• OEM profitability required or at least desired
28

Huge Shifts in the Industry
Old Model
• Vehicle hardware as the differentiating factor
• Complex powertrain
• Long development cycles
• Human operator, stand-alone
• Single vehicle with a single user
• Owner is driver and user
• OEMs are foremost
• Tightly controlled supply chain
• “One sale, once”
• OEM profitability required or at least desired
New Paradigm
• Software as the differentiating factor
• Simplified powertrain – electric?
• Short development cycles
• Automated operation, connected
• New models of usage –ridesharing
• New models of ownership
• Suppliers now hold the keys
• Electronics, electrics & batteries
• New models of monetization
• No requirement for immediate profitability
29

But be wary of non-linear thinking
‣ Vehicle ownership – there is no clear threat to the traditional
model. Millennials have merely delayed purchases for several
reasons (city dwellers, high debt loads, disinterest) but as soon as
they move to the suburbs….
‣ Vehicle purchase – leasing and other new models will emerge.
‣ Vehicle usage – ride-sharing?
‣ Disruption – Uber has disrupted the taxi industry (at $1.50 to
$2.00 per mile), but not the passenger car industry (with total cost
of ownership at $0.60 per mile).
‣ Economics – vehicles are currently bought, sold, paid for and
operated on a VMT basis. If total VMT does not decrease, it is not
at all clear that sales will drop, or usage change significantly.
31

The Future Vehicle Industry Landscape
‣ Vehicle OEMs – e.g. GM, Ford, BMW….
‣ Ride-sharing companies – e.g. Uber, Lyft….
‣ “Transportation as a service” providers.
‣ New ‘dark horses’.
‣ And so now we have
– GM investing in Lyft (OEM+RS).
– Uber looking to develop automated vehicles (RS=OEM).
– Apple looking to develop an EV (‘Project Titan’) (new OEM).
– Google developing automated vehicles (CAV OEM+mapping).
– Ford Smart Mobility (OEM=RS).
Just for a start…..
32

The Future of the OEMs
‣ BMW – Harald Krueger, CEO – March 16, 2016
"The iNext will cover all aspects relevant in the future: autonomous driving, digital connectivity, intelligent lightweight construction, a trendsetting interior and the next generation of electro-mobility.“
‣ Toyota Research Institute - $1B for robotics research
‣ New alliances
– DeepDrive – machine learning and AI – Ford, Toyota, VW, Nvidia, Qualcomm, Panasonic at UC Berkeley
‣ An enormous amount of activity……
33

The Probable Pathway to 2025 and Beyond
‣ Vehicle powertrain technology – more electrification, more hybridization, downsizing, waste energy recovery, 48V systems?
‣ Vehicle structures – vehicle downsizing (more crossovers), weight reduction, more use of light-weight materials.
‣ Vehicle ownership – how will the 84 month ownership cycle be reconciled with 1-2 year product cycles?
‣ OEMs – the center of gravity of the high-technology components of the vehicle has shifted to suppliers both old (Bosch, DENSO, Continental, Delphi) and new (Mobileye, Cruise Automation).
‣ ADAS systems will proliferate, leading to L3 automation (such as the Tesla Autopilot) being essentially standard. (L3 is a suite of technologies).
‣ L4 automation requires or facilitates new vehicle architectures (electrification?) but will be slow in penetrating the full market.
34


ARPA-E NEXTCAR
Vehicle dynamics,
optimization and real
world driving
Connected and
Automated Vehicles (CAVs)
Powertrain, controls and optimization
Engaging the Powertrain, Vehicle and Transportation
Communities
‘Bridging the gap’ to reduce vehicle energy consumption by harnessing Connectivityand Automation.
$30M over 3 years


ARPA-E’s Vision
‣ What if a vehicle had perfect
information about
– Its route and topography
– Environmental conditions
– Traffic conditions ahead
– Traffic behavior
– Condition of its powertrain and
aftertreatment systems (if any)
– The quality of its fuel
– ……and everything else?
39
Source: Daimler

ARPA-E’s Vision
‣ What if a vehicle had perfect
information about
– Its route and topography
– Environmental conditions
– Traffic conditions
– Traffic behavior
– Condition of its powertrain and
aftertreatment systems (if any)
– The quality of its fuel
– ……and everything else?
‣ And it cooperates with all the
vehicles around it in order to reduce
its energy consumption
‣ With perfect control and optimization
40
Source: Daimler
→ while platooning, employing speed
harmonization for congestion
mitigation, eco-approach and departure
from traffic signals, as well as a single
vehicle driving alone, and all other real-
world driving scenarios….

Program Goal
Reduce the energy consumption of all future vehicles by an
additional 20% through the use of connectivity and
automation,
‣ in any vehicle application,
‣ in an energy and fuel agnostic fashion,
‣ while meeting future exhaust emissions regulations, as well
as customer acceptability requirements (including
acceleration, range, utility, driveability etc.),
41

Program Goal
Reduce the energy consumption of all future vehicles by an
additional 20% through the use of connectivity and
automation,
‣ in any vehicle application,
‣ in an energy and fuel agnostic fashion,
‣ while meeting future exhaust emissions regulations, as well
as customer acceptability requirements (including
acceleration, range, utility, driveability etc.),
with a $50/% energy consumption reduction target.
42

2015 Global Vehicle Sales ~88.6M

March 30, 2016 45

Payback – 3 years
46
Parameter/ Metric Conventional
Gasoline
Vehicle
Gasoline
HEV
Gasoline
PHEV BEV
Vehicle miles traveled per year (VMT) 12,000 12,000 12,000 12,000
Gasoline fuel cost ($/gallon) 3.00 3.00 3.00 -
Fuel consumption/energy savings (%) 40 40 40 40
Total highway fraction driven (-) 0.45 0.45 0.45 0.45
Vehicle highway gas mileage
(mpg/mpge)
28 34 38 137
Vehicle city gas mileage (mpg/mpge) 20 36 42 111
PHEV/BEV range (miles) - - 35 81
PHEV/BEV energy (Wh/mile) - - 360 270
Electricity retail cost ($/kWh) - - 0.11 0.11
Payback period (years) 3 3 3 3
Savings in 3 year payback period ($) 1,873 1,233 655 428
Normalized saving ($/%fuel
consumption/energy reduction) 47 31 16 11

47
TARGET PROGRAM AREA