the australian principal health and wellbeing survey ... report.pdf · the australian principal...
TRANSCRIPT

The Australian Principal Health and Wellbeing Survey
2011 Interim Report
Prepared by
Philip Riley, PhD
2
Produced and Published by: Faculty of Education Monash University Clayton, Victoria, Australia, 3800 Printed January 2012 © Copyright 2012 NOT FOR RESALE. All materials produced for this course of study are protected by copyright. Use of these materials including copying or resale may infringe copyright unless written permission has been obtained from the copyright owners. Enquiries should be made to the publisher.

3
Acknowlegements Projects on this scale do not happen without a number of dedicated people’s support. Firstly I would like to thank Professor Edwina Cornish, Deputy Vice Chancellor (Research), and the senior management team at Monash University for having the vision to fund the project through the Monash Researcher Accelerator Program. I would also like to thank all the Principal organisations that supported the projected and facilitated access to the survey for the principals. Special thanks go to the research assistants Aimee Maxwell (now PhD candidate on the project) and Rebecca Claire who worked tirelessly to tight deadlines time and again. For Web development and report construction I would like to thank Mark Allen and Jason Cleeland. For project management from the Faculty of Education, Monash University Development Office I would like to thank in particular, Associate Professor Len Cairns, Bronwyn Smith, Andrew Jackson.
Steering committee A big thank you also goes to the members of the project steering committee. Gabrielle Leigh (President, AGPPA) Frank Sal (President VASSP) Liz Furler, (CEO, Principals Australia Institute) Ted Brierley (Executive Secretary, ICP) Nick Thornton (Director, Lauriston Institute) Mark Merry (AHISA) Len Cairns, Associate Dean (Development), Faculty of Education, Monash University Professor Jeff Richardson, Centre for Heath Economics, Monash University Professor Niki Ellis, CEO, Institute for Safety, Compensation and Recovery Research (ISCRR) Professor Malcolm Sim, School of Epidemiology and Preventative Medicine, Monash University.
Contact Information Monash University Development Office, Faculty of Education, Monash University, Clayton, Victoria, Australia, 3800 Tel: 03 9905 2819 http://www.education.monash.edu.au/contacts/ Chief Investigator: Dr Philip Riley Organizational Liaison: Rebecca Claire Technical and Research Support: Aimee Maxwell
4
Table of Contents Acknowlegements ............................................................................................................................................................... 3 Steering committee ............................................................................................................................................................ 3 Contact Information .......................................................................................................................................................... 3
Introduction ...................................................................................................................... 8 Aims and Background ....................................................................................................................................................... 8 The Survey .............................................................................................................................................................................. 9 Research Questions .......................................................................................................................................................... 11
Results Oveview .............................................................................................................. 12 Australia’s School Principals: A Snapshot ............................................................................................................. 12 Detailed Results .............................................................................................................. 13 Ethical Considerations ................................................................................................................................................... 13 Response Rates .................................................................................................................................................................. 14 Participants ........................................................................................................................................................................ 14 Gender ................................................................................................................................................................................... 14 Age .......................................................................................................................................................................................... 16 Membership of Professional Organisations .......................................................................................................... 16 Role ......................................................................................................................................................................................... 16 Time Fraction ..................................................................................................................................................................... 17 Years in Role and Current Position ........................................................................................................................... 17 Years in Leadership Roles ............................................................................................................................................. 17 Years in Teaching Prior to Leadership ................................................................................................................... 17 Responsibilities .................................................................................................................................................................. 18 Year Level Responsibilities ........................................................................................................................................... 18 Average hours worked per week ............................................................................................................................... 18 Time Usage whilst at work ........................................................................................................................................... 19 Income – Per annum ....................................................................................................................................................... 21
Work Pressures ................................................................................................................................................................ 26 Levels of Autonomy in Carrying Out the Role ...................................................................................................... 27 Level of Confidence in Carrying Out Role .............................................................................................................. 28
Background ......................................................................................................................................................................... 28 Heritage ................................................................................................................................................................................ 28 High school attended (type) ........................................................................................................................................ 28 Background: Family of Origin .................................................................................................................................... 29 Volunteering/Charity Work (outside school hours/role) ............................................................................... 30 Spiritual Practice (outside school hours/role) .................................................................................................... 30 Partner Status .................................................................................................................................................................... 30 Children ................................................................................................................................................................................ 31
Personal Health Status ................................................................................................................................................... 33 General Health and Fitness .......................................................................................................................................... 34 Personal Values ................................................................................................................................................................. 35 Psychological Rating ...................................................................................................................................................... 36 Sources of Support ........................................................................................................................................................... 37 Alcohol Intake .................................................................................................................................................................... 37
School Information .......................................................................................................... 39 Sector ..................................................................................................................................................................................... 39
5
State ....................................................................................................................................................................................... 39 Location ................................................................................................................................................................................ 39 Non Teaching Staff .......................................................................................................................................................... 40 Administrative Support Staff ...................................................................................................................................... 41 Teaching Staff: Experience and Demographics .................................................................................................. 41 Staff Turnover .................................................................................................................................................................... 42 Principal Valued by the Community ........................................................................................................................ 42 Student Profile ................................................................................................................................................................... 43 School Resources .............................................................................................................................................................. 44 School Culture .................................................................................................................................................................... 45 Staff ........................................................................................................................................................................................ 45 Students ................................................................................................................................................................................ 46 Parents .................................................................................................................................................................................. 47
COPSOQ Subscale Scores ................................................................................................. 48 COPSOQ Counts: Incidence of Offensive Behaviour by Subgroup ................................................................ 50
AQoL-‐8D .......................................................................................................................... 60
References ...................................................................................................................... 66 Whitehall Studies ........................................................................................................................................................... 67
Tables Table 1. Number of participants willing to also be interviewed ........................................................... 14 Table 2. Gender ..................................................................................................................................... 14 Table 3. Number of professional organisation memberships per individual principal ......................... 16 Table 4. Principals' role ........................................................................................................................ 16 Table 5. Time fraction spent on leadership ........................................................................................... 17 Table 6. Years spent in current role ...................................................................................................... 17 Table 7. Years spent in leadership roles (including current role) ......................................................... 17 Table 8. Years spent in teaching prior to undertaking a leadership position ........................................ 17 Table 9. Time spent on leadership duties ............................................................................................. 18 Table 10. Leadership responsibilities: Student year levels ................................................................... 18 Table 11. Average number of hours worked per week by principals during school terms .................. 18 Table 12. Average number of hours worked per week by principals during school holidays .............. 19 Table 13. Time spent on internal administrative tasks ......................................................................... 19 Table 14. Curriculum and teaching-related tasks ................................................................................ 19 Table 15. Responding to requests/compliance requirements ................................................................ 19 Table 16. Representing the school at meetings or in the community and networking ......................... 20 Table 17. Public relations and fundraising ........................................................................................... 20 Table 18. Occupational Health and Safety compliance ........................................................................ 20 Table 19. Other duties ........................................................................................................................... 20 Table 20. Percentage of work regarded as management rather than leadership orientated .................. 21 Table 21. Annual income by quantum grouping .................................................................................. 21 Table 22. Sources of stress during the last 3 months: ........................................................................... 26 Table 23. High school attended as a student ......................................................................................... 28 Table 24. Family unit at age 14 ............................................................................................................ 29 Table 25. Father’s highest education qualification ............................................................................... 29 Table 26. Mother’s highest education qualification ............................................................................. 29 Table 27. Highest level of formal education completed? ..................................................................... 29
6
Table 28. Formal leadership qualifications ........................................................................................... 30 Table 29. Has your leadership education has helped you cope with the demands of the job? ............. 30 Table 30. Participated in volunteer or charity work in the past 12 months .......................................... 30 Table 31. Current active member of a sporting, hobby or community-based club or association ....... 30 Table 32. Regular spiritual practice or attendance at religious services or prayers .............................. 30 Table 33. Partner status ......................................................................................................................... 30 Table 34. Is your partner in paid employment? .................................................................................... 31 Table 35. Partner’s occupation by ABS type ........................................................................................ 31 Table 36. Partner’s occupational level by ABS type ............................................................................ 31 Table 37. Do you have children currently living at home? .................................................................. 31 Table 38. Number of children living at home full time ........................................................................ 32 Table 39. Number of children living at home part time ....................................................................... 32 Table 40. Members of immediate family with a long-term health condition ....................................... 33 Table 41. Impact of the health condition on your child or partner’s ability to study or work .............. 33 Table 42. Medical conditions diagnosed by a doctor ........................................................................... 33 Table 43. Prescription medications taken ............................................................................................. 34 Table 44. Overall I maintain a satisfactory level of fitness .................................................................. 34 Table 45. Overall I maintain a healthy diet .......................................................................................... 34 Table 46. Overall I maintain a health weight ........................................................................................ 35 Table 47. Frequency of scheduled medical checkups (annual) ............................................................ 35 Table 48. Importance to you of what you achieve in life ..................................................................... 35 Table 49. Importance to you of close relationships with family and friends ........................................ 35 50. Importance to you of how safe you feel ......................................................................................... 36 Table 51. Importance to you of doing things with people outside your home ..................................... 36 Table 52. Importance to you is your own happiness ............................................................................ 36 Table 53. I am frequently depressed about my job ............................................................................... 36 Table 54. I am frequently depressed about my job at certain times of the year ................................... 37 Table 55. Sources of support ................................................................................................................ 37 Table 56. AUDIT 1: How often do you have a drink containing alcohol? ........................................... 37 Table 57. Degree of worry about the way I use alcohol to manage my stress ...................................... 38 Table 58. Degree of worry about the way I use prescribed medication to manage my stress .............. 38 Table 59. School sector of current school ............................................................................................. 39 Table 60. State and territory of current school ..................................................................................... 39 Table 61. Geographic location of current school .................................................................................. 39 Table 62. Number of campuses at current school ................................................................................. 40 Table 63. Percentage of your school’s non-teaching staff providing pedagogical support .................. 40 Table 64. Percentage of non-teaching staff in administrative or management roles ............................ 41 Table 65. Percentage of teachers by level of experience in years ........................................................ 41 Table 66. Teachers who hold a Masters degree or higher .................................................................... 41 Table 67. Teachers of Aboriginal or Torres Strait Islander background .............................................. 41 Table 68. Teachers’ first language is a language other than English .................................................... 42 Table 69. Teachers currently employed on short-term contracts (up to one year) ............................... 42 Table 70. Percentage of teaching staff who leave the school in an average year ................................. 42 Table 71. Difficulty in fill teaching staff vacancies for this school year .............................................. 42 Table 72. School council/board and community values the work you do ............................................ 42 Table 73. Percentage of your students with a disability that qualifies for extra funding? .................... 43 Table 74. Percentage of your students with a disability that does not attract extra funding ................ 43 Table 75. Percentage of student turnover each year (apart from graduates) ........................................ 43 Table 76. Reasons for student exit (apart from graduating) ................................................................. 43 Table 77. Resourcing inadequacies reported as percentage ................................................................. 44 Table 78. Staff attributes ....................................................................................................................... 45 Table 79. Student attributes .................................................................................................................. 46
7
Table 80. Parental support for, and involvement in, school activities .................................................. 47 Table 81. Copenhagen Psychosocial Questionnaire subscale scores ................................................... 48 Table 82. Prevalence rates for Offensive Behaviour subscales of the COPSOQ-II ............................. 49 Table 83. Australian Quality of Life - 8D subscale scores ................................................................... 60
Figures Figure 1. Principal Gender by School Sector ....................................................................................... 15 Figure 2. Principal Gender by State ...................................................................................................... 15 Figure 3. Year of Birth .......................................................................................................................... 16 Figure 4. Annual Income by State ........................................................................................................ 22 Figure 5. Annual Income by School Sector .......................................................................................... 23 Figure 6. Annual Income by Gender .................................................................................................... 23 Figure 7. Annual Income by School Sector and School Location ........................................................ 24 Figure 8. Annual Income by School Sector and State .......................................................................... 24 Figure 9. Annual Income by School Location and Gender .................................................................. 25 Figure 10. Annual Income by Quantum and Gender ............................................................................ 25 Figure 11. Age of Oldest Child Living at Home .................................................................................. 32 Figure 12. Age of Second Child Living at Home ................................................................................. 33 Figure 13. Alcohol Use Disorders Identification Test .......................................................................... 38 Figure 14. School Location by Gender ................................................................................................. 40 Figure 15. Count of Threats of Physical Violence by School Location ............................................... 50 Figure 16. Count of Threats of Physical Violence by School Sector ................................................... 50 Figure 17. Count of Threats of Physical Violence by State .................................................................. 51 Figure 18. Count of Threats of Physical Violence by Gender .............................................................. 51 Figure 19. Count of Physical Violence by School Location ................................................................. 52 Figure 20. Count of Physical Violence by School Sector ..................................................................... 52 Figure 21. Count of Physical Violence by State ................................................................................... 53 Figure 22. Count of Physical Violence by Gender ............................................................................... 53 Figure 23. Count of Bullying by School Location ............................................................................... 54 Figure 24. Count of Bullying by School Sector ................................................................................... 54 Figure 25. Count of Bullying by Gender .............................................................................................. 55 Figure 26. Count of Unpleasant Teasing by School Location .............................................................. 55 Figure 27. Count of Unpleasant Teasing by School Sector .................................................................. 56 Figure 28. Count of Unpleaseant Teasing by Gender ........................................................................... 56 Figure 29. Count of Conflicts and Quarrels by School Location ......................................................... 57 Figure 30. Count of Conflicts and Quarrels by School Sector ............................................................. 57 Figure 31. Count of Conflicts and Quarrels by Gender ........................................................................ 58 Figure 32. Count of Gossip and Slander by School Location .............................................................. 58 Figure 33. Count of Gossip and Slander by Gender ............................................................................. 59 Figure 34. AQoL Independent Living Utility Score ............................................................................. 61 Figure 35. AQoL Happiness Utility Score ........................................................................................... 61 Figure 36. AQoL Mental Health Utility Score ..................................................................................... 62 Figure 37. AQoL Coping Utility Score ................................................................................................ 62 Figure 38. AQoL Relationships Utility Score ...................................................................................... 63 Figure 39. AQoL Self Worth Utility Score .......................................................................................... 63 Figure 40. AQoL Pain Utility Score ..................................................................................................... 64 Figure 41. AQoL Pain Utility Score ..................................................................................................... 64 Figure 42. AQoL Global Utility Score ................................................................................................. 65
8
Introduction
Aims and Background The role of school principal in many parts of the “first world” world is rapidly changing (Matthews, Moorman, & Nusche, 2007). This has increased the stress levels of an already highly stressed population. In Victoria, the Department of Education and Training, conducted a survey of Government sector principals in 2004, reporting that members experienced “higher degrees of stress than those in comparable employment categories… Principals 79%, [other] white collar [groups] 43%” (Department of Education & Training, 2004, p. 11). Since that study was published many aspects of the role have changed increasing principals’ job demands. In the UK, where schools have been increasingly accountable for results via the publication of league tables, Phillips and Sen (2011) reported that, “work related stress was higher in education than across all other industries… with work-related mental ill-health… almost double the rate for all industry” (p. 177-8). A significant stressor has been the increased emphasis by governments on accountability for uniform curriculum delivery along with the devolution of administrative tasks from central to local control. For example, curriculum and timetabling, once the province of the principal and fundamental to the efficient running of a school, are now more centrally controlled, while many non-educational administrative tasks such as payroll, budgeting and teacher employment have been devolved to school leaders. An extensive review of schools and school leadership in 25 countries the OECD reported,
School leaders’ roles have changed from practicing teachers with added responsibilities to full-time professional managers of human, financial and other resources accountable for their results. This has meant that more and more tasks have been added to the job description: instructional leadership, staff evaluation, budget management, performance assessment, accountability, and community relations, to name some of the most prominent ones. In this environment, the range of knowledge and skills that effective school leaders need today is daunting: curricular, pedagogical, student and adult learning in addition to managerial and financial skills, abilities in group dynamics, interpersonal relations and communications. (Matthews, et al., 2007).
In Australia, significant changes to the principals’ role has recently been introduced by the federal government. This year sees the introduction of a national curriculum tied to national testing (NAPLAN) and public accountability via the My School website (ACARA, 2011). The work practices (role demands) imposed by these changes will further increase work volume and public accountability and decrease principals’ decision latitude through externally imposed reporting deadlines. Extensive research on similar professional populations, middle ranking public servants in the UK, reported in more than 100 Whitehall I and II studies found adverse health outcomes including decreased life expectancy results from high role demand and concurrent low decision latitude. Principals experiencing
concurrent low decision latitude and high [role] demands cannot moderate the stress caused by the high demands through time management or learning new skills, and so become subject to high stress at work and are at increased risk of disease. (Kuper & Marmot, 2003, p. 147)
More disturbing is that under these conditions younger people appear to be at greater risk of coronary heart disease than their older colleagues (Kuper & Marmot, 2003). This finding is a
9
real cause for concern because of the impending retirement of many of Australia’s principals. Principals’ Australia, estimates that as many as 70% of Australia’s 10,000 school principals will reach retirement age within the next five years. They will be replaced with much younger, less experienced individuals, potentially more at risk of adverse health outcomes from undertaking the role. However, this changeover also represents a significant renewal opportunity for the school sector. If changes can be made to principals’ work practices that reduce the negative impacts of taking on the role, the opportunities for sustainable school improvement brought about by “new blood” can be advance the nation’s education sector. But this must be done now. The time is ripe for systematic research of the current state of school leader occupational health, safety and wellbeing. Now is the only time that research will be able to gather baseline data for the new population of principals along with the incumbents for cross-sectional and longitudinal comparison.
The Survey Workplace changes brought about either by changing community attitudes or government policy affects all schools and all school principals yet no systematic measurements of their effects have been conducted until now. This research project will collect data and monitor the health, safety and wellbeing of Australia’s school principals annually. This report results from the first iteration of the survey, conducted in 2011. The data collected will be used to develop evidence-informed changes to work practices aimed at minimizing the adverse health impacts on the individuals. The research has a number of innovations built from research in related fields. Firstly, it is the first independent, national research project undertaken to take baseline measurements and compare the occupational risks of all school principals (Government, Catholic, Independent) longitudinally: to monitor the efficacy of stress reduction interventions. The survey instrument designed for this project addresses a major limitation of previous studies in that they have been either state based, or targeted only one sector: usually the government sector. The survey captures three types of information drawn from existing robust and widely used instruments. Firstly, comprehensive school demographic items drawn from the Trends in International Mathematics and Science Study (TIMSS) (Williams et al., 2007), Program for International Student Assessment (PISA) (Thomson, Bortoli, Nicholas, Hillman, & Buckley, 2011), My School (ACARA, 2011) and International Confederation of Principals surveys are used to capture differences in OH&S associated with the diversity of Australian school settings and types. Secondly, personal demographic and historical information will also be captured. Thirdly, principals’ quality of life and psychosocial coping will be investigated, drawn from two widely used measures, the AQoL-8D (Richardson et al., 2009) and COPSOQ-II (Pejtersen, Kristensen, Borg, & Bjorner, 2010). The combination of items from these instruments allows opportunities for comprehensive analysis of variation in both OH&S and wellbeing as a function of school type, state and sector differences and the personal attributes of the principals themselves. The survey provides automatic feedback of the results to each individual who completes the survey, increasing the benefit to each participant. This method also allows for the identification and support of high-risk individuals through red flag items in the survey. Finally, aggregated survey information will be used to seed focus group discussions of school principals from every education sector (Government, Catholic, Independent) and every state
10
and territory in Australia. Focus groups will then develop primary interventions to reduce occupational stress at the source. Proven secondary interventions designed to help individuals better cope with stress, such as those developed for trainee doctors (Hassed, Lisle, Sullivan, & Pier, 2009) will also be trialed with volunteer principals and evaluated through the annual survey. This conceptual framework, combining primary and secondary occupational health and injury prevention interventions with evidenced-based assessment has proven robust over hundreds of studies and is considered best practice for improving workplace safety (LaMontagne, Keegel, Louie, Ostry, & Lansbergis, 2007). This research project is innovative at both the individual and the organizational level. The principals who complete the survey will receive interactive feedback through a dedicated secure website. The project involves the design and implementation of new information access systems and feedback mechanisms (connected to sophisticated automatic analysis tools) for school leaders, affording them instant health and wellbeing checkups tailored to their specific work context, and eventually, instant intervention strategies for dealing with the complexity of their roles. In future iterations of the survey it is hoped that we can incorporate feedback to individuals using like-group comparisons. For example, an individual principal will be able to compare his or her results with a matched group of principals in similar circumstances on a range of categories. These will include: small/medium/large schools; primary/secondary/P-12/special; urban, suburban, regional, rural and remote locations; low/high Socio Economic Status; indices of happiness, stress, job satisfaction, exercise, social support, coping and quality of life. The instant benefit to individuals is likely to increase both participation rates and the veracity of the information they submit. The aggregated data will be made available to government, employer bodies, unions and other interested parties through these annual reports. Australia’s federal system of government allows for a natural quasi-experiment investigating the changed work practices and accountability of school principals across a number of sectors. The comparators are similarities and differences in work requirements in each of the states and territories, and across sectors (Government, Catholic, Independent). Principals’ health, safety and wellbeing in differing school types (urban; suburban; regional; rural; and remote) can be compared by level (primary, secondary, P-12, special schools) school size, and lifestyle choices such as exercise, diet and social support. The turnover of principals within schools allows investigations of moderator effects, such as years of experience prior to taking up the role. The longitudinal study will allow the mapping of health, safety and wellbeing outcomes on each of these dimensions over time. The occupational health and safety literature categorizes interventions to improve workplaces into three types: primary, secondary and tertiary (LaMontagne, et al., 2007). Primary interventions are organizational, systematic approaches targeted toward prevention of exposure to stressors in the workplace. Secondary interventions are designed to help individuals better cope with the stressors they encounter, such as relaxation and mindfulness training. Tertiary interventions are designed to lessen the impact of stress related problems post occurrence through treatment or management of symptoms and rehabilitation. The Australian principal health and wellbeing survey and evidence-based interventions to reduce stress related disease will provide significant social and economic benefit to Australia. Psychosocial work conditions have a significant impact on health outcomes (Head, et al., 2007; Kuper & Marmot, 2003; Marmot, 2006), while physical and psychological wellbeing have a significant effect on job performance (Lyubomirsky, King, & Diener, 2005).
11
The survey was conducted between the end of August and end of October 2011. All principal professional organisations were consulted prior to the survey being undertaken and each agreed to take part. Principal organisations sent email invitations to their members inviting them to participate. The following information is presented to create a picture of principal health and wellbeing across Australia in 2011. The survey will be repeated in 2012. Current respondents will be able to update their information with a short follow-up survey while principals who did not undertake the survey in 2011 will be able to commence in 2012.
Research Questions The Australian Principal Health and Wellbeing Survey seeks to capture a holistic picture of the diversity of school principals across the country and monitor their occupational health, safety and wellbeing over time through an annual update of the information. Therefore all the principals who responded will be followed up annually with a short health, safety and wellbeing update survey each year. We are interested to map changes that might result from the introduction of policy changes at sector, state and federal level, and work practice changes that are designed to reduce occupational risk. The specific research questions guiding the initial survey were:
1. Can recognizable occupational health, safety and wellbeing subgroups of principals be identified through the survey? These groups may be inferred from a number of criteria including: State; Sector (Government, Catholic, Independent); Location (Urban, Suburban, Large Town, Rural, Remote); Type (Primary, Secondary, Special, Early Childhood, P-12); Background (Family of Origin, School Education); Person Factors (Gender, Family of Procreation, Social Support, Educational Level); Role Factors (Hours worked, number and type of teachers, students and parents, resources, professional support); Occupational Constraints.
2. Do(es) any group(s) thrive in the role?
3. Do(es) any group(s) only just survive in the role?
4. Do(es) any group(s) show signs of adverse health, safety, and wellbeing outcomes.
5. Do(es) any factors affect these group(s), and in what ways?
12
Results Oveview The results paint a complex picture showing a diversity of settings and experiences of Australia’s school principals. Data was obtained from every sector, state and region across the country. The group who responded to the survey put in very long hours at work, both during term time and during holiday periods. The number of hours worked appears to have no relation to salary: these people appear dedicated to the task of running schools as effectively as possible for its own intrinsic reward. The details of the personal costs of their work, their occupational health, safety and wellbeing are equally complex: from many who thrive in the job to those who are perhaps just surviving. These are reported in the bulk of the report by section. The detailed analysis of the large and complex dataset is beginning. What appears below are “first cut” findings. More detailed reports will follow as data analysis is completed. Note: Where the diversity of experience is best represented visually graphs have been used.
Australia’s School Principals: A Snapshot
• Responses from 2005 principals are reported. • 56% female and 44% males • Average age 51.3 years • Most had been in their current role for five years and leadership roles for 12 years,
following 12 more years in teaching. • Approximately 80% work upwards of 46 hours a week during term with just over one
quarter working upwards of 61 hours per week. During school holidays, more than half work upwards of 25 hours per week.
• Annual salaries range from <$50,000 - >$160,00 per annum. • 84% rate personal achievement as very important or higher. • 97.3% rate personal relationships with family and friends as very important or higher. • 83.2% are in a partner relationship, and 82% report that their greatest source of
support comes from their partner. Almost half of their partners also work in the education sector.
• Approximately half have children living at home. • Approximately one quarter of the principals have a family member with a long-term
health condition, with serious impact on the family in 28% of the sample. • They appear to come from stable backgrounds and have been upwardly mobile and
value education for themselves as well as others: 87.9% were living with a mother and father at age 14. The families of origin appear to be largely working class with about one quarter of parents qualified with a university degree, whereas 34% of the principals have a masters degree or above, mostly in formal leadership courses.
• 46% volunteer their time for community support outside of their role, and approximately the same number are active members of a formal community or sporting association.
• Approximately one third of the sample conducts regular spiritual practice.
13
• There are large differences in their self-reported maintenance of healthy levels of exercise, diet and weight control.
• Only 82% of respondents rate their own happiness as very important or higher. • They are generally positive about their job with only 2.6% becoming frequently
depressed about it. • 49% are taking prescription medication for a diagnosed condition. • 43.4% report a diagnosed medical condition. • Most maintain a health alcohol intake, and do not use it to manage stress. • Principals experience nearly five times the incidence of threats of violence and six
times the incidence of actual physical violence at work than other population groups measured on the COPSOQ-II. Government school principals working in large towns and rural locations appear most at risk.
• Overall levels of mental health range from very good to very poor. Principals overall score just less than the general population.
Detailed Results
Ethical Considerations Australia has approximately 10,000 schools and therefore about 10,000 principals. It is more difficult to ascertain the number of assistant principals across the country (also known as deputy, vice and/or campus principals). Gathering a comprehensive set of data for each individual, including contact information allowing for annual follow-up participation, confronted the researchers with many ethical issues that needed to be dealt with before the survey could commence. Our main concern was protection of identity: that no participant could ever be identified from any of his or her responses to the survey in any year it was taken. While this is a relatively simple procedure for the aggregated results, a significant output for the survey annually is the production of a detailed individual report for each participant. The aim of this report is to allow each individual to track their own occupational health, safety and wellbeing both over time and in comparison to other principals. As researchers we are interested in analyzing aggregated results, but wanted the survey to be as useful a tool as possible to the individual participants. A number of protocols were developed to provide arm’s length distance between the researchers and participants. Individual, detailed reports to each principal were constructed automatically, by applying algorithms to each individual’s responses to provide total scores on each subscale of the survey. This ensured that the individual reports were not be seen by any of the researchers. The individual reports were provided to each participant via a secure, password protected website. The researchers used de-identified data sets to conduct specific analyses on the aggregated data. However, this created a difficulty in calculating accurate response rates for the survey.
14
Response Rates Across the country the principals and assistants are represented by approximately 60 professional organisations. For the initial survey in 2011, a total of 20,783 invitations and reminder emails were sent out by each of the principal organisations to their members, most of whom also include assistants as members, between August and October 2011. This kept the researchers at arms length from the principals. The researchers therefore do not know an essential element for determining the actual response rate to the survey: how many principals and assistants actually received an invitation to participate. This makes it impossible to determine the actual response rate as there is no divisor for the calculation. Approximately 3,600 principals registered to take the survey. Some withdrew after registering and any data they had entered was automatically deleted. Some principals were unable to complete the survey electronically due to technical issues. The main issue was browser incompatibility. The other issue preventing completion was a slow internet speed connection between the principal and the survey server. This caused time-out problems preventing continuous connection to the survey. All principals who registered but did not complete the electronic survey while it was open received a .pdf file of the items so that they could fill it out on paper and thus were not excluded from the survey. These surveys are being returned and will be incorporated into the next report.
• 3593 principals registered • 2598 incomplete surveys were received electronically • 2008 completed the survey electronically • 50 have been returned via mail so far. •
This represents somewhere between 20-36% response rate nationally.
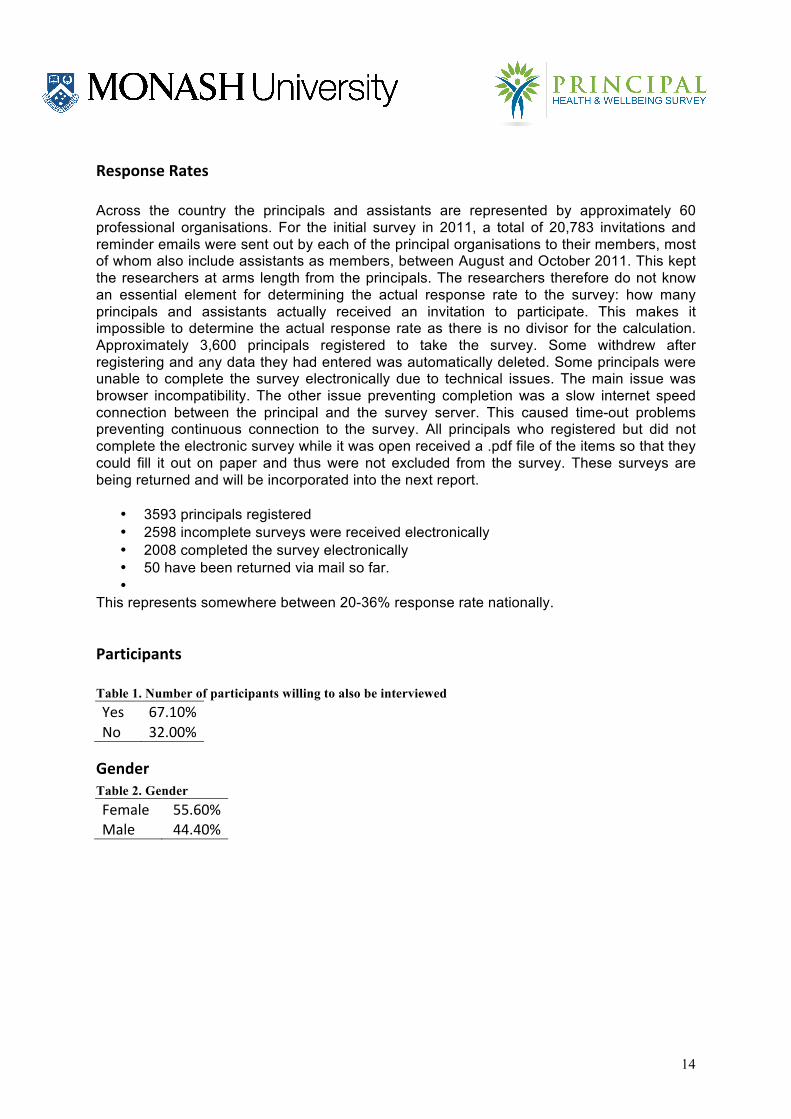
Participants Table 1. Number of participants willing to also be interviewed Yes 67.10% No 32.00%
Gender Table 2. Gender Female 55.60% Male 44.40%
15
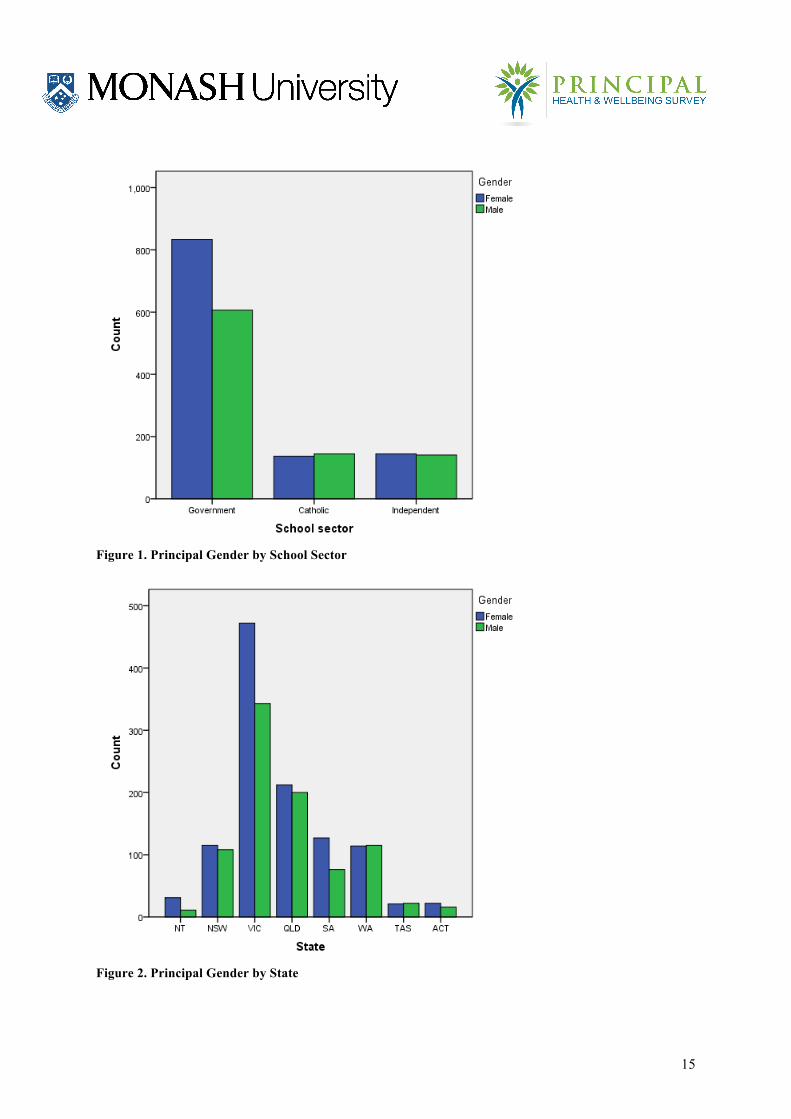
Figure 1. Principal Gender by School Sector
Figure 2. Principal Gender by State

16
Age Range 24 – 75 years (M = 51.35 SD = 7.49)
Figure 3. Year of Birth
Membership of Professional Organisations Over 90% of the principals surveyed belong to at least one professional organization, with 88% belonging to more than one. Table 3. Number of professional organisation memberships per individual principal
0 9.20% 1 38.60% 2 34.10% 3 12.60% 4 3.60% 5 1.50% 6 0.20% 8 0.10%
Role Table 4. Principals' role Principal 57.20% Assistant/Deputy Principal 18.90% Campus Principal 2.70% Missing 21.30%
17
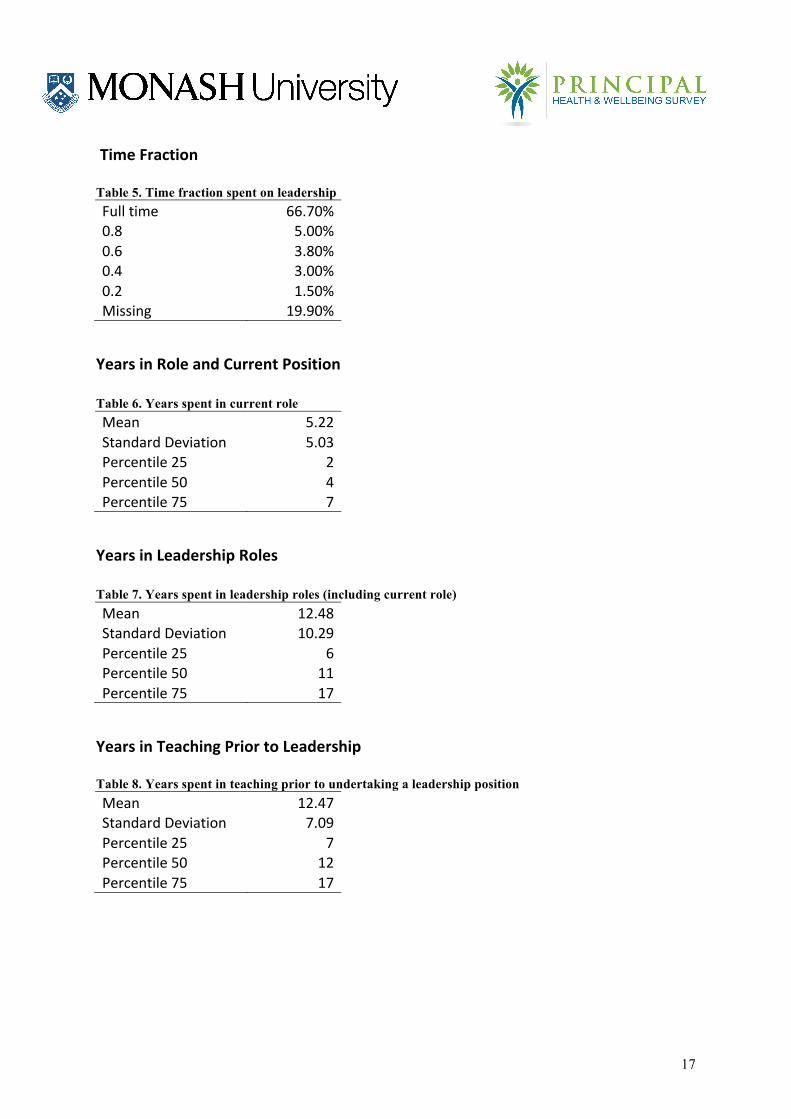
Time Fraction Table 5. Time fraction spent on leadership Full time 66.70% 0.8 5.00% 0.6 3.80% 0.4 3.00% 0.2 1.50% Missing 19.90%
Years in Role and Current Position Table 6. Years spent in current role Mean 5.22 Standard Deviation 5.03 Percentile 25 2 Percentile 50 4 Percentile 75 7
Years in Leadership Roles Table 7. Years spent in leadership roles (including current role) Mean 12.48 Standard Deviation 10.29 Percentile 25 6 Percentile 50 11 Percentile 75 17
Years in Teaching Prior to Leadership Table 8. Years spent in teaching prior to undertaking a leadership position Mean 12.47 Standard Deviation 7.09 Percentile 25 7 Percentile 50 12 Percentile 75 17
18
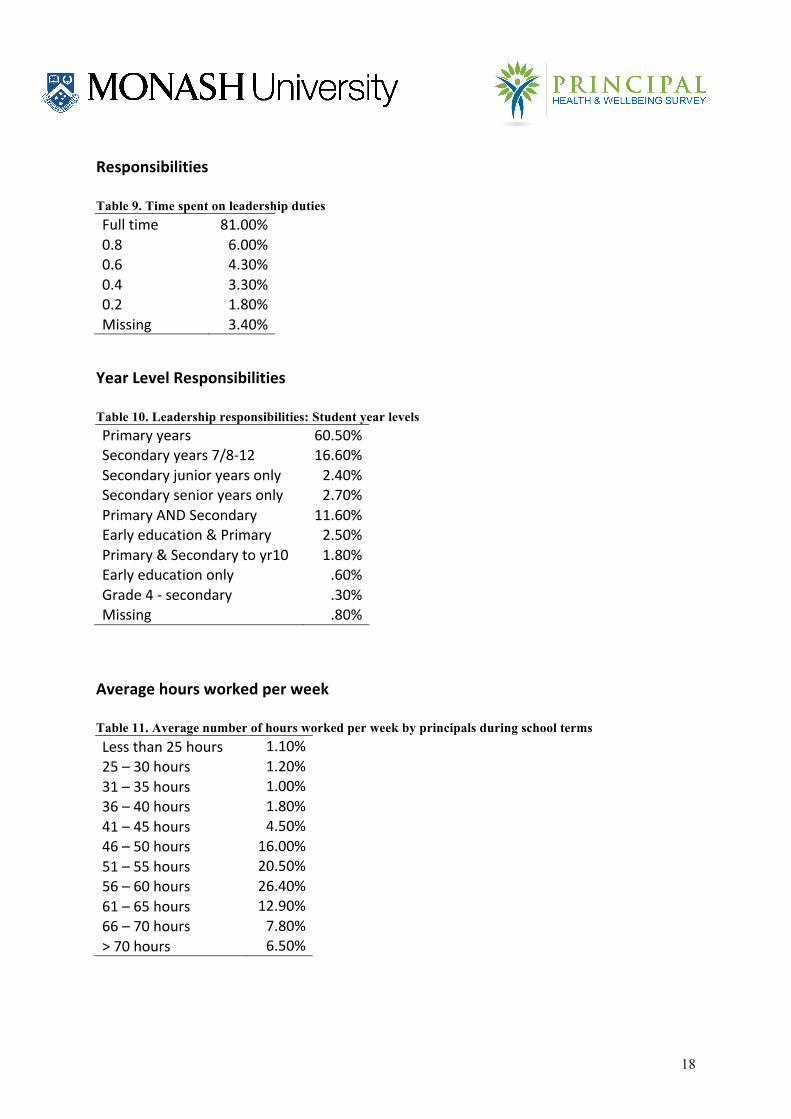
Responsibilities Table 9. Time spent on leadership duties Full time 81.00% 0.8 6.00% 0.6 4.30% 0.4 3.30% 0.2 1.80% Missing 3.40%
Year Level Responsibilities Table 10. Leadership responsibilities: Student year levels Primary years 60.50% Secondary years 7/8-‐12 16.60% Secondary junior years only 2.40% Secondary senior years only 2.70% Primary AND Secondary 11.60% Early education & Primary 2.50% Primary & Secondary to yr10 1.80% Early education only .60% Grade 4 -‐ secondary .30% Missing .80%
Average hours worked per week Table 11. Average number of hours worked per week by principals during school terms Less than 25 hours 1.10% 25 – 30 hours 1.20% 31 – 35 hours 1.00% 36 – 40 hours 1.80% 41 – 45 hours 4.50% 46 – 50 hours 16.00% 51 – 55 hours 20.50% 56 – 60 hours 26.40% 61 – 65 hours 12.90% 66 – 70 hours 7.80% > 70 hours 6.50%
19
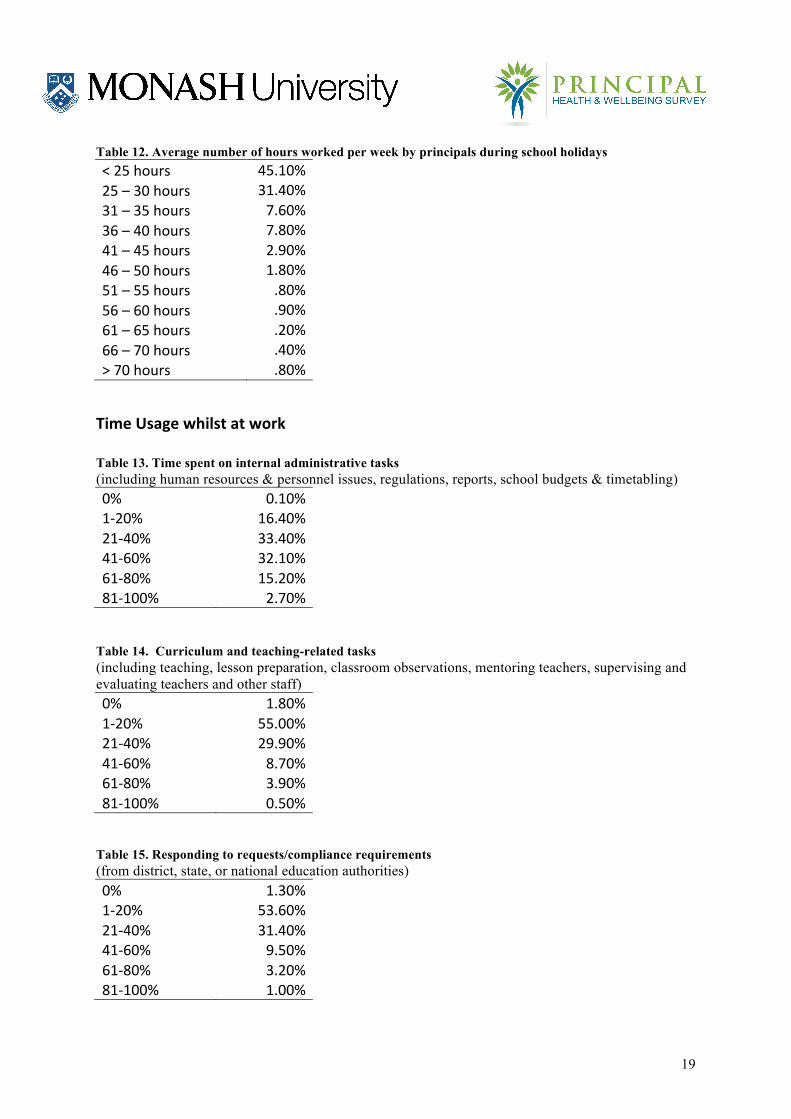
Table 12. Average number of hours worked per week by principals during school holidays < 25 hours 45.10% 25 – 30 hours 31.40% 31 – 35 hours 7.60% 36 – 40 hours 7.80% 41 – 45 hours 2.90% 46 – 50 hours 1.80% 51 – 55 hours .80% 56 – 60 hours .90% 61 – 65 hours .20% 66 – 70 hours .40% > 70 hours .80%
Time Usage whilst at work Table 13. Time spent on internal administrative tasks (including human resources & personnel issues, regulations, reports, school budgets & timetabling) 0% 0.10% 1-‐20% 16.40% 21-‐40% 33.40% 41-‐60% 32.10% 61-‐80% 15.20% 81-‐100% 2.70%
Table 14. Curriculum and teaching-related tasks (including teaching, lesson preparation, classroom observations, mentoring teachers, supervising and evaluating teachers and other staff) 0% 1.80% 1-‐20% 55.00% 21-‐40% 29.90% 41-‐60% 8.70% 61-‐80% 3.90% 81-‐100% 0.50%
Table 15. Responding to requests/compliance requirements (from district, state, or national education authorities) 0% 1.30% 1-‐20% 53.60% 21-‐40% 31.40% 41-‐60% 9.50% 61-‐80% 3.20% 81-‐100% 1.00%
20
Table 16. Representing the school at meetings or in the community and networking 0% 1.10% 1-‐20% 76.00% 21-‐40% 17.10% 41-‐60% 4.20% 61-‐80% 1.20% 81-‐100% 0.30%
Table 17. Public relations and fundraising 0% 5.70% 1-‐20% 80.80% 21-‐40% 10.40% 41-‐60% 2.00% 61-‐80% 0.80% 81-‐100% 0.30%
Table 18. Occupational Health and Safety compliance 0% 6.10% 1-‐20% 77.90% 21-‐40% 11.20% 41-‐60% 3.10% 61-‐80% 1.00% 81-‐100% 0.60%
Table 19. Other duties 0% 3.80% 1-‐20% 66.50% 21-‐40% 19.90% 41-‐60% 6.40% 61-‐80% 2.50% 81-‐100% 0.80%

21
Table 20. Percentage of work regarded as management rather than leadership orientated 10% 0.60% 20% 2.10% 30% 6.30% 40% 12.30% 50% 17.00% 60% 18.60% 70% 22.20% 80% 15.10% 90% 5.50% 100% 0.20%
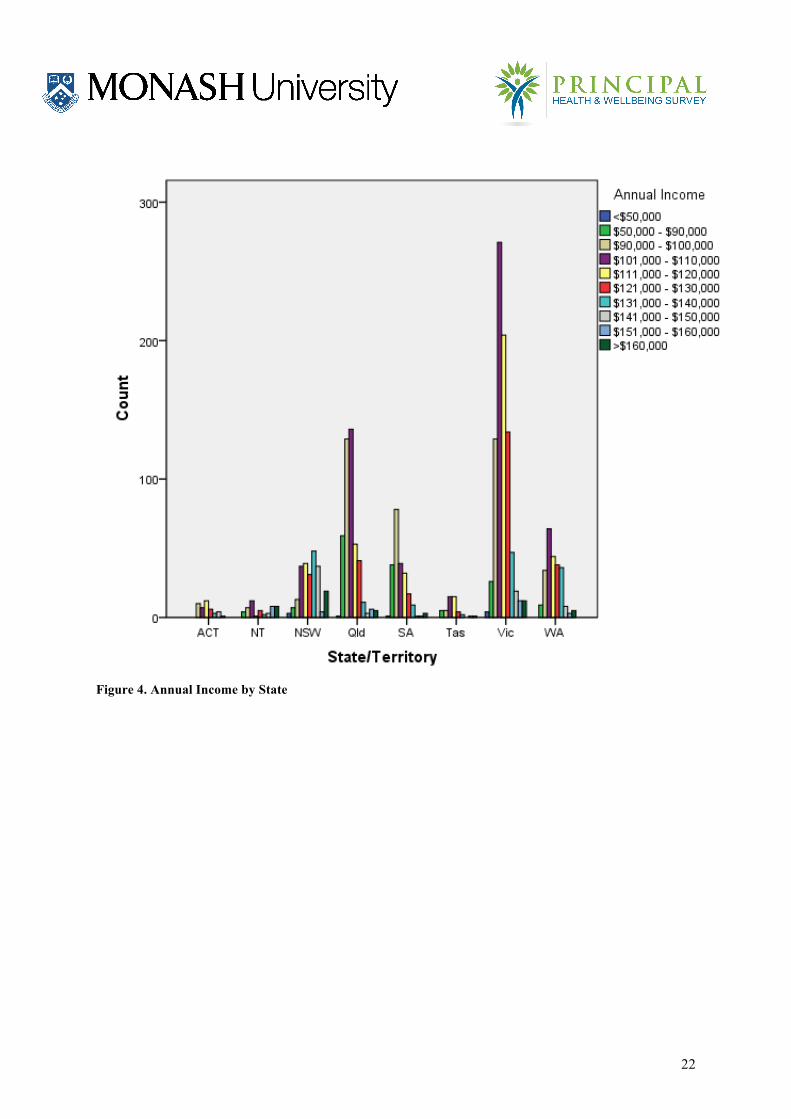
Income – Per annum Table 21. Annual income by quantum grouping <$50,000 6.80% $50,000 -‐ $90,000 10.40% $90,000 -‐ $100,000 7.90% $101,000 -‐ $110,000 27.20% $111,000 -‐ $120,000 18.70% $121,000 -‐ $130,000 13.10% $131,000 -‐ $140,000 7.60% $141,000 -‐ $150,000 3.60% $151,000 -‐ $160,000 1.70% >$160,000 2.60%
22
Figure 4. Annual Income by State
23
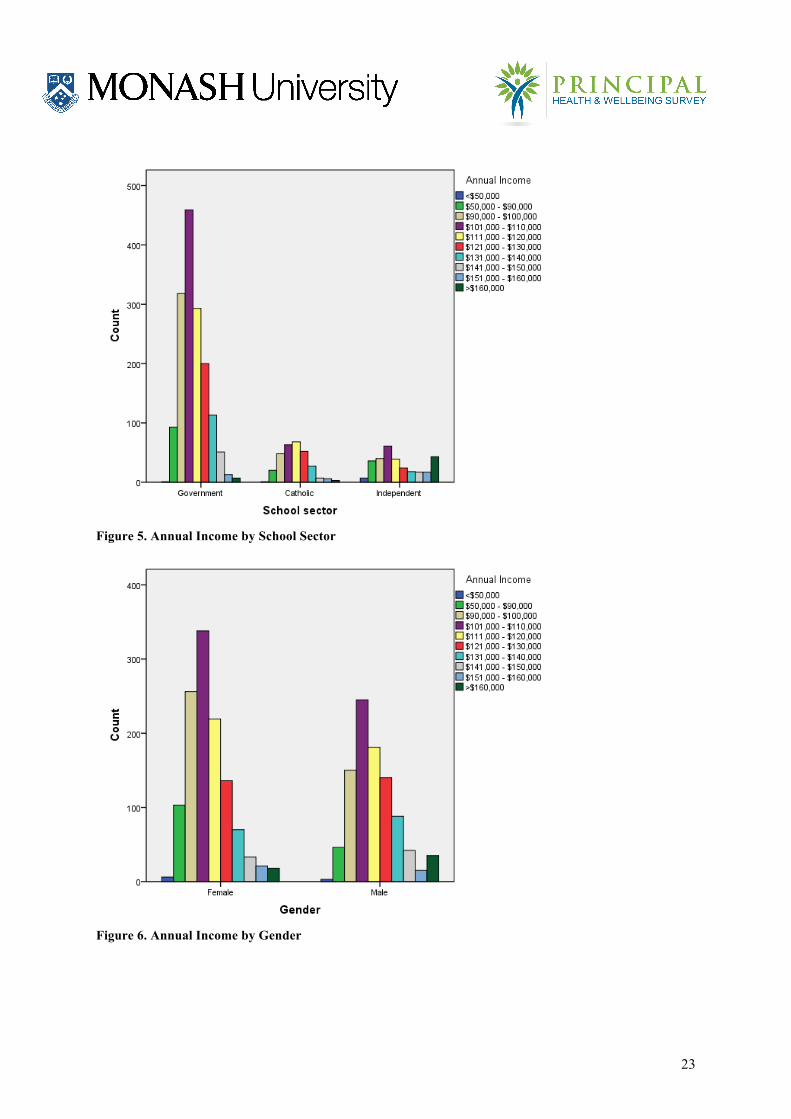
Figure 5. Annual Income by School Sector
Figure 6. Annual Income by Gender
24
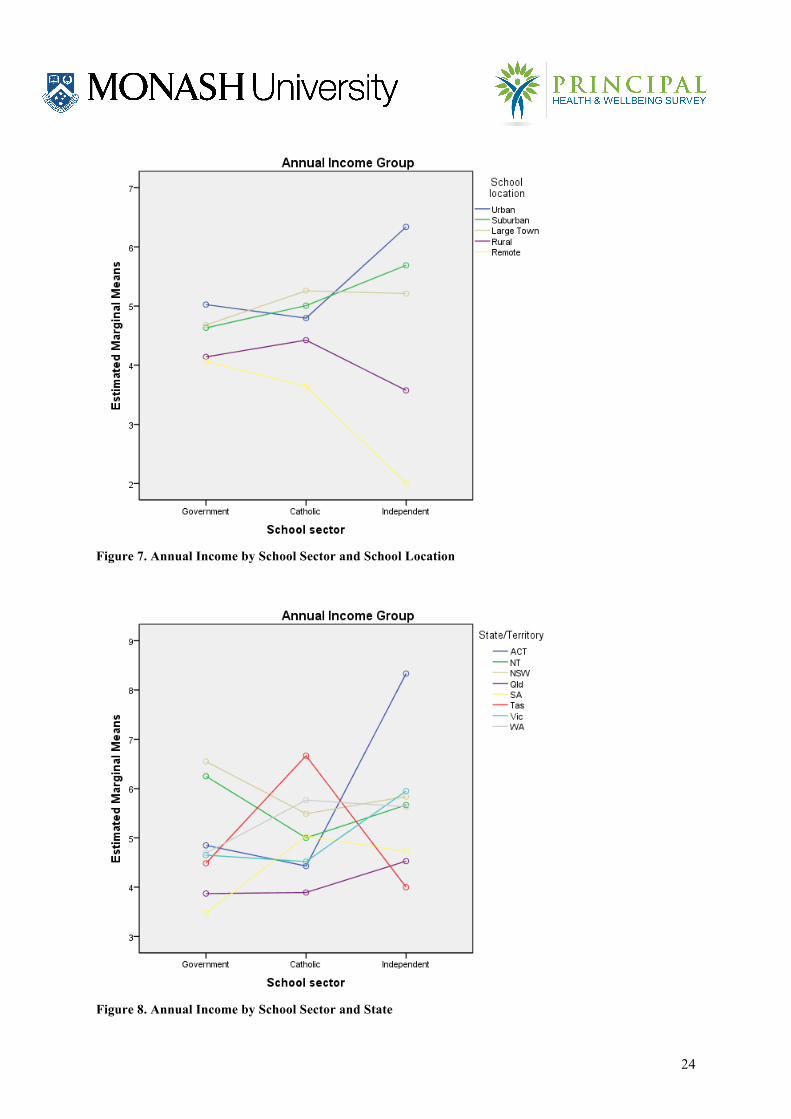
Figure 7. Annual Income by School Sector and School Location
Figure 8. Annual Income by School Sector and State
25
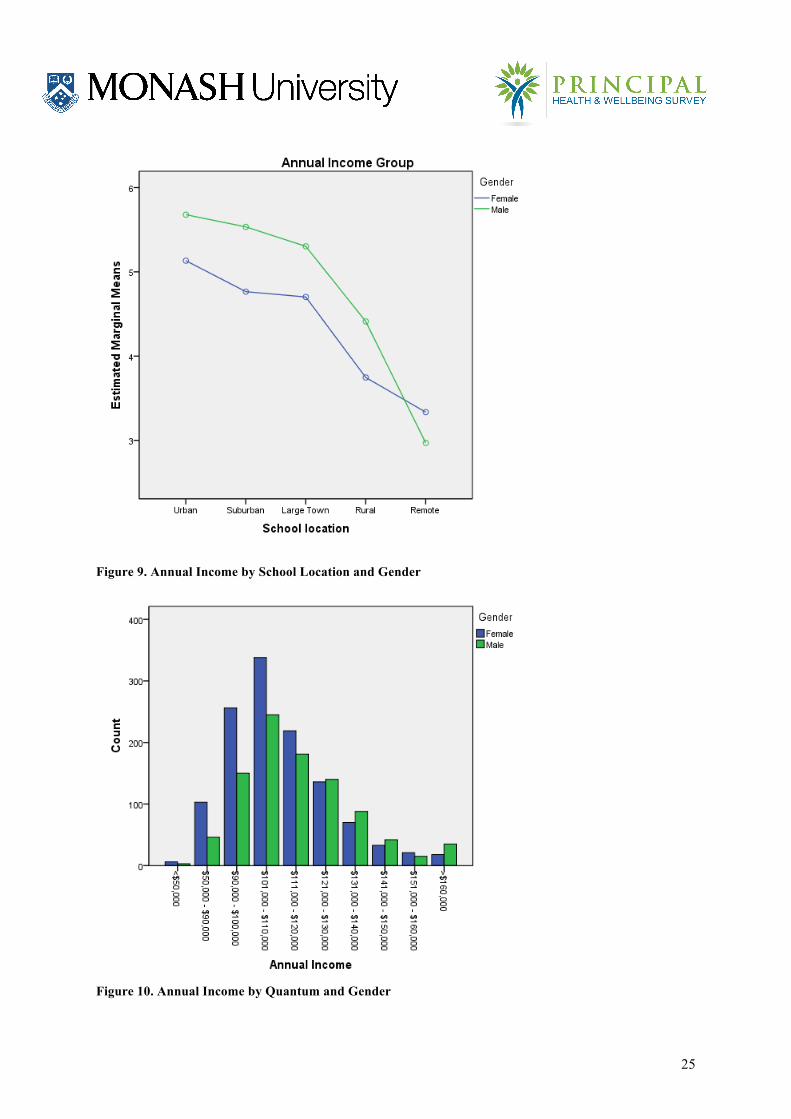
Figure 9. Annual Income by School Location and Gender
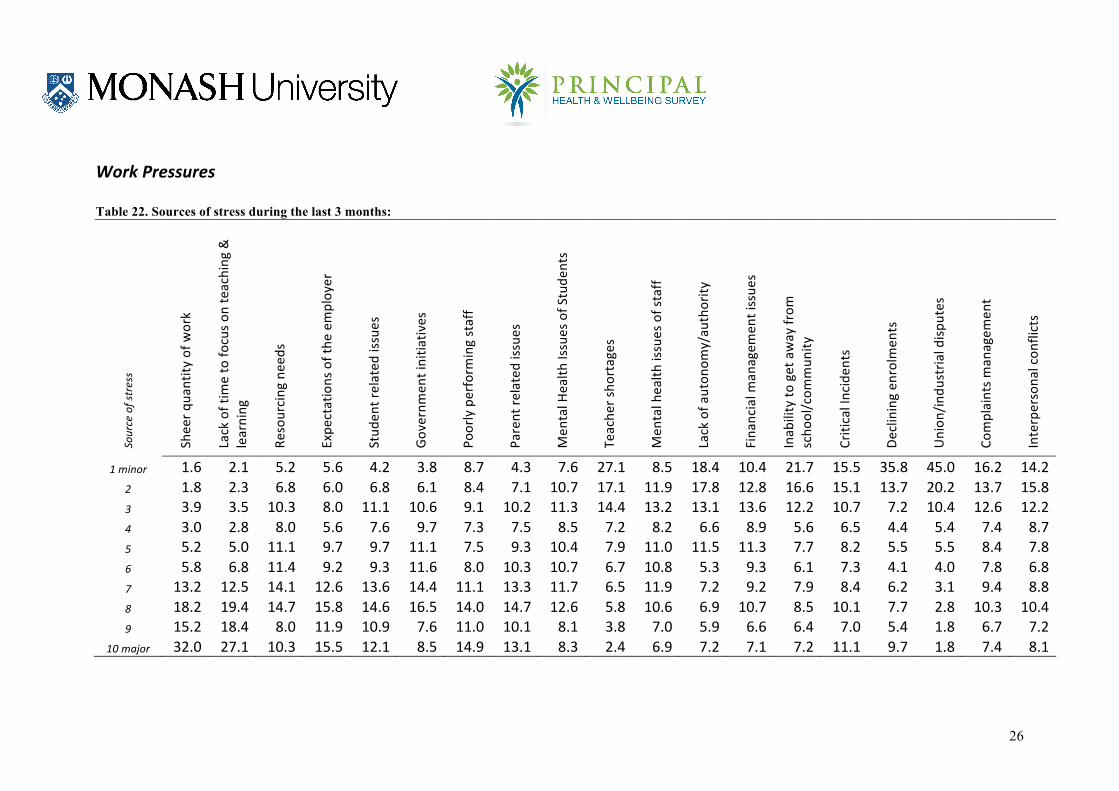
Figure 10. Annual Income by Quantum and Gender
26
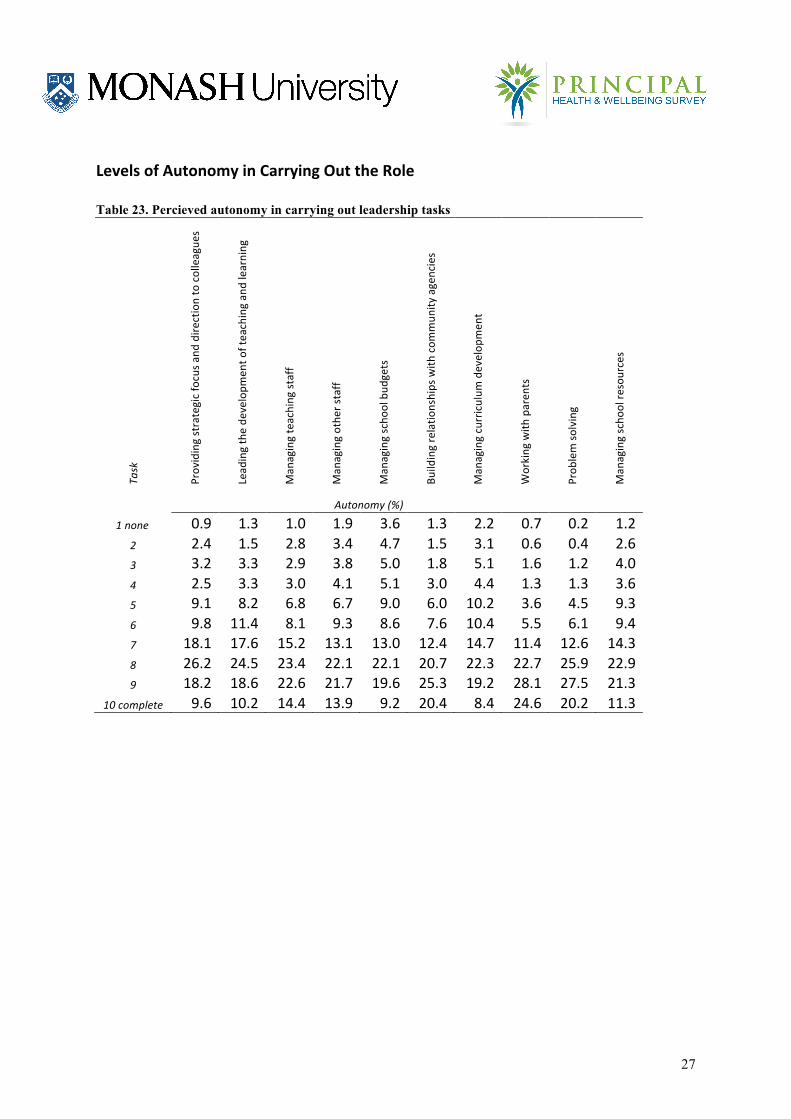
Work Pressures Table 22. Sources of stress during the last 3 months:
Source of stress
Shee
r qua
ntity
of w
ork
Lack of tim
e to fo
cus o
n teaching
&
learning
Resourcing
nee
ds
Expe
ctations of the
employer
Stud
ent related
issues
Governm
ent initia
tives
Poorly perform
ing staff
Parent re
lated iss
ues
Men
tal H
ealth
Issues of Stude
nts
Teache
r sho
rtages
Men
tal health
issues of staff
Lack of a
uton
omy/au
thority
Fina
ncial m
anagem
ent issue
s
Inab
ility to
get away from
scho
ol/com
mun
ity
Critical Inciden
ts
Declining en
rolm
ents
Union
/indu
stria
l disp
utes
Complaints m
anagem
ent
Interpersona
l con
flicts
1 minor 1.6 2.1 5.2 5.6 4.2 3.8 8.7 4.3 7.6 27.1 8.5 18.4 10.4 21.7 15.5 35.8 45.0 16.2 14.2 2 1.8 2.3 6.8 6.0 6.8 6.1 8.4 7.1 10.7 17.1 11.9 17.8 12.8 16.6 15.1 13.7 20.2 13.7 15.8 3 3.9 3.5 10.3 8.0 11.1 10.6 9.1 10.2 11.3 14.4 13.2 13.1 13.6 12.2 10.7 7.2 10.4 12.6 12.2 4 3.0 2.8 8.0 5.6 7.6 9.7 7.3 7.5 8.5 7.2 8.2 6.6 8.9 5.6 6.5 4.4 5.4 7.4 8.7 5 5.2 5.0 11.1 9.7 9.7 11.1 7.5 9.3 10.4 7.9 11.0 11.5 11.3 7.7 8.2 5.5 5.5 8.4 7.8 6 5.8 6.8 11.4 9.2 9.3 11.6 8.0 10.3 10.7 6.7 10.8 5.3 9.3 6.1 7.3 4.1 4.0 7.8 6.8 7 13.2 12.5 14.1 12.6 13.6 14.4 11.1 13.3 11.7 6.5 11.9 7.2 9.2 7.9 8.4 6.2 3.1 9.4 8.8 8 18.2 19.4 14.7 15.8 14.6 16.5 14.0 14.7 12.6 5.8 10.6 6.9 10.7 8.5 10.1 7.7 2.8 10.3 10.4 9 15.2 18.4 8.0 11.9 10.9 7.6 11.0 10.1 8.1 3.8 7.0 5.9 6.6 6.4 7.0 5.4 1.8 6.7 7.2
10 major 32.0 27.1 10.3 15.5 12.1 8.5 14.9 13.1 8.3 2.4 6.9 7.2 7.1 7.2 11.1 9.7 1.8 7.4 8.1
27
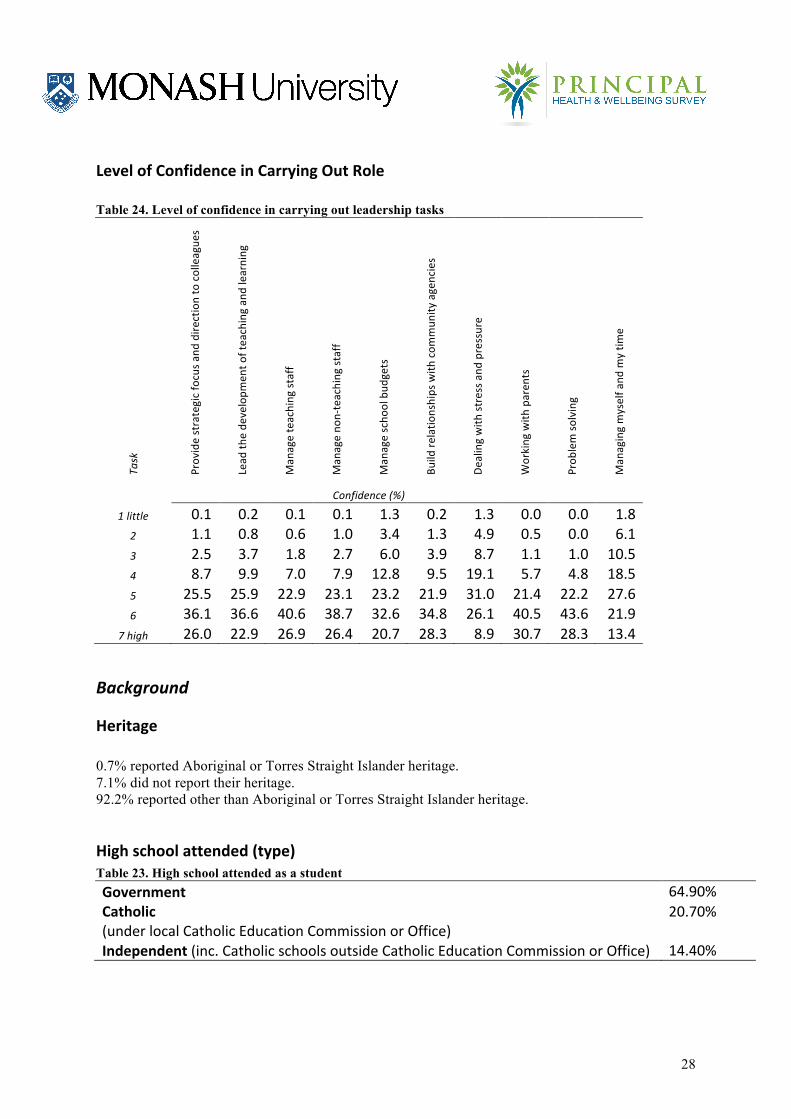
Levels of Autonomy in Carrying Out the Role Table 23. Percieved autonomy in carrying out leadership tasks
Task
Providing strategic focus a
nd dire
ction to colleague
s
Lead
ing the de
velopm
ent o
f teaching an
d learning
Man
aging teaching staff
Man
aging othe
r staff
Man
aging scho
ol bud
gets
Building relatio
nships with
com
mun
ity agencies
Man
aging curriculum
develop
men
t
Working with
paren
ts
Prob
lem so
lving
Man
aging scho
ol re
sources
Autonomy (%) 1 none 0.9 1.3 1.0 1.9 3.6 1.3 2.2 0.7 0.2 1.2
2 2.4 1.5 2.8 3.4 4.7 1.5 3.1 0.6 0.4 2.6 3 3.2 3.3 2.9 3.8 5.0 1.8 5.1 1.6 1.2 4.0 4 2.5 3.3 3.0 4.1 5.1 3.0 4.4 1.3 1.3 3.6 5 9.1 8.2 6.8 6.7 9.0 6.0 10.2 3.6 4.5 9.3 6 9.8 11.4 8.1 9.3 8.6 7.6 10.4 5.5 6.1 9.4 7 18.1 17.6 15.2 13.1 13.0 12.4 14.7 11.4 12.6 14.3 8 26.2 24.5 23.4 22.1 22.1 20.7 22.3 22.7 25.9 22.9 9 18.2 18.6 22.6 21.7 19.6 25.3 19.2 28.1 27.5 21.3
10 complete 9.6 10.2 14.4 13.9 9.2 20.4 8.4 24.6 20.2 11.3
28
Level of Confidence in Carrying Out Role Table 24. Level of confidence in carrying out leadership tasks
Task
Provide strategic focus a
nd dire
ction to colleague
s
Lead
the de
velopm
ent o
f teaching an
d learning
Man
age teaching staff
Man
age no
n-‐teaching staff
Man
age scho
ol bud
gets
Build re
latio
nships with
com
mun
ity agencies
Dealing with
stress and
pressure
Working with
paren
ts
Prob
lem so
lving
Man
aging myself a
nd m
y tim
e
Confidence (%) 1 little 0.1 0.2 0.1 0.1 1.3 0.2 1.3 0.0 0.0 1.8
2 1.1 0.8 0.6 1.0 3.4 1.3 4.9 0.5 0.0 6.1 3 2.5 3.7 1.8 2.7 6.0 3.9 8.7 1.1 1.0 10.5 4 8.7 9.9 7.0 7.9 12.8 9.5 19.1 5.7 4.8 18.5 5 25.5 25.9 22.9 23.1 23.2 21.9 31.0 21.4 22.2 27.6 6 36.1 36.6 40.6 38.7 32.6 34.8 26.1 40.5 43.6 21.9
7 high 26.0 22.9 26.9 26.4 20.7 28.3 8.9 30.7 28.3 13.4
Background
Heritage 0.7% reported Aboriginal or Torres Straight Islander heritage. 7.1% did not report their heritage. 92.2% reported other than Aboriginal or Torres Straight Islander heritage.
High school attended (type) Table 23. High school attended as a student Government 64.90% Catholic (under local Catholic Education Commission or Office)
20.70%
Independent (inc. Catholic schools outside Catholic Education Commission or Office) 14.40%
29
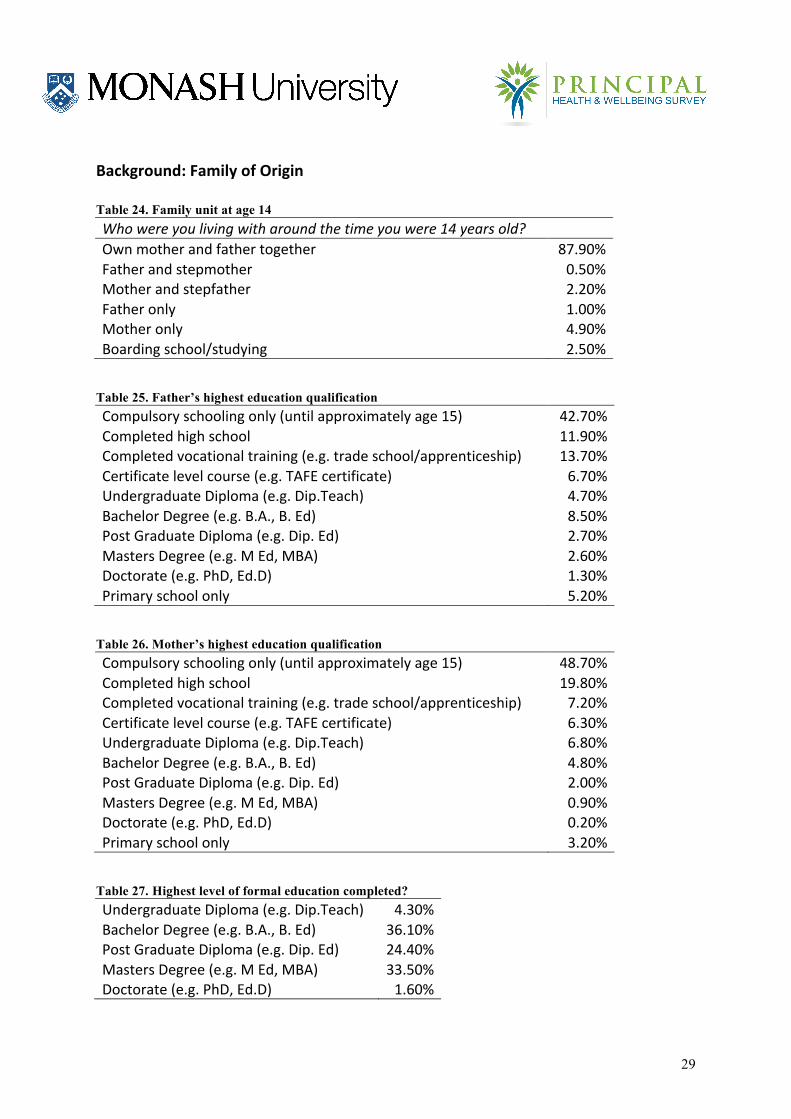
Background: Family of Origin Table 24. Family unit at age 14 Who were you living with around the time you were 14 years old? Own mother and father together 87.90% Father and stepmother 0.50% Mother and stepfather 2.20% Father only 1.00% Mother only 4.90% Boarding school/studying 2.50%
Table 25. Father’s highest education qualification Compulsory schooling only (until approximately age 15) 42.70% Completed high school 11.90% Completed vocational training (e.g. trade school/apprenticeship) 13.70% Certificate level course (e.g. TAFE certificate) 6.70% Undergraduate Diploma (e.g. Dip.Teach) 4.70% Bachelor Degree (e.g. B.A., B. Ed) 8.50% Post Graduate Diploma (e.g. Dip. Ed) 2.70% Masters Degree (e.g. M Ed, MBA) 2.60% Doctorate (e.g. PhD, Ed.D) 1.30% Primary school only 5.20%
Table 26. Mother’s highest education qualification Compulsory schooling only (until approximately age 15) 48.70% Completed high school 19.80% Completed vocational training (e.g. trade school/apprenticeship) 7.20% Certificate level course (e.g. TAFE certificate) 6.30% Undergraduate Diploma (e.g. Dip.Teach) 6.80% Bachelor Degree (e.g. B.A., B. Ed) 4.80% Post Graduate Diploma (e.g. Dip. Ed) 2.00% Masters Degree (e.g. M Ed, MBA) 0.90% Doctorate (e.g. PhD, Ed.D) 0.20% Primary school only 3.20%
Table 27. Highest level of formal education completed? Undergraduate Diploma (e.g. Dip.Teach) 4.30% Bachelor Degree (e.g. B.A., B. Ed) 36.10% Post Graduate Diploma (e.g. Dip. Ed) 24.40% Masters Degree (e.g. M Ed, MBA) 33.50% Doctorate (e.g. PhD, Ed.D) 1.60%
30
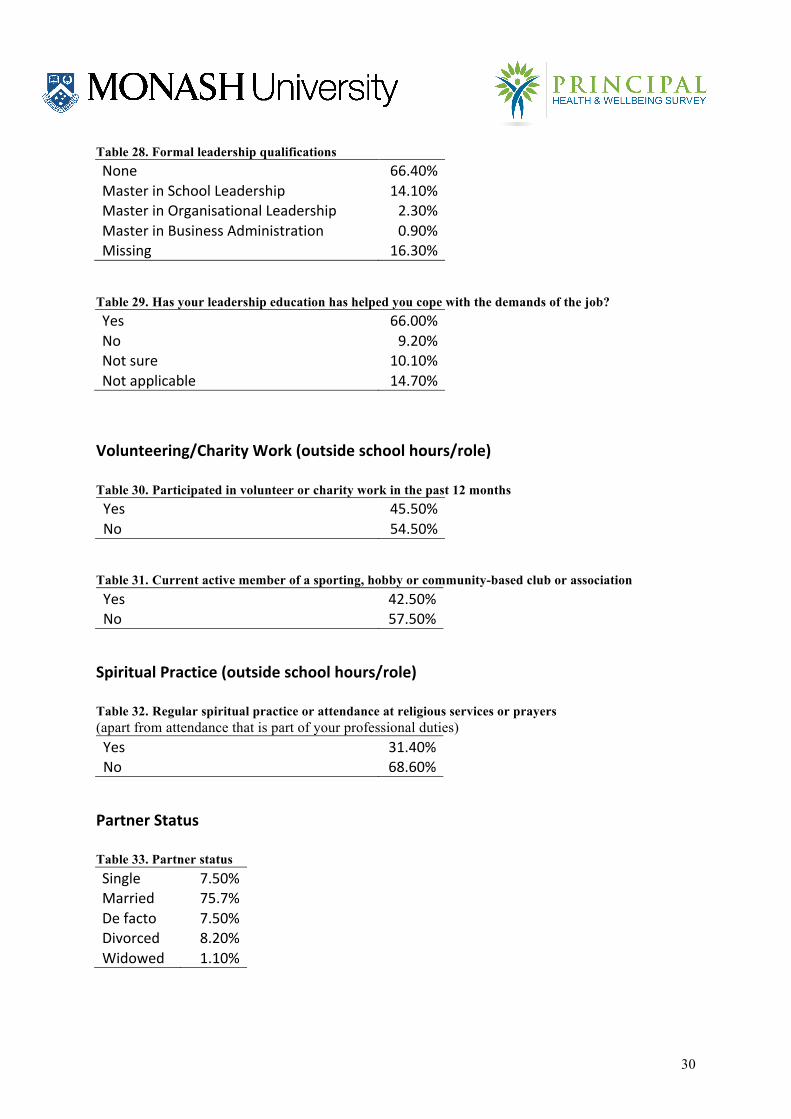
Table 28. Formal leadership qualifications None 66.40% Master in School Leadership 14.10% Master in Organisational Leadership 2.30% Master in Business Administration 0.90% Missing 16.30%
Table 29. Has your leadership education has helped you cope with the demands of the job? Yes 66.00% No 9.20% Not sure 10.10% Not applicable 14.70%
Volunteering/Charity Work (outside school hours/role) Table 30. Participated in volunteer or charity work in the past 12 months Yes 45.50% No 54.50%
Table 31. Current active member of a sporting, hobby or community-based club or association Yes 42.50% No 57.50%
Spiritual Practice (outside school hours/role) Table 32. Regular spiritual practice or attendance at religious services or prayers (apart from attendance that is part of your professional duties) Yes 31.40% No 68.60%
Partner Status Table 33. Partner status Single 7.50% Married 75.7% De facto 7.50% Divorced 8.20% Widowed 1.10%
31
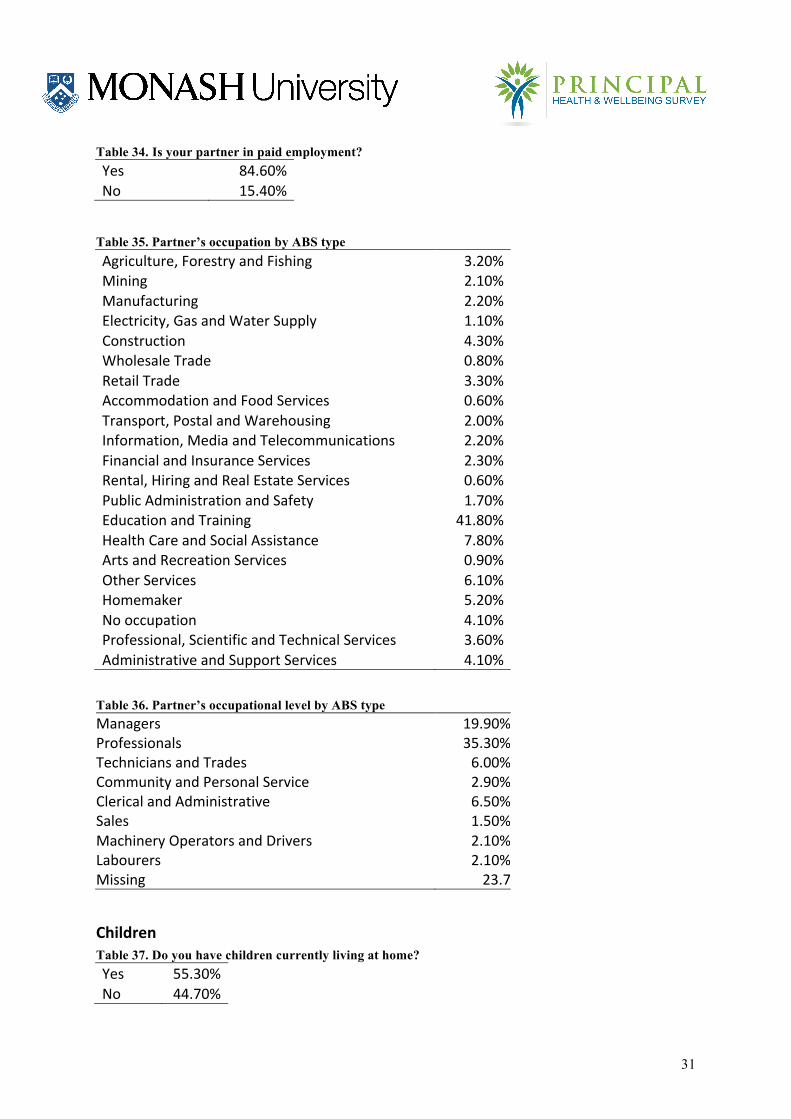
Table 34. Is your partner in paid employment? Yes 84.60% No 15.40%
Table 35. Partner’s occupation by ABS type Agriculture, Forestry and Fishing 3.20% Mining 2.10% Manufacturing 2.20% Electricity, Gas and Water Supply 1.10% Construction 4.30% Wholesale Trade 0.80% Retail Trade 3.30% Accommodation and Food Services 0.60% Transport, Postal and Warehousing 2.00% Information, Media and Telecommunications 2.20% Financial and Insurance Services 2.30% Rental, Hiring and Real Estate Services 0.60% Public Administration and Safety 1.70% Education and Training 41.80% Health Care and Social Assistance 7.80% Arts and Recreation Services 0.90% Other Services 6.10% Homemaker 5.20% No occupation 4.10% Professional, Scientific and Technical Services 3.60% Administrative and Support Services 4.10%
Table 36. Partner’s occupational level by ABS type Managers 19.90% Professionals 35.30% Technicians and Trades 6.00% Community and Personal Service 2.90% Clerical and Administrative 6.50% Sales 1.50% Machinery Operators and Drivers 2.10% Labourers 2.10% Missing 23.7
Children Table 37. Do you have children currently living at home? Yes 55.30% No 44.70%
32
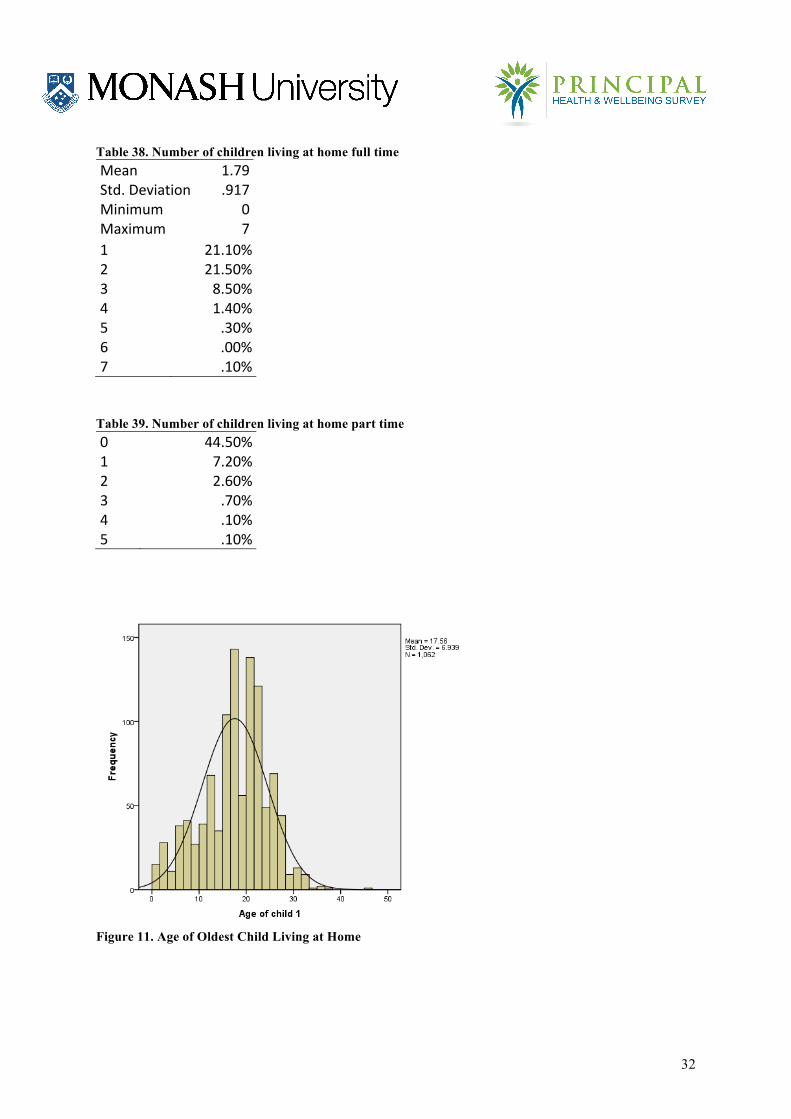
Table 38. Number of children living at home full time Mean 1.79 Std. Deviation .917 Minimum 0 Maximum 7
1 21.10% 2 21.50% 3 8.50% 4 1.40% 5 .30% 6 .00% 7 .10% Table 39. Number of children living at home part time 0 44.50% 1 7.20% 2 2.60% 3 .70% 4 .10% 5 .10%
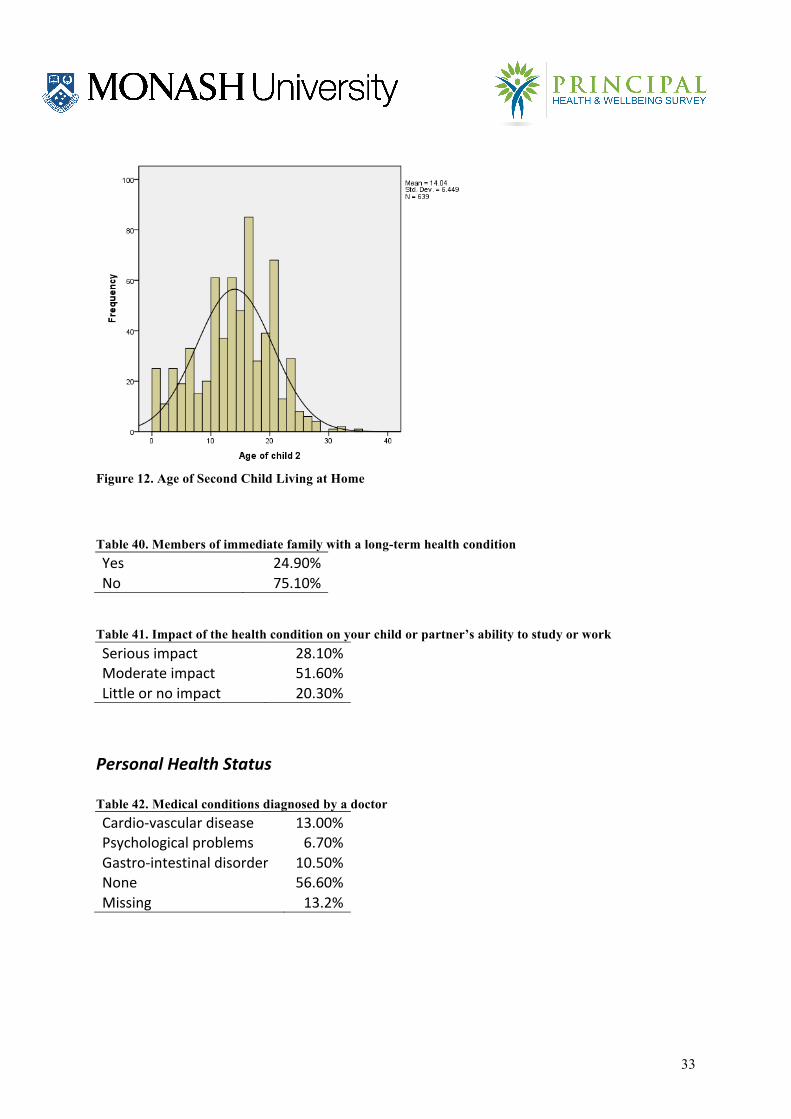
Figure 11. Age of Oldest Child Living at Home
33
Figure 12. Age of Second Child Living at Home Table 40. Members of immediate family with a long-term health condition Yes 24.90% No 75.10%
Table 41. Impact of the health condition on your child or partner’s ability to study or work Serious impact 28.10% Moderate impact 51.60% Little or no impact 20.30%
Personal Health Status Table 42. Medical conditions diagnosed by a doctor Cardio-‐vascular disease 13.00% Psychological problems 6.70% Gastro-‐intestinal disorder 10.50% None 56.60% Missing 13.2%
34
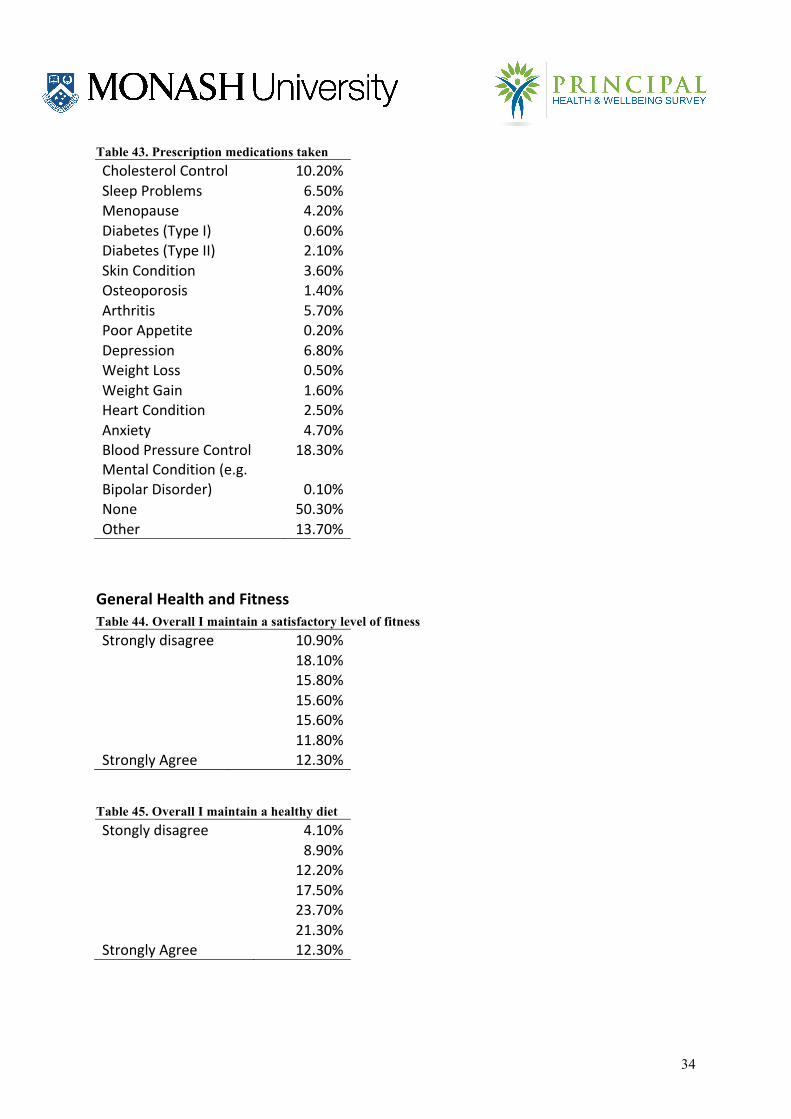
Table 43. Prescription medications taken Cholesterol Control 10.20% Sleep Problems 6.50% Menopause 4.20% Diabetes (Type I) 0.60% Diabetes (Type II) 2.10% Skin Condition 3.60% Osteoporosis 1.40% Arthritis 5.70% Poor Appetite 0.20% Depression 6.80% Weight Loss 0.50% Weight Gain 1.60% Heart Condition 2.50% Anxiety 4.70% Blood Pressure Control 18.30% Mental Condition (e.g. Bipolar Disorder) 0.10% None 50.30% Other 13.70%
General Health and Fitness Table 44. Overall I maintain a satisfactory level of fitness Strongly disagree 10.90%
18.10%
15.80%
15.60%
15.60%
11.80%
Strongly Agree 12.30% Table 45. Overall I maintain a healthy diet Stongly disagree 4.10%
8.90%
12.20%
17.50%
23.70%
21.30%
Strongly Agree 12.30%
35
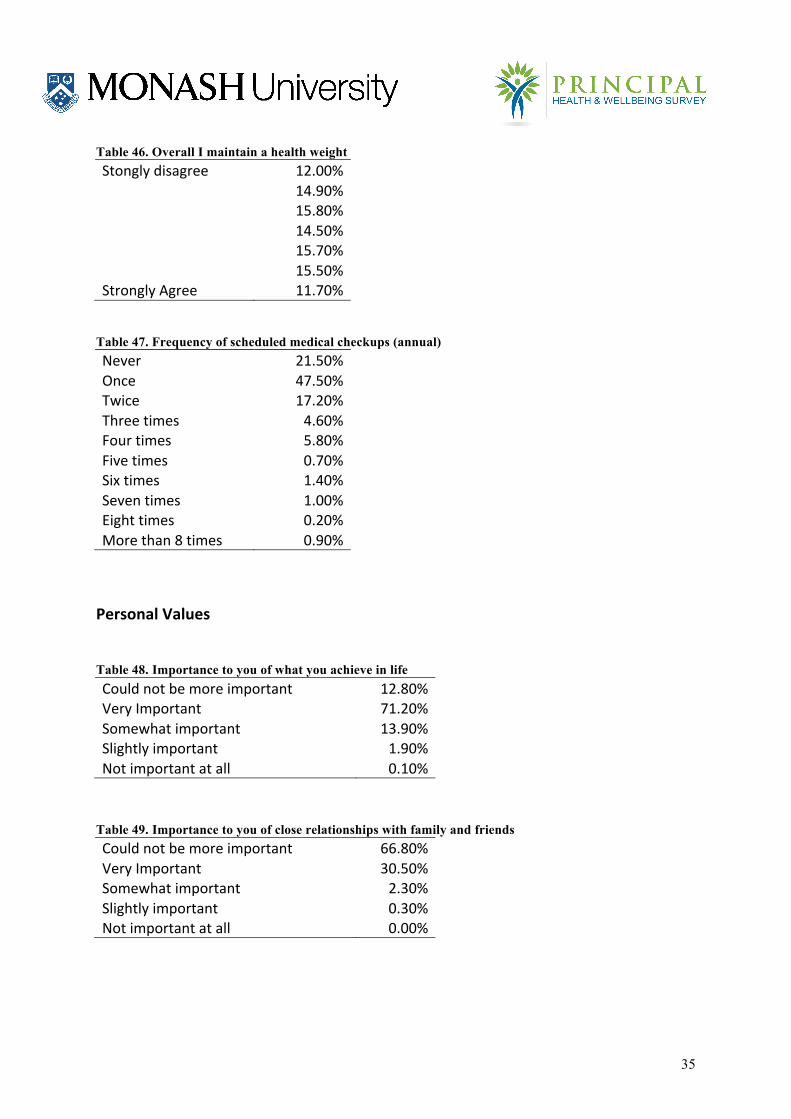
Table 46. Overall I maintain a health weight Stongly disagree 12.00%
14.90%
15.80%
14.50%
15.70%
15.50%
Strongly Agree 11.70% Table 47. Frequency of scheduled medical checkups (annual) Never 21.50% Once 47.50% Twice 17.20% Three times 4.60% Four times 5.80% Five times 0.70% Six times 1.40% Seven times 1.00% Eight times 0.20% More than 8 times 0.90%
Personal Values Table 48. Importance to you of what you achieve in life Could not be more important 12.80% Very Important 71.20% Somewhat important 13.90% Slightly important 1.90% Not important at all 0.10%
Table 49. Importance to you of close relationships with family and friends Could not be more important 66.80% Very Important 30.50% Somewhat important 2.30% Slightly important 0.30% Not important at all 0.00%
36
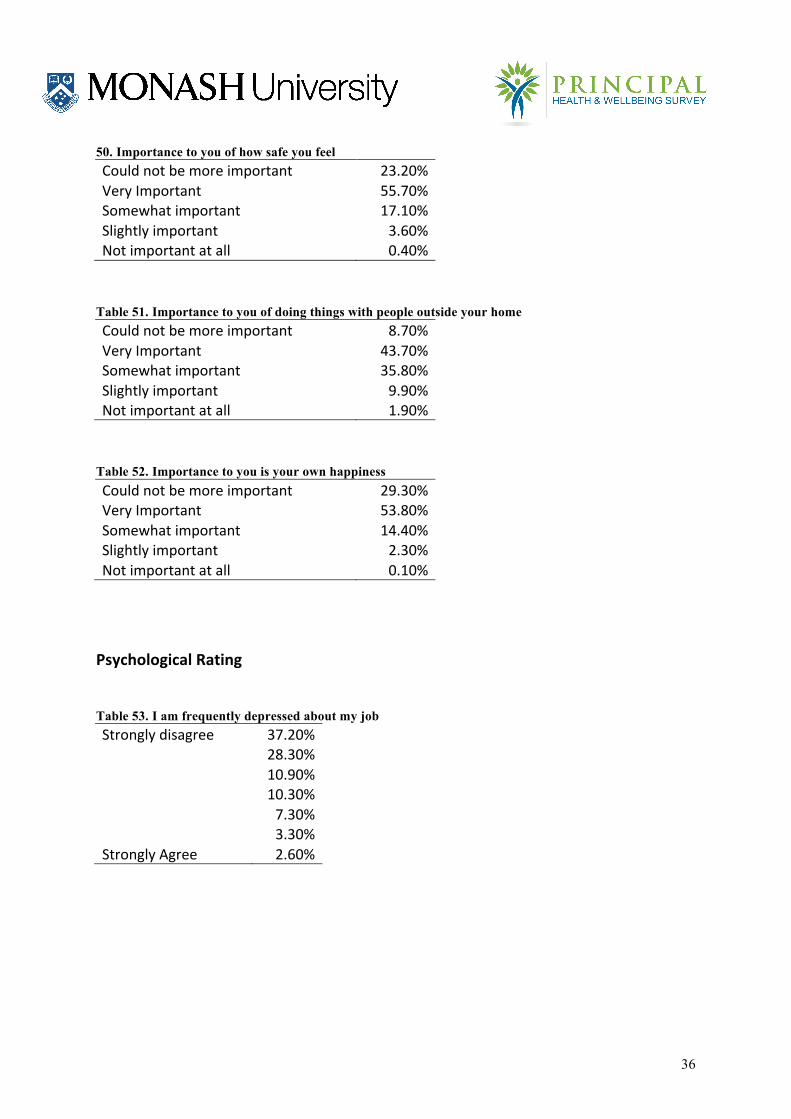
50. Importance to you of how safe you feel Could not be more important 23.20% Very Important 55.70% Somewhat important 17.10% Slightly important 3.60% Not important at all 0.40%
Table 51. Importance to you of doing things with people outside your home Could not be more important 8.70% Very Important 43.70% Somewhat important 35.80% Slightly important 9.90% Not important at all 1.90%
Table 52. Importance to you is your own happiness Could not be more important 29.30% Very Important 53.80% Somewhat important 14.40% Slightly important 2.30% Not important at all 0.10%
Psychological Rating Table 53. I am frequently depressed about my job Strongly disagree 37.20%
28.30%
10.90%
10.30%
7.30%
3.30%
Strongly Agree 2.60%
37
Table 54. I am frequently depressed about my job at certain times of the year Strongly disagree 27.00%
21.80%
11.70%
10.00%
13.50%
9.90%
Strongly Agree 6.00%
Sources of Support Table 55. Sources of support (participants were able to list multiple sources) Partner 82.00% Friend 65.70% Family member 44.20% Colleague in workplace 63.20% School Leader/Colleague – Professional Relationship
56.20%
School Leader/Colleague – Also a friend
43.10%
Supervisor/Line Manager 23.60% Department/Employer 6.40% Professional Association 17.90% Medical Practitioner 16.30% Psychologist/Counsellor 10.80%
Alcohol Intake Table 56. AUDIT 1: How often do you have a drink containing alcohol?
V
a
l
d
never 7.80% monthly or less 13.90% 2-‐4 times a month 19.50% 2-‐3 times a week 28.80% 4 or more times a week 30.00%
38
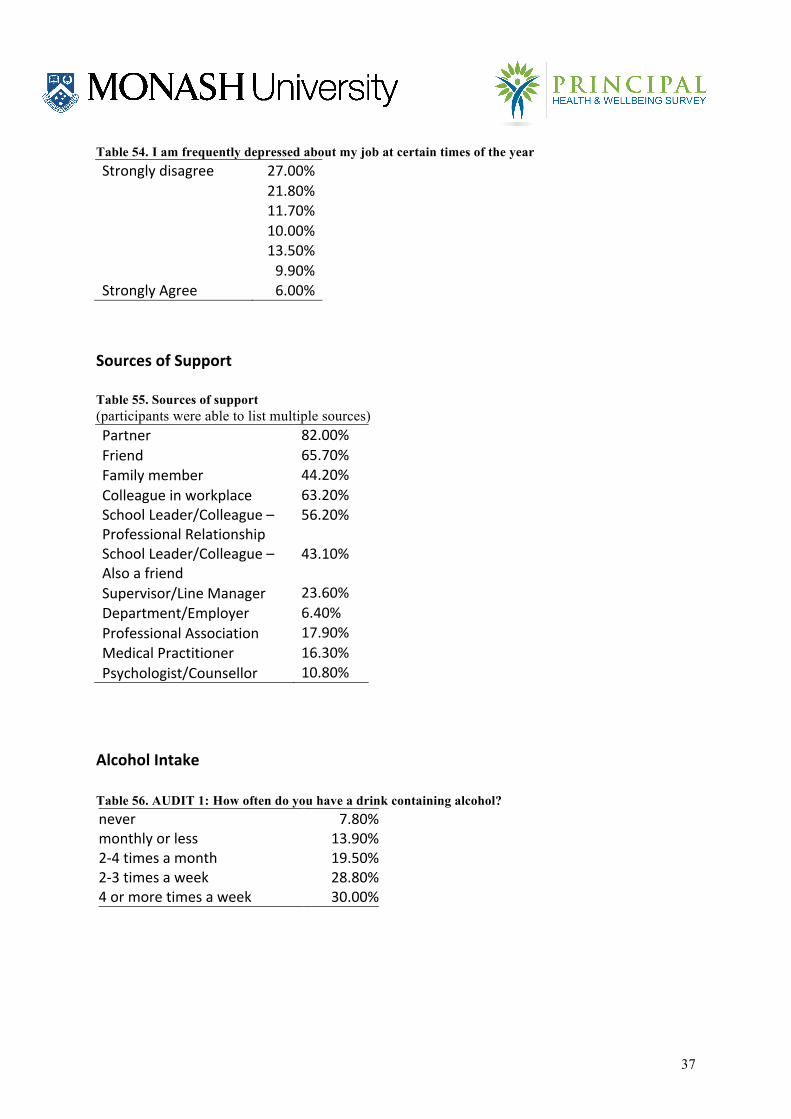
Figure 13. Alcohol Use Disorders Identification Test (AUDIT, WHO, 2001) Scores by School Location Table 57. Degree of worry about the way I use alcohol to manage my stress Strongly disagree 60.90%
12.90%
6.90%
6.20%
6.70%
3.40%
Strongly Agree 2.90%
Table 58. Degree of worry about the way I use prescribed medication to manage my stress Strongly disagree 86.60%
7.50%
1.50%
1.40%
1.40%
0.60%
Strongly Agree 0.60% Missing 21.70%
39
School Information
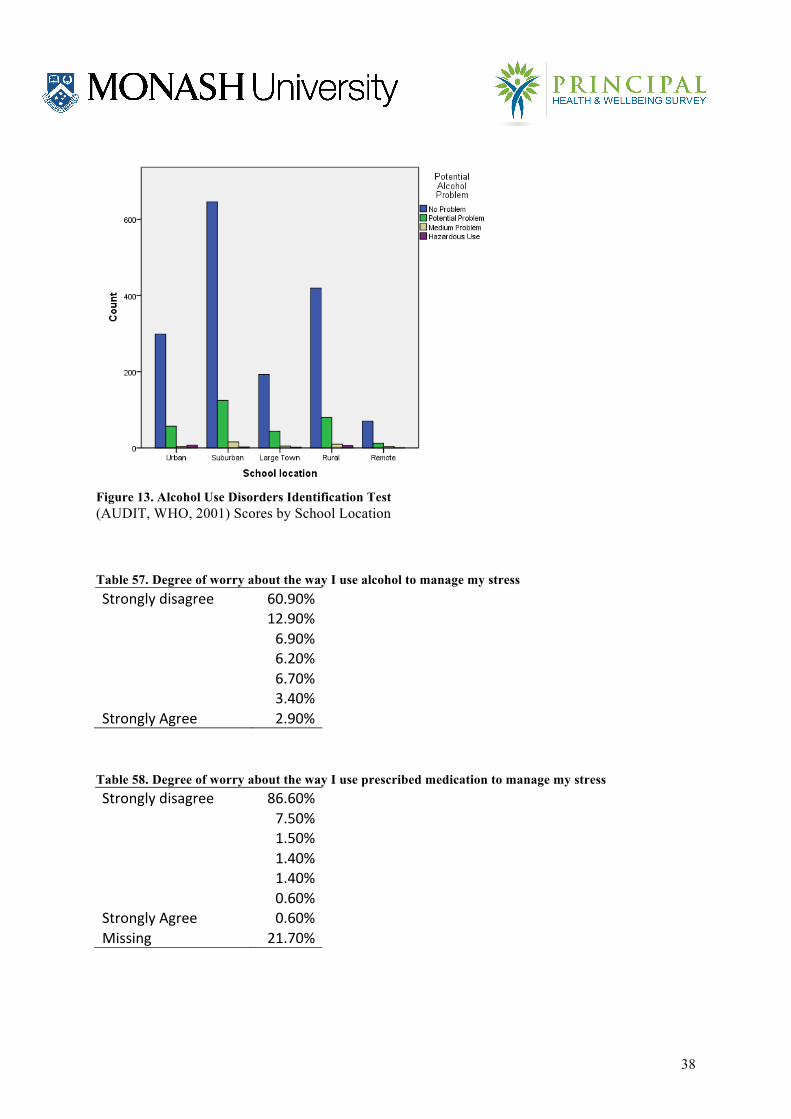
Sector Table 59. School sector of current school Government 71.80% Catholic (under the local Catholic Education Commission or Office) 14.00% Independent (inc. Catholic not under Catholic Education Commission or Office) 14.20%
State Table 60. State and territory of current school Australian Capital Territory 1.90% New South Wales 11.10% Northern Territory 2.10% South Australia 10.10% Queensland 20.60% Tasmania 2.10% Victoria 40.70% Western Australia 11.40%
Location Table 61. Geographic location of current school Urban 443 18.30% Suburban 934 39.40% Large Town 291 12.20% Rural 598 25.70% Remote 102 4.30% Missing 233 9.00%
40
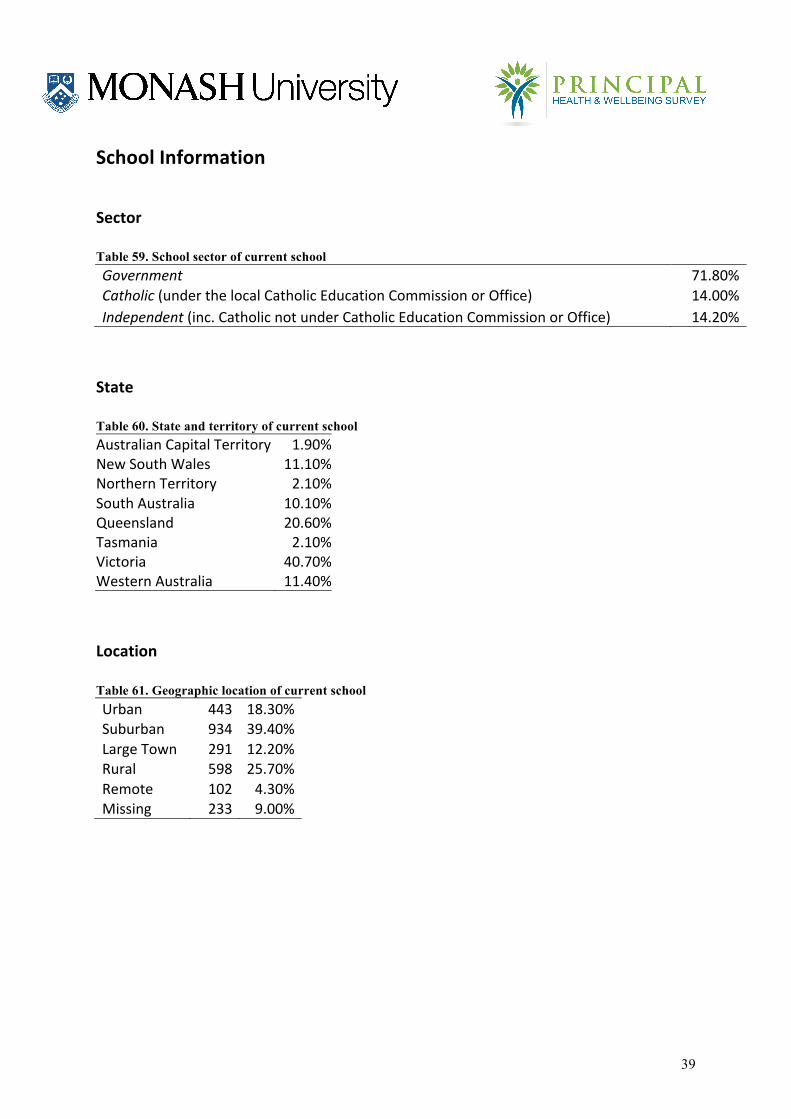
Figure 14. School Location by Gender Table 62. Number of campuses at current school 1 85.00% 2 9.30% 3 3.40% 4 1.00% 5 or more 1.20%
Non Teaching Staff Table 63. Percentage of your school’s non-teaching staff providing pedagogical support e.g., classroom aides 0% 2.70% 1-‐20% 45.50% 21-‐40% 13.70% 41-‐60% 14.20% 61-‐80% 15.40% 81-‐100% 8.50%
41
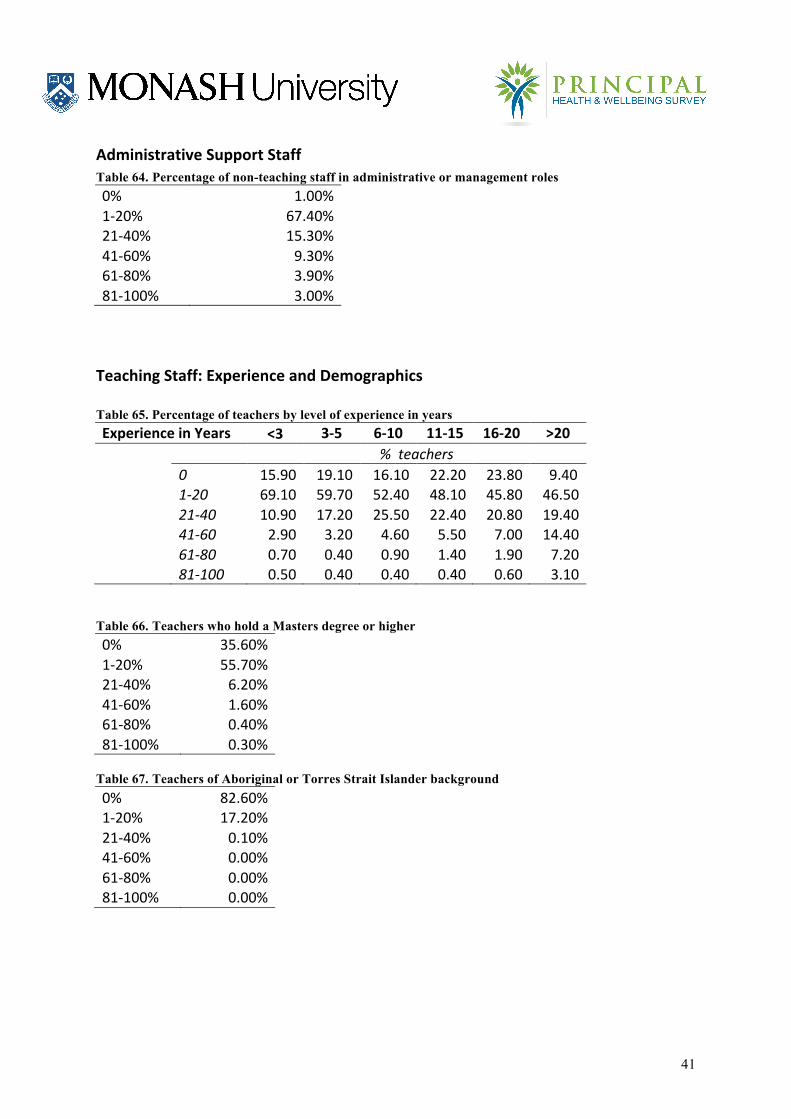
Administrative Support Staff Table 64. Percentage of non-teaching staff in administrative or management roles 0% 1.00% 1-‐20% 67.40% 21-‐40% 15.30% 41-‐60% 9.30% 61-‐80% 3.90% 81-‐100% 3.00%
Teaching Staff: Experience and Demographics Table 65. Percentage of teachers by level of experience in years Experience in Years <3 3-‐5 6-‐10 11-‐15 16-‐20 >20
% teachers 0 15.90 19.10 16.10 22.20 23.80 9.40 1-‐20 69.10 59.70 52.40 48.10 45.80 46.50 21-‐40 10.90 17.20 25.50 22.40 20.80 19.40 41-‐60 2.90 3.20 4.60 5.50 7.00 14.40 61-‐80 0.70 0.40 0.90 1.40 1.90 7.20 81-‐100 0.50 0.40 0.40 0.40 0.60 3.10
Table 66. Teachers who hold a Masters degree or higher 0% 35.60% 1-‐20% 55.70% 21-‐40% 6.20% 41-‐60% 1.60% 61-‐80% 0.40% 81-‐100% 0.30%
Table 67. Teachers of Aboriginal or Torres Strait Islander background 0% 82.60% 1-‐20% 17.20% 21-‐40% 0.10% 41-‐60% 0.00% 61-‐80% 0.00% 81-‐100% 0.00%

42
Table 68. Teachers’ first language is a language other than English 0% 54.20% 1-‐20% 41.10% 21-‐40% 3.20% 41-‐60% 0.90% 61-‐80% 0.30% 81-‐100% 0.30%
Table 69. Teachers currently employed on short-term contracts (up to one year) 0% 11.50% 1-‐20% 71.50% 21-‐40% 13.30% 41-‐60% 2.70% 61-‐80% 0.40% 81-‐100% 0.60%
Staff Turnover Table 70. Percentage of teaching staff who leave the school in an average year Less than 5% 50.90% 5-‐20% 41.20% 21-‐35% 4.50% 36-‐50% 2.40% > 50% 0.90%
Table 71. Difficulty in fill teaching staff vacancies for this school year Easy 39.60% Somewhat difficult 39.90% Very difficult 13.60% No vacancies 7.00%
Principal Valued by the Community Table 72. School council/board and community values the work you do Always 15.30% Most of the time 54.60% Rarely 8.00% Never 0.60% Missing 21.50%
43
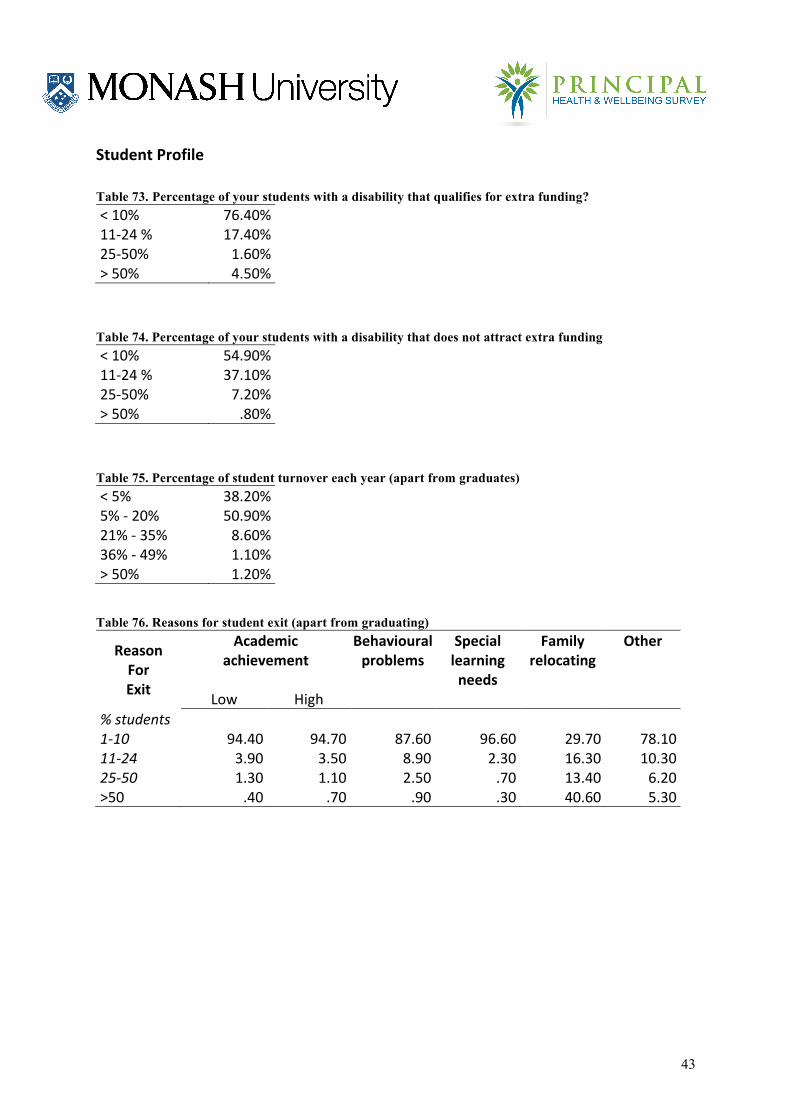
Student Profile Table 73. Percentage of your students with a disability that qualifies for extra funding? < 10% 76.40% 11-‐24 % 17.40% 25-‐50% 1.60% > 50% 4.50%
Table 74. Percentage of your students with a disability that does not attract extra funding < 10% 54.90% 11-‐24 % 37.10% 25-‐50% 7.20% > 50% .80%
Table 75. Percentage of student turnover each year (apart from graduates) < 5% 38.20% 5% -‐ 20% 50.90% 21% -‐ 35% 8.60% 36% -‐ 49% 1.10% > 50% 1.20%
Table 76. Reasons for student exit (apart from graduating)
Reason For Exit
Academic achievement
Behavioural problems
Special learning needs
Family relocating
Other
Low High % students 1-‐10 94.40 94.70 87.60 96.60 29.70 78.10 11-‐24 3.90 3.50 8.90 2.30 16.30 10.30 25-‐50 1.30 1.10 2.50 .70 13.40 6.20 >50 .40 .70 .90 .30 40.60 5.30
44
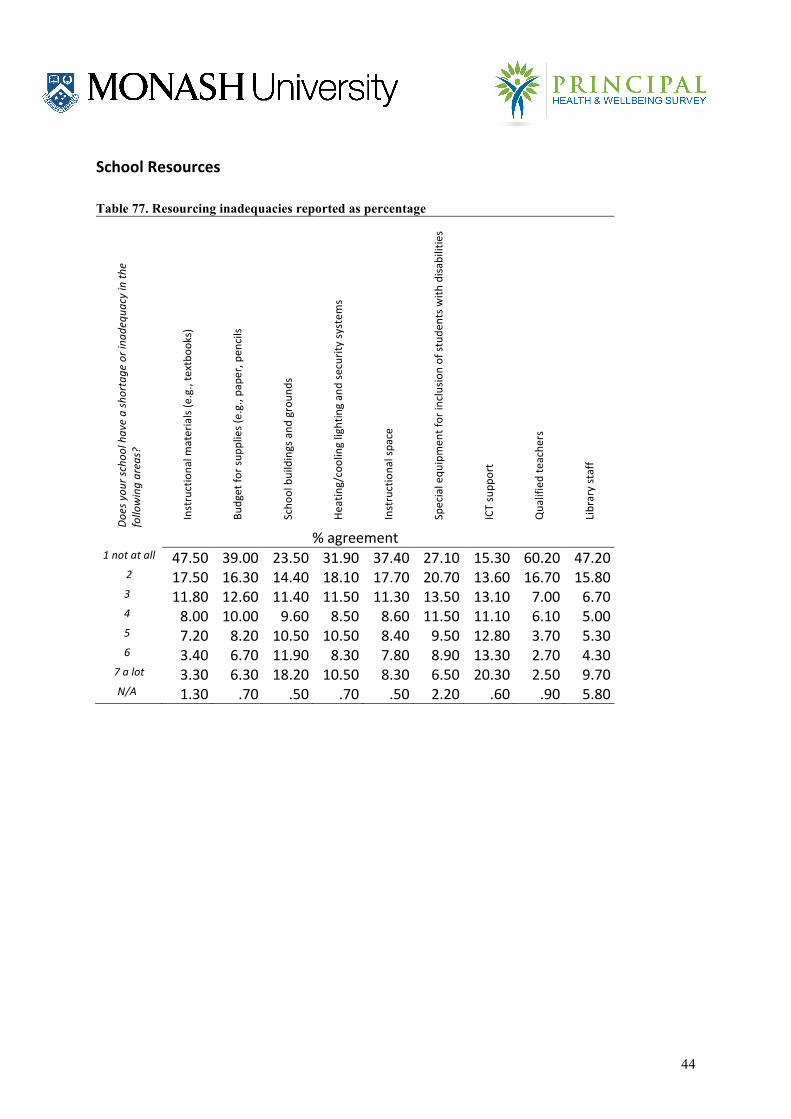
School Resources Table 77. Resourcing inadequacies reported as percentage
Does you
r schoo
l have a shortage or ina
dequ
acy in th
e following areas?
Instructiona
l materials (e.g., textbo
oks)
Budget fo
r sup
plies (e.g., p
aper, p
encils
Scho
ol buildings and
groun
ds
Heating/cooling lighting an
d security system
s
Instructiona
l spa
ce
Special equ
ipmen
t for inclusion of stud
ents with
disa
bilities
ICT supp
ort
Qua
lified teache
rs
Library staff
% agreement 1 not at all 47.50 39.00 23.50 31.90 37.40 27.10 15.30 60.20 47.20
2 17.50 16.30 14.40 18.10 17.70 20.70 13.60 16.70 15.80 3 11.80 12.60 11.40 11.50 11.30 13.50 13.10 7.00 6.70 4 8.00 10.00 9.60 8.50 8.60 11.50 11.10 6.10 5.00 5 7.20 8.20 10.50 10.50 8.40 9.50 12.80 3.70 5.30 6 3.40 6.70 11.90 8.30 7.80 8.90 13.30 2.70 4.30
7 a lot 3.30 6.30 18.20 10.50 8.30 6.50 20.30 2.50 9.70 N/A 1.30 .70 .50 .70 .50 2.20 .60 .90 5.80
45
School Culture
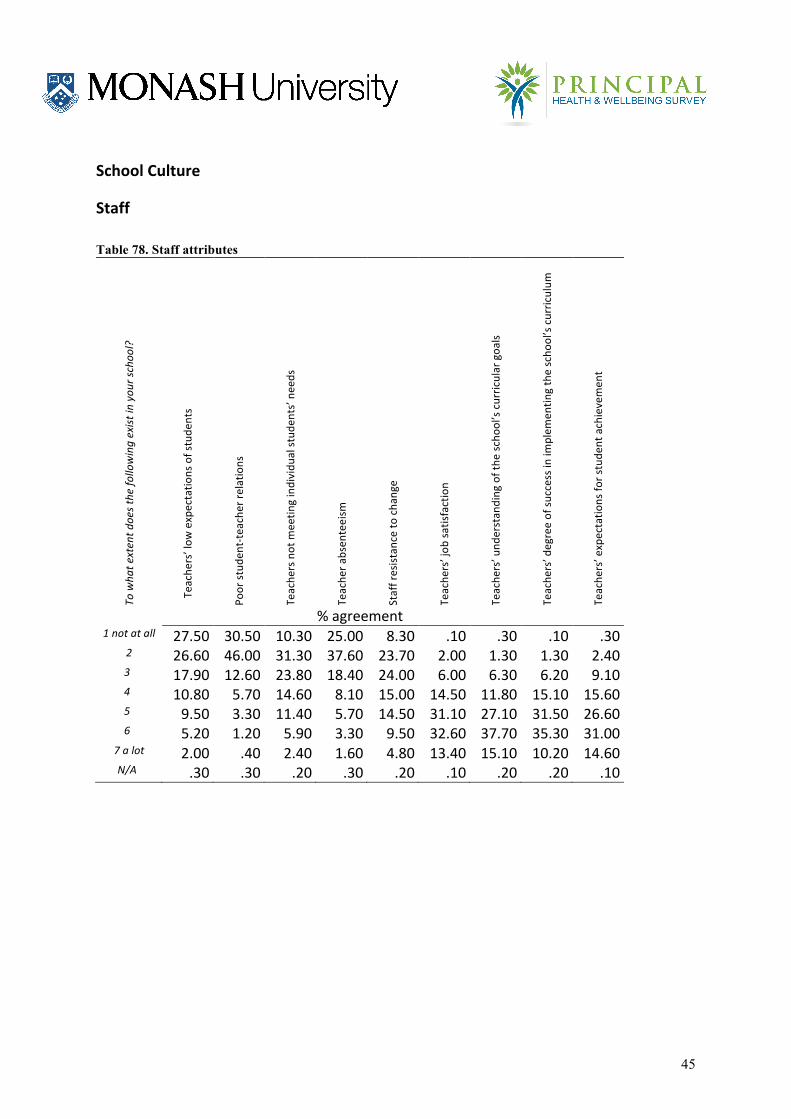
Staff Table 78. Staff attributes
To wha
t extent d
oes the fo
llowing exist in you
r schoo
l?
Teache
rs’ low
expectatio
ns of stude
nts
Poor stud
ent-‐teache
r relations
Teache
rs not m
eetin
g individu
al stud
ents’ n
eeds
Teache
r absen
teeism
Staff resistan
ce to
cha
nge
Teache
rs’ job
satisfaction
Teache
rs’ u
nderstan
ding of the
scho
ol’s curricular goa
ls
Teache
rs’ d
egree of su
ccess in im
plem
entin
g the scho
ol’s curric
ulum
Teache
rs’ expectatio
ns fo
r stude
nt achievemen
t
% agreement 1 not at all 27.50 30.50 10.30 25.00 8.30 .10 .30 .10 .30
2 26.60 46.00 31.30 37.60 23.70 2.00 1.30 1.30 2.40 3 17.90 12.60 23.80 18.40 24.00 6.00 6.30 6.20 9.10 4 10.80 5.70 14.60 8.10 15.00 14.50 11.80 15.10 15.60 5 9.50 3.30 11.40 5.70 14.50 31.10 27.10 31.50 26.60 6 5.20 1.20 5.90 3.30 9.50 32.60 37.70 35.30 31.00
7 a lot 2.00 .40 2.40 1.60 4.80 13.40 15.10 10.20 14.60 N/A .30 .30 .20 .30 .20 .10 .20 .20 .10
46
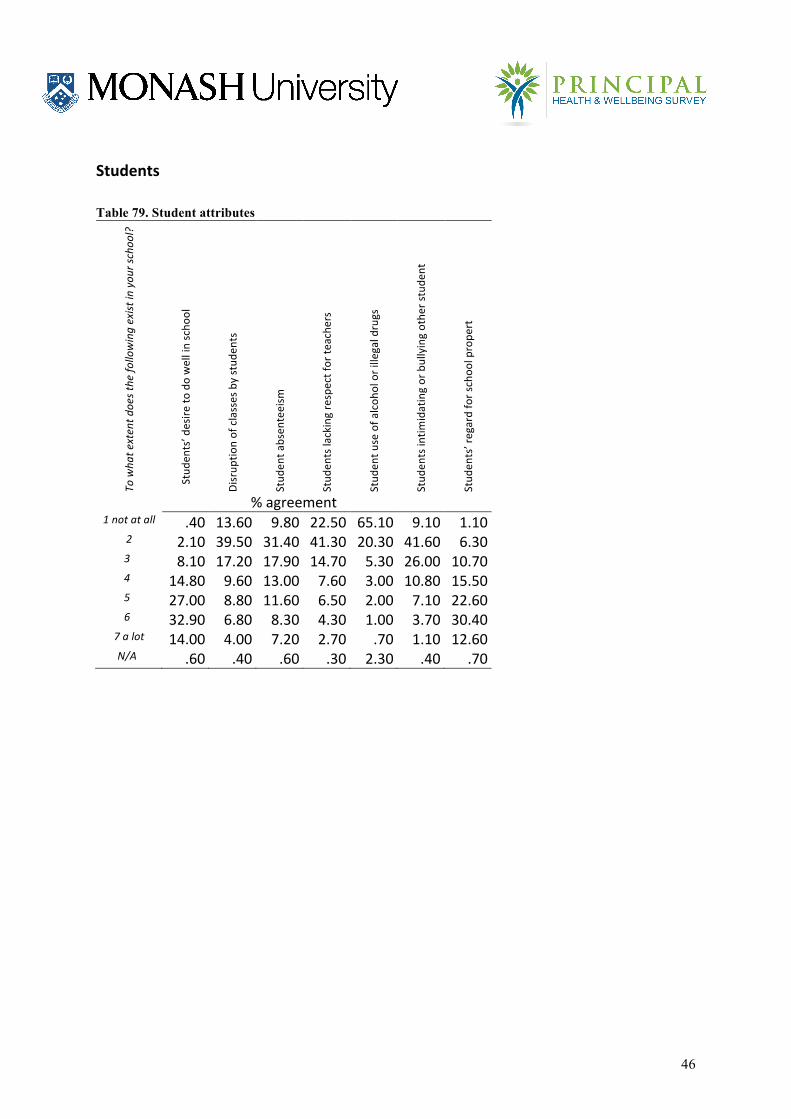
Students Table 79. Student attributes
To wha
t extent d
oes the fo
llowing exist in you
r schoo
l?
Stud
ents’ d
esire
to do well in scho
ol
Disrup
tion of classes by stud
ents
Stud
ent a
bsen
teeism
Stud
ents lacking respect for te
ache
rs
Stud
ent u
se of a
lcoh
ol or illegal drugs
Stud
ents intim
idating or bullying othe
r stude
nt
Stud
ents’ regard for schoo
l prope
rt
% agreement 1 not at all .40 13.60 9.80 22.50 65.10 9.10 1.10
2 2.10 39.50 31.40 41.30 20.30 41.60 6.30 3 8.10 17.20 17.90 14.70 5.30 26.00 10.70 4 14.80 9.60 13.00 7.60 3.00 10.80 15.50 5 27.00 8.80 11.60 6.50 2.00 7.10 22.60 6 32.90 6.80 8.30 4.30 1.00 3.70 30.40
7 a lot 14.00 4.00 7.20 2.70 .70 1.10 12.60 N/A .60 .40 .60 .30 2.30 .40 .70
47
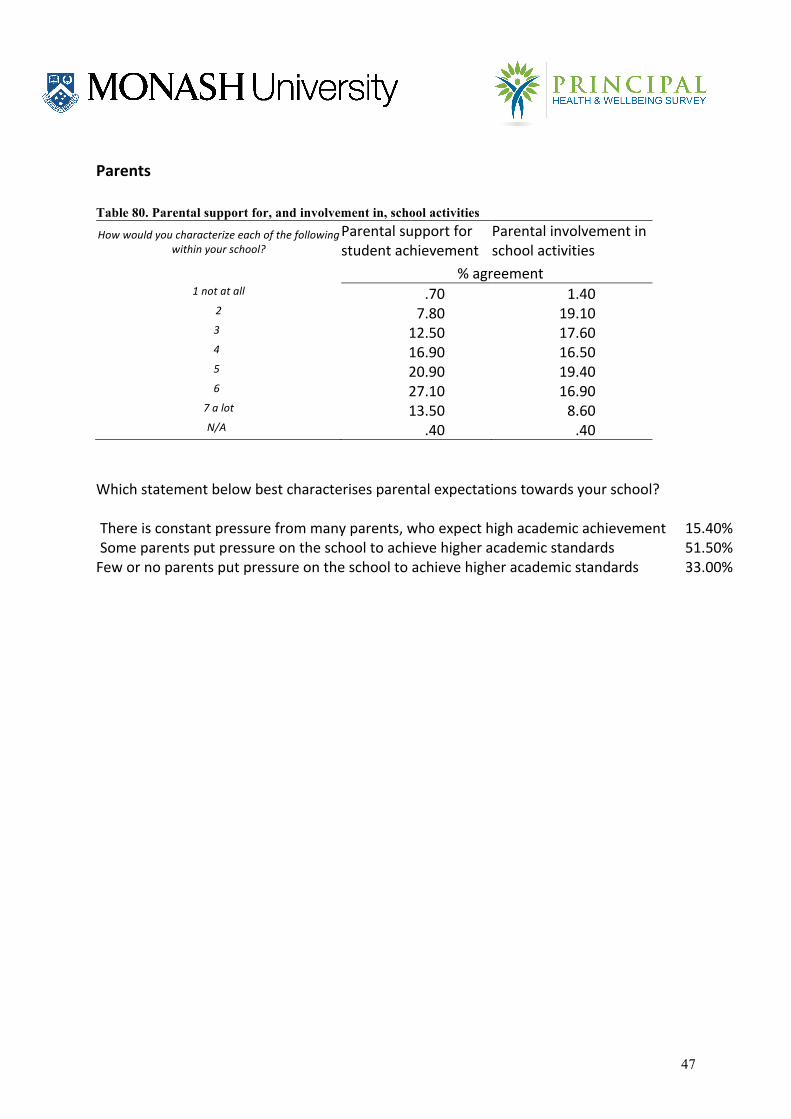
Parents Table 80. Parental support for, and involvement in, school activities How would you characterize each of the following
within your school? Parental support for student achievement
Parental involvement in school activities
% agreement 1 not at all .70 1.40
2 7.80 19.10 3 12.50 17.60 4 16.90 16.50 5 20.90 19.40 6 27.10 16.90
7 a lot 13.50 8.60 N/A .40 .40
Which statement below best characterises parental expectations towards your school? There is constant pressure from many parents, who expect high academic achievement 15.40% Some parents put pressure on the school to achieve higher academic standards 51.50% Few or no parents put pressure on the school to achieve higher academic standards 33.00%
48
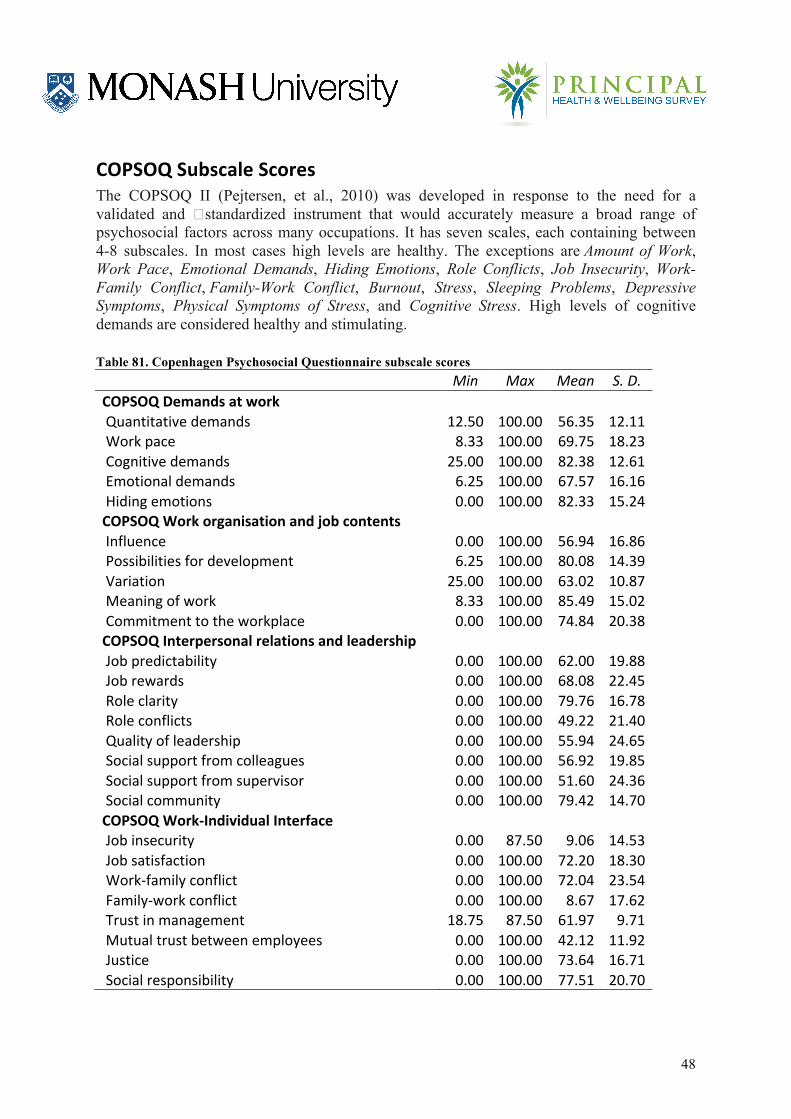
COPSOQ Subscale Scores The COPSOQ II (Pejtersen, et al., 2010) was developed in response to the need for a validated and �standardized instrument that would accurately measure a broad range of psychosocial factors across many occupations. It has seven scales, each containing between 4-8 subscales. In most cases high levels are healthy. The exceptions are Amount of Work, Work Pace, Emotional Demands, Hiding Emotions, Role Conflicts, Job Insecurity, Work-Family Conflict, Family-Work Conflict, Burnout, Stress, Sleeping Problems, Depressive Symptoms, Physical Symptoms of Stress, and Cognitive Stress. High levels of cognitive demands are considered healthy and stimulating.
Table 81. Copenhagen Psychosocial Questionnaire subscale scores
Min Max Mean S. D.
COPSOQ Demands at work Quantitative demands 12.50 100.00 56.35 12.11
Work pace 8.33 100.00 69.75 18.23 Cognitive demands 25.00 100.00 82.38 12.61 Emotional demands 6.25 100.00 67.57 16.16 Hiding emotions 0.00 100.00 82.33 15.24 COPSOQ Work organisation and job contents
Influence 0.00 100.00 56.94 16.86 Possibilities for development 6.25 100.00 80.08 14.39 Variation 25.00 100.00 63.02 10.87 Meaning of work 8.33 100.00 85.49 15.02 Commitment to the workplace 0.00 100.00 74.84 20.38 COPSOQ Interpersonal relations and leadership
Job predictability 0.00 100.00 62.00 19.88 Job rewards 0.00 100.00 68.08 22.45 Role clarity 0.00 100.00 79.76 16.78 Role conflicts 0.00 100.00 49.22 21.40 Quality of leadership 0.00 100.00 55.94 24.65 Social support from colleagues 0.00 100.00 56.92 19.85 Social support from supervisor 0.00 100.00 51.60 24.36 Social community 0.00 100.00 79.42 14.70 COPSOQ Work-‐Individual Interface
Job insecurity 0.00 87.50 9.06 14.53 Job satisfaction 0.00 100.00 72.20 18.30 Work-‐family conflict 0.00 100.00 72.04 23.54 Family-‐work conflict 0.00 100.00 8.67 17.62 Trust in management 18.75 87.50 61.97 9.71 Mutual trust between employees 0.00 100.00 42.12 11.92 Justice 0.00 100.00 73.64 16.71 Social responsibility 0.00 100.00 77.51 20.70
49
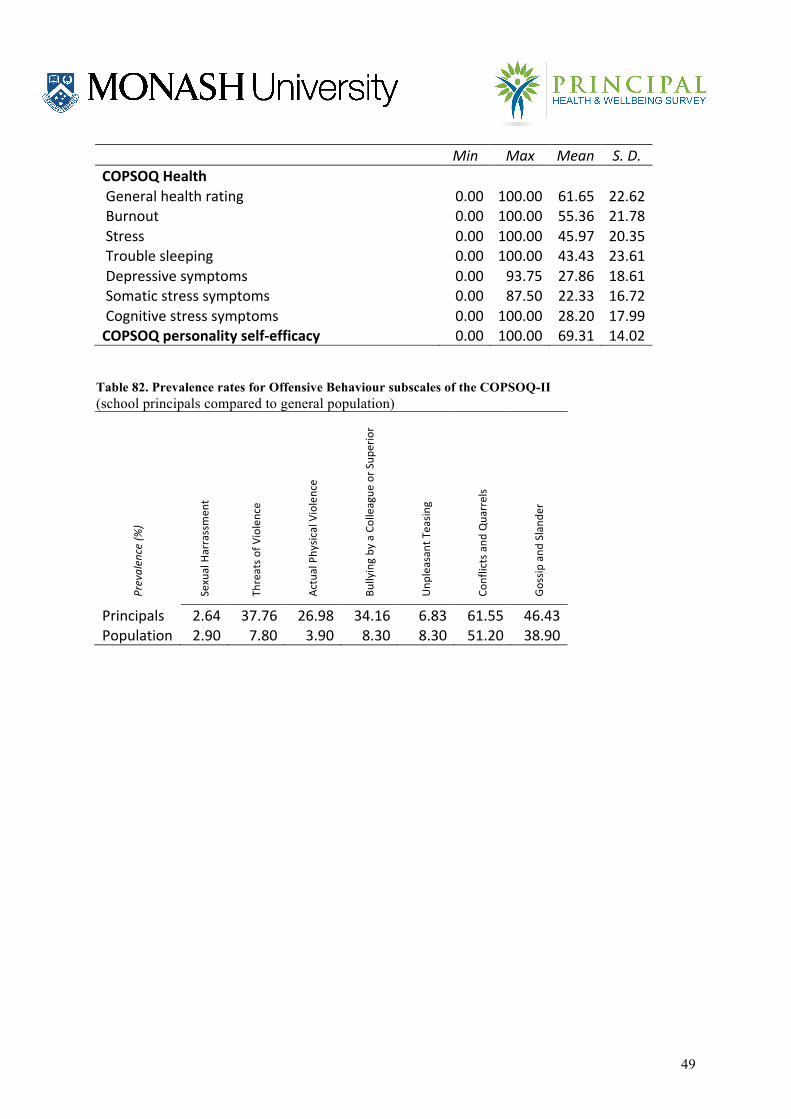
Min Max Mean S. D.
COPSOQ Health General health rating 0.00 100.00 61.65 22.62 Burnout 0.00 100.00 55.36 21.78 Stress 0.00 100.00 45.97 20.35 Trouble sleeping 0.00 100.00 43.43 23.61 Depressive symptoms 0.00 93.75 27.86 18.61 Somatic stress symptoms 0.00 87.50 22.33 16.72 Cognitive stress symptoms 0.00 100.00 28.20 17.99 COPSOQ personality self-‐efficacy 0.00 100.00 69.31 14.02
Table 82. Prevalence rates for Offensive Behaviour subscales of the COPSOQ-II (school principals compared to general population)
Prevalence (%
)
Sexual Harrassmen
t
Threats o
f Violence
Actual Physic
al Violence
Bullying by a Colleague
or S
uperior
Unp
leasan
t Teasin
g
Conflicts and
Qua
rrels
Gossip
and
Sland
er
Principals 2.64 37.76 26.98 34.16 6.83 61.55 46.43 Population 2.90 7.80 3.90 8.30 8.30 51.20 38.90
50
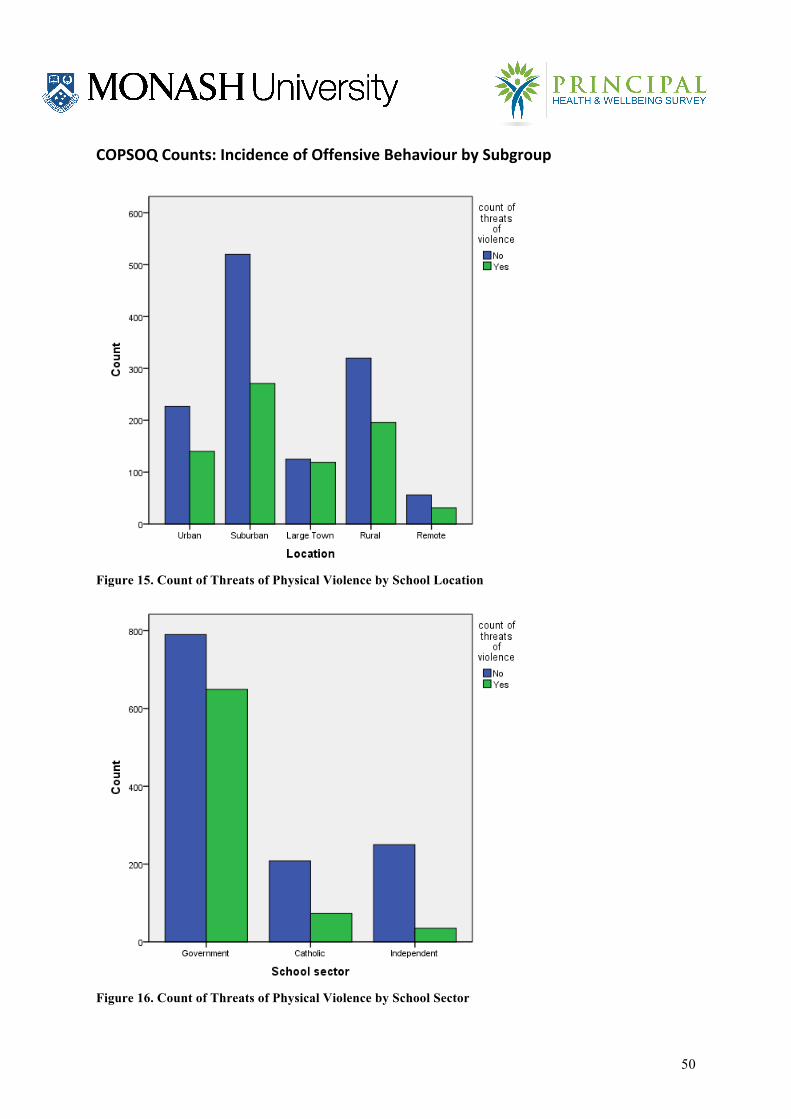
COPSOQ Counts: Incidence of Offensive Behaviour by Subgroup
Figure 15. Count of Threats of Physical Violence by School Location
Figure 16. Count of Threats of Physical Violence by School Sector
51
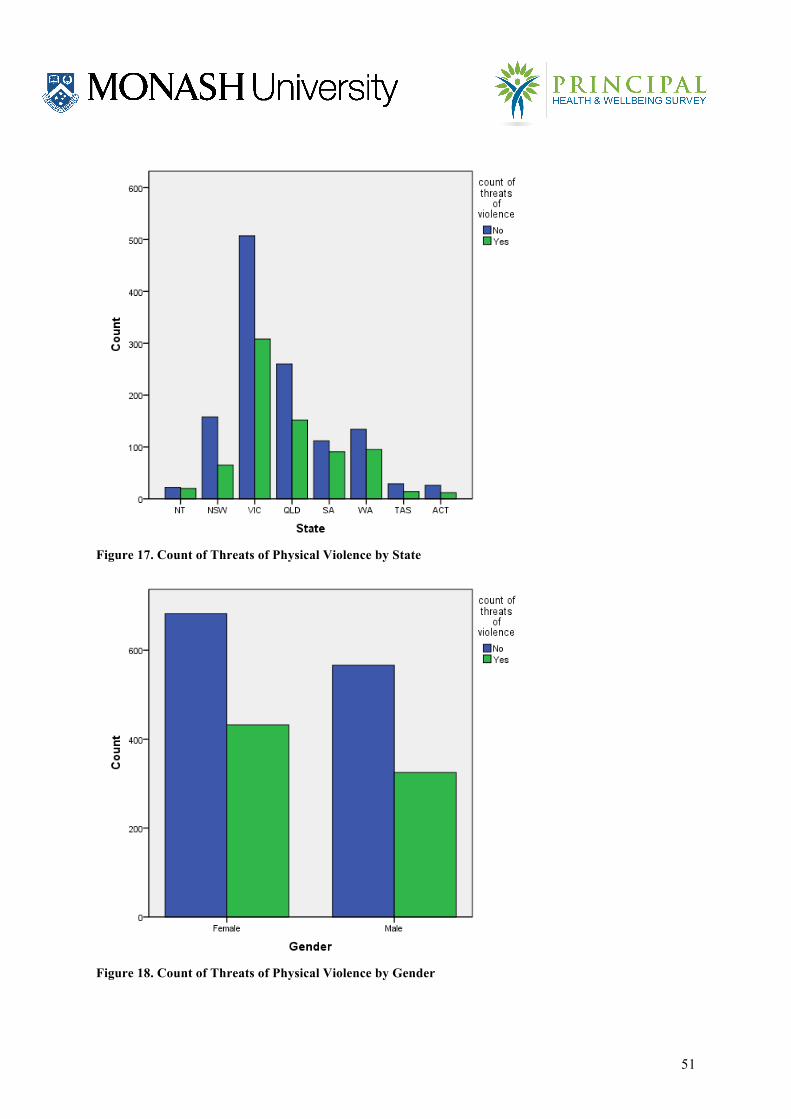
Figure 17. Count of Threats of Physical Violence by State
Figure 18. Count of Threats of Physical Violence by Gender
52
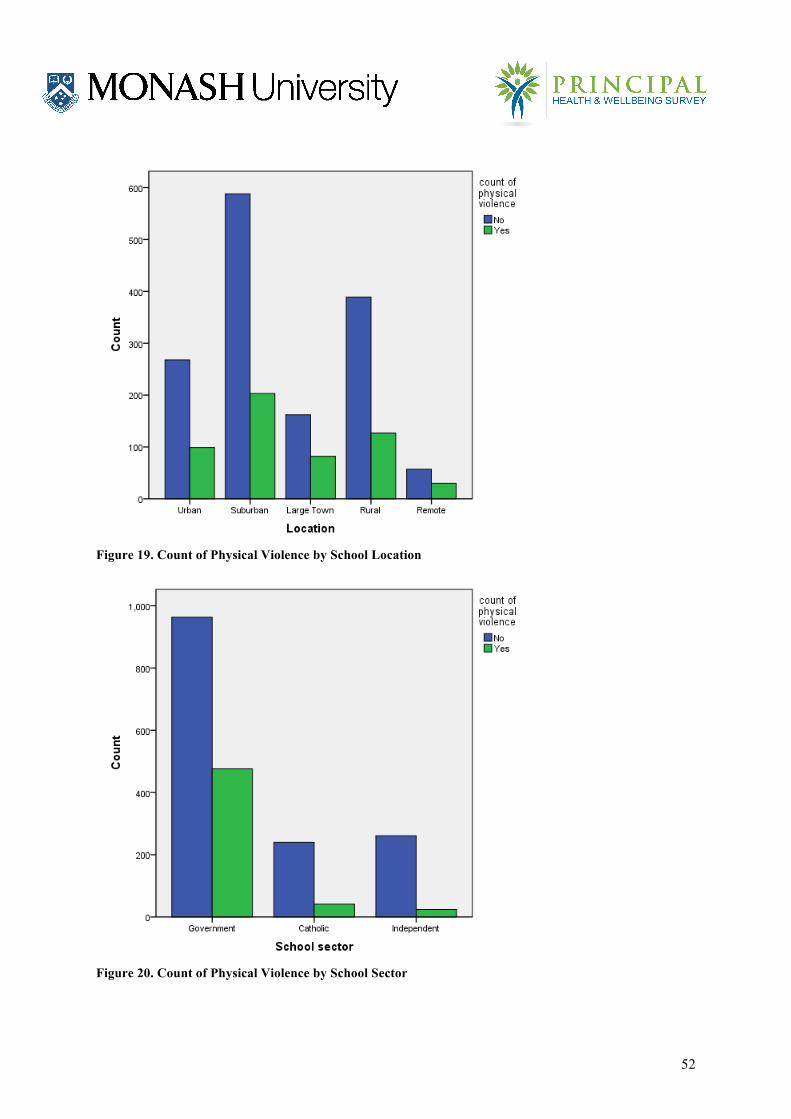
Figure 19. Count of Physical Violence by School Location
Figure 20. Count of Physical Violence by School Sector
53
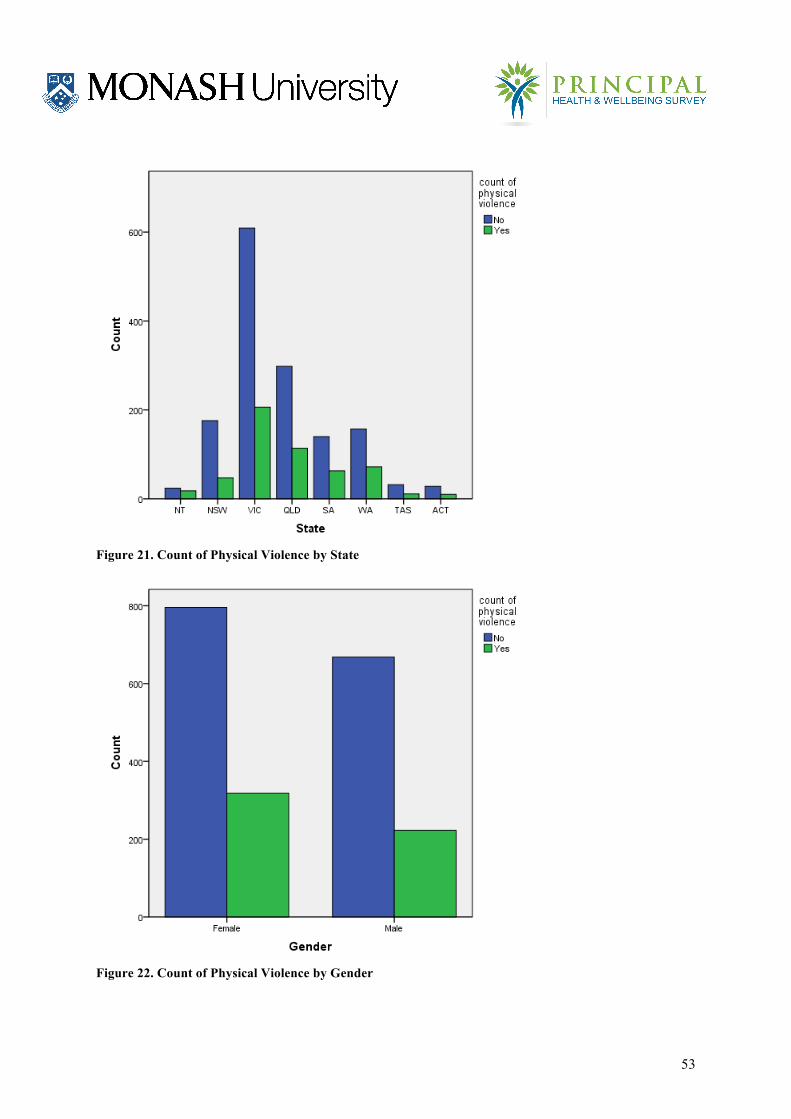
Figure 21. Count of Physical Violence by State
Figure 22. Count of Physical Violence by Gender
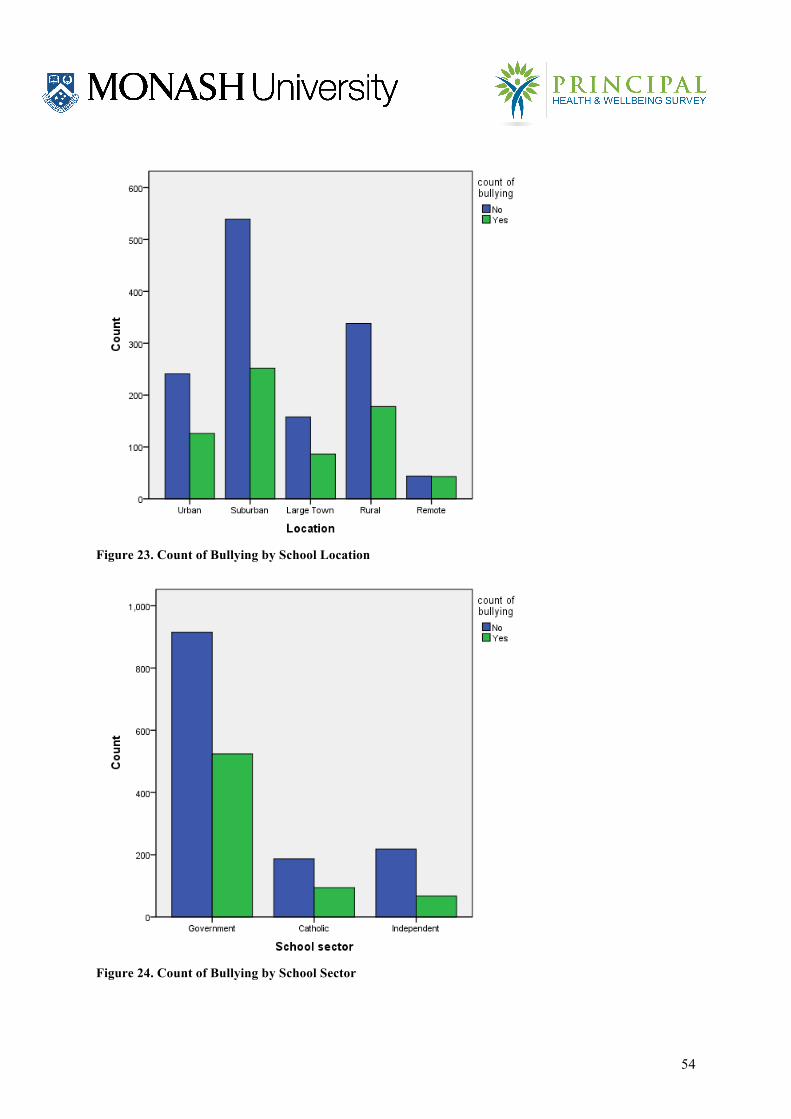
54
Figure 23. Count of Bullying by School Location
Figure 24. Count of Bullying by School Sector
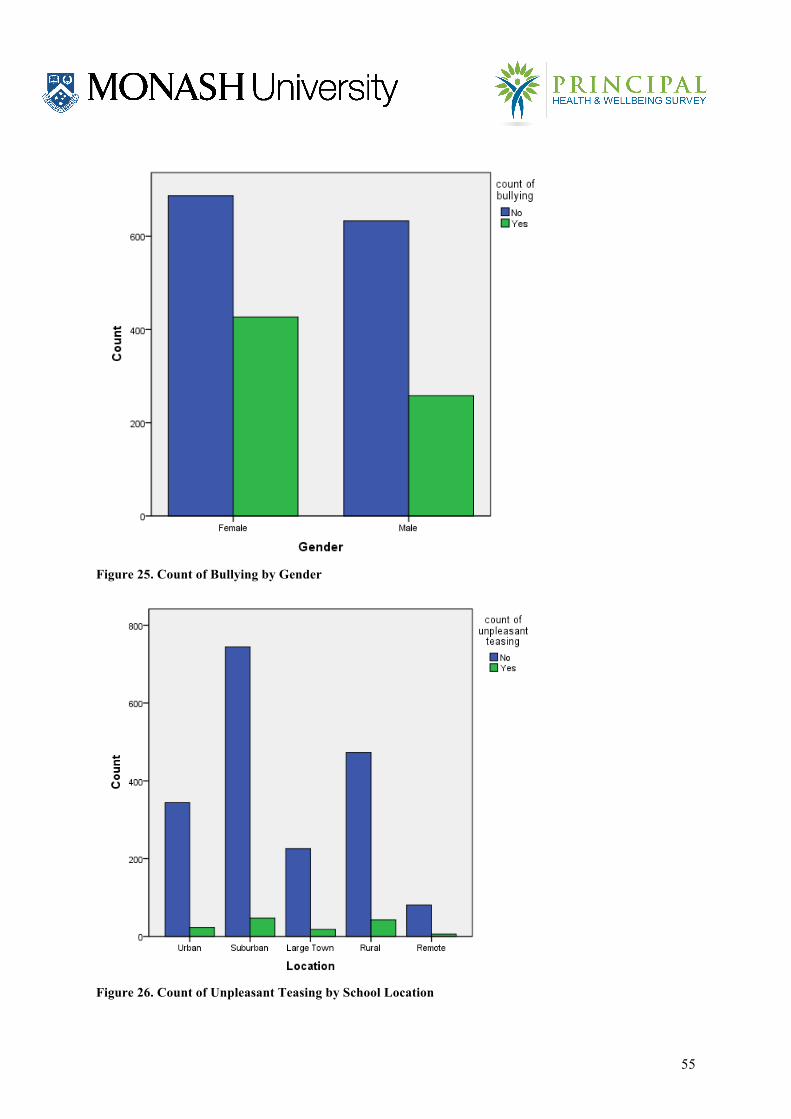
55
Figure 25. Count of Bullying by Gender
Figure 26. Count of Unpleasant Teasing by School Location
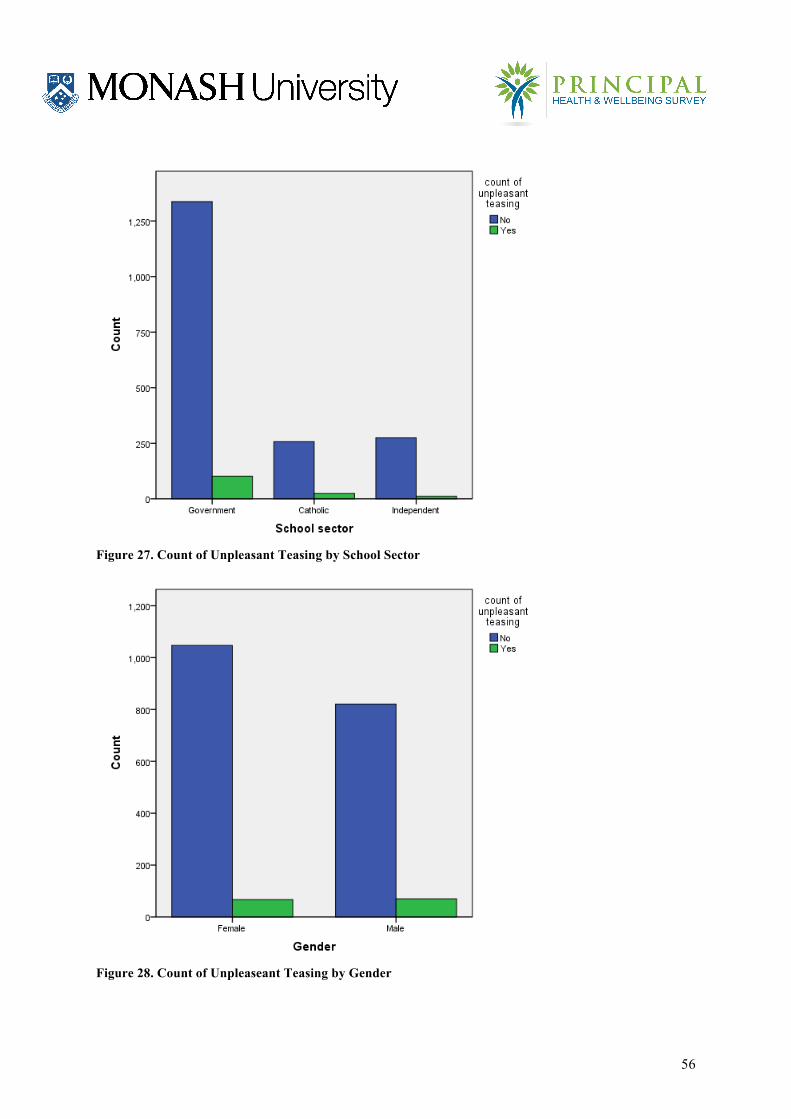
56
Figure 27. Count of Unpleasant Teasing by School Sector
Figure 28. Count of Unpleaseant Teasing by Gender
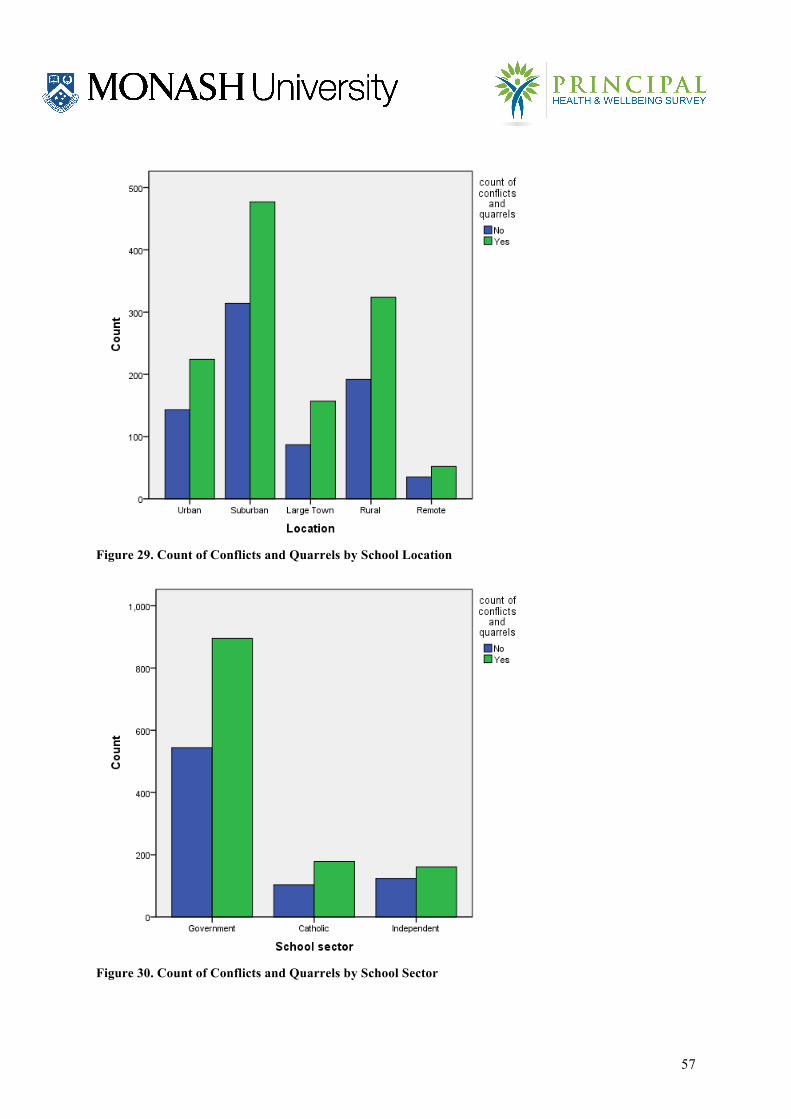
57
Figure 29. Count of Conflicts and Quarrels by School Location
Figure 30. Count of Conflicts and Quarrels by School Sector
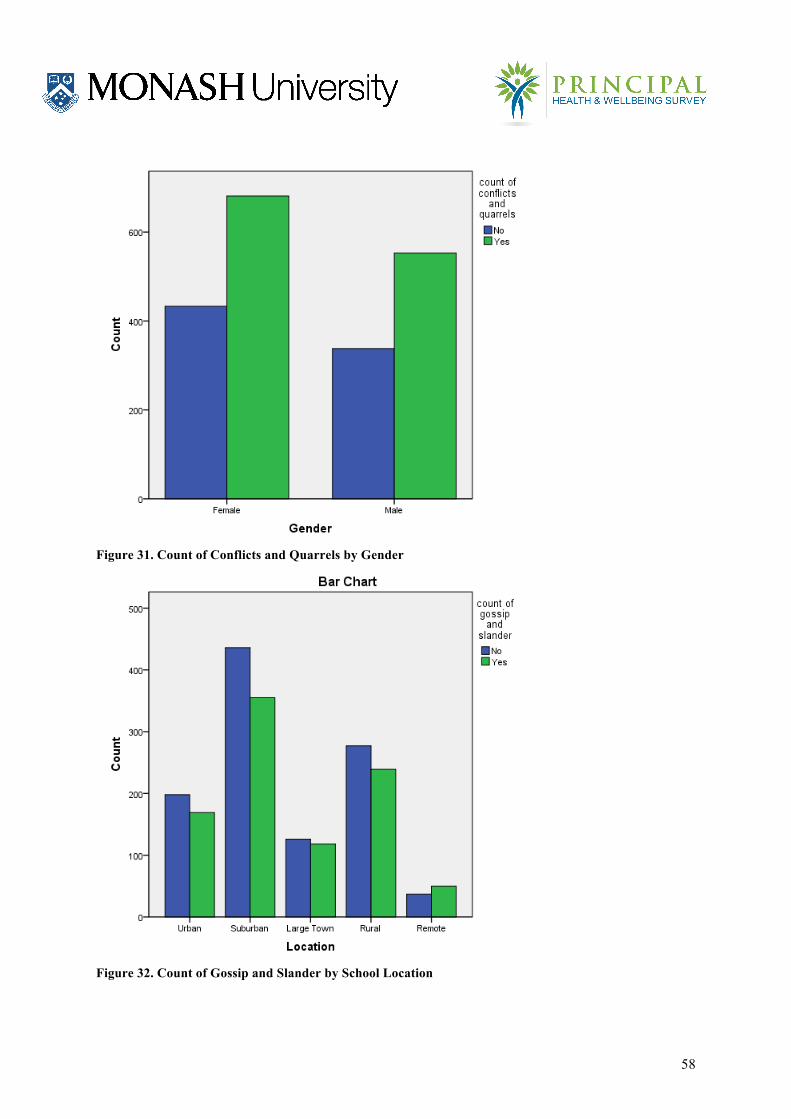
58
Figure 31. Count of Conflicts and Quarrels by Gender
Figure 32. Count of Gossip and Slander by School Location
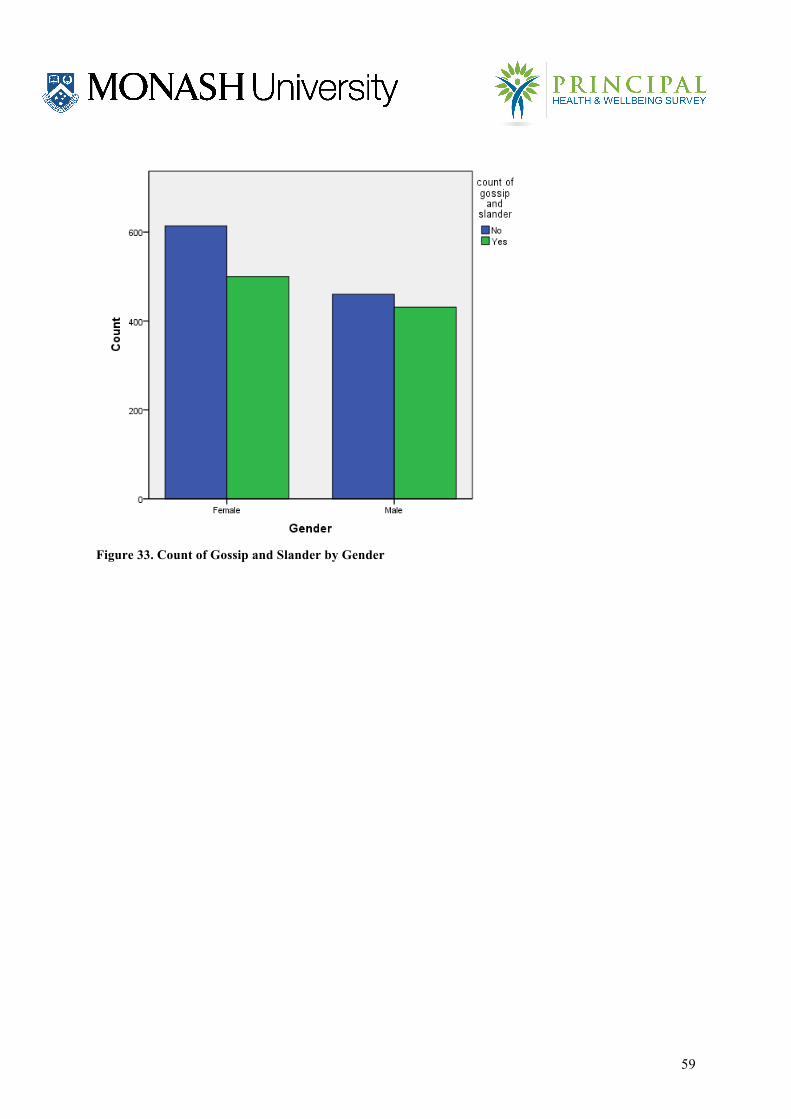
59
Figure 33. Count of Gossip and Slander by Gender
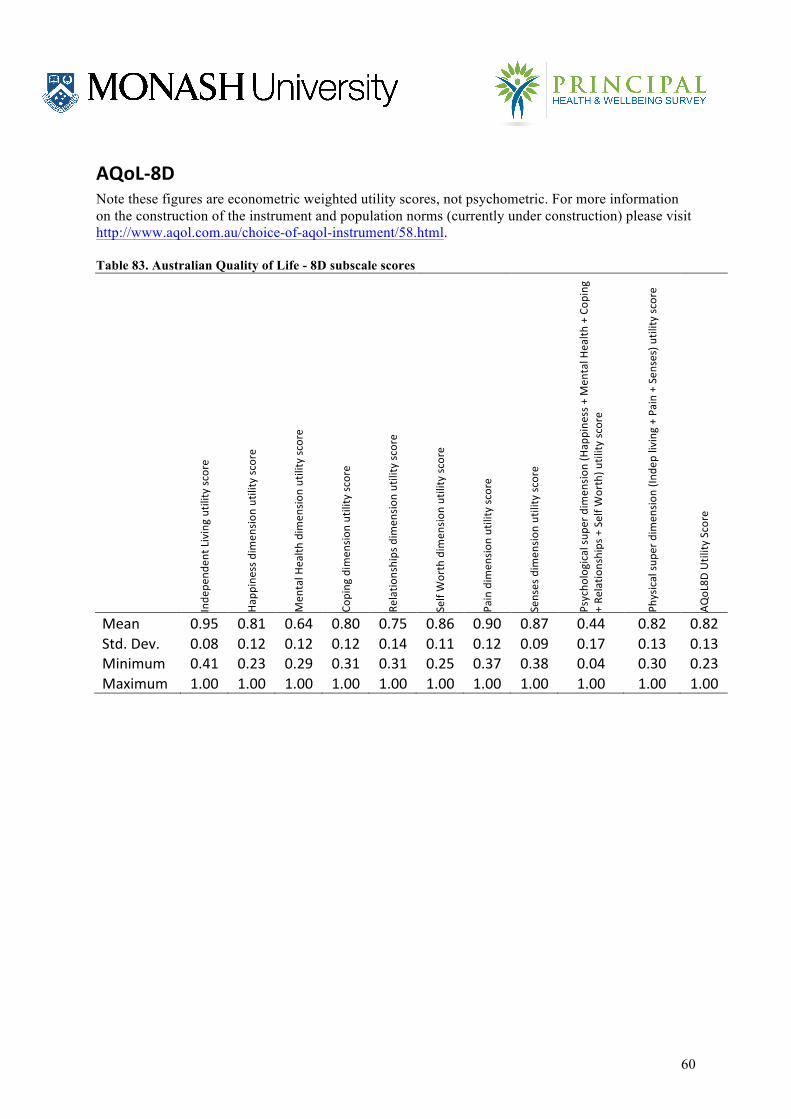
60
AQoL-‐8D Note these figures are econometric weighted utility scores, not psychometric. For more information on the construction of the instrument and population norms (currently under construction) please visit http://www.aqol.com.au/choice-of-aqol-instrument/58.html. Table 83. Australian Quality of Life - 8D subscale scores
Inde
pend
ent Living utility sc
ore
Happ
iness d
imen
sion utility sc
ore
Men
tal H
ealth
dim
ensio
n utility sc
ore
Coping dim
ensio
n utility sc
ore
Relatio
nships dim
ensio
n utility sc
ore
Self Worth dim
ensio
n utility sc
ore
Pain dim
ensio
n utility sc
ore
Senses dim
ensio
n utility sc
ore
Psycho
logical sup
er dim
ensio
n (Hap
pine
ss + M
ental H
ealth
+ Cop
ing
+ Re
latio
nships + Self W
orth) u
tility
score
Physical su
per d
imen
sion (In
dep living + Pain + Sen
ses) utility
score
AQoL8D
Utility
Score
Mean 0.95 0.81 0.64 0.80 0.75 0.86 0.90 0.87 0.44 0.82 0.82 Std. Dev. 0.08 0.12 0.12 0.12 0.14 0.11 0.12 0.09 0.17 0.13 0.13 Minimum 0.41 0.23 0.29 0.31 0.31 0.25 0.37 0.38 0.04 0.30 0.23 Maximum 1.00 1.00 1.00 1.00 1.00 1.00 1.00 1.00 1.00 1.00 1.00
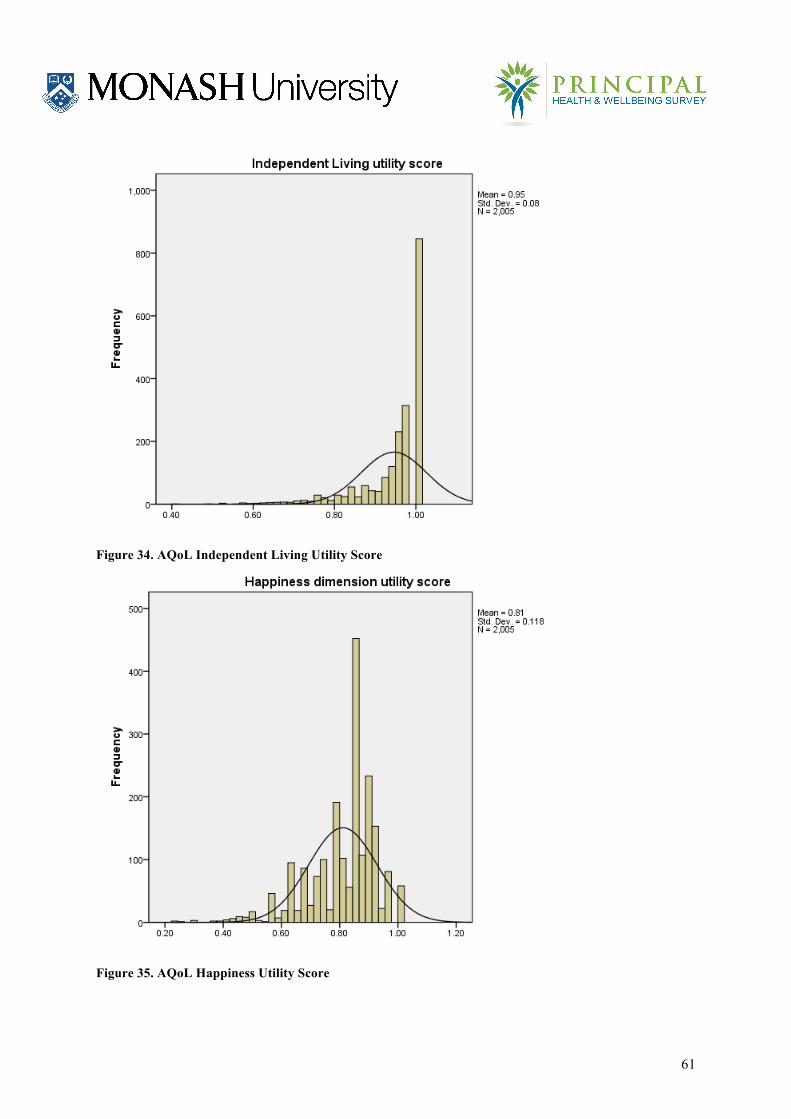
61
Figure 34. AQoL Independent Living Utility Score
Figure 35. AQoL Happiness Utility Score
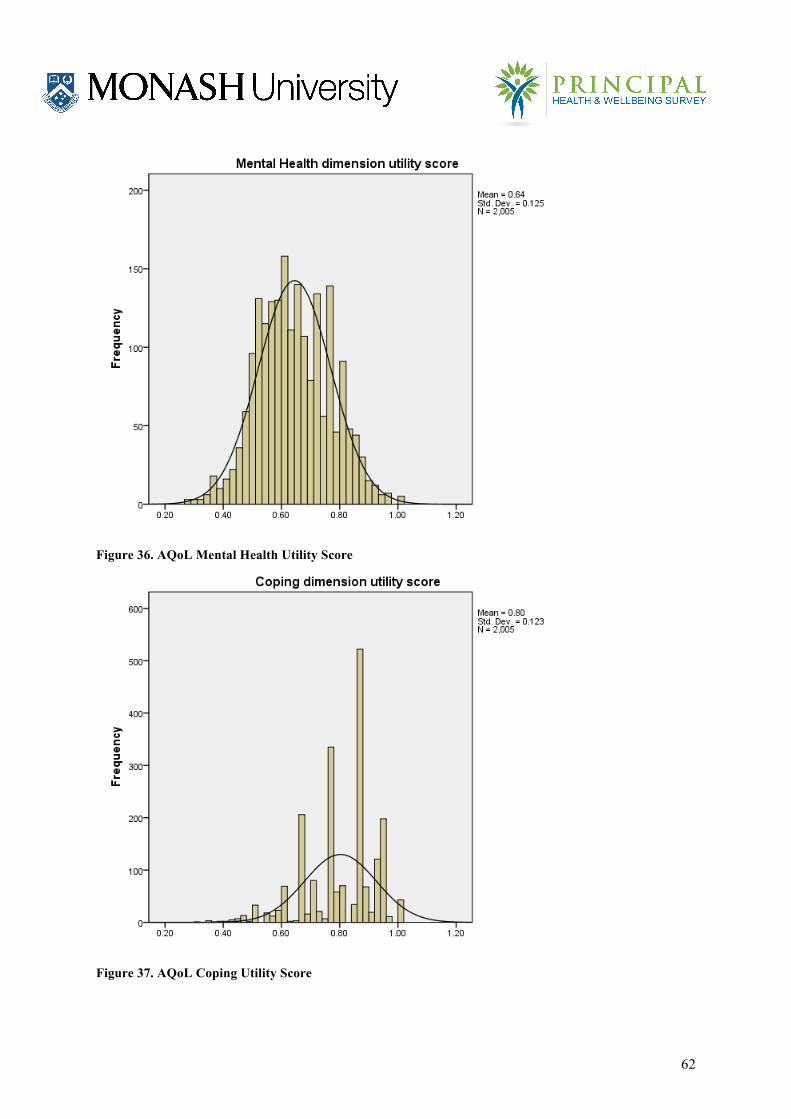
62
Figure 36. AQoL Mental Health Utility Score
Figure 37. AQoL Coping Utility Score
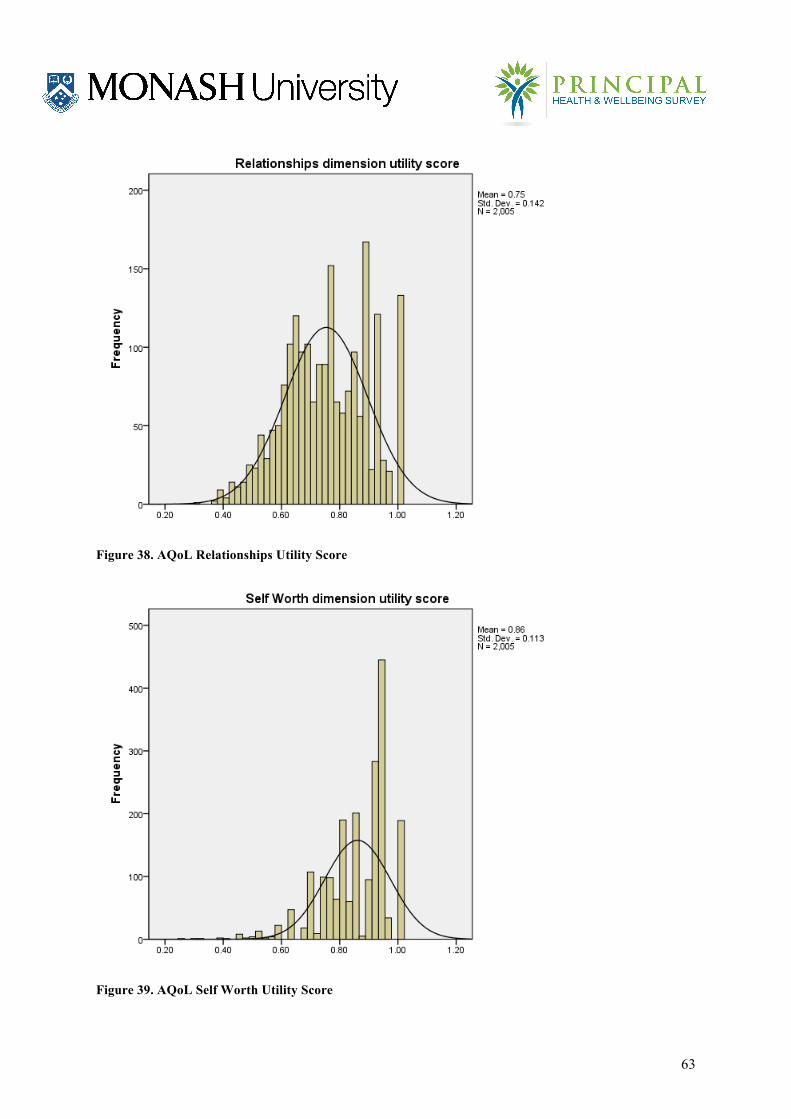
63
Figure 38. AQoL Relationships Utility Score
Figure 39. AQoL Self Worth Utility Score
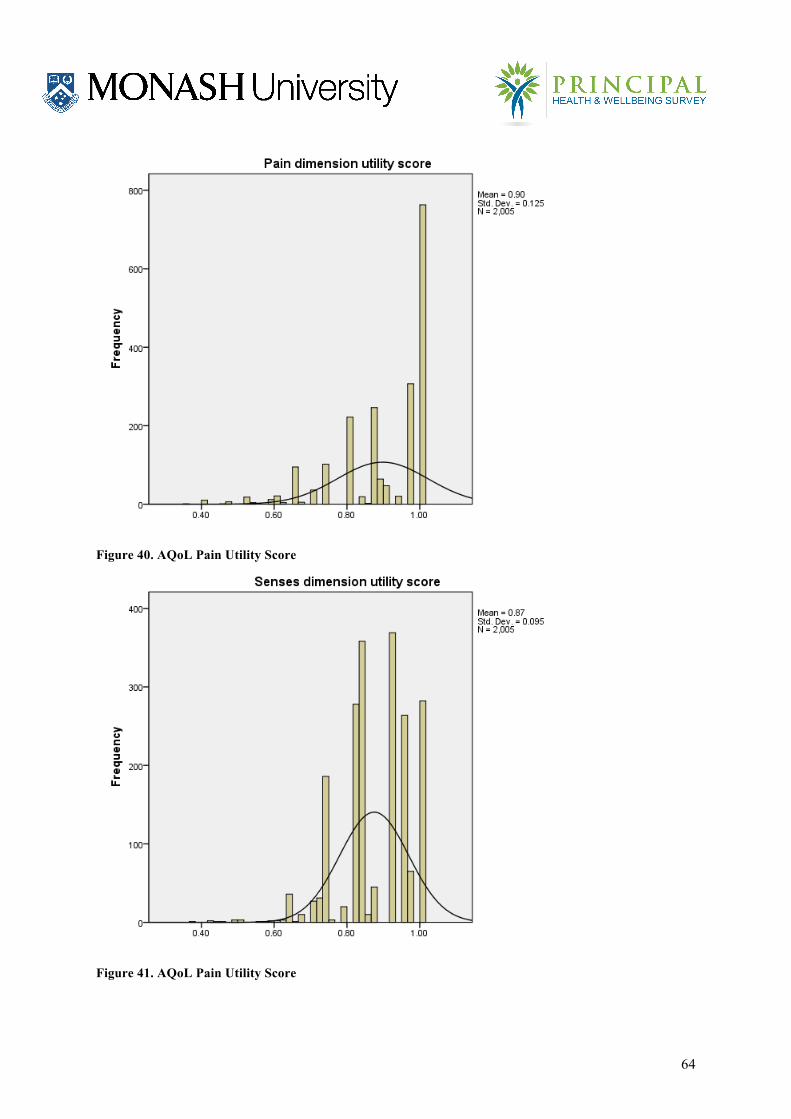
64
Figure 40. AQoL Pain Utility Score
Figure 41. AQoL Pain Utility Score

65
Figure 42. AQoL Global Utility Score
66
References ACARA. (2011). My School. Retrieved 12.5.2011, 2011, from http://www.myschool.edu.au/ Adler, N., Singh-Manoux, A., Schwartz, J., Stewart, J., Matthews, K., & Marmot, M. G.
(2008). Social status and health: A comparison of British civil servants in Whitehall-II with European- and African-Americans in CARDIA. Social Science & Medicine, 66(5), 1034-1045.
Babor, T. F., Higgins-Biddle, J. C., Saunders, J. B., & Monteiro, M. G. (2001). AUDIT: The alcohol use disorders identification test. Guidelines for use in primary care (2nd ed.). Geneva.
Bosma, H., Stansfeld, S. A., & Marmot, M. G. (1998). Job control, personal characteristics, and heart disease. Journal of Occupational Health Psychology, 3(4), 402-409.
Chandola, T., Brunner, E., & Marmot, M. (2006). Chronic stress at work and the metabolic syndrome: prospective study. BMJ: British Medical Journal, 332(7540), 521-525.
De Vogli, R., Ferrie, J. E., Chandola, T., Kivimaki, M., & Marmot, M. G. (2007). Unfairness and health: Evidence from the Whitehall II study. Journal of Epidemiology and Community Health, 61(6), 513-518.
Department of Education & Training. (2004). The privilege and the price: A study of principal class workload and its impact on health and wellbeing. Melbourne: Department of Education and Training.
Elovainio, M., Ferrie, J. E., Gimeno, D., De Vogli, R., Shipley, M., Brunner, E. J., et al. (2009). Organizational justice and sleeping problems: The Whitehall II study. Psychosomatic Medicine, 71(3), 334-340.
Ferrie, J. E., Shipley, M. J., Newman, K., Stansfeld, S. A., & Marmot, M. (2005). Self-reported job insecurity and health in the Whitehall II study: Potential explanations of the relationship. Social Science & Medicine, 60(7), 1593-1602.
Fuhrer, R., Stansfeld, S., Chemali, J., & Shipley, M. (1999). Gender, social relations and mental health: Prospective findings from an occupational cohort (Whitehall II study). Social Science & Medicine, 48(1), 77-87.
Hassed, C., Lisle, S. d., Sullivan, G., & Pier, C. (2009). Enhancing the health of medical students: Outcomes of an integrated mindfulness and lifestyle program. Advances in Health Sciences Education, 14(3), 387-398.
Head, J., Kivimaki, M., Siegrist, J., Ferrie, J. E., Vahtera, J., Shipley, M. J., et al. (2007). Effort-reward imbalance and relational injustice at work predict sickness absence: The Whitehall II study. Journal of Psychosomatic Research, 63(4), 433-440.
Kivimaki, M., Head, J., Ferrie, J., Shipley, M., Brunner, E., Vahtera, J., et al. (2006). Work stress, weight gain and weight loss: Evidence for bidirectional effects of job strain on body mass index in the Whitehall II study. International Journal of Obesity, 30(6), 982-987.
Kuper, H., & Marmot, M. (2003). Job strain, job demands, decision latitude, and risk of coronary heart disease within the Whitehall II study. Journal of Epidemiology and Community Health, 57(2), 147-153.
LaMontagne, A. D., Keegel, T., Louie, A. M., Ostry, A., & Lansbergis, P. A. (2007). A systematic review of the job-stress intervention evaluation literature, 1990–2005. International Journal of Occupational and Environmental Health, 13, 268–280.
Lyubomirsky, S., King, L., & Diener, E. (2005). The benefits of frequent positive affect: Does happiness lead to success? Psychological Bulletin, 131(6), 803-855.
Marmot, M. G. (2006). Status syndrome: A challenge to medicine. [Editorial]. JAMA: Journal of the American Medical Association, 295(11), 1304-1307.
67
Matthews, P., Moorman, H., & Nusche, D. (2007). School leadership development strategies: Building leadership capacity in Victoria, Australia: OECD.
Nabi, H., Kivimaki, M., De Vogli, R., Marmot, M. G., & Singh-Manoux, A. (2008). Positive and negative affect and risk of coronary heart disease: Whitehall II prospective cohort study. BMJ: British Medical Journal, 337(7660), No Pagination Specified.
North, F. M., Syme, S., Feeney, A., Shipley, M., & al, e. (1996). Psychosocial work environment and sickness absence among British civil servants: The Whitehall II study. American Journal of Public Health, 86(3), 332-340.
Pejtersen, J. H., Kristensen, T. S., Borg, V., & Bjorner, J. B. (2010). The second version of the Copenhagen Psychosocial Questionnaire. Scandinavian Journal of Public Health, 38(Suppl 3), 8-24.
Richardson, J., Khan, M., Iezzi, A., Sinha, K., Mihalopoulos, C., Herrman, H., et al. (2009). The AQoL-8D (PsyQoL) MAU Instrument: Overview September 2009. Melbourne: Centre for Health Economics, Monash University.
Stansfeld, S. A., Fuhrer, R., Head, J., Ferrie, J., & et al. (1997). Work and psychiatric disorder in the Whitehall II Study. Journal of Psychosomatic Research, 43(1), 73-81.
Stansfeld, S. A., Smith, G. D., & Marmot, M. (1993). Association between physical and psychological morbidity in the Whitehall II study. Journal of Psychosomatic Research, 37(3), 227-238.
Thomson, S., Bortoli, L. D., Nicholas, M., Hillman, K., & Buckley, S. (2011). Challenges for Australian Education: Results from PISA 2009. Camberwell: Australian Council for Educational Research.
Virtanen, M., Ferrie, J. E., Gimeno, D., Vahtera, J., Elovainio, M., Singh-Manoux, A., et al. (2009). Long working hours and sleep disturbances: The Whitehall II prospective cohort study. Sleep: Journal of Sleep and Sleep Disorders Research, 32(6), 737-745.
Westerlund, H., Kivimaki, M., Ferrie, J. E., Marmot, M., Shipley, M. J., Vahtera, J., et al. (2009). Does working while ill trigger serious coronary events? The Whitehall II study. Journal of Occupational and Environmental Medicine, 51(9), 1099-1104.
Williams, T., Ferraro, D., Roey, S., Brenwald, S., Kastberg, D., Jocelyn, L., et al. (2007). TIMSS 2007 U.S. technical report and user guide. Washington DC: National Center for Education Statistics, Institute of Education Sciences, U.S. Department of Education.
Whitehall Studies Adler, N., Singh-Manoux, A., Schwartz, J., Stewart, J., Matthews, K., & Marmot, M. G.
(2008). Social status and health: A comparison of British civil servants in Whitehall-II with European- and African-Americans in CARDIA. Social Science & Medicine, 66(5), 1034-1045,
Bosma, H., Stansfeld, S. A., & Marmot, M. G. (1998). Job control, personal characteristics, and heart disease. Journal of Occupational Health Psychology, 3(4), 402-409,
Chandola, T., Brunner, E., & Marmot, M. (2006). Chronic stress at work and the metabolic syndrome: prospective study. BMJ: British Medical Journal, 332(7540), 521-525,
De Vogli, R., Ferrie, J. E., Chandola, T., Kivimaki, M., & Marmot, M. G. (2007). Unfairness and health: Evidence from the Whitehall II study. Journal of Epidemiology and Community Health, 61(6), 513-518,
Elovainio, M., Ferrie, J. E., Gimeno, D., De Vogli, R., Shipley, M., Brunner, E. J., et al. (2009). Organizational justice and sleeping problems: The Whitehall II study. Psychosomatic Medicine, 71(3), 334-340,
68
Ferrie, J. E., Shipley, M. J., Newman, K., Stansfeld, S. A., & Marmot, M. (2005). Self-reported job insecurity and health in the Whitehall II study: Potential explanations of the relationship. Social Science & Medicine, 60(7), 1593-1602,
Fuhrer, R., Stansfeld, S., Chemali, J., & Shipley, M. (1999). Gender, social relations and mental health: Prospective findings from an occupational cohort (Whitehall II study). Social Science & Medicine, 48(1), 77-87,
Head, J., Kivimaki, M., Siegrist, J., Ferrie, J. E., Vahtera, J., Shipley, M. J., et al. (2007). Effort-reward imbalance and relational injustice at work predict sickness absence: The Whitehall II study. Journal of Psychosomatic Research, 63(4), 433-440,
Kivimaki, M., Head, J., Ferrie, J., Shipley, M., Brunner, E., Vahtera, J., et al. (2006). Work stress, weight gain and weight loss: Evidence for bidirectional effects of job strain on body mass index in the Whitehall II study. International Journal of Obesity, 30(6), 982-987,
Kuper, H., & Marmot, M. (2003). Job strain, job demands, decision latitude, and risk of coronary heart disease within the Whitehall II study. Journal of Epidemiology and Community Health, 57(2), 147-153,
Nabi, H., Kivimaki, M., De Vogli, R., Marmot, M. G., & Singh-Manoux, A. (2008). Positive and negative affect and risk of coronary heart disease: Whitehall II prospective cohort study. BMJ: British Medical Journal, 337(7660), No Pagination Specified,
North, F. M., Syme, S., Feeney, A., Shipley, M., & al, e. (1996). Psychosocial work environment and sickness absence among British civil servants: The Whitehall II study. American Journal of Public Health, 86(3), 332-340,
Stansfeld, S. A., Fuhrer, R., Head, J., Ferrie, J., & et al. (1997). Work and psychiatric disorder in the Whitehall II Study. Journal of Psychosomatic Research, 43(1), 73-81,
Stansfeld, S. A., Smith, G. D., & Marmot, M. (1993). Association between physical and psychological morbidity in the Whitehall II study. Journal of Psychosomatic Research, 37(3), 227-238,
Virtanen, M., Ferrie, J. E., Gimeno, D., Vahtera, J., Elovainio, M., Singh-Manoux, A., et al. (2009). Long working hours and sleep disturbances: The Whitehall II prospective cohort study. Sleep: Journal of Sleep and Sleep Disorders Research, 32(6), 737-745,
Westerlund, H., Kivimaki, M., Ferrie, J. E., Marmot, M., Shipley, M. J., Vahtera, J., et al. (2009). Does working while ill trigger serious coronary events? The Whitehall II study. Journal of Occupational and Environmental Medicine, 51(9), 1099-1104.