the atlantic lng train 2/3 expansion project - iv - ntnu conferences/2005/sds... · the atlantic...
TRANSCRIPT
The Atlantic LNG Train 2/3Expansion Project
Turning the ChallengesInto
Successes with Technology
Prepared for
Gastech 2005 in Bilbao, Spain
15 March 2005
Slide 2 of 21
AuthorsDave Messersmith, PE
Bechtel Corporation
LNG Technology Manager
LNG Group Deputy Mgr.
Process Engineer
Carlos Yengle
Bechtel Corporation
Advanced Simulations
Process Engineer
Peter Rutherford
BP America
Controls and Instrument Engineer for Atlantic LNG
Trent Yackimec
BP America
Process Engineer for Atlantic LNG

Slide 3 of 21
Facility InformationFacility Information
Located in Point FortinLocated in Point FortinTrinidad and Tobago, WITrinidad and Tobago, WI

Slide 4 of 21
Facility InformationFacility InformationProject History
96 97 98 99 00 01 02 03 04 05 06
Start EPCMay 96
First LNGMar 99
TurnoverJun 99
Start EPCFeb 01
CompleteJul 02
Start EPCNov 99
First LNGAug 02
TurnoverOct 02
First LNGApr 03
TurnoverJun 03
Start EPCJan 02
First LNG4th qtr 05
TurnoverEarly 06
Train 1
Train 2 Train 3
Train 1Upgrade
Train 4

Slide 5 of 21
Train 2/3 Expansion ChallengesTrain 2/3 Expansion Challenges• Scope – Near Duplicate of Train 1 w/ Key Modifications• Capacity – Train 1 +10%• Key Enhancements
– Turbine Drivers Frame 5D– Propane System hydraulics Improvements– Heat exchanger pressure drop optimization– Heavies Removal Column mechanical design Improvements– Anti-surge valve Upgrades– Inlet Gas Filtration enhancements– Molecular Sieve Bed piping optimization
• Challenges – Schedule, Cost, Lessons Learned from Train 1, Feed Gas Pressure, Inlet Compression
Slide 6 of 21
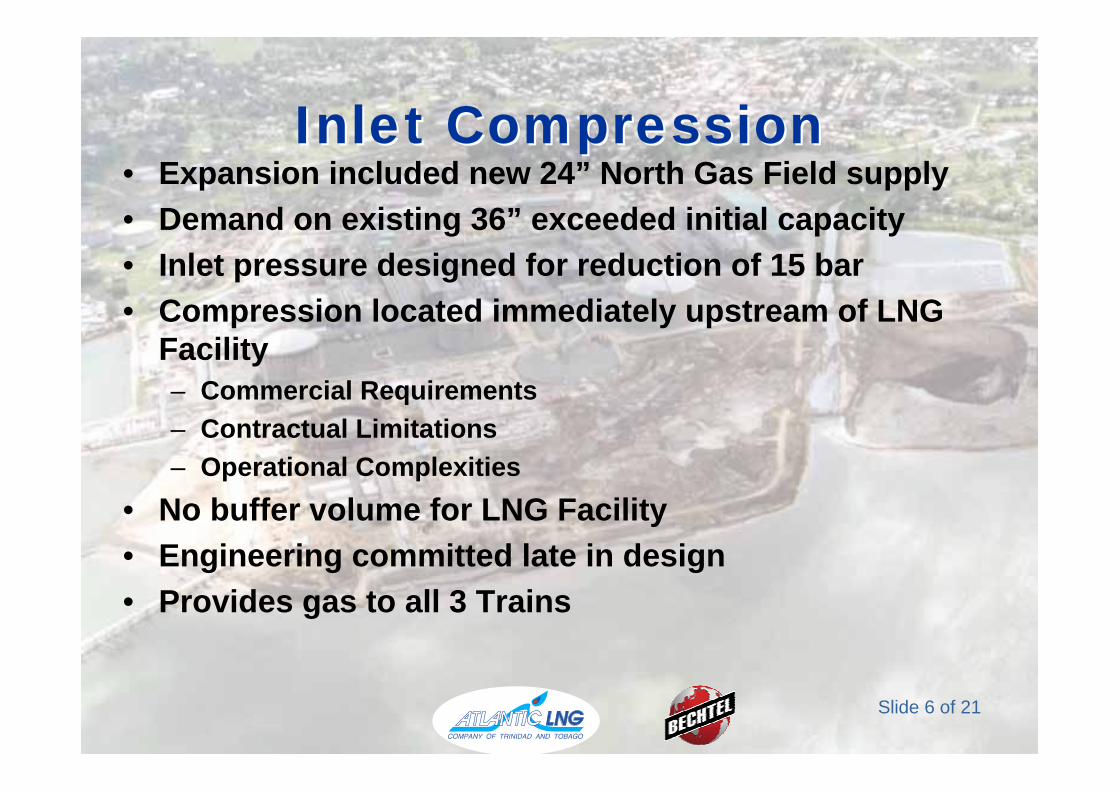
Inlet CompressionInlet Compression• Expansion included new 24” North Gas Field supply• Demand on existing 36” exceeded initial capacity• Inlet pressure designed for reduction of 15 bar• Compression located immediately upstream of LNG
Facility– Commercial Requirements– Contractual Limitations– Operational Complexities
• No buffer volume for LNG Facility• Engineering committed late in design• Provides gas to all 3 Trains
Slide 7 of 21
Inlet CompressionInlet Compression
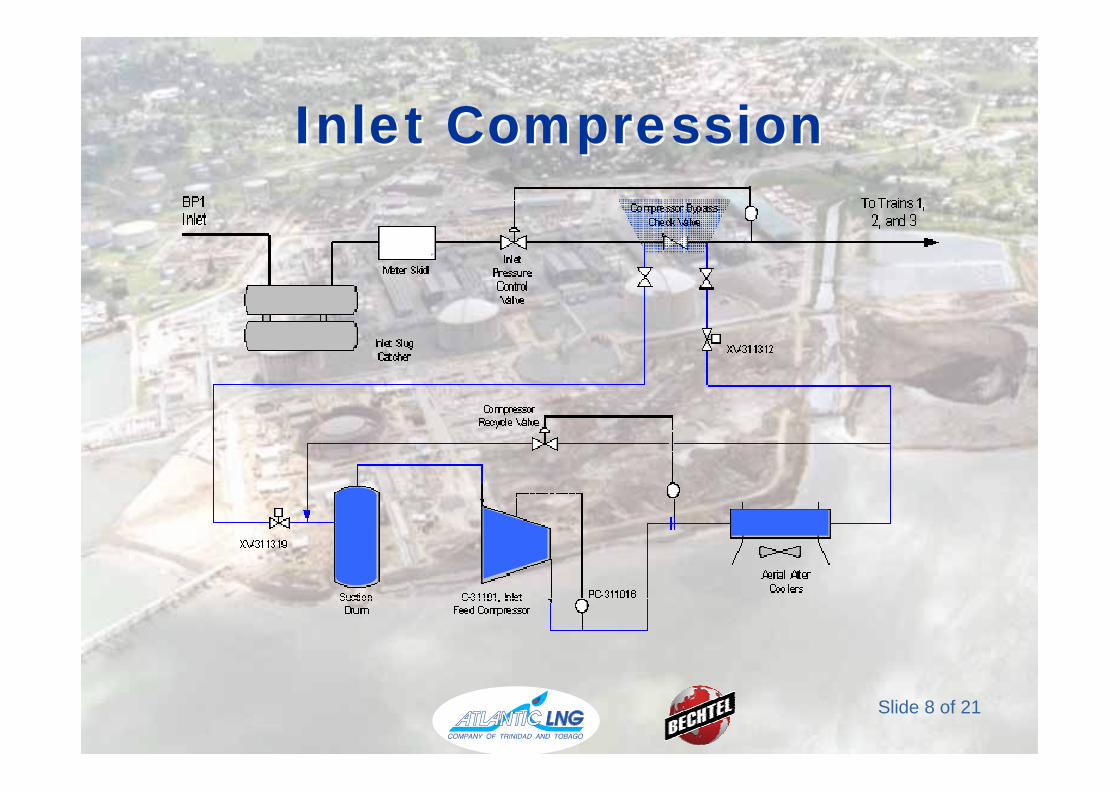
Slide 8 of 21
Inlet CompressionInlet Compression

Slide 9 of 21
Inlet CompressionInlet CompressionProcess Requirements• 1280 MMSCFD feed flow (normal) 250 MMSCFD (min)• 37.5 barg Inlet Pressure (min)• 52 barg Outlet Pressure (min)• GE Frame 5C Driver• Follow facility flow transitions as required• Prevent cascading trips
These Process and Operational requirements led to a study utilizing a rigorous dynamic computer simulation model.

Slide 10 of 21
Dynamic ModelDynamic Model• Hysys.plant ver 2.4.1• Scope of Train 1 Model
– Inlet Pipelines– Inlet Gas treatment– Refrigeration Systems– Methane Compression – NGL Recovery
• Equipment & Instruments modeled with unit operations• System volumes and hydraulics based on isos• Equipment information based on vendor data• Control parameters based on actual Train 1 information

Slide 11 of 21
Dynamic ModelDynamic ModelScenarios1. Feed Gas Compression (FGC) Start up w/ Train 1 &
2 running normally2. Train 1 process shutdown – impact on FGC and
Train 2 and 3.3. FGC Trip – impact on Train 1, 2 & 3
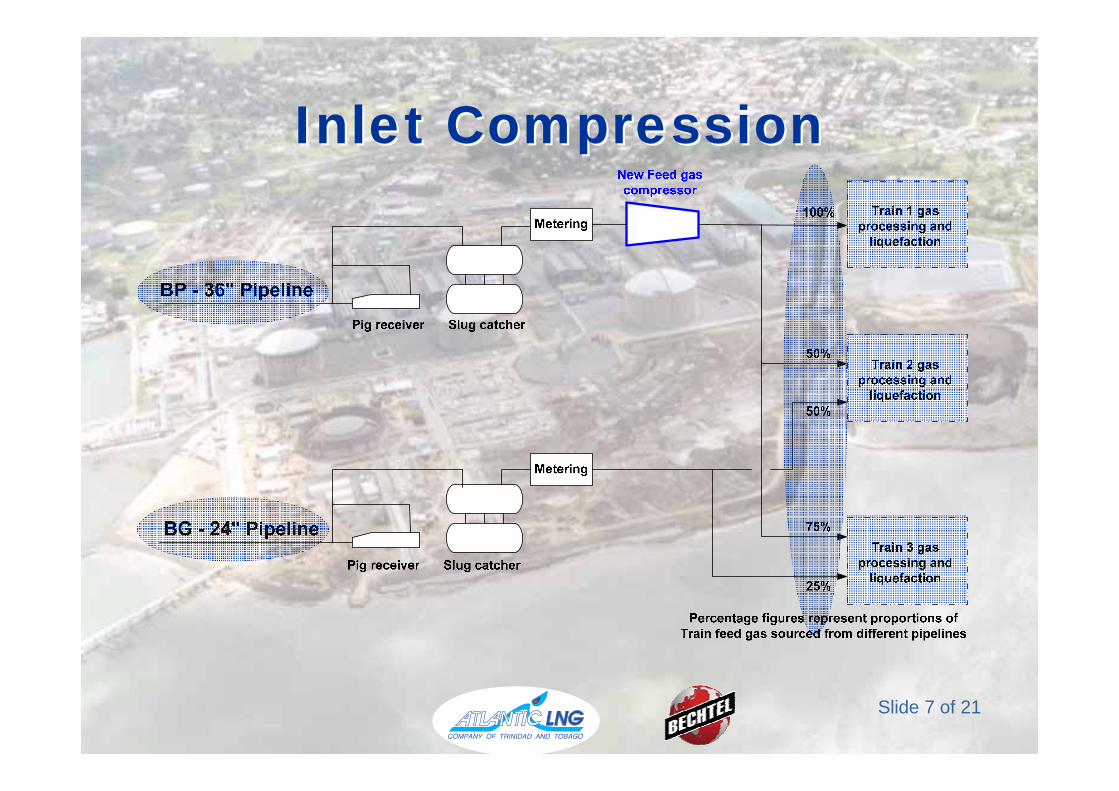
New Feed gas
BP - 36" Pipeline
Train 1 gas processing and
liquefactionMetering
Slug catcherPig receiver
compressor
Train 2 gas processing and
liquefaction
Train 3 gas processing and
liquefaction
BG - 24" Pipeline
Metering
Slug catcherPig receiver
100%
50%
50%
75%
25%
Percentage figures represent proportions of Train feed gas sourced from different pipelines

Slide 12 of 21
Dynamic ModelDynamic ModelFGC TripFGC Trip
BP F e e d - P re ssu re [b a r]
3 5
3 7
3 9
4 1
4 3
4 5
4 7
4 9
0 1 2 3 4 5 6 7 8
T i m e ( m i n u t e s )
Tra in 1 LNG Product - Mass Flow [kg/h]
050000
100000150000200000250000300000350000400000450000
0 1 2 3 4 5 6 7 8
T i m e ( m i n u t e s)
BG Feed- Pressure [bar]
61.46
61.48
61.50
61.52
61.54
61.56
61.58
61.60
0 1 2 3 4 5 6 7 8
T ime (min u t e s)
BP Feed - Pressure [bar]
35
37
39
41
43
45
47
49
0 1 2 3 4 5 6 7 8
T ime (min u t e s)
B G F e e d - P re ssu re [b a r]
6 1.4 6
6 1.4 8
6 1.5 0
6 1.5 2
6 1.5 4
6 1.5 6
6 1.5 8
6 1.6 0
0 1 2 3 4 5 6 7 8
T i m e ( m i n u t e s )
Train 1 LNG Product - Mass Flow [kg/h]
050000
100000150000200000250000300000350000400000450000
0 1 2 3 4 5 6 7 8
Time ( minut es)

Slide 13 of 21
Dynamic ModelDynamic ModelFGC TripFGC Trip
Inlet Feed Gas Com pressor Inle t/Outle t Pressure
35
40
45
50
55
60
0 1 2 3 4 5 6 7 8
T i m e ( m i n u t e s)
Inle t Feed Gas Compressor Bypass - Molar Flow [kgmole/h]
0
10000
20000
30000
40000
50000
60000
0 1 2 3 4 5 6 7 8
T i m e ( m i n u t e s)
Train 1 Feed - Molar Flow [kgmole/h]
0
5000
10000
15000
20000
25000
30000
0 1 2 3 4 5 6 7 8
Time ( minut es)
Train 1 Feed - Pressure [bar]
40
42
44
46
48
50
52
0 1 2 3 4 5 6 7 8
Ti me ( minut es)Inlet Feed Gas Compressor Inlet/Outlet Pressure
35
40
45
50
55
60
0 1 2 3 4 5 6 7 8
Time ( minut es)
Inlet Feed Gas Compressor Bypass - Molar Flow [kgmole/h]
0
10000
20000
30000
40000
50000
60000
0 1 2 3 4 5 6 7 8
Time ( minut es)
Train 1 Feed - Molar Flow [kgmole/h]
0
5000
10000
15000
20000
25000
30000
0 1 2 3 4 5 6 7 8
Time ( minut es)
Train 1 Feed - Pressure [bar]
40
42
44
46
48
50
52
0 1 2 3 4 5 6 7 8
Time ( minut es)
Slide 14 of 21
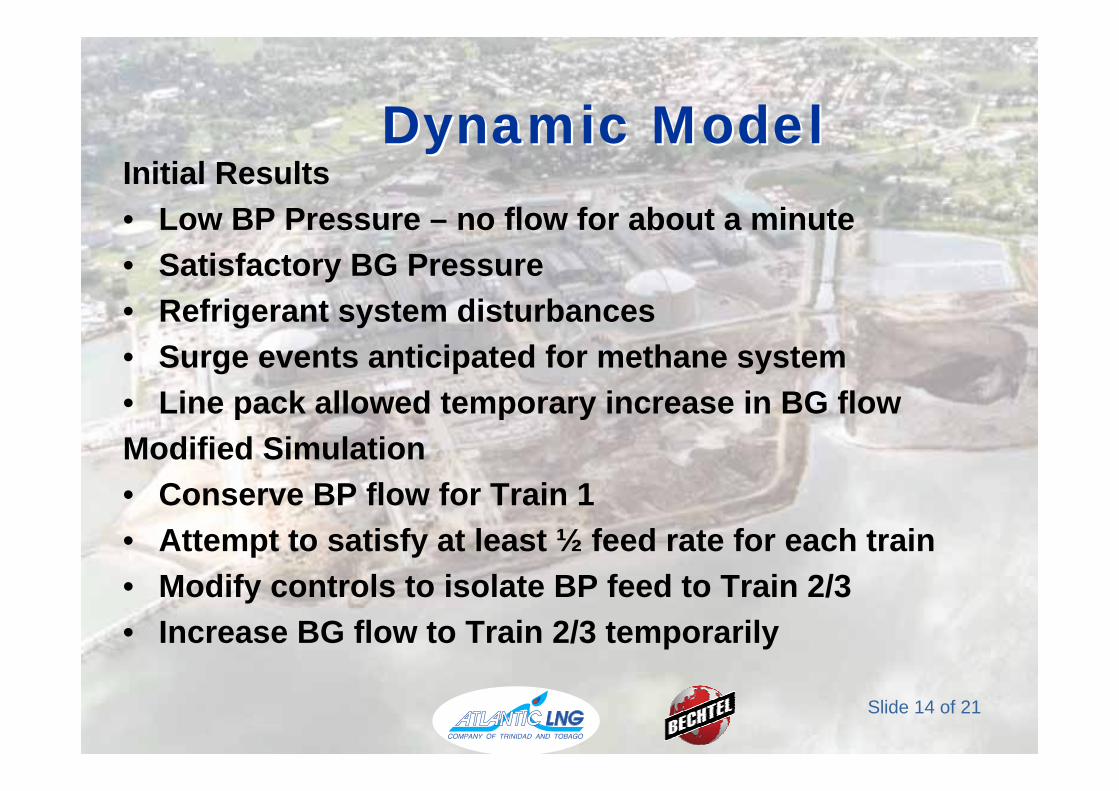
Dynamic ModelDynamic ModelInitial Results• Low BP Pressure – no flow for about a minute• Satisfactory BG Pressure• Refrigerant system disturbances• Surge events anticipated for methane system• Line pack allowed temporary increase in BG flowModified Simulation• Conserve BP flow for Train 1• Attempt to satisfy at least ½ feed rate for each train• Modify controls to isolate BP feed to Train 2/3• Increase BG flow to Train 2/3 temporarily

Slide 15 of 21
Fig. 3 - Train 1 Inlet Feed Gas Molar Flow
0
5000
10000
15000
20000
25000
30000
35000
0 2 4 6 8
Time (min)
Mol
ar F
low
(kgm
ole/
h)
Modified Solution
Fig. 4 - Train 1 Inlet Feed Gas Pressure
40
42
44
46
48
50
52
0 2 4 6 8
Time (min)Pr
essu
re (b
ar)
Modified Solution
Dynamic ModelDynamic Model

Slide 16 of 21
Field TestingField TestingPlan• FGC Commissioned May 03• Full processing rates in all three trains• Validate results of simulation
– Trip FGC– Train 3 reduce BP feed to zero, increase BG feed to 50%– Train 2 reduce BP feed to zero, maintain BG feed at 50%– Train 1 Hold BP feed rate to 50%
Slide 17 of 21
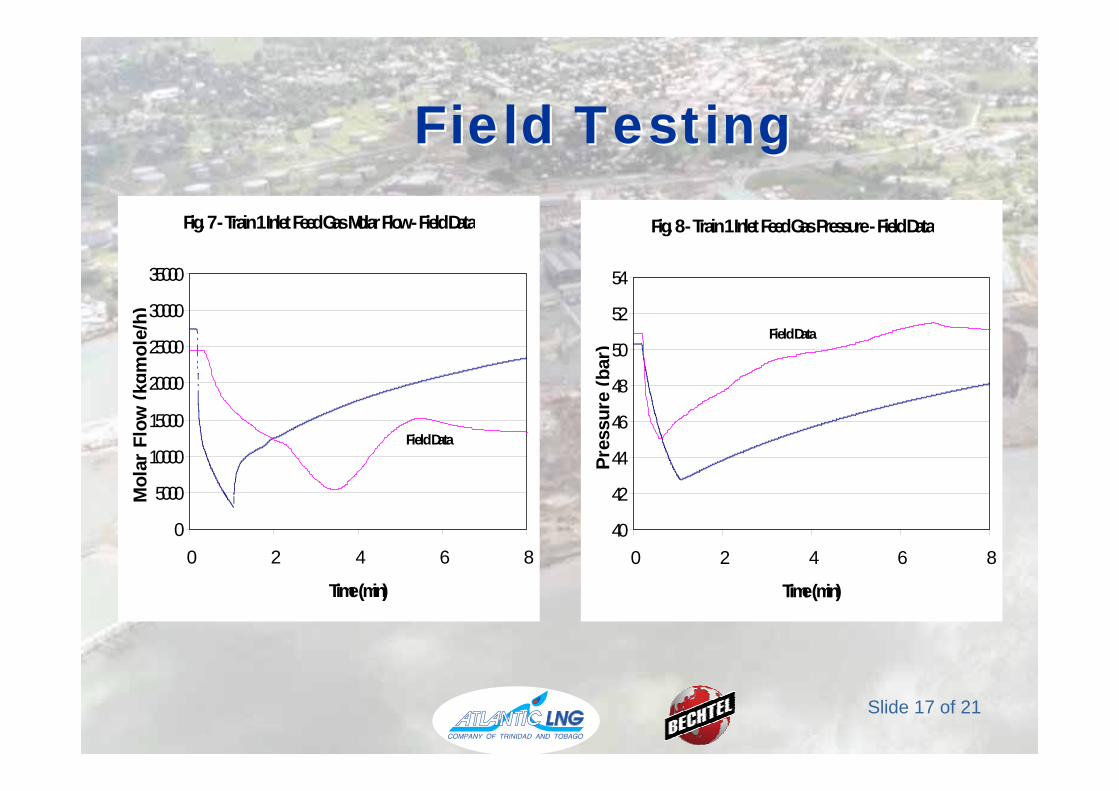
Field TestingField TestingFig. 7 - Train 1 Inlet Feed Gas Molar Flow - Field Data
0
5000
10000
15000
20000
25000
30000
35000
0 2 4 6 8
Time (min)
Mol
ar F
low
(kgm
ole/
h)
Field Data
Fig. 8 - Train 1 Inlet Feed Gas Pressure - Field Data
40
42
44
46
48
50
52
54
0 2 4 6 8
Time (min)Pr
essu
re (b
ar)
Field Data

Slide 18 of 21
Response• 3.5 minutes until flow resumes from BP, low pressure• 6.5 minutes until inlet pressure returns to 51 barg• Train 1 flow decreased to 22% of capacity slowly• Many operational deviations, but no equipment trips• Recovery to 50% rates in about 4 minutes• No loss of condensing• Train 2 & 3 rode through the upset smoothly• Machines not driven to surge• After the trip, facility was restricted to 50% rate• The simulation was not limited to ½ rate
Field TestingField Testing
Slide 19 of 21
Closing RemarksClosing Remarks• Dynamic model closely predicted actual field results• Development of safe operating instruction in advance• Illustrated operational concerns prior to start-up• Used to predict other upsets with confidence• Combined team of specialists reduced risks for system
Slide 20 of 21
– Schedule – 65 days early– Production & Efficiency – exceeded requirements– Ease of start up – 68 days first LNG to turnover
– Schedule – 80 days early– Production & Efficiency – exceeded requirements– Ease of start up – 46 days first LNG to turnover
– Over 18 million hours worked at facility since last LTA
Train 2/3 Expansion SuccessesTrain 2/3 Expansion SuccessesTrain 2Train 2
Train 3Train 3
SafetySafety

Slide 21 of 21
Question or CommentsQuestion or Comments
??