the association between nutrition information use and … or (3) email: [email protected]....
TRANSCRIPT

United States Department of Agriculture
Economic Research Service
Economic Research Report Number 247
April 2018
The Association Between Nutrition Information Use and the Healthfulness of Food Acquisitions
Eliana Zeballos and Tobenna D. Anekwe

Economic Research Service www.ers.usda.gov
United States Department of Agriculture
Recommended citation format for this publication:
Eliana Zeballos and Tobenna D. Anekwe. The Association Between Nutrition Information Use and the Healthfulness of Food Acquisitions, ERR-247, U.S. Department of Agriculture, Economic Research Service, April 2018.
Cover is a derivative of images from Getty Images.
Use of commercial and trade names does not imply approval or constitute endorsement by USDA.
To ensure the quality of its research reports and satisfy governmentwide standards, ERS requires that all research reports with substantively new material be reviewed by qualified technical research peers. This technical peer review process, coordinated by ERS' Peer Review Coordinating Council, allows experts who possess the technical background, perspective, and expertise to provide an objective and meaningful assessment of the output’s substantive content and clarity of communication during the publication’s review.
In accordance with Federal civil rights law and U.S. Department of Agriculture (USDA) civil rights regulations and policies, the USDA, its Agencies, offices, and employees, and institutions participating in or administering USDA programs are prohibited from discriminating based on race, color, national origin, religion, sex, gender identity (including gender expression), sexual orientation, disability, age, marital status, family/parental status, income derived from a public assistance program, political beliefs, or reprisal or retaliation for prior civil rights activity, in any program or activity conducted or funded by USDA (not all bases apply to all programs). Remedies and complaint filing deadlines vary by program or incident.
Persons with disabilities who require alternative means of communication for program information (e.g., Braille, large print, audiotape, American Sign Language, etc.) should contact the responsible Agency or USDA's TARGET Center at (202) 720-2600 (voice and TTY) or contact USDA through the Federal Relay Service at (800) 877-8339. Additionally, program information may be made available in languages other than English.
To file a program discrimination complaint, complete the USDA Program Discrimination Complaint Form, AD-3027, found online at How to File a Program Discrimination Complaint and at any USDA office or write a letter addressed to USDA and provide in the letter all of the information requested in the form. To request a copy of the complaint form, call (866) 632-9992. Submit your completed form or letter to USDA by: (1) mail: U.S. Department of Agriculture, Office of the Assistant Secretary for Civil Rights, 1400 Independence Avenue, SW, Washington, D.C. 20250-9410; (2) fax: (202) 690-7442; or (3) email: [email protected].
USDA is an equal opportunity provider, employer, and lender.

United States Department of Agriculture
Economic Research Service
Economic Research Report Number 247
April 2018
Abstract
Consumers have access to a variety of sources of nutrition information, including the Nutrition Facts label on packaged foods, USDA’s MyPlate food guidance for healthy eating, and the posting of nutrition information in restaurants. This study uses unique data from USDA’s 2012-13 National Household Food Acquisition and Purchase Survey (FoodAPS) to explore the correlation between consumers’ use of nutrition information and the healthfulness of their food choices. Healthfulness of food purchases is assessed by conformance with the Dietary Guidelines for Americans as measured by the 2010 Healthy Eating Index (HEI-2010). Results show that the HEI-2010 score is positively associated with nutrition information use. This positive correlation between nutrition information use and HEI-2010 also holds within each of the three categories of house-hold participation in USDA’s Supplemental Nutrition Assistance Program (participant, low-income nonparticipant, and high-income nonparticipant). Examining the influence of nutrition information use separately on food-at-home and food-away-from-home purchases shows that the food-at-home HEI-2010 score is positively correlated with more nutrition information use while the food-away-from-home HEI-2010 score is not correlated with more nutrition information use.
Keywords: FoodAPS, National Household Food Acquisition and Purchase Survey, HEI, Healthy Eating Index, Nutrition Information Use Index, FAFH, food away from home, FAH, food at home
Acknowledgments
The authors thank Lisa Mancino and Jessica Todd of USDA’s Economic Research Service (ERS) for their reviews and comments. Peer reviews were provided by Charles Joseph Courtemanche of Georgia State University, Jeta Rudi of California Polytechnic and State University, Eliza Mojduszka of USDA’s Office of the Chief Economist, and Andrea Carlson of ERS. We also thank Jean Buzby and Tim Park of ERS for their reviews and John Weber and Lori A. Fields of ERS for editorial and design assistance.
The Association Between Nutrition Information Use and the Healthfulness of Food AcquisitionsEliana Zeballos and Tobenna D. Anekwe

ii The Association Between Nutrition Information Use and the Healthfulness of Food Acquisitions, ERR-247
USDA, Economic Research Service
Summary . . . . . . . . . . . . . . . . . . . . . . . . . . . . . . . . . . . . . . . . . . . . . . . . . . . . . . . . . . . . . . . . . . . . . iii
Introduction . . . . . . . . . . . . . . . . . . . . . . . . . . . . . . . . . . . . . . . . . . . . . . . . . . . . . . . . . . . . . . . . . . . .1
Data . . . . . . . . . . . . . . . . . . . . . . . . . . . . . . . . . . . . . . . . . . . . . . . . . . . . . . . . . . . . . . . . . . . . . . . . . .5
National Household Food Acquisition Purchase Survey (FoodAPS) . . . . . . . . . . . . . . . . . . . . . .5
Primary Respondent . . . . . . . . . . . . . . . . . . . . . . . . . . . . . . . . . . . . . . . . . . . . . . . . . . . . . . . . . . . .7
Food at Home . . . . . . . . . . . . . . . . . . . . . . . . . . . . . . . . . . . . . . . . . . . . . . . . . . . . . . . . . . . . . . . . .9
Food Away From Home . . . . . . . . . . . . . . . . . . . . . . . . . . . . . . . . . . . . . . . . . . . . . . . . . . . . . . . . 10
Healthy Eating Index-2010 and Nutrient Densities . . . . . . . . . . . . . . . . . . . . . . . . . . . . . . . . . . . 10
Nutrition information use . . . . . . . . . . . . . . . . . . . . . . . . . . . . . . . . . . . . . . . . . . . . . . . . . . . . . . .13
Other variables and controls. . . . . . . . . . . . . . . . . . . . . . . . . . . . . . . . . . . . . . . . . . . . . . . . . . . . .15
Results . . . . . . . . . . . . . . . . . . . . . . . . . . . . . . . . . . . . . . . . . . . . . . . . . . . . . . . . . . . . . . . . . . . . . . . 17
Discussion . . . . . . . . . . . . . . . . . . . . . . . . . . . . . . . . . . . . . . . . . . . . . . . . . . . . . . . . . . . . . . . . . . . . .25
References . . . . . . . . . . . . . . . . . . . . . . . . . . . . . . . . . . . . . . . . . . . . . . . . . . . . . . . . . . . . . . . . . . . .27
Appendix . . . . . . . . . . . . . . . . . . . . . . . . . . . . . . . . . . . . . . . . . . . . . . . . . . . . . . . . . . . . . . . . . . . . .31
Contents

United States Department of Agriculture
A report summary from the Economic Research Service April 2018
The Association Between Nutrition Information Use and the Healthfulness of Food AcquisitionsEliana Zeballos and Tobenna D. Anekwe
What Is the Issue?
In 2015, poor diet was the leading risk factor for premature death and was responsible for 11.2 percent of total disability-adjusted life years (i.e., the number of years lost to disease and early death) and 18.8 percent of total deaths in the United States. To mitigate the health and economic burden generated by diet-related diseases, the Federal Government has developed and promoted several nutrition education initiatives for consumers, including the Nutrition Facts label, MyPyramid, MyPlate, and the posting of nutrition information in restaurants. USDA’s 2012-13 National Household Food Acquisition and Purchase Survey (FoodAPS) gathered unique data on the nutritional quality of foods acquired or bought by households as well as their use of nutrition information in making food choices. Using these data, this study addresses three questions related to the effectiveness of Federal nutri-tion information and education efforts: (1) Do people who often use nutrition information purchase food of higher nutritional quality than people who use nutrition information less often? (2) If they do, does that result hold for food-at-home and food-away-from-home acquisitions separately? and (3) Are these results similar among USDA’s Supplemental Nutrition Assistance Program (SNAP) participant households, low-income nonparticipant households, and higher income nonparticipant households?
What Did the Study Find?
• Thirty-ninepercentofhouseholdsfallintothecategoryoflownutritioninformationusers, 48 percent are medium nutrition information users, and 13 percent are high nutrition information users.
• Basedonanassessmentofthenutritionalqualityoffoodacquisitionsandpurchasesusing the 2010 Healthy Eating Index (HEI-2010), and in line with expectations, nutri-tional quality is found to have a positive correlation with nutrition information use: The HEI-2010 scores for households increase with nutrition information (low use—48, medium use—54, high use—56).
• ExaminingtherelationshipbetweennutritioninformationuseandHEI-2010bySNAPparticipation status shows that the positive correlation between nutrition information use and HEI-2010 scores also holds for SNAP participant households, low-income nonparticipant households, and higher income nonparticipant households.
www.ers.usda.gov
United States Department of Agriculture
Economic Research Service
Economic Research Report Number 247
April 2018
The Association Between Nutrition Information Use and the Healthfulness of Food Acquisitions
Eliana Zeballos and Tobenna D. Anekwe
ERS is a primary source of economic research and
analysis from the U.S. Department of Agriculture, providing timely informa-
tion on economic and policy issues related to agriculture, food, the environment, and
rural America.
Summary
www.ers.usda.gov
• Nutritioninformationuseappearstohaveadifferentialeffectonthenutritionalqualityof food-at-home versus food-away-from-home acquisitions. While the overall HEI-2010 score for food-at-home acquisitions is 21 percent higher than that for food-away-from-home acquisitions, the gap increases across the three levels of information use. The HEI-2010 gap is 14 percent among households with low nutrition information use and 25 percent and 27 percent among households with medium and high nutrition information use, respectively.
• Theincreasingdifferencebetweenfood-at-homeHEI-2010andfood-away-from-homeHEI-2010 as nutrition information use increases is mostly driven by the positive effect of nutrition information use on food-at-home acquisitions. The HEI-2010 score for food-at-home acquisitions increases with nutrition information use. By contrast, the HEI-2010 score for food-away-from-home acquisitions does not seem to increase when households use more nutrition information. This finding that nutrition information correlates with more healthful acquisitions for food at home than for food away from home is consistent with the idea that there is an indulgence effect when consumers eat out. The healthfulness gap, however, may stem from other factors, such as a lack of nutrition information in many dining-out settings.
How Was the Study Conducted?
This study uses data from USDA’s 2012-13 National Household Food Acquisition and Purchase Survey (FoodAPS) to develop a measure of consumers’ knowledge and use of nutri-tion information—the Nutrition Information Use (NIU) index. Researchers calculate the 2010 Healthy Eating Index for households’ food-at-home and food-away-from-home purchases, which measures conformance with the Dietary Guidelines for Americans. The analysis includes only nonfree, or paid, food acquisitions, as it is likely that food items given freely to people do not come with many (or any) alternative choices. Researchers also examine the NIU’s correlation with food-at-home and food-away-from-home HEI-2010 scores and with other nutrition variables, such as added sugar and sodium intake. Using regressions, the analysis accounts for a range of consumer characteristics that may affect nutritional quality of acquisitions, including use of a grocery list while shopping, self-perceived diet quality, and body mass index. However, the study design does not permit drawing causal inference.
1 The Association Between Nutrition Information Use and the Healthfulness of Food Acquisitions, ERR-247
USDA, Economic Research Service
The Association Between Nutrition Information Use and the Healthfulness of Food Acquisitions
Introduction
Poor diet is not only a contributor to chronic disease (Mokdad et al., 2004) but also the leading risk factor for premature death, responsible for 18.8 percent of total deaths and 11.2 percent of total disability-adjusted life years (DALYs) in the United States in 2015 (IHME, 2015).1 Underconsumption of fruit and vegetables and overconsumption of sodium and processed meats are among the main risk factors associated with cardiovascular disease, neoplasms, and diabetes (IHME, 2015). In turn, heart disease, cancer, stroke, and diabetes were among the 10 leading causes of death in the United States, accounting for 54 percent of all deaths in 2014 (Kochanek et al., 2016). These chronic health conditions impose a great societal burden, including significant direct and indirect costs on health and welfare systems (Cunningham, 2009; Schoenberg et al., 2007; Vogeli et al., 2007).
To mitigate the economic burden associated with diet-related diseases, Federal and State poli-cymakers have undertaken several initiatives to educate the public about nutrition and health. In November 1990, the National Nutrition Monitoring and Related Research Act and the Nutrition Labeling and Education Act (NLEA) were both signed into law to increase access to information that may encourage people to eat a more healthful diet. As a result, many nutrition education initia-tives have since been developed, such as the Nutrition Facts label, MyPyramid, MyPlate, and the posting of nutrition information in restaurants.2
The Dietary Guidelines for Americans, issued by USDA and the U.S. Department of Health and Human Services, are part of a complex and multifaceted strategy for promoting health and preventing diet-related chronic diseases and serve as the evidence-based foundation for Federal nutrition education (DeSalvo et al., 2016). Based on the Dietary Guidelines, USDA developed nutrition guides that present intake recommendations to consumers; this information has been periodically revised and reformatted during the last 25 years. The Food Guide Pyramid was released in 1992 and provided a recommended number of daily servings for each food group (Duston, 1992). This guide was replaced by MyPyramid in 2005, which again translated nutri-tional recommendations into daily servings for each food group. In place of the hierarchical levels of the Food Guide Pyramid, MyPyramid used colorful vertical wedges sided by an image of a person climbing stairs to represent exercise (Britten et al., 2006; MyPyramid, n.d.). In June 2011, USDA replaced MyPyramid with the MyPlate tool to accompany the 2010 Dietary Guidelines for
1 Poor diet is indicated by such characteristics as excess energy intake; high intake of saturated fat and sodium; and low intake of fruit, vegetables, and fiber (Guenther et al., 2006; Serdula et al., 2004; Wright et al., 2004).
2 We include all of these nutrition education initiatives in the analysis, as we want to use all of the information that was relevant in 2012 (MyPyramid was relevant in 2012 because MyPlate had only recently been released).

2 The Association Between Nutrition Information Use and the Healthfulness of Food Acquisitions, ERR-247
USDA, Economic Research Service
Americans. MyPlate consists of a diagram of a plate and drinking glass divided into the same five food groups as MyPyramid, with the difference being that the key recommendations are simpli-fied in MyPlate (Levine et al., 2012; USDA, n.d.).
To support the recommendations of the Dietary Guidelines and the different nutrition guides, the FDA has mandated that packaged and processed foods sold in the United States display a standard Nutrition Facts label (NFL) (Janssen, 1981; Todd and Variyam, 2008). Consumers can use the NFL to determine the quantity of calories and nutrients in one serving of a purchased food item. Although consumers can use the Nutrition Facts label (NFL) when they acquire food at stores, the same information is generally not easily available in restaurants, as foods sold or served in restau-rants are exempted from mandatory nutrition labeling requirements. For this reason, the 2010 Patient Protection and Affordable Care Act included a provision requiring chain restaurants and similar retail food establishments with more than 20 locations nationwide to post proper nutrition labeling of menu items. This new calorie labeling will be consistent nationwide and will provide easy-to understand nutrition information in a direct and accessible manner (FDA, 2017). Beginning with New York City in 2008, various State, county, and municipal governments have mandated that chain restaurants provide information about the calorie content of foods at the point of sale. New York City requires fast-food restaurants to post this information on menu boards and requires full-service restaurants with wait staff to print the information in their menus.
In general, the major goal of these nutrition and dietary regulations and programs is to provide credible nutrition information and offer personalized eating plans to increase consumers’ nutri-tion knowledge, with the expectation that this will lead them to make more healthful food choices (Taylor and Wilkening, 2008). Providing nutrition information at the point of purchase, in theory, can have an impact on people’s food choices. Many of these nutritional strategies assume that the consumer is highly motivated to eat a healthful diet and that access to nutrition information is the main barrier to dietary improvement (Petty et al., 2002); if these assumptions hold, then a public that enjoys better access to nutrition information will presumably select more healthful foods to reduce their risk for diet-related chronic disease (IOM, 2012).
To test this theory, many studies examine the relationship between nutrition initiatives and diet quality. In a review of the literature, Kim et al. (2000) conclude that food labels are indeed useful tools that enable individuals to make more healthful food choices. Kreuter et al. (1997) show that label readers have diets that are higher in fruit, vegetables, and fiber and lower in fat than diets of nonlabel readers. Another study finds that label users have diets that are lower in cholesterol relative to diets of nonusers (Guthrie et al., 1995). Variyam (2008), using a quasi-experimental approach to control for unobserved selection effects, finds that label use has only a modest asso-ciation with diet quality.
While studies often find a positive relationship between label use and a more healthful diet, the effect of calorie labeling at the point of purchase in restaurants is ambiguous. Kiszko et al. (2014) review the literature and find that while some positive results are reported from studies examining the effects of calorie labeling in restaurants, overall, the best-designed studies show that calorie labels do not reduce total calories ordered. Findings from other studies are more optimistic. For example, Deb and Vargas (2016) find that body mass index (BMI) decreases in U.S. counties after implementation of calorie-labeling laws; Restrepo (2016) finds the same for New York City. Gregory et al. (2014) find that consumers who intend to use nutrition information when they eat out have higher 2010 Healthy Eating Index scores and consume less sugar than those with no intention of using the information.

3 The Association Between Nutrition Information Use and the Healthfulness of Food Acquisitions, ERR-247
USDA, Economic Research Service
Whereas previous studies each generally focus on a single nutrition initiative, in this ERS study, we construct an index that is a composite measure summarizing several types of consumer nutri-tion knowledge and nutrition information use (including knowledge and use of nutrition initiatives). Since many of these nutrition initiatives complement each other, the index will help one develop a better understanding of the relationship between consumers’ nutrition information use as a whole and the nutritional quality of their food acquisitions. This Nutrition Information Use index is constructed using a principal components analysis of data on consumers’ nutrition knowledge and nutrition information use from USDA’s National Household Food Acquisition and Purchase Survey (FoodAPS). We employ the following variables to construct the index: knowledge of MyPlate and MyPyramid and whether the FoodAPS respondent follows the recommendations in these plans, use of the Nutrition Facts label, participation in nutrition education classes, and use of online searches for nutrition information or information about how to shop for or prepare nutritious foods and meals.
Since many factors influence consumer decisions regarding what foods to buy and eat, and these factors may vary based on whether one is eating out or at home, we compare the nutritional quality of food-at-home (FAH) and food-away-from-home (FAFH) purchases or acquisitions. This relates to the question of whether there is an indulgence effect. This study refers to the indulgence effect when consumers indulge themselves when eating out, even as they keep a relatively healthful diet at home. Given the increased popularity of dining out, understanding the impact of nutrition information use on the nutritional quality of FAH versus that of FAFH events may be crucial for better targeting of food-related policies and programs. In addition, FAFH accounts for 43.7 percent of all food spending (USDA/ERS, 2016) and 32 percent of total calories consumed (Mancino et al., 2009) and is corre-lated with obesity and chronic diseases (Lin and Guthrie, 2012).3
In this study, we first examine whether individuals who use nutrition information regularly acquire a higher nutritional quality of food, as defined by the 2010 Healthy Eating Index (HEI-2010) score that measures conformance with Dietary Guidelines for Americans,4 (for FAH and FAFH sources, combined) than individuals who use nutrition information less frequently. We disaggre-gate food acquisitions by source (i.e., FAH versus FAFH) and compare the nutritional quality of FAH and FAFH events. And we investigate how this FAH-versus-FAFH healthfulness gap varies by consumers’ level of nutrition information use and by other demographic variables (e.g., age and gender). Specifically, this study aims to shed light on the following three questions: (1) Do people who use nutrition information acquire a higher nutritional quality of food? (2) If so, does this hold for food-at-home and food-away-from-home events separately? and (3) Are these results similar within the different participation categories in USDA’s Supplemental Nutrition Assistance Program (SNAP) (i.e., SNAP households, low-income nonparticipant households, and higher income nonpar-ticipant households5)? We control for a range of consumer characteristics, including use of a grocery list, self-perceived diet quality, and BMI. Information on a correlation between nutrition information use and diet quality may help inform efforts to design and revise programs to improve dietary health
3 Food away from home (FAFH) has, on average, poorer nutrition quality than food at home; FAFH meals have more fat and saturated fat and less calcium, fiber, and iron. For example, Todd et al. (2010) find that for the average adult, FAFH increases daily caloric intake while reducing diet quality.
4 See a complete description of how the 2010 Healthy Eating Index (HEI-2010) is constructed in section 2.2.
5 We separate the data into SNAP participants and two groups of nonparticipants because low-income nonparticipants constitute a sociologically distinct population from higher income nonparticipants.

4 The Association Between Nutrition Information Use and the Healthfulness of Food Acquisitions, ERR-247
USDA, Economic Research Service
outcomes. For example, if consumers’ nutrition information knowledge and use is positively corre-lated with more healthful food acquisitions (and this correlation is confirmed as causal by followup studies), then presenting consumers with nutrition information and implementing population-wide nutrition-education campaigns may encourage them to select more healthful food options.
This study makes three contributions to the literature. First, it exploits a unique dataset that collects detailed information about all food acquisitions of households during a full week, which is useful because many nutrition information initiatives are intended to affect consumer decisions at the point of purchase. Second, using the unique data, the study examines the differential effect of nutrition information use on the healthfulness of food-at-home versus food-away-from-home acquisitions. Third, the study takes a novel approach by summarizing several variables about nutrition knowledge and nutrition information use in a single tool called the Nutrition Information Use (NIU) index. Although we control for the major determinants that link healthy purchases and the use of nutrition information, we are careful not to claim a causal relationship between NIU and HEI-2010.
5 The Association Between Nutrition Information Use and the Healthfulness of Food Acquisitions, ERR-247
USDA, Economic Research Service
Data
National Household Food Acquisition Purchase Survey (FoodAPS)
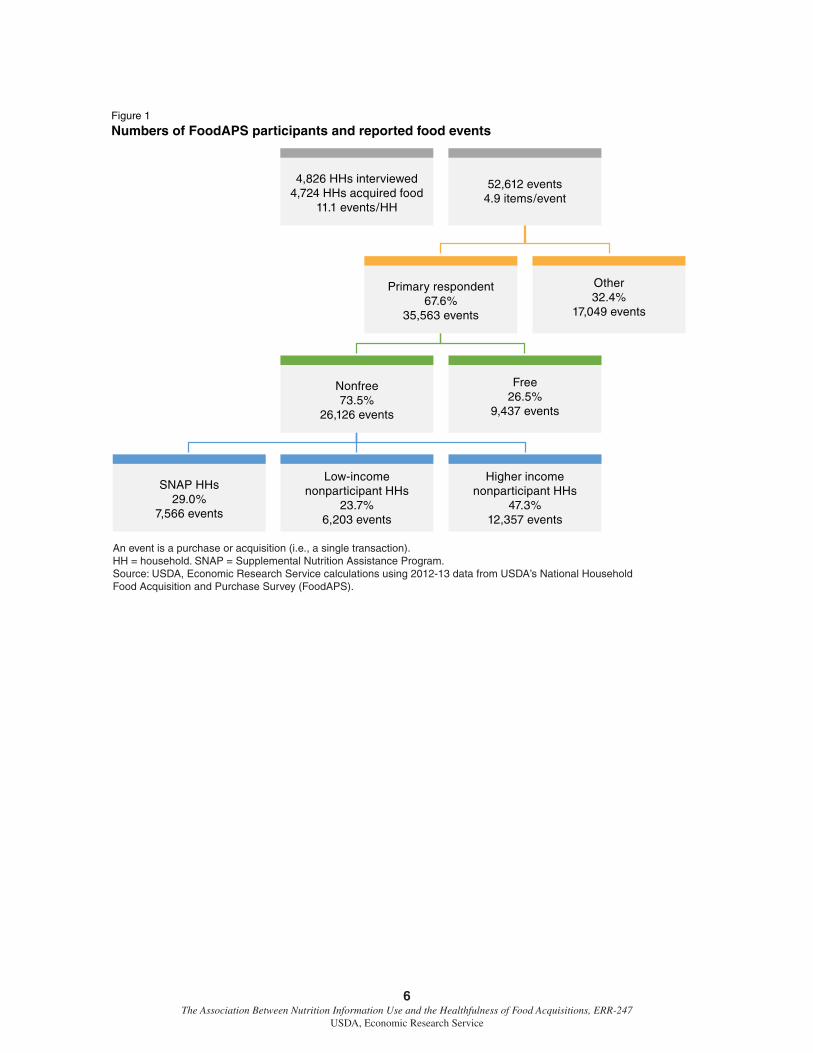
USDA’s National Household Food Acquisition and Purchase Survey is a nationally representative survey of households, including SNAP households, low-income nonparticipant households, and higher income nonparticipant households. FoodAPS is the first survey to collect unique and compre-hensive information about household food purchases and acquisitions that is comparable to informa-tion from other national-level surveys (Clay et al., 2016). The survey collects detailed information over a 1-week period about all of a household’s food acquisitions, which comprises all food and drinks brought into the home (FAH) as well as meals, snacks, and drinks acquired outside of the home (FAFH), including foods acquired through food and nutrition assistance programs. Between April 2012 and January 2013, 4,826 households participated in the survey. Overall, 98 percent of surveyed households (4,724 households) reported acquiring food at least 1 time during the week, with a mean (average) of 11 food events per week per household. The data contain a total of 52,612 food events, where “food event” is defined as a purchase or acquistion (i.e., a single transaction). On average, five food items were purchased or acquired per event.
In FoodAPS, a household’s main food shopper or meal planner serves as the household’s primary respondent (PR). As part of this role, the PR completes two in-person interviews: one before reporting any food acquisitions and one after the conclusion of the food reporting week. The inter-views collect demographic, diet and health, and other information used in this study to construct the NIU index (described in subsection 2.3). Since only the primary respondent completes the two in-person interviews, we limit the analysis to only those food events that were purchased or acquired by the PR for which we have complete information (67.6 percent of all food events) (i.e., this analysis is limited to the participant level).6 Moreover, we focus on food items that people choose to buy (i.e., nonfree items) rather than on food items that are free because it is likely that food items people receive for free do not come with many (or any) alternative choices. Free food items not considered in the analysis account for more than a quarter of all food items reported.7 Our analysis is based on 26,126 food events (fig. 1).
At the time of the interview, 29.0 percent of the events were acquired by a PR who was receiving SNAP benefits, 23.7 percent were acquired by a low-income PR who was not receiving SNAP bene-fits, and 47.3 percent were acquired by a higher income nonparticipant PR. We consider a household to be low income if its annual income is lower than 1.85 times the Federal poverty threshold, which varies by household size. For reference, the 2012 poverty guideline is $15,130 for a household with two members and $19,090 for a household with three members.
6 This sample selection criteria may limit the representativeness of the analysis for nonprimary respondents.
7 Almost all (93.6 percent) free food events are considered FAFH. Of these events, 20.9 percent involved food acquired at restaurants and eating places, 31.6 percent involved food at school, 32.7 percent involved food from friends and family, and 14.3 percent involved food at work (with the remaining 0.5 percent accounted for by Meals on Wheels).
6 The Association Between Nutrition Information Use and the Healthfulness of Food Acquisitions, ERR-247
USDA, Economic Research Service
Figure 1
Numbers of FoodAPS participants and reported food events
An event is a purchase or acquisition (i.e., a single transaction). HH = household. SNAP = Supplemental Nutrition Assistance Program. Source: USDA, Economic Research Service calculations using 2012-13 data from USDA’s National Household Food Acquisition and Purchase Survey (FoodAPS).
4,826 HHs interviewed 4,724 HHs acquired food
11.1 events/HH
52,612 events 4.9 items/event
Primary respondent67.6%
35,563 events
Other32.4%
17,049 events
Nonfree73.5%
26,126 events
Free26.5%
9,437 events
Low-income nonparticipant HHs
23.7%6,203 events
SNAP HHs29.0%
7,566 events
Higher income nonparticipant HHs
47.3%12,357 events

7 The Association Between Nutrition Information Use and the Healthfulness of Food Acquisitions, ERR-247
USDA, Economic Research Service
Primary Respondent
Primary respondents in this subsample are, on average, 50 years old; 68 percent are female, and 45 percent are married. Overall, 56 percent of PRs are employed. Thirteen percent report being Hispanic, 69 percent report being Non-Hispanic White, and 12 percent report being Non-Hispanic Black. The mean household size is 2.43 persons. Fifteen percent of households are food insecure (table 1).8
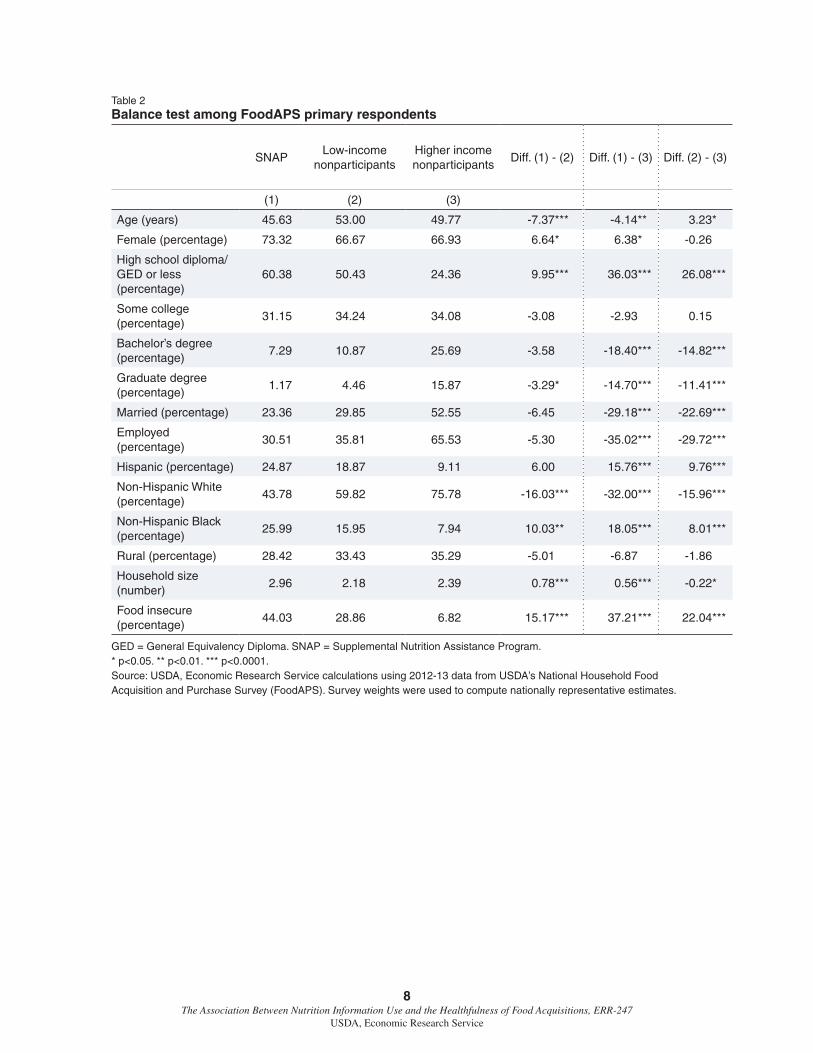
Based on FoodAPS data, PRs in SNAP households are younger on average and are more likely to be female than PRs in nonparticipant households (table 2). PRs in SNAP households are also more likely than PRs in nonparticipant households to have only a high school education or less. Finally, SNAP households are larger and more likely to be food insecure than nonparticipant households.9
Table 1 Summary statistics for FoodAPS primary respondents
Item Mean Std. err. [95% coef. interval]
Age (years) 49.77 0.50 48.74 50.79
Female (percentage) 67.60 1.39 64.74 70.45
High school diploma/ GED or less (percentage)
33.72 2.11 29.39 38.05
Some college (percentage) 33.73 2.43 28.74 38.72
Bachelor’s degree (percentage) 20.66 1.99 16.57 24.75
Graduate degree (percentage) 11.90 1.47 8.87 14.93
Married (percentage) 44.69 1.39 41.84 47.54
Employed (percentage) 55.98 1.26 53.38 58.57
Hispanic (percentage) 12.82 0.11 12.60 13.05
Non-Hispanic White (percentage) 68.85 0.35 68.12 69.57
Non-Hispanic Black (percentage) 11.73 0.34 11.02 12.43
Rural (percentage) 34.15 4.41 25.09 43.22
Household size (number) 2.43 0.02 2.39 2.47
Food insecure (percentage) 15.41 0.88 13.60 17.22
N = 4,564; Population size = 117,316,639. GED = General Equivalency Diploma.Source: USDA, Economic Research Service calculations using 2012-13 data from USDA’s National Household Food Acquisition and Purchase Survey (FoodAPS). Survey weights were used to compute nationally representative estimates.
8 Food security is consistent, dependable access to enough food for active healthy living. Households that report having experienced either low or very low food security in the last 30 days are classified as food insecure.
9 All of these findings match those in the FoodAPS analysis of Todd and Scharadin (2016), which uses the same three SNAP participation categories as this ERS study.
8 The Association Between Nutrition Information Use and the Healthfulness of Food Acquisitions, ERR-247
USDA, Economic Research Service
Table 2 Balance test among FoodAPS primary respondents
SNAP Low-income
nonparticipantsHigher income nonparticipants
Diff. (1) - (2) Diff. (1) - (3) Diff. (2) - (3)
(1) (2) (3)
Age (years) 45.63 53.00 49.77 -7.37*** -4.14** 3.23*
Female (percentage) 73.32 66.67 66.93 6.64* 6.38* -0.26
High school diploma/ GED or less (percentage)
60.38 50.43 24.36 9.95*** 36.03*** 26.08***
Some college (percentage)
31.15 34.24 34.08 -3.08 -2.93 0.15
Bachelor’s degree (percentage)
7.29 10.87 25.69 -3.58 -18.40*** -14.82***
Graduate degree (percentage)
1.17 4.46 15.87 -3.29* -14.70*** -11.41***
Married (percentage) 23.36 29.85 52.55 -6.45 -29.18*** -22.69***
Employed (percentage)
30.51 35.81 65.53 -5.30 -35.02*** -29.72***
Hispanic (percentage) 24.87 18.87 9.11 6.00 15.76*** 9.76***
Non-Hispanic White (percentage)
43.78 59.82 75.78 -16.03*** -32.00*** -15.96***
Non-Hispanic Black (percentage)
25.99 15.95 7.94 10.03** 18.05*** 8.01***
Rural (percentage) 28.42 33.43 35.29 -5.01 -6.87 -1.86
Household size (number)
2.96 2.18 2.39 0.78*** 0.56*** -0.22*
Food insecure (percentage)
44.03 28.86 6.82 15.17*** 37.21*** 22.04***
GED = General Equivalency Diploma. SNAP = Supplemental Nutrition Assistance Program. * p<0.05. ** p<0.01. *** p<0.0001.Source: USDA, Economic Research Service calculations using 2012-13 data from USDA’s National Household Food Acquisition and Purchase Survey (FoodAPS). Survey weights were used to compute nationally representative estimates.
9 The Association Between Nutrition Information Use and the Healthfulness of Food Acquisitions, ERR-247
USDA, Economic Research Service
Food at Home
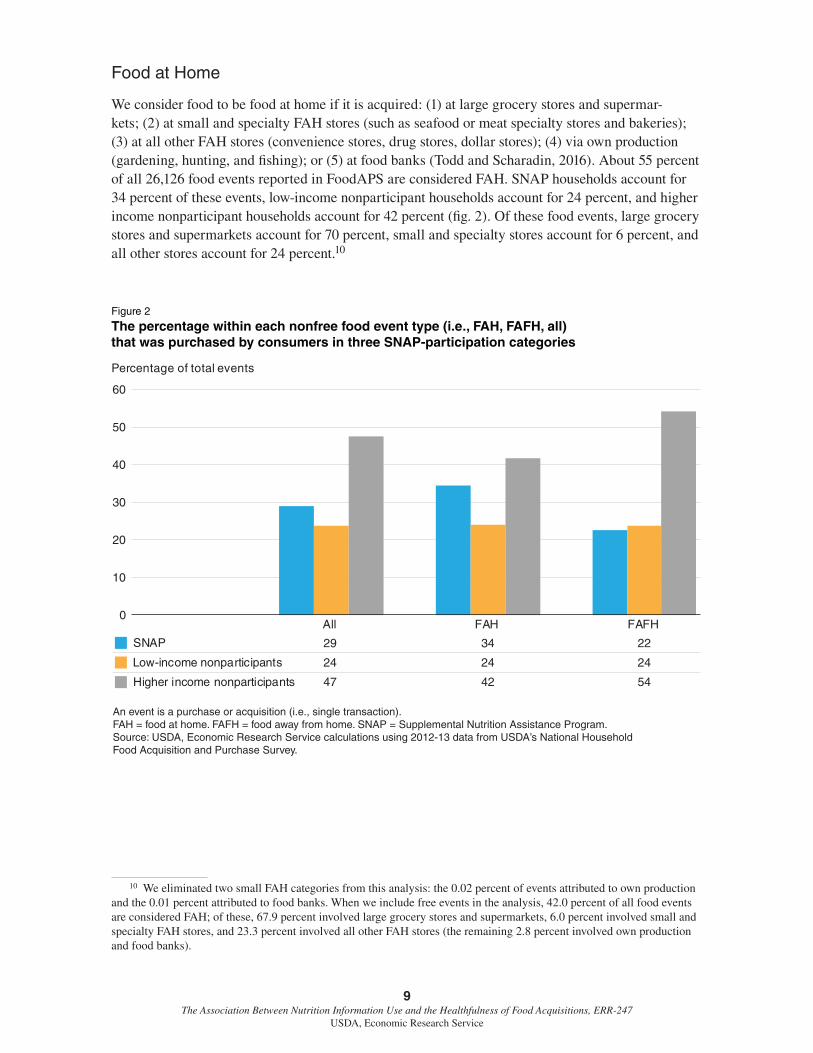
We consider food to be food at home if it is acquired: (1) at large grocery stores and supermar-kets; (2) at small and specialty FAH stores (such as seafood or meat specialty stores and bakeries); (3) at all other FAH stores (convenience stores, drug stores, dollar stores); (4) via own production (gardening, hunting, and fishing); or (5) at food banks (Todd and Scharadin, 2016). About 55 percent of all 26,126 food events reported in FoodAPS are considered FAH. SNAP households account for 34 percent of these events, low-income nonparticipant households account for 24 percent, and higher income nonparticipant households account for 42 percent (fig. 2). Of these food events, large grocery stores and supermarkets account for 70 percent, small and specialty stores account for 6 percent, and all other stores account for 24 percent.10
Figure 2
The percentage within each nonfree food event type (i.e., FAH, FAFH, all) that was purchased by consumers in three SNAP-participation categories
An event is a purchase or acquisition (i.e., single transaction). FAH = food at home. FAFH = food away from home. SNAP = Supplemental Nutrition Assistance Program.Source: USDA, Economic Research Service calculations using 2012-13 data from USDA’s National Household Food Acquisition and Purchase Survey.
0
10
20
30
40
50
60
All FAH FAFH
SNAP 29 34 22
Low-income nonparticipants 24 24 24
Higher income nonparticipants 47 42 54
Percentage of total events
10 We eliminated two small FAH categories from this analysis: the 0.02 percent of events attributed to own production and the 0.01 percent attributed to food banks. When we include free events in the analysis, 42.0 percent of all food events are considered FAH; of these, 67.9 percent involved large grocery stores and supermarkets, 6.0 percent involved small and specialty FAH stores, and 23.3 percent involved all other FAH stores (the remaining 2.8 percent involved own production and food banks).

10 The Association Between Nutrition Information Use and the Healthfulness of Food Acquisitions, ERR-247
USDA, Economic Research Service
Food Away From Home
We consider food to be food away from home if it was acquired (1) at restaurants and eating places; (2) at school, preschool, or after-school programs; (3) from friends, family, or places of worship; (4) at work; or (5) from Meals on Wheels (Todd and Scharadin, 2016). About 45 percent of all 26,126 nonfree food events reported in FoodAPS are considered FAFH. SNAP households account for 22 percent of these events, low-income nonparticipant households account for 24 percent, and higher income nonparticipant households account for 54 percent (fig. 2). Just under 90 percent of these events involved food acquisition at restaurants and eating places, and most of the remainder was evenly split between work and school. 11
Healthy Eating Index-2010 and Nutrient Densities
To assess nutritional quality, we use two different measures: (1) the 2010 Healthy Eating Index and its components and (2) nutrient density. Nutrient density is defined as the number of calories from saturated fat, added sugar, and sodium per 100 grams of food.
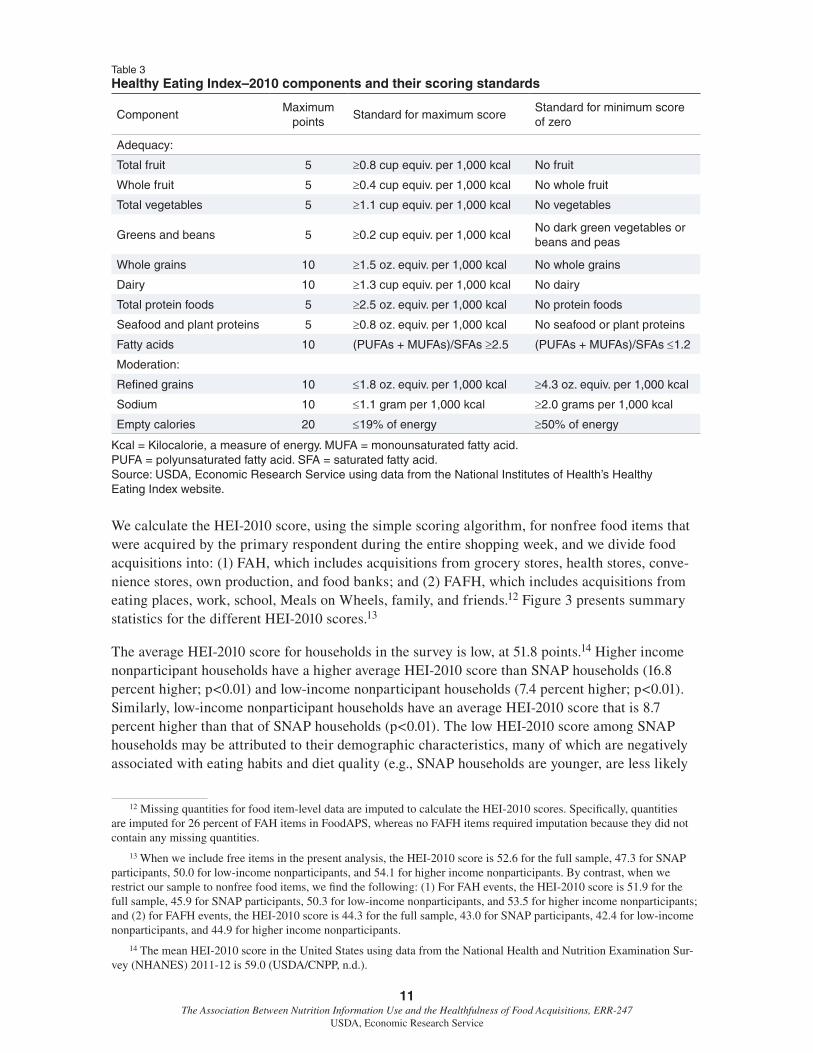
The HEI is a measure of diet quality that was developed by USDA’s Center for Nutrition Policy and Promotion (CNPP) and the HHS National Cancer Institute to measure a person’s conformance with the 2010 Dietary Guidelines for Americans. The HEI-2010 is a scoring metric that comprises 12 nutrient components that sum to a maximum total score of 100 (table 3). The index includes nine adequacy components (i.e., for food constituents or food groups that people should consume at least a certain amount of every day) and three moderation components (i.e., for food constituents or food groups that should be limited) (Guenther et al., 2014; Guenther et al., 2008).
11 We eliminated two small FAFH categories from this analysis: the 0.9 percent of events attributed to friends and fam-ily and the 0.07 percent attributed to Meals on Wheels. When we include free events in the analysis, 58 percent of all food events are considered FAFH; of these, 60.5 percent involved food acquired at restaurants and eating places, 16.1 percent involved school, 14.5 percent involved friends and family, and 8.7 percent involved work (the remaining 0.2 percent involved Meals on Wheels).
11 The Association Between Nutrition Information Use and the Healthfulness of Food Acquisitions, ERR-247
USDA, Economic Research Service
Table 3 Healthy Eating Index–2010 components and their scoring standards
ComponentMaximum
pointsStandard for maximum score
Standard for minimum score of zero
Adequacy:
Total fruit 5 ≥0.8 cup equiv. per 1,000 kcal No fruit
Whole fruit 5 ≥0.4 cup equiv. per 1,000 kcal No whole fruit
Total vegetables 5 ≥1.1 cup equiv. per 1,000 kcal No vegetables
Greens and beans 5 ≥0.2 cup equiv. per 1,000 kcalNo dark green vegetables or beans and peas
Whole grains 10 ≥1.5 oz. equiv. per 1,000 kcal No whole grains
Dairy 10 ≥1.3 cup equiv. per 1,000 kcal No dairy
Total protein foods 5 ≥2.5 oz. equiv. per 1,000 kcal No protein foods
Seafood and plant proteins 5 ≥0.8 oz. equiv. per 1,000 kcal No seafood or plant proteins
Fatty acids 10 (PUFAs + MUFAs)/SFAs ≥2.5 (PUFAs + MUFAs)/SFAs ≤1.2
Moderation:
Refined grains 10 ≤1.8 oz. equiv. per 1,000 kcal ≥4.3 oz. equiv. per 1,000 kcal
Sodium 10 ≤1.1 gram per 1,000 kcal ≥2.0 grams per 1,000 kcal
Empty calories 20 ≤19% of energy ≥50% of energy
Kcal = Kilocalorie, a measure of energy. MUFA = monounsaturated fatty acid. PUFA = polyunsaturated fatty acid. SFA = saturated fatty acid.Source: USDA, Economic Research Service using data from the National Institutes of Health’s Healthy Eating Index website.
We calculate the HEI-2010 score, using the simple scoring algorithm, for nonfree food items that were acquired by the primary respondent during the entire shopping week, and we divide food acquisitions into: (1) FAH, which includes acquisitions from grocery stores, health stores, conve-nience stores, own production, and food banks; and (2) FAFH, which includes acquisitions from eating places, work, school, Meals on Wheels, family, and friends.12 Figure 3 presents summary statistics for the different HEI-2010 scores.13
The average HEI-2010 score for households in the survey is low, at 51.8 points.14 Higher income nonparticipant households have a higher average HEI-2010 score than SNAP households (16.8 percent higher; p<0.01) and low-income nonparticipant households (7.4 percent higher; p<0.01). Similarly, low-income nonparticipant households have an average HEI-2010 score that is 8.7 percent higher than that of SNAP households (p<0.01). The low HEI-2010 score among SNAP households may be attributed to their demographic characteristics, many of which are negatively associated with eating habits and diet quality (e.g., SNAP households are younger, are less likely
12 Missing quantities for food item-level data are imputed to calculate the HEI-2010 scores. Specifically, quantities are imputed for 26 percent of FAH items in FoodAPS, whereas no FAFH items required imputation because they did not contain any missing quantities.
13 When we include free items in the present analysis, the HEI-2010 score is 52.6 for the full sample, 47.3 for SNAP participants, 50.0 for low-income nonparticipants, and 54.1 for higher income nonparticipants. By contrast, when we restrict our sample to nonfree food items, we find the following: (1) For FAH events, the HEI-2010 score is 51.9 for the full sample, 45.9 for SNAP participants, 50.3 for low-income nonparticipants, and 53.5 for higher income nonparticipants; and (2) for FAFH events, the HEI-2010 score is 44.3 for the full sample, 43.0 for SNAP participants, 42.4 for low-income nonparticipants, and 44.9 for higher income nonparticipants.
14 The mean HEI-2010 score in the United States using data from the National Health and Nutrition Examination Sur-vey (NHANES) 2011-12 is 59.0 (USDA/CNPP, n.d.).

12 The Association Between Nutrition Information Use and the Healthfulness of Food Acquisitions, ERR-247
USDA, Economic Research Service
to be non-Hispanic White, have less education, and live in larger households (Todd and Scharadin, 2016)). FAH acquisitions have a 21.2 percent higher HEI-2010 score than FAFH acquisitions, and this difference is statistically significant. This result corresponds with findings in the literature that people eat less healthfully away from home than at home (Lin and Guthrie, 2012; Mancino et al., 2009; Todd et al., 2010).
Interestingly, the HEI-2010 scores of total vegetables, total protein, fatty acid ratio, and empty calo-ries are higher for FAFH than for FAH (fig. 4). Scores for most other components are higher for FAH than for FAFH (all differences are statistically significant). We do not see a statistically signifi-cant difference for dairy and greens and beans.
Figure 3
Healthy Eating Index-2010 score by food event type and by SNAP participation
An event is a purchase or acquisition (i.e., single transaction). FAH = food at home. FAFH = food away from home. SNAP = Supplemental Nutrition Assistance Program.Source: USDA, Economic Research Service calculations using 2012-13 data from USDA’s National Household Food Acquisition and Purchase Survey.
HEI score
0
10
20
30
40
50
60
All FAH FAFHAll 51.8 51.6 42.6
SNAP 45.8 45.5 39.4
Low-income nonparticipants 49.8 49.7 40.5
Higher income nonparticipants 53.5 53.2 43.5

13 The Association Between Nutrition Information Use and the Healthfulness of Food Acquisitions, ERR-247
USDA, Economic Research Service
Figure 4
Healthy Eating Index-2010 component scores by food event type
HEI score
0
2
4
6
8
10
12
14
All FAH FAFHTotal fruit 2.11 2.32 0.54Whole fruit 2.38 2.56 0.54Total vegetables 2.94 2.64 3.17Greens and beans 1.85 1.53 1.55Whole grains 2.33 2.61 0.60Dairy 5.30 5.04 4.93Total protein 3.80 3.35 4.17Seafood and plant protein 2.04 1.89 1.34Fatty acid ratio 4.98 4.94 5.23Refined grains 6.01 6.63 3.37Sodium 6.48 6.86 4.83Empty calories 11.60 11.26 12.29
HEI = Healthy Eating Index. FAH = food at home. FAFH = food away from home.Source: USDA, Economic Research Service calculations using 2012-13 data from USDA’s National Household Food Acquisition and Purchase Survey. Survey weights were used to compute nationally representative estimates.
Nutrition information use
During the second FoodAPS interview, PRs answer several questions related to their nutrition knowledge and nutrition information use:
• Have you heard of MyPlate?
• Have you followed the MyPlate guidelines?
• Have you heard of MyPyramid?
• Have you heard of the Food Pyramid or the Food Guide Pyramid?
• Have you looked at the MyPyramid plan for a man/woman your age on the internet?15
15 This and the next question asked only about MyPyramid and not MyPlate because when the FoodAPS questionnaire was developed, MyPlate had only recently been released.

14 The Association Between Nutrition Information Use and the Healthfulness of Food Acquisitions, ERR-247
USDA, Economic Research Service
• Have you tried to follow the MyPyramid plan or the Pyramid plan recommendations for you?
• How often do you use the Nutrition Facts panel to help you decide which item to buy?
• In the past 2 months, have you searched the internet for nutrition information or information about how to shop for or prepare nutritious food and meals?
• In the past 2 months, have you participated in any events, lectures, or demonstrations about how to shop for or prepare nutritious food and meals?
We modified all of the variables so that a value of “1” indicates “yes,” and we combined some variables to account for valid skips.16 Given the redundancy and correlation of these variables, we use a principal component analysis (PCA)17 to construct two scores: (1) a factor score, which is a linear composite of the optimally weighted observed variables, and (2) a factor-based score for each component, which is a linear composite of the variables that demonstrated meaningful loadings for the component in question. Both the factor score and the factor-based score use the same variables; however, in the latter case, the observed variables are not multiplied by optimal weights before they are summed (O’Rourke et al., 2005). Both constructed variables will be used as dependent variables in different regression analyses. For a simplified analysis, we divide both the simple score and the factor score into three categories: low, medium, and high nutrition information use. (The cutoff points for these three categories were decided by dividing the factor-score and simple-score ranges into equal thirds.) According to the factor score (simple score), 39.3 (41.9) percent of the households have low nutrition information use, 47.7 (45.5) percent have medium nutrition information use, and 13.0 (12.6) percent have high nutrition information use. Figure 5 presents a histogram of the NIU’s factor score, which ranges from -2.3 to 3.9, with a mean of 0.2.18 The NIU is slightly skewed to the right, with almost half (48.3 percent) of participants presenting a negative score. Per construction, the values of NIU are not meaningful per se. Since in this analysis we want to look at the relation-ship between NIU and the healthfulness of food acquisitions, we care only about the ordinal ranking of NIU’s factor score.
16 For example, if a person had heard of MyPlate and followed its guidelines, we assigned a 2. If a person had heard of MyPlate but had not followed its guidelines, we assigned a 1. We assigned a zero if a person had not heard of MyPlate (in which case, the latter question was a valid skip).
17 A PCA can be defined as the sum of variables weighted such that the resulting components account for the maximal amount of variance in the dataset (Beaumont, 2012; O’Rourke et al., 2005) (see appendix for a description of the principal component analysis).
18 Higher income nonparticipant households have a higher NIU factor score with a mean equal to 0.35, while low-income nonparticipant households and SNAP households have a lower NIU factor score with a mean equal to -0.25 and -0.24, respectively.

15 The Association Between Nutrition Information Use and the Healthfulness of Food Acquisitions, ERR-247
USDA, Economic Research Service
0
2
4
6
8
10
12-2
.3
-1.8
-1.5
-1.2
-1.0
-0.8
-0.6
-0.4
-0.2 0
0.2
0.4
0.6
0.8
1.0
1.2
1.4
1.6
1.8
2.0
2.2
2.4
2.6
2.8
3.1
3.4
Percentage of households
NIU
Figure 5
Percentage distribution of households’ NIU factor scores—frequency
NIU = Nutrition Information Use index.Source: USDA, Economic Research Service calculations using 2012-13 data from USDA’s National Household Food Acquisition and Purchase. Survey weights were used to compute nationally representative estimates.
Other variables and controls
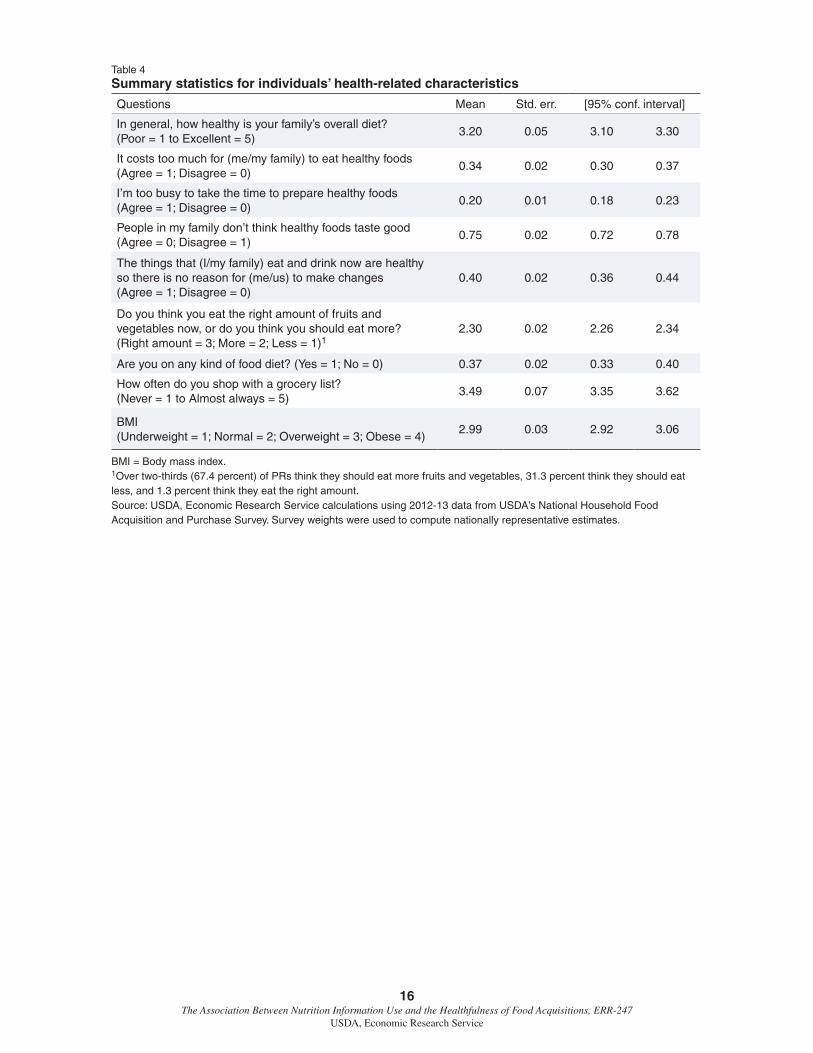
The regression analysis presented later in this report controls for a range of socioeconomic charac-teristics (see table 1) and other characteristics (see table 4). We control for many variables that may affect consumers’ food choices, such as use of a grocery list and self-perceived diet quality. About 34 percent of the PRs believe that it costs too much to eat healthful food, 20 percent are too busy to take the time to prepare healthful foods, and 37 percent are on a food diet of some kind (either to lose weight or for some other health-related reasons). On average, 75 percent of the sample does not think that healthful food tastes good.
16 The Association Between Nutrition Information Use and the Healthfulness of Food Acquisitions, ERR-247
USDA, Economic Research Service
Table 4 Summary statistics for individuals’ health-related characteristics
Questions Mean Std. err. [95% conf. interval]
In general, how healthy is your family’s overall diet? (Poor = 1 to Excellent = 5)
3.20 0.05 3.10 3.30
It costs too much for (me/my family) to eat healthy foods (Agree = 1; Disagree = 0)
0.34 0.02 0.30 0.37
I’m too busy to take the time to prepare healthy foods (Agree = 1; Disagree = 0)
0.20 0.01 0.18 0.23
People in my family don’t think healthy foods taste good (Agree = 0; Disagree = 1)
0.75 0.02 0.72 0.78
The things that (I/my family) eat and drink now are healthy so there is no reason for (me/us) to make changes (Agree = 1; Disagree = 0)
0.40 0.02 0.36 0.44
Do you think you eat the right amount of fruits and vegetables now, or do you think you should eat more? (Right amount = 3; More = 2; Less = 1)1
2.30 0.02 2.26 2.34
Are you on any kind of food diet? (Yes = 1; No = 0) 0.37 0.02 0.33 0.40
How often do you shop with a grocery list? (Never = 1 to Almost always = 5)
3.49 0.07 3.35 3.62
BMI (Underweight = 1; Normal = 2; Overweight = 3; Obese = 4)
2.99 0.03 2.92 3.06
BMI = Body mass index.1Over two-thirds (67.4 percent) of PRs think they should eat more fruits and vegetables, 31.3 percent think they should eat less, and 1.3 percent think they eat the right amount.Source: USDA, Economic Research Service calculations using 2012-13 data from USDA’s National Household Food Acquisition and Purchase Survey. Survey weights were used to compute nationally representative estimates.

17 The Association Between Nutrition Information Use and the Healthfulness of Food Acquisitions, ERR-247
USDA, Economic Research Service
Results
HEI-2010 scores vary across households with different levels of nutrition information use (fig. 6). Households with low nutrition information use have an average HEI-2010 score of 48.1, which is 10.6 percent lower than the score for households with medium nutrition information use (p<0.01).19 In turn, households with medium nutrition information use have an average HEI-2010 score of 53.8, which is 3.8 percent lower than the score for households with high nutrition information use, but this difference is not statistically significant.
This positive correlation between nutrition information use and HEI-2010 also holds for each of the three SNAP participation categories. Higher income nonparticipant households have a higher HEI-2010 score than low-income nonparticipant (7.4 percent higher, p<0.01) and SNAP households (16.8 percent higher, p<0.01). In turn, low-income nonparticipant households have an HEI-2010 score that is 8.7 percent higher than that of SNAP households (p<0.01). SNAP households have a lower HEI-2010 score than the other household types across all three levels of nutrition information use. However, we do not find any statistically significant difference in HEI-2010 scores between low-income nonparticipant households and higher income nonparticipant households across the three levels of nutrition information use.
HEI score
Figure 6
HEI-2010 score by level of nutrition information use and by SNAP participation
HEI = Healthy Eating Index. SNAP = Supplemental Nutrition Assistance Program.Source: USDA, Economic Research Service calculations using 2012-13 data from USDA’s National Household Food Acquisition and Purchase Survey. Survey weights were used to compute nationally representative estimates.
0
10
20
30
40
50
60
All SNAPLow-income
nonparticipantsHigher incomenonparticipants
All 51.8 45.8 49.8 53.5
Low 48.1 43.3 48.6 50.0
Medium 53.8 47.1 53.0 52.9
High 55.9 50.0 54.6 57.0
19 Consistent with previous literature (Guenther et al., 2014), we find mean HEI scores that are relatively low (e.g., in the 40s and 50s), indicating that the American diet falls well below the optimal score of 100.
18 The Association Between Nutrition Information Use and the Healthfulness of Food Acquisitions, ERR-247
USDA, Economic Research Service
To establish whether these correlations hold when controlling for different socioeconomic charac-teristics and making full use of the variability of households’ NIU index (by using the index as a continuous variable rather than the categorical version of the variable consisting of the categories “low,” “medium,” and “high”), we estimate the following equation:
(1) HEIi=β0+ β1NIUIi + β2Xi +єit
where HEIi is the HEI-2010 score of household i, NIUIi is the NIU index, and Xi is a series of socioeconomic variables described in table 1 and table 4.
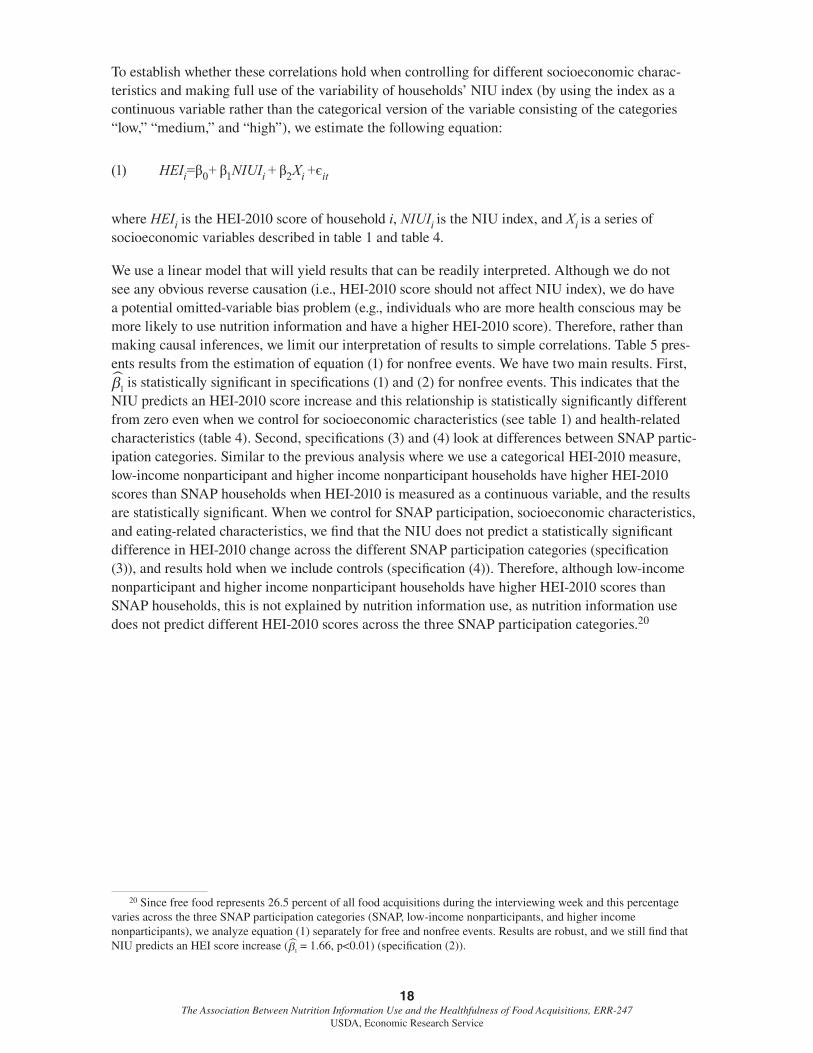
We use a linear model that will yield results that can be readily interpreted. Although we do not see any obvious reverse causation (i.e., HEI-2010 score should not affect NIU index), we do have a potential omitted-variable bias problem (e.g., individuals who are more health conscious may be more likely to use nutrition information and have a higher HEI-2010 score). Therefore, rather than making causal inferences, we limit our interpretation of results to simple correlations. Table 5 pres-ents results from the estimation of equation (1) for nonfree events. We have two main results. First,
is statistically significant in specifications (1) and (2) for nonfree events. This indicates that the NIU predicts an HEI-2010 score increase and this relationship is statistically significantly different from zero even when we control for socioeconomic characteristics (see table 1) and health-related characteristics (table 4). Second, specifications (3) and (4) look at differences between SNAP partic-ipation categories. Similar to the previous analysis where we use a categorical HEI-2010 measure, low-income nonparticipant and higher income nonparticipant households have higher HEI-2010 scores than SNAP households when HEI-2010 is measured as a continuous variable, and the results are statistically significant. When we control for SNAP participation, socioeconomic characteristics, and eating-related characteristics, we find that the NIU does not predict a statistically significant difference in HEI-2010 change across the different SNAP participation categories (specification (3)), and results hold when we include controls (specification (4)). Therefore, although low-income nonparticipant and higher income nonparticipant households have higher HEI-2010 scores than SNAP households, this is not explained by nutrition information use, as nutrition information use does not predict different HEI-2010 scores across the three SNAP participation categories.20
20 Since free food represents 26.5 percent of all food acquisitions during the interviewing week and this percentage varies across the three SNAP participation categories (SNAP, low-income nonparticipants, and higher income nonparticipants), we analyze equation (1) separately for free and nonfree events. Results are robust, and we still find that NIU predicts an HEI score increase ( = 1.66, p<0.01) (specification (2)).

19 The Association Between Nutrition Information Use and the Healthfulness of Food Acquisitions, ERR-247
USDA, Economic Research Service
Table 5 OLS regression: nutrition information use (NIU) predicting HEI-2010 score
HEI-2010 score—nonfree
(1) (2) (3) (4)
NIU2.54*** 1.62*** 2.24*** 1.75**
(0.35) (0.41) (0.63) (0.76)
Low-income nonparticipant HH- - 3.91*** 2.00
- - (1.21) (1.19)
Higher income nonparticipant HH- - 6.33*** 2.96**
- - (1.16) (1.35)
Low-income nonparticipant * NIU- - -0.21 -0.40
- - (0.78) (0.76)
Higher income nonparticipant * NIU- - 0.02 -0.17
- - (0.79) (0.81)
Constant51.39*** 48.04*** 46.34*** 45.59***
(0.54) (5.98) (0.81) (5.34)
Observations 4,583 4,523 4,583 4,523
R-squared 0.05 0.13 0.07 0.14
Controls No Yes No Yes
Models control for all of the variables listed in table 1 and table 4. Standard errors in parentheses.
*** p<0.01. ** p<0.05. * p<0.1. HH = household. Source: USDA, Economic Research Service calculations using 2012-13 data from USDA’s National Household Food Acquisition and Purchase Survey. Survey weights were used to compute nationally representative estimates.
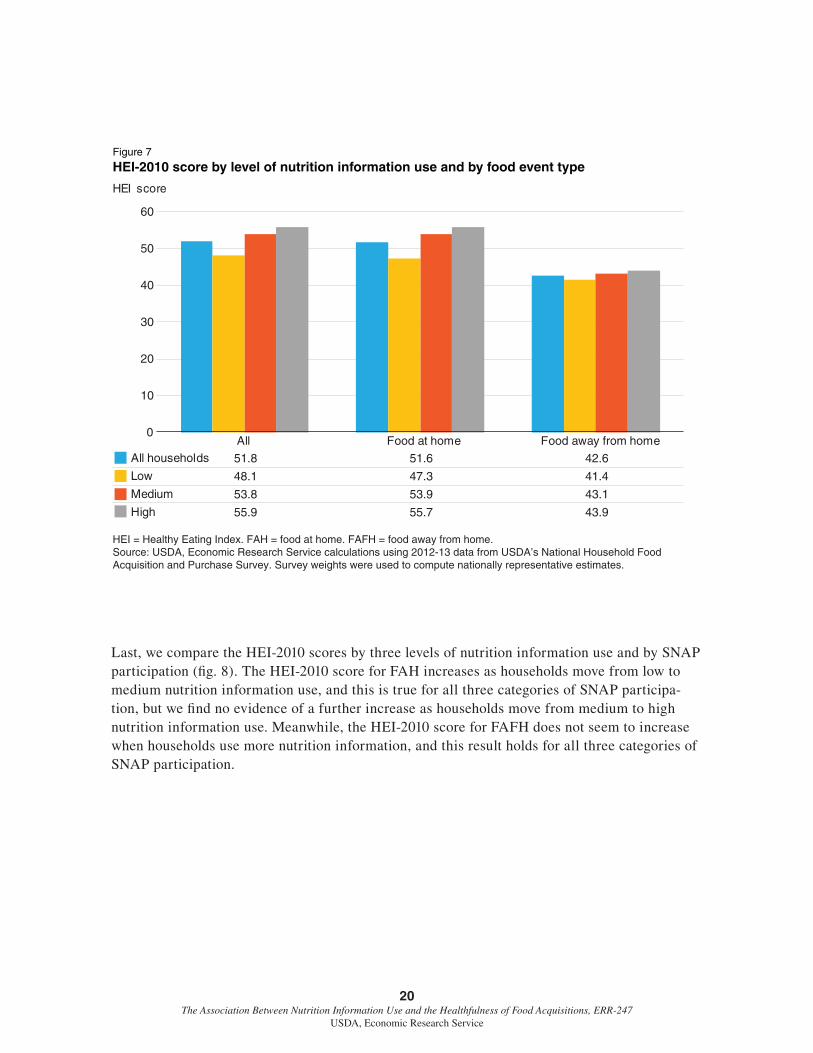
We also compare HEI-2010 scores by three levels of nutrition information use for FAH and FAFH events (fig. 7). Overall, the FAH HEI-2010 score is 51.6, which is 21.1 percent higher than the FAFH HEI-2010 score (p<0.01). This FAH-versus-FAFH HEI-2010 score difference is smaller for households with low nutrition information use (14.3 percentage points) and larger for households with medium and high nutrition information use (25.1 percentage points and 26.9 percentage points, respectively). Also, the FAH HEI-2010 score is 14.3 percent higher for households with medium nutrition information use than for households with low nutrition information use (p<0.01), whereas we do not find a statistically significant difference in the FAH HEI-2010 score between households with medium and high nutrition information use. Finally, when looking at FAFH HEI-2010 scores, we do not find a statistically significant difference between households by the level of nutrition information use.21
21 Results do not change when we include only food from restaurants and eating places as FAFH (i.e., excluding meals from schools, friends and family, work, and Meals on Wheels).
20 The Association Between Nutrition Information Use and the Healthfulness of Food Acquisitions, ERR-247
USDA, Economic Research Service
HEI score
Figure 7
HEI-2010 score by level of nutrition information use and by food event type
HEI = Healthy Eating Index. FAH = food at home. FAFH = food away from home.Source: USDA, Economic Research Service calculations using 2012-13 data from USDA’s National Household Food Acquisition and Purchase Survey. Survey weights were used to compute nationally representative estimates.
0
10
20
30
40
50
60
All Food at home Food away from homeAll households 51.8 51.6 42.6
Low 48.1 47.3 41.4
Medium 53.8 53.9 43.1
High 55.9 55.7 43.9
Last, we compare the HEI-2010 scores by three levels of nutrition information use and by SNAP participation (fig. 8). The HEI-2010 score for FAH increases as households move from low to medium nutrition information use, and this is true for all three categories of SNAP participa-tion, but we find no evidence of a further increase as households move from medium to high nutrition information use. Meanwhile, the HEI-2010 score for FAFH does not seem to increase when households use more nutrition information, and this result holds for all three categories of SNAP participation.

21 The Association Between Nutrition Information Use and the Healthfulness of Food Acquisitions, ERR-247
USDA, Economic Research Service
Figure 8
HEI-2010 score by level of nutrition information use and by SNAP participation, by food event type
HEI = Healthy Eating Index. FAH = food at home. FAFH = food away from home.SNAP = Supplemental Nutrition Assistance Program.Source: USDA, Economic Research Service calculations using 2012-13 data from USDA’s National Household Food Acquisition and Purchase Survey. Survey weights were used to compute nationally representative estimates.
0
10
20
30
40
50
60
All SNAPLow-income
nonparticipantsHigher incomenonparticipants
FAH - Low 47.3 42.8 46.5 49.2
FAH - Medium 53.9 48.5 53.6 54.7
FAH - High 55.7 49.8 52.8 56.8
FAFH - Low 41.4 39.9 39.9 42.3
FAFH - Medium 43.1 39.9 41.1 43.7
FAFH - High 43.9 36.2 41.3 45.1
HEI score
We also want to establish if these correlations hold when controlling for different socioeconomic characteristics and making full use of the variability of households’ Nutrition Information Use index again by using NIU as a continuous instead of a categorical variable (with categories “low,” “medium,” and “high”). We estimate the following two equations:
(2) HEIij = β0 + β1 NIUIi + β2FAHi + β3 NIUIi * FAHi + β4 Xi +єit
where HEIij is the HEI-2010 score of household i for event type j (i.e., j = 1 for FAH; j = 2 for FAFH), NIUIi is the Nutrition Information Use index, FAHi is equal to 1 for FAH and equal to 2 for FAFH, and Xi is a series of socioeconomic variables (see table 1) and health-related variables (see table 4).22
22 As mentioned in equation (1), we do have a potential omitted-variable bias problem. Therefore, rather than making causal inferences, we limit our interpretation of results to simple correlations.
22 The Association Between Nutrition Information Use and the Healthfulness of Food Acquisitions, ERR-247
USDA, Economic Research Service
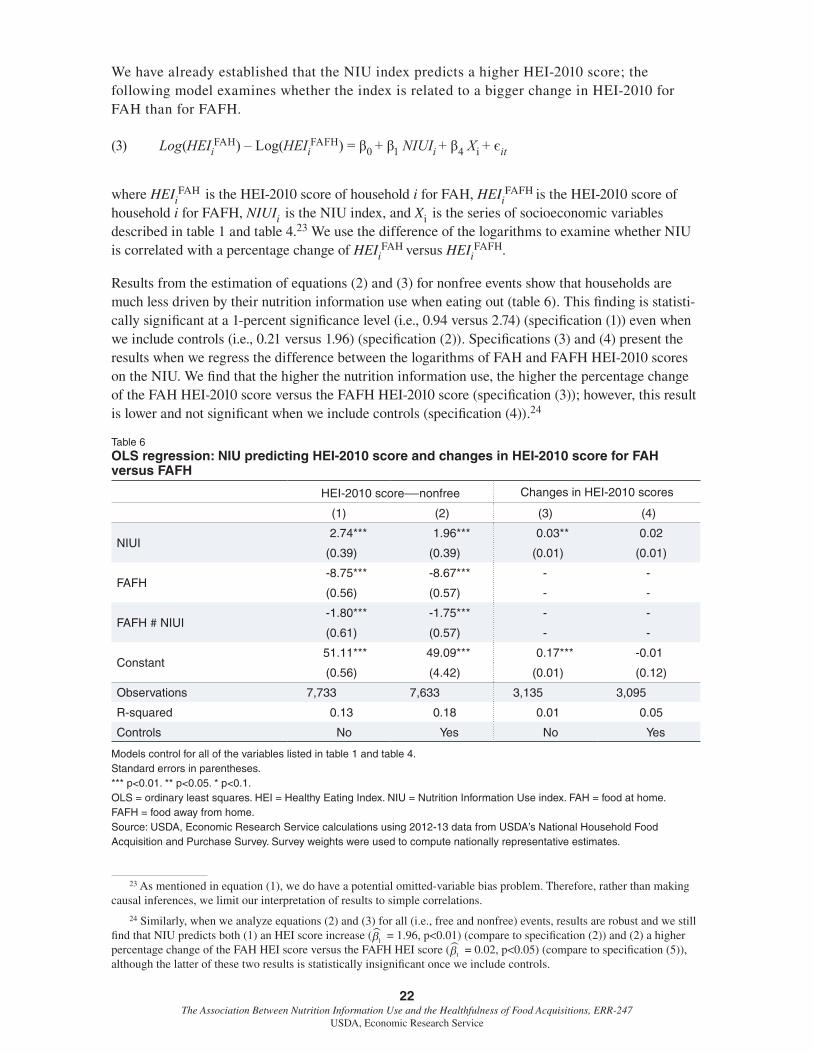
We have already established that the NIU index predicts a higher HEI-2010 score; the following model examines whether the index is related to a bigger change in HEI-2010 for FAH than for FAFH.
(3) Log(HEIiFAH) – Log(HEIi
FAFH) = β0 + β1 NIUIi + β4 Xi + єit
where HEIiFAH is the HEI-2010 score of household i for FAH, HEIi
FAFH is the HEI-2010 score of household i for FAFH, NIUIi is the NIU index, and Xi is the series of socioeconomic variables described in table 1 and table 4.23 We use the difference of the logarithms to examine whether NIU is correlated with a percentage change of HEIi
FAH versus HEIiFAFH.
Results from the estimation of equations (2) and (3) for nonfree events show that households are much less driven by their nutrition information use when eating out (table 6). This finding is statisti-cally significant at a 1-percent significance level (i.e., 0.94 versus 2.74) (specification (1)) even when we include controls (i.e., 0.21 versus 1.96) (specification (2)). Specifications (3) and (4) present the results when we regress the difference between the logarithms of FAH and FAFH HEI-2010 scores on the NIU. We find that the higher the nutrition information use, the higher the percentage change of the FAH HEI-2010 score versus the FAFH HEI-2010 score (specification (3)); however, this result is lower and not significant when we include controls (specification (4)).24
Table 6 OLS regression: NIU predicting HEI-2010 score and changes in HEI-2010 score for FAH versus FAFH
HEI-2010 score—nonfree Changes in HEI-2010 scores
(1) (2) (3) (4)
NIUI2.74*** 1.96*** 0.03** 0.02
(0.39) (0.39) (0.01) (0.01)
FAFH-8.75*** -8.67*** - -
(0.56) (0.57) - -
FAFH # NIUI-1.80*** -1.75*** - -
(0.61) (0.57) - -
Constant51.11*** 49.09*** 0.17*** -0.01
(0.56) (4.42) (0.01) (0.12)
Observations 7,733 7,633 3,135 3,095
R-squared 0.13 0.18 0.01 0.05
Controls No Yes No Yes
Models control for all of the variables listed in table 1 and table 4.Standard errors in parentheses.*** p<0.01. ** p<0.05. * p<0.1.OLS = ordinary least squares. HEI = Healthy Eating Index. NIU = Nutrition Information Use index. FAH = food at home. FAFH = food away from home.Source: USDA, Economic Research Service calculations using 2012-13 data from USDA’s National Household Food Acquisition and Purchase Survey. Survey weights were used to compute nationally representative estimates.
23 As mentioned in equation (1), we do have a potential omitted-variable bias problem. Therefore, rather than making causal inferences, we limit our interpretation of results to simple correlations.
24 Similarly, when we analyze equations (2) and (3) for all (i.e., free and nonfree) events, results are robust and we still find that NIU predicts both (1) an HEI score increase ( = 1.96, p<0.01) (compare to specification (2)) and (2) a higher percentage change of the FAH HEI score versus the FAFH HEI score ( = 0.02, p<0.05) (compare to specification (5)), although the latter of these two results is statistically insignificant once we include controls.
23 The Association Between Nutrition Information Use and the Healthfulness of Food Acquisitions, ERR-247
USDA, Economic Research Service
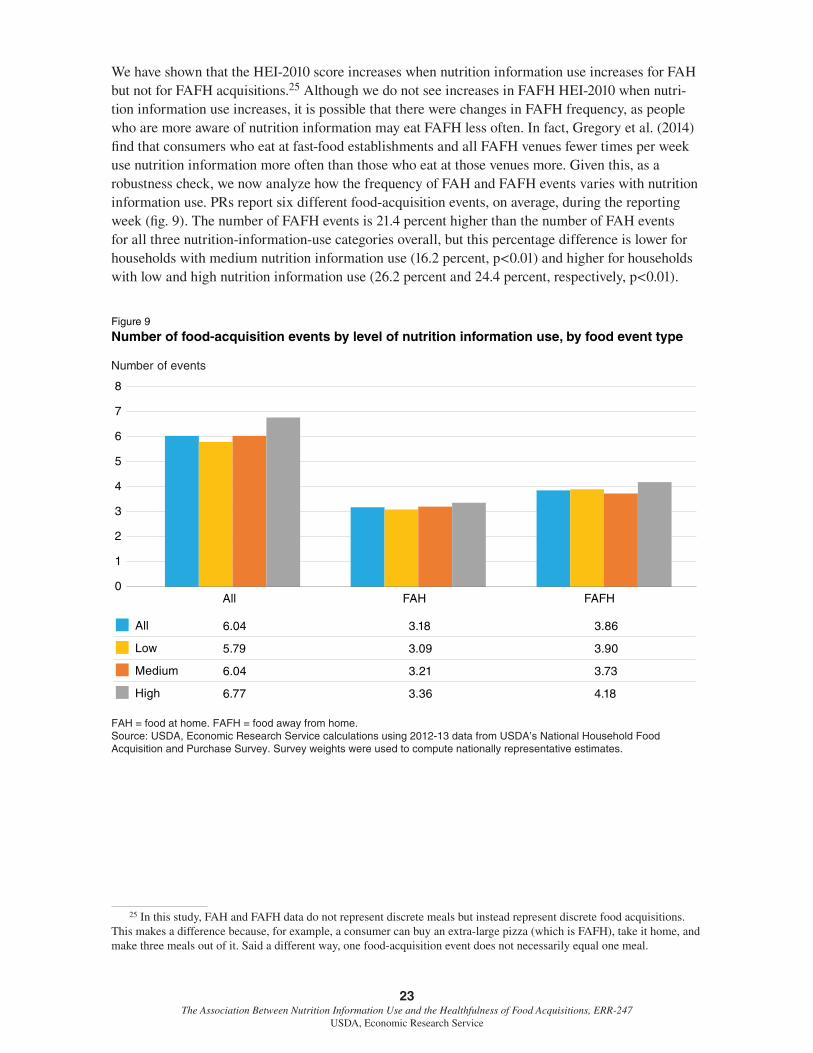
We have shown that the HEI-2010 score increases when nutrition information use increases for FAH but not for FAFH acquisitions.25 Although we do not see increases in FAFH HEI-2010 when nutri-tion information use increases, it is possible that there were changes in FAFH frequency, as people who are more aware of nutrition information may eat FAFH less often. In fact, Gregory et al. (2014) find that consumers who eat at fast-food establishments and all FAFH venues fewer times per week use nutrition information more often than those who eat at those venues more. Given this, as a robustness check, we now analyze how the frequency of FAH and FAFH events varies with nutrition information use. PRs report six different food-acquisition events, on average, during the reporting week (fig. 9). The number of FAFH events is 21.4 percent higher than the number of FAH events for all three nutrition-information-use categories overall, but this percentage difference is lower for households with medium nutrition information use (16.2 percent, p<0.01) and higher for households with low and high nutrition information use (26.2 percent and 24.4 percent, respectively, p<0.01).
Figure 9
Number of food-acquisition events by level of nutrition information use, by food event type
FAH = food at home. FAFH = food away from home.Source: USDA, Economic Research Service calculations using 2012-13 data from USDA’s National Household Food Acquisition and Purchase Survey. Survey weights were used to compute nationally representative estimates.
Number of events
0
1
2
3
4
5
6
7
8
All FAH FAFH
All 6.04 3.18 3.86
Low 5.79 3.09 3.90
Medium 6.04 3.21 3.73
High 6.77 3.36 4.18
25 In this study, FAH and FAFH data do not represent discrete meals but instead represent discrete food acquisitions. This makes a difference because, for example, a consumer can buy an extra-large pizza (which is FAFH), take it home, and make three meals out of it. Said a different way, one food-acquisition event does not necessarily equal one meal.

24 The Association Between Nutrition Information Use and the Healthfulness of Food Acquisitions, ERR-247
USDA, Economic Research Service
When viewed by SNAP participation, only in the case of higher income nonparticipant households does the frequency of FAH events increase with greater nutrition information use (fig. 10). The frequency of FAFH events increases with greater nutrition information use only in the case of SNAP participants.
Figure 10
Number of food-acquisition events by level of nutrition information use and by SNAP participation, for FAH and FAFH
SNAP = Supplemental Nutrition Assistance Program. FAH = food at home. FAFH = food away from home.Source: USDA, Economic Research Service calculations using 2012-13 data from USDA’s National Household Food Acquisition and Purchase Survey. Survey weights were used to compute nationally representative estimates.
Number of events
0.0
0.5
1.0
1.5
2.0
2.5
3.0
3.5
4.0
4.5
5.0
All SNAPLow-income
nonparticipantsHigher incomenonparticipants
FAH - Low 3.09 3.27 2.98 3.08
FAH - Medium 3.21 3.61 3.10 3.17
FAH - High 3.36 3.50 2.98 3.40
FAFH - Low 3.90 2.87 3.31 4.37
FAFH - Medium 3.73 2.90 3.09 3.90
FAFH - High 4.18 2.98 3.01 4.45

25 The Association Between Nutrition Information Use and the Healthfulness of Food Acquisitions, ERR-247
USDA, Economic Research Service
Discussion
In this study, we take a novel approach by summarizing both consumers’ reported dietary knowl-edge and nutrition information use in a single metric that we call the Nutrition Information Use index. Our key findings are:
1. The NIU predicts healthful food acquisitions for consumers. Although HEI-2010 scores in general are low for FoodAPS households, HEI-2010 scores for households with a low NIU are 7.8 percentage points less than those for households with a high NIU. To date, few studies look at the relationship between HEI-2010 score and health outcomes. For instance, Reedy et al. (2014) compare individuals with HEI-2010 scores in the lowest and highest quintile and find that a higher HEI-2010 score is correlated with a reduced risk of all-cause, cardiovascular disease, and cancer mortality for men and women. However, more research is needed to determine whether smaller differences in HEI-2010 are associated with and have an impact on health outcomes.
2. When food acquisitions are disaggregated into food at home and food away from home:
• Thenutritionalqualityoffoodathomeishigherthanthatoffoodawayfromhome,creating a “healthfulness gap” between FAH and FAFH;
• Thishealthfulnessgapincreaseswithnutritioninformationuse.Thisfindingisconsistent with an indulgence effect wherein consumers’ food-at-home acquisitions are more healthful than food-away-from-home acquisitions; and
• Thereasonthehealthfulnessgapincreaseswithnutritioninformationuseisthatthe nutritional quality of food-at-home acquisitions indeed grows with nutrition information use while the nutritional quality of food-away-from-home acquisi-tions remains constant. An exception is found for the higher income nonparticipant households, for whom the nutritional quality of food-away-from-home acquisi-tions does increase with nutrition information use. However, this increase is not enough to erase the widening of the healthfulness gap as nutrition information use increases (see figure 8).
Although, in general, HEI-2010 scores are low, these findings suggest that nutrition information use might be making a difference in people’s FAH diets; however, the same cannot be said for the effect of nutrition information on FAFH consumption. Consistent with these findings is research by Jones (2010), which looks at consumer food choices at restaurants. In that study, many participants in a focus group report that they like to order tasty foods at restaurants. One participant stated that she felt it was okay to indulge at restaurants and that from a menu with 11 items, she would order either a T-bone steak or chicken alfredo pasta, even when told that 6 other items were lower in calories. However, because the steak had fewer calories than the chicken alfredo pasta, she would choose the steak. Another explanation for the healthfulness gap between consumers’ FAH and FAFH acquisi-tions may be that consumers are eating out at establishments that do not have nutrition information available; in this case, consumers would not be ignoring nutrition information that is available but instead would have no way of accessing nutrition information in the first place. Further research is needed to better understand the reasons for this healthfulness gap.

26 The Association Between Nutrition Information Use and the Healthfulness of Food Acquisitions, ERR-247
USDA, Economic Research Service
Gregory et al. (2010) provides a counterpoint to our finding that the NIU is not correlated with more healthful FAFH acquisitions. That study uses data from the Centers for Disease Control and Prevention’s National Health and Nutrition Examination Survey and finds a positive correlation between using nutrition information when deciding what to eat at an FAFH venue and better diet quality (in terms of HEI-2010, and saturated fat and sugar intake). What accounts for the discrep-ancy in findings from the two studies? For one, the studies measure nutrition information use very differently: This ERS study uses a nutrition index constructed from eight different FoodAPS ques-tions, none of which ask specifically about consumer use of FAFH nutrition information. Gregory et al. (2010) asks about nutrition information use during an FAFH acquisition (i.e., the last time the consumer ate out or bought food from an FAFH venue). Thus, perhaps asking FoodAPS respon-dents about their nutrition information use at FAFH venues specifically rather than generally might yield a positive correlation between FAFH nutrition information use and FAFH HEI-2010. However, FoodAPS does not ask respondents about their FAFH nutrition information use, so we were not able to investigate this issue empirically.
Consumers do care about nutrition, but they care about other attributes of their food as well. For example, Glanz et al. (1998) asked 2,967 people to rate the level of importance they place on the different characteristics of food using a scale of 1 (not at all important) to 5 (very important). On average, respondents placed the most importance on taste (4.7). The next highest ratings were cost (4.1), nutrition (3.9), convenience (3.8), and weight control (3.4). Although access to nutrition infor-mation in food-at-home settings may enable consumers to act more effectively on their desire for healthful diets, there may be a disconnect when it comes to food-away-from-home settings.
27 The Association Between Nutrition Information Use and the Healthfulness of Food Acquisitions, ERR-247
USDA, Economic Research Service
References
Beaumont, R. 2012. An Introduction to Principal Component Analysis & Factor Analysis Using SPSS 19 and R (Psych Package).
Britten, P., K. Marcoe, S. Yamini, and C. Davis 2006. “Development of Food Intake Patterns for the MyPyramid Food Guidance System,” Journal of Nutrition Education and Behavior 38(6): S78–S92.
Clay, D.M., M. Ver Ploeg, A. Coleman-Jensen, H. Elitzak, C. Gregory, D. Levin, C. Newman, and M.P. Rabbit. Comparing National Food Acquisition and Purchase Survey (FoodAPS) Data With Other National Food Surveys’ Data, EIB-157, U.S. Department of Agriculture, Economic Research Service.
Cunningham, P.J. 2009. Chronic Burdens: “The Persistently High Out-of-Pocket Health Care Expenses Faced by Many Americans With Chronic Conditions,” Issue Brief 63, The Commonwealth Fund.
Deb, P., and C. Vargas. 2016. “Who Benefits From Calorie Labeling? An Analysis of Its Effects on Body Mass,” NBER Working Paper No. 21992, National Bureau of Economic Research.
DeSalvo, K.B., R. Olson, and K.O. Casavale 2016. “Dietary Guidelines for Americans,” JAMA 315(5): 457-458.
Duston, D. 1992. “Food Guide Pyramid Is Built on a Base of Grains,” The Associated Press, Bowling Green Daily News, April 29.
Glanz, K., M. Basil, E. Maibach, J. Goldberg, and D. Snyder 1998. “Why Americans Eat What They Do: Taste, Nutrition, Cost, Convenience, and Weight Control Concerns as Influences on Food Consumption,” Journal of the American Dietetic Association 98(10): 1118–1126.
Gregory, C.A., I. Rahkovsky, and T. Anekwe. 2014. Consumers’ Use of Nutrition Information When Eating Out, EIB-127, U.S. Department of Agriculture, Economic Research Service.
Guenther, P.M., J. Reedy, and S.M. Krebs-Smith 2008. “Development of the Healthy Eating Index-2005,” Journal of the American Dietetic Association 108(11): 1896–1901.
Guenther, P.M., K.O. Casavale, J. Reedy, S.I. Kirkpatrick, H.A. Hiza, K.J. Kuczynski, L.L. Kahle, S.M. Krebs-Smith. 2013. “Update of the Healthy Eating Index: HEI-2010,” Journal of the Academy of Nutrition and Dietetics 113(4): 569–580.
Guenther, P.M., K.W. Dodd, J. Reedy, and S.M. Krebs-Smith 2006. “Most Americans Eat Much Less Than Recommended Amounts of Fruits and Vegetables,” Journal of the American Dietetic Association 106(9): 1371–1379.
Guenther, P.M., S.I. Kirkpatrick, J. Reedy, S.M. Krebs-Smith, D.W. Buckman, K.W. Dodd, K.O Casavale, and R.J. Carroll. 2014. “The Healthy Eating Index-2010 Is a Valid and Reliable Measure of Diet Quality According to the 2010 Dietary Guidelines for Americans,” The Journal of Nutrition 144(3): 399–407.

28 The Association Between Nutrition Information Use and the Healthfulness of Food Acquisitions, ERR-247
USDA, Economic Research Service
Guthrie, J.F., J.J. Fox, L.E. Cleveland, and S. Welsh. 1995. “Who Uses Nutrition Labeling, and What Effects Does Label Use Have on Diet Quality?” Journal of Nutrition Education 27(4): 163–172.
Institute for Health Metrics and Evaluation (IHME). 2015. “Global Burden of Disease.” Accessed from the IHME website.
Institute of Medicine (IOM). 2012. Front-of-Package Nutrition Rating Systems and Symbols: Promoting Healthier Choices, E.A. Wartella, A.H. Lichtenstein, A. Yaktine, and R. Nathan (eds.). Washington, DC: National Academies Press.
Janssen, W. 1981. “The Story of the Laws Behind the Labels,” U.S. Food and Drug Administration.
Jones, C.S. 2010. “Encouraging Healthy Eating at Restaurants: More Themes Uncovered Through Focus Group Research,” Services Marketing Quarterly 31(4): 448–465.
Kim, S.-Y., R.M. Nayga Jr, and O. Capps Jr. 2000. “The Effect of Food Label Use on Nutrient Intakes: An Endogenous Switching Regression Analysis,” Journal of Agricultural and Resource Economics 25(1): 215–231.
Kiszko, K.M., O.D. Martinez, C. Abrams, and B. Elbel. 2014. “The Influence of Calorie Labeling on Food Orders and Consumption: A Review of the Literature,” Journal of Community Health 39(6): 1248–1269.
Kochanek, K.D., S.L. Murphy, J. Xu, and B. Tejada-Vera. 2016. “Deaths: Final Data for 2014,” National Vital Statistics Reports, Volume 65, Number 4, U.S. Department of Health and Human Services, Centers for Disease Control and Prevention, National Center for Health Statistics, National Vital Statistics System.
Kreuter, M.W., L.K. Brennan, D.P. Scharff, and S.N. Lukwago. 1997. “Do Nutrition Label Readers Eat Healthier Diets? Behavioral Correlates of Adults’ Use of Food Labels,” American Journal of Preventive Medicine 13(4): 277–283.
Levine, E., J. Abbatangelo-Gray, A.R. Mobley, G.R. McLaughlin, and J. Herzog. 2012. “Evaluating MyPlate: An Expanded Framework Using Traditional and Nontraditional Metrics for Assessing Health Communication Campaigns,” Journal of Nutrition Education and Behavior 44(4): S2–S12.
Lin, B.-H., and J. Guthrie. 2012. Nutritional Quality of Food Prepared at Home and Away From Home, 1977–2008, EIB-105, U.S. Department of Agriculture, Economic Research Service.
Mancino, L., J. Todd, and B.-H. Lin. 2009. “Separating What We Eat Fom Where: Measuring the Effect of Food Away Fom Home on Diet Quality,” Food Policy 34(6): 557–562.
Mokdad, A.H., J.S. Marks, D.F. Stroup, and J.L. Gerberding. 2004. “Actual Causes of Death in the United States, 2000,” JAMA 291(10): 1238–1245.
MyPlate. n.d. Choose MyPlate. Accessed from the Choose MyPlate website.
O’Rourke, N., L. Hatcher, and E.J. Stepanski. 2005. “A Step-by-Step Approach to Using SAS for Univariate & Multivariate Statistics,” Cary, NC: SAS Institute.

29 The Association Between Nutrition Information Use and the Healthfulness of Food Acquisitions, ERR-247
USDA, Economic Research Service
Petty, R.E., P. Briñol, and Z.L. Tormala. 2002. “Thought Confidence as a Determinant of Persuasion: The Self-Validation Hypothesis,” Journal of Personality and Social Psychology 82(5): 722–741.
Reedy, J., S.M. Krebs-Smith, P.E. Miller, A.D. Liese, L.L. Kahle, Y. Park, and A.F. Subar. 2014. “Higher Diet Quality Is Associated With Decreased Risk of All-Cause, Cardiovascular Disease, and Cancer Mortality Among Older Adults,” The Journal of Nutrition 144(6): 881–889.
Restrepo, B.J. 2016. “Calorie Labeling in Chain Restaurants and Body Weight: Evidence From New York,” Health Economics 26(10):1191–1209.
Schoenberg, N.E., H. Kim, W. Edwards, and S.T. Fleming. 2007. “Burden of Common Multiple-Morbidity Constellations on Out-of-Pocket Medical Expenditures Among Older Adults,” The Gerontologist 47(4): 423–437.
Serdula, M.K., C. Gillespie, L. Kettel-Khan, R. Farris, J. Seymour, and C. Denny. 2004. “Trends in Fruit and Vegetable Consumption Among Adults in the United States: Behavioral Risk Factor Surveillance System, 1994–2000,” American Journal of Public Health 94(6): 1014–1018.
Taylor, C.L., and V.L. Wilkening 2008. “How the Nutrition Food Label Was Developed, Part 2: The Purpose and Promise of Nutrition Claims,” Journal of the American Dietetic Association 108(4): 618–623.
Todd, J., and B. Scharadin. 2016. Where Households Get Food in a Typical Week: Findings From USDA’s FoodAPS, EIB-156, U.S. Department of Agriculture, Economic Research Service.
Todd, J., and J. Variyam. 2008. The Decline in Consumer Use of Food Nutrition Labels, 1995–2006, ERR-63, U.S. Department of Agriculture, Economic Research Service.
Todd, J., L. Mancino, and B.-H. Lin. 2010. The Impact of Food Away from Home on Adult Diet Quality. ERR-90. U.S. Department of Agriculture, Economic Research Service.
U.S. Department of Agriculture (USDA). n.d. “Choose MyPlate.gov.”
U.S. Department of Agriculture, Center for Nutrition Policy and Promotion (USDA/CNPP) and U.S. Department of Health and Human Services. n.d. Healthy Eating Index, Accessed on the CNPP website.
U.S. Department of Agriculture, Center for Nutrition Policy and Promotion (USDA/CNPP). n.d. MyPyramid, Accessed from the USDA website.
U.S. Department of Agriculture, Economic Research Service (USDA/ERS). 2016. “Food Expenditures,” Data series accessed on the ERS website.
U.S. Food and Drug Administration (FDA). 2017. “Menu Labeling Requirements,” Accessed from the FDA website.
Variyam, J.N. 2008. “Do Nutrition Labels Improve Dietary Outcomes?” Health Economics 17(6): 695–708.

30 The Association Between Nutrition Information Use and the Healthfulness of Food Acquisitions, ERR-247
USDA, Economic Research Service
Vogeli, C., A.E. Shields, T.A. Lee, T.B. Gibson, W.D. Marder, K.B. Weiss, and D. Blumenthal. 2007. “Multiple Chronic Conditions: Prevalence, Health Consequences, and Implications for Quality, Care Management, and Costs,” Journal of General Internal Medicine 22(3): 391–395.
Wright, J., J. Kennedy-Stephenson, C. Wang, M. McDowell, and C. Johnson. 2004. “Trends in Intake of Energy and Macronutrients—United States, 1971–2000,” JAMA 291(10): 1193.
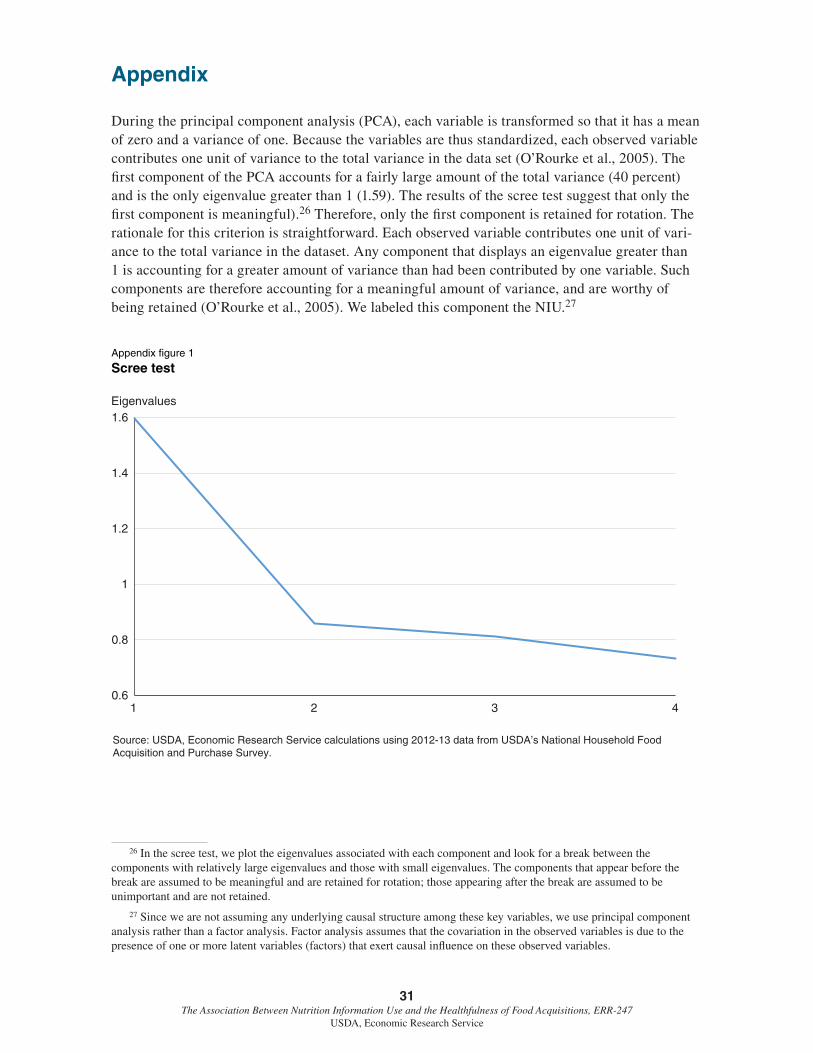
31 The Association Between Nutrition Information Use and the Healthfulness of Food Acquisitions, ERR-247
USDA, Economic Research Service
Appendix
During the principal component analysis (PCA), each variable is transformed so that it has a mean of zero and a variance of one. Because the variables are thus standardized, each observed variable contributes one unit of variance to the total variance in the data set (O’Rourke et al., 2005). The first component of the PCA accounts for a fairly large amount of the total variance (40 percent) and is the only eigenvalue greater than 1 (1.59). The results of the scree test suggest that only the first component is meaningful).26 Therefore, only the first component is retained for rotation. The rationale for this criterion is straightforward. Each observed variable contributes one unit of vari-ance to the total variance in the dataset. Any component that displays an eigenvalue greater than 1 is accounting for a greater amount of variance than had been contributed by one variable. Such components are therefore accounting for a meaningful amount of variance, and are worthy of being retained (O’Rourke et al., 2005). We labeled this component the NIU.27
Appendix figure 1
Scree test
Source: USDA, Economic Research Service calculations using 2012-13 data from USDA’s National Household Food Acquisition and Purchase Survey.
Eigenvalues
0.6
0.8
1
1.2
1.4
1.6
1 2 3 4
26 In the scree test, we plot the eigenvalues associated with each component and look for a break between the components with relatively large eigenvalues and those with small eigenvalues. The components that appear before the break are assumed to be meaningful and are retained for rotation; those appearing after the break are assumed to be unimportant and are not retained.
27 Since we are not assuming any underlying causal structure among these key variables, we use principal component analysis rather than a factor analysis. Factor analysis assumes that the covariation in the observed variables is due to the presence of one or more latent variables (factors) that exert causal influence on these observed variables.

32 The Association Between Nutrition Information Use and the Healthfulness of Food Acquisitions, ERR-247
USDA, Economic Research Service
To construct the NIU, we took nine FoodAPS questions about nutrition knowledge and nutri-tion information use, condensed them into five variables, and then used a principal components analysis to summarize these five variables into a single component. In interpreting the rotated factor pattern (see appendix table 1), we considered items to be loaded on a given component if the factor loading was 0.40 or greater for that component (Beaumont, 2012; O’Rourke et al., 2005). One variable—related to participating in events, lectures, or demonstrations about how to shop for or prepare nutritious food and meals—was eliminated from the analysis because its factor loading was less than 0.40.
In an orthogonal analysis such as this one, factor loadings are equivalent to bivariate correlations between the observed variables and the components. Therefore, the correlation between the first component and variable 1 is 0.4473, 0.4678 for the second variable, 0.5364 for the third variable, and 0.5416 for the last variable.
Our component satisfies the following requirements: It has more than three variables with significant loadings, the variables that load on the first component share the same conceptual meaning, and no variables load on more than one component. Finally, the rotated pattern demonstrates a simple struc-ture, which means that the pattern possesses two characteristics: (1) most of the variables have rela-tively high factor loadings on only one component, and near-zero loadings on the other components, and (2) most components have relatively high factor loadings for some variables, and near-zero load-ings for the remaining variables (O’Rourke et al., 2005). In this case, all four final variables have high loadings in the only component that we keep.
Appendix table 1 Rotated factor loadings from PCA
Variable Questions Loadings
MyPlate
1. Have you heard of MyPlate?
0.44732. Have you followed the MyPlate guidelines?
Yes 1 and 2 = 2; Yes 1 = 1; No all = 0
MyPyramid
1. Have you heard of MyPyramid?
0.4678
2. Have you heard of the food pyramid of the food guide pyramid?
3. Have you looked at MyPyramid plan for a man/woman your age on the internet?
4. Have you tried to follow the MyPyramid plan of the Pyramid plan recommendations for you?
Yes 1 or 2, 3, and 4 = 3; Yes 1 or 2 and 3 = 2; Yes 1 or 2 = 1; No all = 0
NFLHow often do you use the Nutrition Facts panel to help you decide which item to buy? 0.5364Never = 1; All the time = 6
Nutrition information search
In the past 2 months, have you searched the internet for nutritional information or information about how to shop for or prepare nutritious food and meals? 0.5416
Yes = 1; No = 0
PCA = principal component analysis. NFL = Nutrition Facts label. Source: USDA, Economic Research Service calculations using 2012-13 data from USDA’s National Household Food Acquisition and Purchase Survey.Survey weights were used to compute nationally representative estimates.