the arab league: export earnings and economic …file.scirp.org/pdf/me_2017042714041555.pdf · the...
TRANSCRIPT

Modern Economy, 2017, 8, 604-641 http://www.scirp.org/journal/me
ISSN Online: 2152-7261 ISSN Print: 2152-7245
DOI: 10.4236/me.2017.84045 April 27, 2017
The Arab League: Export Earnings and Economic Development
Raul Gouvea, Gautam Vora*
Anderson School of Management, University of New Mexico, Albuquerque, New Mexico
Abstract The countries of the Arab League paint a diverse picture of economic (and so-cial) performance and export-earnings performance. While Arab countries have formed numerous alliances for one reason or another, the League of Arab States, more popularly known as the Arab League, is the dominant one. One can, however, see a social, political, economic development divide among them. Focusing on the export performance of these countries during the pe-riod from 1988 through 2012, we examine stability of export earnings as well as exports’ risk-return profile. The single index model from the modern port-folio theory is used for empirical examination. The results indicate that these countries exhibit a corresponding performance divide for export-earnings. The oil and natural gas exporters show a much higher sensitivity than non-oil ex-porters. Exporters with a higher proportion of manufactured products show a much lower sensitivity. Examination of risk-return tradeoff reveals a more complicated picture: Qatar, UAE and Bahrain show the highest Sharpe ratio which is a measure of performance based on total fluctuations whereas Leba-non, Jordan and Tunisia show the highest Treynor ratio which is a measure of performance based on market-fluctuations. The study concludes that different socioeconomic development policies are needed for developed and developing countries of the Arab League. Several structural challenges facing these coun-tries are pointed out and discussed to improve economic and export perfor-mances. These challenges can be overcome only with sustained resolute action emanating from the highest level of political control.
Keywords Commodities, Export Diversification, Portfolio Model, Single Index Model, Export Performance, Development Policies
1. Introduction
The League of Arab States (LAS), more commonly known as the Arab League, is
How to cite this paper: Gouvea, R. and Vora, G. (2017) The Arab League: Export Earnings and Economic Development. Mo- dern Economy, 8, 604-641. https://doi.org/10.4236/me.2017.84045 Received: September 27, 2016 Accepted: April 24, 2017 Published: April 27, 2017 Copyright © 2017 by authors and Scientific Research Publishing Inc. This work is licensed under the Creative Commons Attribution International License (CC BY 4.0). http://creativecommons.org/licenses/by/4.0/
Open Access

R. Gouvea, G. Vora
605
the oldest regional Arab organization founded in Cairo in March 1945 by six Arab countries in and around North Africa, the Horn of Africa, and Southwest Asia1. The countries were Kingdom of Egypt, Kingdom of Iraq, Transjordan (renamed Jordan in 1949), Lebanon, Saudi Arabia and Syria. A seventh Arab country, Yemen, joined as a member in May 1945. Over the years the member-ship has grown as pan-Arabism sentiment2 prevailed; currently, the League has 22 members as follows and repeated in Table 1: (1) Algeria, (2) Bahrain, (3) Comoros, (4) Djibouti, (5) Egypt, (6) Iraq, (7) Jordan, (8) Kuwait, (9) Lebanon, (10) Libya, (11) Mauritania, (12) Morocco, (13) Oman, (14) Palestine, (15) Qa-tar, (16) Saudi Arabia, (17) Somalia, (18) Sudan, (19) Syria, (20) Tunisia, (21) United Arab Emirates (UAE), and (22) Yemen.
Table 1 additionally shows that these 22 Arab countries have actually formed numerous alliances for sociopolitical and socioeconomic purposes. The Council of Arab Economic Unity (CAEU) comprising 18 countries was formed in 1964. The Organization of Arab Petroleum Exporting Countries (OAPEC) today comprising 11 countries was formed in 1968. The Arab Monetary Fund (AMF) was formed in 1977 which is composed of all members of LAS, except Comoros3. The Cooperation Council for the Arab States of the Gulf (originally and cur-rently known as Gulf Cooperation Council (GCC)) comprising six countries was formed in 1981. The Arab Maghreb Union (AMU) comprising five countries was formed in 1989. The Greater Arab Free Trade Area (GAFTA) comprising 14 countries was formed in 1997. The Agadir Agreement (AgaAg) comprising four countries was formed in 2004.
Article 2 of the Pact of the Arab League States (of March 22, 1945) states the purposes of LAS. The article states inter alia,
1This formal bloc must be distinguished from the group of countries called Middle East and North Africa (MENA). MENA has no well-accepted definition and the acronym is often used in academic, military planning, and disaster relief. Wikipedia’s list includes 18 countries (http://en.wikipedia.org/wiki/MENA). The World Bank, on the other hand, has a directorate de-voted to MENA and it (http://www.worldbank.org/en/region/mena) defines the group to include 14 countries (1) Algeria, (2) Djibouti, (3) Egypt, (4) Iran, (5) Iraq, (6) Israel, (7) Jordan, (8) Lebanon, (9) Libya, (10) Morocco, (11) Syria, (12) Tunisia, (13) West Bank and Gaza (or Palestine State), (14) Yemen. MENA-8 is the World Bank’s designation for eight developing countries (oil importers: Egypt, Tunisia, Lebanon and Jordan; oil exporters: Iran, Iraq, Yemen and Libya). The Gulf Coopera-tion Council (GCC) countries play a major role in MENA through aid, investment, tourism reve-nues and remittances. In some reports, however, the World Bank includes the GCC countries in MENA (http://documents.worldbank.org/curated/en/2014/10/20272046/mena-economic-monitor-corrosive-subsidies). 2Pan-Arabism is an ideology advocating the unification of the Arab countries of North Africa and West Asia from the Atlantic Ocean to the Arabian Sea. Often this group is referred to as the Arab World. The ideology is closely connected to Arab Nationalism, which asserts that the Arabs consti-tute a single nation. Its popularity was highest during the decades of 1950s and 1960s. Advocates of pan-Arabism have often espoused socialist principles and strongly opposed Western political in-volvement in the affairs of the Arab world. The advocates sought to insulate the Arab World from outside forces by forming internal alliances for sociopolitical cooperation and, to a lesser extent, economic cooperation. (See Wikipedia at http://en.wikipedia.org/wiki/Pan-Arabism and references therein.) 3The Arab Monetary Fund is somewhat unique in its accounting system. The Arab Accounting Di-nar (AAD), its unit of accounting, is equivalent to three SDRs. (http://www.medea.be/en/themes/economy-and-trade/arab-monetary-fund/)

R. Gouvea, G. Vora
606
Table 1. Arab organizations and groupings.
OPEC (1960)
OAPEC (1968)
LAS (1945) CAEU (1964)
GCC (1981) AMU (1989)
GAFTA (1997)
AgaAg (2004)
MENA (2007)
Algeria Algeria Algeria Algeria Algeria Algeria
Bahrain Bahrain Bahrain Bahrain Bahrain
Comoros
Djibouti Djibouti
Egypt Egypt Egypt Egypt Egypt Egypt
Iraq (FM) Iraq Iraq Iraq Iraq Iraq
Jordan Jordan Jordan Jordan
Kuwait (FM)
Kuwait (FM)
Kuwait Kuwait Kuwait Kuwait
Lebanon Lebanon Lebanon Lebanon
Libya Libya (FM) Libya Libya Libya Libya Libya
Mauritania Mauritania
Morocco Morocco Morocco Morocco Morocco Morocco
Oman Oman Oman Oman
Palestine Palestine West Bank and Gaza
Qatar Qatar Qatar Qatar Qatar Qatar
Saudi Arabia (FM)
Saudi Arabia (FM)
Saudi Arabia Saudi Arabia Saudi Arabia Saudi Arabia
Somalia
Sudan Sudan Sudan
Syria Syria Syria Syria Syria
Tunisia Tunisia Tunisia Tunisia Tunisia Tunisia Tunisia
United Arab Emirates
United Arab Emirates
United Arab Emirates
United Arab Emirates
United Arab Emirates
United Arab Emirates
Yemen Yemen Yemen
7 11 22 18 6 5 14 4 14
OPEC’s non-Arab members are five, namely, Angola, Ecuador, Iran, Nigeria, and Venezuela. FM denotes founding member. The World Bank includes Iran and Israel in the regional grouping of MENA.
It also has among its purposes a close co-operation of the member States with due regard to the structure of each of these States and the conditions prevailing therein, in the following matters:
(a) Economic and financial matters, including trade, customs, currency, agri-culture and industry;
(b) Communications, including railways, roads, aviation, navigation, and posts and telegraphs;
(c) Cultural matters; (d) Matters connected with nationality, passports, visas, execution of judg-
ments and extradition; (e) Social welfare matters;

R. Gouvea, G. Vora
607
(f) Health matters. It is worth noting that the Pact explicitly and specifically emphasizes matters
of trade, economic development, infrastructure, telecommunications, travel and tourism and social development. It is also worth noting that the Pact places the economic and financial matters at the top of the list. The Pact may have been motivated by political and sovereignty concerns; the delegates, however, recog-nized the importance of socioeconomic development through trade, internal and external.
Like LAS, the other alliances were motivated by a host of factors, though trade and development were not ignored. GAFTA, however, was formed explicitly as a trading bloc. The emphasis on trade and economic development must be consi-dered important factors because not all Arab countries are oil-producing, not all Arab oil-producing countries are members of OPEC, and lastly, not all non- Arab oil-producing countries are members of OPEC4,5.
While the LAS countries desire more trade and development, both of these goals depend on the countries’ natural endowments and nurtured resources. The countries have striven for development on different fronts through numerous organizations. An important element of economic development is exports.
In this paper, we wish to examine the performance of exports of the LAS countries. It would be quite tempting to examine the performance of GAFTA or CAEU or GCC. As we will see in the next sections, the exports of the LAS coun-tries are widely different, yet some common themes emerge in that most of their exports are commodities (agricultural or extractive and intermediate goods). Only a few countries have portfolios with a large contribution from manufac-tured products. The exports of the LAS countries need to be placed in a larger context for evaluation as will be shown in this paper. Neither the export earnings nor the volatility of exports or earnings can be evaluated in isolation; they must be evaluated together.
Our study is different from the literature on exports. We are examining the behavior of total exports of the countries belonging to a regional bloc. The sam-ple includes oil-exporting countries and non-oil-exporting countries. Only eight, out of 22, countries (Algeria (98.3%), Iraq (98.8%), Kuwait (91.6%), Libya (94%), Oman (76.6%), Qatar (92.2), Saudi Arabia (84.1%), and Yemen (89.1%)) have oil
4The Organization of the Petroleum Exporting Countries (OPEC) was founded in Baghdad, Iraq, with the signing of an agreement in September 1960 by five countries, namely, Islamic Republic of Iran, Iraq, Kuwait, Saudi Arabia and Venezuela. They were to become the Founder Members of the Organization.
These countries were later joined by Qatar (1961), Indonesia (1962), Libya (1962), the United Arab Emirates (1967), Algeria (1969), Nigeria (1971), Ecuador (1973), Gabon (1975) and Angola (2007).
From December 1992 until October 2007, Ecuador suspended its membership. Gabon terminated its membership in 1995. Indonesia suspended its membership effective January 2009.
Currently, the Organization has a total of 12 Member Countries. 5The other top 25 non-OPEC oil-producing countries are (1) Russia, (2) U.S., (3) China, (4) Mexico, (5) Canada, (6) Norway, (7) Brazil, (8) Kazakhstan, (9) U.K., (10) Azerbaijan, (11) Indonesia, (12) Oman, (13) India, (14) Colombia, (15) Argentina, (16) Malaysia, (17) Egypt, (18) Australia, (19) Su-dan, (20) Syria, (21) Syria, (22) Equatorial Guinea, (23) Yemen, (24) Vietnam, (25) Congo. (http://peak-oil.org/peak-oil-reference/peak-oil-data/production-and-peak-dates-by-country/)
R. Gouvea, G. Vora
608
exports larger than 75% of total exports. The other countries export many more items. Because of the emphasis of the study, we need not be concerned about the causes of changes in total exports or about the changes in underlying currencies6 or relative fluctuations in currencies or terms of trade. We are using aggregate numbers; therefore it is not necessary to try to separate the effects of quantity versus price. The results and interpretations thereof will be in broader terms too.
We show that the LAS countries exhibit an export-earnings or performance divide similar to their economic development divide. The oil and natural gas exporters show a much higher sensitivity than non-oil exporters. Exporters with a higher proportion of manufactured products show a much lower sensitivity. Examination of risk-return tradeoff reveals a more complicated picture: Qatar, UAE and Bahrain show the highest Sharpe ratio whereas Lebanon, Jordan and Tunisia show the highest Treynor ratio. The study concludes that different so-cioeconomic development policies are needed for developed and developing countries of the Arab League.
The contributions of the paper are manifold. First and foremost is that the study employs a modern method, single index model, to evaluate the perfor-mance of exports of a prominent politico-economic bloc. The socio-politico- economic diversity of this bloc is immense, even though they are “united” by some form of ideology. Second, the study examines not only the stability of ex-port earnings, but also the risk-return tradeoff of export portfolios. Third, the study juxtaposes developed and developing countries of the bloc. Fourth, the study provides in one single place most of the relevant socioeconomic indicators to evaluate the stage of development of constituent countries. Fifth, the study expostulates with the governments and authorities of these countries the policies necessary for the bloc to pursue either individually or as a group.
This paper is organized as follows. Section 2 discusses the global context of the exports of the LAS countries. Section 3 discusses the socioeconomic picture of LAS. Section 4 discusses the export sector of LAS. Section 5 discusses data, me-thods and hypotheses. Section 6 discusses results. Section 7 discusses implica-tions for policies for the LAS countries and points out some caveats of this re-search. Section 8 discusses the challenges faced by the LAS countries. Section 9 concludes the paper.
2. Foreign Direct Investment & Exports Trends in the Global Context
Eight years after the start of the financial crisis in 2008, the global economy in 2016 is still struggling to recover its growth rate of the pre-crisis years. The growth rates in gross domestic product (GDP) for a large majority of the coun-tries are on a slow recovery path, with an expected growth of less than three percent for the global economy in 2015 ([1] [2]). Even high-growth countries such as China are moving into a cycle of single-digit growth rates, well below the two-digit growth rates of their the pre-crisis years ([3] [4] [5]).
6We are aware that crude and petroleum products are quoted and traded in USD.

R. Gouvea, G. Vora
609
In 2016, several forces and trends, such as the “BREXIT” Referendum, are shaping a lower-than-expected rate of economic growth for several economic regions around the globe: (a) low commodity prices; (b) lower levels of global trade; and (c) lack of economic confidence, not to mention some of the prob-lems and remedies of the financial crisis, viz., (d) house-price bubble and subse-quent burst, (e) overleveraged individuals, households and institutions and sub-sequent deleveraging; (f) consumers reluctant to spend and banking institutions reluctant to lend; (g) corporations hoarding earnings and cash including huge borrowings from the bond markets. These trends started in the U.S. and spread globally and hardly a country was spared. They are affecting not only the LAS non-oil exporting countries but also the GCC oil-exporting countries. In partic-ular lower prices for petroleum products and natural gas as well as geopolitical conflicts have hampered and are delaying the economic recovery for numerous LAS countries ([6]). For instance, similar to the western countries, some of the members of GCC introduced fiscally stimulus policies to offset lower prices of oil and natural gas ([2] [7] [8]).
The global foreign direct investment (FDI) saw a substantial decline of about eight percent in 2014. This decline has affected the LAS countries in a myriad of ways. The issues of national security in the region have dramatically cut the FDI flows to Syria and Yemen and to other neighboring Arab countries ([9]). Tradi-tionally, the U.S. and Western European countries have been a major source of the FDI. A slow growth in the euro zone has slowed the FDI flows to the region. Saudi Arabia, the region’s largest recipient of the FDI, has seen a modest decline in FDI. Egypt has seen a more dramatic decline in the FDI. Iraq, on the other hand, has seen resurgence in the FDI, mostly targeted at Kurdistan. The lack of intra-bloc economic integration can be starkly observed in the extreme concen-tration of the intra-LAS FDI. For instance, the bulk of the intra-LAS FDI, close to 65 percent, are allocated to Saudi Arabia, UAE, and Qatar, further stressing the economic recovery within the region ([10] [11]).
The LAS countries have found themselves under tremendous external pres-sure, either from a slowdown of the FDI or from lower prices for their main ex-porting products and services such as tourism because growth in these countries is heavily influenced by the countries’ ties to global markets either via FDI or via international trade of products and services. Moreover, the small size of their local markets, the relative paucity of the intra-LAS trade and of the intra-LAS FDI are not enough to counteract global economic fluctuations. For instance, data for 2012 for eight MENA countries show that the intra-regional FDI ac-counted for only 24 percent of all the FDI flowing into these countries while in-tra-regional trade flows were approximately nine percent ([12] [13]). The World Bank paints a picture of MENA region in not-so-buoyant words (http://www.worldbank.org/en/region/mena/overview):
Growth in MENA is expected to slow down in 2015 and range between 3.1 … estimated by the World Bank, … below the already low growth of last year and continue on the same path in 2015. The main reasons for the con-

R. Gouvea, G. Vora
610
tinued, sluggish growth are: prolonged conflict and political instability in Syria, Iraq, Libya and Yemen; low oil prices that are dragging down growth in oil exporters; and the slow pace of reforms that is standing in the way of a resumption of investment. The continuation of this situation will signifi-cantly hurt the overall unemployment rate, now standing at 12%, and po-verty in the region. The group of oil exporters is estimated to grow by around 2.9% in 2015 with growth stagnating in developing oil exporters, at 1%. … [the] World Bank estimates that growth in developing oil exporters in MENA … [will] drop to 1% compared to 6% prior to the oil collapse. Fiscal deficits are mounting, leaving the region with a deficit of 8% of GDP in 2015. … Growth in developing MENA countries will stay at 2% in 2015.
[The] World Bank is afraid that the deterioration in the fiscal situation in the Gulf States because of a prolonged slump in oil price would cause a deterioration in remittance outflows from the GCC countries to the rest of the region, mainly Egypt, Yemen and Jordan. In addition, the World Bank is afraid that aid flows from GCC to the MENA countries may also decline7.
While the LAS countries are diverse in sociopolitical dimensions, most of them may be classified as emerging economies and middle-income countries. For these countries to make economic progress, they need to overcome structural challenges some of which are poor education system, high unemployment, low female labor force participation, poor private sector development, low investments in innova-tion and R&D systems, weak governance, poor public sector, cronyism and nepot-ism, governmental protection against competition, widespread corruption. One of the traditional methods of meeting such challenges is through export sector.
Table 2 provides aggregate exports of the LAS countries. The broad categories are (1) All food items, (2) Agricultural raw materials, (3) Fuels, (4) Ores, metals, precious stones, non-monetary gold and (4) Manufactured exports. An addi-tional column shows the percent of high-tech exports as percent of manufac-tured exports. The table shows that 1) Four countries have exports of food items greater than 25%, viz., Comoros at
33.7%, Djibouti at 37.9%, Somalia at 56.1% and Syria at 29.5%. 2) Only one country has exports of agricultural raw materials greater than 25%,
viz., Somalia at 33.1%. 3) Thirteen countries have exports of fuels greater than 25%, viz., Algeria at
98.3%, Bahrain at 33.9%, Egypt at 30%, Iraq at 98.8%, Kuwait at 91.6%, Libya at 94%, Oman at 76.6%, Qatar at 92.2%, Saudi Arabia at 84.1%, Sudan at 85%, Syria at 27.6%, UAE at 57.2% and Yemen at 89.1%.
4) Three countries have exports of ores, metals, etc., greater than 25%, viz., Ba-hrain at 38.3%, Lebanon at 28.6% and Mauritania at 58.3%.
5) Eight countries have exports of manufactured goods greater than 25%, viz.,
7The World Bank’s assessment for MENA countries in conflict is dire: “For … Iraq, Libya, Yemen, and Syria, economic prospects are grim. Growth is expected to turn negative in 2015 [for Iraq] fol-lowing a contraction of 0.5% in 2014. Libya is in recession … [whose] economy is estimated to have contracted by 24% in 2014, following a contraction of about 14% in 2013.”

R. Gouvea, G. Vora
611
Table 2. Aggregate exports (in percent).
Country All Food
Items Agricultural Raw
Materials Fuels
Ores, Metals, Precious Stones, Non-Monetary
Gold
Manufactured Products
High-Tech Exports (% of Manufactured Products)
Algeria 0.5 0.0 98.3 0.3 0.9 0
Bahrain 3.6 0.5 33.9 38.3 22.8 0
Comoros 33.7 0.4 0.0 1.0 64.9 0
Djibouti 37.9 5.9 5.1 12.6 33.4 0
Egypt 14.1 2.7 30.0 11.2 41.9 1
Iraq 0.2 0.1 98.8 0.3 0.6 0
Jordan 14.4 0.4 0.6 15.5 68.7 3
Kuwait 0.2 0.2 91.6 0.9 7.1 0
Lebanon 16.2 1.2 0.2 28.6 53.5 2
Libya 0.2 −0.1 94.0 2.3 2.3 0
Mauritania 23.2 −0.3 5.3 58.3 0.7 0
Morocco 19.9 1.2 4.6 11.3 63.0 6
Oman 4.0 0.0 76.6 3.6 15.7 3
Palestine
Qatar 0.0 0.0 92.2 1.2 6.4 0
Saudi Arabia 1.4 0.0 84.1 0.8 13.5 1
Somalia 56.1 33.1 0.1 0.5 10.1 0
Sudan 4.3 1.5 85 8.1 1.1 1
Syria 29.5 1.3 37.6 3.4 28.1 1
Tunisia 9.6 0.6 14.2 1.7 73.9 6
United Arab Emirates
3.7 0.2 57.2 16.7 21.9 0
Yemen 6.1 0.3 89.1 2 2.5 0
Source: UNCTAD, 2013; World Bank, 2015.
Comoros at 64.9%, Djibouti at 33.4%, Egypt at 41.9%, Jordan at 68.7%, Leb-anon at 53.5%, Morocco at 63%, Syria at 28.1% and Tunisia at 73.9%.
6) Nine countries have modest exports of high-tech products (as percent of manufactured products), viz., Egypt at 1%, Jordan at 3%, Lebanon at 2%, Morocco at 6%, Oman at 3%, Saudi Arabia at 1%, Sudan at 1%, Syria at 1% and Tunisia at 6%.
The broad categories while informative are not insightful. Table 3 provides top exports of the LAS countries. The top exports are defined to be not less than one percent of total exports of a country. Only the first exported item which is less than one percent is given in the table for comparison and is not included in the total given in millions of US dollars or in percentages. The diversity of ex-ported items is revealing of the natural endowments and the industrial capabili-ties for intermediate goods. Oil-exporters, on the whole, have dominant epo-

R. Gouvea, G. Vora
612
Table 3. Exports (in MM USD and %).
Country Item No.
HS Code Item Value
(MM USD) Percent of Total
Exports
Algeria
1 2709 Crude Petroleum 31,370 44.99%
2 2711 Petroleum Gas 25,703 36.86%
3 2710 Refined Petroleum 10,071 14.44%
4 2707 Coal Tar Oil 849 1.22%
5 2814 Ammonia 614 0.88%
Total (≥1%) 67,992 97.51%
Bahrain
1 2710 Refined Petroleum 4672 57.64%
2 7601 Raw Aluminium 862 10.64%
3 2711 Petroleum Gas 331 4.08%
4 2601 Iron Ore 267 3.30%
5 7606 Aluminium Plating 249 3.07%
6 3102 Nitrogenous Fertilizers 213 2.63%
7 7614 Stranded Aluminium Wire 182 2.25%
8 7605 Aluminium Wire 154 1.90%
9 8415 Air Conditioners 93 1.15%
10 6204 Non-Knit Women’s Suits 81 1.00%
11 7203 Iron Reductions 71 0.88%
Total (≥1%) 7105 87.66%
Comoros
1 907 Cloves 27 40.09%
2 303 Non-fillet Frozen Fish 17 25.86%
3 8908 Scrap Vessels 9 13.60%
4 3301 Essential Oils 5 7.42%
5 905 Vanilla 3 3.97%
6 7204 Scrap Iron 1 1.80%
7 8703 Cars 1 1.16%
8 302 Non-fillet Fresh Fish 1 1.06%
9 7311 Iron Gas Containers 1 1.03%
10 304 Fish Fillets 1 0.75%
Total (≥1%) 64 95.99%
Djibouti
1 106 Other Animals 12 31.79%
2 901 Coffee 5 12.65%
3 102 Bovine 3 9.17%

R. Gouvea, G. Vora
613
Continued
4 713 Dried Legumes 2 4.54%
5 7204 Scrap Iron 2 4.07%
6 8483 Transmissions 1 2.92%
7 8504 Electrical Transformers 1 2.67%
8 1001 Wheat 1 2.35%
9 4011 Rubber Tires 1 2.15%
10 4103 Other Hides and Skins 1 2.00%
11 8474 Stone Processing Machines 1 1.82%
12 8429 Large Construction Vehicles 1 1.75%
13 8539 Electric Filament 1 1.73%
14 4102 Sheep Hides 1 1.60%
15 1102 Cereal Flours 0 1.31%
16 4106 Tanned Goat Hides 0 1.29%
17 8716 Trailers 0 0.97%
Total (≥1%) 32 83.81%
Egypt
1 2709 Crude Petroleum 6562 17.85%
2 2711 Petroleum Gas 3731 10.15%
3 2710 Refined Petroleum 3165 8.61%
4 7108 Gold 1645 4.48%
5 3102 Nitrogenous Fertilizers 1263 3.43%
6 8544 Insulated Wire 761 2.07%
7 805 Citrus 595 1.62%
8 6203 Non-Knit Men’s Suits 538 1.46%
9 2510 Calcium Phosphates 436 1.19%
10 2814 Ammonia 410 1.11%
11 7409 Copper Plating 376 1.02%
12 406 Cheese 367 1.00%
13 7208 Hot-Rolled Iron 359 0.98%
Total (≥1%) 19,849 53.99%
Iraq
1 2709 Crude Petroleum 56,723 99.13%
2 2710 Refined Petroleum 166 0.29%
Total (≥1%) 56,723 99.13%
Jordan
1 2510 Calcium Phosphates 957 10.65%
2 3104 Potassic Fertilizers 541 6.02%
3 3004 Packaged Medicaments 503 5.60%

R. Gouvea, G. Vora
614
Continued
4 3105 Mixed Mineral or Chemical Fertilizers
302 3.36%
5 6110 Knit Sweaters 284 3.16%
6 3003 Unpackaged Medicaments 255 2.84%
7 702 Tomatoes 242 2.69%
8 6204 Non-Knit Women’s Suits 227 2.53%
9 3102 Nitrogenous Fertilizers 219 2.44%
10 7108 Gold 197 2.20%
11 8544 Insulated Wire 162 1.80%
12 2809 Phosphoric Acid 147 1.64%
13 104 Sheep and Goats 145 1.61%
14 3901 Ethylene Polymers 109 1.21%
15 809 Pitted Fruits 104 1.15%
16 2709 Crude Petroleum 100 1.12%
17 2834 Nitrites and Nitrates 97 1.08%
18 2801 Halogens 95 1.06%
19 6105 Knit Men’s Shirts 95 1.06%
20 3923 Plastic Lids 93 1.04%
21 6104 Knit Women’s Suits 90 1.00%
22 7113 Jewellery 87 0.97%
Total (≥1%) 4964 55.26%
Kuwait
1 2709 Crude Petroleum 52,939 66.82%
2 2710 Refined Petroleum 17,943 22.65%
3 2711 Petroleum Gas 3581 4.52%
4 2902 Cyclic Hydrocarbons 1436 1.81%
5 3901 Ethylene Polymers 905 1.14%
6 2905 Acyclic Alcohols 837 1.06%
7 3102 Nitrogenous Fertilizers 343 0.43%
Total (≥1%) 77,643 98.00%
Lebanon
1 7108 Gold 1398 27.74%
2 7102 Diamonds 298 5.90%
3 7113 Jewellery 296 5.88%
4 8502 Electric Generating Sets 158 3.14%
5 7404 Scrap Copper 137 2.73%
6 7204 Scrap Iron 115 2.27%
7 4901 Brochures 94 1.87%
8 3103 Phosphatic Fertilizers 83 1.65%

R. Gouvea, G. Vora
615
Continued
9 2710 Refined Petroleum 72 1.44%
10 8418 Refrigerators 65 1.30%
11 2809 Phosphoric Acid 58 1.15%
12 3920 Raw Plastic Sheeting 52 1.04%
13 9403 Other Furniture 52 1.04%
14 2008 Other Processed Fruits and Nuts
51 1.01%
15 2202 Flavored Water 45 0.90%
Total (≥1%) 2932 58.16%
Libya
1 2709 Crude Petroleum 43,244 88.16%
2 2711 Petroleum Gas 3236 6.60%
3 2710 Refined Petroleum 2252 4.59%
4 7203 Iron Reductions 71 0.15%
Total (≥1%) 48,731 99.35%
Mauritania
1 2601 Iron Ore 1583 45.53%
2 2603 Copper Ore 420 12.07%
3 307 Molluscs 341 9.79%
4 303 Non-fillet Frozen Fish 332 9.55%
5 7108 Gold 317 9.13%
6 2709 Crude Petroleum 176 5.06%
7 302 Non-fillet Fresh Fish 83 2.38%
8 2710 Refined Petroleum 75 2.14%
9 2301 Animal Meal and Pellets 47 1.34%
10 7204 Scrap Iron 21 0.61%
Total (≥1%) 3373 96.99%
Morocco
1 8544 Insulated Wire 2380 9.50%
2 3105 Mixed Mineral or Chemical Fertilizers
2076 8.28%
3 2510 Calcium Phosphates 1858 7.41%
4 2809 Phosphoric Acid 1780 7.10%
5 6204 Non-Knit Women’s Suits 1180 4.71%
6 2710 Refined Petroleum 1091 4.35%
7 8703 Cars 978 3.90%
8 1604 Processed Fish 575 2.29%
9 8541 Semiconductor Devices 533 2.13%
10 6203 Non-Knit Men’s Suits 526 2.10%

R. Gouvea, G. Vora
616
Continued
11 702 Tomatoes 525 2.09%
12 307 Molluscs 495 1.97%
13 805 Citrus 426 1.70%
14 3103 Phosphatic Fertilizers 416 1.66%
15 2707 Coal Tar Oil 386 1.54%
16 6109 Knit T-shirts 354 1.41%
17 6206 Non-Knit Women’s Shirts 326 1.30%
18 6403 Leather Footwear 324 1.29%
19 8542 Integrated Circuits 305 1.22%
20 6104 Knit Women’s Suits 268 1.07%
21 7106 Silver 254 1.01%
22 7404 Scrap Copper 230 0.92%
Total (≥1%) 17,056 68.03%
Oman
1 2709 Crude Petroleum 21,422 51.68%
2 2711 Petroleum Gas 6028 14.54%
3 2710 Refined Petroleum 4326 10.44%
4 2902 Cyclic Hydrocarbons 1031 2.49%
5 3102 Nitrogenous Fertilizers 888 2.14%
6 7601 Raw Aluminium 693 1.67%
7 2905 Acyclic Alcohols 672 1.62%
8 2601 Iron Ore 548 1.32%
9 7203 Iron Reductions 513 1.24%
10 3920 Raw Plastic Sheeting 351 0.85%
Total (≥1%) 36,121 87.14%
Qatar
1 2711 Petroleum Gas 47,445 46.77%
2 2709 Crude Petroleum 39,171 38.61%
3 2710 Refined Petroleum 7154 7.05%
4 3901 Ethylene Polymers 2177 2.15%
5 3102 Nitrogenous Fertilizers 1328 1.31%
6 7601 Raw Aluminium 1174 1.16%
7 2901 Acyclic Hydrocarbons 536 0.53%
Total (≥1%) 98,449 97.05%
S. Arabia
1 2709 Crude Petroleum 198,499 76.27%
2 2710 Refined Petroleum 14,957 5.75%
3 3901 Ethylene Polymers 9516 3.66%

R. Gouvea, G. Vora
617
Continued
4 2905 Acyclic Alcohols 7425 2.85%
5 2711 Petroleum Gas 6535 2.51%
6 3902 Propylene Polymers 5743 2.21%
7 2902 Cyclic Hydrocarbons 2303 0.88%
Total (≥1%) 242,675 93.25%
Somalia
1 102 Bovine 67 40.40%
2 104 Sheep and Goats 61 36.54%
3 1207 Other Oily Seeds 8 4.59%
4 4402 Wood Charcoal 6 3.77%
5 4106 Tanned Goat Hides 4 2.25%
6 4103 Other Hides and Skins 4 2.17%
7 4102 Sheep Hides 2 1.30%
8 8413 Liquid Pumps 2 1.28%
9 4105 Tanned Sheep Hides 2 1.26%
10 1301 Insect Resins 2 1.18%
11 4101 Equine and Bovine Hides 2 0.92%
Total (≥1%) 158 94.74%
Sudan
1 7108 Gold 2167 44.90%
2 2709 Crude Petroleum 1771 36.69%
3 1207 Other Oily Seeds 176 3.64%
4 1301 Insect Resins 99 2.04%
5 2902 Cyclic Hydrocarbons 70 1.46%
6 2710 Refined Petroleum 53 1.09%
7 204 Sheep and Goat Meat 48 1.00%
8 1701 Raw Sugar 39 0.80%
Total (≥1%) 4384 90.82%
Syria
1 2510 Calcium Phosphates 167 10.73%
2 2709 Crude Petroleum 121 7.78%
3 808 Apples and Pears 74 4.75%
4 909 Spice Seeds 57 3.68%
5 7606 Aluminium Plating 43 2.77%
6 802 Other Nuts 39 2.51%
7 504 Animal Organs 34 2.18%
8 3004 Packaged Medicaments 31 2.02%
9 5205 Non-Retail Pure Cotton Yarn 25 1.63%

R. Gouvea, G. Vora
618
Continued
10 3402 Cleaning Products 25 1.59%
11 6109 Knit T-shirts 20 1.26%
12 5703 Tufted Carpets 19 1.22%
13 5407 Synthetic Filament Yarn Woven Fabric
19 1.19%
14 7214 Raw Iron Bars 18 1.17%
15 7206 Iron Ingots 17 1.09%
16 4105 Tanned Sheep Hides 17 1.08%
17 809 Pitted Fruits 16 1.02%
18 406 Cheese 16 1.01%
19 6110 Knit Sweaters 15 0.98%
Total (≥1%) 756 48.68%
Tunisia
1 2709 Crude Petroleum 1591 10.35%
2 8544 Insulated Wire 1551 10.09%
3 6203 Non-Knit Men’s Suits 898 5.84%
4 6204 Non-Knit Women’s Suits 751 4.89%
5 2710 Refined Petroleum 493 3.21%
6 8528 Video Displays 459 2.99%
7 6403 Leather Footwear 438 2.85%
8 8536 Low-voltage Protection Equip-ment
383 2.49%
9 1509 Pure Olive Oil 347 2.25%
10 8708 Vehicle Parts 302 1.96%
11 3105 Mixed Mineral or Chemical Fertilizers
301 1.96%
12 6211 Non-Knit Active Wear 262 1.71%
13 6109 Knit T-shirts 259 1.68%
14 6110 Knit Sweaters 232 1.51%
15 2809 Phosphoric Acid 231 1.50%
16 8517 Telephones 207 1.35%
17 804 Tropical Fruits 207 1.35%
18 8501 Electric Motors 168 1.09%
19 8803 Aircraft Parts 168 1.09%
20 2835 Phosphinates and Phosphonates 156 1.01%
21 6205 Non-Knit Men’s Shirts 152 0.99%
Total (≥1%) 9405 61.17%
UAE
1 2709 Crude Petroleum 74,195 46.18%
2 2710 Refined Petroleum 21,320 13.27%
3 7108 Gold 14,746 9.18%
4 2711 Petroleum Gas 11,817 7.35%
5 7113 Jewellery 5600 3.49%

R. Gouvea, G. Vora
619
Continued
6 7601 Raw Aluminium 3531 2.20%
7 7102 Diamonds 3122 1.94%
8 3901 Ethylene Polymers 1649 1.03%
9 8525 Broadcasting Equipment 1568 0.98%
Total (≥1%) 135,980 84.64%
Yemen
1 2709 Crude Petroleum 4945 58.39%
2 2711 Petroleum Gas 1921 22.69%
3 2710 Refined Petroleum 489 5.77%
4 2707 Coal Tar Oil 184 2.18%
5 302 Non-fillet Fresh Fish 107 1.26%
6 307 Molluscs 67 0.79%
Total (≥1%) 7647 90.29%
nymous exports. Non-oil-exporters have different items.
Let us concentrate on the eight countries whose manufactured products showed a category share of 25% or more. We list below the top five exported items of these countries. 1) Comoros: Cloves at 40.09%, Non-fillet frozen fish at 25.86%, Scrap vessels at
13.60%, Essential oils at 7.42% and Vanilla at 3.97%. 2) Djibouti: Other animals at 31.79%, Coffee at 12.65%, Bovine at 9.17%, Dried
legumes at 4.54% and Scrap iron at 4.07%. 3) Egypt: Crude petroleum at 17.85%, Petroleum gas at 10.15%, Refined petro-
leum at 8.61%, Gold at 4.48% and Nitrogenous fertilizers at 3.43%. 4) Jordan: Calcium phosphates at 10.65%, Potassic fertilizers at 6.02%, Packaged
medicaments at 5.60%, Mixed mineral or chemical fertilizers at 3.36% and Knit Sweaters at 3.16%.
5) Lebanon: Gold at 27.74%, Diamonds at 5.90%, Jewellery at 5.88%, Electric generating sets at 3.14% and Scrap copper at 2.73%.
6) Morocco: Insulated wire at 9.50%, Mixed mineral or chemical fertilizers at 8.28%, Calcium phosphates at 7.41%, Phosphoric acid at 7.10% and Non-knit women’s suits at 4.71%.
7) Syria: Calcium phosphates at 10.73%, Crude petroleum at 7.78%, Apples and pears at 4.75%, Spice seeds at 3.68% and Aluminium plating at 2.77%.
8) Tunisia: Crude petroleum at 10.35%, Insulated wire at 10.09%, Non-knit men’s suits at 5.84%, Non-knit women’s suits at 4.89% and Refined petro-leum at 3.21%.
As we can see, the details give a finer and more insightful picture of a coun-try’s exports. Table 3 thus provides a different (and sometimes contradictory), yet accurate, picture of exports8. Of course, we recognize that aggregation is ne-
8Some contradictions may be explained by the definitional problems between data sources of UNCTAD and World Bank.

R. Gouvea, G. Vora
620
cessary for ease of handling data. The details, however, inform the empirical methods for our study.
To what extent fluctuations of these exports contribute to economic growth remains an open question. Thus, today more than ever, given the current ma-croeconomic conditions, it is important to address the issue of the stability of exports as measured by the changes (or equivalently earnings) for the LAS countries. It is well-known that extreme exports-earnings volatility has negative impact on a country’s economic development and growth prospects ([14]-[22]).
Using data on trade and econometric methods, this paper addresses the ques-tions of the stability of export earnings and performance of the export portfolios of the LAS countries. The next section paints a socioeconomic picture of the league.
3. The Socio-Politico-Economic Picture of the Arab League
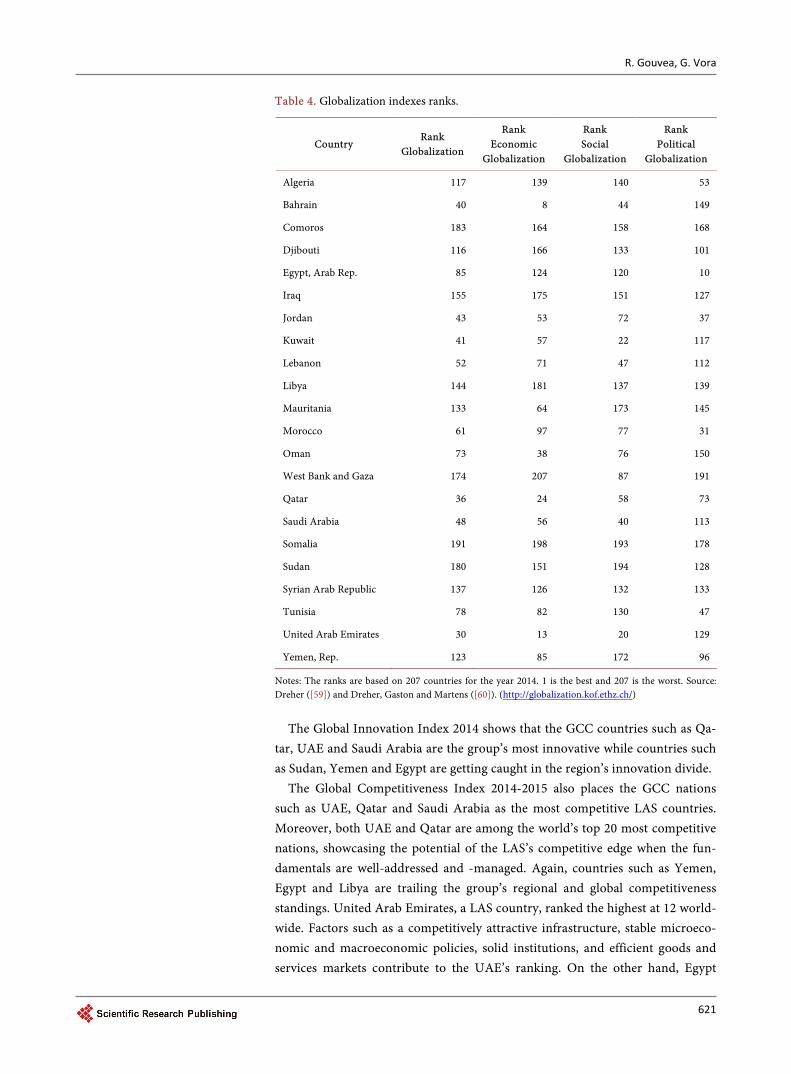
One of the dimensions of the LAS countries has been their diverse approach and exposure to trends in globalization. Table 4 shows the globalization divide per-meating the LAS countries. Table 4 reports the ranks of the KOF Index of Glo-balization for 20149, which consists of three subsidiary indexes. For instance, the GCC countries of United Arab Emirates (ranked 30) and Qatar (36) are way more plugged into and inserted in the global economy than countries such as Somalia (ranked 191), Comoros (183) and Sudan (180). There is also a mid-level group showing growing insertion into the global economy such as Bahrain (ranked 40), Kuwait (41), Jordan (43), Saudi Arabia (48), and Lebanon (52). The KOF Index of Economic Globalization for 2014 shows that countries like Ba-hrain (ranked 8), UAE (13), and Qatar (24) rank very high. It is clear that some countries in LAS have positioned themselves much more effectively to fully ben-efit from globalization trends than others. The increasing integration into the global economy by some of these countries reinforces the virtuous cycle of eco-nomic growth and development, increasing the economic complexity of some of these nations. Table 4 shows also the two remaining sub-indexes, viz., the social globalization index and the political globalization index.
Table 5 continues to fill-in details of the socio-politico-economic picture. The Table reports numerous indicators of development of the LAS countries: Global Innovation Index10 (GII) for 2014, Global Competitiveness Index11 (GCI) for 2014-2015, Ease-of-Doing Business Index12 (EDBI) for 2015, Economic Freedom Index13 (EFI) for 2015, Human Development Index14 (HDI) for 2014, Corrup-tion Perception Index15 (CPI) for 2014, GDP per Capita in USD16 for 2013, Ex-ports as a percent of GDP17 for 2013.
9http://globalization.kof.ethz.ch/ 10World Intellectual Property Organization (WIPO). (http://www.wipo.int/econ_stat/en/economics/gii/) 11World Economic Forum. (http://reports.weforum.org/global-competitiveness-report-2014-2015/) 12World Bank. (http://www.doingbusiness.org/rankings) 13Heritage Foundation. (http://www.heritage.org/index/about) 14UN. (http://hdr.undp.org/en/composite/HDI) 15Transparency International. (https://www.transparency.org/cpi2014) 16World Bank. (http://data.worldbank.org/) 17World Bank. (http://data.worldbank.org/)
R. Gouvea, G. Vora
621
Table 4. Globalization indexes ranks.
Country Rank
Globalization
Rank Economic
Globalization
Rank Social
Globalization
Rank Political
Globalization
Algeria 117 139 140 53
Bahrain 40 8 44 149
Comoros 183 164 158 168
Djibouti 116 166 133 101
Egypt, Arab Rep. 85 124 120 10
Iraq 155 175 151 127
Jordan 43 53 72 37
Kuwait 41 57 22 117
Lebanon 52 71 47 112
Libya 144 181 137 139
Mauritania 133 64 173 145
Morocco 61 97 77 31
Oman 73 38 76 150
West Bank and Gaza 174 207 87 191
Qatar 36 24 58 73
Saudi Arabia 48 56 40 113
Somalia 191 198 193 178
Sudan 180 151 194 128
Syrian Arab Republic 137 126 132 133
Tunisia 78 82 130 47
United Arab Emirates 30 13 20 129
Yemen, Rep. 123 85 172 96
Notes: The ranks are based on 207 countries for the year 2014. 1 is the best and 207 is the worst. Source: Dreher ([59]) and Dreher, Gaston and Martens ([60]). (http://globalization.kof.ethz.ch/)
The Global Innovation Index 2014 shows that the GCC countries such as Qa-
tar, UAE and Saudi Arabia are the group’s most innovative while countries such as Sudan, Yemen and Egypt are getting caught in the region’s innovation divide.
The Global Competitiveness Index 2014-2015 also places the GCC nations such as UAE, Qatar and Saudi Arabia as the most competitive LAS countries. Moreover, both UAE and Qatar are among the world’s top 20 most competitive nations, showcasing the potential of the LAS’s competitive edge when the fun-damentals are well-addressed and -managed. Again, countries such as Yemen, Egypt and Libya are trailing the group’s regional and global competitiveness standings. United Arab Emirates, a LAS country, ranked the highest at 12 world- wide. Factors such as a competitively attractive infrastructure, stable microeco-nomic and macroeconomic policies, solid institutions, and efficient goods and services markets contribute to the UAE’s ranking. On the other hand, Egypt

R. Gouvea, G. Vora
622
Table 5. Socio-politico-economic indicators.
Country GII GCI EDBI EFI HDI CPI GDP
per capita Exports (%GDP)
Algeria n.a. 79 154 157 93 100 5.3 33.1
Bahrain 62 44 53 18 44 55 24.6 74.3
Comoros n.a. n.a. 159 n.a. 159 142 0.81 16.4
Djibouti n.a. n.a. 155 112 170 107 1.6 n.a.
Egypt 99 119 112 124 110 94 3.3 17.6
Iraq n.a. n.a. 156 n.a. 120 170 6.8 34
Jordan 64 64 117 38 77 56 5.2 42.5
Kuwait 69 40 86 74 46 67 52.1 71.6
Lebanon 77 113 104 94 65 136 9.9 62.5
Libya n.a. 126 188 n.a. 55 166 11.9 n.a.
Mauritania n.a. 141 176 n.a. 161 124 1.0 66.7
Morocco 84 72 71 89 129 80 3.0 33.6
Oman 75 46 66 56 56 64 21.9 62.6
Palestine 16 50 32 31 26 93.7 71.7
Qatar 47
Saudi Arabia 38 24 49 77 34 55 25.9 51.8
Somalia n.a. n.a. n.a. n.a. n.a. 174 n.a. n.a.
Sudan 143 n.a. 160 n.a. 166 173 1.7 9.6
Syria n.a. n.a. 175 n.a. 118 159 n.a. n.a.
Tunisia 78 87 60 107 90 79 4.3 47
United Arab Emirates 36 12 22 25 40 25 43.0 98.4
Yemen 141 142 n.a. 133 154 161 1.4 n.a.
Total countries 143 144 189 165 187 174
Source: Global Innovation Index (GII), 2014, WIPO; Global Competitiveness Index (GCI), 2014-2015, WEF; Ease-of-Doing Business Index (EDBI), 2015, World Bank; Economic Freedom Index (EFI), 2015, Heritage Foundation; Human Development Index (HDI), 2014, UN; Corruption Perception Index (CPI), 2014, Transparency International; GDP per Capita (in USD), 2013, World Bank; Exports (% of GDP), 2013, World Bank.
ranked 119, stressing the need to deepen its market reforms efforts as well as stabilizing its macroeconomic and microeconomic environments. In addition, the lack of competition and rigid labor markets do not help Egypt achieve higher levels of competitiveness. A number of LAS countries, Algeria and Morocco for instance, need to address the quality of their educational systems ([23]). On the competitiveness dimension the divide is also present: Yemen is classified as a factor-driven economy, ranked 142. On the other extreme Qatar is classified as an innovation-driven economy, ranked 16 ([23]).
The Ease-of-Doing Business Index 2015 also showcases how some LAS coun-tries have been more diligent than others in creating a more welcoming envi-ronment for their private companies. The GCC countries of UAE, Saudi Arabia,

R. Gouvea, G. Vora
623
Qatar and Bahrain have the most inviting business environments. Countries like Algeria, Djibouti, Comoros and Mauritania, on the other hand, show onerous business environments which are not conducive to entrepreneurial activity. The economic divide permeating Arab League nations is a reflection of how these countries have addressed regulations affecting their business environments. For instance, UAE was ranked 22, Saudi Arabia 49, while Jordan was ranked 117. The World Bank ([24]) provides a vivid example of the efficiency of a country’s business environment in the cost of exports: looking at the USD cost per con-tainer, UAE shows a much lower cost than Jordan and Saudi Arabia.
The Economic Freedom Index reinforces the established rankings in the re-gion, i.e., the freer economic regimes are found in UAE, Qatar, Jordan, and Ba-hrain. Countries of Egypt, Algeria and Yemen show a strong interference by the government in their economic and business environments.
The GDP per capita numbers indicate that the most competitive and more market-oriented countries also show the highest levels of per capita income in the region. Qatar and UAE lead the LAS in a clear contrast to countries of Ye-men, Mauritania and Comoros.
The Human Development Index provides an alternative way of assessing a country’s multi-dimensional development. It includes variables such as healthy and long life, educational standards and standard of living. The index shows that countries like Qatar, Saudi Arabia, UAE, and Bahrain are able to achieve “very high levels of human development” whereas countries like Yemen, Comoros and Mauritania show “low levels of human development.” Again the GCC countries are able to attain a number of vital dimensions of socio-politico-economic de-velopment.
Transparency International’s Corruption Perception Index (CPI) indicates that the GCC countries, such as Qatar and UAE are the least corrupted countries in the LAS grouping and in the world. This adds credence to other indicators and further explains the successful trajectory of Qatar and UAE. These countries are able to balance neoliberal measures with an effective and efficient state, leading to stable economic and social development. Social safety net, trade libe-ralization policies, and micro- and macro-economic solid foundations are plac-ing them at the forefront of economic development and growth in LAS. Crucial-ly important, these two countries have substantial reserves in their sovereign wealth funds, the use of which could bolster human capital development and innovation and R&D strategies ([25]).
All in all Table 4 and Table 5 paint a diverse picture of socio-politico-eco- nomic development across the countries of LAS.
4. The Arab League’s Foreign Sector
Since the Arab Spring ([6]), several LAS countries have seen a deterioration in theirs external sector. For instance, the FDI flows into the LAS countries show a substantial change between 2002-2008 and the period post-financial crisis. Be-tween 2002-2008 the FDI flows increased from USD 5.4 billion to USD 91.7 bil-

R. Gouvea, G. Vora
624
lion, decreasing dramatically to only US$ 42.1 billion in 2013 ([9]). The real estate sector and the liberalization of the gas and oil industries in
some of the LAS countries helped to attract substantial amounts of the FDI dur-ing the period of 2002-2008. The financial-crisis years, however, deeply affected the real estate sector and tourism sector, imposed a downward pressure on oil prices, and internal geopolitical conflicts have all combined to add a negative impact on the attraction of foreign direct investment ([26]).
Another dimension of the heterogeneous nature of the LAS countries can be seen by looking at the net foreign assets of the GCC countries vis-à-vis countries like Egypt, Syria, Jordan, Lebanon and Morocco. In 2014, the GCC countries had forecasted net foreign assets of USD 2.27 trillion compared to forecasted nega-tive net foreign assets of USD 46.7 billion. In addition, the current accounts of the GCC countries were estimated to be around USD 300 billion in 2014, com-pared to USD 25.9 billion deficit for the other countries such as Egypt, Syria, Jordan, Lebanon and Morocco ([27]).
The dramatic reduction in oil prices in 2014 has had multi-faceted impacts. Kuwait and Saudi Arabia have refused to go along with some OPEC members such as Venezuela which was calling for a price hike. The different production costs and budgetary constraints drove this process. For instance, Algeria needs an estimated oil price of close to USD 121 per barrel to achieve a balance in its government budget whereas Qatar needs around USD 65. Oman and Bahrain are also vulnerable to lower oil prices ([28]).
Since the early 1950s, several attempts have been made to foster intra-trade amongst Arab countries. Starting with the Treaty on Transit Trade (TTT) and the subsequent efforts in the early 1980s to create an Arab Free Trade Area (AFTA), the Greater Arab Free Trade Zone (GAFTA) was established in the early 2000s. It aims to increase the interdependence of economies in the region, foster the creation of a more homogenous market, lead to economic efficiency gains, and result in trade-creation effects. Agricultural products, however, were left out (during the harvest season) penalizing GAFTA’s agricultural producers ([29]).
Table 2 showcases LAS’s trade structure by product group. There is a clear dichotomy amongst exporting countries. Some the countries show a much high-er degree of dependence on oil and natural gas exports than others. Iraq obtains close to 99 percent of its export earnings from oil whereas Tunisia obtains close to 74% from manufactured products. We also have countries that display a more balanced and diversified export portfolio such as Egypt and Lebanon. Table 2 showcases the very low levels of high-tech exports as a percentage of these coun-tries’ manufactured exports. For instance, Morocco and Tunisia show the high-est percentage with a six percent participation of high-tech exports as a share of total manufacturing exports whereas the large majority shows no exports of high-tech products at all. It is clear that LAS countries are trailing a number of South-East Asian countries that are currently showing much higher share of high-tech exports in their trade portfolios, e.g., Malaysia (44%) and Thailand

R. Gouvea, G. Vora
625
(21%) ([1]). The lofty goals of trade and mutual cooperation and development have yet to
be realized. A regional trading bloc, with or without monetary union, should at least show some results emanating from at least an informal (or formal) customs union. Such results seem to have eluded LAS.
Intra-LAS trade amongst the members constitutes a very small percentage of these countries’ total exports: around nine percent ([30]). Table 6 gives a com-parison of trade among the LAS countries: The grand average for years 1990, 1995 and 2000 is around nine percent. While the oil and natural gas exporters can depend on a continually strong global demand for energy, the same cannot be said for other countries in the bloc. Regional consumption and investment necessary for the former are essential for economic development however de-fined. That we do not observe large intra-LAS trade is quite puzzling.
Table 6. Inter-Arab and external trade.
1990 1995 2000
Country Total IAT Total ET Ratio Total IAT Total ET Ratio Total IAT Total ET Ratio
Algeria 469 20.689 2.27% 560 21.042 2.66% 553 29.223 1.89%
Bahrain 2.203 7.547 29.19% 2.169 7.83 27.7% 1.967 10.312 19.08%
Comoros
Djibouti
Egypt 481 11.801 4.07% 924 15.18 6.09% 1.919 18.469 10.39%
Iraq 1.578 16.839 9.37% 714 1.089 65.56% 1.05 16.843 6.23%
Jordan 1.056 3.504 30.13% 1.496 5.467 27.37% 1.081 6.496 16.65%
Kuwait 535 12.231 4.37% 1.263 20.616 6.12% 1.44 27.193 5.30%
Lebanon 643 2.972 21.62% 733 7.376 9.94% 1.058 6.944 15.24%
Libya 792 19.541 4.06% 1.135 13.697 8.29% 1.04 16.095 6.46%
Mauritania 27 857 3.15% 37 1.214 3.05% 35 1.095 3.22%
Morocco 1.405 12.142 11.57% 1.145 13.245 8.64% 1.008 20.375 4.95%
Oman 3.581 8.235 43.49% 2.142 10.313 20.77% 3.359 16.694 20.12%
Palestine
Qatar 386 4.988 7.75% 572 5.609 10.19% 1.269 14.779 8.59%
Saudi Arabia 5.772 68.498 8.43% 6.473 78.128 8.29% 9.249 109.055 8.48%
Somalia 111 545 20.37% 185 447 41.38% 146 576 25.39%
Sudan 535 1.819 29.41% 537 1.789 30.02% 535 3.359 15.93%
Syria 937 6.602 14.19% 1.298 8.595 15.10% 1.357 9.072 14.96%
Tunisia 775 9.684 8% 991 13.676 7.25% 1.151 14.229 8.09%
United Arab Emirates 2.236 33.389 6.7% 3.291 52.389 6.28% 6.682 82.879 8.6%
Yemen 552 3.946 14% 738 3.521 20.97% 1.045 6.418 16.28%
Total 24.073 245.83 9.79% 26.404 281.23 9.39% 34.107 410.11 8.32%
Source: http://www.medea.be/en/themes/economy-and-trade/arab-free-trade-area-afta/. IAT = inter-Arab trade; ET = external trade.

R. Gouvea, G. Vora
626
5. Data, Methods, Hypotheses and Expected Results
This section discusses the data and statistical details for our study. We use the me-thods from modern finance. This method should help us evaluate the returns on exports in light of fluctuations of exports. Modern finance has developed measure of fluctuations as well as risk-return tradeoff ratios. We discuss the details of da-ta, empirical methods, and hypotheses on world-trade-based fluctuations and performance ratios. The section concludes by detailing expected results.
5.1. Data
The sample consists of 21 countries (all the countries for LAS except Palestine (or West Bank and Gaza)) for the period from 1988 through 2012. Data are col-lected in nominal USD from the Direction of Trade Statistics published by In-ternational Monetary Fund. In our study because the numbers are expressed in nominal USD we need not adjust them for inflation in any local currency; the US dollar acts as the numeraire thereby helping us avoid the debate about real versus nominal quantities. Data are collected for the total global exports of each of the aforementioned country and the world as a whole. The last one serves as the broad market (index) of global trade. We use the annual data. Percentage changes are calculated from these annual numbers. These percentage changes are analogous to returns in the context of stock market assets. The total return in the stock market would include dividend. The total return on a stock consists of growth in price and dividend. For an average-price stock, however, the dividend amount is small enough to not make much difference in the time series of re-turns. Additionally the export trade numbers are in millions and there is nothing analogous to dividend in international trade. Therefore we call these percentage changes export returns or in short, returns. These export returns are used in the empirical methods described below.
5.2. Methods
We use a method from the Modern Portfolio Theory for the empirical work. The pricing model developed out of the insights of Markowitz ([31] [32]), Sharpe ([33]) and Lintner ([34]) is called the Capital Asset Pricing Model (CAPM)18. The pricing model gives an investor the tool to evaluate the risk-return tradeoff so that the investor can determine whether a risky asset would provide a rate of return commensurate with risk borne. This risk-return tradeoff of a risky asset is measured against that of the market as a whole where a broad-based index of risky assets is used to represent the market.
The aforementioned pricing model permits conceptualization of risk in two different ways. The first measure is the standard deviation of returns; this is a measure of the total risk. The second measure is the beta; this is a measure of the
18The equation of CAPM is given as ( ) ( ){ } ,i f m f iE R R E R R β= + − where ( )iE R is the expected
return on asset i for the next period, fR is the risk-free rate, ( )mE R is the expected return on the
market portfolio and iβ is the average sensitivity of asset i’s returns to those of the market portfo-lio.

R. Gouvea, G. Vora
627
average sensitivity of the returns of an asset to the returns of the market as a whole, i.e., the sensitivity to the fluctuations in the market. The total risk can be decomposed into the systematic risk and the unsystematic (also known as unique) risk. The beta is a measure of the systematic risk. The systematic risk is not diversifiable whereas the unique risk can be reduced by an optimal portfolio. The systematic risk is often sought to be reduced by other risk-management tools and methods, e.g., options and futures. Whereas the CAPM is used in many contexts, the investment-related applications have used the empirical ver-sion of the CAPM. This is called the single index model (SIM)19. If we take the perspective of a country in the context of the global trade, then export diversifi-cation is one method of reducing the risk inherent in the country’s export trade.
We refer the interested reader to Gouvea and Vora ([35]) who provide nu-merous citations to the application of SIM in various fields to demonstrate that the use of SIM to explore the topic of this study is well-established. We use SIM in a direct way to analyze the performance of export portfolios.
We wish to assess the sensitivity of exports to the fluctuations in global trade. The slope coefficient of the simple linear regression equation captures the sensi-tivity. In the context of investment theory, as mentioned before, this slope coef-ficient is called the beta and the regression equation is called the single index model. The estimation of the equation of the SIM is based on an index which serves as the benchmark. In this application, the benchmark is the total world exports. That a country’s or a portfolio’s exports would fluctuate with total world exports (trade) does not need explanation. The estimation is based on the annual arithmetic returns calculated from the total exports for a country, portfo-lio or the world ([35] [36]).
Sharpe ([37] [38] [39]) introduced one of the more popular reward-to-risk ra-tios, viz., the reward-to-variability ratio, more commonly called the Sharpe (performance) measure or the Sharpe ratio. The Sharpe ratio is defined as the ratio of the excess return and the standard deviation of that return20. Treynor ([40]) provided another popular reward-to-risk ratio, viz., the reward-to-vola- tility ratio, more commonly called the Treynor (performance) measure or the Treynor ratio. The Treynor ratio is defined as the ratio of the excess return and the systematic risk of that return21. Typically these ratios are calculated from the ex post data. Ex post ratios are mostly used for performance evaluation whereas ex ante ratios are often used for investment decision-making.
19The equation is given as , , , ,i t i i m t i tR Rα β ε= + + where in the current context, .i tR is the return
for country or portfolio i for period t, ,m tR is the return for the index m for period t, iα is the in-
tercept for country or portfolio i, iβ is the slope coefficient for country or portfolio i, and ,i tε is the error term for country or portfolio i for period t. 20Notationally the Sharpe Ratio is ( )i f iR R σ− , where iR is the arithmetic average of the returns
for country or portfolio i, fR is the arithmetic average of the risk-free return and iσ is the stan-dard deviation. 21Notationally the Treynor Ratio is ( )i f iR R β− , where iR is the arithmetic average of the returns
for country or portfolio i, fR is the arithmetic average of the risk-free return and iβ is the meas-ure of market-related risk.

R. Gouvea, G. Vora
628
We will need to make a slight modification while applying investment-theo- retic performance measures to evaluate countries’ export performance; we will use the ex post export return in place of excess export return for a country or its portfolio. This is equivalent to assuming that the risk-free rate is zero. Thus, we use close variants of the Sharpe ratio22 and the Treynor ratio23, which we will continue to refer as reward-to-risk ratios.
The best way to evaluate the risk-return tradeoff will be to compare these ra-tios with those of a portfolio of all the LAS countries and with those of the index.
5.3. Hypotheses
We wish to see whether export portfolios of all products of countries show di-vergent risk-return characteristics. We wish to describe whether their risk, de-scribed by two measures of volatility (own-volatility and market-based volatility) earns commensurate returns. The countries serve the role of assets and return on exports of the countries serve as asset returns. Given these methodological ne-cessities, the hypothesis can be stated succinctly as whether the betas of these countries are the same and whether the performance measures are the same.
We wish to examine three things. First, we want to examine the behavior of the betas of the countries and collectively their portfolio. We have already men-tioned that the beta shows the sensitivity of the export earnings to the index. Second, we wish to examine whether the Treynor ratios for the countries and their portfolio show any over- or under-performance. The Treynor ratio is de-fined as the ratio of the average return for the sample period and the beta. It is an indicator of the return earned per unit of systematic risk. Third, we wish to examine whether the Sharpe ratios for the countries and their portfolio show any over- or under-performance. The Sharpe ratio is defined as the ratio of the av-erage return for the sample period and the standard deviation. It is an indicator of the return earned per unit of its own total volatility. Depending on the need of the examination and the perspective used, one or the other performance meas-ure may be preferred.
5.4. Expected Results
If exports of the LAS countries are treated equally in global trade, then we should get the result that all countries’ exports are equally sensitive to the aggre-gate exports of the world and the risk-return tradeoff is similar for them. If, on the other hand, these countries are treated differently (because of intrinsic dif-ferences), then we should get the result that their sensitivity to the aggregate ex-
22In the context of this study, we need not use the risk-free rate. Alternatively, fR may be consi-
dered equal to zero. Therefore the Sharpe Ratio becomes i iR σ where iR is the arithmetic aver-
age of the returns for country or portfolio i and iσ is the standard deviation of the returns for country or portfolio i. 23In the context of this study, we need not use the risk-free rate. Alternatively, fR may be consi-
dered equal to zero. Therefore the Treynor Ratio becomes i iR β , where iR is the arithmetic av-
erage of the returns for country or portfolio i and iβ is the measure of market-related risk.

R. Gouvea, G. Vora
629
ports of the world and the risk-return tradeoff is different. The implications for economic policy, industrial policy, business policies, social policies, etc., will be different in these two cases overall and different for individual countries. These implications are discussed in later sections.
6. Results
Table 7 gives the single index model estimates for the countries and the portfo-lio, using the full sample period of 1989 through 2012 for returns. The coeffi-cients of intercept and slope are reported along with their t-statistics below the coefficients. The statistical significance at 10 percent, 5 percent and 1 percent are indicated by asterisks. Mean returns and standard deviations of the returns are given columns 3 and 4.
As highlighted on Table 7, the LAS countries show a widely diverse response to global trade fluctuations. The beta showing the sensitivity of export portfolios is way higher for oil-exporters than non-oil exporters. For instance, the beta for Algeria is 1.65 which is in line with that of others oil exporting countries such as Saudi Arabia at 1.95, UAE at 1.74 and Sudan at 1.7. Thus, these countries expe-rienced higher levels of volatility in their responses to global trade fluctuations.
Countries with a higher content of manufactured products in their export portfolios, on the other hand, such as Jordan, Lebanon, Morocco and Tunisia, show export portfolio betas well below levels experienced by countries with a heavy dependence on oil and natural gas. For instance, the beta of Tunisia is 0.87, Lebanon 0.32, Jordan 0.34, and Morocco 1.08. Thus, these countries expe-rienced lower levels of volatility in their responses to global trade fluctuations. On the other hand, low betas for both Lebanon and Jordan also reflect the low competitive nature of their export portfolio composition, i.e., these two coun-tries are not fully responding to global trade trends, consequently they are not able to take full advantage of global trade opportunities. Contrastingly Moroc-co’s export portfolio beta shows that that the country follows trade trends.
In sum, 13 out of the 21 LAS countries, all of them oil-exporting nations, show betas higher than the market beta. This constitutes a higher sensitivity and thus volatility of their export earnings. On the other hand, countries with a higher share of manufactured products shows a much lower level of volatility, although again there are substantial differences among countries. Moreover, it is important to mention that the “what you export matters”, i.e., manufactured exports with a larger global market and higher value-added tend to also benefit nations with betas closer to the global market beta ([35]).
Figure 1 illustrates the Sharpe ratio for the LAS countries, the portfolio of all countries and the world index. Adjusting for risk, Qatar shows the highest Sharpe ratio denoting a performance superior to the index, followed by UAE and Bahrain. Note, however, that these countries are naturally able to create ex-port portfolios, i.e., the composition of their exports that allow them to have a higher Sharpe ratio which is not possible for Comoros and Syria. Countries with high levels of manufactured products in their export portfolios also fared rela-

R. Gouvea, G. Vora
630
Table 7. Single index model results for countries of LAS and LAS portfolio for period from 1989 through 2012.
Code Country Mean
Return Standard Deviation
Intercept Slope Sharpe Ratio
Treynor Ratio
DZA Algeria 0.123100 0.247497 −0.019240 1.655692*** 0.497381 0.074350
−0.385459 4.367333
BHR Bahrain, Kingdom of 0.140926 0.204083 0.041414 1.157518*** 0.690533 0.121749
0.902225 3.320141
COM Comoros 0.160121 0.569447 0.219137 −0.686468 0.281187 −0.233253
1.407135 −0.580368
DJI Djibouti 0.1180290 0.203441 0.124336 −0.070327 0.581444 −1.682004
2.219223 −0.165267
EGY Egypt 0.141842 0.253590 0.040227 1.181977** 0.559337 0.120004
0.654082 2.530365
IRQ Iraq 0.365089 1.006258 0.290630 0.866100 0.362819 0.421532
1.052161 0.412830
JOR Jordan 0.096400 0.195783 0.067002 0.341955 0.492382 0.281908
1.262037 0.848042
KWT Kuwait 0.325389 0.960841 0.208789 1.356281 0.338650 0.239913
0.796835 0.681510
LBN Lebanon 0.103399 0.202983 0.075792 0.321133 0.509399 0.321983
1.372933 0.765907
LBY Libya 0.179508 0.519595 0.095514 0.977006 0.345475 0.183732
0.679662 0.915344
MRT Mauritania 0.088673 0.199684 −0.037308 1.465412*** 0.444069 0.060511
−1.020788 5.279006
MAR Morocco 0.092382 0.210018 −0.000883 1.084849*** 0.439876 0.085157
−0.017936 2.902288
OMN Oman 0.128127 0.205319 0.015812 1.306435*** 0.624037 0.098074
0.367000 3.992308
QAT Qatar 0.206804 0.239096 0.072731 1.559521*** 0.864939 0.132607
1.477052 4.169910
SAU Saudi Arabia 0.152466 0.256821 −0.015177 1.950015*** 0.593666 0.078187
−0.338341 5.723418
SOM Somalia 0.094013 0.209209 0.003416 1.053816** 0.449372 0.089212
0.069033 2.803947
SDN Sudan 0.140869 0.369848 −0.007849 1.729878** 0.380884 0.081433
−0.087594 2.541798
SYR Syrian Arab Republic 0.233699 0.713212 0.037380 2.283579 0.327671 0.102339
0.201193 1.618291

R. Gouvea, G. Vora
631
Continued
TUN Tunisia 0.093219 0.145194 0.018107 0.873697*** 0.642034 0.106695
0.572791 3.638848
ARE United Arab Emirates 0.153127 0.213619 0.003198 1.743967*** 0.716822 0.087804
0.097814 7.023750
YEM Yemen, Republic of 0.188003 0.509183 −0.043888 2.757346*** 0.369224 0.068182
−0.374333 3.139302
Port Portfolio 0.136609 0.211252 −0.009328 1.697527*** 0.646663 0.080475
−0.278936 6.683492
World World 0.085970 0.101865 1.000000 0.843961 0.085970
Notes: Annual returns for countries and all the countries in a portfolio. The first row gives the value of the coefficients. The second row gives the t-stat for the coefficients. The critical values for t-stat for DF = 21 are 2.8314 (1%), 2.0796 (5%) and 1.7207 (10%), except for Yemen for which t-stat for DF = 19 are 2.8609 (1%), 2.0930 (5%) and 1.7291 (10%). These are designated by ***, ** and * respectively.
Figure 1. Sharpe ratio for countries, portfolio and world index.
tively well such as Tunisia, Jordan, Morocco and Lebanon. On the lower side of performance we find Syria, Kuwait and Iraq.
Figure 2 illustrates the Treynor ratios for the LAS countries, the portfolio of all countries and the world index. Manufactured products-intensive exporters such as Lebanon, Jordan, Tunisia and Morocco fared better than oil-exporting countries. Yemen and Syria show the worst Treynor ratio performance for the

R. Gouvea, G. Vora
632
Figure 2. Treynor ratio for countries, portfolio and world index.
grouped by Syria. Iraq is the outlier in the group. Comoros (COM) and Djibouti (DJI) are outliers because they have a negative beta. Figure 2 shows that Treynor ratios are tightly bunched thereby causing some overlapping points.
The next section provides some caveats for interpretation and discusses policy implications.
7. Caveats and Implications for Policies
The results mentioned in the earlier section are more or less not unexpected. We have done what we had set out to do, i.e., explore empirically the performance of exports (or export earnings) of countries comprising the Arab League.
Recognize that we have not used the Markowitz model of constructing optim-al portfolios. The Markowitz model needs both a full variance-covariance matrix and returns of the assets (here countries) in expectations terms. The outcome of the Markowitz model is an optimal portfolio where the optimality is defined as follows: Maximize a portfolio’s rate of return given a level of risk in standard deviation or minimize a portfolio’s risk in standard deviation given a level of portfolio return. The Markowitz model is not an equilibrium asset-pricing mo- del.
We are using the single index model which is the ex post counterpart of the ex ante asset-pricing model designated as CAPM. The performance evaluation

R. Gouvea, G. Vora
633
measurements due to Sharpe and Treynor do use the building blocks of the sin-gle index model.
In general the above interpretation must give pause to policy-makers in both developed and under-developed countries. The policies directed (extremely) narrowly (say, for niche markets) are likely to be less fruitful than broader poli-cies. The policies of export zones, special economic zones, clusters of one type or another, export promotion policies, profligate subsidies and crude attempts at protection which might have worked for manufacturing may not work with equal efficiency or efficacy.
This brings us to the composition of exports. As detailed in Table 2 and Table 3, in general a diversified portfolio of exports helps a country’s development. The oil-exporters have done well mainly because energy is the engine of global economy. The contrast between Figure 1 and Figure 2 is eye-catching in terms of volatility of export earnings. Note that the aim of the present research is ex-port volatility and export composition. We have added the information on glo-balization and socio-politico-economic indicators of the countries of the Arab League. An analysis of these factors and their relationship to economic growth is beyond the scope of this paper.
Nevertheless, the LAS countries require special attention. We provide some salient policy implications in the next section.
8. Arab League’s Structural Challenges
The LAS countries face a number of economic and social structural challenges. Some LAS countries have been more effectively addressing them than others. A number of these challenges have a direct impact on these countries’ economies and export performance. 1) Transitioning from a Natural-Based-Resource Economy to a Knowledge-
Driven Economy Fostering entrepreneurship in these countries may provide the answer to the
low productivity and high unemployment plaguing their economies. Thus, the creation of private sector jobs, by promoting small and medium size companies, since they create more jobs than more capital intensive companies, is becoming of paramount economic and business strategic importance for the LAS coun-tries. Investor confidence necessitates serious effort for removal of barriers for the fostering of local private sector initiatives. Private sector’s investment and growth would increase growth and development prospects for the entire region. The creation of a more diversified pool of exporting companies would help alle-viate these countries’ dependence on natural-resource-based goods ([41] [42]).
Thus, the transition from an oil and natural gas producer economy to a knowledge-driven economy is of paramount importance to reposition LAS in the global economy. Thus, increasing the complexity of their economies, en-hancing their innovation and economic competitiveness, and designing new de-velopment pathways are becoming a major priority for these economies ([43]).
It is worth noting that World Economic Forum ([44]) classifies the LAS coun-

R. Gouvea, G. Vora
634
tries as follows: Stage 1: Mauritania and Yemen; Transitioning from Stage 1 to Stage 2: Algeria, Kuwait, Libya and Saudi Arabia; Stage 2: Egypt, Jordan, Mo-rocco and Tunisia; Transitioning from Stage 2 to Stage 3: Bahrain, Lebanon, Oman and UAE; Stage 3: Qatar24. This categorization for a bloc with stupendous natural resources whose demand is relatively less price-sensitive is astonishing. This categorization is expected to worsen with the continuing strife in the region and expense of a country’s wealth on unproductive uses.
The establishment of an innovation and R&D mindset that permeates the whole of these economies is also a pre-condition for the embracing of an alter-native growth path strategy such as knowledge-driven economic strategy. The increasing economic diversification, stressing more value-added products and services, is of paramount importance in the process of embracing entrepreneur-ship and job creation. Such a strategy would deepen the integration of the LAS economies in the global supply chain of services and products. In light of this, the creation of a quadruple innovation helix bringing together the private sector, government, academic and research units and consumers will deepen and ex-pand innovation and knowledge driven efforts ([43] [45] [46]).
The erection of innovation systems for a number of Arab League nations will have a positive impact on productivity gains, increase in the share of technology content on these countries’ exports, amongst other economic and social impacts. These countries also need to address the challenge of “brain drain”. It is esti-mated that more than 50% of students do not return to their countries of origin thereby further compromising these countries’ ability to create innovation sys-tems. The number of patents and levels of investment on R&D will need a boost. Thus, the creation of dynamic innovations systems in these economies may help to retain and to reverse the brain drain trend ([30]).
Initiatives such as the exploration of alternative energy sources to meet in-creasing energy demand needs by a number of LAS countries could become a vital strategy. Qatar, UAE and Saudi Arabia are pioneers in this regard. For in-stance, Saudi Arabia’s King Abdullah City for Atomic and Renewable Energy (K.A.CARE) initiatives to boost its domestic solar energy sector will have dra-matic impacts on its innovation and technology efforts. The efforts to build “energy corridors” to export solar energy to other nearby nations such as the GCC countries would help to diversify Saudi Arabia’s export portfolio. Moreo-ver, initiatives such as the Trans-Mediterranean Renewable Energy Cooperation and the interconnection of power grids between the GCC and Saudi Arabia (Gulf Cooperation Council Interconnection Authority) would further reinforce the possibilities to increase exports of renewable and sustainable energy by Saudi Arabia ([47]). 2) Job Creation
One of the most pressing issues facing the region is the high rates of unem-ployment, in particular, youth unemployment ([48]). Changes aimed at diversi-fying the economic structure of these countries, putting a premium on manu-
24Comoros, Djibouti, Iraq, Somalia, Sudan and Syria do not enough information for classification.

R. Gouvea, G. Vora
635
facturing and service industries stressing value-added, with a high capability of utilizing local labor may provide one of the answers to this issue. Novel ways for labor absorption will need to be implemented.
With an average of 30% youth population unemployment, the region is not creating a hopeful future environment for its youth, further compromising social stability. Efforts need to be made to design educational triple helix arrange-ments, where the private sector, educational institutions, and local governments interact to develop synergies in order to provide workers with a more competi-tive set of skills, easing their penetration in local labor markets. This needed set of skills in fields such as science and engineering would address the changing needs of the local private sector and government agencies. In addition, it would have a dramatic impact on these countries’ economic efficiency and competi-tiveness ([27] [49] [50]).
The employment divide between the countries in LAS is quite interesting and poses formidable challenges. The developing countries are suffering from unem-ployment of various degrees whereas the developed countries are importing temporary workers from Indian subcontinent and Pacific Rim countries. This situation calls for a coordinated policy among the member-states. The LAS countries already have two major advantages for easier cross-border immigra-tion, permanent or temporary, viz., (1) the language and (2) the similarity of culture. This would increase not only remittances but also domestic consump-tion and consequently savings and development. 3) Fostering an Equitable and Inclusive Economic and Social Environment
Social mobility and the creation and expansion of a middle class in the region are also a major challenge confronting these countries. Some member countries such as Qatar, UAE, Saudi Arabia and Kuwait have taken the first steps to con-solidate an emerging middle-class, but the other countries still have to under-stand the importance of reducing income inequality to build a sustainable, equitable and inclusive economic growth and development strategy. For in-stance, the share of women in the region’s labor force is around 26%, well below global averages ([51]). 4) Millennium Development Goals
It is well accepted that the “Arab Spring” was a result of unemployment, in-come-inequalities, poor quality of government services, lack of political and economic transparency, and governance issues ([27] [51]).
The LAS countries are substantially lagging in their Millennium Development Goals. Issues such as hunger and undernourishment, poor access to health care services, and access to water plague a number of countries in the region ([51]).
Fostering labor-intensive industries in conjunction with capital-intensive ones, and stressing educational opportunities and fostering gender equality op-portunities could be major steps towards building a more inclusive and equitable society in the region, helping to address a number of the millennium goals for the region. It is clear that actions need to be taken to lower the income-divide present amongst the LAS countries.

R. Gouvea, G. Vora
636
5) Encouraging the Intra-LAS Trade and FDI If the goals of Article 2 of the Pact of the Arab League States (see Section 1)
are to be achieved, then it needs an unabashed bloc-wide champion. The world has gathered enough evidence through GATT, WTO, UNCTAD, IMF, IBRD, ADB, NAFTA, and the like25, that trade blocs or still tighter webs of integration are helpful in lifting millions out of poverty and pushing millions into a better and fulfilling life by almost any socioeconomic indicators. As we noted in an earlier section the intra-LAS trade is abysmally small. This situation cannot be allowed to continue. Whatever is necessary must be done. If this requires major overhauls in social and economic policies, they must be undertaken. Some rec-ommendations are given above. The most important recommendation follows: political stability and individual, personal empowerment are condiciones sine quibus non. Citing China’s26 authoritarian rule is not enough to satisfy the local population who expects more of its political leaders. Reliance on the GCC- countries is not enough for the bloc to make rapid progress. A whole slew of re-forms is necessary. 6) Developing Exports of Creative Goods and Services
The peoples of the LAS countries have the history and traditions of millennia behind them for creativity. The colonial past or the current warfare is unlikely to dim the innate genius of Arabs for creative goods and services and trade therein. While the governments are implementing the recommendations made in Sec-tion 8.1, we recommend that simultaneously they undertake to promote indus-tries devoted to creative goods and services. Global trade in these is increasing rapidly. The League can easily leapfrog other individual countries and trading blocs if policies are developed and implemented collectively.
9. Conclusions and Final Remarks
Section 7 of this paper discussed in some detail limitations of the empirical work, important caveats in the interpretation of results and policy implications for both business firms and countries. Section 8 of this paper discussed in details some of more salient policy implications because the LAS countries are hetero-geneous and at different points in their development cycle. Exports and eco-nomic development of a country are almost always important to a country whether emerging or developed. They assume a greater significance for a volatile region of the world. The LAS countries are confronted with twin sets of prob-lems: Not all LAS countries have oil-based earnings and almost all LAS countries have structural impediments for faster growth.
Since the early 1990s, the increasing exposure of the LAS countries to globali-zation forces has provided additional pressure on their economic policies. The lack of effective economic and social policies and strategies to integrate these
25As if this were not enough, China, India and other 19 countries founded the Asian Infrastructure Investment Bank (AIIB) to speed up the process of targetted FDI where the targets are the infra-structure projects in the Asia region. 26China has slowly abandoned its communist tendencies since 1978 when Deng Xiaoping led it through revolutionary market-economy reforms.

R. Gouvea, G. Vora
637
countries more effectively into the global economy has stressed their economies and societies. Factors such as the lack of attention to human capital development and productivity enhancement, the lack of effective, transparent and efficient in-stitutions, the poor infrastructure development in non-GCC countries, and ma-cro- and micro-economic instability in non-GCC countries have contributed to a severe income and social amongst the LAS countries ([52]).
In sum, growth remains imbalanced in the region and fragile in a number of non-GCC countries. Growth in oil-importing countries is lagging behind growth in oil-exporting countries. Morocco is an exception amongst non-oil exporting countries, helped by tourism and exports of manufactured products and high-tech products. In addition, increasing security and political instability is-sues are affecting growth and development prospects in the region ([53] [54]).
Thus, governments of the LAS countries need to devise new development and growth paths for their economies. Arab League countries must make an effort to avoid creating or continuing distorted growth, such as the rent-seeking economy model so ingrained in many of LAS countries ([30] [55]). The extreme concen-tration of investments in a few sectors, such as petrochemicals, oil, gas and tour-ism tends to prevent a virtuous cycle of economic and social growth. The diver-sification of investments leading to higher levels of entrepreneurial activity will certainly have positive impacts on employment, productivity growth, export di-versification, foreign direct investment attraction, and on the increasing eco-nomic complexity of these economies ([26] [47] [56] [57] [58]).
These remarks point out the avenues for further research. Supranational or-ganizations such as the World Bank, IMF, UNCTAD, etc. do indeed have re-search programs on regional economic development. This research needs to be expanded to include a dissection of constraints and impediments to all-inclusive growth in the Arab League. In spite of the continual political uncertainty and so-cial upheavals the countries of the Arab League possess the potential to not only overcome them but also make a sustained concrete move towards the Millen-nium Development Goals. Development in all aspects of their societies’ evolu-tion is urgent and long overdue. Researchers can help in this effort.
References [1] World Bank Group (2015) Global Economic Prospects, January 2015: Having Fiscal
Space and Using It. World Bank, Washington DC. https://openknowledge.worldbank.org/handle/10986/20758
[2] World Bank Group (2015) Global Economic Prospects, June 2015: The Global Eco- nomy in Transition. World Bank, Washington DC. https://openknowledge.worldbank.org/handle/10986/21999
[3] United Nations (2015) World Economic Situation and Prospects 2015. United Na-tions, New York. http://www.un.org/en/development/desa/policy/wesp/wesp_archive/2015wesp_full_en.pdf
[4] World Bank (2016) Global Economic Prospects: Divergences and Risks. June. World Bank, Washington DC.

R. Gouvea, G. Vora
638
http://pubdocs.worldbank.org/en/842861463605615468/Global-Economic-Prospects-June-2016-Divergences-and-risks.pdf
[5] World Bank (2016) Global Economic Prospects: Spillovers amid Weak Growth. January. World Bank, Washington DC. http://pubdocs.worldbank.org/en/697191452035053704/Global-Economic-Prospects-January-2016-Spillovers-amid-weak-growth.pdf
[6] Cammett, M. and Diwan, I. (2013) The Political Economy of the Arab Uprisings. Westview Press, Boulder, CO.
[7] Gaub, F. and Laban, A. (2015) Arab Futures: Three Scenarios for 2025. European Union Institute for Security Studies, Report No. 22, Paris, February. http://www.iss.europa.eu/uploads/media/Report_22_Arab_futures.pdf
[8] IMF (2016) Uncertainty in the Aftermath of the U.K. Referendum. July. IMF World Economic Outlook (WEO) Update. IMF, Washington DC. https://www.imf.org/external/pubs/ft/weo/2016/update/02/
[9] UNCTAD (2015) Global FDI Flows Declines in 2014. China Becomes the World’s Top FDI Recipient. Global Investment Trends Monitor, No. 18. UNCTAD, Geneva. http://unctad.org/en/PublicationsLibrary/webdiaeia2015d1_en.pdf
[10] Mina, W. (2014) United Arab Emirates FDI Outlook. The World Economy, 37, 1716-1730. https://doi.org/10.1111/twec.12169
[11] El-Azez Safi, A. (2011) Foreign Direct Investment in the Arab World: An Analysis of Flows and an Evaluation of Country Specific Business Environment. Master’s Thesis, University of Trento, Trento, Italy.
[12] OECD (2014) Draft Background Note: Recent FDI Trends in the MENA Region. December. OECD, Paris, France. https://www.oecd.org/mena/competitiveness/Draft%20Note_FDI%20trends%20in%20MENA_Dec.%202014.pdf
[13] Abdmoulah, W. (2011) Arab Trade Integration: Evidence from Zero-Inflated Nega-tive Binomial Model. Journal of Economic Cooperation and Development, 32, 39- 66. http://www.sesric.org/pdf.php?file=ART10091401-2.pdf
[14] Balassa, B. (1978) Exports and Economic Growth: Further Evidence. Journal of De-velopment Economics, 5, 181-189. https://doi.org/10.1016/0304-3878(78)90006-8
[15] Brainard, W. and Cooper, R. (1968) Uncertainty and Diversification in Internation-al Trade. Food Research Institute Studies in Agricultural Economics, Trade, and Development, 8, 256-285.
[16] Michaely, M. (1962) Concentration in International Trade. North-Holland, Ams-terdam.
[17] Michaely, M. (1977) Exports and Growth: An Empirical Investigation. Journal of Development Economics, 4, 49-53. https://doi.org/10.1016/0304-3878(77)90006-2
[18] MacBean, A.I. (1966) Export Instability and Economic Development. Allen and Unwin, London.
[19] Love, J. (1986) Commodity Concentration and Export Earnings Instability: A Shift from Cross-Section to Time Series Analysis. Journal of Development Economics, 24, 239-248. https://doi.org/10.1016/0304-3878(86)90090-8
[20] Gersovitz, M. and Paxson, C. (1990) The Economies of Africa and the Prices of Their Exports. Princeton Studies in International Finance, No. 68, October. De-partment of Economics, Princeton University, New Jersey. https://www.princeton.edu/~ies/IES_Studies/S68.pdf
[21] Di Giovanni, J. and Levchenko, A.A. (2011) The Risk Content of Exports: A Portfo-lio View of International Trade. In: Frankel, J. and Pissarides, C., Eds., NBER In-

R. Gouvea, G. Vora
639
ternational Seminar on Macroeconomics 2011, University of Chicago Press, Chica-go.
[22] Abu Shihab, R. and Abdul-Khaliq, T.S.S. (2014) The Causal Relationship between Exports and Economic Growth in Jordan. International Journal of Business and So-cial Science, 5, 302-308.
[23] Sala-i-Martín, X., Bilbao-Osorio, B., Di Battista, A., Drzeniek Hanouz, M., Galvan, C. and Geiger, T. (2014) The Global Competitiveness Index 2014-2015: Accelerating a Robust Recovery to Create Productive Jobs and Support Inclusive Growth. In: Schwab, K., Ed., The Global Competitiveness Report, Chapter 1.1, World Economic Forum, Geneva, 3-52. http://www3.weforum.org/docs/WEF_GlobalCompetitivenessReport_2014-15.pdf
[24] World Bank (2014) Doing Business 2015, Going beyond Efficiency. 12th Edition (Economy Profile 2015: United Arab Emirates). October. World Bank, Washington DC. https://openknowledge.worldbank.org/bitstream/handle/10986/20988/921530WP0Box380ab0Emirates00Public0.pdf?sequence=1&isAllowed=y http://www.doingbusiness.org/~/media/WBG/DoingBusiness/Documents/Annual-Reports/English/DB15-Full-Report.pdf
[25] BTI (2014) United Arab Emirates Country Report. Bertelsmann Stiftung Transfor-mation Index BTI, Gütersloh, Germany. https://www.bti-project.org/fileadmin/files/BTI/Downloads/Reports/2014/pdf/BTI_2014_United_Arab_Emirates.pdf
[26] Hussein, K. (2014) FDI Trends in the Arab Region. Presentation: UN Economic and Social Commission for Western Asia (ESCWA). https://www.finances.gov.ma/Docs/2015/DTFE/DAY%201%20Khaled%20Hussein%20UNESCWA%20FDI%20Trends%20in%20the%20Arab%20region.pdf
[27] Hanieh, Adam (2015) Fundamental Rifts: Power, Wealth and Inequality in the Arab World. 28 February. Middle East Monitor, UK. https://www.middleeastmonitor.com/20150228-fundamental-rifts-power-wealth-and-inequality-in-the-arab-world/
[28] Aggarwal, V.K. (2014) The Political Economy of Falling Oil Prices: Implications for Arab Gulf States and the U.S. The Arab Gulf States Institute in Washington, Wash-ington DC. http://www.agsiw.org/wp-content/uploads/2015/01/AGSIW-The-Political-Economy-of-Falling-Oil-Prices.pdf
[29] MEDEA Institute (2014) Arab Free Trade Area (AFTA). MEDEA Institute, Brus-sels, Belgium. http://www.medea.be/en/themes/economy-and-trade/arab-free-trade-area-afta/
[30] Corm, G. (2015) The Political Economy of Democratic Transition in the Arab Situ-ation. Contemporary Arab Affairs, 8, 22-38. https://doi.org/10.1080/17550912.2014.976403
[31] Markowitz, H.M. (1952) Portfolio Selection. Journal of Finance, 7, 77-91. https://doi.org/10.1111/j.1540-6261.1952.tb01525.x
[32] Markowitz, H.M. (1959) Portfolio Selection: Efficient Diversification of Invest-ments. John Wiley & Sons, New York.
[33] Sharpe, W.F. (1964) Capital Asset Prices: A Theory of Market Equilibrium under Conditions of Risk. Journal of Finance, 19, 425-442. https://doi.org/10.1111/j.1540-6261.1964.tb02865.x
[34] Lintner, J. (1965) The Valuation of Risk Assets and the Selection of Risky Invest-ments in Stock Portfolios and Capital Budgets. Review of Economics and Statistics,

R. Gouvea, G. Vora
640
47, 13-37. https://doi.org/10.2307/1924119
[35] Gouvea, R. and Vora, G. (2015) Reassessing Export Diversification Strategies: A Cross-Country Comparison. Modern Economy, 6, 96-118. https://doi.org/10.4236/me.2015.61009
[36] Gouvea, R. and Vora, G. (2016) Global Trade in Creative Services: An Empirical Exploration. Creative Industries Journal, 9, 66-93. https://doi.org/10.1080/17510694.2016.1206361
[37] Sharpe, W.F. (1966) Mutual Fund Performance. Journal of Business, 39, 119-138. https://doi.org/10.1086/294846
[38] Sharpe, W.F. (1975) Adjusting for Risk in Portfolio Performance Measurement. Journal of Portfolio Management, 1, 29-34. https://doi.org/10.3905/jpm.1975.408513
[39] Sharpe, W.F. (1994) The Sharpe Ratio. Journal of Portfolio Management, 21, 49-58. https://doi.org/10.3905/jpm.1994.409501
[40] Treynor, J.L. (1965) How to Rate Management of Investment Funds. Harvard Busi-ness Review, 43, 63-75.
[41] Esfahani, H., Mohaddes, K. and Pesaran, M. (2014) An Empirical Growth Model for Major Oil Exporters. Journal of Applied Econometrics, 29, 1-21. https://doi.org/10.1002/jae.2294
[42] IMF (2014) Middle East, North Africa, Pakistan, and Afghanistan: Turning the Corner? Working Paper. IMF Middle East and Central Asia Department (Regional Economic Outlook Update) IMF, Washington DC. https://www.imf.org/external/pubs/ft/reo/2014/mcd/eng/pdf/menap0514.pdf
[43] Al Thani, M.A.J. (2013) Arab Spring & the Gulf States: Time to Embrace Change. Profile Books, London.
[44] World Economic Forum (2014) The Global Competitiveness Report 2014-2015. World Economic Forum, Geneva.
[45] Driouchi, A. (2014) Knowledge Economy in the Arab World: Towards New Eco-nomic Development Policies. In: Driouchi, A., Ed., Knowledge-Based Economic Policy Development in the Arab World, Chap. 1, IGI Global, Hershey, PA, 1-21. http://www.igi-global.com/chapter/knowledge-economy-in-the-arab-world/97780
[46] Hvidt, M. (2015) Transformation of the Arab Gulf Economies into Knowledge Economies: Motivational Issues Related to the Tertiary Education Sector. Working Paper, Arab Center for Research and Policy Studies, Doha, Qatar. http://english.dohainstitute.org/file/Get/50639fc8-77e4-4193-b90d-d468227c3504
[47] Alkoblan, Y. (2015) Saudi Arabia Beyond Oil-Based Economy. Global Energy Net-work Institute, San Diego, CA. http://www.geni.org/globalenergy/research/saudi-arabia-beyond-oil/Saudi-Arabia-Beyond-Oil-Based-Economy-Alkoblan-Yousef-Feb-2015.pdf
[48] Elbadawi, I. and Loayza, N. (2008) Informality, Employment and Economic Devel-opment in the Arab World. Journal of Development and Economic Policies, 10, 27-75. http://siteresources.worldbank.org/DEC/Resources/Elbadawi_InformalityEmploymentandEconomicDevpt.pdf
[49] Huggins, R., Izushi, H., Prokop, D. and Thompson, P. (2014) The Global Competi-tiveness of Regions. Routledge, London.
[50] Kreishan, F. (2014) The Economics of Tourism in Jordan: A Statistical Study Dur-ing the Period 1990-2011. Arab Economic and Business Journal, 9, 37-45.
[51] Abu-Ismail, K., Kuncic, A., Prasad, N. and Sarangi, N. (2014) An Arab Perspective

R. Gouvea, G. Vora
641
on the Post 2015 Agenda: National Targets, Regional Priorities and Global Goals. Working Paper, United Nations Economic and Social Commission for Western Asia (ESCWA). https://www.unescwa.org/sites/www.unescwa.org/files/publications/files/e_escwa_edgd_14_wp-1_e.pdf
[52] Iqbal, Z. (2014) The Arab Awakening: Determinants and Economic Consequences. Working Paper, Middle East Institute, Washington DC. http://www.mei.edu/content/arab-awakening-determinants-and-economic-consequences
[53] Hausmann, R., Hidalgo, C.A., Bustos, S., Coscia, M., Simoes, A. and Yildirim, M.A. (2014) The Atlas of Economic Complexity: Mapping Paths to Prosperity. MIT Press, Cambridge, MA.
[54] World Bank (2015) MENA Economic Monitor, April 2015: Towards a New Social Contract. World Bank, Washington DC. http://www.worldbank.org/en/region/mena/publication/mena-economic-monitor-april-2015-new-social-contract
[55] World Bank (2015) MENA Economic Monitor, October 2015: Inequality, Upris-ings, and Conflict in the Arab World. World Bank, Washington DC. http://www.worldbank.org/en/region/mena/publication/mena-economic-monitor-october-2015-inequality-uprising-conflict-arab-world
[56] Al Khouri, R. (2013) Economic Dimensions of the Arab Spring. June. Foreign Poli-cy Research Institute, Philadelphia, PA. http://www.fpri.org/docs/Khouri_-_Economic_Dimensions_of_Arab_Spring.pdf
[57] Khan, M. (2014) The Economic Consequences of the Arab Spring. February. Atlan-tic Council, Washington DC. http://www.atlanticcouncil.org/images/publications/The_Economic_Consequences_of_the_Arab_Spring.pdf
[58] IMF (2014) Arab Countries in Transition: Economic Outlook and Key Challenges. October 9. Working Paper, IMF, Washington DC. https://www.imf.org/external/np/pp/eng/2014/100914.pdf
[59] Dreher, A. (2006) Does Globalization Affect Growth? Evidence from a New Index of Globalization. Applied Economics, 38, 1091-1110. https://doi.org/10.1080/00036840500392078
[60] Dreher, A., Gaston, N. and Martens, P. (2008) Measuring Globalisation—Gauging Its Consequences. Springer, New York.

Submit or recommend next manuscript to SCIRP and we will provide best service for you:
Accepting pre-submission inquiries through Email, Facebook, LinkedIn, Twitter, etc. A wide selection of journals (inclusive of 9 subjects, more than 200 journals) Providing 24-hour high-quality service User-friendly online submission system Fair and swift peer-review system Efficient typesetting and proofreading procedure Display of the result of downloads and visits, as well as the number of cited articles Maximum dissemination of your research work
Submit your manuscript at: http://papersubmission.scirp.org/ Or contact [email protected]