the application of an ultrasonic shear wave reflection method for
TRANSCRIPT

The application of an ultrasonic shear wave reflectionmethod for nondestructive testing of cement-based
materials at early ages


The Application of an UltrasonicShear Wave Reflection Methodfor Nondestructive Testing ofCement-Based Materials at Early Ages
An Experimental and Numerical Analysis
by Dr.-Ing. Thomas Voigt
Schriftenreihe desInstituts fur Massivbau und BaustofftechnologieUniversitat LeipzigBand 7

Dr.-Ing. Thomas Voigt
Born in 1974 in Lutherstadt Eisleben, Germany. From 1994 to 1999 studies ofcivil engineering and business management at University of Leipzig, Germany.During 2000 structural engineer at Konig und Heunisch, Consulting Engineers,Leipzig. From 2001 to 2004 research associate under the supervision of ProfessorSurendra P. Shah at the Center for Advanced Cement-Based Materials at North-western University, Illinois, USA. During 2002 research visit at Delft Universityof Technology, The Netherlands.
Die Arbeit The Application of an Ultrasonic Shear Wave Reflection Method forNondestructive Testing of Cement-Based Materials at Early Ages – An Experi-mental and Numerical Analysis ist eine von der WirtschaftswissenschaftlichenFakultat der Universitat Leipzig genehmigte Dissertation zur Erlangung des aka-demischen Grades Doktor-Ingenieur (Dr.-Ing.). Die Gutachten wurden vorgelegtvon Prof. Dr.-Ing. Stefan Winter, Prof. Dr. Surendra P. Shah und Dr.-Ing. FrankDehn. Die Verteidigung fand am 27. September 2004 in Leipzig statt.
Der Titel dieser Dissertation lautet:
The Application of an Ultrasonic Shear Wave Reflection Method for Nondestruc-tive Testing of Cement-Based Materials at Early Ages – An Experimental andNumerical Analysis
Bibliografische Information der Deutschen BibliothekDie Deutsche Bibliothek verzeichnet diese Publikation in derDeutschen Nationalbibliografie; detaillierte bibliografische Datensind im Internet uber <http://dnb.ddb.de> abrufbar.
Der Druck dieser Arbeit wurde durch den Verein der Freunde desBauingenieurwesens an der Universitat Leipzig finanziell unterstutzt.
Druck und buchbinderische Verarbeitung: Books on Demand GmbHPrinted in Germany
ISBN 3-8334-2424-9

Always use the method that works best. Whether it is scientific orempirical or in-between, that is secondary.
Sandor Popovics


Abstract
A very significant portion of today’s civil infrastructure is partially or comple-tely made out of cementitious materials, such as concrete. Repeated failures ofconcrete structures during construction have shown that the early-age period isone of the most critical periods in the life span of concrete, making the availa-bility of information about early-age concrete properties most essential. In thiscontext, the application of nondestructive test methods can be very beneficial.These methods offer the possibility to determine in-situ material properties ofconcrete directly on the structure without causing significant damage.
Several nondestructive test methods are available that determine concrete pro-perties by using empirical relationships. Such methods often require advance ca-libration or the application of complimentary techniques. The research describedin this thesis has the objective of overcoming this practice and developing a me-thod that allows the description of the physical parameters of concrete to be aresult of its true microstructure rather than relying on empirical laws. With thisaim, a method based on ultrasonic shear wave reflections was introduced. Themethod measures the reflection loss of ultrasonic waves at the interface of a steelplate and hydrating cementitious materials.
To apply the proposed method for nondestructive testing of concrete, it is ne-cessary to determine how the measured reflection loss is related to the progressof cement hydration. Consequently, the investigations reported in this thesis aredevoted to the fundamental relationships among evolving microstructure, me-chanical properties, and reflection loss. A wide range of material properties ofdifferent cement pastes, mortars, and concretes were evaluated by starting frommore phenomenological parameters, such as setting, and then moving to defi-ned physical and physico-chemical properties, such as elastic moduli, degree ofhydration, and porosity. To complement the experimental work, two numericalmodels for simulating the cement hydration process were employed to determineadditional properties of the cementitious microstructure (HYMOSTRUC3D) andto verify the results obtained from experiments (CEMHYD3D).
The conducted investigations have shown that the reflection loss is closely re-lated to parameters describing the tested materials on a macroscopic level, suchas setting or compressive strength. In fact, a bilinear relationship between com-pressive strength and reflection loss for early-age concrete has been identified.Based on this relationship, field tests with the wave reflection method were con-ducted in a precast production plant. After adjustments to the used concrete mix
viii
proportion, the wave reflection method could successfully be used to predict thein-situ compressive strength of full-size precast elements at early ages under fieldconditions.
Furthermore, it was found that the reflection loss is directly related to the de-gree of hydration, the gel-space ratio and the parameters describing the connec-tivity of the hydrating cement particles. The experimentally and numericallyobtained relationships were used to develop a constitutive model that allows thedetermination of the mortar compressive strength from the measured reflectionloss only. This model requires no further calibration for w/c-ratio or curing tem-perature if it is applied to plain Portland cement mortar. The extension of thismodel to compressive strength predictions of concrete containing mineral admix-tures was identified as an important subject of future work to ensure an effectiveapplication of the wave reflection method.

Die Anwendung einer Ultraschall-Scherwellen-Reflexionsmethode zur zersto-
rungsfreien Prufung von zementgebundenen Werkstoffen im jungen Alter –
Eine experimentelle und numerische Analyse
Ein bedeutender Anteil moderner Infrastruktur wird teilweise oder komplett auszementgebundenen Werkstoffen, wie z.B. Beton hergestellt. Das wiederholte Ver-sagen von Betonbauwerken wahrend der Bauphase hat gezeigt, dass die Fruhpha-se eine der kritischsten Phasen im Lebenszyklus des Betons ist. Vor diesem Hin-tergrund kommt der zuverlassigen Bestimmung der Eigenschaften jungen Betonseine besondere Bedeutung zu. Zerstorungfreie Prufverfahren, deren Anwendungin diesem Zusammenhang von großem Nutzen sein kann, bieten die Moglichkeit,die Betoneigenschaften direkt am Bauwerk zu bestimmen ohne diesem wesentli-chen Schaden zuzufugen.
Es stehen verschiedene zerstorungfreie Prufverfahren zur Verfugung die be-stimmte Betoneigenschaften auf der Grundlage empirischer Beziehungen ermit-teln. Verfahren basierend auf empirisch ermittelten Zusammenhangen erfordernjedoch oftmals vorhergehende Kalibrierungsmaßnahmen oder die Anwendungerganzender Methoden. Ziel dieser Arbeit ist es, ein Verfahren zu entwickeln, wel-ches die Bestimmung physikalischer Eigenschaften von Beton auf der Grundlageseiner wahren mikrostrukturellen Beschaffenheit erlaubt, anstatt sich auf empiri-sche Gesatzmaßigkeiten zu verlassen. Es wird eine Ultraschall-Reflexionsmethodevorgestellt, die auf der Messung des Reflexionsverlustes von Scherwellen an derGrenzflache zwischen einer Stahlplatte und einem erhartenden zementgebunde-nen Material basiert.
Um die vorgestellte Methode fur die zerstorungfreie Prufung von Beton an-wenden zu konnen, ist es notwendig zu untersuchen, wie sich der gemessene Re-flexionsverlust in Bezug auf den Fortschritt der Zementhydratation verhalt. Ausdiesem Grund widmet sich diese Arbeit der eingehenden Analyse des grundsatz-lichen Zusammenhanges zwischen mikrostrukturellen Veranderungen, mechani-schen Betoneigenschaften und gemessenem Reflexionsverlust. Ausgehend von derBeobachtung von eher phanomenologischen Eigenschaften, wie z.B. dem Erstar-rungsverhalten, bis hin zu genau definierten physikalischen und chemischen Ei-genschaften, wie z.B. Elastizitatsmodul, Hydratationsgrad und Porositat, wurdeein relativ weites Spektrum an Materialeigenschaften untersucht. Erganzend zuden experimentellen Untersuchungen wurden zwei numerische Modelle zur Simu-lation der Zementhydratation benutzt um zum einen zusatzliche Eigenschaftender zementgebundenen Mikrostruktur zu ermitteln (HYMOSTRUC) und zumanderen experimentelle Ergebnisse zu uberprufen (CEMHYD3D).

x
Die durchgefuhrten Untersuchungen haben gezeigt, dass der Reflexionsverlustin engem Zusammenhang mit Parametern, wie z.B. Erstarrungsverhalten oderDruckfestigkeit steht, welche das geprufte Material auf makroskopischer Ebenebeschreiben. Im speziellen konnte ein bilinearer Zusammenhang zwischen Druck-festigkeit und Reflexionsverlust festgestellt werden. Auf der Grundlage dieserBeziehung wurden erste Feldversuche mit der Reflexionsmethode in einem Be-tonfertigteilwerk durchgefuhrt. Nach der Durchfuhrung von materialspezifischenVorversuchen im Labor konnte die Reflexionsmethode erfolgreich zur Bestim-mung der Bauteildruckfestigkeit von Fertigteilen eingesetzt werden.
Es wurde außerdem festgestellt, dass der Reflexionsverlust in direktem Zu-sammenhang zum Hydratationsgrad, dem Zementgel-Porenraum-Verhaltnis unddem Verbundheitsgrad der hydratisierten Zementpartikel steht. Die experimentellund numerisch ermittelten Zusammenhange wurden genutzt, um ein grundlegen-des Modell zu entwickeln, welches die Bestimmung der Morteldruckfestigkeit aufder alleinigen Grundlage von Reflexionsmessungen ermoglicht. Dieses Modell er-fordert keine weitere Kalibrierung fur w/z-Werte oder Erhartungstemperaturen,solange es fur reinen Zementmortel angewendet wird. Um dieses Modell auchfur Betone und Werkstoffe mit mineralischen Zusatzstoffen anwenden zu konnen,wird eine entsprechende Weiterfuhrung der begonnenen Forschung empfohlen.

Contents
Acknowledgements . . . . . . . . . . . . . . . . . . . . . . . . . . . . . . xv
1 Introduction 11.1 Significance of Early Age Concrete Properties . . . . . . . . . . . . 11.2 When is “Early Age”? . . . . . . . . . . . . . . . . . . . . . . . . . 21.3 The Need for In-Situ and Nondestructive Testing . . . . . . . . . . 31.4 Scope and Objective of this Thesis . . . . . . . . . . . . . . . . . . 51.5 Outline of this Thesis . . . . . . . . . . . . . . . . . . . . . . . . . 6
2 Methods for Nondestructive Testing of Early-Age Concrete 72.1 Introduction . . . . . . . . . . . . . . . . . . . . . . . . . . . . . . . 72.2 Mechanical Methods . . . . . . . . . . . . . . . . . . . . . . . . . . 8
2.2.1 General Impact Methods . . . . . . . . . . . . . . . . . . . 82.2.2 Indentation Methods . . . . . . . . . . . . . . . . . . . . . . 82.2.3 The Rebound Method . . . . . . . . . . . . . . . . . . . . . 82.2.4 Pullout Methods . . . . . . . . . . . . . . . . . . . . . . . . 112.2.5 Penetration Resistance Methods . . . . . . . . . . . . . . . 122.2.6 Break-Off Method . . . . . . . . . . . . . . . . . . . . . . . 13
2.3 The Maturity Method . . . . . . . . . . . . . . . . . . . . . . . . . 142.4 Methods based on Acoustics . . . . . . . . . . . . . . . . . . . . . . 16
2.4.1 Ultrasonic Pulse Velocity Method . . . . . . . . . . . . . . . 162.4.2 Ultrasonic Wave Reflection Method . . . . . . . . . . . . . 252.4.3 Impact-Echo Method . . . . . . . . . . . . . . . . . . . . . . 382.4.4 Resonant Frequency Method . . . . . . . . . . . . . . . . . 422.4.5 Acoustic Emission . . . . . . . . . . . . . . . . . . . . . . . 44
2.5 Radioactive Methods . . . . . . . . . . . . . . . . . . . . . . . . . . 452.5.1 Gamma Radiometry . . . . . . . . . . . . . . . . . . . . . . 452.5.2 X-ray Microscopy . . . . . . . . . . . . . . . . . . . . . . . . 452.5.3 X-Ray Microtomography . . . . . . . . . . . . . . . . . . . 46
2.6 Methods based on Optical Fibers . . . . . . . . . . . . . . . . . . . 472.7 Microwave Absorption Method . . . . . . . . . . . . . . . . . . . . 502.8 Electrical Methods . . . . . . . . . . . . . . . . . . . . . . . . . . . 51

xii Contents
3 Stress Wave Propagation Theory 543.1 Wave Types . . . . . . . . . . . . . . . . . . . . . . . . . . . . . . . 543.2 Wave Reflection at Boundaries . . . . . . . . . . . . . . . . . . . . 553.3 General Derivation of Elastic Constants . . . . . . . . . . . . . . . 573.4 Shear Waves in Cementitious Materials . . . . . . . . . . . . . . . 58
3.4.1 Propagation . . . . . . . . . . . . . . . . . . . . . . . . . . . 583.4.2 Reflection . . . . . . . . . . . . . . . . . . . . . . . . . . . . 613.4.3 Deriving Viscoelastic Properties of Cement Paste . . . . . . 64
4 Wave Reflection Method 654.1 General Introduction . . . . . . . . . . . . . . . . . . . . . . . . . . 65
4.1.1 History of the Wave Reflection Method . . . . . . . . . . . 654.2 Determination of Reflection Coefficient . . . . . . . . . . . . . . . . 66
4.2.1 Principle . . . . . . . . . . . . . . . . . . . . . . . . . . . . 664.2.2 Multiple Reflection Process . . . . . . . . . . . . . . . . . . 674.2.3 Signal Analysis . . . . . . . . . . . . . . . . . . . . . . . . . 674.2.4 Self-Compensating Calculation Algorithm . . . . . . . . . . 684.2.5 Reflection Loss . . . . . . . . . . . . . . . . . . . . . . . . . 70
4.3 Experimental Setup . . . . . . . . . . . . . . . . . . . . . . . . . . 714.4 Influence of Experimental Parameters . . . . . . . . . . . . . . . . 71
4.4.1 General . . . . . . . . . . . . . . . . . . . . . . . . . . . . . 714.4.2 Influence of Wave Type . . . . . . . . . . . . . . . . . . . . 724.4.3 Influence of Buffer Material . . . . . . . . . . . . . . . . . . 74
5 Complimentary Experimental Methods 775.1 Temperature Controlled Water Bath . . . . . . . . . . . . . . . . . 775.2 Test of Compressive Strength . . . . . . . . . . . . . . . . . . . . . 785.3 Test of Penetration Resistance . . . . . . . . . . . . . . . . . . . . 795.4 In-situ Temperature Measurements . . . . . . . . . . . . . . . . . . 805.5 Calorimetry . . . . . . . . . . . . . . . . . . . . . . . . . . . . . . . 805.6 Forced Resonance Method . . . . . . . . . . . . . . . . . . . . . . . 805.7 Test of Pulse Velocity . . . . . . . . . . . . . . . . . . . . . . . . . 825.8 Thermogravimetry . . . . . . . . . . . . . . . . . . . . . . . . . . . 84
5.8.1 General . . . . . . . . . . . . . . . . . . . . . . . . . . . . . 845.8.2 Non-evaporable Water after Powers . . . . . . . . . . . . . 855.8.3 Non-evaporable Water and CH after El-Jazairi and Illston . 87
5.9 Test of Chemical Shrinkage . . . . . . . . . . . . . . . . . . . . . . 895.10 Extrusion . . . . . . . . . . . . . . . . . . . . . . . . . . . . . . . . 90
6 Monitoring Early Age Properties of Cementitious Materials 916.1 Introduction . . . . . . . . . . . . . . . . . . . . . . . . . . . . . . . 916.2 Setting Process . . . . . . . . . . . . . . . . . . . . . . . . . . . . . 92
6.2.1 General Relationship . . . . . . . . . . . . . . . . . . . . . . 926.2.2 Influence of Admixtures . . . . . . . . . . . . . . . . . . . . 926.2.3 Influence of Water/Cement Ratio . . . . . . . . . . . . . . . 93

Contents xiii
6.3 Compressive Strength . . . . . . . . . . . . . . . . . . . . . . . . . 966.3.1 Strength of Regular Cement Mortar . . . . . . . . . . . . . 966.3.2 Strength of Extruded Cement Mortar . . . . . . . . . . . . 996.3.3 Compressive Strength Development of Concrete . . . . . . . 108
6.4 Modulus of Elasticity . . . . . . . . . . . . . . . . . . . . . . . . . . 1146.4.1 General Remarks . . . . . . . . . . . . . . . . . . . . . . . . 1146.4.2 Dynamic Shear Modulus from Compressive Strength . . . . 1156.4.3 Dynamic Shear Modulus from Sonic Measurements . . . . . 120
6.5 Direct Measures of Cement Hydration . . . . . . . . . . . . . . . . 1246.5.1 General Remarks . . . . . . . . . . . . . . . . . . . . . . . . 1246.5.2 Amount of Non-Evaporable Water . . . . . . . . . . . . . . 1246.5.3 Amount of Calcium Hydroxide . . . . . . . . . . . . . . . . 1266.5.4 Chemical Shrinkage . . . . . . . . . . . . . . . . . . . . . . 129
6.6 Microstructural Parameters . . . . . . . . . . . . . . . . . . . . . . 1316.6.1 General Remarks . . . . . . . . . . . . . . . . . . . . . . . . 1316.6.2 Capillary Porosity . . . . . . . . . . . . . . . . . . . . . . . 1326.6.3 Gel-Space Ratio . . . . . . . . . . . . . . . . . . . . . . . . 134
6.7 Conclusions . . . . . . . . . . . . . . . . . . . . . . . . . . . . . . . 135
7 Numerical Simulation of Wave Reflection Measurements 1377.1 Introduction . . . . . . . . . . . . . . . . . . . . . . . . . . . . . . . 137
7.1.1 Need for Numerical Simulation . . . . . . . . . . . . . . . . 1377.1.2 Objective . . . . . . . . . . . . . . . . . . . . . . . . . . . . 138
7.2 Overview of Existing Computer-Based Models . . . . . . . . . . . . 1387.2.1 General Overview . . . . . . . . . . . . . . . . . . . . . . . 1387.2.2 CEMHYD3D (NIST) . . . . . . . . . . . . . . . . . . . . . 1407.2.3 HYMOSTRUC3D (TU Delft) . . . . . . . . . . . . . . . . . 142
7.3 Application of HYMOSTRUC3D . . . . . . . . . . . . . . . . . . . 1467.3.1 General Remarks . . . . . . . . . . . . . . . . . . . . . . . . 1467.3.2 Calibration and Verification of the Model . . . . . . . . . . 1477.3.3 Results of the Numerical Modeling . . . . . . . . . . . . . . 1487.3.4 Numerical Simulation vs. Experimental Results . . . . . . . 151
7.4 Application of CEMHYD3D . . . . . . . . . . . . . . . . . . . . . . 1557.4.1 General Remarks . . . . . . . . . . . . . . . . . . . . . . . . 1557.4.2 Calibration of the Model . . . . . . . . . . . . . . . . . . . . 1567.4.3 Simulation of Chemical Shrinkage . . . . . . . . . . . . . . 1567.4.4 Simulation of the Amount of Calcium Hydroxide . . . . . . 1577.4.5 Simulation of Cement Paste and Mortar Shear Modulus . . 159
7.5 Conclusions . . . . . . . . . . . . . . . . . . . . . . . . . . . . . . . 161
8 Evaluation of the Pulse Velocity Method 1638.1 General Remarks . . . . . . . . . . . . . . . . . . . . . . . . . . . . 1638.2 Experimental Program . . . . . . . . . . . . . . . . . . . . . . . . . 1648.3 Results . . . . . . . . . . . . . . . . . . . . . . . . . . . . . . . . . . 165
8.3.1 Comparison with Penetration Resistance . . . . . . . . . . . 165
xiv Contents
8.3.2 Comparison with In-situ Temperature Rise . . . . . . . . . 1688.3.3 Comparison with Adiabatic Heat Release . . . . . . . . . . 1698.3.4 Relationship to Adiabatic Heat and Chemical Shrinkage . . 1708.3.5 Comparison of the Sensitivity of the Methods . . . . . . . . 172
8.4 Conclusions . . . . . . . . . . . . . . . . . . . . . . . . . . . . . . . 173
9 A Constitutive Model for Early-Age Cement Mortar 1749.1 Objective . . . . . . . . . . . . . . . . . . . . . . . . . . . . . . . . 1749.2 Development of the Model . . . . . . . . . . . . . . . . . . . . . . . 175
9.2.1 General Outline . . . . . . . . . . . . . . . . . . . . . . . . 1759.2.2 Gel-Space Ratio Concept . . . . . . . . . . . . . . . . . . . 1769.2.3 Contact Area Concept . . . . . . . . . . . . . . . . . . . . . 1779.2.4 Combination of Gel-Space Ratio and Contact Area Concept 179
9.3 Application of the Model . . . . . . . . . . . . . . . . . . . . . . . 1819.3.1 General Remarks . . . . . . . . . . . . . . . . . . . . . . . . 1819.3.2 Portland Cement Mortars cured at different Temperatures . 181
9.4 The Physical Nature of the Model . . . . . . . . . . . . . . . . . . 1829.5 Further Research . . . . . . . . . . . . . . . . . . . . . . . . . . . . 183
10 Practical Application in Precast Production 18510.1 Introduction . . . . . . . . . . . . . . . . . . . . . . . . . . . . . . . 18510.2 Laboratory Experiments . . . . . . . . . . . . . . . . . . . . . . . . 18610.3 Field Testing . . . . . . . . . . . . . . . . . . . . . . . . . . . . . . 187
10.3.1 Test Equipment and Setup . . . . . . . . . . . . . . . . . . 18710.3.2 Results . . . . . . . . . . . . . . . . . . . . . . . . . . . . . 188
10.4 Comparison to the Maturity Method . . . . . . . . . . . . . . . . . 19210.4.1 Strength–Maturity Relationship . . . . . . . . . . . . . . . . 19210.4.2 Comparison of Predictions . . . . . . . . . . . . . . . . . . . 19310.4.3 Comment on the Use of the Maturity Method . . . . . . . . 194
10.5 Conclusions . . . . . . . . . . . . . . . . . . . . . . . . . . . . . . . 195
11 Conclusions and Future Work 19611.1 Conclusions . . . . . . . . . . . . . . . . . . . . . . . . . . . . . . . 19611.2 Future Work . . . . . . . . . . . . . . . . . . . . . . . . . . . . . . 201
A Evaluation of Thermogravimetric Measurements 202A.1 Determination of Loss of Ignition . . . . . . . . . . . . . . . . . . . 202A.2 The Non-evaporable Water Content after Powers . . . . . . . . . . 202A.3 Non-evaporable Water and Calcium Hydroxide Content . . . . . . 204
B Standard Error of the Estimate 205
C Definition of Decibel 206
Index 208
References 211

Acknowledgements
The research presented in this thesis was conducted during my time as a re-search associate at the Center for Advanced Cement-Based Materials (ACBM)at Northwestern University, Evanston, USA.
Many people at Northwestern University, University of Leipzig and other in-stitutions made this thesis possible. First and foremost, I would like to thankmy advisor Professor Surendra P. Shah for the opportunity to work at ACBM.I am indebted to him for his guidance and support throughout the last years.Professor Dr.-Ing. Stefan Winter served as the primary reviewer of my thesis andhis kindness and interest in my research proved invaluable. Likewise, as one ofmy secondary reviewers, Dr.-Ing. Frank Dehn’s readiness to discuss and improvemy work was essential. Professor Dr.-Ing. Olaf Selle and Professor Dr.-Ing. habil.Nguyen Viet Tue deserve my acknowlegdement for their willingness to conductmy doctoral examination. I would also like to thank Professor em. Dr.-Ing. Dr.-Ing. e.h. Gert Konig for mentoring me during my time in Leipzig. Without hissupport I would not be where I am now.
The research work conducted within the frame of this thesis was made possibleby the Center for Advanced Cement-Based Materials and the Infrastructure Tech-nology Institute of Northwestern University. Their financial support is gratefullyacknowledged.
Throughout my research I had the opportunity to collaborate with a numberof people who were instrumental in the success of this thesis. I am gratefulto Professor Maria S. Konsta-Gdoutos for her advice, many fruitful discussionsand for taking the time to read this manuscript. Professor Dr. Ir. Klaas vanBreugel kindly enabled me to use the HYMOSTRUC model and was generouswith his support and guidance during my visit at Delft University of Technology,The Netherlands. I also want to acknowledge Dr. Guang Ye for his patience inexplaining to me the secrets of HYMOSTRUC, his efforts to come to ACBM,and for helping me to actually use the model. Above all, he has been a goodfriend.

xvi
During experiments which were conducted at ACBM (as part of the roundrobin test program of the RILEM Committee ATC-185) I greatly benefited fromthe advice and help of Dr.-Ing. Christian Grosse. The use of the CEMHYD3Dmodel to verify important results of this thesis was generously supported byDr. Edward Garboczi. I am also thankful to Mr. Jean-Claude Roumain for hishelp organizing and conducting field tests, as well as his valuable advice fromthe practical perspective. These field tests were made possible by Rocky Moun-tain Prestress, Denver, Colorado, and especially Mr. Brian Williamson. I am aswell grateful to Professor Kenneth Poeppelmeier for the support he provided inconducting the thermogravimetric analysis experiments. My collaboration withDipl.-Ing. Tim Malonn on the work of my thesis dealing with extrusion was vital.
All members of the ACBM research group and staff deserve my special grati-tude for creating a friendly and productive work environment. I especially wouldlike to thank Marcia Hilliard, Richard Garza, and James Lingscheit. I would alsolike to thank my ACBM co-worker Zhihui Sun, for all her help. Caleb Jordan waswonderful in conducting experiments and analyzing the results. Although not acollaborator per se, my friend Ricky Selle has helped me to complete this workthrough his motivation, many critical discussions and his MATLAB expertise.
The successful completion of this thesis would not have been possible withoutthe help of my parents. I am so thankful that they have always supported mydecisions, regardless of how far this would set me apart from their home.
Finally, I would like to thank my wife Nicole and my children Robert and Lenafor always reminding me that there is much more to life than concrete.
Evanston, December 2004 Thomas Voigt
Chapter 1
Introduction
1.1 Significance of Early Age Concrete Properties
A significant amount of today’s infrastructure is partially or completely made outof concrete or similar cementitious materials. To meet the constantly increasingexpectations of the user community, concrete structures are required to be highlyserviceable, durable, flexible and esthetic. This calls for concrete materials withconsistent properties that can be adjusted to meet different criteria. The prop-erties of concrete are solely determined by the composition of its ingredients, themixing and placing process, and the conditions during the setting and hardeningprocess. Damages and unintentional properties occurring to the concrete duringthis process are not or only with great financial effort repairable. The exposureof fresh concrete to direct sun light, an erroneous dosage of an admixture or thedisregard of the water adsorption of the aggregates can, for example, be sufficientto render a concrete completely useless for its intended purpose.
Concrete is also especially vulnerable during the period immediately followingthe final setting, which is understood as the end of the concrete’s transitionfrom fluid to solid state. During this time the concrete is of early age andits properties differ significantly from those of mature, fully hardened concrete,which is per definition the case at the age of 28 days. Nevertheless, many concretestructures are and must be subjected to severe loading during construction, whenthe concrete is still of early age. If the special properties of early age concrete arenot fully understood and correctly addressed this scenario can lead to the failureof concrete elements, such as excessive floor sagging, spalling or increased longterm deflections. It was shown, for example, by Fu and Gardner (1986) that high

2 1 Introduction
construction loads applied to immature concrete slabs lead to non-recoverablecreep deflections that have a significant impact to the long term deflections ofthe structure. In several cases such type of construction loading has lead tothe total collapse of buildings even before their completion (Kaminetzky andStivaros, 1994).
These circumstances emphasize the importance of the detailed knowledge ofearly age concrete and its performance in structures under construction. Thisnecessity goes along with the requirement to incorporate the specifics of early ageconcrete into design codes, which in turn calls for research on this subject. Theobjective of the research dealing with early age concrete should be to understandthe microstructural changes occurring during the early hydration period. Onlythis allows to develop relationships between the early-age microstructure andlater age properties of the concrete (Carino et al., 1989). The final goal of theefforts undertaken in the field of early-age concrete must be to identify whatproperties are affected by concrete maturity and how this can be addressed inpractice. Considerable progress has been made in the last decades by manyresearchers covering a wide area of aspects (for example: Weigler and Karl, 1974;Byfors, 1980; RILEM TC 42–CEA, 1981; Laube, 1990; Gutsch, 1998; Rostasy
et al., 2002).
1.2 When is “Early Age”?
When dealing with the subject early age concrete it would be of interest to definewhat “early age” exactly means. A possible definition of early age is proposed byCarino et al. (1989) as the period during which the concrete properties undergoa rapid change. The authors conclude that if it is assumed that such rapidchanges occur during the time before 50% of the cement is hydrated a normalconcrete containing type I cement and cured at room temperature would be ofearly age for a period of three days. In Grubl et al. (2001, p. 283) the earlyage period is defined as the time between the initial setting and the completehardening of the concrete and assigned to the period between 2 to 4 and 15to 24 hours after casting. Reinhardt (1991) describes concrete as young duringthe time between one and seven days, which is when it has reached the end ofcuring. In this context, the end of curing is interpreted as the time when theconcrete has developed its main properties being durability and resistance againstenvironmental forces. This point of view goes along the line with the criteria putforward by Byfors (1980, p. 21) and Mehta and Monteiro (1993, p. 310). They

1.3 The Need for In-Situ and Nondestructive Testing 3
argue that concrete is of early age as long as hydration has not advanced to astage where the concrete properties have reached a certain level that is criticalfor a specific application. The property of interest can be, for example, formstability allowing the removal of formwork from small concrete structures or aspecific value of compressive strength to release prestress to precast elements.
Considering the different time ranges and criteria given above it is difficult toassign a definite time period for the expression ”early-age”. The best definitionis probably to call concrete of early-age during the first seven days after casting.However, instead of specifying a certain time it would be more appropriate andimportant to base this definition on the properties of the concrete itself. Thecriterion to call concrete being of early age should intimately be associated withthe question whether it is possible to apply the usual material and design modelsas well as testing methods to the concrete in consideration (Bergstrom, 1982).As long as one of the latter criteria is not met concrete should be treated asearly-age concrete.
1.3 The Need for In-Situ and Nondestructive Testing
Given the significance of early-age concrete properties as described in the firstsection of this chapter information about the properties of early age concrete andtheir development in time should be obtained by a rigorous test program. Amongothers, Reinhardt (1991) emphasizes that, besides the regular 28-day-testing, aneed for testing during concrete construction exists for concrete (i) in fresh state,(ii) during setting, and (iii) at early ages.
The traditional and to date most common method to assess concrete quality isto determine the compressive strength of companion cylinders or cubes that werecast during the construction of a concrete structure. When testing these cylindersit is of immense importance that they represent the condition of the concrete inthe structure. Unfortunately, in many cases this cannot be assumed for a numberof reasons. The probably most severe error is introduced by the differences in thecuring conditions between the specimen and the concrete in the structure. Thein general massive concrete structures develop a significant amount of heat andby this undergo a specific temperature history. On the other hand, the curing ofthe small concrete cylinders or cubes is dominated by the ambient temperature.In dependency on their location (next to the structure or in a curing room), thespecimens are either subjected to changing or constant temperature conditions.The difference in the curing conditions between structure and test specimens is

4 1 Introduction
especially large if the environmental temperatures are extreme and the specimensfield cured. Thus, if no appropriate precautions are taken the concrete specimenshave only a limited relationship to the actual concrete in the structure.
If the test cylinders or cubes fail to reach the required minimum strengthcriterion in many cases cores are drilled from the structure and tested. Theacceptance decision about the concrete in question is then made based uponthe compressive strength of the cores. In his landmark paper, Malhotra (1977)concluded that this practice bears significant problems. This conclusion is basedon an experimental survey showing that factors as lenght-depth ratio, embeddedreinforcement, and drilling direction of the cores as well as type of aggregate,strength level, and curing of the concrete have a major impact on the ability ofthe cores to reflect the in-situ strength of the concrete in the structure.
The misinterpretation of the concrete quality (or strength) can and alreadyhas lead to damage to structures and human life. To improve the accuracy ofconcrete testing and the reliability of the test results nondestructive test methodscan be applied. These methods offer the possibility to determine in-situ materialproperties of the concrete directly on the structure without significantly damagingit. The salient advantage of nondestructive test methods is that they allowrepeated testing of the same specimen or location of a structure. By using thesemethods the safety at the job site can be increased and construction can progressfaster and more economically.
Since the introduction of nondestructive techniques in the 1940s and ’50s, thesemethods have received a significant attention in both, research and practice.However, the nature of such nondestructive test methods, which is to determinea structural condition by an independent nondestructive phenomenon (Popovics,2003), has prevented these methods from their real breakthrough and a wideenough acceptance by the practitioner community. In 1974, the then prevalentattitude towards nondestructive test methods was summarized and commentedby Philleo with the remark:
The obvious objection to (nondestructive tests) is that they mea-sure something other than compressive strength. But they measuresomething related to the hydration of cement since the results changeas the cement hydrates. If we could shed our compressive strengthhangup and admit that there are other ways to evaluate concrete ma-turity, we might be more tolerant of a less-than-perfect correlationwith compressive strength.

1.4 Scope and Objective of this Thesis 5
Since then, promoting the use and further development of methods for nonde-structive testing of concrete was repeatedly identified as being of high priority(Philleo, 1979; Schickert, 1984; Carino, 1994). In this context it is especially im-portant to develop recommendations for the use of nondestructive test methodsand the interpretation of the obtained results. The general specification of non-destructive or in-place testing for all concrete structures would create the basisfor the development of a better construction practice and assure high concretequality during placing and curing (Carino et al., 1989). Along this line, Mal-
hotra (1977) recommended to introduce a three-step quality assurance systemconsisting of (i) assuring that the fresh concrete as delivered meets the specifiedcriteria, (ii) accelerated strength testing to determine the strength potential ofthe concrete in a timely manner, and (iii) conducting in-place/nondestructivetests to determine the quality and strength of the concrete on the structure.
A first step in the direction highlighted above was made by the German FederalMinistry of Transportation, Construction and Housing (Bundesministerium furVerkehr, Bau- und Wohnungswesen). A guideline was released that specifies theapplication of the impact-echo or a similar method to nondestructively determinewhether the inner linings of newly constructed concrete tunnels have the requiredwall thickness (RI-ZFP-TU , 2001).
1.4 Scope and Objective of this Thesis
The objective of this thesis is to evaluate the applicability of an ultrasonic wavereflection method to monitor the setting and hardening of cementitious materialsat early ages. The principle of the wave reflection (WR) method consists ofmonitoring the reflection coefficient of ultrasonic shear waves at an interfaceformed by a steel plate and the cementitious material to be tested. An ultrasonicshear wave transducer is coupled to the steel plate, which in turn is brought incontact with the test material when it is still in liquid or unhydrated state. Withproceeding hydration the shear wave propagation properties of the test materialchange, which results in a variation of the reflection coefficient.
To apply the proposed WR-method for nondestructive testing in civil engineer-ing it is necessary to determine how this variation of the reflection coefficient isrelated to the progress of hydration in cementitious materials, such as concrete.Only if this knowledge is available it will be possible to derive relationships thatallow the quantitative determination of concrete properties from the results ofthe WR-measurements. The main goal of the investigations presented in this

6 1 Introduction
thesis is to determine which fundamental parameters of cement-based materialsgovern the WR-measurements conducted with shear waves.
The research underlying this thesis was conducted as part of a research projectwith the objective to develop the wave reflection method to a field applicable testmethod to nondestructively determine the in-situ properties of early-age concrete.The thesis is meant to provide the basis for this development by identifyingrelationships between physical properties of hydrating cement-based materialsand the results of the WR-measurements.
1.5 Outline of this Thesis
The thesis will first give a literature review about methods that can be usedfor nondestructive testing of cement-based materials at early ages (chap. 2). Inthis overview emphasis is placed on covering the spectrum of methods availablerather than describing every technique in its very detail. The literature reviewcontinues with chapter 3, which presents the fundamentals of the propagationand reflection of stress waves that are necessary to understand the principle ofthe wave reflection method.
Chapters 4 and 5 are devoted to a detailed description of the wave reflectionmethod and the other experimental techniques that were used for the presentedinvestigations. The following three chapters (6, 7, 8) deal with an analysis ofthe applicability of the wave reflection method for monitoring the cement hydra-tion process. This comparison is done by using experimental results, numericalsimulation and comparisons to other nondestructive test methods.
Chapter 9 uses the results of the conducted investigations to formulate an out-line of a constitutive material model that relates the results of the wave reflectionmeasurements to intrinsic properties of cementitious materials. The results offirst field measurements with the wave reflection method are presented in chap-ter 10 to underline the potential of the WR-method for practical application. Theconclusions drawn from the examinations presented in this thesis are presentedin chapter 11.

Chapter 2
Methods for Nondestructive Testing of Early-
Age Concrete
2.1 Introduction
This chapter provides an overview about methods for nondestructive testing ofcementitious materials. The main emphasis is placed on techniques that havethe ability to evaluate the setting and hardening process of such materials andthat can be applied in-situ on the concrete structure. To the benefit of a morecomprehensive survey selected methods that do not fulfill these conditions arealso mentioned. These are, for example, important techniques to evaluate theintegrity of concrete structures, advanced methods currently limited to laboratoryuse or techniques whose field application is in development.
Several authors have compiled detailed descriptions of the various methods fornondestructive testing in civil engineering and of concrete in particular. Jones
(1962) and Pohl (1966) were among the first to summarize available methods forconcrete testing. The monograph written by Malhotra in 1976 was the first tocover a wider spectrum of test methods. In 1982, Bungey published his textbookon “Testing of Concrete in Structures”, which is now in its third edition (Bungey
and Millard, 1996). The handbook edited by Malhotra and Carino (2004) coverstechniques of more than 14 different categories that have proven to be effectivenondestructive testers of a variety of concrete properties.
In addition to the printed references, a very comprehensive catalog of nonde-structive methods that can be applied to concrete is available in the Internet(Schickert et al., 1999). In this compendium for each individual method a de-tailed description along with a list of references and manufactures as well asonline links are provided.

8 2 Methods for Nondestructive Testing of Early-Age Concrete
2.2 Mechanical Methods
2.2.1 General Impact Methods
Impact methods as covered in this paragraph induce a damage to the concretesurface by mechanical means and correlate the extent of this damage to thecompressive strength of the concrete. According to Gaede (1941), the Russianengineer Skramtajew seems to be the first who has used such a method for con-crete testing in 1933. The method consisted of simply firing a military revolver(type Nagan) from a distance of 20 cm in the direction of the concrete surfaceto be tested. The volume of the resulting crater was measured and found to berelated to the compressive strength of the same concrete. Skramtajew (1938)reports about the improvement of the Nagan method by another Russian engi-neer (Poliakoff). This time, a specially designed gun that is directly placed onthe concrete surface is used to fire a bullet and thereby generating the surfacecrater. This type of methods can be considered as original developments and didnot find a very widespread application.
2.2.2 Indentation Methods
The principle of indentation methods is based on applying a mechanical impactto the surface of the concrete. This impact, which can be generated by a steelball or the tip of a pendulum, leaves a circular impression (indentation) on theconcrete surface. The diameter of this indentation is the actual parameter that ismeasured. The probably first application of this method to concrete in structureswas the so called “ball impact test”, published by the German engineer Gaede
in 1934. A specially designed spring apparatus was used to impact the concretesurface with a hardened steel ball. The diameter of the induced indentation wasfound to be related to the compressive strength of the concrete determined fromcubical specimens. The difference between the actual and the predicted strengthvalues was about 30%.
According to Malhotra (1977, 3–8) and Jones (1963, 84–85), similar methodsapplying this principle were developed in the following years: the Williams testingpistol, the Franck spring hammer, and the Einbeck pendulum hammer.
2.2.3 The Rebound Method
The Swiss engineer Schmidt reported experiments with a concrete test hammerthat measures the surface hardness of concrete (Schmidt, 1950, 1951; Neuffer,

2.2 Mechanical Methods 9
Fig. 2.1: Principle of the Schmidt Rebound Hammer (from Carino, 1994, Reprinted by permissionfrom the American Concrete Institute, USA)
1951). The device, known as the Schmidt Rebound Hammer, measures the re-bound of a spring-loaded mass impacting the free end of a plunger (steel rod)that is held against the concrete surface (Fig. 2.1). The extent of the reboundof this mass is expressed as the rebound number R. Schmidt states in his paperthat “the rebound number R can be considered as a new quality parameter ofthe concrete; it characterizes the hardness of the mortar (concrete minus coarseaggregates) at one single location close to the surface . . . ” The rebound ham-mer allows the determination of the concrete quality by using predeterminedcorrelation charts between the rebound number and compressive strength.
Since its introduction, the Schmidt Rebound Hammer became very popularbecause of its simplicity of use. Extensive research work was conducted to providethe basis for using the rebound hammer for a range of materials, such as airentrained (Zoldners, 1957), lightweight aggregate (Greene, 1954; Nasser and Al-
Manaseer, 1987a) and recycled aggregate concrete (Ravindrajah et al., 1988).Greene (1954) also presented data about the correlation between the reboundnumber and the modulus of rupture obtained from flexural tests on concretebeams. A correlation between the rebound number and rate of wear of concrete

10 2 Methods for Nondestructive Testing of Early-Age Concrete
Fig. 2.2: Schmidt pendulum hammer type PT (manufactured by PROCEQ SA, Switzerland,reprinted by permission from Geotron-Elektronik GmbH, Germany)
pavement blocks and the abrasion resistance of concrete floors was reported byKolek (1958) and Bungey and Millard (1996, 46), respectively. The reboundhammer is widely used in combination with other nondestructive test method,which increase the accuracy of the prediction. A comprehensive overview aboutthe use of the rebound hammer is also given by Malhotra (2004).
With regard to the applicability of the rebound hammer to test early age con-crete it was found by Carette and Malhotra (1984) that the accuracy of thestrength prediction is not sufficient to allow the safe determination of the strip-ping time for removal of form work in concrete construction. The standard errorof the estimates was significantly higher than that of other nondestructive testmethods. Similarly, it is stated in Bungey and Millard (1996, 44) that specialcare should be taken when the rebound hammer is used for testing concrete atearly ages or low strength, because the rebound number may be too low to allowaccurate reading. Furthermore, the impact may also cause damage to the surfaceof the green concrete.
That these problems can be dealt with is shown by the successful applicationof the Schmidt pendulum hammer for the determination of the time of formremoval from inner linings of concrete tunnels in Germany (Willmes, 2004). Thependulum hammer, which is shown in figure 2.2, works after the same principle asthe regular hammer. The only exception is that the spring-loaded mass describesa semi-circular path before directly impacting the concrete. After the partialremoval of the form work in the ridge of the tunnel lining, readings are takenwith the pendulum hammer. The compressive strength is then determined byusing the predetermined relationship between rebound value and compressive

2.2 Mechanical Methods 11
strength. The pendulum hammer used for these tests is especially suitable foryoung concrete because of the small mass of the impactor.
2.2.4 Pullout Methods
The principle of the pullout method consists of measuring the force required toextract a metal insert out of a hardened concrete mass. According to Skramtajew
(1938), the method was originally developed in the former Soviet Union by Volfand Gershberg. In this case a metal rod with a sperical end was embedded intofresh concrete. Due to the thickened end a fracture cone develops when the rodis pulled out of the concrete. The concrete in the fracture zone is simultaneouslysubjected to tension and shear stresses. The pullout force was correlated tothe concrete cube strength for ages between 1 and 28 days; the average differencebetween measured and predicted strength was found to be relatively small (±9%).
Extensive experiments with this pullout technique using a steel rod with acylindrical head were reported by Tremper (1944). In this study, the averagedeviation of the strength prediction could be reduced to ±6.4%. Since then, thetest was adapted, for example, by using post installed pullout rods (Chabowski
and Bryden-Smith, 1979; Yener and Chen, 1984) or a simple screw as the metalinsert (Jaegermann, 1989). Pioneering work was conducted by Malhotra (1975)and Malhotra and Carette (1977) by providing extensive application examplesand analyzing the relationship between the pullout strength of concrete and theresults of other important nondestructive test methods.
Pullout tests on concretes at ages between one and three days conducted by
(a) Volz (b) Tremper
Fig. 2.3: Variants of the pullout method (from Carino, 1994, Reprinted by permission from theAmerican Concrete Institute, USA)

12 2 Methods for Nondestructive Testing of Early-Age Concrete
Carette and Malhotra (1984) have shown that this method can be used to de-termine the time of form removal from concrete elements. The variation of thepullout test results and the accuracy of the strength predictions were found tobe in an acceptable range.
A detailed description of the many aspects of the pullout method, includingthat of the commercial available systems LOK-test and CAPO-test (cut andpullout), can be found in Carino (2004b).
2.2.5 Penetration Resistance Methods
Penetration resistance methods use a mechanical force to drive a probe into thesurface of the concrete to be tested. The depth of the penetration of the probesis taken as a measure of the penetration resistance of the concrete and is relatedto the compressive strength. In general, two variants of penetration resistancemethods can be distinguished: the probe penetration and the pin penetration.
Probe Penetration According to Malhotra (1977, 26), the probe penetrationmethod was jointly developed by the Port of New York Authority, New York andthe Windsor Machinery Co., Connecticut, in the mid 1960s. The method, whichis known as the Windsor probe, uses a powder actuated gun to drive a hardenedsteel-alloy probe into the concrete surface. Recent investigation concerning thecorrelation of the probe penetration depth and the cube strength of concrete wereconducted by Carette and Malhotra (1984), Nasser and Al-Manaseer (1987a) andAl-Manaseer and Aquino (1999). In 1979, Bartos reports that the Windsor probewas probably the most widely used method for determination of safe strippingtime of form work at this time. But at the same time, it is emphasized that“If you don’t know the type of the coarse aggregate in the concrete, the testis meaningless.” The suitability of the Windsor probe for testing of early-ageconcrete (1 to 3 days) was also verified by Carette and Malhotra (1984).
Pin Penetration The pin penetration method was developed by Nasser andAl-Manaseer (1987b) specifically to establish the time of safe form removal fromconcrete elements. The method uses a spring-loaded hammer that drives a small,nail-like, pin into the concrete surface. The authors presented investigations thatshow a goof correlation between penetration depth and compressive strength ofnormal and lightweight aggregate concrete with different w/c-ratios at ages of1, 2, 5, 7, 14 and 28 days. In Nasser and Al-Manaseer (1987a) it is shown

2.2 Mechanical Methods 13
that the strength predictions of the new pin penetration test compare favorablyto results obtained with the Windsor probe, rebound hammer, pullout test andP-wave velocity. Another variant of the pin penetration test was introducedby Iwaki et al. (2001). In this test the pin is driven into the concrete withpneumatic pressure using a device similar to a commercial nail gun. The methodwas successfully applied to estimate the early-age compressive strength (from 1to 25 MPa) of tunnel linings under field conditions.
A very detailed overview about both types of the penetration resistance methodis given by Malhotra and Carette (2004).
2.2.6 Break-Off Method
In 1979, Johansen introduced the break-off (BO) method as a technique that “di-rectly determines the flexural strength of the concrete in an annular cross sectionparallel to the concrete surface and at a definite distance from the surface.”Thesection of the concrete to be subjected to the test is prepared by either inserting aplastic tube into the fresh concrete or drilling into the hardened concrete shortlybefore the test. The parameter measured by the break-off method is the forcethat is required to literally break the resulting concrete cylinder off the concretestructure.
Johansen used the method for testing airfield pavements at early ages. Hefound that the break-off strength was in good correlation to the modulus of rup-ture determined from beam tests as well as to the cube strength of the concrete.
Fig. 2.4: Principle of the break-off method (from Carino, 1994, Reprinted by permission from theAmerican Concrete Institute, USA)

14 2 Methods for Nondestructive Testing of Early-Age Concrete
It is concluded that the break-off method is especially sensitive in recording theinfluence of temperature on the early-age strength of concrete. Further field ap-plications of the break-off method were reported by Carlsson et al. (1984). Theyreport the successful use of the method for determining the time of form removal,the monitoring of the in-situ strength of off-shore platforms cast in slip-form pro-duction and the in-situ testing of old concrete.
In an extensive study of the break-off method Barker and Ramirez (1988)found that the relationship between the break-off and the compressive strengthis relatively independent from the size of the aggregate. On the other hand itwas concluded that, because of the larger influence of the aggregates, it may notbe advantageous to use the break-off method to predict the modulus of rupture.Byfors (1980, p. 330) used the break-off method to test concretes with two w/c-ratios and three different aggregate sizes. It was found that the method is suitablefor testing concrete at early ages or low strengths. The lower strength limit ofthe reliability was given with 1 to 2 MPa.
A comprehensive overview about the break-off method is given by Naik (2004).
2.3 The Maturity Method
The principles of the maturity method were established by McIntosh, Nurse andSaul between 1949 and 1951 (see Carino, 2004a, for references). Since then, thematurity method has been treated by numerous researchers and used by manyengineers for field testing. The method makes use of the combined effects of timeand temperature on the strength gain of concrete. By knowing the age and thetemperature history of the concrete an equivalent age value can be calculatedwhich is, with some limitations, uniquely related to the concrete compressivestrength. The equivalent age can be understood as the length of the curingperiod at a certain reference temperature that would result in the same maturityas the curing period at a given (variable) temperatures that is currently observed.Carino (2004a) has provided an excellent reference about the principle and theapplication of the maturity method and the following summary is based on thisreference.
One of the inputs that are needed for applying the maturity method is thetemperature history of the concrete to be tested. This can easily be obtained byembedding a thermocouple in the concrete member and recording the tempera-ture data. The second important input is a maturity function that accounts forthe effect of time and temperature on the strength gain of the concrete. This

2.3 The Maturity Method 15
bears some difficulties, since the rate in that the strength increases (the rateconstant) changes with temperature. The best procedure currently available isto use the concept of the equivalent age based on the Arrhenius equation. Thisconcept accurately describes the relationship between the rate constant and thetemperature, which is nonlinear. An important parameter of the Arrhenius equa-tion is the activation energy, which describes the temperature sensitivity of therate constant.
The activation energy depends on the chemistry and the fineness of the cement,and the amount of mineral and chemical admixtures. General rules were devel-oped to estimate the activation energy that give results with reasonable accuracy.However, to maximize the accuracy of the method the activation energy shouldbe determined for each cement in use by laboratory testing of appropriate mortarmixtures. To finally apply the maturity method in the field a relationship be-tween compressive strength and equivalent age must be developed by laboratoryexperiments as well.
The application of the maturity for strength prediction on site requires onlythe measurement of the in-situ temperature of the concrete member to be tested.This temperature is used to determine the equivalent age which in turn allowsthe calculation of the strength by using the predetermined strength-equivalentage relationship. This requires that the field concrete has the identical propertiesas the concrete that was used for the laboratory testing. Furthermore, the fieldconcrete must be cured properly, that is moisture must be available to allowsufficient hydration.
Additionally, Carino points out that research has identified an influence of theearly-age temperature history on the final strength of a given concrete mixture.Since the final strength is a parameter of the strength-equivalent age relationship,this dependency can not be considered to be unique. In other words, if theearly-age temperature history of the laboratory concrete significantly differs fromthat of the field concrete, the maturity method produces erroneous strengthpredictions. This scenario can be avoided by using relationships that predictthe relative strength gain of the concrete, This, however, requires the applicationof additional techniques to estimate the absolute strength level of the concrete,which is most often of interest.
Pinto and Hover (1999) have applied the maturity concept to determine theapparent activation energy for a given mortar mixture by measuring initial andfinal setting times with the penetration resistance method. This is done by ob-serving how a variation in the curing temperature of a given mortar mixture

16 2 Methods for Nondestructive Testing of Early-Age Concrete
affects the occurrence of initial and final setting times. It was concluded, thatonce the apparent activation energy of a mortar mixture is determined, the ma-turity approach can be used to accurately determine both setting times.
Schindler (2004) has proposed a new concept to determine the activation en-ergy to be used for the calculation of the equivalent age. This concept considersthe chemical composition and the Blaine surface of the cement and the replace-ment level of cement by fly ash and ground-granulated blast-furnace slag (GG-BFS). The proposed concept is based on own experiments and data taken fromthe literature.
2.4 Methods based on Acoustics
2.4.1 Ultrasonic Pulse Velocity Method
Original Developments
Cheesman (1949), Jones (1949), and Whitehurst (1951) were probably the firstwho have conducted ultrasonic wave transmission experiments on concrete duringsetting. Jones noticed that the P-wave velocity, measured on concrete during finalsetting, increases rapidly and that its rate of increase reduces considerably afterone day of curing. Furthermore, the trends of compressive strength and P-wavevelocity measured on two different concrete mixtures between one and seven dayswere found to have very similar patterns, which was taken as an indication of arelation between those parameters. The analysis of the relationships has shownthat the cement to coarse aggregate ratio is an influencing factor.
Whitehurst (1951) investigated the quantitative relationship between P-wavevelocity and final setting time of concrete containing different types of cement.The wave transmission measurements were conducted as early as two hours aftercasting the specimens. Verifying Jones’ results, the P-wave velocity was foundto increase very rapidly in the beginning. However, a sudden decrease of therate of change was reported before ten hours, with only little increase of theP-wave velocity after that. As a result of the investigations it was shown thatthe marked change in the growth rate of the P-wave velocity coincides with theexperimentally determined final setting time of the tested concrete.

2.4 Methods based on Acoustics 17
Fig. 2.5: Developement of P-wave velocity in setting concrete (from Whitehurst, 1951, Reprinted,with permission, from the ASTM Proceedings, Volume 51, copyright ASTM International, 100 BarrHarbor Drive, West Conshohocken, PA 19428)
Developments between 1960 and 1979
In his efforts to analyze and explain the hydration behavior of cement-basedmaterials, Popovics (1971) found that setting processes always follow a powerlaw trend. By using the data previously published by Whitehurst (1951) it wasshown that the P-wave velocity measured at ages between two and eight hoursfollows such a power law. Since Popovics based his theory on a comparison with avariety of other established indicators of the cement setting, it can be concludedthat the P-wave velocity has a proven potential of accurately monitoring thisprocess.
The use of P-waves and S-waves in transmission mode to monitor concrete inthe first hours and days after casting was reported by Pimenov et al. (1972). Itwas shown that both wave types have the ability to detect internal changes ofconcrete when it is vibrated (in fresh state) or subjected to heat curing. The com-parison of P- and S-wave velocity measurements to the appropriate compressivestrength data showed that especially the S-wave velocity reproduced the trendof the strength data in a very good qualitative manner.
Neisecke (1974, 60) has also reported the application of combined measure-ments with P-waves and S-waves. Based on the two wave velocities and theintensity of the transmitted P-waves the hydration of cement paste in the first24 hours after mixing was studied (fig. 2.6). One of the findings was that theS-wave velocity develops after a clearly different trend than the P-wave veloc-ity. Immediately after mixing, S-wave velocity remains at a value of zero before

18 2 Methods for Nondestructive Testing of Early-Age Concrete
time
P-wave velocity
S-wave velocity
Poisson’s ratio
Fig. 2.6: Development of P- and S-wave velocity and Poisson’s ratio of cement paste (from Neisecke,1974, Reprinted by permission from Prof.-Dr. J. Neisecke)
increasing gradually after approximately two hours. This phenomenon was in-terpreted with the absence of a continuous skeleton of solid particles that wouldallow the shear waves to propagate. It was concluded that the undoubtedly al-ready existent hydration products are obviously not interconnected at this earlystage. The availability of P- and S-wave measurements allowed also the directdetermination of the Poisson’s ratio in a completely nondestructive manner. Thedevelopment of this elastic constant from a value of 0.5 (fluid state) to approxi-mately 0.25 (hardened state) is a very effective measure of the phase transitionoccurring to the cement paste.
(a) Comparison in time (b) Direct relationship
Fig. 2.7: Compressive strength and P-wave velocity of early-age concrete (from Elvery and Ibrahim,1976, Reprinted by permission from Thomas Telford Limited, UK)

2.4 Methods based on Acoustics 19
Fig. 2.8: Effect of chemical admixtures on P-wave velocity measurements at early ages (from van derWinden and Brant, 1977, Reprinted by permission from The Concrete Society, UK)
A significant contribution to the understanding of the relationship betweenP-wave velocity and compressive strength of concrete was made by Elvery andIbrahim (1976). Experiments are reported that examine both parameters onconcretes with different water/cement-ratios (0.4–0.7), aggregate/cement-ratios(1.0–5.9) and cement types at curing temperatures ranging from 1°C to 60°C.The tests were conducted with the main emphasis on the early age of the con-cretes (2 hours to 4 days). One of the most important conclusions was that fora concrete with a given cement type and aggregate content, the relationship be-tween compressive strength and P-wave velocity is independent from w/c-ratioand curing temperature. When the logarithm of compressive strength is plottedagainst the P-wave velocity then this relationship was found to exhibit a clearbilinear characteristic.
The ability of the P-wave velocity to monitor the setting behavior of concreteaffected by w/c-ratio, cement type, temperature, and chemical admixtures, suchas accelerator, retarder and superplasticizer, was tested by van der Winden andBrant (1977). The method was found to be sensitive to the changes in the ki-netics of the cement setting caused by the different parameters mentioned before(fig. 2.8). This sensitivity becomes especially clear by observing the differenttrends of the P-wave velocity measured on concretes containing accelerator, re-tarder and no admixtures (see also van der Winden, 1991).
20 2 Methods for Nondestructive Testing of Early-Age Concrete
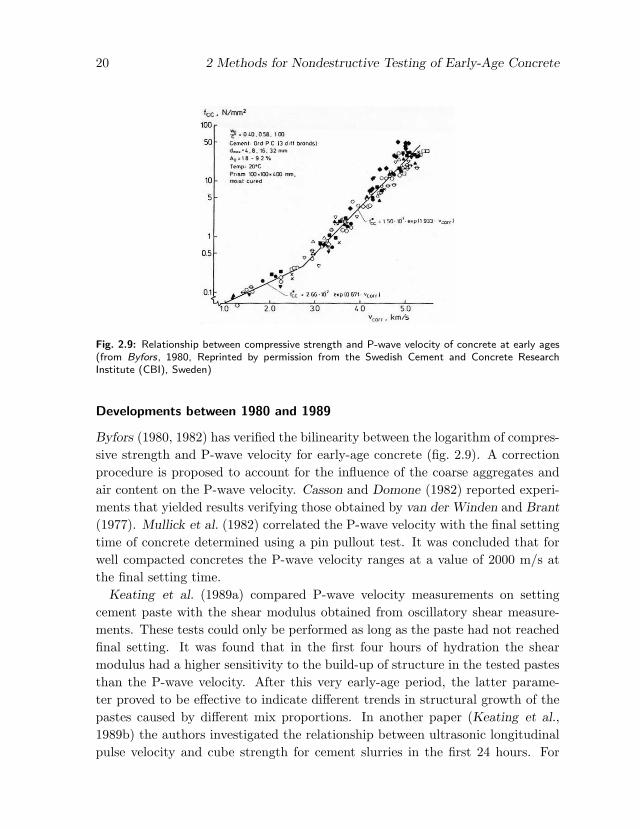
Fig. 2.9: Relationship between compressive strength and P-wave velocity of concrete at early ages(from Byfors, 1980, Reprinted by permission from the Swedish Cement and Concrete ResearchInstitute (CBI), Sweden)
Developments between 1980 and 1989
Byfors (1980, 1982) has verified the bilinearity between the logarithm of compres-sive strength and P-wave velocity for early-age concrete (fig. 2.9). A correctionprocedure is proposed to account for the influence of the coarse aggregates andair content on the P-wave velocity. Casson and Domone (1982) reported experi-ments that yielded results verifying those obtained by van der Winden and Brant
(1977). Mullick et al. (1982) correlated the P-wave velocity with the final settingtime of concrete determined using a pin pullout test. It was concluded that forwell compacted concretes the P-wave velocity ranges at a value of 2000 m/s atthe final setting time.
Keating et al. (1989a) compared P-wave velocity measurements on settingcement paste with the shear modulus obtained from oscillatory shear measure-ments. These tests could only be performed as long as the paste had not reachedfinal setting. It was found that in the first four hours of hydration the shearmodulus had a higher sensitivity to the build-up of structure in the tested pastesthan the P-wave velocity. After this very early-age period, the latter parame-ter proved to be effective to indicate different trends in structural growth of thepastes caused by different mix proportions. In another paper (Keating et al.,1989b) the authors investigated the relationship between ultrasonic longitudinalpulse velocity and cube strength for cement slurries in the first 24 hours. For

2.4 Methods based on Acoustics 21
Fig. 2.10: Effect of cement content on P-wave velocity measurements at early ages (from Popovicset al., 1994, Reprinted by permission from the American Concrete Institute, USA)
concrete cured at room temperature, it was noted that the relative change in thepulse velocity in the first few hours is higher than the observed rate of strengthgain.
Developments between 1990 and 1999
Kruml (1990) and Domone and Thurairatnam (1990) investigated the settingbehavior of concrete with the P-wave velocity method and compared the obtainedresults to those of other suitable methods, such as pin penetration, calorimetryand viscometric tests. The P-wave velocity was found to be indicative of theexamined setting process and comparable to the other methods used.
Popovics et al. (1994) analyzed the propagation of P-waves in fresh and hard-ened concrete. The experiments showed that at very early ages the P-wavevelocity is influenced by the cement paste portion of the concrete. Accordingly,appropriate changes in the P-wave velocity can be observed, when the cementpaste builds up solid structure. These changes were found to be especially rapidimmediately after the initial setting time (fig. 2.10). The attenuation of the

22 2 Methods for Nondestructive Testing of Early-Age Concrete
transmitted pulses also appeared to be very sensitive to changes in the internalstructure of the hydrating cement paste. The same technique was compared toother methods in its ability to determine the w/c-ratio of concrete by Popovics
and Popovics (1998). Although the method gave the most reliable results, generaldependencies could not be derived.
Sayers and Dahlin (1993) have focussed their work on the fundamental analysisof the P-wave propagation in cement pastes by comparing measured data topredictions based on elastic wave propagation theory. Verifying the results of theprevious investigators, it was found that the P-wave propagation is governed atearly ages by the fluid phase and at later ages by the porous solid phase of thetested cement paste.
Sayers and Grenfell (1993) conducted similar transmission experiments withP- and S-waves on different cement pastes typically used for oil wells to studythe evolution of the effective bulk and shear moduli of the cement pastes duringhydration. It was fund, that after the percolation threshold of the cement, the twomoduli are linearly related. The Poisson’s ratio developed in a similar manneras reported by Neisecke (1974), that is from 0.5 typical for a fluid to a value of0.35, which is reasonable for porous solids. The dependency between Poisson’sratio and shear modulus for cement at early ages is given in figure 2.11.
A comparison of the ability of P- and S-waves to indicate the developmentof a percolating solid microstructure in hydrating cement paste was reportedby D’Angelo et al. (1995). It was found that, compared to P-waves, S-waves aremuch more sensitive to the connectivity of the cement matrix. The authors reporta close correlation between the onset of shear wave propagation and thickening
Fig. 2.11: Relationship between Poisson’s ratio and shear modulus of cement paste at early ages(Reprinted from Ultrasonics, Vol. 31, C. M. Sayers, R. L. Grenfell, Ultrasonic propagation throughhydrating cements, pp. 147–153, 1993, with permission from Elsevier)

2.4 Methods based on Acoustics 23
times measured on the basis of the American Petroleuum Institute specifications.An integrated approach to analyze the relations between cement hydration and
the evolution of mechanical properties of cement-based materials was presentedby Boumiz et al. (1996). The authors simultaneously measured P- and S-wavevelocity, heat of hydration and electrical conductivity on cement pastes and mor-tars. The interconnection of the cement particles was found to be decisive forthe propagation of the two wave types. The percolation threshold, as a measureof this connectivity was located between the beginning of increase of the P-wavevelocity and the first detection of S-wave propagation. The percolation thresholdwas determined based on the assumption that the shear modulus (derived fromS-wave velocity) increases according to a power law after the the occurrence ofthe percolation threshold. Based on the wave velocity measurements it was alsopossible to directly evaluate the development of the dynamic Young’s and shearmoduli as a function of time and degree of hydration. It was concluded that theelastic moduli (Young’s and shear) are governed primarily by the connectivity ofthe cement particles, whereas compressive strength, which was also measured, ismore closely related to the filling of pores with hydration products.
Grosse and Reinhardt (1994) have reported P-wave transmission experimentson concrete with different compositions. In addition to the P-wave velocity therelative energy and the frequency spectrum of the transmitted signals were an-alyzed. Bothe parameters, velocity and energy were found to be sensitive tochanges in the hydration behavior caused by different w/c-ratios, retarder or dif-ferent cement types. The analysis of the frequency spectrum has shown that atvery early ages (up to 4 h) only low frequencies within a narrow range are trans-mitted. At later ages, the frequencies increase significantly and the transmittedspectrum becomes wider.
A very detailed description of the various application possibilities of the previ-ous method is given in Reinhardt et al. (1998). In this report it is analyzed howthe parameters P-wave velocity, relative energy as well as the frequency spectrumcan indicate the setting and hardening behavior of concrete influenced by cementtype, w/c-ratio, aggregate size and chemical admixtures, such as retarder (indifferent contents), air entrainer, and superplasticizer. The authors also suggestto model the development of the P-wave velocity with the Boltzmann equation.It is shown how the different parameters of this equation can be varied to modelthe influence of, for example, the w/c-ratio on the shape of the P-wave velocitycurve.

24 2 Methods for Nondestructive Testing of Early-Age Concrete
Developments since 2000
Newly developed equipment combined with the appropriate computer softwarefor the continuous measurement of the P-wave velocity in setting mortar andconcrete were presented by Reinhardt et al. (2000). The method uses a PMMAcontainer with attached ultrasonic transducers to hold the fresh materials tobe tested. The measurements are fully automated and analyzed by a specialsoftware, which results in the immediate availability of the test parameters P-wave velocity, relative energy and frequency spectrum. Further details about thistest setup and its application are also given in Grosse (2001) and Reinhardt andGrosse (2004).
The application of P-wave velocity measurements to predict the compressivestrength development of concrete is reported by Erfurt (2002, 137–148). In thisinvestigation a commercial system consisting of ultrasonic transducers and com-puter software is used. The transducers are attached to a base plate in a defineddistance. To perform the measurements the transducers are submerged into theconcrete with the base plate floating on the surface of a fresh concrete. Theconical shape of the transducers allows their safe removal from the hardenedconcrete after the measurements are completed. The software that is used toevaluate the measurements is based on an expert system that automatically con-verts the P-wave velocity data to the compressive strength of the tested concrete.The strength conversation requires the input of the composition of the tested con-crete and the P-wave velocity of the used aggregates. Details about the describedsoftware are given by Gebauer (2001) and Kaßner (2001). The experimental re-sults for concretes with two water/cement-ratios and aggregate sizes obtainedby Erfurt show that the applied system can predict the early-age compressivestrength with a good accuracy. The difference between predicted and measuredstrength values ranged between 3% and 20% for a maximum prediction periodof seven days after casting.
Lee et al. (2004) reported P-wave transmission experiments using a techniqueidentical to that developed by Reinhardt et al. (2000). The focus of the investiga-tions was to develop relationships between the setting behavior and the P-wavevelocity measured on mortars and concretes in four different water/cement-ratioswith and without fly ash. It was found that a certain range of P-wave velocitycan be taken as an indicator of the occurrence of the initial setting time of thetested mortars. However, this range was found to influenced by the presence offly ash in the mixture (without fly ash: 800–980 m/s; with fly ash: 920–1070m/s). Alternatively, it was suggested to consider the time of increase of the P-
2.4 Methods based on Acoustics 25
wave velocity and the time when the P-wave velocity reaches its maximum rate ofchange as parameters characterizing the setting behavior of the tested materials.
An analysis of the relationship of P-wave velocity measurements to parame-ters of the cementitious microstructure was reported by Ye et al. (2003a). Theultrasonic tests were performed on cement pastes with three water/cement-ratioscured at three different, constant temperatures. To describe the changes in themicrostructure a parameter called bridge volume was used. This value was de-rived from numerical simulations with the HYMOSTRUC model (see sec. 7.2.3)and is generally defined as the volume of the cement particles that bridge thegap between neighboring clusters of cement particles. In other words, the bridgevolume is a parameter of the connectivity of the hydrating cement particles. Theauthors found that there is a unique relationship between P-wave velocity andbridge volume that is independent from water/cement-ratio and curing temper-ature used in the study. A model is proposed that allows the prediction of theP-wave velocity from the simulated bridge volume.
Investigations following a similar approach were conducted by Ye et al. (2004).Again, the P-wave velocity measured on concretes was found to be in close rela-tion to the connectivity of the solid phase, that is the hydrated cement particleof the cement paste portion of the tested concretes. The parameters describingthis connectivity were the volume of the total and connected solid phase as wellas the time of the percolation threshold. It was found that in the initial phase ofhydration the P-wave velocity is governed by the volume of the connected solidphase. This was indicated by the fact that the P-wave velocity starts to increaseat a time that is very close to the percolation threshold. At later ages the P-wavevelocity follows the trend of the total solid phase.
2.4.2 Ultrasonic Wave Reflection Method
2.4.2.1 Overview
The first application of the wave reflection method for testing cementitious ma-terials was reported by Stepisnik et al. (1981) and Lasic and Stepisnik (1984).More details about these studies can be found in section 4.1.1.
Over the last decade extensive research has been undertaken to investigate theapplicability of the wave reflection method to monitor the setting and hardeningof cement-based materials. The conducted investigations cover a wide range ofdifferent aspects of the test method. One main focus is the laboratory exami-nation of the hydration kinetics of a variety of cementitious materials with the

26 2 Methods for Nondestructive Testing of Early-Age Concrete
wave reflection technique. The parameters that are obtained from the ultrasonicmeasurements are related to the characteristics of the developing microstructureof the test materials during the phase change from the liquid, viscoelastic tothe hardened, elastic stage. Parameters like chemical shrinkage, non-evaporablewater content, composition of hydration products, pore size distribution, anddynamic viscosity are considered. A number of complementing experimentaltechniques of advanced materials testing are applied to obtain the latter parame-ters. These include, for example, X-ray diffraction (XRD), differential thermalanalysis (DTA), thermogravimetry (TG), porosimetry, and calorimetry.
While the wave reflection method can be considered as a powerful laboratorytool, another emphasis is the application of the wave reflection technique as atool for the in-situ assessment of the setting and hardening state of cementitiousmaterials. The nature of the wave reflection technique to require access to onlyone side of the specimen or structure that is to be tested is taken advantage ofin these works. The wave reflection measurements are linked to parameters likesetting time, compressive strength, and elastic moduli of the hydrating cementcomposites. In the following sections the recent research available in the literatureis described briefly.
2.4.2.2 Valic and Coworkers, Slovenia
Valic and his coworkers adapted the experimental procedure that was introducedby Stepisnik et al. (1981). The method uses a quartz bar bonded to a shearwave transducer to measure the reflection coefficient at the interface between thequartz and the test material that is placed at the free end of the quartz bar. Valic
and Stepisnik (1998b) used the technique to monitor the hardening behaviorof a variety of materials. Experiments are reported with gypsum, aluminouscement, white cement, blast furnace slag Portland cement and mortar, epoxy andjoint filler. The reported results of the measured reflection coefficient allowed aqualitatively distinction of the individual hydration and hardening kinetics of thetested materials.
Valic and Stepisnik (1998a, 1999) proved the ability of the wave reflection tech-nique to be sensitive to the hydration behavior of cement paste as it is influencedby different w/c ratios, curing temperatures and material finenesses. The effectof the ageing of cement powder (as a result of the exposure of the powder to ahumid environment for a certain amount of time) to the hydration kinetics ofthese cements was also shown to be detectable with the method. Based on thegood correlation of the reflection coefficient (measured with shear waves) with a
2.4 Methods based on Acoustics 27
model for the kinetics of phase change as proposed by Avrami (1939, 1940, 1941)the authors concluded that the shear wave reflection coefficient is proportionalto the amount of hydrated cement.
The sensitivity of the reflection coefficient to the initial and final setting timeof cement paste was examined by Valic et al. (1999). The setting times of fastand slow setting cement were tested with the Vicat method and it was foundthat initial and final setting could be related to a certain range of the reflectioncoefficient. It was stated that after an appropriate calibration, the shear wavereflection coefficient can be used to determine the time of initial and final set.Valic and Vuk (2000) attempted to correlate the reflection coefficient with thecompressive and bending strength as well as the content of CH in the first 24hours after casting. The reflection coefficient and the concrete strength werefound to be in good agreement. The relationship between the CH content andthe reflection coefficient in the first 24 hours was determined to be linear.
A summary of the essential work of Valic and his coworkers is given in Valic
(2000).
2.4.2.3 Chotard, Smith and Coworkers, France
Chotard, Smith and their coworkers used compression waves to monitor the hy-dration behavior of cement paste throughout the setting and hardening process.Ultrasonic waves with a frequency of 1 MHz were used in transmission and reflec-tion mode. The cement paste is placed in a polymethylmethacrylate (PMMA)container, which also serves as the buffer medium for the wave reflection mea-surements.
The same setup has been used to investigate the hydration behavior of a Port-land cement paste by Gimet et al. (1999). In addition to the ultrasonic para-meters the heat of hydration and the volume change of the hydrating cementpaste were measured. The trend of the wave velocity was found to correlate wellto distinctive changes of the temperature and shrinkage. Marked changes in thecompression wave reflection coefficient occurred at a later time when comparedto temperature and shrinkage. Reflection coefficient and wave velocity were usedto calculate the changes in the density of the cement paste during the transfor-mation from the viscous liquid to the solid state.
Similar measurements on calcium aluminate cement of two w/c ratios at isother-mal conditions were conducted by Chotard et al. (2001a,b). Results of compres-sion wave velocity and reflection coefficient are presented for the first 24 hoursafter casting and qualitatively related to additional parameters of the setting of

28 2 Methods for Nondestructive Testing of Early-Age Concrete
the cement pastes. These additional measures were obtained by in-situ temper-ature measurements, chemical shrinkage tests, thermogravimetry (TG), differ-ential thermal analysis (DTA), and X-ray diffraction (XRD). The wave velocityand the reflection coefficient were found to develop in the typical S-shaped pat-tern and are in good agreement with the trends observed from the temperature,shrinkage and TG-measurements. The DTA and XRD results show significantamounts of calcium aluminate hydrates only after a major increase of wave ve-locity and reflection coefficient are measured.
Smith et al. (2002) extended this study by examining calcium aluminate cementin three different w/c-ratios at various isothermal curing conditions. The ultra-sonic measurements were again complemented by temperature measurements,TG, DTA, and XRD. The compression wave velocity was found to correlate wellwith the development of the bound water content determined by TG. It was con-cluded that the wave velocity is closely related to the stiffening process of thepaste due to progressive formation of hydrates. Significant changes in the devel-opment of the reflection coefficient were found to be related to the time whenhydrates in crystalline form could be detected by the XRD test. Hence, it wasdeduced that the reflection coefficient is linked to morphological changes of thehydrating cement paste, especially to the formation of crystallized hydrates.
2.4.2.4 Cohen-Tenoudji and Coworkers, France
Cohen-Tenoudji and his coworkers have extensively used the wave reflection tech-nique for the characterization of the hydration process of different cement-basedmaterials, including reactive powder cement and concrete (RPC). The techniquewas used to study the setting and hardening by determining viscoelastic andelastic parameters and relating those to results of complementary experiments.
Morin et al. (2000) report about measurements on RPC with shear waves inechographic mode in a frequency range of 100 to 600 kHz. Plexiglas is used asthe buffer material and the experiments are conducted at isothermal conditions.The developed heat of hydration was measured by an in-situ temperature sensor.The development of the reflection coefficient and the phase shift of the reflectedsignal as influenced by the curing process is presented. From these quantities thecomplex dynamic shear modulus consisting of the storage modulus G′ and the lossmodulus G′′ is derived. The experiments have shown that the loss modulus G′,which describes the viscoelastic behavior of the RPC, seems to be closer relatedto the onset of setting as it is indicated by the heat of hydration. The storagemodulus G′, which characterizes the elastic portion of the material behavior,
2.4 Methods based on Acoustics 29
starts to increase at a later time but is the dominant quantity with a clearlyhigher sensitivity at later ages. The viscosity loss factor was calculated from theratio of G′′ and G′ and used as a parameter to describe the setting process asthe transition from viscoelastic to elastic material behavior of the RPC. It wasproposed to consider the time of the maximum of the viscosity loss factor asthe time of setting. It was observed that this time of the maximum of the lossfactor varies with the frequency of the shear waves. The authors conclude fromtheir experiments that the mechanical behavior of hydrating RPC can be dividedinto two stages. First, at early ages, the RPC behaves viscoelastic according tothe Zener model and second, at later ages, the RPC shows a dispersive, clearlyfrequency dependent behavior.
Similar experiments on RPC containing silica fume, crushed quartz and super-plasticizer were conducted by Morin et al. (1998). The echographic measurementswith shear waves (100–600 kHz) showed a dispersive behavior of the reflectioncoefficient at an intermediate stage of the hydration process. The beginning ofthis frequency dependent behavior was interpreted as the time of percolation ofthe cement particles. The disappearance of the dispersiveness was thought to bethe time of the formation of a large solid skeleton taking up the whole volumeof the specimen. Calorimetric measurements were performed to compliment theexperimental results.
Feylessoufi et al. (2001) examined the hydration of Portland cement basedRPC with ultrasonic measurements in transmission and reflection mode. Com-pression and shear waves with a center frequency of 0.5 MHz were used. Addi-tionally, calorimetric measurements were conducted and the chemical shrinkagewas measured. The ultrasonic measurements were used to determine the re-flection coefficient (for shear and compression waves), the phase of the reflectedshear waves, and the spectral amplitudes of transmitted compression and shearwaves. Based on the conducted investigations, the hydration process was di-vided into five stages. The first stage is the settling period, were the short-rangereorganization and stronger interaction of the solid particles causes noticeableshrinkage deformations. Those structural changes were found to be detectableonly by the compression wave reflection coefficient. The shear wave reflectioncoefficient remains unchanged. The second stage is an aggregation period, werea temporarily stagnation in the chemical shrinkage was caused by the agglomer-ation of the concrete sample. This was interpreted as the time of percolation ofthe contacts between the particles. During this time, the shear wave reflectioncoefficient starts to decrease slightly together with an increase of the heat of hy-
30 2 Methods for Nondestructive Testing of Early-Age Concrete
dration. No shear wave transmission is measured at this time. The third stageis a post percolation bond development phase, which is indicated by a sharpdecrease in the compression and shear wave reflection coefficients. The trans-mission of shear waves is also detected during this stage. The development ofthe reflection coefficients is frequency dependent during this time. In the fourthstage the connection within the framework are multiplied by further hydration.This leads to a reinforcement of the framework and to a fully hyperstatic state.The frequency dependency of the reflection coefficients has diminished in thisstage. At the beginning of this stage the bulk modulus and Young’s modulus(derived from compression and shear wave velocity) are equal. The fifth stageis a hyperstatic phase were all particles are connected. The Young’s moduluscontinues to increase, but with a slower rate. The bulk modulus does not changesignificantly throughout this stage. The development of the Young’s modulus,bulk modulus and Poisson’s ratio is shown for the time range of 20–70 hours.
The effect of superplasticizer addition on the hydration kinetics of Portlandcement based RPC was studied by Morin et al. (2001). The admixture wasadded in three different contents. The influence of the admixture content on thesetting and hardening of the material was measured by compression and shearwaves in echographic mode, calorimetry and autogenous shrinkage tests. It isreported that the initial value of the compression wave reflection coefficient isinfluenced by the amount of the superplasticizer that has been added. A lowaddition rate corresponds to a low reflection coefficient and vice versa. This wasexplained by the effect of superplasticizers to favor air entrapment and microbubble formation during the mixing process by lowering the surface tension ofthe water. Thus a lower addition rate of superplasticizer results in a lower aircontent, which in turn causes differences in the density and the longitudinalacoustic impedance of the materials. These differences were well detected by thecompression wave reflection coefficient. The reflection coefficient of shear waveswas found to be not sensitive to the air content of the RPC. The values of theshear wave reflection coefficient measured for the three different contents were onthe exact same level, at one. Although no hydration activity could be detectedat early curing times the compression wave reflection coefficient was found todecrease significantly during that time. This was attributed to the sensitivityof compression waves to structural changes in fresh RPC as a result of settlingprocesses. The shear wave reflection coefficient remains unchanged during thistime. With the onset of the hydration reactions indicated by the developed heat,both reflection coefficients decrease rapidly. The different hydration rates caused

2.4 Methods based on Acoustics 31
by the different addition rates of the admixture are well detected by compressionand shear wave reflection coefficient. During the time of the rapid decrease of thereflection coefficients the RPC was found to behave dispersive. Different trends ofthe shear wave reflection coefficient were measured for different frequencies (300,410, 600 kHz). This phenomenon was attributed to differences in the wave lengthsand the concluding different sensitivity of the waves to the size of the connectedclusters developing during hydration. It was observed that the curves of thedifferent frequencies converged after a certain time. This time was interpretedas the time when the tested material has reached its complete hyperstatic statewith the particles having no degree of freedom.
Ultrasonic measurements in combination with autogenous shrinkage tests havebeen used to study the evolution of the capillary network of RPC by Morin et al.
(2002). Compression and shear waves were used in echographic mode with thewall of a Plexiglas cell as the buffer medium. From the reflection coefficients ofthe compression and shear waves the Young’s and the bulk modulus of the RPCwere calculated. The wave reflection technique was especially suitable for thisapplication since it allows the measurement of the elastic moduli immediatelyafter mixing of the fresh RPC. The radius of the active capillary was calculatedbased on the elastic moduli and the volume change measured by the autogenousshrinkage.
Compression and shear waves in transmission and echographic mode have beenused by Lacouture et al. (2003) to monitor the linear and nonlinear behavior ofRPC during the setting and hardening process. The compression and shear wavereflection coefficients were used to calculate Young’s modulus and Poisson’s ratio,which were considered as the linear elastic moduli. It was concluded that thepercolation threshold of the hydration products occurs at the time when theshear wave reflection coefficient starts to decrease. This is also the beginningof the peak in the developed the heat of hydration, which is measured in-situthe sample. The shear wave reflection coefficient is found to depend on thefrequency during its sharp decrease. This dispersive behavior disappears at acertain time, which is interpreted as the time when all solid particles are fullyconnected. The classical and nonclassical nonlinear elastic parameters α and β
were calculated based on the compression wave velocity from the transmissionexperiments and the fundamental second, and third harmonics amplitude of thetransmitted waves. From the dependency of the second and third harmonicsamplitude to the fundamental amplitude the authors concluded, that RPC is anonlinear, nonclassical material.

32 2 Methods for Nondestructive Testing of Early-Age Concrete
2.4.2.5 Shah and Coworkers, USA
Shah and his coworkers have developed an application of the wave reflectiontechnique that uses a steel plate as the buffer material. In several studies theapplicability of the method for fundamental laboratory investigations of hydrat-ing cement, mortar and concrete is investigated. The possibility of the practicalapplication of the method is also addressed by designing experiments to elicitpotentials and limitations. A general overview about the method used by thisgroup is given by Shah et al. (2000); Voigt and Shah (2002-2003) and Voigt et al.
(2004a).Ozturk et al. (1999) investigated the ability of the wave reflection method to
monitor the setting and hardening of concrete when influenced by several ad-mixtures. Besides a plain concrete mixture for reference, concretes containingaccelerator, retarder, superplasticizer, and silica fume were tested. The ultra-sonic measurements were complimented by heat of hydration measurements andthe determination of the initial and final setting time. Compression and shearwaves in a frequency range of 2–5 MHz were used for the wave reflection measure-ments and the bottom plate of a steel mold that held the fresh concrete servedas the buffer medium. The emphasis was placed on measurements with shearwaves. The results have shown that the development of the shear wave reflectioncoefficient indicates very well the influence of the different admixtures on thehydration behavior of the tested materials. After an initial period, where thereflection coefficient remains constant, the value decreases indicating the onsetof cement hydration. The time of the decrease in the reflection coefficient wasfound to correlate well with the end of the induction period as indicated by thein-situ temperature measurements. It was also observed that the initial settingtime and the time of the decrease in the reflection coefficient are influenced tothe same degree by the different admixtures. The compression wave velocitiesdirectly measured by transmission experiments and calculated from compressionwave reflection coefficient were compared for paste and concrete. It was foundthat both velocities are similar for cement paste but have different trends forconcrete. Based on these results it was concluded, that the reflection coefficientmeasures local material properties of the cement paste matrix in the immediatevicinity of the steel-concrete interface.
The previous study was extended by Rapoport et al. (2000). Concretes con-taining accelerator, retarder, superplasticizer and silica fume were tested withthe wave reflection technique, dynamic modulus test (by means of resonance fre-quency), pin penetration test and in-situ calorimetry. Shear waves with a center

2.4 Methods based on Acoustics 33
2.5
3
3.5
4
2 3 4 5 6 7
Time of Point A (h)
En
do
fIn
du
ctio
nP
eri
od
(h)
Plain
Portland Cement Concrete
w/c = 0.5
Accelerator
Silica Fume
Superplastizicer
Retarder
In-situ Temperature
0
2
4
6
8
10
2 3 4 5 6 7
Initia
lS
ettin
gT
ime
(h)
Accelerator
Silica Fume
Plain
Superplastizicer
Retarder
Portland Cement Concrete
w/c = 0.5
Initial Setting
Time of Point A (h)
Fig. 2.12: Relationship between end of induction period, initial setting time and time of increaseof reflection loss (Point A) for concrete (from Rapoport et al., 2000, Reprinted by permission fromthe American Concrete Institute, USA)
frequency of 2.25 MHz were used for the wave reflection tests. The authors pro-pose a numerical procedure to determine two critical points in the graph of theshear wave reflection coefficient. These are the time when the reflection coeffi-cient starts to decrease (Point A) and the time when the rate of the decrease slowsdown and the coefficient starts to approach a certain final value asymptotically(Point B). The time of the occurrence of the Point A was shown to be linearlyrelated to the initial setting time and the end of the induction period as markedby the temperature measurements (see fig. 2.12). The occurrence of Point Bwas found to be related to a distinct point in the development of the dynamicshear modulus determined by the resonant frequency tests. This is taken as theexperimental evidence of the theoretical relationship between the shear wave re-flection coefficient and the dynamic shear modulus. In conclusion of this studythe authors propose a theory that relates the time of occurrence of Point A withthe time when the cement grains percolate throughout the specimen (percolationthreshold). Point B is assumed to be related to the time of the depercolation ofthe water in the specimen.
Subramaniam et al. (2000, 2002) investigated the applicability of the wavereflection method to assess the development of the in-situ compressive strengthof concrete structures. Three large laboratory-sized concrete slabs were cast withmixtures typically used for pavement and bridge construction. Fly ash, silicafume, air entraining agent, and high-range water reducer were used as admixturesfor the concrete compositions. The measurement of the shear wave reflection

34 2 Methods for Nondestructive Testing of Early-Age Concrete
Time (hours)
No
rma
lize
d v
alu
es
Fig. 2.13: Comparison of normalized reflection coefficient and strength gain in slabs with differentconcrete compositions. (from Subramaniam et al., 2002, Reprinted by permission from the AmericanConcrete Institute, USA)
coefficient started immediately after casting. A steel plate located on the topsurface of the fresh concrete was used as the buffer medium for the reflectionmeasurements. After the final set of the concrete cores were extracted from theslab in regular time intervals to determine the in-situ strength development. Thetrends of the compressive strength and the shear wave reflection coefficient for thethree concrete compositions were normalized and compared to each other over atime range of up to seven days. This comparison showed a very good agreementof the two quantities (see fig. 2.13). The significantly different trends of thestrength development of the three concrete mixtures are very well followed bythe reflection coefficient. Based on these results the authors concluded that shearwave reflection coefficient and the compressive strength have the same relativerate of change over the investigated time range.
Based on the promising results of the previous study the relationship betweenthe shear wave reflection coefficient and compressive strength was investigated inmore detail by Akkaya et al. (2003). Experiments were conducted with differentconcrete mixtures at isothermal and non-isothermal conditions. Concretes withvarious w/b-ratios, fly ash contents, and coarse aggregate types were tested. Theconcretes were cured at three different isothermal conditions (4, 22, 30℃) andalso subjected to the outside environment. The reflection coefficient was mea-sured with shear waves (2.25 MHz) using the bottom plate of a steel mold asthe buffer medium and the compressive strength was measured on sample cylin-
2.4 Methods based on Acoustics 35
ders. The shear wave reflection coefficient was expressed as the reflection loss(in dB, starting from zero). The results have shown that compressive strengthand reflection loss are linear related within a time range of up to four days. Thelinearity of this relationship could also be established for the experiments con-ducted at uncontrolled environmental conditions were the in-situ temperature ofthe concrete followed the drastic day/night cycle of the ambient air temperature.A strength prediction procedure was proposed based on the estimation of theslope of the strength vs. reflection loss relationship. The authors conclude thata calibration of the strength vs. reflection loss relationship is necessary to obtainan acceptable accuracy of the strength predictions.
The repeatability of the wave reflection measurements on concrete and mortarat isothermal conditions was subject of a study conducted by Voigt et al. (2003).The evolution of the shear wave reflection coefficient in terms of the reflectionloss was measured on different batches of the same mortar and concrete mixtures.The compressive strength was determined with accompanying strength tests oncylindrical specimens. The results show a very good repeatability of the reflectionloss measured on mortar. Shape and final value of the reflection loss curve couldbe reproduced. The measured reflection loss on concrete was repeatable in regardto the shape of the curve. The final value of the different curves showed alarger scatter. It was concluded that the observed scatter is attributed to thehomogeneity of the test material. However, due to the calibration of the reflectionloss vs. strength relationship, the accuracy of the strength prediction was notfound to be influenced by this phenomenon. The results of this study couldalso reveal a close relationship of the kinetics of the strength and reflection lossevolution. It was found that the time of the occurrence of the inflection pointin the reflection loss graph, determined by its first derivative, is a fixed multipleof the time when the compressive strength starts to increase. This theoreticalstarting time of the compressive strength was defined as the intersection of aparabolic trend line fitted to the strength data. A summary of the investigationson the relationship of compressive strength and reflection loss of shear waves asdescribed in the previous two paragraphs is also given by Voigt et al. (2002).
Voigt and Shah (2003, 2004) have presented an investigation of the relation-ship between the reflection loss and basic material parameters of Portland cementmortar. Experiments were conducted on silica mortars with three different w/c-ratios cured at isothermal conditions. The wave reflection measurements withshear waves (2.25 MHz) were complimented by compression tests, pin penetra-tion, resonant frequency tests, adiabatic calorimetry and thermogravimetry. Due

36 2 Methods for Nondestructive Testing of Early-Age Concrete
to the determination of the compressive strength at very early ages (starting atca. 6 hours) an additional feature of the relationship between strength and re-flection loss was discovered. The linear trend exhibits a sudden change of itsslope at early ages. The time of this slope change is influenced by rate of thestrength gain of the tested mortar. The comparison of the dynamic shear modulias determined from the resonant frequency test and calculated from the wavereflection measurements shows that both quantities have similar features. Bothmoduli start to increase at the same time and the curves exhibit very similarshapes. However, the final values of the moduli were found to differ significantly.The shear modulus determined from the resonant frequency has an about 100higher final value than the one calculated from the reflection loss. This phenom-enon reinforces the previously established theory (Ozturk et al., 1999) that thewave reflection technique as it is applied in these studies measures the propertiesof the cement paste matrix next to the steel plate rather than the properties ofthe bulk including fine and coarse aggregates. The authors further present therelationship between the reflection loss and the degree of hydration (determinedfrom thermogravimetry), which showed a strong linear trend throughout the en-tire monitored time period. No bilinear pattern was observed. From the resultsof this study the authors concluded that the wave reflection loss measured withshear waves can be directly related to the fundamental material parameters shearmodulus and degree of hydration of the tested mortar mixtures.
Voigt et al. (2004b) have conducted investigations that have shown that thenumerical simulation of the cement hydration process can be a very useful tool forexplaining the results of wave reflection measurements. The comparison betweenthe wave reflection measurements and simulated microstructural parameters indi-cated that the connectivity of the hydrated cement particles has a major influenceon the development of the measured reflection loss. In this context, the connec-tivity is characterized by the percolation threshold, the volume fraction of theconnected solid phase and the specific contact area of the cement particles. Thehydration model HYMOSTRUC3D was used to numerically determine these pa-rameters. In particular, it was found that in the initial period the reflection lossstarts to increase close to the time of the occurrence of the percolation thresh-old of the cement particles. The subsequent reflection loss development followsthe trend of the volume fraction of the connected solid phase. At later ages thereflection loss is governed by the volume fraction of the total solid phase. Thespecific contact area of the cement particles was found to have a unique rela-tionship to reflection loss and compressive strength measured on mortars. This

2.4 Methods based on Acoustics 37
relationship is not influenced by the w/c-ratio of the tested mortars, which offersvarious possibilities for the further use of these dependencies.
2.4.2.6 Ozturk and Coworkers, Germany
Ozturk et al. (2004) improved the wave reflection test setup that was developedearlier (Ozturk et al., 1999). In order to increase the sensitivity of the ultrasonicmeasurement, steel was replaced by a material with lower acoustic impedancefor the buffer material. It was found that acrylic glass was the most appropriatebuffer material, since during the hydration process the acoustic impedance ofthe hardening cement paste exceeds that of the acrylic glass. Thus immediatelyafter mixing the obtained wave reflection curve decreases, has an inflection point,reaches a minimum and increases again. Compression wave transducers with acenter frequency of 200 kHz were applied. A correlation between the settingand hardening of cement-based materials and the development of the reflectioncoefficient was established, which allowed to accurately monitor the setting. Theinitial set and final set were correlated to the inflection point and the increaseof the wave reflection curve after having reached its minimum, respectively. Thedynamic Young’s modulus, the compressive strength and the degree of hydrationwere reflected in the development of the wave reflection curve. The sensitivityof the technique to the influence of the ambient temperature on the hydrationprocess of early-age concrete was also investigated. Concrete specimens wereproduced and cured at four different isothermal conditions (20°C, 35°C, 50°C,65°C), and the hydration acceleration was monitored non-destructively. It wasfound that within the investigated range, the greatest accelerating effect on thesetting of cement is from 20°C to 35 °C. Further temperature increase showedno significant acceleration. At any time after mixing the reflection coefficient–compressive strength relationship was found to be linearly related with increasingambient temperature.
2.4.2.7 Others
An application of the wave reflection method that uses a wedge-shaped buffermedium with triangular cross section has been proposed by Labouret et al. (1998).The buffer block is inserted in the horizontal surface of the fresh cement/concretewith the tip of the wedge penetrating the material. This setup generates twoinclined interfaces of the concrete/cement and the buffer medium. Two com-pression wave transducers are attached to the upward facing side of the buffer
38 2 Methods for Nondestructive Testing of Early-Age Concrete
medium. One transducer acts as the emitter and the other as the receiver. Thewaves are sent by the transmitting transducer, reflected twice at the edges of thebuffer medium at 45°C incidence and then received by the second transducer.The signal loss of the waves undergoing the multiple reflection process is relatedto the square of the reflection coefficient between the buffer medium and thecement at any given time. The authors present measurements of the signal lossand the phase of the reflected signal versus curing time of one cement and oneconcrete.
Wave reflection experiments using compression and shear waves with a fre-quency of 5 MHz have been reported by Belkheiri et al. (1999). Using a glassrod as the buffer medium the amplitude development of the reflected waves isused to monitor the setting and hardening behavior of Portland cement, gypsumlike plaster and synthetic resin. The typical pattern of the hydration kineticsof Portland cement could be reproduced by the applied method. The differenthardening behavior of the gypsum plaster resulting from different plaster to waterratios was also found to be detectable. Finally, the retardation time of the resinhardening caused by a variation in the content of the added hardening agent wasshown to be measurable.
The principle of the wave reflection technique to nondestructively monitor thebond strength of ceramic tiles has been used by Tan et al. (1996). The tiles werebonded to a concrete base with Portland cement paste of different w/c ratios.By using the ceramic tiles as the buffer medium, the reflection of compressionwaves (4 MHz) from the interface between the tile and the bonding cement pastewere measured. The loss of the reflected waves relative to the transmitted signal,which depends on the reflection coefficient at the cement-tile interface, was foundto differ significantly with the w/c-ratio of the cement paste used for the bonding.The measured reflection loss at the cement/tile interface for the different w/c-ratios was found to correlate well with the pull-off force of the tiles that wasdetermined by means of mechanical testing.
2.4.3 Impact-Echo Method
The impact-echo method uses a mechanical impact on the surface of a concretemember to generate a stress wave pulse that undergoes multiple reflections be-tween the opposite surfaces of the considered object. By measuring the time thatthe waves require to travel from the point of the impact to the opposite side andback to the point of generation, the velocity of the waves can be calculated giventhat the thickness of the member is known. Alternatively, if the wave velocity

2.4 Methods based on Acoustics 39
(a) from Pessiki and Carino (1988) (b) from Pessiki and Johnson (1994)
Fig. 2.14: Impact-echo method for testing early age mortar and concrete (Reprinted by permissionfrom the American Concrete Institute, USA)
of the tested concrete has been predetermined, the thickness of the member canbe calculated. The impact-echo method was developed by researchers of the Na-tional Institute of Standards and Technology (NIST), which was formerly knownas the National Bureau of Standards (NBS), of the United States of Amerika.The main application field of the impact-echo method is the detection of internalfeatures of concrete structures, such as delaminations, cracks or tendon ducts.A general description of the impact-echo method for this type of application aswell as further references are given in Sansalone and Streett (1997), Sansalone
(1997), and Carino (2004c).It was shown by Pessiki and Carino (1988) that the impact-echo method can
also be used for monitoring the setting and hardening of early-age concrete.The authors conducted impact-echo measurements on freshly cast mortar andconcrete cylinders (fig. 2.14a). The obtained P-wave velocity data were analyzedin regard to the initial and final setting time measured with the pin penetrationmethod as well as compressive strength of cylinders. The results indicated thegeneral suitability of the impact-echo method to measure the P-wave velocity ofconcrete and mortar during setting. It was concluded that if a certain value ofwave velocity is defined as the criterion for the time of initial or final set thenthe impact-echo method could be used as a tool to evaluate if the concrete hasreached this velocity. The value of the P-wave velocity that was found to correlateto the time of initial set was 670 m/s.
Pessiki and Carino also investigated the possibility to predict the early-agecompressive strength development by means of the conducted impact-echo tests.Three concrete mixtures varying in water/cement-ratio and aggregate contentwere cured at three different temperatures. The P-wave velocity was determined

40 2 Methods for Nondestructive Testing of Early-Age Concrete
in a time range between 3 hours and 28 days. At early ages the P-wave velocityincreased at a faster rate when compared with the compressive strength andat later ages the strength was the faster developing quantity. Nevertheless, aconsistent relationship between P-wave velocity and strength, independent fromthe water/cement-ratio was found. Heat curing and aggregate content of theconcrete had an influencing effect on this relationship. As a result, the P-wavevelocity determined with the impact-echo method was found to be a sensitiveindicator of the changes in the compressive strength up to values equal to 60%of the 28-day strength.
The efforts to apply the impact-echo method to determine the in-place com-pressive strength of early-age concrete were continued by Pessiki and Johnson
(1994, 1996). Impact-echo tests were conducted on concrete slabs (fig. 2.14b)and the measured velocities compared to strength data obtained from compan-ion cylinders and cores. It was found that the method is suitable for this typeof application, especially at early ages. The first strength predictions could bemade three hours before extracting cores was possible. The authors concludedthat strength predictions should be made only at early ages, since the P-wavevelocity looses sensitivity when at higher concrete maturity.
Lee et al. (2003) used the impact-echo method to measure the rod-wave velocityof concrete cylinder specimens between 12 hours and 28 days. The comparisonof the P-wave velocity data to the compressive strength of the cylinders hasshown that the resulting velocity-strength relationship can be used to predictthe compressive strength for ages up to three days after casting. The velocity-strength relationship was found to be exponentional in nature and influenced byvariations of the water/cement-ratio and the curing age. The addition of fly ashdid not alter this dependency. The authors concluded that by accounting for thementioned effects by establishing the appropriate velocity-strength relationshipsthe impact-echo method can be used to predict the early-age compressive strengthwith a good accuracy.
A continuation of the efforts to apply the impact-echo method for measure-ments of fresh concrete was presented by Grosse et al. (2004). To perform themeasurements, a glass plate was placed on the surface of a fresh concrete slaband used to induce the mechanical impact. The measurements were conductedon slabs with a thickness of 5 to 20 cm during the first 22 hours of hydration.Simultaneously to the impact-echo tests, a sample of the concrete was tested withP-waves in through transmission mode to obtain a control value of the P-wavevelocity. The authors compared the resonant frequency measured on the con-
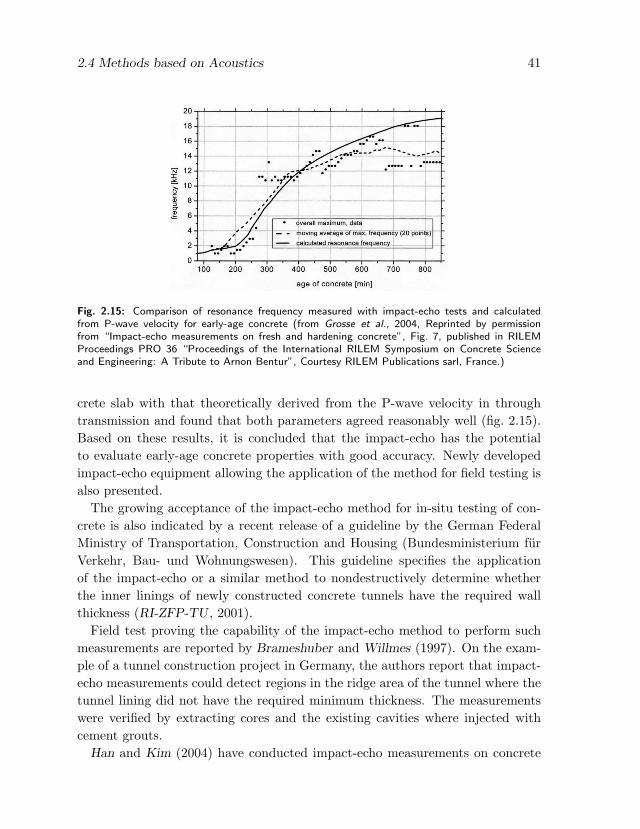
2.4 Methods based on Acoustics 41
Fig. 2.15: Comparison of resonance frequency measured with impact-echo tests and calculatedfrom P-wave velocity for early-age concrete (from Grosse et al., 2004, Reprinted by permissionfrom “Impact-echo measurements on fresh and hardening concrete”, Fig. 7, published in RILEMProceedings PRO 36 “Proceedings of the International RILEM Symposium on Concrete Scienceand Engineering: A Tribute to Arnon Bentur”, Courtesy RILEM Publications sarl, France.)
crete slab with that theoretically derived from the P-wave velocity in throughtransmission and found that both parameters agreed reasonably well (fig. 2.15).Based on these results, it is concluded that the impact-echo has the potentialto evaluate early-age concrete properties with good accuracy. Newly developedimpact-echo equipment allowing the application of the method for field testing isalso presented.
The growing acceptance of the impact-echo method for in-situ testing of con-crete is also indicated by a recent release of a guideline by the German FederalMinistry of Transportation, Construction and Housing (Bundesministerium furVerkehr, Bau- und Wohnungswesen). This guideline specifies the applicationof the impact-echo or a similar method to nondestructively determine whetherthe inner linings of newly constructed concrete tunnels have the required wallthickness (RI-ZFP-TU , 2001).
Field test proving the capability of the impact-echo method to perform suchmeasurements are reported by Brameshuber and Willmes (1997). On the exam-ple of a tunnel construction project in Germany, the authors report that impact-echo measurements could detect regions in the ridge area of the tunnel where thetunnel lining did not have the required minimum thickness. The measurementswere verified by extracting cores and the existing cavities where injected withcement grouts.
Han and Kim (2004) have conducted impact-echo measurements on concrete

42 2 Methods for Nondestructive Testing of Early-Age Concrete
cylinders of various ages to investigate the effects of cement type, curing temper-ature, and age on the relationships between dynamic and static elastic moduli orcompressive strength. Concrete specimens (cement Types I and V) with w/c/-ratios of 0.40 and 0.50 are cured isothermally at 10°C, 23°C, and 50°C and testedat 1, 3, 7, and 28 days. It was found that cement type and age do not have asignificant influence on the relationship between dynamic and static elastic mod-uli, but the ratio of static to dynamic elastic modulus approaches unity as thetemperature increases. The initial chord elastic modulus, which is measured at alow strain level, is similar to the dynamic elastic modulus. The relationship be-tween dynamic elastic modulus and compressive strength has the same tendencyas the relationship between dynamic and static elastic moduli for various cementtypes, temperatures, and ages.
2.4.4 Resonant Frequency Method
The resonance frequency method makes use of the relationship between the nat-ural frequency of a solid body’s vibration and its elastic properties. Hence, byknowing the density of a specimen with given dimensions it is possible to calcu-late the dynamic constants Young’s modulus, shear modulus and Poisson’s ratioby measuring the natural (resonant) frequency. This principle was first appliedby Powers (1938) by matching the musical tone of a vibrating concrete specimenwith the tone created by a set of frequency calibrated orchestra bells. Only ashort time later the method was refined by Hornibrook (1939) and Thomson
(1940) by using electronic equipment.A detailed description of the fundamentals of the resonant frequency method
and its application are described in several references (Malhotra and Sivasun-
daram, 2004; Jones, 1962; Pohl, 1966). In the following paragraphs it will beattempted to give an overview about the possibilities to apply this method fornondestructive testing of early-age concrete.
Simmons (1955) used the resonance frequency method to determine the dy-namic Poisson’s ratio of concrete at ages starting from one day after casting. Thecomparison of these measurements to values of Poisson’s ratio obtained from pulsevelocity test revealed a significant difference between them. The Poisson’s ratioderived from the resonance frequency where consistently lower.
Similar investigations were conducted by Swamy (1971). In his paper the dy-namic Poisson’s ratio of cement paste, mortar and concrete is determined fromthe longitudinal and torsional resonant frequency. The tests which were con-ducted from ages of one day onwards, confirmed the results from the previous
2.4 Methods based on Acoustics 43
investigator. The effects of age, w/c-ratio, aggregate content and curing condi-tions on the dynamic Poisson’s ratio could be established. However, it was foundthat the results where subjected to relatively large scatter and that unique rela-tionships between dynamic Poisson’s ratio and parameters, such as w/c-ratio orcompressive strength are unlikely to exist.
Another frequently investigated subject is the relationship of the dynamic elas-tic moduli of concrete to its compressive strength. Experiments to examine thisrelationship for concrete at early ages were reported by Hansen (1986b), Gardner
(1990), and Jin and Li (2001). Hansen found that this relationship is primarilyinfluenced by the paste content of the concrete. The influence of the w/c-ratio(tested: 0.4 and 0.6) was negligible. Gardner investigated concretes of differ-ent cement types and w/c-ratios and containing fly ash at four different curingtemperatures (0°C,10°C,20°C,30°C). It was found that with an absolute error of5.6% a single relationship between dynamic Young’s modulus and compressivestrength of all tested mixtures could be defined. The independence of this rela-tionship from the w/c-ratio of concrete (ages from 1 to 28 days) could also beverified by the results reported by Jin and Li.
Among several other researchers, Nagy (1997) has investigated the relationshipbetween the Young’s modulus derived from static and resonant frequency tests.The measurements, which were startet as early as five hours after casting, wereused to derive an empirical relation between static and dynamic Young’s modulus.This formula was shown to produce good prediction results for the static Young’smodulus for concretes with two different cement types and w/c-ratios.
Cros and Ferrandis (1999) and Ferrandis and Leveque (2003) have developed atechnique that utilizes a metallic cylinder/rod combination to follow the settingprocess of cement pastes. The rod is embedded in the specimen to be testedshortly after casting. The measurements are conducted by exciting the metalliccylinder that is attached to the rod with a piezoelectric element. The resultingresonance frequency of the entire metal insert is then determined and comparedto that when the metal rod is in free condition (not in contact embedded in thespecimen). As the cement hydrates the metal insert essentially changes continu-ously from a free vibration mode to a blocked mode. The investigators concludedthat the measured resonance frequency can be used to derive the storage shearmodulus G′ of the tested cement paste within a certain range. This range can beadapted to the hardening stage of the cement paste by changing the dimensionsof the used cylinder/rod metal insert.
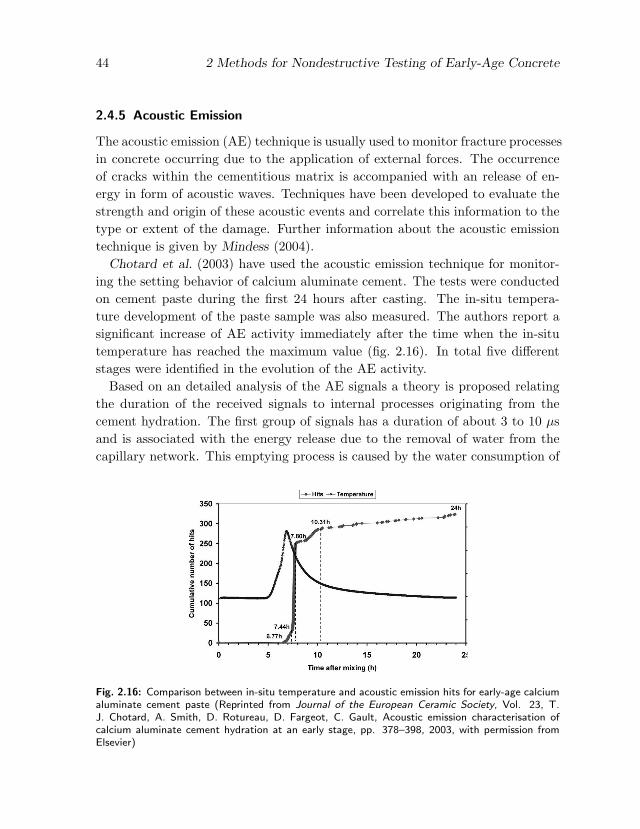
44 2 Methods for Nondestructive Testing of Early-Age Concrete
2.4.5 Acoustic Emission
The acoustic emission (AE) technique is usually used to monitor fracture processesin concrete occurring due to the application of external forces. The occurrenceof cracks within the cementitious matrix is accompanied with an release of en-ergy in form of acoustic waves. Techniques have been developed to evaluate thestrength and origin of these acoustic events and correlate this information to thetype or extent of the damage. Further information about the acoustic emissiontechnique is given by Mindess (2004).
Chotard et al. (2003) have used the acoustic emission technique for monitor-ing the setting behavior of calcium aluminate cement. The tests were conductedon cement paste during the first 24 hours after casting. The in-situ tempera-ture development of the paste sample was also measured. The authors report asignificant increase of AE activity immediately after the time when the in-situtemperature has reached the maximum value (fig. 2.16). In total five differentstages were identified in the evolution of the AE activity.
Based on an detailed analysis of the AE signals a theory is proposed relatingthe duration of the received signals to internal processes originating from thecement hydration. The first group of signals has a duration of about 3 to 10 µsand is associated with the energy release due to the removal of water from thecapillary network. This emptying process is caused by the water consumption of
Fig. 2.16: Comparison between in-situ temperature and acoustic emission hits for early-age calciumaluminate cement paste (Reprinted from Journal of the European Ceramic Society, Vol. 23, T.J. Chotard, A. Smith, D. Rotureau, D. Fargeot, C. Gault, Acoustic emission characterisation ofcalcium aluminate cement hydration at an early stage, pp. 378–398, 2003, with permission fromElsevier)

2.5 Radioactive Methods 45
the hydration process. The second group of AE signals has a duration of about11 to 200 µs. This group is believed to be associated with the precipitationof small germa of hydrates, the growth of crystalline hydrates and the onset ofmicrocracking.
2.5 Radioactive Methods
2.5.1 Gamma Radiometry
Gamma radiometry is based on the transmission of gamma rays through thematerial to be tested and the subsequent evaluation of the transmitted radia-tion. The fraction of the originally transmitted radiation that is received by thedetector is in direct relationship to the density of the tested material.
In context with early-age concrete, gamma radiometry is used for monitoringthe uniformity and density of concrete immediately after placing. Pohl (1966, 92)and Mitchell (2004) report about the application of this technique in concretehighway construction. By measuring the density of the fresh concrete shortlyafter placing it possible to identify proper consolidation or possible variation inthe concrete composition. This technique is especially effective if it is used inconnection with slipform pavement. The necessary equipment can be mounted ona slipform paver to perform noncontact measurements, which allow a continuousmonitoring of the density of the placed concrete. Further details concerningother variants of this technique for monitoring the compaction of fresh concreteare given by Honig (1991).
2.5.2 X-ray Microscopy
In-situ investigations of the cement hydration process using X-ray microscopywere reported by Gartner et al. (2000), Juenger et al. (2003a) and Kurtis andRodrigues (2003). The measurements were conducted with an X-ray microscopedeveloped at the Center for X-ray Optics (CXRO) at the Advanced Light Source(ALS) at the E.O. Lawrence Berkeley National Laboratory (LBNL). The tech-nique is based on the transmission of X-rays through a sample. By using a systemof mirrors and micro zone plates the transmitted X-rays are projected onto anX-ray CCD-camera. The use of X-rays with very short wave lengths (soft X-rays)leads to a very high resolution of approximately 25 nm. The images that can beobtained with the microscope have a magnification that ranges between 1600×and 2400×. The great advantage of the described method is that it is possible

46 2 Methods for Nondestructive Testing of Early-Age Concrete
(a) at 15 min (b) at 55 min
Fig. 2.17: Portland cement in solution saturated with calcium hydroxide and gypsum, scalebar = 1µm (from Juenger et al., 2003a, Reprinted by kind permission from Springer Science and BusinessMedia)
to examine wet samples over time under atmospheric pressure. These featuresmake X-ray microscopy very useful for studying cement hydration.
Juenger et al. (2003a,b) describe observations of the hydration of Portlandcement in a solution saturated with calcium hydroxide and gypsum. The dis-solution and reaction of the cement particles could be observed in a very goodmanner. The comparison of images taken at the same location of the samples atdifferent times showed very clearly the formation of needle-like products aroundthe cement grains (fig. 2.17). It is concluded that the soft X-ray transmissionmicroscopy is a very good tool for answering questions concerned with the rateof formation and the morphology of hydration products.
2.5.3 X-Ray Microtomography
The application of X-ray microtomography offers the possibility to obtain a three-dimensional representation of the material under examination. Hydrating Port-land cement pastes were tested with this technique at the European SynchrotronRadiation Facility (ESERF) in Grenoble, France, in 2000. To perform the mea-surements, freshly mixed cement paste was filled in plexiglass tubes with an innerdiameter of 1 mm. The tubes are then mounted on a tranlation/rotation stageallowing precise alignment in the beam of the 3-D microtomography unit. To ob-

2.6 Methods based on Optical Fibers 47
(a) w/c = 0.35, age = 4 hours (b) w/c = 0.45, age = 129 hours
Fig. 2.18: Two-dimensional image of the microstructure of hydrating cement paste obtained fromX-ray microtomography (Bentz et al., 2002)
tain a complete 3-D image set for a material more then 1000 single radiographicimage must be recorded at different angles. The resolution of the obtained fi-nal digital images is 0.95 µm per voxel. More detail about the experimentalprocedure is given by Bentz et al. (2002).
A 2-D slice image for the w/c-ratio of 0.35 after hydration time of 4 hours isgiven in figure 2.18a. It can be seen that many unhydrated cement particles arestill existent (light grey). Another 2-slice image for a 129 hours old cement pastewith a w/c-ratio of 0.45 is given in figure 2.18b. Due to the higher w/c-ratio andthe progressed age, fewer unhydrated cement grains can be found.
2.6 Methods based on Optical Fibers
Optical fibers were first used for applications in the telecommunication industrystarting in the mid 1960s. The fibers consist of a glass core that transmits theoptical signals, that is light waves. Depending on the type of fiber, this glasscore is surrounded by a stabilizing cladding and/or a coating for protection. Theuse of optical fibers as sensors is based on transmitting light waves into the fiber.While constantly being reflected at the inner walls of the glass core, light wavestravel through the fiber before being reflected at the end of the fiber. These

48 2 Methods for Nondestructive Testing of Early-Age Concrete
reflections are evaluated and carry the desired information. External forces, suchas pressure, strain or temperature that are acting on the fiber change the phase,the intensity or the wave length of the light waves that are being reflected andreceived. If these changes can be related to certain parameters (e.g. strain) theoptical fibers can be used to actually measure these parameters. A comprehensivereview of the use of optical fibers in civil engineering is given by Merzbacher et al.
(1996) and Ansari (1997).The use of optical fibers to evaluate the air content of fresh concrete was
reported by Ansari (1990, 1991a,b). To conduct the measurements the end ofthe optical fiber is simply inserted into the fresh concrete to be tested. Theapplied methodology makes use of the fact that the intensity with that the lightwaves are reflected depends on the type of the material that is in contact withthe end of the optical fiber at the time of reflection. The intensity is high if thefiber touches an air bubble and it is low when it is in contact with cement paste.The measuring system, the airmeter, has first to be calibrated to the concretethat is under test. This calibration is done by placing the sensor tip into theconcrete and keeping is stationary for ten seconds. This reading represents aair content of zero percent. After that the data are collected for ten secondswhile the sensor tip is held in the air. This reading corresponds to an air contentof 100%. After this calibration procedure, the sensor tip is plunged back intothe concrete and moved around for ten seconds to collect readings. The averageof these readings will be located somewhere between the readings taken duringthe calibration procedure. A computer calculates the air content based on thesereadings. The measurements taken with this Fiber Optic Airmeter where foundto produce reliable results under laboratory and field conditions.
Glisic and Simon (2000) performed measurements with optical fibers in orderto determine the early-age deformation of concrete. These early-age deformationsare caused by internal shrinkage and temperature changes that accompany thecement hydration. The measurements are performed by embedding two opticalfibers into the concrete. One of them is a standard type fiber with normal stiff-ness. This standard sensor is immediately subjected to the internal deformationsof the concrete. The second embedded fiber is of higher stiffness and thereforeis influenced by the concrete deformations at a later time, when sufficient bondstrength between the stiff sensor and the concrete has developed. The deforma-tion measured by the embedded fibers were monitored during the first three daysof the concrete hardening. The measurements obtained from the standard sensorwere found to develop after the exact same trend as the the in-situ temperature

2.6 Methods based on Optical Fibers 49
Fig. 2.19: Effect of drying conditions on early-age shrinkage of cement paste measured with opticalfiber (Reprinted from Cement and Concrete Composites, Vol. 26, V. Slowik, E. Schlattner, T. Klink,Experimental investigation into early age shrinkage of cement paste by using fibre Bragg gratings,pp. 473–479, 2004, with permission from Elsevier)
that was also measured. At very early ages the deformations measured of the twosensors (standard and stiff) showed differences due to their different properties.The time at which these difference became negligible was found to be suitable tobe used as a criterion indicating that the concrete had reached a certain strengthlevel.
Similar experiments were conducted by Slowik et al. (2004) to evaluate theearly age shrinkage of laboratory size cement paste specimens. Optical fiberswere embedded along the longitudinal axis of cement paste prisms and the strainmeasured by these fibers was found to develop according to the trend that istypically observed in common early-age shrinkage measurements. The appliedmethod was found to be suitable to establish the effects of different drying con-ditions (sealed, open, under air current) and of the location in the measure-ments(distance from upper sample surface) on the development of the early ageshrinkage. Figure 2.19 shows the effect of the drying condition on the shrinkagedevelopment. The deformation of the sealed specimen indicated the developmentof the chemical shrinkage.
50 2 Methods for Nondestructive Testing of Early-Age Concrete
2.7 Microwave Absorption Method
Microwaves are electromagnetic waves with wavelengths between 0.3 mm and 30cm and frequencies ranging from 1 to 1000 GHz. The propagation of microwavesin concrete depends on its dielectric properties, which in turn are a function of theamount of the free water present in the material. During hydration, the amountof the free water in the concrete reduces significantly, which makes microwave ab-sorption methods a powerful tool for monitoring this hydration process. Clemena
(2004) reports about measurements of the dielectric constant and the reflectiv-ity (reflection coefficient) of microwaves on setting and hardening concrete. Thereflectivity was found to be linearly related to the compressive strength for agesbetween 1 and 28 days. This relationship was the same for concretes preparedwith two different cement types.
Moukwa et al. (1991) have reported microwave measurements at 10 GHz tomonitor the hydration of Portland cement in the first 24 hours. The microwavemeasurements were complemented with calorimetry. The conductivity and rela-tive permittivity derived from the microwave measurements could be associatedwith the different stages of the cement hydration process. Distinct points inthe development of these two parameters were found to be indicative for theend of the induction period, the time when the maximum heat is generated andthe change in the heat deceleration rate. Conductivity and relative permittivitywere also found to be very sensitive to the w/c-ratio and the type of the usedcement. The authors also indicate the suitability of the method for field applica-tion, since readings indicating chemical changes occurring during the hydrationof the cement can be obtained from non-contact surface reflection measurements.
The ability of the microwave absorption method to detect the w/c-ratio ofcement paste was demonstrated by Zoughi et al. (1995). It is reported that bysweeping through the microwave frequency range (5–17 GHz) the resulting changein the reflection coefficient can be used to estimate the w/c-ratio of the testedcement paste. Based on standard relationships between compressive strengthand w/c-ratio a correlation between the change in the reflection coefficient of themicrowaves to the change in compressive strength was obtained. Similar resultswere reported by Shalaby and Zoughi (1995).
The application of the microwave technique to field measurements of the w/c-ratio of fresh cement paste and concrete was reported by Mubarak et al. (2001).By using a monopole antenna that is immersed into the material to be testedthe reflection coefficient of the microwaves can be measured. The magnitude of

2.8 Electrical Methods 51
w/c-ratio
Outp
ut V
oltage (
V)
(a) Calibration of reflectometer reading to w/c-ratio
actual w/c-ratio
pre
dic
ted w
/c-r
atio
(b) Prediction of w/c-ratio
Fig. 2.20: Application of microwave absoprtion technique for measuring w/c-ratio of fresh cementpaste (from Mubarak et al., 2001, Reprinted by permission from the Institute of Electrical andElectronics Engineers, © 2001 IEEE)
the reflection coefficient, which is measured by the reflectometer as voltage, hasbeen calibrated to the w/c-ratio of a range of cement pastes (fig. 2.20a). Basedon this calibration, the w/c-ratio of cement paste mixtures could be predictedwith an accuracy of ±0.02 (fig. 2.20b).
2.8 Electrical Methods
The first applications of electrical resistivity measurements to monitor the prop-erties of cement-based materials date back to the 1920s. Bogue (1947, p. 472)reports about experiments conducted by Shimizu in 1928/29 showing that thesetting of cement can be more accurately monitored by electrical rather thanby mechanical or thermal methods. It was found that the end of setting corre-sponds to an inflection point in the conductivity (the reciprocal of the resistivity)development versus hydration time.
Calleja (1952) conducted electrical resistance measurements on cement pasteduring the first ten hours after mixing and compared these results to in-situtemperature measurements. It was found that distinct points in the resistancedevelopment matched the occurrence of marked changes in the temperature de-velopment. It was concluded that the beginning and end of the setting processcan be indicated with electrical resistance measurements.
The possibility to quantitatively evaluate the setting process of concrete bymeans of the measurement of the electrical conductance was reported by Sri-
ravindrarajah and Swamy (1982). In their work the beginning of the setting was

52 2 Methods for Nondestructive Testing of Early-Age Concrete
interpreted as the time of the increase of the conductance curve. Similar resultswere reported by McCarter and Afshar (1984, 1985a,b,c) who measured the de-velopment of the resistivity and the dielectric constant of cement pastes duringthe first 24 hours after casting. In these studies it was found that the electri-cal response of the cement pastes is sensitive to physical and chemical changeswithin paste and can be used to monitor the setting and hardening process. Theinfluence of retarders and accelerators of different dosages on the cement settingcould also be quantified. These conclusion were drawn based on the comparisonbetween the electrical measurements and the in-situ temperature evolution, thecompressive strength development and SEM micrographs.
The application of resistivity measurements to early-age cement paste by us-ing non-contact test device was proposed by Li et al. (2003). Experiments arepresented that evaluate the resistivity of cement pastes of three w/c-ratios andthat of the appropriate pore solutions extracted at different time during the hy-dration. The formation factor as an indicator of the tortuosity of the pastes wasderived from this data. The author concluded that the resistivity measurementsobtained from the newly developed device can accurately follow the hydrationprocess and are an index of the porosity and pore connectivity.
A comprehensive overview about the application of electrical methods for thetesting of cementitious materials was presented by McCarter et al. (2003). Em-phasis was placed on the early hydration of cementitious systems, the impedanceof fly ash mixtures and concrete durability. It was found, for example, that theconductance, in particular its derivative, measured on early age Portland cementpaste is indicative for five distinct phases that can be correlated to phases ofcement hydration as determined with isothermal calorimetry. Fixed frequencyelectrical conductivity measurements were taken on concrete specimens at differ-ent depths within the concrete cover. The specimens were subjected to wettingcycles with water and NaCl-solution. The results showed a clear influence ofthe depth and the wetting medium on the measured conductivity over time. Itwas concluded that, besides the known factors cement hydration and pozzolanicactivity, level of pore saturation and pore-fluid conductivity are the determiningfactors of the conductivity of the concrete. As the NaCl-solution advances intothe concrete cover the conductivity measured at the respective electrode pairs in-creases as a response of the increased ionic concentration of the pore fluid. Thisallows tracking of the chloride front and drawing conclusions about processes,such as corrosion, that affect the durability of concrete.
A portable system for field testing of early-age concrete was introduced by
2.8 Electrical Methods 53
van Beek (2000). The system is based on a dielectric sensor that operates at afrequency of 20 MHz. To conduct the measurements a electrode set is embeddedin the concrete member during the casting process. By means of the dielectricsensor attached to the embedded electrodes and a handheld computer the con-ductivity of the hardening concrete can be measured and used to determine thein-situ compressive strength. This compressive determination is based on therelationship between conductivity and strength, which has to be determined inadvance by laboratory testing. The practical applicability of this method hasbeen demonstrated by on-site tests on a cast-in-place concrete bridge.

Chapter 3
Stress Wave Propagation Theory
3.1 Wave Types
To successfully apply test methods that are based on ultrasonic waves, basicknowledge about type and properties of acoustic waves and their propagation incementitious materials is beneficial. The three most important types of acousticwaves will be introduced here. If a solid material is excited by a mechanicalimpact three different types of waves are generated: compression or primary (P)waves, shear or secondary (S) waves and surface or Rayleigh (R) waves. Startingfrom the point of excitation they propagate uniformly but with different velocitiesthrough the medium. The P-wave travels with the highest velocity followed bythe S- and R-waves. The relationship between the wave velocities is governedby the Poisson’s ratio of the considered material. For normal concrete with aPoisson’s ratio of µ = 0.18 the ratio between P- and S-wave velocity is 0.62 andthat between P- and R-wave velocity is 0.57 (Sansalone and Streett, 1997). Aschematic showing the generation and propagation of the discussed wave typesis given in figure 3.1.
The three wave types differ also in the form of the caused particle movement.The particles excited by a P-wave move parallel to the direction of wave prop-agation whereas an S-wave causes the particles to move perpendicular to thedirection of travel. An R-wave that propagates only along the surface of ma-terials moves the particles on an elliptical path. The amplitude of the particlemovement decreases dramatically with their distance to the surface. A snapshotof the particle movement for P- and S-waves is given in figure 3.2.
The velocity of acoustical waves in a material is governed by its density ρ and
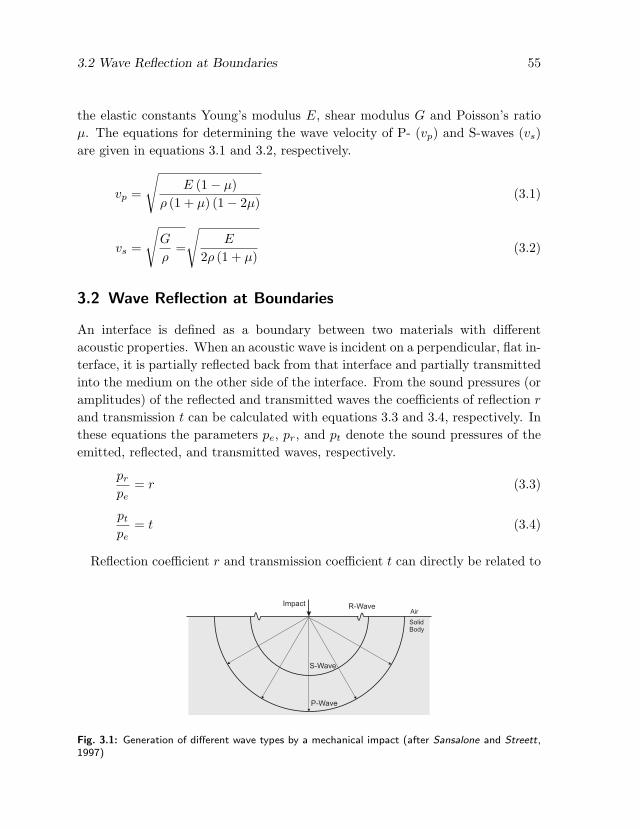
3.2 Wave Reflection at Boundaries 55
the elastic constants Young’s modulus E, shear modulus G and Poisson’s ratioµ. The equations for determining the wave velocity of P- (vp) and S-waves (vs)are given in equations 3.1 and 3.2, respectively.
vp =
√E (1− µ)
ρ (1 + µ) (1− 2µ)(3.1)
vs =
√G
ρ=
√E
2ρ (1 + µ)(3.2)
3.2 Wave Reflection at Boundaries
An interface is defined as a boundary between two materials with differentacoustic properties. When an acoustic wave is incident on a perpendicular, flat in-terface, it is partially reflected back from that interface and partially transmittedinto the medium on the other side of the interface. From the sound pressures (oramplitudes) of the reflected and transmitted waves the coefficients of reflection r
and transmission t can be calculated with equations 3.3 and 3.4, respectively. Inthese equations the parameters pe, pr, and pt denote the sound pressures of theemitted, reflected, and transmitted waves, respectively.
pr
pe= r (3.3)
pt
pe= t (3.4)
Reflection coefficient r and transmission coefficient t can directly be related to
R-WaveImpactAir
SolidBody
S-Wave
P-Wave
Fig. 3.1: Generation of different wave types by a mechanical impact (after Sansalone and Streett,1997)

56 3 Stress Wave Propagation Theory
ë
ë
Direction of Travel
P-wave
S-wave
Excitation
Fig. 3.2: Snapshot of particle movement caused by compression and shear waves (after Krautkramerand Krautkramer , 1990)
the acoustic impedances Z of the materials that form the interface. The acousticimpedance of a material is calculated as the product of the wave velocity vi andthe density ρi of the material (eq. 3.5), where i is the number of the material.From the acoustic impedances of the materials the coefficients r and t can becalculated with equations 3.6 and 3.7 (Krautkramer and Krautkramer, 1990).A schematic of the reflection of acoustic waves at a plane interface at normalincidence is given in figure 3.3.
Z = ρivi i = 1, 2, . . . , n (3.5)
r =Z2 − Z1
Z2 + Z1(3.6)
t =2Z2
Z2 + Z1(3.7)
If in equation 3.6 the acoustic impedance of material 2 (Z2) is smaller thanthat of material 1 (Z1) the reflection coefficient r becomes negative. This negativevalue indicates a phase reversal of the reflected wave relative to the incident wave.Such a phase reversal occurs when, for example, longitudinal waves are reflectedat an interface of steel and hardened cement paste. The reflection process isschematized in figure 3.4.

3.3 General Derivation of Elastic Constants 57
transmitted wave
Material 2
1 Z = vñ
Material 1
incident wave
reflected wave
Z = vñ1 1 2 2 2
Fig. 3.3: Schematic of the reflection process of acoustic waves at a plane interface at normalincidence
3.3 General Derivation of Elastic Constants
Arising from elasticity and acoustics two elastic moduli can directly be derivedfrom density and wave velocity. Knowing the velocity of longitudinal and shearwaves in a material the longitudinal (L) and shear modulus (G) can be calculatedfrom equations 3.8 and 3.9.
L = ρv2p (3.8)
G = ρv2s (3.9)
The moduli L and G are related to the direction of particle motion causedby primary and shear waves. The longitudinal modulus relates strain to longi-tudinally applied stress. The shear modulus describes the elastic behavior of amaterial when the strain perpendicular to the direction of the applied stress iszero. The moduli L and G are interrelated through the Lame constant λ as givenin equation 3.10 (Schreiber et al., 1973).
L = λ + 2G (3.10)
E = v2pρ
(1 + µ) (1− 2µ)(1− µ)
(3.11)
As it will be of advantage in a later chapter of this thesis it is possible to definea relationship physical relationship between the reflection coefficient measuredwith shear waves and the shear modulus of the second medium (material 2 fromeq. 3.6). This relationship as given in equation 3.12 can be obtained by combiningthe left part of equation 3.2 with equations 3.5 and 3.6.

58 3 Stress Wave Propagation Theory
p
-1
1
r
pe
pt
-0.67
0.33
v = 5800 m/s
= 7.81 g/cm
Z = 45 Ns/m
r = -0.67
r
Transmitted Wave
Reflected Wave
Sound Pressure
Steel Cement Paste
L
1
3
3
v = 4500 m/s
= 2.00 g/cm
Z = 9 Ns/m
t = 0.33
r
L
2
3
3
Incident Wave
Fig. 3.4: Schematic of reflection process of longitudinal waves at a steel-cement paste interface(after Krautkramer and Krautkramer , 1990)
GWR =Z2
B (1 + r)2
ρc (1− r)2(3.12)
3.4 Shear Waves in Cementitious Materials during Setting andHardening
3.4.1 Propagation
The phenomenon of propagation of shear waves in cementitious materials dur-ing the setting and hardening process will be explained on the example of purecement paste. Freshly mixed cement paste is from a rheological point of view aviscoelastic medium with the material behavior dominated by its viscous prop-erties (viscosity and yield stress). Several references are available that discussthe propagation of shear waves in viscoelastic media in general (McSkimin, 1964;
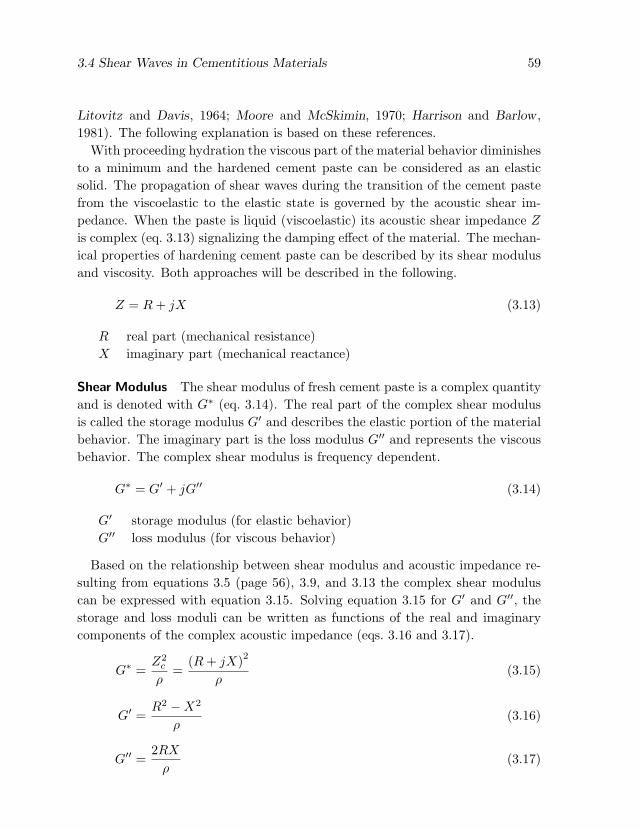
3.4 Shear Waves in Cementitious Materials 59
Litovitz and Davis, 1964; Moore and McSkimin, 1970; Harrison and Barlow ,1981). The following explanation is based on these references.
With proceeding hydration the viscous part of the material behavior diminishesto a minimum and the hardened cement paste can be considered as an elasticsolid. The propagation of shear waves during the transition of the cement pastefrom the viscoelastic to the elastic state is governed by the acoustic shear im-pedance. When the paste is liquid (viscoelastic) its acoustic shear impedance Z
is complex (eq. 3.13) signalizing the damping effect of the material. The mechan-ical properties of hardening cement paste can be described by its shear modulusand viscosity. Both approaches will be described in the following.
Z = R + jX (3.13)
R real part (mechanical resistance)X imaginary part (mechanical reactance)
Shear Modulus The shear modulus of fresh cement paste is a complex quantityand is denoted with G∗ (eq. 3.14). The real part of the complex shear modulusis called the storage modulus G′ and describes the elastic portion of the materialbehavior. The imaginary part is the loss modulus G′′ and represents the viscousbehavior. The complex shear modulus is frequency dependent.
G∗ = G′ + jG′′ (3.14)
G′ storage modulus (for elastic behavior)G′′ loss modulus (for viscous behavior)
Based on the relationship between shear modulus and acoustic impedance re-sulting from equations 3.5 (page 56), 3.9, and 3.13 the complex shear moduluscan be expressed with equation 3.15. Solving equation 3.15 for G′ and G′′, thestorage and loss moduli can be written as functions of the real and imaginarycomponents of the complex acoustic impedance (eqs. 3.16 and 3.17).
G∗ =Z2
c
ρ=
(R + jX)2
ρ(3.15)
G′ =R2 −X2
ρ(3.16)
G′′ =2RX
ρ(3.17)

60 3 Stress Wave Propagation Theory
Tab. 3.1: Purely viscous, Newtonian fluid
Z is complex (R = X)
general: G is complex (G′ = 0, η′′ = 0)
stress and resulting strain are 90° out of phase
acoustic impedance: Zc = (1 + j)
rρG′′
2= (1 + j)
rωρη′
2
shear modulus: G′′ =2RX
ρ; R = X =
rρG′′
2
viscosity: η′ =G′′
ω
Viscosity The viscoelastic behavior of cement paste can also be described bythe complex viscosity η∗ (eq. 3.18), where the real part η′ (also called dynamicviscosity) represents the viscous behavior and the imaginary part η′′ stands forthe elastic behavior of the paste.
η∗ = η′ + jη′′ (3.18)
Complex viscosity and complex shear modulus are related by equation 3.19. Bysubstituting equations 3.14 and 3.18 in equation 3.19, the storage and loss mod-uli can be expressed by means of the real and imaginary parts of the complexviscosity (eqs. 3.20 and 3.21).
G∗ = ωη∗ (3.19)
G′ = ωη′′ (3.20)
G′′ = ωη′ (3.21)
By using the established relationships from equations 3.16 and 3.17, η′ and η′′
can be expressed by means of the real and imaginary part of the complex acousticimpedance (eqs. 3.23 and 3.22).
η′ =2RX
ρω(3.22)
η′′ =R2 −X2
ρω(3.23)

3.4 Shear Waves in Cementitious Materials 61
Tab. 3.2: Loss-less elastic solid
Z is real (X = 0)
general: G is real (G′′ = 0, η′ = 0)
stress and resulting strain are in phase
acoustic impedance: Zc = R =p
ρG′ =p
ρωη′′
shear modulus: G′ =R2
ρ=
Z2
ρ
viscosity: η′′ =R2
ωρ=
G′
ω
Based on the equations presented above the complex acoustic impedance ofcement paste during its transition from the viscoelastic to the elastic state canbe expressed with Eq. 3.24, where G′ represents the elastic and η′ the viscousproperties of the material.
Z =√
ρG′ + jρωη′ (3.24)
For the purpose of clarification the general relationships between acoustic im-pedance, shear modulus and viscosity are applied for two ideal cases: a purelyviscous, Newtonian fluid (Table 3.1) and a loss-less elastic solid (Table 3.2).
3.4.2 Reflection
The basic principles of the reflection and refraction of shear waves in viscoelasticmedia where derived by O’Neil (1949) and first applied for the measurement of theviscosity and shear elasticity of liquids by Mason et al. (1949). Further referencethat deals specifically with the reflection of shear waves under conditions similarto these considered here can be found in Mason (1958) and the references givenin the beginning of the previous section.
The reflection coefficient of shear waves at an interface between two solid ma-terials is a real quantity and can be described as in section 3.2. However, for thecase of a solid-viscoelastic interface the reflection coefficient becomes complex(eq. 3.25).
r∗ = r0ejϕ = r0 (cos ϕ + j sinϕ) (3.25)
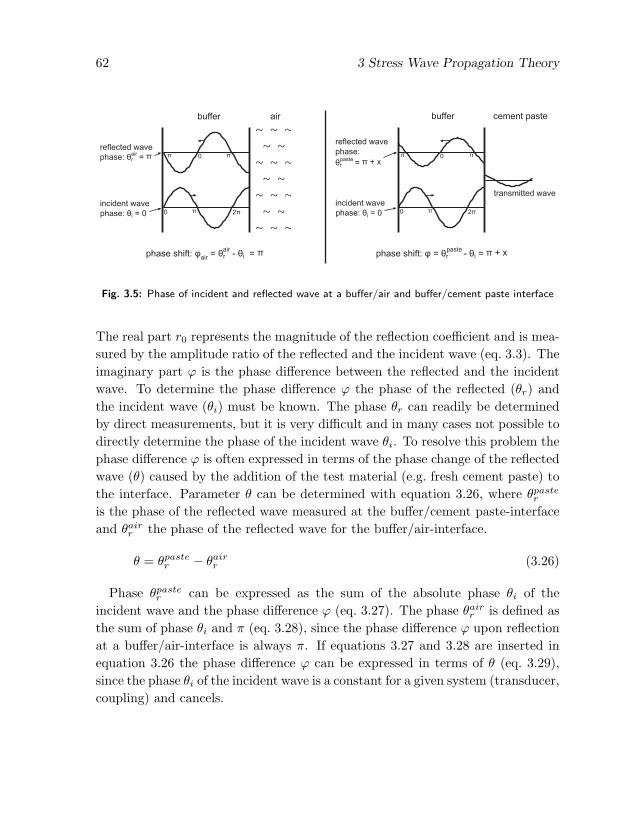
62 3 Stress Wave Propagation Theory
ð0
ðincident wave
ð
ð 2ð
buffer cement paste
phase: = 0èi2ð
ð
0
0ðreflected wave
phase: =è ðrair
incident wave
phase: = 0èi
reflected wave
phase:
= + xè ðrpaste
0
buffer air
phase shift: =ö = - ðair
è èrair
i phase shift: = + xö = è - è ðrpaste
i
transmitted wave
~ ~ ~
~~
~~
~
~~
~~
~
~~
~~
~
Fig. 3.5: Phase of incident and reflected wave at a buffer/air and buffer/cement paste interface
The real part r0 represents the magnitude of the reflection coefficient and is mea-sured by the amplitude ratio of the reflected and the incident wave (eq. 3.3). Theimaginary part ϕ is the phase difference between the reflected and the incidentwave. To determine the phase difference ϕ the phase of the reflected (θr) andthe incident wave (θi) must be known. The phase θr can readily be determinedby direct measurements, but it is very difficult and in many cases not possible todirectly determine the phase of the incident wave θi. To resolve this problem thephase difference ϕ is often expressed in terms of the phase change of the reflectedwave (θ) caused by the addition of the test material (e.g. fresh cement paste) tothe interface. Parameter θ can be determined with equation 3.26, where θpaste
r
is the phase of the reflected wave measured at the buffer/cement paste-interfaceand θair
r the phase of the reflected wave for the buffer/air-interface.
θ = θpaster − θair
r (3.26)
Phase θpaster can be expressed as the sum of the absolute phase θi of the
incident wave and the phase difference ϕ (eq. 3.27). The phase θairr is defined as
the sum of phase θi and π (eq. 3.28), since the phase difference ϕ upon reflectionat a buffer/air-interface is always π. If equations 3.27 and 3.28 are inserted inequation 3.26 the phase difference ϕ can be expressed in terms of θ (eq. 3.29),since the phase θi of the incident wave is a constant for a given system (transducer,coupling) and cancels.

3.4 Shear Waves in Cementitious Materials 63
θpaster = θi + ϕ (3.27)
θairr = θi + π (3.28)
ϕ = θ + π (3.29)
Using the expression for the phase difference given in equation 3.29, the complexreflection coefficient from equation 3.25 can be rewritten with equation 3.30.
r∗ = r0ej(π+θ) = −r0 (cos θ + j sin θ) (3.30)
The equation of the reflection coefficient as a function of the acoustic im-pedances of the materials forming the interface (eq. 3.6, page 56), can be rewrit-ten as given in equation 3.31, with Zs and Zc as the acoustic impedances of steeland cement paste respectively.
Zc = Zs1 + r∗
1− r∗(3.31)
The combination of equations 3.30 and 3.31 gives equation 3.32, which relatesthe complex acoustic impedance of the cement paste to the complex reflectioncoefficient and the acoustic impedance of the steel.
Zc = Zs1− r0 (cos θ + j sin θ)1 + r0 (cos θ + j sin θ)
= Zs1− r2
0 + j2r0 sin θ
1 + r20 + 2r0 cos θ
(3.32)
The substitution of Zc by its real and imaginary parts as given in equation 3.13(page 59) now allows the calculation of R and X only from the complex reflectioncoefficient (eqs. 3.33 and 3.34).
R = Zs1− r2
0
1 + r20 + 2r0 cos θ
(3.33)
X = Zs2r0 sin θ2
1 + r20 + 2r0 cos θ
(3.34)
Based on the relationships given in this section it is possible to calculate the realand imaginary part of the complex acoustic impedance of cement paste from theamplitude ratio of shear waves reflected at an interface (real part or magnitude of

64 3 Stress Wave Propagation Theory
reflection coefficient) and the phase difference of the reflected waves (imaginarypart of reflection coefficient) caused by the test medium.
3.4.3 Deriving Viscoelastic Properties of Cement Paste
The relationships given in the previous two sections can be used to determine theviscoelastic properties of hydrating cementitious materials using the immediateresults of wave reflection measurements performed at an interface between abuffer material and the cement paste to be tested. The storage modulus G′
and the loss modulus G′′, which, as the components of the complex dynamicshear modulus G∗, represent the elastic and viscous material properties, can becalculated by combining equations 3.16 and 3.17 with equations 3.33 and 3.34 toequations 3.35 and 3.36 given below.
G′ =R2 −X2
ρ= Z2
s
(1− r2
0
)− 4r2
0 sin2 θ
ρ (1 + 2r0 cos θ + r20)
2 (3.35)
G′′ =2RX
ρ= Z2
s
4r0
(1− r2
0
)sin θ
ρ (1 + 2r0 cos θ + r20)
2 (3.36)
The obtained dynamic shear moduli allow to clearly distinguish between theevolution of the purely elastic (G′) and the purely viscous (G′′) properties ofcement paste in time. Similarly to the above procedure, the viscous and elas-tic material behavior can be expressed in terms of the components η′ and η′′ ofthe complex viscosity η∗. By combining equations 3.22 and 3.23 with the equa-tions 3.33 and 3.34 the expressions for η′ and η′′ as given in equations 3.37 and3.38 can be obtained.
η′ =2RX
ρω= Z2
s
4r0
(1− r2
0
)sin θ
ρω (1 + 2r0 cos θ + r20)
2 (3.37)
η′′ =R2 −X2
ρω= Z2
s
(1− r2
0
)− 4r2
0 sin2 θ
ρω (1 + 2r0 cos θ + r20)
2 (3.38)
In the above equations, parameter η′ holds for the viscous properties and para-meter η′′ stands for the elastic material behavior. In practice, the elastic proper-ties are usually expressed in terms of the dynamic storage modulus G′ (eq. 3.35)and the viscous properties are measured by the dynamic viscosity η′ (eq. 3.37).

Chapter 4
Wave Reflection Method
4.1 General Introduction
4.1.1 History of the Wave Reflection Method
The origin of the ultrasonic wave reflection technique can be found in the earlydevelopments of the ultrasonic material testing. As early as 1950, McSkimin
reported measurements using a technique that places a buffer rod made of fusedsilica between the test material and a quartz crystal transducer (McSkimin, 1950,1953). By using longitudinal and transverse waves the velocity and attenuationin silicon and germanium single crystals were measured.
Roderick and Truell (1952) developed a technique that uses water as the buffermedium between the transducer and the specimen. Longitudinal waves are trans-mitted by a transducer, which is placed at the bottom of a water tank. The wavestravel through water until they encounter a steel specimen that is submerged inthe water above the transducer. The described setup was used to measure thereflection loss of the waves when they are reflected at the water-steel interface.By evaluating the wave reflection from the far end of the steel specimen theattenuation in the steel specimen was determined.
Papadakis (1968a,b) described experiments with a buffer rod bonded to asample material. A transducer at the free end of the buffer rod was used togenerate ultrasonic waves and to monitor the reflections from the buffer-sampleinterface and from the far end of the sample. From the amplitude ratios of theappropriate echoes the reflection coefficient at the buffer-sample interface andthe attenuation in the sample were calculated. Various buffer materials (glass,aluminum, magnesium and, titanium) were used to examine different specimen
66 4 Wave Reflection Method
materials (brass and fused silica). The measurements were done with longitudinaland transverse waves at frequencies ranging from 5 to 50 MHz.
The first application of the wave reflection method to cementitious materialswas reported by Stepisnik et al. (1981). The reflections of transverse waves atthe interface between a quartz bar and cement paste were monitored and usedto calculate the reflection coefficient at the quartz-cement interface as well asthe shear modulus and dynamic viscosity of the cement paste. The reflectioncoefficient was shown to be a sensitive indicator of the hydration behavior of thetested cement paste at early ages. The influence of different curing temperaturesand w/c ratios as well as chemical and mineral admixtures (retarder, slag) couldqualitatively be identified. It was also attempted to explain the developmentof the dynamic shear modulus by a model for the micro kinetics of granulationand growth as defined by Avrami (1939, 1940, 1941). The results of this workwere very promising, but the authors pointed out that a considerable amountof research work will be needed to reach fundamental understanding of the rela-tionship between the wave reflection measurements and the hydration process ofcementitious materials.
A systematic investigation of the sensitivity of the wave reflection method tothe hydration of Portland cement was reported by Lasic and Stepisnik (1984).The experiments showed that the development of the reflection coefficient isclearly affected by the w/c-ratio and the curing temperature of the tested cementpastes. It was also found that the retarding effect of saccharose and glucose onthe cement hydration could be monitored. The wave reflection measurementswere conducted with shear wave (16.5 MHz) and a quartz buffer.
4.2 Determination of Reflection Coefficient
4.2.1 Principle
The principle of the wave reflection measurements consists of monitoring the re-flection coefficient of ultrasonic waves at an interface formed by a buffer materialand the cementitious material to be tested. An ultrasonic transducer is coupledto the buffer material, which in turn has to be brought in contact with the testmaterial when it is still in liquid or unhydrated state. With proceeding hydrationthe wave propagation properties of the test material change, which results in avariation in the reflection coefficient. The reflection coefficient is obtained fromthe amplitudes of successive reflections received from the interface between thebuffer and the test material.
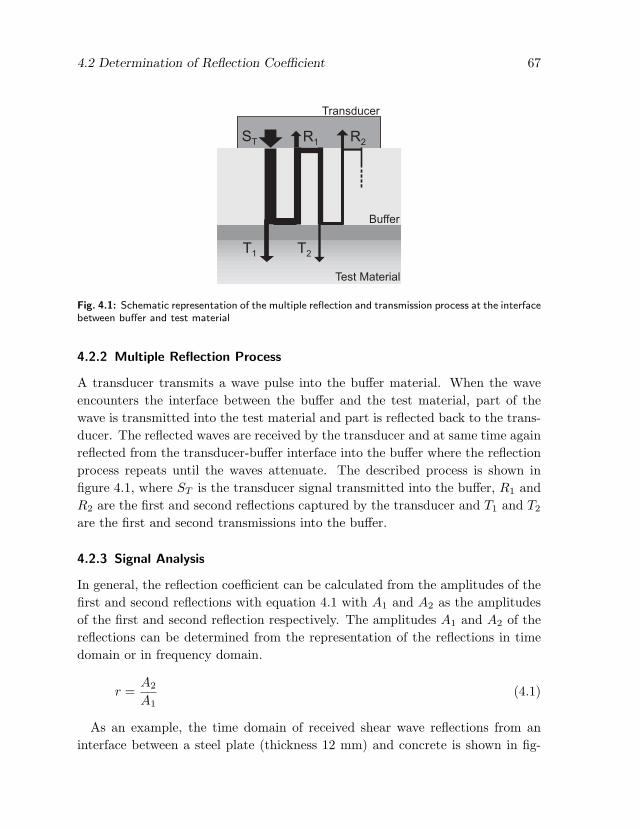
4.2 Determination of Reflection Coefficient 67
ST
R2
Buffer
Test Material
Transducer
R1
T2
T1
Fig. 4.1: Schematic representation of the multiple reflection and transmission process at the interfacebetween buffer and test material
4.2.2 Multiple Reflection Process
A transducer transmits a wave pulse into the buffer material. When the waveencounters the interface between the buffer and the test material, part of thewave is transmitted into the test material and part is reflected back to the trans-ducer. The reflected waves are received by the transducer and at same time againreflected from the transducer-buffer interface into the buffer where the reflectionprocess repeats until the waves attenuate. The described process is shown infigure 4.1, where ST is the transducer signal transmitted into the buffer, R1 andR2 are the first and second reflections captured by the transducer and T1 and T2
are the first and second transmissions into the buffer.
4.2.3 Signal Analysis
In general, the reflection coefficient can be calculated from the amplitudes of thefirst and second reflections with equation 4.1 with A1 and A2 as the amplitudesof the first and second reflection respectively. The amplitudes A1 and A2 of thereflections can be determined from the representation of the reflections in timedomain or in frequency domain.
r =A2
A1(4.1)
As an example, the time domain of received shear wave reflections from aninterface between a steel plate (thickness 12 mm) and concrete is shown in fig-

68 4 Wave Reflection Method
-0.8
-0.6
-0.4
-0.2
0
0.2
0.4
0.6
0.8
1
5 10 15 20
Time ( s)ì
no
rma
lize
dA
mp
litu
de
(-)
Main Bang
First Reflection
Second Reflection
0
Fig. 4.2: Time domain of multiple reflectionprocess of shear waves at a steel-concrete in-terface
0
0.2
0.4
0.6
0.8
1
0 0.5 1 1.5 2 2.5 3 3.5 4
Frequency (MHz)
no
rma
lize
dA
mp
litu
de
(-)
First Reflection
Second Reflection
Fig. 4.3: Frequency domain of first and secondreflections
ure 4.2. The separation of the reflections in the time domain is about 8 µs forthe given steel plate thickness. Each single reflection can be transformed intothe frequency domain using a fast Fourier transform (FFT) algorithm, which isshown in figure 4.3. The reflections have their maximum amplitude at approx-imately 2.25 MHz, which corresponds to the center frequency of the used shearwave transducer. In both representations, the time and the frequency domain,the reduction of the amplitude of the reflections due to transmission losses at thesteel-concrete interface can clearly be seen.
4.2.4 Self-Compensating Calculation Algorithm
The reflections shown in the previous figures are not only influenced by thetransmission losses at the interface between the buffer and the test material, butinclude also losses due to coupling of the transducer to the buffer material as wellas material and geometric losses in the buffer. To eliminate those influences andisolate the reflection coefficient the following procedure was developed by Ozturk
et al. (1999). The procedure uses the amplitudes of the reflection as derivedfrom the frequency domain, but the calculation can also be applied to reflectionsrepresented in time domain. The first reflection can be written as
F1 (f) = ST d1 r d2 (4.2)
where F1(f) is the FFT of the first reflection in terms of the frequency f ; ST
the transducer function including transducer specific variables and variables dueto coupling; r the reflection coefficient at the buffer-cement paste interface and

4.2 Determination of Reflection Coefficient 69
buffer air
1 reflectionst F1,free
2 reflectionnd F2,free
transducer signal STd1
d2
d3
d4
r
r = 0
r = 0
buffer cement paste
ST
contact to cement pastefree boundary condition
F1
F2
d1
d2
d3
d4
r
r > 0
r > 0
Fig. 4.4: Analytical procedure for calculation of the reflection coefficient
d1 and d2 express the material and geometric signal losses along the propagationpath through the buffer to and from the interface. The second reflection is givenby
F2 (f) = ST d1 r d2 r′ d3 r d4 (4.3)
where F2(f) is the FFT of the second reflection in terms of the frequencyf ; r the reflection coefficient at the transducer-buffer interface; and d3 and d4
are again the material and geometric signal losses along the corresponding wavepaths. Calculating the ratio of F2 (f)/F1 (f) is not sufficient to determine thereflection coefficient, since d3, r and d4 remain in the expression. To remove thesefactors, experiments on a free buffer must be performed. For this free boundarycase, where the reflection coefficient at the buffer-air interface is unity, the ratioof the second to the first signal results in
F2,free (f)F1,free (f)
=ST d1 d2 r d3 d4
ST d1 d2= d3 r d4 (4.4)
F1 (f)/F2 (f)F1,free (f)/F2,free (f)
=r d3 r d4
d3 r d4= r (4.5)
where F1,free(f) and F2,free(f) are the FFT of the first and second reflectionfor the free boundary case, respectively. The reflection coefficient r can be iso-lated with equation 4.5, where the ratio derived from equation 4.2 and 4.3 isdivided by the ratio for the free boundary case (eq. 4.4). The derived analyticalprocedure is schematized in figure 4.4.

70 4 Wave Reflection Method
4.2.5 Reflection Loss
Basically, the reflection coefficient as calculated above represents an amplituderatio and describes the relative loss in amplitude between the first and secondreflection at a given time t. In ultrasonics amplitude ratios are usually measuredin decibel (Krautkramer and Krautkramer, 1990). The reflection coefficient r(t)expressed in decibel becomes the reflection loss RL(t). The conversion of r intoRL can be done with equation 4.6 with RL(t) as the reflection loss at time t andr(t) as the reflection coefficient at time t. The general derivation of the equationgiven below can be found in appendix C.
RL (t) = −20 log [r (t)] (4.6)
The general development of the reflection loss of shear waves at an interfacebetween steel and a cementitious material during hydration is given in figure 4.5.In the plotted curve two distinct points can be identified: Point A, which marksthe time of increase of the reflection loss and Point B after which the reflectionloss starts to approach a final value. Furthermore, the phases of cement hydration(after Mindess et al., 2003; Dehn et al., 2003) and their general relationship tothe reflection loss development are given in figure 4.5. During the inductionperiod and most part of the dormant period no change of the reflection loss can
Time (h)
Reflection L
oss (
dB
)
I + II III IV + V
II
III
IV
I Induction Period
Dormant Period
Acceleration
Deceleration
Steady StateV
....
...
...
....
....
Phases of Cement Hydration
Point A
Point B
Fig. 4.5: General development of reflection loss and its relationship to the phases of cement hydra-tion

4.3 Experimental Setup 71
be measured and the values are very close to zero. During the transition from thedormant period to the acceleration period the reflection loss starts to increase,which indicates the beginning of the setting process. The increase of the reflectionloss is highest during the acceleration period. During the retardation and thesteady state of the hydration process the reflection loss development levels offconsiderably and reaches the final value.
4.3 Experimental Setup
The schematic of the experimental apparatus that is used for the wave reflec-tion measurements is given in figure 4.6. It consists of a laptop computer, apulser/receiver unit, a transducer, and a steel plate. The transducer, which gen-erates the ultrasonic waves, is connected to the computer via the pulser/receiver.This unit excites the transducer and transmits the information of the receivedreflections from the transducer to the computer. The computer performs thesignal analysis using a program written in the LabView environment. The shownconfiguration of the setup is capable of measuring the reflection coefficient attwo separate channels. Consequently, by using two transducers, which are eachconnected to a separate pulser/receiver the reflection coefficient can be measuredat two different points at the specimen or structure simultaneously.
Mode Gain
GainDampingMode
Pulse Height
Concrete
Transducers
Ch. 1 Ch. 2
Steel Plates
Pulser/Receivers
Fig. 4.6: Schematic of experimental apparatus for WR-measurements
4.4 Influence of Experimental Parameters
4.4.1 General
The reflection coefficient obtained from the amplitude of reflected waves cantheoretically vary from unity to zero. The range in which the measured reflection

72 4 Wave Reflection Method
coefficient changes depends on the difference between the acoustic impedances ofthe buffer medium and the test material (see Eq. 3.6 on page 56). This mismatchis a function of the type of the sound waves that are used for the measurementsand the properties of the buffer material itself. The frequency of the ultrasonicwaves used is also a factor that has to be considered. The particular influence ofthose factors will be discussed in detail in the following sections.
4.4.2 Influence of Wave Type
4.4.2.1 Shear Waves
When shear waves are used for the measurements and the test material (e.g.cement paste) is in liquid state, the entire wave energy, which is approaching theinterface, is reflected, since shear waves cannot propagate in liquids. Thus, thereflection coefficient is unity. With proceeding hydration the cement grains per-colate and build up a skeleton allowing the shear waves to propagate. This allowsthe shear waves to pass the interface resulting in reflection losses at the inter-face. Consequently, the reflection coefficient starts to decrease. With proceedinghydration the ability of the cement paste to transmit shear waves gains higherlevels. More and more wave energy is transmitted into the cement paste and thereflection coefficient decreases further. After a certain time this process slowsdown and the reflection coefficient approaches a final value. At this time changesin the microstructure of the cement paste due to hydration are too small to al-ter the shear wave propagation properties significantly. The reflection process ofshear waves at a steel-mortar interface for fresh and hardened mortar is shownin figure 4.7.
a) hardened mortar
steel
S
R
T
S
R
transducer
b)fresh mortar
Fig. 4.7: Schematic of the reflection process of shear waves at a steel-mortar interface

4.4 Influence of Experimental Parameters 73
0.6
0.7
0.8
0.9
1.0
0 12 24 36 48 60 72
Time (Hours)
Re
fle
cti
on
Co
eff
icie
nt
(-)
Shear Waves
Longitudinal Waves
Portland cement mortar
w/c = 0.35
isothermal curing @ 25°C
buffer material: steel
Fig. 4.8: Comparison of the reflection coefficient measured with longitudinal and shear waves
4.4.2.2 Longitudinal Waves
When longitudinal waves are used instead of shear waves the initial value ofthe reflection coefficient is clearly below unity since longitudinal waves have theability to propagate also in liquid cementitious materials. The initial value ofthe longitudinal reflection coefficient will remain on a certain constant level un-til the propagation properties of the test material change due to the hydrationprocess. The reflection coefficient will then decrease and in furtherance behaveas explained for the case of shear waves.
4.4.2.3 A Comparative Example
To illustrate the the above described influence of the wave type, the developmentof the reflection coefficient measured with longitudinal and shear waves at aninterface between Portland cement mortar and steel will be explained here. Theacoustic properties of the PC mortar and the steel are given in table 4.1. Thereflection coefficients measured with the two wave types are shown in figure 4.8.The difference in the initial values can clearly be seen. The shear wave reflectioncoefficient starts at a value of one whereas the longitudinal reflection coefficientstarts at 0.96. The calculations in table 4.2 show that the shear wave reflectioncoefficient rs of one relates to a shear wave velocity in the mortar of zero. Themeasured primary wave reflection coefficient rp with the value of 0.96 relates toan initial P-wave velocity in the mortar of 450 m/s.
Another difference of the two curves in figure 4.8 is their range of variation.The shear wave reflection coefficient exhibits a significant larger change (1 to0.65) than the longitudinal reflection coefficient (0.96 to 0.75). This phenom-

74 4 Wave Reflection Method
enon can be explained by comparing the ratio of the acoustic impedances ofsteel and mortar for longitudinal and shear waves respectively. At the age of72 hours the shear impedances for steel and mortar (Zs,steel = 25Ns/m3 vs.Zs,mortar = 4.2Ns/m3) are much closer than the corresponding longitudinal im-pedances (Zp,steel = 45Ns/m3 vs. Zp,mortar = 6.6Ns/m3). As the results ofthe better match of the impedances in the case of shear waves, the shear wavereflection coefficient is more sensitive to the hydration behavior of the cementmortar than the longitudinal reflection coefficient.
4.4.3 Influence of Buffer Material
For a given cement-based material and hydration behavior the reflection coeffi-cient is significantly influenced by the type of the buffer material that is usedfor the measurements. Three different materials will be compared: steel, quartzand polymethyl methacrylate (PMMA). PMMA is also known under its brandnames Plexiglas or Lucite. The type of the buffer medium does not influencethe general development of the reflection coefficient. Distinctive points in thecurve, for example, time of increase remain unchanged. What is influenced isthe range in that the reflection coefficient changes during the hydration process.This bandwidth depends on how well the acoustic impedances of the buffer andthe test material match. In general: the smaller the acoustic impedance of thebuffer material the wider is the range in that the reflection coefficient changes.In table 4.3 the acoustic properties of steel, quartz, PMMA and Portland cementmortar with respect to shear wave propagation are given. The acoustical proper-
Tab. 4.1: Acoustic properties ofthe steel and mortar used for ex-ample in figure 4.8 and table 4.2
material property
ρsteel = 7.81vp,steel = 5800
steel vs,steel = 3200Zp,steel = 45Zs,steel = 25
mortar ρmortar = 2.00
Units: Z in Ns/m3, v in m/sρ in g/cm3
Tab. 4.2: Comparison of primary andshear wave reflection coefficients shownin figure 4.8
time primary waves shear waves
rp = 0.96 rs = 1.000 h Zp = 0.9 Zs = 0
vp = 450 vs = 0
rp = 0.75 rs = 0.6572 h Zp = 6.6 Zs = 4.2
vp = 3300 vs = 2100
Units: Z in Ns/m3, v in m/s

4.4 Influence of Experimental Parameters 75
ties of the mortar were determined with the shear wave reflection method usingsteel as the buffer medium.
The development of the reflection coefficient measured at the steel-mortar in-terface is shown in figure 4.9a (dotted). In addition, the reflection coefficient asit would have been measured in experiments using quartz (dashed) and PMMA(solid) as the buffer material are presented. The two additional curves were cal-culated based on the properties of quartz and PMMA as given in table 4.3 andunder the assumption of an identical development of the mortar properties asmeasured with the steel. The measured and calculated reflection coefficients areplotted as defined by equation 3.6 (p. 56). A negative reflection coefficient resultsfrom the fact that the acoustic impedance of the mortar is smaller than that ofthe buffer material. This is the case for steel and quartz during the entire timeperiod of 72 hours shown in figure 4.9a. The reflection coefficient calculated forthe PMMA-mortar interface shows positive values after approximately 10 hours.This indicates that the acoustic impedance of the mortar has exceeded that ofthe PMMA.
The trends of the reflection coefficients compared in figure 4.9a exhibit sig-nificant differences concerning their range of change. The curve assigned to thebuffer material PMMA shows the largest bandwidth followed by quartz and steelwith smaller bandwidths. The comparison of the properties of the buffer ma-terials and the mortar at 72 hours as given in table 4.3 shows that the shearimpedance of PMMA is the closest to that of the mortar. The impedances ofsteel and mortar exhibit the largest difference and consequently the appropriatecurve shows the smallest bandwidth.
However, in practice the reflection coefficient is determined from experimen-tally measured amplitudes of successive wave reflections (eq. 4.1 on page 67).The reflection coefficient determined that way is always positive and can be con-sidered as the absolute value of the coefficient as defined by equation 3.6 (page56). The development of the absolute values of the reflection coefficients for the
Tab. 4.3: Acoustical properties of different buffer materials and cement mortar
Steel Quartz PMMA Mortar
Shear wave velocity (m/s) vT 3200 3700 1100 1960
Density (g/cm3) ρ 7.81 2.20 1.19 2.00
Shear Impedance (Ns/m3) ZT 25.0 8.25 1.3 3.9

76 4 Wave Reflection Method
-1
-0.8
-0.6
-0.4
-0.2
0
0.2
0.4
0.6
12 24 36 48 60
Time (h)
Re
fle
ctio
nC
oe
ffic
ien
t(-
)
PMMA
Quartz
Steel
0 72
(a) Calculated from acoustic impedance values
0
0.2
0.4
0.6
0.8
1
0 12 24 36 48 60 72
Time (h)
Re
fle
cti
on
Co
eff
icie
nt
(-)
PMMA
Quartz
Steel
(b) Measured in experiments
Fig. 4.9: Shear wave reflection coefficients for Portland cement mortar and buffer materials steel,quartz and PMMA
materials steel, quartz and PMMA is given in figure 4.9b. The coefficients varybetween unity and zero. Since the reflection coefficient for PMMA originallyvaries from −1 to approximately +0.45 the curve of the absolute reflection co-efficient approaches zero and starts to increase again. This trend change is notrelated to a certain critical point in the hydration behavior of the test mater-ial. It only indicates the time when the acoustic impedances of the test materialand the PMMA-buffer have equal values. Wave reflection measurements witha PMMA-buffer on cement paste which resulted in the development of the re-flection coefficient following this pattern have been reported by Cohen-Tenoudjiand his coworkers in Feylessoufi et al. (2001), Lacouture et al. (2003), and Morin
et al. (1998, 2000, 2001, 2002).

Chapter 5
Complimentary Experimental Methods
5.1 Temperature Controlled Water Bath
To insure repeatable curing conditions for all tested materials, many experimentswere conducted with paste, mortar or concrete cured at a constant temperature of25°C throughout the duration of the experiments. The specimens were submergedin a water bath connected to a microprocessor controlled refrigerating/heatingcirculator. The circulator continuously adjusted the temperature of the circulat-ing water to 25°C with an accuracy of ±0.1°C. A schematic of the water bathand a photograph of experimental equipment submerged in the water bath areshown in figures 5.1 and 5.2, respectively.
Water Bath
25°CRefrigerating/Heating
Circulator
Fig. 5.1: Schematic of temperature controlled water bathFig. 5.2: Experimental equipment sub-merged in water bath

78 5 Complimentary Experimental Methods
5.2 Test of Compressive Strength
Mortar Cubes. The compressive strength of cement paste and mortar was testedon cubical specimens. Cubes of the size of 50×50×50 mm3 were used to determinethe compressive strength development of cement paste and mortar according toASTM C109. Dependent on the w/c-ratio of the used mixture proportions thecompression tests were started between three and six hours after casting.
Regular Mortar and Concrete Cylinders. The compressive strength of concretemixtures was tested on cylindrical specimens with the dimensions of 76×152 mmaccording to ASTM C39 (2003). Prior to testing, these cylinders were cappedwith sulfur to ensure uniaxial loading of the specimens during the compressiontests. The cylinders were tested in stroke control with one movable and one stiffplate. The loading rate of the cylinders was adjusted to the age of the specimensat time of testing.
Extruded Mortar Cylinders. Additionally, the compressive strength of extrudedcement mortar cylinders was tested. The extrusion technique (sec. 5.10, p. 90)was used to produce mortar cylinders that allowed testing the compressive strengthof these specimens at very early age. The extruded cylinders had the dimensionsof 32×64 mm. Because of their excellent shape retention the specimens could beused for testing the green strength of the mortar immediately after the extrusionprocess. The compression tests at this stage were performed with a load cell of
Fig. 5.3: Extruded cylinder during compression test

5.3 Test of Penetration Resistance 79
a capacity of 444 N and two stiff plates. At later ages, when the mortar washardened the capacity of the load cell was increased and a movable and a stiffplate was used for the tests. An extruded cylinder during a compression test todetermine the green strength is shown in figure 5.3.
5.3 Test of Penetration Resistance
To evaluate the progress of the hydration reaction of the investigated materi-als penetration resistance tests according to ASTM C403 were conducted. Themethod is based on measuring the force that is required that a metal needle pen-etrates a setting mortar sample to a depth of 25 mm. According to the degree ofsetting of the mortar, needles of different diameters are used. Six needles withbearing areas of 16, 32, 65, 161, 323, and 645 mm2 are available. The test wasalways conducted on mortar samples. If it is desired to investigate the settingbehavior of a concrete its mortar phase has to be separated from the coarse ag-gregates by wet-sieving. The penetration tests are performed in regular timeintervals until the mortar is completely set. The penetration resistance is calcu-lated from the ratio of the required force and the bearing area of the used needleand is used to determine the time of the initial and final setting of the mortar.The time of initial set is defined as the time when the penetration resistance
Time (h)
Pe
ne
tra
tio
nR
esis
tan
ce
Final Setting
Initial Setting3.5
27.6
y =a tb
(MP
a)
Fig. 5.4: Determination of initial and final setting timeFig. 5.5: Experimental equipment fortesting the penetration resistance

80 5 Complimentary Experimental Methods
has reached a value of 3.5 MPa, whereas for final setting a value of 27.6 MPa isspecified. To interpolate between the measurement points a power function ofthe form y = atb is fitted to the data. The determination of the setting timesis schematized in figure 5.4 and the equipment used for the measurement of thepenetration resistance is given in figure 5.5.
5.4 In-situ Temperature Measurements
During many experiments the development of the in-situ temperature of cementpaste, mortar or concrete specimens was measured. A programmable data loggerthat is capable of measuring the temperature on six different channels simultane-ously was used. The temperature data was collected by embedded thermocouples(Type J) into the specimens. The data collection interval varied from five to tenminutes.
5.5 Calorimetry
To asses the heat of hydration calorimetric measurements of cement paste andmortar were conducted with a semi-adiabatic calorimeter. Cylindrical plasticmolds (51×102 mm) filled with the freshly mixed cement paste or mortar wereequipped with a temperature sensor and then placed in the calorimeter. Thetemperature inside the cylinder specimen and the room temperature was mea-sured by a data logger and downloaded to a computer. The heat transfer fromthe sample to the room is evaluated by a software program based on the degree ofthe insulation provided by the calorimetric equipment and the difference betweenthe sample and room temperature. This heat loss is then used to calculate theadiabatic heat release of the tested materials during hydration based on the mea-sured semi-adiabatic heat release development. Further details about the usedcalorimetric equipment are given by Radji and Douglas (1994).
5.6 Forced Resonance Method
The forced resonance method as described in ASTM C215 was used to deter-mine the dynamic Young’s, dynamic shear modulus and dynamic Poisson’s ratio.The fundamental longitudinal and torsional resonant frequency of mortar prisms(210×60×50 mm) was measured by forcing the specimen to vibrate in longitudi-nal and torsional mode. The fundamental resonant frequencies were determined
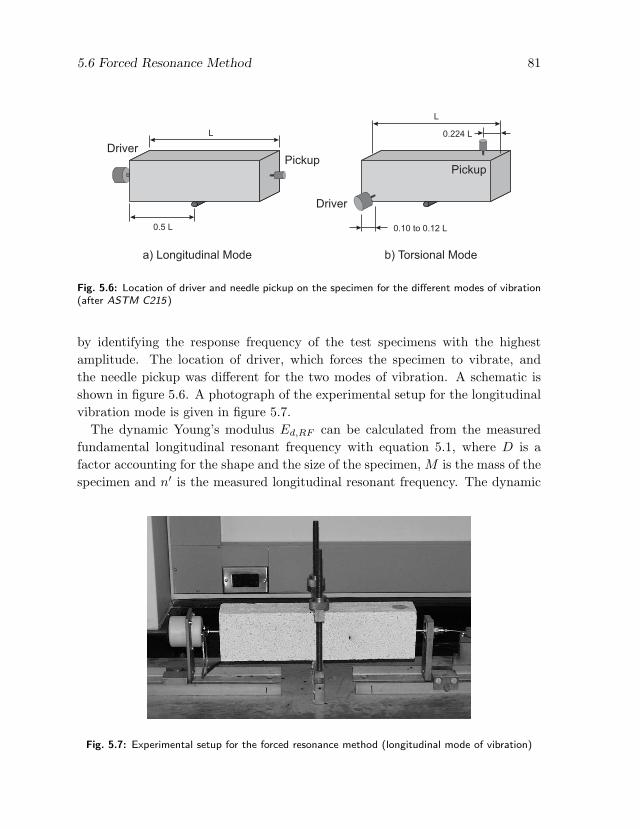
5.6 Forced Resonance Method 81
0.5 L
DriverPickup
a) Longitudinal Mode
0.10 to 0.12 L
Driver
Pickup
b) Torsional Mode
L
L
0.224 L
Fig. 5.6: Location of driver and needle pickup on the specimen for the different modes of vibration(after ASTM C215)
by identifying the response frequency of the test specimens with the highestamplitude. The location of driver, which forces the specimen to vibrate, andthe needle pickup was different for the two modes of vibration. A schematic isshown in figure 5.6. A photograph of the experimental setup for the longitudinalvibration mode is given in figure 5.7.
The dynamic Young’s modulus Ed,RF can be calculated from the measuredfundamental longitudinal resonant frequency with equation 5.1, where D is afactor accounting for the shape and the size of the specimen, M is the mass of thespecimen and n′ is the measured longitudinal resonant frequency. The dynamic
Fig. 5.7: Experimental setup for the forced resonance method (longitudinal mode of vibration)

82 5 Complimentary Experimental Methods
shear modulus (or dynamic modulus of rigidity) Gd,RF can be calculated fromthe measured fundamental torsional resonant frequency with equation 5.2, whereB is a factor accounting for the shape and the size of the specimen, and n′′ is themeasured torsional resonant frequency. The dynamic Poisson’s ratio µd,RF canthen be calculated from Ed,RF and Gd,RF with equation 5.3. The factors B andD were determined according to ASTM C215.
Ed,RF = DM (n′)2 (5.1)
Gd,RF = BW (n′′)2 (5.2)
µd,RF =E
2G− 1 (5.3)
5.7 Test of Pulse Velocity
Wave transmission tests according to ASTM C597 were conducted to determinethe longitudinal and shear wave velocity in hydrating cement-based materials.To allow measurements on fresh paste, mortar or concrete special molds weredesigned. These molds are equipped with styrofoam layers to prevent the trans-mission of the ultrasonic waves through the walls of the molds. The molds alsoencase and seal the transducers, which allows placing the molds in the water bathshown in figure 5.2. When the measurements were conducted with longitudinal
(a) Primary waves (150 kHz) (b) Shear waves (180 kHz)
Fig. 5.8: Molds for measuring longitudinal and shear wave velocity

5.7 Test of Pulse Velocity 83
waves a frequency of 150 kHz was used. The experiments with shear waves wereperformed with a frequency of 180 kHz or 2.25 MHz. The latter frequency wasonly used for experiments with mortar. Photographs showing the molds usedfor the measurement of the longitudinal (150 kHz) and shear wave velocity (180kHz) are given in figures 5.8a–b. The equipment used for the experiments usingshear waves with a frequency of 2.25 MHz is shown in figure 5.9.
During the hydration of the tested cementitious material the transition timeof the ultrasonic waves is measured by a pulse velocity meter in regular timeintervals. By knowing the length of the wave path l and the transition timet the wave velocity v of the test material can be calculated with v = l/t. Themeasured velocities itself can be used as an indicator of the progress of the settingand hardening process of the test materials. The velocity values can also be usedto calculate elastic material constants of the tested material. From the shear wavevelocity and the density of the test material the dynamic shear modulus can bederived with equation 5.4, where GPV is the dynamic shear modulus derivedfrom the pulse velocity test, vs the shear wave velocity and ρm the density of thematerial.
GPV = ρv2s (5.4)
The wave transmission tests were also used to measure the attenuation of theultrasonic waves when propagating through the hydrating cement-based mate-rials. To determine the attenuation at a given time the amplitude of the wave
Fig. 5.9: Mold for measuring shear wave velocity (2.25 MHz)

84 5 Complimentary Experimental Methods
transmitted through the test material is compared to the wave amplitude mea-sured when the transmitting and receiving transducers are brought in directcontact. The amplitudes were measured in mV using an oscilloscope. Based onthese parameters the attenuation A can be calculated with equation 5.5, whereVt is the voltage of the wave transmitted through the test material and Vc thevoltage of the wave signal when the transducer contact each other.
A = 20 logVt
Vc(5.5)
5.8 Thermogravimetry
5.8.1 General
Thermogravimetry (TG) is a technique that measures the mass change of a sub-stance as a function of temperature while the substance is subjected to a con-trolled temperature program. The results of thermogravimetric measurementscan be presented in form of a TG curve, where the mass loss is plotted againsttime or temperature. Another possibility is to present the data as a derivativethermogravimetric (DTG) curve by plotting the rate of change of the mass withrespect to time or temperature. More details concerning TG and its generalapplication are given by Dunn and Sharp (1993) and Heal (2002).
TG and DTG have been used frequently for studying the hydration of Portlandcements, by considering the fact that the hydration reaction between the mixingwater and cement can be reversed when the hardened cement paste is subjectedto high temperatures. The mass loss of a cement paste sample resulting from thedehydration process can directly be related to the amount of the non-evaporablewater, which in turn is a good approximation of the amount of the water that ischemically combined with the various hydration products at the time of testing.If the mass loss occurring in certain temperature ranges is evaluated separatelyit is also possible to estimate the contents of the different types of hydrationproducts. A review of the application of thermal methods and TG in particularto the testing of cementitious materials is given by Bhatty (1993).
Within the scope of this thesis, TG measurements were performed in orderto determine the amount of the evaporable and non-evaporable water in the hy-drating cement paste. Samples of approximately 150 mg were taken by crushingcubes of cement paste that were cast in common ice cube trays. The samples

5.8 Thermogravimetry 85
were taken from the inner part of the cubes. TG was performed immediatelyafter the sampling process. The cement paste was cured at isothermal conditions(25°C) and the measurements started as early as one hour after casting. Thesamples were heated up to a temperature of 900°C according to a defined heatingregime. During the heating process the sample loses weight due to the evapora-tion of the free water and the decomposition of the hydration products. In orderto distinguish between evaporable and non-evaporable water, the temperaturewas first increased to 105°C, held at that value for two hours and then increasedfurther to 900°C. The heating rate was 10°C/min. The samples were heated in asteady flow of dry, CO2-free nitrogen. The result of the TG is the developmentof the weight loss of the sample during heating. The heating regime and themeasured weight loss for a cement paste sample (w/c = 0.35, age 36 h) are givenin figure 5.10.
Alternatively to the constant temperature ramp of 105°C used here, Taylorsuggested that when a sample is continuously heated at a rate of 10°C/min theweight that is retained at temperatures between 145°C and 150°C can be used asan equivalent to the weight that would be obtained after oven drying at 105°C(Taylor, 1997, pp. 121, 200). Taylor states that these temperatures always dependon experimental conditions, such as sample size, heating rate, rate of gas flowand the design of the apparatus.
5.8.2 Non-evaporable Water Content after Powers
Two parameters, the amount of the total water and the non-evaporable water inthe cement paste can be derived directly from TG-measurements. The differencebetween the initial sample weight (m0) and the weight at 900℃ (m900) yieldsthe amount of the total water (wt) held in the cement paste at the time oftesting. The amount of the total water needs to be corrected by the weight lossof the dry cement powder at 900℃ with respect to its initial mass (L0/900). Theamount of non-evaporable water (wn) is calculated from the weight loss measuredbetween 105℃ and 900℃ corrected by the loss of ignition of the dry cementpowder at 900℃ with respect to its mass at 105℃ (L105/900). The amountsof the two types of water are expressed in gram per gram of original cement.The equations for calculating the content of the total water (wt/c) and non-evaporable water per gram of original cement (wn/c) are given in equations 5.7and 5.6. If both quantities are known the amount of the evaporable water pergram of original cement can be calculated with equation 5.8. The calculationof the non-evaporable water from the weight loss of cement paste after heating

86 5 Complimentary Experimental Methods
0
200
400
600
800
1000
0 60 120 180 240
Time (min)
Tem
pera
ture
(°C
)
70
75
80
85
90
95
100
Re
tain
ed
Ma
ss
(%)
105 C (120 min)°
900°C (15 min)
Evaporable Water
TG - Curve
Heating Regime
Portland Cement Pastew/c = 0.35, @ 36 hours
10C/m
in
°
m0
m105
m900
L105-900
Non-EvaporableWater wn
we
Dry Cement Powder
L105-900
L0-105
Fig. 5.10: Heating regime and weight loss of cement paste with w/c = 0.35 measured after 36hours by TG
was first derived by Powers (1949). The complete derivation of equations 5.6–5.8and the determination of the losses of ignition (L0/900) and (L105/900) is given inappendix A.2.
wt
c=
m0
m900
(1− L0/900
)− 1 (5.6)
wn
c=
m105
m900
(1− L105/900
)− 1 (5.7)
we
c=
wt
c− wn
c(5.8)
The amount of non-evaporable water is commonly considered as an approxi-mation of the chemically bound water, although much water from the interlayerspaces, which is by definition part of the chemically bound water, is lost duringthe drying process at 105°C (Taylor, 1997, pp. 121, 198). Thus, by relating the

5.8 Thermogravimetry 87
content of non-evaporable water at a certain time t to that for complete hydra-tion, the degree of hydration (α(t)) can be calculated (eq. 5.9). The contentof non-evaporable water for complete hydration (wn/ccomplete) was determinedbased on the maximum water content of the clinker phases of the used cementas it can be found in the literature (used value: wn/ccomplete = 0.236).
α (t) =wn
c (t)wn
ccomplete
(5.9)
5.8.3 Non-evaporable Water and Calcium Hydroxide Content after El-Jazairi
and Illston
El-Jazairi and Illston (1977, 1980) have used thermogravimetric measurementsto follow the development of the major constitutions of Portland cement paste.In their investigations the total mass loss that a cement paste sample undergoesduring heating is divided into three dominant hydrothermal phases, which aredefined as follows:
dehydration This reaction takes place between 105°C and 440°C and includesprimarily the decomposition of most of the C-S-H phases.
dehydroxylation This phase occurs between 440°C and 580°C and describes thedecomposition of the calcium hydroxide.
decarbonation This last phase takes place between 580°C and 1000°C and in-cludes the decomposition of the calcium carbonate.
The weight loss during dehydration (wdh/c), dehydroxylation (wdx/c), and de-carbonation (wdc/c) in grams per gram of original cement corrected by the loss ofignition of the anhydrous cement (L105/900) can be calculated with equations 5.10,5.11, and 5.12, respectively. The given equations represent an extension of theconcept derived by El-Jazairi and Illston, since they originally did not account forthe loss of ignition of the cement. The complete derivation of equations 5.10–5.12is given in appendix A.3.
From the weight losses defined above it is possible to distinguish between thetotal amount of non-evaporable water and the total amount of calcium hydroxideheld in the cement paste. The total amount of non-evaporable water in gram pergram of original cement (w′
n/c), given with equation 5.13, is corrected for thewater loss equivalent to that of decarbonation. The correction factor 0.41 is

88 5 Complimentary Experimental Methods
based on the assumption that the carbonate is formed by the reaction of CO2
with Ca(OH)2. The amount of calcium hydroxide in gram per gram of originalcement (wCH/c) can be derived from the dehydroxylation and decarbonationlosses with equation 5.14. The first part of equation 5.14 represents the amount ofthe free calcium hydroxide formed during hydration. The factor 4.11 correspondsto the ratio of the molar masses of Ca(OH)2 (74.09 mol) and H2O (18.01 mol)(Mounanga et al., 2004).
wdh
c=
m105 −m440
m900
(1− L105/900
)(5.10)
wdx
c=
m440 −m580
m900
(1− L105/900
)(5.11)
wdc
c=
m580 −m900
m900
(1− L105/900
)(5.12)
w′n
c=
wdh
c+
wdx
c+ 0.41
wdc
c(5.13)
wCH
c= 4.11
wdx
c︸ ︷︷ ︸free Ca(OH)2
+1.68wdc
c(5.14)
For the experiments conducted within the frame of this thesis it was foundthat the temperature range for the dehydroxylation given by El-Jazairi and Ill-
ston did not match exactly the temperature range that was observed in theTG-measurements. The decomposition of the calcium hydroxide was found tostart at temperatures consistently lower than 440°C. A representative example ofthe occurrence of the three hydrothermal phases during the TG-measurementsis given in figure 5.11. Indicated by the distinct drop in the derivative ther-mogravimetric (DTG) curve, the figure shows that the dehydroxylation startsat approximately 400°C. This also agrees with data presented by Taylor (1997,pp. 118, 211), which show that the decomposition of calcium hydroxide takesplace between 380°C and 550 °C. A similar temperature range, that is 350°C to550 °C, is given by Bogue (1947, 73). To allow an exact determination of theamount of calcium hydroxide the weight loss associated with the dehydroxylationis determined as shown in the inset in figure 5.11 (see also Taylor, 1997, p. 120).
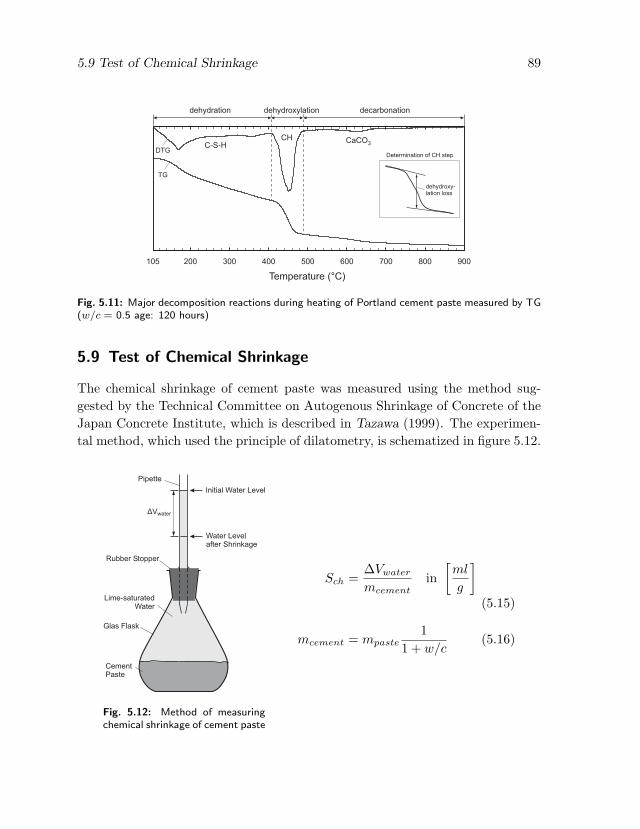
5.9 Test of Chemical Shrinkage 89
105 200 300 400 500 600 700 800 900
Temperature (°C)
dehydration dehydroxylation decarbonation
C-S-HCH CaCO3
Determination of CH step
TG
DTG
dehydroxy-lation loss
Fig. 5.11: Major decomposition reactions during heating of Portland cement paste measured by TG(w/c = 0.5 age: 120 hours)
5.9 Test of Chemical Shrinkage
The chemical shrinkage of cement paste was measured using the method sug-gested by the Technical Committee on Autogenous Shrinkage of Concrete of theJapan Concrete Institute, which is described in Tazawa (1999). The experimen-tal method, which used the principle of dilatometry, is schematized in figure 5.12.
CementPaste
Lime-saturatedWater
Rubber Stopper
Pipette
Glas Flask
Initial Water Level
Water Levelafter Shrinkage
ÄVwater
Fig. 5.12: Method of measuringchemical shrinkage of cement paste
Sch =∆Vwater
mcementin
[ml
g
](5.15)
mcement = mpaste1
1 + w/c(5.16)
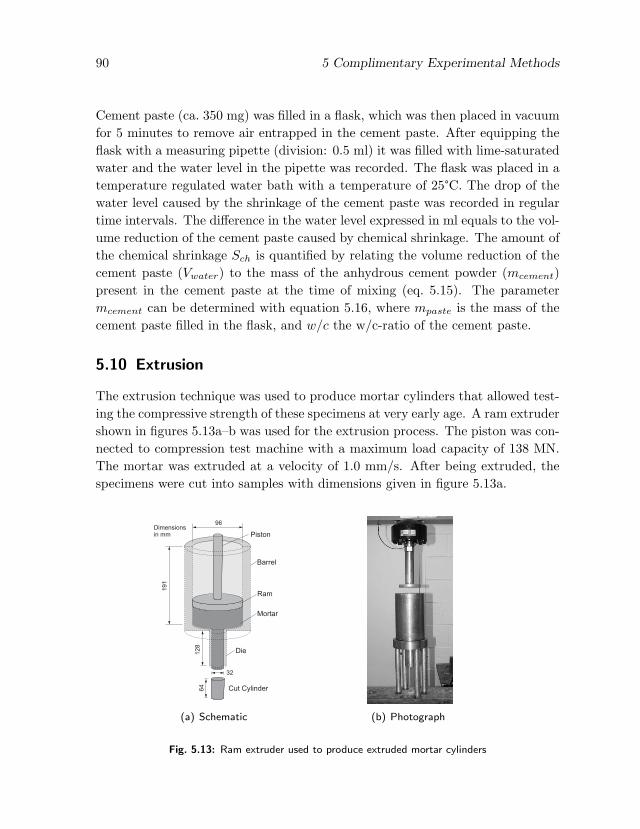
90 5 Complimentary Experimental Methods
Cement paste (ca. 350 mg) was filled in a flask, which was then placed in vacuumfor 5 minutes to remove air entrapped in the cement paste. After equipping theflask with a measuring pipette (division: 0.5 ml) it was filled with lime-saturatedwater and the water level in the pipette was recorded. The flask was placed in atemperature regulated water bath with a temperature of 25°C. The drop of thewater level caused by the shrinkage of the cement paste was recorded in regulartime intervals. The difference in the water level expressed in ml equals to the vol-ume reduction of the cement paste caused by chemical shrinkage. The amount ofthe chemical shrinkage Sch is quantified by relating the volume reduction of thecement paste (Vwater) to the mass of the anhydrous cement powder (mcement)present in the cement paste at the time of mixing (eq. 5.15). The parametermcement can be determined with equation 5.16, where mpaste is the mass of thecement paste filled in the flask, and w/c the w/c-ratio of the cement paste.
5.10 Extrusion
The extrusion technique was used to produce mortar cylinders that allowed test-ing the compressive strength of these specimens at very early age. A ram extrudershown in figures 5.13a–b was used for the extrusion process. The piston was con-nected to compression test machine with a maximum load capacity of 138 MN.The mortar was extruded at a velocity of 1.0 mm/s. After being extruded, thespecimens were cut into samples with dimensions given in figure 5.13a.
96
191
32
128
64
Mortar
Barrel
Piston
Die
Cut Cylinder
Dimensionsin mm
Ram
(a) Schematic (b) Photograph
Fig. 5.13: Ram extruder used to produce extruded mortar cylinders
Chapter 6
Monitoring the Early Age Properties of
Cementitious Materials
6.1 Introduction
The investigations described in this chapter are aimed at studying the funda-mental relationships among evolving microstructure, mechanical properties, andultrasonic wave reflection measurements. The reflection coefficient measured withshear waves can theoretically be related to shear modulus. The development ofshear modulus with time is related to how the microstructure of hydrating cementevolves as a result of curing. Experiments are designed to elicit these fundamen-tal relationships and use them to develop procedures that relate the measuredreflection loss to the physical properties of cementitious materials.
The hydration behavior of different Portland cement pastes, mortars, and con-cretes is investigated by the WR-method and various complimentary, indepen-dent, test methods. The analysis of the test results will yield information aboutthe relationship of the reflection loss to key material parameters of cement-basedmaterials. By starting from more phenomenological parameters, such as setting,and moving to defined physical and physico-chemical properties, such as elasticmoduli and degree of hydration, the employed test methods evaluate a wide rangeof material properties. The investigations presented in the following sections areintended to identify the parameters that govern the development of the reflectionloss measured by the WR-method.

92 6 Monitoring Early Age Properties of Cementitious Materials
6.2 Setting Process
6.2.1 General Relationship
The sensitivity of the wave reflection method to the setting behavior of cementi-tious materials in general will be demonstrated by comparing the results of thewave reflection method with the temperature rise due to hydration measured ina mortar specimen. The in-situ temperature is a well established measure of thehydration progress and is widely used in the context of the maturity method. Bymeans of the wave reflection method the reflection loss (eq. 4.6, p. 70) of shearwaves (2.25 MHz) at the interface of a steel plate and the mortar was measured.The tested mortar mixture contains retarding agent in a content of 0.4% per massof cement. The development of reflection loss and temperature in time is given infigures 6.1. It can be seen that the time of increase in the temperature, indicatingthe end of the dormant period, coincides well with the time when the reflectionloss starts to increase (Point ➀). At that time the commencing percolation ofsolid hydration products allows the shear waves to propagate in the cement mor-tar. Thus, waves are transmitted over the steel-mortar interface resulting in asignificant increase of the reflection loss. The rate of the reflection loss increasereaches its maximum during the ascending part of the temperature development,when also the hydration reactions are at their maximum level (Point ➁). Afterthe temperature has reached the maximum point the slope of the reflection losscurve reduces indicating a slower hydration progress.
6.2.2 Influence of Admixtures
In this section the ability of the wave reflection method to monitor the hydrationbehavior of cementitious materials influenced by different chemical and mineraladmixtures will be investigated. As a first example the setting behavior of Port-land cement mortars containing accelerator and retarder monitored with the wavereflection method (using shear waves) and adiabatic calorimetry will be used. Thereflection loss and the rate of the adiabatic heat evolution of the two mortars areshown in figure 6.2. It can be seen that from the qualitative point of view thereflection loss reproduces very well the hydration behavior as measured by therate of adiabatic heat evolution. The reflection loss for the accelerated mortarstarts to increase much earlier than the curve for the retarded mortar mixture.The same behavior can be found for the rate of heat evolution. Another indicatorof the sensitivity of the wave reflection method to differences in the hydration

6.2 Setting Process 93
behavior is the rate at that the reflection loss increases. The curve for the mor-tar containing accelerator exhibits a higher slope than the curve for the retardedmortar (αa > αr in fig. 6.2(a)). Again, on a qualitative basis the same statementcan be made for the rate of the adiabatic heat evolution (αa > αr in fig. 6.2b).
6.2.3 Influence of Water/Cement Ratio
The capability of the shear wave reflection method to monitor the setting behaviorof cementitious materials influenced by different w/c-ratios will be analyzed inthe following. Cement mortars with w/c-ratios of 0.35, 0.5 and 0.6 were cured atisothermal conditions of 25°C. The mix proportion of the tested mortars is givenin table 6.1. The setting behavior of the three tested mortars was examinedby measuring the penetration resistance according to ASTM C403 (see sec 5.3,p. 79). The development of the penetration resistance of the tested mortars isgiven in figure 6.3. The figure shows clearly the strong influence of the w/c-ratioon the development of the penetration resistance in time. The time of initial andfinal setting derived from the data presented in figure 6.3 are given in table 6.2.
The development of the shear wave reflection loss measured on the mortarsin the first twelve hours after casting is given in figure 6.4. It can clearly beseen that the reflection loss curves reproduce very well the characteristics ofthe setting behavior indicated by the penetration resistance. To allow a directcomparison between the reflection measurements and the setting behavior the
0.0
0.2
0.4
0.6
0.8
1.0
0 12 24 36 48
Time (hours)
Re
fle
cti
on
Lo
ss
(dB
)
23
24
25
26
In-s
itu
Te
mp
era
ture
(
°C
)
Reflection Loss
In-situ TemperaturePortland Cement Mortar
Retarder: 0.4 M% of Cement
w/c = 0.6
1
2
RL
°C
Fig. 6.1: Comparison between reflection loss and temperature measured in-situ

94 6 Monitoring Early Age Properties of Cementitious Materials
0.0
0.2
0.4
0.6
0.8
1.0
0 12 24 36 48
Time (hours)
Refl
ecti
on
Lo
ss
(dB
)
Retarder
Accelerator
Portland Cement Mortar
w/c = 0.6
raá á
(a) Reflection loss
0
5
10
15
20
25
30
35
0 12 24 36 48
Time (hours)
Ra
teo
fH
ea
tE
vo
luti
on
(kJ
/[k
g·h
])
Retarder
AcceleratorPortland Cement Mortar
w/c = 0.6
a
r
á
á
(b) Rate of adiabatic heat evolution
Fig. 6.2: Reflection loss and rate of adiabatic heat evolution for mortars containing accelerator andretarder
time of the initial setting of the mortars and the corresponding value of reflectionloss is marked in figure 6.4. The mortar with w/c = 0.35 has the earliest initialsetting time and also shows a very early and steep increase of the reflection loss.Accordingly, the mortar with w/c = 0.6 that has a later initial setting time causesthe reflection loss to increase later and with a lower rate. It should be pointedout that at the time of initial setting all three mortars show a very similar valueof the reflection loss. Hence, based on the group of the tested mortars, it seemsto be reasonable, to define a critical reflection loss value (RL,IS) that, within acertain interval of probability, can indicate the occurrence of the initial setting.
Another indicator for the setting process of cementitious materials is the de-velopment of the adiabatic heat of hydration. The normalized values of theadiabatic heat release and the reflection loss for the mortars with w/c = 0.35and 0.5 are given in figure 6.5. The data are plotted versus equivalent age to
Tab. 6.1: Mix proportion oftested cement mortars
M35 M50 M60
cementa 1 1 1water 0.35 0.5 0.6sandb 2 2 2aType I, bpure silica sand
Tab. 6.2: Initial and final setting time (inhours) of tested mortars
w/c-ratio initial setting final setting
0.35 3.29 4.750.50 4.75 6.610.60 6.14 8.51

6.2 Setting Process 95
0
10
20
30
40
2 3 4 5 6 7 8 9
Time (h)
Pe
ne
tra
tio
nR
esis
tan
ce
(MP
a) w/c = 0.35
w/c = 0.5
w/c = 0.6
27.6
3.5
final setting
initial setting
(R = 0.9710)2
(R = 0.9954)2
(R = 0.9756)2
Fig. 6.3: Evolution of the penetration resistanceof tested mortar mixtures
0.0
R = 0.12 ± 0.02
0.4
0.6
0.8
0 3 6 9 12
Time (h)
w/c = 0.6
w/c = 0.35 w/c = 0.5
Reflection L
oss (d
B)
IS 0.35 0.5 0.6
w/c IS (h) R (dB)
0.35
0.50
0.60
3.3
4.8
6.1
0.10
0.14
0.11
L
0.2
L
Cement Mortar
IS IS
Fig. 6.4: Reflection loss development and initialsetting time for Portland cement mortars withdifferent w/c-ratios
account for their different temperature histories (adiabatic and isothermal). Theequivalent age was calculated with the Arrhenius equation (activation energyEa = 33.5 kJ/mol). It can be seen from the figure that both quantities developafter very similar trends over the entire period of time that is investigated. Thisgood agreement is very important for evaluating the relationship between thereflection loss and the process of cement hydration. The adiabatic heat releasedescribes the total amount of heat that is generated by the hydration of onemass unit of cement and can be considered as a direct measure of the cementhydration.
0
0.2
0.4
0.6
0.8
1
0 24 48 72 96
Time (h)
no
rma
lize
dS
ca
le(-
)
0 12 24 36 48 60
Time (h)
Reflection Loss Adiabatic Heat Release
w/c = 0.35 w/c = 0.50
Fig. 6.5: Comparison of adiabatic heat release and reflection loss for mortars with w/c = 0.35 and0.5 (normalized values)

96 6 Monitoring Early Age Properties of Cementitious Materials
0
10
20
30
40
50
60
0 24 48 72 96 120 144 168 192
Time (Hours)
Co
mp
ressiv
eS
tre
ng
th(M
Pa
)
50 mm
w/c = 0.35
w/c = 0.5
w/c = 0.6
Power Law
Hyperbolic Trend
Cement Mortar
Fig. 6.6: Compressive strength development oftested cement mortars
0
2
4
6
8
0 3 6 9 12 15 18
Time (h)
Co
mp
ressiv
eS
tre
ng
th(M
Pa
)
Power Law
Hyperbolic Trend
w/c = 0.35 w/c = 0.5
w/c = 0.6
Cement Mortar
Fig. 6.7: Initiation of compressive strength de-velopment
6.3 Compressive Strength
6.3.1 Strength Development of Cement Mortar under Isothermal Conditions
The sensitivity of the wave reflection method to the compressive strength develop-ment of cementitious materials will be analyzed in this section. The compressivestrength development was determined according to ASTM C109. Mortar cubeswith the size of 50×50 mm were used for the compression tests. The cubes werecured in a temperature controlled water bath at 25°C. Dependending on thew/c-ratio the tests were started between three and six hours after casting. Thedevelopment of the compressive strength of the three tested mortar mixtures upto eight days as well as in the first twenty hours is given in figures 6.6 and 6.7.It can be seen that the strength starts to develop after a power law and laterincreases according to a hyperbolic trend.
As an example, the development of reflection loss and strength for the mortarwith w/c = 0.5 is given in figure 6.8. It can be seen, that both parameters de-velop after the same pattern. First, reflection loss and strength start to increaseaccording to a power law. This phenomenon agrees with studies conducted byPopovics (1971), who concluded that physical characteristics of the setting ofcementitious materials can be approximated by a power function. After the set-ting process the growth characteristic of reflection loss and strength changes toa hyperbolic trend. The hyperbolic trend function is the linear hyperbolic modelfor the compressive strength development at isothermal conditions introduced byCarino (1984) and Knudsen (1980). The model is given in equation 6.1, wherefc (t) is the strength at time t, fc,u the ultimate strength of the concrete at infi-

6.3 Compressive Strength 97
nite age, t0 the time when strength virtually starts to increase and k the constantrate for the strength gain of concrete at a constant temperature. The model isbased on the assumption that the degree of hydration of an individual cementparticle is linearly related to the product of time and the rate constant (Knud-
sen, 1984). Knudsen (1980) stated that the linear hyperbolic model (eq. 6.1) isvalid for any property that is directly related to the extent of cement hydration.The similarities in the growth characteristics of reflection loss and compressivestrength let conclude that both parameters are intimately related.
fc (t) = fc,uk (t− t0)
1 + k (t− t0)(6.1)
The relationship between reflection loss and compressive strength (fc–RL re-lationship) for the tested cement mortars with w/c = 0.35, 0.5 and 0.6 is givenin figure 6.9. The fc–RL relationship, which is independent from the w/c-ratio,exhibits a strong bilinear pattern, dividing the relationship into two parts. Thefirst part at very early ages has a clearly lower slope compared to the second partof the relationship at later ages. The transition between the two trends occurredwithin the first 15 hours after mixing. It is believed that the change of the slopeis related to differences in the kinetics of the strength and reflection loss gain atearly ages.
A similar bilinear pattern for the relationship between compressive strength(in logarithmic scale) and P-wave velocity of concrete was found by Elvery and
0
5
10
15
20
25
0 12 24 36 48
Time (h)
0
0.5
1.0
1.5
2.0
2.5
Power Law
hyperbolic Trend
f(t) = a·tb
ReflectionLoss
CompressiveStrength
PowerLaw
hyperbolicTrend
Cement Mortarw/c = 0.5
Co
mp
ressiv
eS
tre
ntg
h (
MP
a)
Re
flectio
nL
oss
(dB
)
( ) ( )( )0
0u,cc
ttk1
ttkftf
-+
-=
Fig. 6.8: Comparison of reflection loss and compressive strength of mortar with w/c = 0.5

98 6 Monitoring Early Age Properties of Cementitious Materials
0
10
20
30
40
50
0 1 2 3 4
Reflection Loss (dB)
w/c = 0.6
w/c = 0.5
w/c = 0.35
Com
pre
ssiv
e S
trength
(M
Pa)
R2 = 0.9736
f = 3.25 R - 0.13cR = 0.92432A
B
Trends
A
Bfc = 15.38 R - 11.58
fc = 2.9 MPa
Time
Transition Point
w/c = 0.35: 6.7 hw/c = 0.50: 10.9 hw/c = 0.60: 14.4 h
R = 0.95 dBL
L
L
Cement Mortar
Fig. 6.9: Relationship between reflection loss and compressive strength for tested cement mortars
Ibrahim (1976). The authors stated that this behavior could be attributed to theearly formation of C-S-H phases that provide links between the cement grainsand aggregates. The thereby improved wave propagation properties of the settingconcrete leads to a significant increase of the wave velocity. The compressivestrength, on the other side, that changes only slightly during this early periodwas found to increase significantly at a later stage, when the C-S-H formationhas reached a more advanced stage. Elvery and Ibrahim report that the changeof the slope in the bilinear relationship occurred at about 28 hours after casting.
The bilinear trend shown in figure 6.9 is most likely due to a similar effect.The time difference between the occurrence of the transition point (Elvery andIbrahim: 28h; fig. 6.9: up to 15h) can be attributed to the fact that the prop-agation of P- and S-waves in setting and hardening cementitious materials isinfluenced by different parameters. Nevertheless the bilinearity of the fc–RL re-lationship, compressive strength and reflection loss are related by a single lineartrend function during the time between about 15 hours and 4 days after casting.This offers various possibilities for the practical application of the wave reflectionmethod to nondestructively determine the compressive strength development inconcrete structures.

6.3 Compressive Strength 99
6.3.2 Strength Development of Extruded Cement Mortar
6.3.2.1 Overview and Experimental Program
In this section, the relationship between reflection loss and compressive strengthat very early ages will be examined. In general, compression tests on regular castspecimens cannot be performed until the initial set has occurred. Therefore, thecompressive strength of regular cast cementitious materials at any time beforeinitial setting is practically a not defined parameter. Even after the initial settingit is very difficult to remove specimens from their mold without damage until thefinal set has occurred.
To overcome this problem mortar specimens were produced with an extrusiontechnique (see sec. 5.10, p. 90). By means of this technique cylindrical specimenswere produced that have an excellent shape retention, even if the mortar is infresh state. To make the mortar suitable for the extrusion technique specialbinders must be added to provide good material cohesion, low adhesion to diesurfaces, and low elasticity of the mortars (Srinivasan et al., 1999). The mortarswere not thermally treated during the extrusion process. The mix proportions ofthe two different mortar mixtures that were used for the experiments are givenin table 6.3. For both mortars hydroxypropyl methylcellulose (HPMC) was usedas a water-soluble, organic binder. In addition, clay on the basis of a purifiedmagnesium aluminosilicate was added as an inorganic binder to mortar Mix B.
The compressive strength of the extruded cylinders was tested according tothe procedure described in section 5.2 on page 78. The compressive strength ob-tained from mortar cylinders in fresh state is commonly called the green strengthof the tested material. The possibility to measure the compressive (or green)
Tab. 6.3: Mix proportions of the mortars used for the extrusion
Mortar A Mortar B
cementa 1 1
water 0.35 0.39
fine aggregatesb 3.46 3.41
clayc – 0.034d
HPMC 0.016e 0.014e
superplasticizer 0.010 0.010
aType III, briver sand, cpurified magnesium aluminosilicated0.01 of fine aggregates, e0.004 of fine aggregates
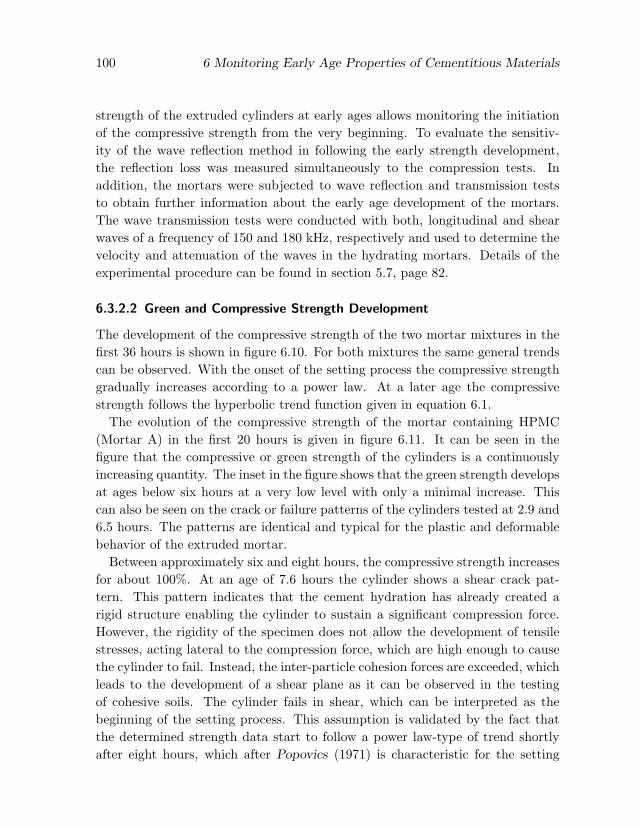
100 6 Monitoring Early Age Properties of Cementitious Materials
strength of the extruded cylinders at early ages allows monitoring the initiationof the compressive strength from the very beginning. To evaluate the sensitiv-ity of the wave reflection method in following the early strength development,the reflection loss was measured simultaneously to the compression tests. Inaddition, the mortars were subjected to wave reflection and transmission teststo obtain further information about the early age development of the mortars.The wave transmission tests were conducted with both, longitudinal and shearwaves of a frequency of 150 and 180 kHz, respectively and used to determine thevelocity and attenuation of the waves in the hydrating mortars. Details of theexperimental procedure can be found in section 5.7, page 82.
6.3.2.2 Green and Compressive Strength Development
The development of the compressive strength of the two mortar mixtures in thefirst 36 hours is shown in figure 6.10. For both mixtures the same general trendscan be observed. With the onset of the setting process the compressive strengthgradually increases according to a power law. At a later age the compressivestrength follows the hyperbolic trend function given in equation 6.1.
The evolution of the compressive strength of the mortar containing HPMC(Mortar A) in the first 20 hours is given in figure 6.11. It can be seen in thefigure that the compressive or green strength of the cylinders is a continuouslyincreasing quantity. The inset in the figure shows that the green strength developsat ages below six hours at a very low level with only a minimal increase. Thiscan also be seen on the crack or failure patterns of the cylinders tested at 2.9 and6.5 hours. The patterns are identical and typical for the plastic and deformablebehavior of the extruded mortar.
Between approximately six and eight hours, the compressive strength increasesfor about 100%. At an age of 7.6 hours the cylinder shows a shear crack pat-tern. This pattern indicates that the cement hydration has already created arigid structure enabling the cylinder to sustain a significant compression force.However, the rigidity of the specimen does not allow the development of tensilestresses, acting lateral to the compression force, which are high enough to causethe cylinder to fail. Instead, the inter-particle cohesion forces are exceeded, whichleads to the development of a shear plane as it can be observed in the testingof cohesive soils. The cylinder fails in shear, which can be interpreted as thebeginning of the setting process. This assumption is validated by the fact thatthe determined strength data start to follow a power law-type of trend shortlyafter eight hours, which after Popovics (1971) is characteristic for the setting
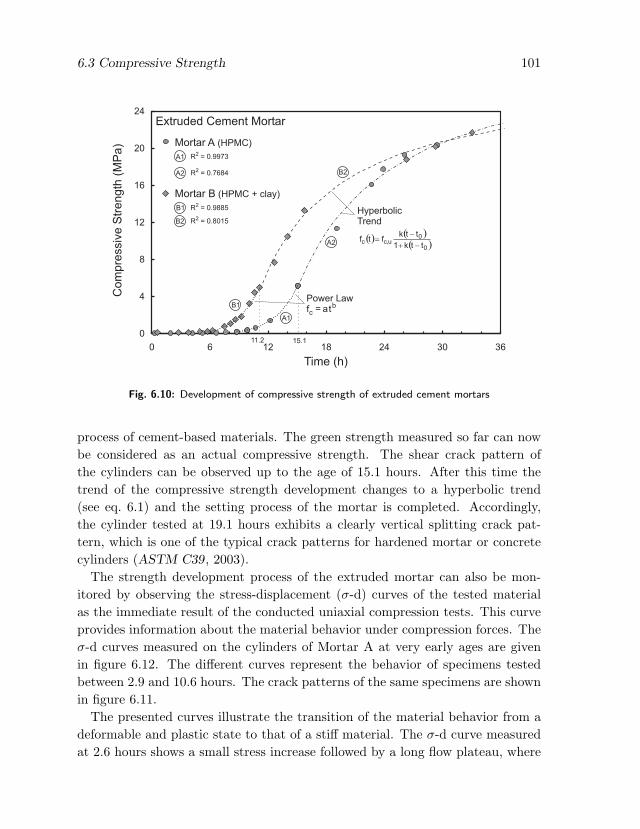
6.3 Compressive Strength 101
0
4
8
12
16
20
24
0 6 12 18 24 30 36
Time (h)
Co
mp
ressiv
eS
tre
ng
th(M
Pa
) Mortar A (HPMC)
Mortar B (HPMC + clay)
HyperbolicTrend
A2
A1
B1
B2
B1
B2
A1
A2
R = 0.80152
R = 0.98852
R = 0.99732
R = 0.76842
Extruded Cement Mortar
Power Lawf = atc
b
( ) ( )( )0
0u,cc
ttk1
ttkftf
-+
-=
15.111.2
Fig. 6.10: Development of compressive strength of extruded cement mortars
process of cement-based materials. The green strength measured so far can nowbe considered as an actual compressive strength. The shear crack pattern ofthe cylinders can be observed up to the age of 15.1 hours. After this time thetrend of the compressive strength development changes to a hyperbolic trend(see eq. 6.1) and the setting process of the mortar is completed. Accordingly,the cylinder tested at 19.1 hours exhibits a clearly vertical splitting crack pat-tern, which is one of the typical crack patterns for hardened mortar or concretecylinders (ASTM C39, 2003).
The strength development process of the extruded mortar can also be mon-itored by observing the stress-displacement (σ-d) curves of the tested materialas the immediate result of the conducted uniaxial compression tests. This curveprovides information about the material behavior under compression forces. Theσ-d curves measured on the cylinders of Mortar A at very early ages are givenin figure 6.12. The different curves represent the behavior of specimens testedbetween 2.9 and 10.6 hours. The crack patterns of the same specimens are shownin figure 6.11.
The presented curves illustrate the transition of the material behavior from adeformable and plastic state to that of a stiff material. The σ-d curve measuredat 2.6 hours shows a small stress increase followed by a long flow plateau, where

102 6 Monitoring Early Age Properties of Cementitious Materials
0
4
8
12
0 6 12 18
Time (h)
0.0
0.2
0.4
0.6
0 2 4 6 8 10
2.9h
7.6h
8.6h
10.6h
15.1h
19.1h
Co
mp
ressiv
e S
tre
ng
th (
MP
a)
Power Lawf = atc
b
HyperbolicTrendPower Law
2
6
10
3 9 15
Initial StrengthDevelopment
6.5h
Mortar A(HPMC)
Fig. 6.11: Development of compressive strength of extruded cement mortar (Mix A) and appropriatecracking patterns of tested cylinders
0.00
0.05
0.10
0.15
0.20
0.25
0.30
0 5 10 15 20
Displacement (mm)
Str
ess
(MP
a)
8.6 h
7.6 h
2.9 h
6.5 h
10.6 h Mortar A(HPMC)
Fig. 6.12: Stress-displacement curves measured on extruded mortar cylinders at early ages (Mor-tar A)

6.3 Compressive Strength 103
the stress remains on a constant level while the displacement increases. Thisbehavior is typical for a plastic material, such as freshly extruded cement mortar.At an age of 6.5 hours essentially the same behavior can be observed. The onlydifference is the higher stress level of the flow plateau. This similarity in thematerial behavior is also expressed by the failure patterns of the cylinders testedat these times (see fig. 6.11).
The σ-d curve measured at 7.6 hours exhibits a different characteristic. Thecurve now increases until a distinctive maximum value is reached. Although thestiffness of the mortar is still very low, the cylinder fails at a certain stress levelwith a subsequent decrease in the measured stress. This change in the failuremechanism is also reflected by the shear crack pattern of the cylinder tested at thistime. The cylinder tested at 8.6 hours shows an even more distinct maximumstress value accompanied with a further increase of the stiffness. The mortartested at this time clearly starts to develop properties of a solid material. Theshear crack pattern of the failed cylinder is more pronounced and the appropriatestrength value marks the beginning of the power law trend of the compressivestrength values (see fig. 6.11).
6.3.2.3 Results of Ultrasonic Measurements
The results of the ultrasonic wave transmission and reflection measurements arepresented in figure 6.13. The comparison of the P- and S-wave velocity especiallyat early ages allows important conclusions about the sensitivity of these two wavetypes. In figure 6.13a it can be observed that at the very beginning, the P-wavevelocity measured on Mortar B, which contains clay, is significantly higher thanthat of Mortar A at the same age. This indicates that the P-wave velocity isvery sensitive to the internal structure of the tested materials even before theso-called initial set. The fine clay particles added to Mortar B cause the alreadyvery dense microstructure of the extruded material to become even more denseand compact. This improves the mechanical coupling between the constituentsof the mortar (cement, clay, and sand particles) and thereby improves the P-wavepropagation properties of the fresh mortar material.
However, the differences in the internal structure of the mortars do not influ-ence the initial values of the S-wave velocity. In figure 6.13b can be seen thatboth mortar mixtures show similar velocity values at the time of onset of theS-wave propagation. This origins from the fact that S-wave propagation is notinfluenced by the inter-particle distance inside a material. S-waves can only prop-

104 6 Monitoring Early Age Properties of Cementitious Materials
0.0
0.5
1.0
1.5
2.0
2.5
3.0
3.5
4.0
0 6 12 18 24 30 36
Time (h)
P-w
ave
Ve
locity
(km
/s)
Mortar B
Mortar A
P-wave velocity
(a)
0.0
0.5
1.0
1.5
2.0
0 6 12 18 24 30 36
Time (h)
S-w
ave
Ve
locity
(km
/s)
Mortar B
Mortar A
S-wave velocity
(b)
0.0
0.5
1.0
1.5
2.0
2.5
3.0
0 6 12 18 24 30 36
Time (h)
Re
fle
ctio
nL
oss
(dB
)
Mortar B
Mortar A
Reflection Loss
(measured with S-waves)
(c)
Fig. 6.13: Results of P-wave velocity, S-wave velocity, and wave reflection measurements on MortarsA and B
agate if the individual particles are part of a shear-rigid microstructure and thisshear rigidity can only be created when the particles become connected due tothe cement hydration process. For this reason, the S-wave velocity measured onMortars A and B starts to increase at different times since both mortars exhibitdifferent hydration dynamics.
As indicated by the compressive strength development given in figure 6.10,Mortar B starts to gain strength faster than Mortar A. The same effect canbe observed for the S-wave velocity in figure 6.13b. This can be taken as anindication for the fact that the S-wave velocity is governed by the same materialproperty as the compressive strength, that is how well the individual particlesof the cementitious microstructure are bonded together as a result of cementhydration.
6.3.2.4 Comparison of Compressive Strength with Results of Ultrasonic Mea-
surements
The objective of the experiments conducted with extruded cement mortar is tofurther detail the knowledge about the relationship between compressive strengthand reflection loss. Special emphasis will be placed on the period when thegreen strength of the mortar transforms to an actual compressive strength. Infigure 6.14a the compressive strength development of Mortar B within the first15 hours after mixing is given. The reflection loss, velocity and attenuationmeasured on the same mortar are given in figures 6.14b–d, respectively.
The initiation of the compressive strength shown in figure 6.14a has already

6.3 Compressive Strength 105
been discussed in the previous section (see fig. 6.11). The reflection loss measuredon the mortar is given in figure 6.14b. It can be noted that the reflection lossincreases immediately to a relatively high value (ca. 0.1 dB) and remains on thislevel for a longer period of time. It is believed that this is attributed to the natureof the extruded cement mortar. During the extrusion process cement paste andsand are exposed to a high triaxial pressure condition, which creates a materialwith a very dense internal structure. Due to this pressure and the low w/c-ratio,the cement and sand particles are in much closer contact as they are in a regularcast mortar mixture. This obviously allows the shear waves to propagate acrossthe steel-mortar interface for a small extend and thereby causes the reflectionloss to increase.
After approximately six hours the reflection loss, given in figure 6.14b, startsslightly to increase from its initial constant value. The time of this increasematches the time when also the first significant increase of the compressivestrength can be observed (Point ➀). This suggests that the structural changescaused by the hydration in this time step affects both quantities in a similar way.The percolating cement particles start to develop a solid internal microstruc-ture that lends compressive strength to the cylinder and allows the shear wavesto propagate in the mortar, which causes the reflection loss to increase. Theinitiation of the hydration process also results in the onset of the shear wavepropagation in through transmission mode (fig. 6.14c). Since transmitted shearwave signals could not be detected before this time, it can be concluded that thehydration products now provide a continuous path allowing the shear waves topass the test specimen from one side to the other. Thus, the time marked byPoint ➀, at which the reflection loss starts to increase, can be considered as thetime when the cement particles are percolated (percolation threshold). Furtherinvestigations that support this theory are presented in section 7.3.4, page 150.
It should be noted that the attenuation of the transmitted shear wave signalsshown in figure 6.14d remains on a constant level although the shear wave velocityis increasing. This indicates that the microstructural changes in the mortarare still rather small, which is also reflected in the small rates of increase ofcompressive strength, reflection loss and shear wave velocity between Point ➀ andPoint ➁ (ca. eight hours). At this time, all three of the latter parameters startto develop after a power law and the attenuation is decreasing. This observationand especially the significant increase of the compressive strength after Point ➁
indicates the onset of the setting process of the mortar.From the observations described above can be concluded that the measure-

106 6 Monitoring Early Age Properties of Cementitious Materials
0.0
0.3
0.5
0.8
1.0
0.0
0.5
1.0
1.5
2.0
2.5
0
20
40
60
80
100
0 3 6 9 12 15
Time (h)
P-Waves
S-Waves
0
300
600
900
1200
1500
P-Waves
S-Waves
ReflectionLoss (dB)
CompressiveStrength (MPa)
WaveVelocity (m/s)
Attenuation (dB)
S-Waves
32
� �
Mortar A
64
(a)
(b)
(c)
(d)
PowerLaw
PowerLaw
PowerLaw
PercolationThreshold
Initiation ofCompressive Strength
Fig. 6.14: Comparison of compressive strength development with ultrasonic measurements of Mor-tar B

6.3 Compressive Strength 107
ments conducted with shear waves in reflection and transmission mode are invery close correlation to the evolution of the compressive strength of the testedmortar at very early ages. Figures 6.14c and d also show results for wave ve-locity and attenuation measured with primary waves. It can be seen that thetransmission of P-waves can be detected as early as 1.5 hours after casting. Afterapproximately three hours the P-wave velocity in figure 6.14c increases with asignificant rate, although no increase in compressive strength can be observed.The same statement (on a qualitative basis) can be made for the attenuation ofthe P-waves shown in figure 6.14d.
Similar observations of a rapid increase of P-wave velocity accompanied withno or only small changes in compressive strength of concrete were made by Elvery
and Ibrahim (1976) and Byfors (1980). It was concluded that this phenomenoncould be attributed to the early formation of C-S-H phases that connect cementparticles and aggregates and thereby improve the P-wave propagation propertiesof the concrete. Whereas the compressive strength does not show significantchanges until the cement hydration has progressed to a much higher extent.
6.3.2.5 Relationship between Compressive Strength and Reflection Loss
In this section the relationship between compressive strength and reflection lossduring the time immediately after the initiation of the strength development ofthe extruded cement mortars will be investigated in more detail. In section 6.3.1,page 96, it was found that the fc–RL relationship for Portland cement (TypeI) mortars has a bilinear character, that is with a flat slope at early age and asteeper slope in the later age. The origin of this change in slope was alreadydiscussed in section 6.3.1. In figures 6.15a and b the fc–RL relationships forMortar A and B in the first hours are given. It can be seen that for both mortarsthe fc–RL relationship can be subdivided into three parts. The first part coversthe time when the setting process of the mortar has not yet started. The strengthof the mortar measured during this time can be considered as a green strengthand no consistent trend in the data points can be identified.
In the second part of the fc–RL relationship compressive strength and reflec-tion loss are related by a consistent function, which is a power law for the cementmortars investigated here. The R2-values of the fitted power law functions aregiven in the figure. For both tested mortars the time period in which the fc–RL relationship can be described by the power function matches that when alsothe compressive strength (fig. 6.10) follows a power function. From the resultspresented in the previous section it can be concluded that this second part covers

108 6 Monitoring Early Age Properties of Cementitious Materials
0
1
2
3
4
5
6
0.0 0.2 0.4 0.6 0.8
Co
mp
ressiv
eS
tre
ng
th(M
Pa
)
0
5
10
15
20
25
0.0 0.5 1.0 1.5 2.0
Reflection Loss (dB)
Complete f -R Relationshipc L
(up to 33 hours)
Mortar A
Power Law
R = 0.97552
(a) Reflection Loss (dB)
7.5
Part 1 Part 2
11.1Time (h)
Part 3
0
1
2
3
4
5
6
0.0 0.2 0.4 0.6 0.8 1.0 1.2
Co
mp
ressiv
eS
tre
ng
th(M
Pa
)
0
5
10
15
20
25
0.0 1.0 2.0 3.0
Reflection Loss (dB)
Complete f -R Relationshipc L
(up to 59 hours)
Mortar B
Power Law
R = 0.98002
(b) Reflection Loss (dB)
7.6
Part 2
15.1Time (h)
Part 1 Part 3
Fig. 6.15: Early age relationship between compressive strength and reflection loss for Mortars Aand B
the setting process of the mortars. Investigations conducted on regular cast mor-tars containing Portland cement Type I have shown that the fc–RL relationshipof these mortars follows a linear trend during setting (see sec. 6.3.1, p. 96). Theinfluence of the cement type (cement Type III was used for the extruded mortars)on the second part of the fc–RL relationship shows that the reflection loss is verysensitive to microstructural properties of the tested cementitious materials andtheir development.
The third part of the fc–RL relationship, which is given in the insets of fig-ure 6.15, follows a strong linear trend and has a steeper slope compared to parttwo. This third part represents the main part of the fc–RL relationship andexhibits the same behavior as the fc–RL relationships of normally cast cementType I mortars (sec. 6.3.1).
6.3.3 Compressive Strength Development of Concrete
6.3.3.1 Experiments at Isothermal Conditions
The ability of the wave reflection method to monitor the compressive strengthdevelopment of concrete will be investigated in this section. For this purpose,two concrete mixtures were tested at three different isothermal curing tempera-tures of 3°C, 22°C, and 30°C. The concrete curing temperatures were maintained

6.3 Compressive Strength 109
Tab. 6.4: Mixture composition of the concrete tested atisothermal conditions
Concrete A Concrete B
cementa 1 1
fly ash – 0.27
silica fume – 0.08
water 0.55 0.52
fine aggregatesb 1.98 2.42
coarse aggregatesc 3.32 3.71
superplasticizer – 0.016
aType I, briver sand, ccrushed limestone, max. size 24 mm
by placing the specimens in temperature controlled curing rooms. The mixturecompositions of the used concretes are given in table 6.4. The strength devel-opment of the tested concrete mixtures was determined using cylinders (76×152mm) as described in section 5.2, page 78. At least five specimens were tested atdifferent times during the initial development of the strength (usually between13-24 hours after casting). The in-situ temperature development of the concretespecimens was monitored using the method described in section 5.4, page 80.
The reflection loss developments measured for Concrete B cured at the threetemperatures are presented in figure 6.16. Figure 6.17 shows the appropriate in-situ temperature of the tested specimens. It can be seen that except for very earlyages the specimens maintained the ambient temperature of the curing room. Theresults shown in figure 6.16 show that the differences in the hydration behavior
0.0
0.5
1.0
1.5
2.0
2.5
3.0
0 24 48 72 96 120 144 168 192
Time (h)
Re
fle
ctio
nL
oss
(dB
)
30°C
22°C
3°C
Fig. 6.16: Reflection loss development of Con-crete B
30°C
22°C
3°C
0
5
10
15
20
25
30
35
0 24 48 72 96 120 144 168 192
Time (hours)
Te
mp
era
ture
(°C
)
Fig. 6.17: In-situ concrete temperature forisothermally cured concrete

110 6 Monitoring Early Age Properties of Cementitious Materials
0.0
0.5
1.0
1.5
2.0
0 12 24 36 48 60 72
Time (h)
Re
fle
ctio
nL
oss
(dB
)
30°C
22°C
3°C
Fig. 6.18: Early age reflection loss developmentof Concrete B
0
5
10
15
20
25
30
35
0 12 24 36 48 60 72
Time (h)
Co
mp
ressiv
eS
tre
ng
th(M
Pa
)
30°C
22°C
3°C
Concrete, w/c=0.55isothermal
Fig. 6.19: Early age compressive strength de-velopment of Concrete B
0
10
20
30
40
50
0.5 1 1.5 2 2.5 3 3.5
Reflection Loss (dB)
Co
mp
ressiv
eS
tre
ng
th(M
Pa
)
3°C: R =2
0.9961
22°C: R = 0.9887
30°C: R = 0.9935
2
2
all: R = 0.92892
3°C
30°C
22°C
trend forall temperatures
(a) Concrete A
0
10
20
30
40
50
0.5 1 1.5 2 2.5 3
Reflection Loss (dB)
Co
mp
ressiv
eS
tre
ng
th(M
Pa
)
3°C
30°C22°C
3°C: R =2
0.9755
22°C: R = 0.9789
30°C: R = 0.9896
2
2
all: R = 0.90612
trend forall temperatures
(b) Concrete B
Fig. 6.20: Influence of mix proportion and curing temperature on the relationship between reflectionloss and compressive strength
caused by the curing temperatures are reproduced in the reflection loss graphs.By comparing the early age reflection loss development of Concrete B for the
three curing temperatures (fig. 6.18) with the corresponding development of thecompressive strength during the same period of time (fig. 6.19) the relationshipbetween both parameters can be analyzed on a qualitative basis. It can be seenthat the rate of strength development is affected by the curing temperature. Theconcrete cured at the highest ambient temperature starts developing strength firstwith the highest rate of change. The concrete cured at the lowest temperaturestarts last with the lowest growth rate. The reflection loss follows exactly thesame trend.
The direct relationship between compressive strength and reflection loss (fc–RL-relationship) of the two concrete compositions tested at three different tem-peratures is given in figures 6.20a–b. First, it should be noted that for a given

6.3 Compressive Strength 111
0
10
20
30
40
50
0 10 20 30 40 50
Measured Strength (MPa)
Pre
dic
ted
Str
en
gth
(MP
a)
Concrete A
Concrete B
Fig. 6.21: Comparison of measured and predicted compressive strength values of the tested concretes
curing temperature both parameters exhibit a strong linear relationship. Thetrend lines that can be fitted to the data have a very high coefficient of deter-mination R2, which are given in the figures. This type of relationship agreeswith the results described in section 6.3.1, where a bilinear dependency betweenreflection loss and compressive strength of cement mortar was observed. Sincethe compression tests with the concrete mixtures were started relatively late (14to 18 hours after casting) the first part of the bilinear fc–RL relationship couldnot be detected in presented curves.
Second, it can be seen that for a given concrete composition the fc–RL rela-tionships determined for the three curing temperatures run very close together.This allows to define a global trend line that describes the fc–RL relationshipfor a given concrete composition. The R2-values of these global trend lines rangewith 0.93 for Concrete A and 0.91 for Concrete B below those of the individualtrend lines. Nevertheless, these relationships can be considered to be statisti-cally significant. The differences between the slopes of the fc–RL relationshipsfor Concrete A and B imply that the mix proportion influences this parameter.In section 6.3.1 the fc–RL relationship of different mortar mixtures was foundto be independent of the w/c-ratio (fig. 6.9). In the case considered here theconcrete proportions differ in the usage of mineral admixtures. It is assumedthat the differences in the concrete microstructure caused by the addition of fly

112 6 Monitoring Early Age Properties of Cementitious Materials
ash and silica to Concrete B are responsible for the observed slope change of thefc–RL relationship.
For the practical application of the wave reflection method it would be of in-terest to what extend the determined fc–RL relationships can be used to predictthe compressive strength development of concrete based on the measured reflec-tion loss. The general form of the relationship that can be used for this purposeis given in equation 6.2, where fc(RL) is the compressive strength, RL the re-flection loss, m the slope of the fc–RL relationship and n the intersection offc–RL relationship with the strength axis.
fc (RL) = mRL + n (6.2)
By using the above equation and the parameters of the fc–RL relationshipgiven, for example, in figure 6.20a the compressive strength of Concrete A can bedetermined based only on the reflection loss measurements. The comparison ofthe compressive strength values of Concrete A and B measured with actual com-pression tests and the corresponding values predicted according to equation 6.2is given in figure 6.21.
6.3.3.2 Experiments at Uncontrolled (Outdoor) Conditions
In the previous section it was shown that the compressive strength of concretecured at constant temperature conditions can be estimated with the wave reflec-tion method. However, for a wider practical applicability of the wave reflectionmethod it is necessary to investigate if compressive strength and reflection lossare also linearly related when the curing temperature of the concrete is not con-trolled. For this purpose, experiments were conducted at outdoor conditionswith concrete specimens being cured in the open. Four different concrete mix-tures were used for the experiments. The mix proportions are given in table 6.5.For the given concrete mixtures the compressive strength was determined usingcylinders (76×152 mm) as described in section 5.2, page 78. Identical curingconditions were achieved by placing the concrete cylinders next to the specimensused for the wave reflection measurements. The in-situ temperature of the speci-mens used for the wave reflection measurements was monitored using the methoddescribed in section 5.4, page 80.
The reflection loss development of the four tested concrete mixtures is given infigure 6.22. It can be seen that the reflection loss was monitored in a discontinu-ous manner. Discontinuous sampling of the wave reflection data allows acquiring

6.3 Compressive Strength 113
0
1
2
3
4
0 24 48 72 96 120 144
Time (h)
Re
fle
ctio
nL
oss
(dB
)
( )( )( )0
0,LL
ttk1
ttkRtR
-+
-= ¥
ConcreteOutdoor Curing
Interpolationwith Model
Concrete 1w/c=0.71, fa/c=0.83
Concrete 6w/c=0.50, fa/c=0.64
0
1
2
3
4
0 24 48 72 96 120 144
Time (h)
Re
fle
ctio
nL
oss
(dB
)
Concrete 5w/c=0.54, fa/c=0.53
( )( )( )0
0,LL
ttk1
ttkRtR
-+
-= ¥
ConcreteOutdoor Curing
Interpolationwith Model
Concrete 4w/c=0.49, fa/c=0.26
Fig. 6.22: Reflection loss development of concrete cured at outdoor conditions
data from multiple sensors using a single channel data acquisition system. Thefeasibility of the practical implementation of this procedure was explored in thereported experiments. In section 6.3.1 it was found that the reflection loss fol-lows an hyperbolic trend that can also be used to describe the evolution of thecompressive strength of isothermally cured concrete (eq. 6.1, p. 97). To obtain acontinuous measure for the change of the reflection loss with time, this model wasused to interpolate the discrete reflection loss data collected during the differenttime intervals. The in-situ temperature development of the specimens of Con-crete 1 and 4 are given in figure 6.23. The temperature curves show significantchanges and are dominated by the day/night cycle. The maximum temperaturedifference is about 17 K.
The relationship between the compressive strength and the reflection loss forthe four different concrete mixtures is given in figure 6.24. It should first be
Tab. 6.5: Mixture composition of concretes tested at outdoor conditions
Concrete 4 Concrete 5 Concrete 6 Concrete 1
cementa 1 1 1 1
fly ash 0.26 0.53 0.64 0.83
water 0.49 0.54 0.50 0.71
fine aggregatesb 2.44 2.76 2.25 2.36
coarse aggregatesc 2.64 2.46 2.44 1.57
superplasticizer 0.007 0.013 0.028 0.007
aType I, briver sand, cgravel, max. size 16 mm

114 6 Monitoring Early Age Properties of Cementitious Materials
0
5
10
15
20
25
30
35
40
0 24 48 72 96 120 144
Time (hours)
Te
mp
era
ture
(°C
)
ConcreteOutdoor Curing Concrete 4
Concrete 1
Fig. 6.23: In-situ concrete temperature for con-crete cured at outdoor conditions
0
10
20
30
40
50
1.5 2 2.5 3 3.5
Reflection Loss (dB)
Co
mp
ressiv
eS
tre
ng
th(M
Pa
)
Concrete 4, R = 0.99412
Concrete 6, R = 0.99712
Concrete 5, R = 0.97682
ConcreteOutdoor Curing
Concrete 1, R = 0.98982
Concrete B
Fig. 6.24: Relationship between compressivestrength and reflection loss for concrete curedat outdoor conditions
noted that although the curing temperature of the concretes varied significantlyduring the period of measurement the fc–RL-relationships shown exhibit a stronglinear trend. The R2-value for each of the fitted trend lines is given in the figure.Additionally it can be observed that the fc–RL relationships of the four concreteshave clearly different trends. The different contents of fly ash in the mixtures (seetab. 6.5) obviously cause significant changes in the cementitious microstructurethat alter the parameters of the fc–RL relationship.
6.4 Modulus of Elasticity
6.4.1 General Remarks
The development of the elastic modulus, as a true physical property of solidmaterials, is an important criterion for the evaluation of the early age propertiesof cementitious materials. In this section it will be investigated how the reflectionloss relates to elastic material parameters of concrete and cement mortar. Thereflection loss or reflection coefficient measured by the wave reflection methodusing shear waves is physically related to the dynamic shear modulus of thetested material (eq. 3.12, p. 58). Thus, the reflection loss should qualitativelyand quantitatively be governed by the evolution of the dynamic shear modulusof the tested material. To verify this relationship the dynamic shear modulusdetermined with the WR-method (Gd,WR) will be compared to shear modulimeasured with additional independent test methods.

6.4 Modulus of Elasticity 115
6.4.2 Dynamic Shear Modulus derived from Compressive Strength Data
The evaluation of the relationship between elastic material parameters and theWR-measurements will first be done by analysing compressive strength dataof concrete. A great deal of research has been undertaken to investigate therelationship between the compressive strength and the elastic (Young’s) modulusof cement-based materials. Based on this, general relationships between thecompressive strength and the static modulus of elasticity (fc–Es-relationship) incompression of concrete are included in several design codes (e.g. ACI 318-02;Eurocode 2; DIN 1045-1; CEB-FIP Model Code 90). It should be noted thatthese relationships are empirical and not based on physical material laws.
In addition to the relationships covering the static elastic modulus, investiga-tions were conducted concerning the evolution of the dynamic elastic moduluswith regard to the compressive strength of concrete. In general, relationshipssimilar to those between static elastic modulus and compressive strength havebeen found. The most significant difference is that for concrete ages greater that24 hours the dynamic elastic modulus is always approximately 10%–20% higherthan the static elastic modulus. The relationships between compressive strength
Tab. 6.6: Empirical relationships between compressive strength and dynamic elastic andshear modulus of concrete
Test Conditions
cement w/c temp.Reference Relationshiptype -ratio (°C)
other
Han and Kim 0.4
(2004)Ed = 8.8769f0.3982
c I–0.5
23 –
Jin and Li 0.5,
(2001)Ed = 7.077f0.4467
c I0.6
21 –
Gardner 0.35, 0, 10, also fly ash
(1990)Ed = 13f
1/3c I, III
0.55 20, 30 concrete
Hansen 0.4 paste vol.
(1986)Ed = 8.1706f0.46
c I–0.6
2132%
Swamy and Rigby Ed = 5.895f0.5c 0.37 conc. age
(1971) Gd = 2.408f0.5c
n/a–0.87
2028–56 d
Units: fc in MPa and Ed and Gd in GPa

116 6 Monitoring Early Age Properties of Cementitious Materials
Tab. 6.7: Mixture composition of the concrete tested atisothermal conditions
Concrete A Concrete C
cement 1a 1b
water 0.55 0.32
fine aggregatesc 1.98 1.65
coarse aggregates 3.32d 1.96e
high range water reducer – 0.017
vicosity modifier – 0.003
paste volume 31.7% 32.4%
aType I bType III criver sanddcrushed limestone, max. size 24 mm dgravel
and the dynamic modulus of elasticity (fc–Ed-relationship) that resulted fromsome of the most recent investigations along with the references and the condi-tions under which the fc–Ed-relationships were determined are given in table 6.6.Only two references, Swamy and Rigby (1971) and Klieger (1957), where foundthat also investigated the dynamic shear modulus and its dependency from thecompressive strength (fc–Gd-relationship). The fc–Gd-relationship for concretefound by Swamy and Rigby , which is also given in table 6.6, is valid for concreteat ages between 28 and 56 days. Given the fact that the shear modulus derivedfrom the reflection loss is a dynamic modulus, the compressive strength data willbe converted into dynamic moduli values in the further analysis. This eliminatesthe need to convert the static elastic moduli values that would be obtained fromthe fc–Es-relationships given in the design codes into dynamic values.
Two concretes with different w/c-ratios will be investigated. The mix propor-tions of the tested concretes are given in table 6.7. Both concretes were curedat controlled temperature conditions (Concrete A: 30°C, Concrete B: 25°C). Thecompressive strength of the concretes was determined on cylindrical specimens asdescribed in section 5.2, page 78. The development of the compressive strength ofthe two conretes is given in figure 6.25. It can be seen that the concrete with thelower w/c-ratio of 0.32 has significant higher strength values. In figure 6.26 thefc–Ed relationships from table 6.6 for the compressive strength range that appliesto the two tested concrete mixtures is shown. The predictions have a rather largedeviation, which can be attributed to the fact that the used fc–Ed relationshipshave been determined for concretes with varying mix proportions. However, in
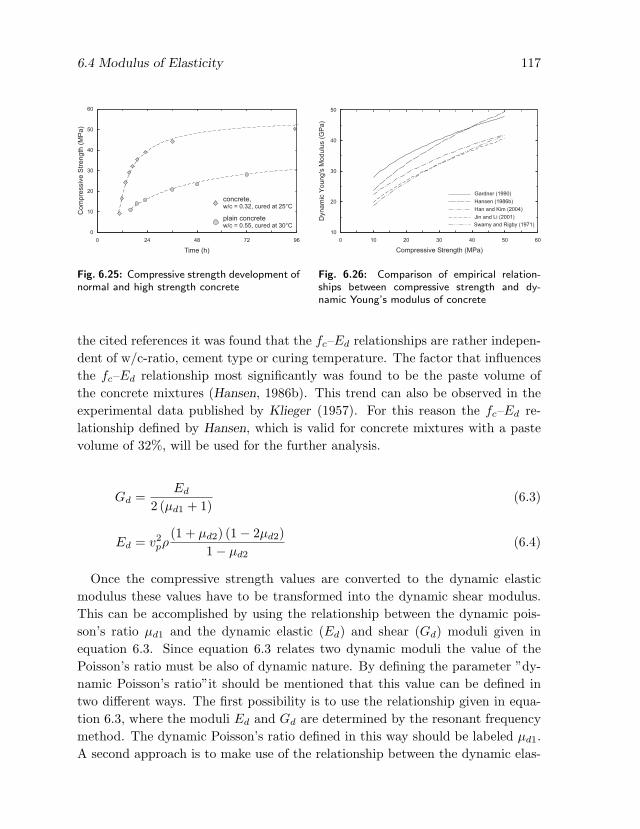
6.4 Modulus of Elasticity 117
0
10
20
30
40
50
60
0 24 48 72 96
Time (h)
Co
mp
ressiv
eS
tre
ng
th(M
Pa
)
plain concretew/c = 0.55, cured at 30°C
concrete,w/c = 0.32, cured at 25°C
Fig. 6.25: Compressive strength development ofnormal and high strength concrete
10
20
30
40
50
0 10 20 30 40 50 60
Compressive Strength (MPa)
Dyn
am
icY
ou
ng
'sM
od
ulu
s(G
Pa
)
Swamy and Rigby (1971)
Gardner (1990)
Hansen (1986b)
Han and Kim (2004)
Jin and Li (2001)
Fig. 6.26: Comparison of empirical relation-ships between compressive strength and dy-namic Young’s modulus of concrete
the cited references it was found that the fc–Ed relationships are rather indepen-dent of w/c-ratio, cement type or curing temperature. The factor that influencesthe fc–Ed relationship most significantly was found to be the paste volume ofthe concrete mixtures (Hansen, 1986b). This trend can also be observed in theexperimental data published by Klieger (1957). For this reason the fc–Ed re-lationship defined by Hansen, which is valid for concrete mixtures with a pastevolume of 32%, will be used for the further analysis.
Gd =Ed
2 (µd1 + 1)(6.3)
Ed = v2pρ
(1 + µd2) (1− 2µd2)1− µd2
(6.4)
Once the compressive strength values are converted to the dynamic elasticmodulus these values have to be transformed into the dynamic shear modulus.This can be accomplished by using the relationship between the dynamic pois-son’s ratio µd1 and the dynamic elastic (Ed) and shear (Gd) moduli given inequation 6.3. Since equation 6.3 relates two dynamic moduli the value of thePoisson’s ratio must be also of dynamic nature. By defining the parameter ”dy-namic Poisson’s ratio”it should be mentioned that this value can be defined intwo different ways. The first possibility is to use the relationship given in equa-tion 6.3, where the moduli Ed and Gd are determined by the resonant frequencymethod. The dynamic Poisson’s ratio defined in this way should be labeled µd1.A second approach is to make use of the relationship between the dynamic elas-

118 6 Monitoring Early Age Properties of Cementitious Materials
tic modulus and the P-wave velocity vp as given in equation 6.4. The dynamicPoisson’s ratio that can be derived by solving this equation should be labeled µd2.
Several investigations studying the evolution of the dynamic Poisson’s ratio(µd1 and µd2) and its dependency on factors such as mix proportion and cur-ing have been conducted. In an early work Simmons found a linear relationshipbetween the two dynamic Poisson’s ratio values µd1 and µd2 and the dynamicmodulus of elasticity of concrete (Simmons, 1955), where the Poisson’s ratiovalues decrease with increasing modulus of elasticity. The dynamic values ofthe Poisson’s ratio were also compared to those determined by the direct staticmethod (µs). It was found that the Poisson’s ratio obtained from the dynamicmoduli Ed and Gd are intermediate between those obtained from static measure-ments and those determined from P-wave velocity and dynamic elastic modulus(µs < µd1 < µd2). These results were confirmed later by Anson and Newman
(1966) and Swamy (1971). However, Swamy could not verify the linear relation-ship between dynamic Poisson’s ratio and dynamic elastic modulus as found bySimmons. The general trend initially determined by Simmons could still be ob-served, but influences such as w/c-ratio, aggregate type and content, and curingconditions caused significant scatter within the data. Based on the cited refer-ences and a recent study conducted by Jin and Li (2001) it can be concludedthat for early age concrete that is considered here (0-3 days) the values of thedynamic Poisson’s ratio µd1 range from 0.24 to 0.18 and those for µd2 from 0.3to 0.26. The dynamic Poisson’s ratio µd1 that will be used in equation 6.3 forcalculating the dynamic shear modulus will be approximated with 0.2.
In figure 6.27 the dynamic shear moduli derived from the compressive strength(Gd,fc
) and the WR-measurements (Gd,WR) are plotted for both concrete mix-tures. By comparing both shear moduli for a given concrete mixture it is obviousthat both curves follow quantitatively the same trend. The rate of increase ofboth moduli is practically identical during the entire period of time investigated,which is proven by the linear relationship between the parameters Gd,fc
andGd,WR for the concrete with the w/c-ratio of 0.32 given in figure 6.28. A similarlinear relationship was found for the second concrete mixture.
Additionally, from figure 6.27 can be seen that for a given concrete compositionthe two dynamic shear moduli Gd,fc
and Gd,WR differ significantly in their ab-solute value. The shear modulus Gd,fc
calculated from the compressive strengthis always larger than the shear modulus Gd,WR derived from the reflection lossmeasurements. To quantify this phenomenon the values of the modulus ratioGd,WR/Gd,fc
were calculated for both concretes and plotted in dependency from

6.4 Modulus of Elasticity 119
0
5
10
15
20
25
0 12 24 36 48 60 72
Time (h)
Dyn
am
icS
he
ar
Mo
du
lus
(GP
a)
w/c = 0.32
w/c = 0.55
G from compressive strength
G from reflection loss
Fig. 6.27: Comparison of the dynamic shear modulus cal-culated from reflection loss and compressive strength fortwo concrete compositions
G(G
Pa)
d,W
R
G (GPa)d,fc
2
4
6
8
10
9 11 13 15 17 19 21
R = 0.97712
Fig. 6.28: Relationship between dy-namic shear moduli Gd,fc and Gd,WR
the absolute shear modulus of the concrete (fig. 6.29). The figure shows thatshear modulus Gd,WR ranges between values equal to 26% (at ca. 20 hours) and50% (at ca. five days) of shear modulus Gd,fc . To explain the rather large dif-ference between the shear moduli Gd,fc
and Gd,WR the obtained results will becompared to investigations conducted by Swamy and Rigby (1971). In this studythe dynamic elastic and shear moduli of different concretes, mortars and cementpastes were determined by the resonant frequency method. From the data pub-lished by Swamy and Rigby the ratios of the dynamic shear moduli of cementpaste and mortar and the corresponding concrete composition with a w/c-ratioof 0.45 were calculated. The ratios, which are plotted in figure 6.29, are basedon measurements obtained at ages between one and five days.
The presented data show that the modulus ratio Gd,WR/Gd,fc for the two testedconcretes ranges between the modulus ratios calculated from Swamy and Rigby ’sdata. This observation allows to infer further information about the nature ofthe dynamic shear modulus Gd,WR that is measured by the WR-method. Fromfigure 6.29 follows that the shear modulus Gd,WR is in similar relation to shearmodulus Gd,fc
as the shear moduli of cement paste and mortar are to the shearmodulus of the corresponding concrete tested by Swamy and Rigby . Thus, theshear modulus Gd,WR can be considered to represent the properties of the cementpaste or mortar phase of the tested concrete mixtures. This seems evident sincethe reflections of the shear waves at the steel-concrete interface monitored bythe WR-method are most likely influenced by the local properties of the cementpaste or mortar located immediately next to the steel plate.

120 6 Monitoring Early Age Properties of Cementitious Materials
Mo
du
lus R
atio
Gd,paste
Gd,concrete
modulusratios
Gd,WR
Gd,fc
0.20
0.30
0.40
0.50
0.60
0.70
8 10 12 14 16 18 20 22
Dynamic Shear Modulus (GPa)
Gd,mortar
Gd,concrete
w/c
key
0.450.320.55
sourceSwamy and Rigby
(1971)
Fig. 6.29: Ratio of dynamic shear moduli Gd,WR/Gd,fc of the tested concretes compared to theratio of dynamic shear moduli of cement paste or mortar and corresponding concrete taken fromSwamy and Rigby (1971)
6.4.3 Dynamic Shear Modulus determined by Sonic Measurements
In the previous section reflection loss measurements on concrete were conductedto investigate if these measurements can be used to calculate the dynamic shearmodulus of the tested material. The dynamic shear modulus derived from theWR-measurements (Gd,WR) was compared to the dynamic shear modulus calcu-lated from the compressive strength (Gd,fc) of the investigated concretes. Para-meter Gd,fc
was obtained using empirical relationships between the compressivestrength and the dynamic elastic modulus of concrete. To further verify theability of the WR-method to monitor the evolution of the dynamic shear modu-lus of cement-based materials, experiments have been conducted to complementthe WR-measurements with other independent techniques that directly measurethe dynamic shear modulus. The applied techniques are the forced resonancemethod and the pulse velocity method. Compared to static test methods thesalient advantage of these techniques is their nondestructive nature, which allowsperforming repeating tests on always the same specimen throughout the entirehardening process. Dynamic tests are also performed at a much lower stress andstrain level than static tests, which eliminates the influence of creep and inelasticdeformation occurring during the loading/unloading procedure of static tests.
As a result of the investigations described in the previous section it was foundthat the reflection loss measurements on concrete are obviously governed by thedynamic shear modulus of the cement paste or mortar that are located next to thesteel plate used for the measurements. To exactly determine which constituent of

6.4 Modulus of Elasticity 121
12 24 36 48 60 72 84 96 108
Time (h)
2
3
4
5F
requency
(kH
z)
0
25
50
75
100
Amplitude(arbitrary)
Fig. 6.30: Evolution of the torsional resonant frequency spectrum of cement mortar with w/c = 0.6
the tested material influences the reflection loss measurements, experiments withcement paste and mortars with different w/c-ratios were conducted (see tab. 6.1,p. 94 for the exact mix proportions).
The forced resonance method and the pulse velocity method are described indetail in section 5.6, page 80 and section 5.7, page 82, respectively. The measure-ments of the fundamental longitudinal and torsional resonant frequencies werestarted as soon as the tested mortars had reached sufficient strength to be re-moved from the molds. The dynamic shear modulus that is calculated from thetorsional resonant frequency with equation 5.2 will be labeled Gd,RF . To obtainthe dynamic shear modulus from the pulse velocity method shear waves with afrequency of 2.25 MHz were used. Data about the shear modulus are availablebeginning at that time when the hydration progress of the mortars allowed theshear waves to propagate through the mortar sample. The dynamic shear mod-ulus is calculated from the pulse velocity of shear waves with equation 5.4 willbe labeled Gd,PV .
The evolution of the torsional resonant frequency spectrum of the mortar withw/c = 0.6 as the immediate result of the forced resonance method conductedin torsional mode is given in figure 6.30. It can be seen that the fundamentaltorsional resonance frequency increases with a very high rate in the first 24 to 36hours after casting.
The results of the measured dynamic shear moduli of the tested cement pasteand mortar mixtures are given in figures 6.31a–c. Three values of the dynamicshear modulus of the mortars were determined from the results of the WR-method, the forced resonance method, and the pulse velocity method. The dy-

122 6 Monitoring Early Age Properties of Cementitious Materials
0
3
6
9
12
15
18
0 12 24 36 48 60 72
Time (h)
w/c = 0.35 Gd,RF
Dyn
am
ic S
he
ar
Mo
du
lus (
GP
a)
(a)
Gd,PV
Gd,WR
Gd,RF (paste)
0
3
6
9
12
15
18
0 12 24 36 48 60 72
Time (h)
Dynam
ic S
hear
Modulu
s (
GP
a)
w/c = 0.5
(b)
Gd,RF
Gd,PV
Gd,WR
Gd,RF (paste)
0
3
6
9
12
15
18
0 12 24 36 48 60 72
Time (h)
Dynam
ic S
hear
Modulu
s (
GP
a)
w/c = 0.6
(c)
Gd,RF
Gd,PV
Gd,WR
Gd,RF (paste)
Fig. 6.31: Comparison of the dynamic shear moduli of mortars and the corresponding cement pastesobtained from the wave reflection, pulse velocity and forced resonance method
namic shear modulus of the cement paste was measured using the forced reso-nance method only and is given as a control value. By comparing the differentvalues of the dynamic shear modulus for a given mortar mixture can be notedthat the curves for Gd,WR, Gd,RF and Gd,PV have very similar shapes. The threemoduli start to increase at approximately the same time and also the time whenthe moduli start to approach their final values is similar. Furthermore, it can beseen that for all three mortars the shear moduli Gd,PV and Gd,RF , determinedwith the pulse velocity and forced resonance method, are almost equal. The shearmodulus Gd,WR, derived from the WR-reflection measurements, has always sig-nificantly lower values ranging close to the shear modulus of the corresponding
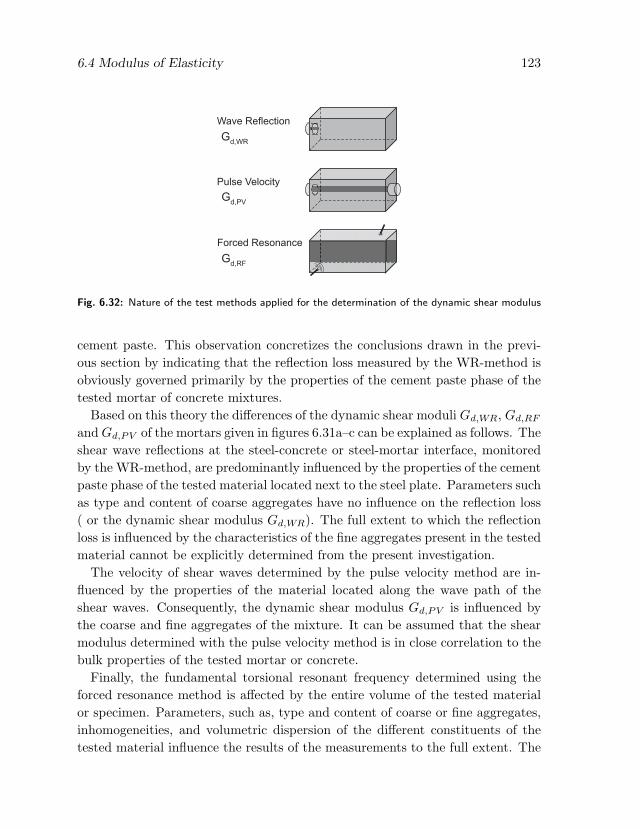
6.4 Modulus of Elasticity 123
Gd,WR
Pulse Velocity
Wave Reflection
Forced Resonance
Gd,PV
Gd,RF
Fig. 6.32: Nature of the test methods applied for the determination of the dynamic shear modulus
cement paste. This observation concretizes the conclusions drawn in the previ-ous section by indicating that the reflection loss measured by the WR-method isobviously governed primarily by the properties of the cement paste phase of thetested mortar of concrete mixtures.
Based on this theory the differences of the dynamic shear moduli Gd,WR, Gd,RF
and Gd,PV of the mortars given in figures 6.31a–c can be explained as follows. Theshear wave reflections at the steel-concrete or steel-mortar interface, monitoredby the WR-method, are predominantly influenced by the properties of the cementpaste phase of the tested material located next to the steel plate. Parameters suchas type and content of coarse aggregates have no influence on the reflection loss( or the dynamic shear modulus Gd,WR). The full extent to which the reflectionloss is influenced by the characteristics of the fine aggregates present in the testedmaterial cannot be explicitly determined from the present investigation.
The velocity of shear waves determined by the pulse velocity method are in-fluenced by the properties of the material located along the wave path of theshear waves. Consequently, the dynamic shear modulus Gd,PV is influenced bythe coarse and fine aggregates of the mixture. It can be assumed that the shearmodulus determined with the pulse velocity method is in close correlation to thebulk properties of the tested mortar or concrete.
Finally, the fundamental torsional resonant frequency determined using theforced resonance method is affected by the entire volume of the tested materialor specimen. Parameters, such as, type and content of coarse or fine aggregates,inhomogeneities, and volumetric dispersion of the different constituents of thetested material influence the results of the measurements to the full extent. The

124 6 Monitoring Early Age Properties of Cementitious Materials
dynamic shear modulus Gd,RF determined using the forced resonance methodrepresents the bulk properties of the tested material or specimen. The nature ofthe three applied test methods as described above is schematized in figure 6.32.
6.5 Direct Measures of Cement Hydration
6.5.1 General Remarks
In this section it will be investigated how the WR-measurements are related tothe hydration process of cement-based materials as indicated by different directmeasures of cement hydration. A profound analysis of the capabilities of the WR-method requires such fundamental investigations that are essential for developingan understanding of the physical relationships between the reflection loss andbasic material parameters of cement paste, mortar and concrete. Several methodshave been established and proven to be a direct measure of cement hydration.In the following sections the amount of the non-evaporable water, the amount ofcalcium hydroxide, and the chemical shrinkage of Portland cement paste will beinvestigated and related to the corresponding WR-measurements.
6.5.2 Amount of Non-Evaporable Water
The hydration of cement is a chemical reaction between the constituents of ce-ment and the mixing water. The amount of the water that becomes part of thevarious hydration products increases with time and the total amount of waterthat can react with one gram of cement is limited to a certain value. Thus, bydetermining the amount of the water that has reacted with the cement at anygiven time the progress of the cement hydration can be assessed. One commonmethod to measure this quantity is to revert the hydration process by exposingdried, hydrated cement paste to high temperatures. Due to the decomposition ofthe various hydration products the sample undergoes a weight loss, which, whentaken in its total, equals to the amount of the non-evaporable water held in thecement paste at the time of testing (see sec. 5.8, p. 84 for exact determination).The amount of non-evaporable water is commonly considered as an approxima-tion of the chemically bound water, although much water from the interlayerspaces, which is by definition part of the chemically bound water, is lost duringthe drying process at 105°C (Taylor, 1997, pp. 121, 198).
The amount of non-evaporable water of cement pastes with the w/c-ratios 0.35,0.5 and 0.6 was determined by thermogravimetry according to the procedure de-

6.5 Direct Measures of Cement Hydration 125
0.0
0.1
0.2
0.3
0.4
0.5
0.6
0.7
0.8
1 10 100 1000 10000
Time (h)
De
gre
eo
fH
yd
ratio
n(-
)
w/c = 0.6
w/c = 0.5
w/c = 0.35
Portland Cement Pasteisothermal curing 25°C
Fig. 6.33: Development of the degree of hydration of cement pastes determined from the non-evaporable water content
rived by Powers (1949) (see also sec 5.8.2 and app. A.2). Using the amount ofnon-evaporable water that is held in the paste at complete hydration the degreeof hydration can calculated from the results of the TG-measurements using equa-tions 5.7 and 5.9 (pages 86 and 87). The development of the degree of hydrationof the pastes is given in figure 6.33. Since the tested mortars contain pure silicasand, which does not have any water absorption, the hydration behavior of pasteand mortar with the same w/c-ratio can be considered as identical. Hence, for agiven w/c-ratio the degree of hydration measured on the paste will be consideredas the degree of hydration of the mortar.
The direct comparison of the degree of hydration of the cement pastes andthe reflection loss measured on the corresponding mortar mixtures is given in
0
1
2
3
4
5
1 10 100 1000
Time (Hours)
Re
fle
ctio
nL
oss
(dB
)
0.0
0.1
0.2
0.3
0.4
0.5
0.6
De
gre
eo
fH
yd
ratio
n(-
)
Reflection Loss
Degree of Hydration
Portland cement mortarw/c = 0.35
0
1
2
3
1 10 100 1000
Time (Hours)
Re
fle
ctio
nL
oss
(dB
)
0.0
0.1
0.2
0.3
0.4
0.5
0.6
De
gre
eo
fH
yd
ratio
n(-
)
Reflection Loss
Degree of Hydration
Portland cement mortarw/c = 0.5
Fig. 6.34: Reflection loss and degree of hydration for mortar with different w/c-ratios

126 6 Monitoring Early Age Properties of Cementitious Materials
0
1
2
3
4
0.0 0.1 0.2 0.3 0.4 0.5 0.6 0.7
Degree of Hydration (-)
Re
fle
ctio
nL
oss
(dB
)
1: w/c = 0.35, R = 0.99582: w/c = 0.50, R = 0.99333: w/c = 0.60, R = 0.9841
2
2
2
1
2
3
Portland cement mortar
Fig. 6.35: Correlation of reflection loss and degree of hydration for w/c = 0.35, 0.5 and 0.6
figure 6.34 for the w/c-ratios of 0.35 and 0.5. It can be seen from the figurethat both quantities develop after almost the same trend over the time period ofapproximately 80 hours. The relationship between the degree of hydration andthe reflection loss for all tested w/c-ratios is given in figure 6.35. For each w/c-ratio, the presented data exhibit a very strong linear trend over the entire periodof time that is plotted. The coefficients of determination R2 of the plotted trendlines are given in the figure to illustrate the statistical significance of the trends.It is emphasized that the given relationships do not show a bilinear pattern as itwas observed for relationship between compressive strength and reflection loss.The fact that a single linear trend line is valid for the entire period of time shownin the graph indicates that the degree of hydration and reflection loss have amore fundamental relationship.
By comparing the relationships of the different w/c-ratios, it can be seen thatthe slope of the relationship changes with the w/c-ratio, where a low w/c-ratiocorresponds to a high slope. In other words, for a given degree of hydration, thereflection loss of the mortar with w/c = 0.35 is higher than the reflection lossof the mortar with, for example, w/c = 0.6. This variation is most likely dueto the different microstructural properties of the mortars caused by the differentw/c-ratios and will be investigated further in Chapter 6.6.
6.5.3 Amount of Calcium Hydroxide
Besides the calcium silicate hydrates (C-S-H) calcium hydroxide (Ca(OH)2 orCH), which is also referred to as Portlandite, is a major component of the hy-

6.5 Direct Measures of Cement Hydration 127
350 380 410 440 470 500
Temperature (°C)
2.4 h
6.1 h
11.7 h
24.0 h
53.7 h
DTG-curvesPortland cement pastew/c = 0.50
Derivative o
fT
G-D
ata
(arb
itra
ry)
Fig. 6.36: Development of the decomposition of calcium hydroxide characterized by the derivativeof TG-curves
dration products and occupies about 20% to 25% of the solid volume of cementpaste (Mindess et al., 2003, p. 73). The amount of CH held in cement paste ata given time is widely regarded as a measure of the degree of hydration of thatmaterial. El-Jazairi and Illston (1980) have shown that the content of calciumhydroxide and non-evaporable water follow very similar trends during the courseof hydration. In a study conducted by Mounanga et al. (2004) on cement pasteswith various w/c-ratios at a range of different temperatures it was found thatthe CH content is uniquely related to the degree of hydration determined fromthe non-evaporable water content. Further investigations that use the contentof free CH to characterize the hydration of Portland cement were conducted byBhatty and Reid (1985), Bhatty et al. (1986) and Midgley (1979). Given thisbackground, it will be of interest how the development of the amount of calciumhydroxide over time is related to corresponding wave reflection measurements.

128 6 Monitoring Early Age Properties of Cementitious Materials
0.00
0.05
0.10
0.15
0.20
0.25
0 24 48 72 96 120 144 168
Time (h)
fre
eC
a(O
H) 2
Co
nte
nt(g
/gce
me
nt)
Portland cement paste
isothermal curing, 25°C
Dispersion Model
()( )( )0
0,chch
ttk1
ttkStS
-+
-= ¥
w/c = 0.35
w/c = 0.6
w/c = 0.5
measured by
thermogravimetry
Fig. 6.37: Evolution of Ca(OH)2-content of cement pastewith different w/c-ratios determined with thermogravime-try
0.00
0.05
0.10
0.15
0.20
0.25
0 1 2 3 4
Reflection Loss (dB)
Ca
(OH
) 2C
on
ten
t(g
/gce
me
nt)
�
�
�
w/c = 0.60: R = 0.9899
w/c = 0.50: R = 0.9979
w/c = 0.35: R = 0.9942
2
2
2
Portland cement paste
isothermal curing, 25°C�
�
�
fre
e
Fig. 6.38: Relationship betweenCa(OH)2-content (paste) and reflectionloss (mortar)
The amount of the free CH in cement pastes with w/c-ratios of 0.35, 0.5 and0.6 was determined with TG-measurements using the procedure described insection 5.8.3. The free CH has a crystalline morphology and describes thatpart of the CH present in the paste that has not reacted with carbon dioxide(CO2) to calcium carbonate (CaCO3). Evidence of free CH can be found fromTG-measurements through a distinct drop of the weight loss curve in the tem-perature range of about 380°C to 500°C. Derivative thermogravimetric (DTG)curves for cement paste with a w/c-ratio of 0.5 for different ages are given infigure 6.36. These curves clearly show the increasing amount of free CH withtime that is decomposing during the specified temperature range (dehydroxyla-tion). The quantitative development of the free CH in gram per gram of originalcement in time for the three tested pastes is given in figure 6.37. The plottedvalues were calculated from the results of the TG-measurements using the leftpart of equation 5.14, incorporating the weight loss of the paste during the de-hydroxylation period only. The data show that due to the higher availability ofwater the CH content for higher w/c-ratios ranges on higher values, indicating afaster progress of cement hydration in these mixtures.
The relationship between the free CH content of the cement pastes and thereflection loss measured on mortars with the corresponding w/c-ratios is givenin figure 6.38. Similar to the degree of hydration determined from the non-evaporable water content, the free CH content has a linear relationship to thereflection loss for early ages (3–4 days). The slope of the derived trend lines show

6.5 Direct Measures of Cement Hydration 129
again a distinctive dependency on the w/c-ratio. This shows that, despite thestrong linearity of the trend lines, the progress of cement hydration cannot beused solely to explain the development of the reflection loss.
6.5.4 Chemical Shrinkage
In this section the relationship between chemical shrinkage and reflection loss ofcementitious materials will be investigated. The chemical shrinkage was mea-sured with the dilatometric method described in section 5.9, page 89. The inves-tigations described in the following were conducted since the chemical shrinkageof Portland cement has been shown to be a sensitive indicator of the progress ofthe cement hydration. In various studies it was found that the chemical shrinkageof Portland cement develops in close correlation with the compressive strength,the heat of hydration, and the non-evaporable water content of cement pasteand mortar (Jung , 1974; Knudsen and Geiker, 1982; Geiker, 1983). In studiescomparing the sensitivity of different methods to the cement hydration it wasalso found that the chemical shrinkage is in linear relationship to the degree ofhydration determined by quantitative X-ray diffraction analysis (Parrott et al.,1990).
The development of the chemical shrinkage of cement pastes with w/c-ratios of0.35, 0.5 and 0.6 is given in figure 6.39. In subfigure a it is shown that the generaldevelopment of the shrinkage data obtained from the conducted experimentscan be explained by the dispersion model, which was already shown by Geiker
(1983). By further analysing the curves for the different w/c-ratios at ages greaterthan 24 hours, it can be observed that cement paste with a lower w/c-ratio
0
1
2
3
4
5
0 24 48 72 96 120 144 168
Time (h)
Ch
em
ica
lS
hri
nka
ge
(ml/1
00
g)
Portland cement paste
isothermal curing, 25°C
Dispersion Model
()( )( )0
0,chch
ttk1
ttkStS
-+
-= ¥
w/c = 0.35
w/c = 0.6
w/c = 0.5
measured by dilatometry
sample height: 3.5 cm
0.0
0.2
0.4
0.6
0.8
3 4 5 6 7 8
Time (h)
Ch
em
ica
lS
hri
nka
ge
(ml/1
00
g)
Portland cement paste
isothermal curing, 25°C
Power Law
Dispersion Model
w/c = 0.35
w/c = 0.50
w/c = 0.60
S =atchb
Fig. 6.39: Development of chemical shrinkage of Portland cement pastes with different w/c-ratios

130 6 Monitoring Early Age Properties of Cementitious Materials
exhibits also a lower chemical shrinkage. This agrees with results published forexample by Powers (1935), Czernin (1962), and Geiker and Knudsen (1982).The development of the chemical shrinkage within the first eight hours is givenin figure 6.39b. It can be seen that similar to the reflection loss the chemicalshrinkage also starts to increase following a power law trend.
Several references can be found that have investigated the influence of thesample size (height) of the tested cement paste on the final value of the chem-ical shrinkage (Geiker, 1983; Tazawa et al., 1995; Boivin et al., 1999). It wasfound that for low w/c-ratios (w/c ≤ 0.3) the chemical shrinkage decreases withincreasing sample height. This effect is due to a lower permeability of the pastepreventing the water to permeate through the sample and fill the pores created bythe self-desiccation. This effect was not observed for w/c-ratios equal or greaterthan 0.4. Based on these investigations, the paste with w/c = 0.35 tested herehas the potential to be influenced by this size effect. However, the data givenin Geiker (1983) indicate that the decrease of the chemical shrinkage is mostsignificant at ages greater than three days and for sample heights greater than 3cm. In the study presented here, the sample height was always 2.5 cm and chem-ical shrinkage data of the first three days will be used for comparison with thereflection loss data. Under these conditions, the influence of the sample heighton the development of the chemical shrinkage can assumed to be minor.
The relationships between the chemical shrinkage of the cement pastes and thereflection loss measured on mortars containing the corresponding paste is givenin figure 6.40 (see tab. 6.1, p. 94 for mix proportions). The figure shows thatboth parameters are related by a strong linear trend that applies to the entireperiod that was investigated. The R2-values for the plotted trend lines are givenin the figure to illustrate the statistical significance of the trends. The closecorrelation between the chemical shrinkage and the reflection loss, expressed bythe linear trends, validates the previously presented results, which show that theWR-measurements are governed by basic parameters that are intimately relatedto the hydration process.
The plotted data also show that the w/c-ratio influences the slope of the lineartrends, where a low w/c-ratio corresponds to a small slope. A similar dependencybetween the slope of the trend lines and the w/c-ratio was already found for therelationship between the degree of hydration and reflection loss investigated insection 6.5.2. This observation again indicates that the reflection loss is influencedby characteristics of the cementitious microstructure that cannot be described bythe chemical shrinkage only.
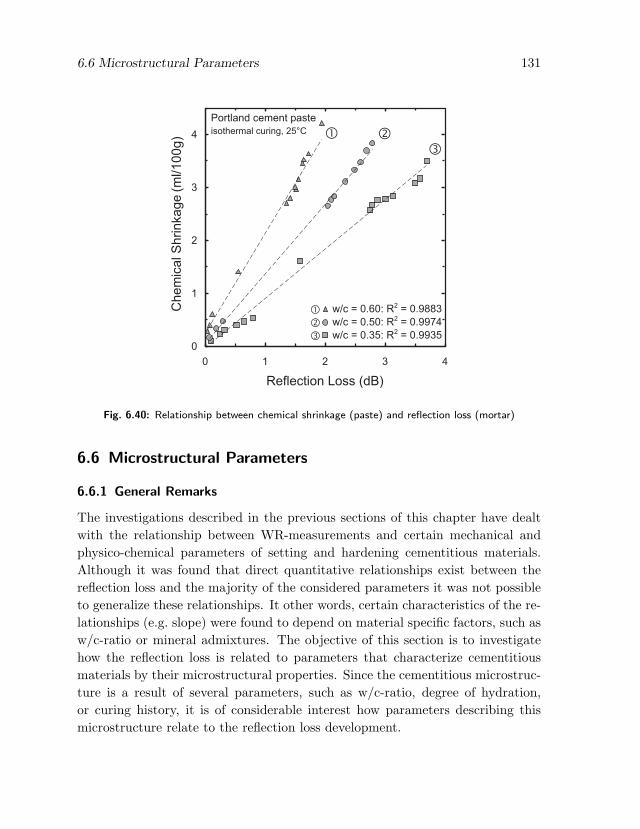
6.6 Microstructural Parameters 131
0
1
2
3
4
0 1 2 3 4
Reflection Loss (dB)
Ch
em
ica
lS
hri
nka
ge
Portland cement paste
isothermal curing, 25°C
�
�
�
w/c = 0.50: R = 0.99742
w/c = 0.60: R = 0.9883
w/c = 0.35: R = 0.9935
2
2
�
�
�
(ml/1
00
g)
Fig. 6.40: Relationship between chemical shrinkage (paste) and reflection loss (mortar)
6.6 Microstructural Parameters
6.6.1 General Remarks
The investigations described in the previous sections of this chapter have dealtwith the relationship between WR-measurements and certain mechanical andphysico-chemical parameters of setting and hardening cementitious materials.Although it was found that direct quantitative relationships exist between thereflection loss and the majority of the considered parameters it was not possibleto generalize these relationships. It other words, certain characteristics of the re-lationships (e.g. slope) were found to depend on material specific factors, such asw/c-ratio or mineral admixtures. The objective of this section is to investigatehow the reflection loss is related to parameters that characterize cementitiousmaterials by their microstructural properties. Since the cementitious microstruc-ture is a result of several parameters, such as w/c-ratio, degree of hydration,or curing history, it is of considerable interest how parameters describing thismicrostructure relate to the reflection loss development.

132 6 Monitoring Early Age Properties of Cementitious Materials
0.0
0.2
0.4
0.6
0.8
1.0
1 10 100 1000
Degre
e o
f Hydra
tion
0.2
0.4
0.6
0.8
1.0
Mass P
erc
ent
Log Time (hours)
Unhydrated Cement
Capillary Water
Solid Hydration Products
w/c = 0.35
Gel Water
0
(a)
Degre
e o
f Hydra
tion
0.2
0.4
0.6
0.8
1.0
Mass P
erc
ent
Log Time (hours)
Unhydrated Cement
Solid Hydration Products
w/c = 0.50.0
0.2
0.4
0.6
0.8
1.0
1 10 100 1000
Capillary Water
Gel Water
0
(b)
0.0
0.2
0.4
0.6
0.8
1.0
1 10 100 1000
Ma
ss P
erc
en
t
Log Time (hours)
Unhydrated Cement
Solid Hydration Products
w/c = 0.6
Capillary Water
Gel Water
De
gre
e o
f Hyd
ratio
n
0.2
0.4
0.6
0.8
1.0
0
(c)
Fig. 6.41: Mass relationships among constituents and degree of hydration of the cement pastesduring hydration measured by TG
6.6.2 Capillary Porosity
In section 6.5 it was found that the reflection loss is linearly related to severaldirect measures of cement hydration. However, it was also found that the slope ofthis relationship strongly depends on the w/c-ratio of the investigated mixtures.Since the w/c-ratio has a major influence on the pore structure of the hardenedcement paste the relationship between capillary porosity and reflection loss willbe examined in this section.
From the TG-measurements the mass relationships among the constituents ofthe tested cement pastes, as shown in figure 6.41, can be derived in dependency

6.6 Microstructural Parameters 133
0.0
0.2
0.4
0.6
1 10 100 1000
Time (h)
Ca
pill
ary
Po
rosity
w/c = 0.6
w/c = 0.5
w/c = 0.35
PC-Mortar
w/c = 0.6
w/c = 0.5
w/c = 0.35
Fig. 6.42: Capillary porosity of cement pasteswith different w/c-ratios
0
1
2
3
4
0.2 0.3 0.4 0.5 0.6
Capillary Porosity (-)
w/c=0.35
w/c=0.50
w/c=0.60
Portland cement mortarhydration temperature: 25°C
Reflection L
oss (
dB
)
Fig. 6.43: Relationship between capillary poros-ity and reflection loss of cement pastes with dif-ferent w/c-ratios
from the different w/c-ratios. The weight fraction of the unhydrated cement caneasily be derived from the weight of the original cement and depends on the initialw/c-ratio, and the degree of hydration. At each time the sum of the mass of thecapillary and the gel water equals to the total amount of the evaporable water.The distinction between capillary and gel water cannot be made based on theresults of the TG. Thus, a relation derived from the Powers-Brownyard model(Powers and Brownyard, 1949) for the structure of hardened Portland cementpaste was used (eq. 6.5), where the weight of the gel water (wg) is defined as afraction of the non-evaporable water (wn). The Parameters a and k, which wereoriginally derived from water absorption studies on cement paste at differentvapor pressures are taken from the literature (Hansen, 1986a). The parameterscan be considered to be constant with a = 3.3 and k = 0.25.
wg = akwn (6.5)
From figure 6.41 it can be seen that the paste with w/c = 0.6 contains muchmore capillary water than the paste with, for example, w/c = 0.35. Since capil-lary water leads to the formation of capillary pores, both pastes have a differentcapillary porosity. The strong influence of the w/c-ratio on the development ofthe capillary porosity of the three pastes is given in figure 6.42. The porosityvalues were derived from the capillary water content measured by TG. It wouldnow be of interest to investigate how the differences in capillary porosity affectthe reflection loss measurements.
The relationship between both values for the three w/c-ratios is given in fig-

134 6 Monitoring Early Age Properties of Cementitious Materials
ure 6.43. It can be stated that the reflection loss strongly depends on the de-velopment of the capillary porosity for all three w/c-ratios. A decrease of thecapillary porosity due to hydration is followed by a steep increase of the reflec-tion loss. Except for very high porosities for w/c = 0.5 and 0.6 the presentedrelationships are dominated by a linear pattern. The horizontal shift of the threegraphs origins from the different initial values of the capillary porosity caused bythe w/c-ratio.
This example shows vividly how the reflection loss measured on the compositeof cement paste and sand is affected by the properties of the cement paste phase.The densification of the microstructure caused by the occupation of capillarypore space with hydration products improves the ability of the cement paste totransmit ultrasonic shear waves and thereby causes the measured reflection lossto increase. A similar relationship between the reflection loss and the relativedecrease of the capillary porosity of cement pastes with different w/c-ratios wasreported by Sun et al. (2004).
6.6.3 Gel-Space Ratio
To reveal and quantify the obviously existent relationship between reflection lossand porosity it is attempted to find a suitable parameter that can quantify theinfluence of degree of hydration and w/c-ratio on the capillary porosity of thecement paste. This can be accomplished by using a parameter commonly calledgel-space ratio as defined by Powers (1958a). The gel-space ratio describes towhat extent the available space is occupied by the gel, where available spaceis defined as the volume of the gel plus the volume of capillary pores. In thiscontext, the expression gel describes hydrated cement. For any given time t,the gel-space ratio X can be calculated with equation 6.6, with α as the degreeof hydration at time t and w/c as the original w/c-ratio. The devlopment ofthe gel-space ratio of the cement paste phase of the tested mortars is given infigure 6.44.
X (t) =volume of gel (incl. gel pores)
volume of gel + capillary pores=
0.68α (t)0.32α (t) + w/c
(6.6)
The relationship between the reflection loss and the gel-space ratio for thetested mortars is given in figure 6.45. It can be seen that the relation between re-flection loss and gel-space ratio for all three mortars can adequately be describedby a single trend line, which follows a power law. At this point it should be men-

6.7 Conclusions 135
0.0
0.1
0.2
0.3
0.4
0.5
0.6
0.7
0 24 48 72 96 120
Time (h)
Ge
l/S
pa
ce
Ra
tio
(-)
w/c = 0.35
w/c = 0.50
w/c = 0.60
Portland cement mortar
w/c = 0.35
w/c = 0.50
w/c = 0.60
Fig. 6.44: Gel-space ratio for mortars with w/c = 0.35,0.50, 0.60
0.0
0.1
0.2
0.3
0.4
0.5
0.6
0.7
0.0 1.0 2.0 3.0 4.0
Reflection Loss R (dB)L
Ge
l-S
pa
ce
Xa
tio
(-)
w/c = 0.35w/c = 0.50 R = 0.9671w/c = 0.60
2
R
X = 0.2716 RL0.6442
Fig. 6.45: Correlation of reflection lossand gel-space ratio
tioned, that a similar, power law-type, relationship between compressive strengthand gel-space ratio was found by Powers (1958a,b). The uniqueness of the re-lationship between reflection loss and gel-space ratio allows concluding that thereflection loss measured with shear waves is governed by physico-chemical para-meters of the cement paste, namely degree of hydration, porosity and w/c-ratio.
6.7 Conclusions
The investigations presented in this chapter have shown that the reflection lossmeasured with shear waves can be related to a number of important materialparameters of the tested mortars and concretes. These parameters describe theproperties of these materials from many different perspectives. The specific find-ings are summarized in the following paragraphs.
The reflection loss measured with the wave reflection method can be usedto qualitatively and quantitatively evaluate the setting behavior of cementitiousmaterials. The influence of temperature, w/c-ratio, and chemical admixtures onthe kinetics of the setting process are reliably indicated by the evolution of thereflection loss.
The reflection loss was found to be in close relationship with the evolution ofthe compressive strength of mortar and concrete and can be used to quantita-tively follow the compressive strength gain. Both parameters were found to bein bilinear relationship. For the case of the tested mortars this relationship isindependent of the w/c-ratio. When concrete or systems containing mineral ad-

136 6 Monitoring Early Age Properties of Cementitious Materials
mixtures are considered the relationship between reflection loss and compressivestrength cannot considered to be unique.
The reflection loss measured with shear waves is physically related to the dy-namic shear modulus of the tested materials. The shear modulus derived fromthe reflection loss was compared to shear moduli measured by complementary,independent test methods. This comparison has shown that the reflection lossis governed by the dynamic shear modulus of the cement paste phase of mortarand concrete.
The reflection loss measured on mortar was found to be directly and linearlyrelated to the progress of cement hydration as measured by several, well estab-lished parameters. The evaluated parameters are degree of hydration (derivedfrom the non-evaporable water content), calcium hydroxide content and chemicalshrinkage. The parameters of the linear trends are influenced by the w/c-ratio.
The reflection loss is intimately related to parameters directly describing themicrostructure of cementitious materials. The investigated parameters are cap-illary porosity and gel-space ratio. For the tested mortars it was found that therelationship between gel-space ratio and reflection loss is independent of the w/c-ratio. It can be concluded that the reflection loss can be considered as a directmeasure of the gradual evolution of solid microstructure caused by the hydratingcement particles.

Chapter 7
Numerical Simulation of Wave Reflection
Measurements
7.1 Introduction
7.1.1 Need for Numerical Simulation
In common engineering practice, concrete is usually characterized by its bulkproperties, such as compressive strength or shrinkage. In many cases these prop-erties are determined by means of indirect measurements and empirical relation-ships. However, fundamental investigations that are aimed at describing thephysical parameters of concrete as a result of its true microstructure rather thanrelying on empirical laws must consequently be based on properties derived fromthe micro- and nanostructure of the cement paste.
Following the argumentation of Garboczi (1993), cementitious materials arecomposite materials that exhibit a complex microstructure, which can be de-scribed by using a wide range of length scales. Concrete consists of mortar andaggregates with random features in the order of centimeters. Mortar can again besubdivided into cement paste and sand, which results in inhomogeneities of thesize of millimeters. Cement paste itself is a heterogeneous material that combinesunhydrated cement, C-S-H, CH and capillary pores. Here, the randomness canbe described on the level of micrometers. The C-S-H as the main phase of thecement paste is a highly heterogeneous material with complexities measured onthe nano scale level. Thus, the defined goal of relating properties and microstruc-ture of cement-based materials must be accomplished by spanning a wide rangeof length scales, covering several orders of magnitude.

138 7 Numerical Simulation of Wave Reflection Measurements
In fulfilling this task, numerical simulations using the computation power ofmodern computer technology can be very helpful. Since the mid-1980s several mi-crostructural and micromechanical models for the evolution of the microstructureof hydrating cementitious materials have been developed (see sec. 7.2, p. 138 fordetails). These models allow to effectively assess the properties of cement-basedmaterials based on their composition and curing history.
7.1.2 Objective
It is the objective of this chapter to employ numerical simulation methods thatcan model the hydration process of cement in order to determine properties of thecementitious microstructure. Starting from the results of the numerical simula-tions it will be investigated which microstructural changes caused by the cementhydration can be monitored with the WR-measurements. The goal of this partof the presented investigations is to establish relationships that make it possibleto obtain information of the evolution of the intrinsic microstructural propertiesof cement-based materials by analyzing the characteristics of the reflection lossdevelopment. Parameters such as volumetric distribution and connectivity of thesolid and pore phases are believed to be the major factors of the propagation andattenuation of high frequency shear waves and therefore governing parameters ofthe reflection loss.
7.2 Overview of Existing Computer-Based Models
7.2.1 General Overview
A comprehensive overview about numerical and computer modeling of cement-based materials is given by Garboczi and Bentz (1991); Bentz (1997) and Ye
(2003). The following paragraphs are partially adapted from these references.The first attempt to numerically simulate the microstructure of cement and con-crete was undertaken by Wittmann et al. (1985). The model, which is based ona finite element technique, does not treat the cement paste microstructure at afundamental level. The aggregates and cement paste matrix are represented bya grid of finite elements, which can be used to simulate elastic moduli, diffusionand thermal expansion coefficients of the model concrete.
A model that represents the microstructure of cement paste at the level of singlecement particles was developed by Jennings and Johnson (1986). In this modelspherical tricalcium silicate (C3S) particles are randomly arranged in a three-

7.2 Overview of Existing Computer-Based Models 139
dimenional space according to the w/c-ratio. At each hydration step a certainamount of the particles is converted to C-S-H causing the formation of hydrationshells around the particles. Additionally, calcium hydroxide (CH) crystals areallowed to nucleate and grow in the pore space. When, due to their growth,spherical particles overlap the overlap volume is redistributed over the particlesthat are part of the newly formed cluster. This model can be classified as acontinuum type model, which means that the microstructural features are repre-sented by defined geometrical objects (spheres) having specific center coordinatesand diameters.
A similar approach is used in the HYMOSTRUC model developed by van
Breugel (1991). Details about this model will be given in Section 7.2.3. Anotherapplication of the principle of continuum models was reported by Navi and Pignat
(1996, 1999). The model considers spherical particles of tricalcium silicate (C3S)that are placed in a three-dimensional body, where the pore spaces are filled withwater. Similar to the model of Jennings, these spheres grow during the hydratioprocess, gradually filling the available pore space. The phases that are presentin the hydrating microstructure are C3S, C-S-H, CH, water, and air. The modelwas extensively used for studying the connectivity of the capillary pore space andthe pore size distribution.
Maekawa et al. (1999, 2003) have developed a model named DuCOM (Durabi-lity of Concrete Model) that can be used to numerically determine cement hydra-tion, moisture transport and microstructure development as well as parametersrelevant for long term durability of concrete. The model assumes that the cementparticles are spherical and of the same size. The hydration process is simulatedbased on a particle expansion mechanism and a multi-component model for theheat of hydration of cement based on its clinker compounds. Compared to othermodels, DuCOM follows a more global approach that aims to study the durabil-ity of the material concrete as a results of its ingredient materials, environmentalconditions and size and shape of the structure that it forms. A description ofDuCOM is also available as an electronic monograph on the Internet (Maekawa
et al., 2004).A somewhat different type of a continuum-based model that generates the
microstructure of cement paste based on a mosaic method was introduced by Xi
et al. (1996). In this case a two-dimensional space is subdivided into polygonalsegments (called cells of the mosaic) by randomly intersecting lines. By assigningeach of these cells to one of a set of distinguishable colors a pattern is createdthat can be used to describe the two-dimensional distribution of a multi-phase

140 7 Numerical Simulation of Wave Reflection Measurements
composite material. The volume fraction of each phase is defined by a separateparameter whereas the particle size of the microstructure (containing all phases)is defined by a global parameter. This model can be transferred to a three-dimensional microstructure by using randomly intersecting planes that divide acubic body into sub-blocks. The model was successfully applied to characterizeand model the porosity of hardened cement paste determined from backscatteredelectron micrographs (Tennis et al., 1997). In this application the microstructureof cement paste was represented in two phases (e.g. pore and solid phase).
Another approach to simulate the hydration of cement-based materials and theresulting microstructure is to use digital image-based models. In these modelsthe cement particles are represented as a group of single elements (pixels). Thearrangement of these pixels in a two- or three-dimensional form can then be mod-ified after certain rules to simulate cement hydration. One example of this kindof model is the cement hydration model developed at the National Institute ofStandards and Technology (NIST), USA, which will be described in the followingsection.
A different application of a digital image-based model is reported by Tzschich-
holz et al. (1996). The model starts from a random, two-dimensional configura-tion (side length = 10 mm) of coarse grained unhydrous cement particles witha diameter of 500 µm. The hydration process is simulated based on diffusionalion transport and chemical dissolution-precipitation reactions. In contrast to themodel developed at NIST, where hydrate pixels perform a random walk untilthey touch another solid, the hydrates are considered immobile and the masstransport happens by the diffusion of ions. Besides the volume fraction of thecement gel, the model also allows the calculation of parameters, such as silicaand calcium ion concentrations.
7.2.2 CEMHYD3D (NIST)
A digital image-based computer model for simulating the hydration process ofPortland cement has been developed at the National Institute of Standards andTechnology (NIST), USA (Bentz and Garboczi, 1991). The latest significantupdate of the model has been reported by Bentz (1997). The model is under thename CEMHYD3D freely available to the general public in its version 2.0, whichwas released in April 2000. A detailed description of the principle and variousapplication possibilities of the hydration model is given by Bentz (2000). Thisreport is also available on the Internet as part of an electronic monograph dealingwith cement-based and general random porous materials (Garboczi et al., 2004).

7.2 Overview of Existing Computer-Based Models 141
(a) Three-dimensional microstructure (b) Two dimensional slice from 3-D mi-crostructure
Fig. 7.1: Digitized microstructure in the initial stage as used by CEMHYD3D (grey levels correspondto clinker phases of the cement and gypsum) (from Bentz, 2000)
The simulation process done by CEMHYD3D is based on a three-dimensionalrepresentation of cement particles and pore volume, where the particle size dis-tribution, the phase volume fractions and the phase surface-area fractions ofthe modeled cement correspond to those of the original cement (fig. 7.1). Thiscementitious microstructure in the unhydrated state is represented as a three-dimensional array of cubic volume elements, called pixels, with 100 pixels on aside (1 pixel = 1 µm). Based on the measured particle size distribution of thecement and the desired w/c-ratio, digitized spherical particles are then placedrandomly into the three-dimensional pixel body. In accordance with the gypsumvolume fraction of the used cement, these spheres are assigned to represent ei-ther cement or gypsum particles. Each pixel of the spheres representing a cementparticle is then assigned to one of the cement compounds C3S, C2S, C3A, andC4AF.
Once the microstructure of the unhydrated cement is generated the hydrationprocess is simulated by allowing the the dissolution, diffusion and reaction ofthe different cement compounds. These processes, which are implemented by acellular automata algorithm, follow a set of rules defining the phase transitions ofthe different cement compounds. The simulations are carried out by maintainingthe correct volume stoichiometry. This means that, for example, by dissolvingn pixel representing C3S 1.7n pixel of C-S-H and 0.61n pixel of CH are formed.The process is schematized in figure 7.2. Further details on the fundamental

142 7 Numerical Simulation of Wave Reflection Measurements
principles of the CEMHYD3D model can be found in the references given above.The hydration model has been used to determine various properties of ce-
mentitious microstructures. These properties range from the volume fractions,connectivity and percolation of the solid and pore phases, to hydration rate,chemical shrinkage and heat release. The model also allows the determination ofthe compressive strength of standard mortar cubes (ASTM C109) by using thegel-space ratio concept derived by Powers and Brownyard (1949). This conceptmakes use of the relationship between the gel-space ratio (eq. 6.6, p. 134) andmortar compressive strength that was found to be independent of the w/c-ratio.
The described CEMHYD3D model will be used in section 7.4 to validate theexperimental results of the degree of hydration, chemical shrinkage, and amountof calcium hydroxide. The three-dimensional microstructure generated by themodel will be used as input for finite element models to calculate the shearmoduli of the investigated cement pastes and mortars. The simulated shearmoduli values will be compared to those directly measured and those derivedfrom the reflection loss measurements.
7.2.3 HYMOSTRUC3D (TU Delft)
A numerical model HYMOSTRUC was developed to allow the simulation of thehydration process of Portland cement (van Breugel, 1991, 1995a,b; Koenders,1997). In this model, the degree of hydration is simulated as a function of theparticle size distribution and of the chemical composition of the cement, the w/c-ratio and the reaction temperature. HYMOSTRUC was extended to simulatethe microstructure of hydrating cement in three-dimensional form by Ye et al.
(2003b) (HYMOSTRUC3D). HYMOSTRUC3D models the hydrating cement
Fig. 7.2: Cellular automata algorithm (from Garboczi et al., 2004)

7.2 Overview of Existing Computer-Based Models 143
unhydratedcement
outer product
inner product
embeddedparticles
expansion caused byembedded particles
Fig. 7.3: Mechanism of expansion and embedding of cement particles due to formation of inner andouter hydration products (after van Breugel , 1991)
particles as growing spheres randomly distributed in a cubic three-dimensional(3-D) body (side length 100 µm). As cement hydrates, the cement grains gradu-ally dissolve and a porous shell of hydration products is formed around the grain.This results in an outward growth or expansion of the particles. The hydratesaround the cement grains first cause the formation of small isolated clusters. Bigclusters are formed when small cement particles become embedded in the outershell of other particles, which promotes the outward growth of these particles.As hydration progresses, the growing particles become more and more connected.The material evolves from the state of a suspension to the state of a porous elasticsolid. A schematic of the expansion and embedding process as the fundamentalprinciple of HYMOSTRUC is given in figure 7.3.
HYMOSTRUC3D assumes that the microstructure of hydrating cement pasteconsists of two major phases: the solid and the pore phase. The solid phase isformed by the hydration products (inner and outer) and the unhydrated cement.The remaining volume, which is not occupied by the solid phase, is the porephase and represents capillary pores that are filled with air or water. The three-dimensional visualization of the solid and pore phases is shown in figure 7.4. Thenumerical model allows the calculation of various parameters that describe theproperties of these two phases during the hydration of the cement. Ye et al. (2002,2003b) have derived various geometrical and topological parameters, such aspercolation threshold and connectivity of solid and pore phase, capillary porosity,and pore size distribution from the numerically simulated microstructures. Acritical comparison between parameters simulated with HYMOSTRUC3D andresults of experimental investigations on various cementitious materials can befound in Ye (2003).

144 7 Numerical Simulation of Wave Reflection Measurements
(a) Solid and capillary pore phase (b) Capillary pore phase
Fig. 7.4: Three-dimensional representation of cement paste microstructure calculated by HY-MOSTRUC3D
Within the scope of the investigations described here parameters characterizingthe volumetric distribution and the connectivity of the phases will be used. Thefollowing output parameters of the model will be analyzed:
• volume fraction of the total solid and pore phase,
• volume fraction of connected solid phase,
• percolation threshold of solid phase,
• specific contact area of cement particles.The volume fraction of the phases is the relative volume of the 3D-body shown
in figure 7.4 that is occupied by the solid or pore phase at a certain hydrationtime. The initial value of this parameter depends solely on the w/c-ratio ofthe simulated cement paste. The volume fraction of the connected solid phaserepresents the relative volume of the 3D-body that is occupied by solid particlesthat are continuously connected and thereby providing an uninterrupted linkbetween two opposite faces of the 3D-body. The percolation threshold is definedas the time when the first of those continuous links is created by the percolationprocess of the solid phase. The time of occurrence of the percolation thresholdis the time when the volume fraction of the connected solid phase increases to avalue larger than zero.
The distribution of unhydrated cement in the initial stage of hydration is givenin figure 7.5a in a two-dimensional (2D) form. This 2D-picture can be consideredas a slice taken from a cube as given in figure 7.4. The unhydrated cement in
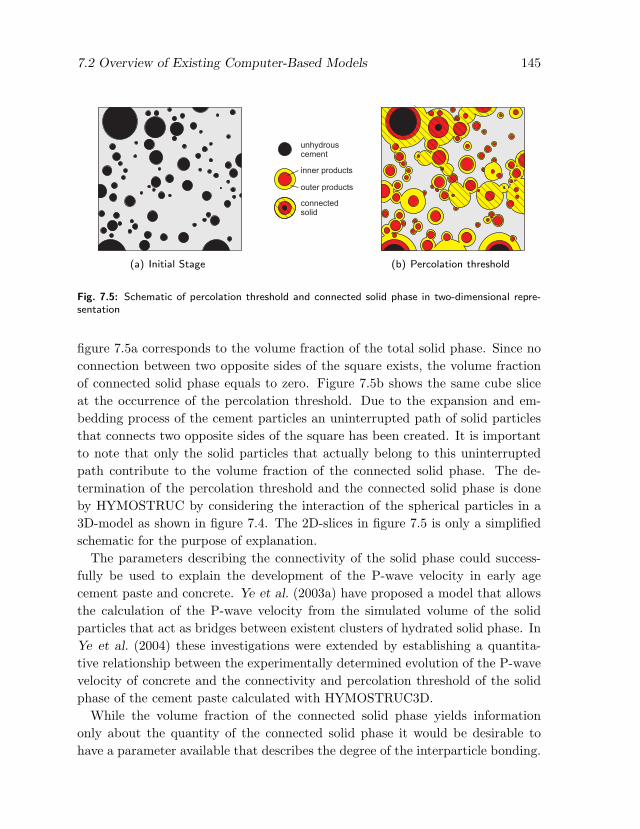
7.2 Overview of Existing Computer-Based Models 145
(a) Initial Stage
connectedsolid
unhydrouscement
inner products
outer products
(b) Percolation threshold
Fig. 7.5: Schematic of percolation threshold and connected solid phase in two-dimensional repre-sentation
figure 7.5a corresponds to the volume fraction of the total solid phase. Since noconnection between two opposite sides of the square exists, the volume fractionof connected solid phase equals to zero. Figure 7.5b shows the same cube sliceat the occurrence of the percolation threshold. Due to the expansion and em-bedding process of the cement particles an uninterrupted path of solid particlesthat connects two opposite sides of the square has been created. It is importantto note that only the solid particles that actually belong to this uninterruptedpath contribute to the volume fraction of the connected solid phase. The de-termination of the percolation threshold and the connected solid phase is doneby HYMOSTRUC by considering the interaction of the spherical particles in a3D-model as shown in figure 7.4. The 2D-slices in figure 7.5 is only a simplifiedschematic for the purpose of explanation.
The parameters describing the connectivity of the solid phase could success-fully be used to explain the development of the P-wave velocity in early agecement paste and concrete. Ye et al. (2003a) have proposed a model that allowsthe calculation of the P-wave velocity from the simulated volume of the solidparticles that act as bridges between existent clusters of hydrated solid phase. InYe et al. (2004) these investigations were extended by establishing a quantita-tive relationship between the experimentally determined evolution of the P-wavevelocity of concrete and the connectivity and percolation threshold of the solidphase of the cement paste calculated with HYMOSTRUC3D.
While the volume fraction of the connected solid phase yields informationonly about the quantity of the connected solid phase it would be desirable tohave a parameter available that describes the degree of the interparticle bonding.

146 7 Numerical Simulation of Wave Reflection Measurements
To provide such a measure HYMOSTRUC calculates the contact area of thesolid phase. If a cluster of connected solid particles is considered (fig. 7.6a) thecontact area for this cluster is the sum of the areas that establish the connectionbetween the individual particles (fig. 7.6b). HYMOSTRUC3D computes thespecific contact area of the hydrated cement particles, which is defined as thecontact area per unit volume of cement paste at a given hydration age.
7.3 Application of HYMOSTRUC3D
7.3.1 General Remarks
In this section it will be analyzed how the results of the WR-measurements canbe related to the microstructural properties of hydrating cement paste deter-mined by numerical simulation with HYMOSTRUC3D. It is the aim to identifythe parameters of the cementitious microstructure that are the most influenc-ing factors for the development of the reflection loss measured with shear waves.HYMOSTRUC3D was chosen for this investigation, since the model allows thecalculation of different parameters describing the connectivity of hydrating ce-ment grains. Using this information the gradual creation of inter-particle bondstransforming in water suspended cement grains into a solid microstructure canbe monitored on a micrometer level. Conducting this kind of observations onreal cement paste would be very time consuming and require the application ofvery advanced experimental techniques.
The application of HYMOSTRUC3D can also be considered to contribute tothe verification of the numerical model itself, since the results of additional exper-
(a) Connected cement parti-cles
(b) Exposed contact area
Fig. 7.6: Contact area of cement particles

7.3 Application of HYMOSTRUC3D 147
iments will be used to complement the comparison between numerical simulationand ultrasonic measurements. Hence, the following investigations are positionedalong the line of the research presented by Ye (2003) where HYMOSTRUC3Dwas used to determine transport properties of hydrating cement paste.
7.3.2 Calibration and Verification of the Model
An important requirement for the use of numerical simulations is informationabout the reliability of the obtained results. To assure that the simulation re-sults are comparable to the actual experiments the numerical model has to becalibrated. For the investigations presented here the numerical model was cali-brated and verified in several independent ways.
Chemical Composition and Particle Size Distribution of Cement The firststep of assuring the reliability of the simulation is the careful definition of theinput parameters of the HYMOSTRUC3D model. The model requires the in-put of the characteristics of the cement that will be used for the simulationsby defining the chemical composition and the particle size distribution (PSD).The chemical composition of the cement, as determined from X-ray diffractionmeasurements, was directly used as an input parameter in terms of the amountof the different clinker compounds. The PSD of the cement was experimentallydetermined with the Low Angle Laser Light Scattering (LALLS) method. Fourtests were conducted and average values of the measurements were used for thecalibration purpose. Fifty percent of the cement particles are smaller than 14.3µm and the volume weighted mean value of the particle diameter is 18.5 µm. Tomake the PSD usable as an input parameter for the numerical simulation, it wasapproximated using the Rosin-Rammler distribution with a minimum particlesize of 1 µm. The comparison between the PSD determined by experiment andthat used as an input parameter for HYMOSTRUC3D is shown in figure 7.7.
Degree of Hydration A additional way of calibration was to compare the degreeof hydration calculated by HYMOSTRUC3D to the degree of hydration deter-mined from the amount of the non-evaporable water as described in Section 6.5.2.The parameters that determine the kinetics of the cement hydration simulatedby HYMOSTRUC3D were adjusted until the simulated and experimental valueswere brought to an acceptable agreement. The simulated and measured dataof the degree of hydration for cement pastes with three w/c-ratios is given infigure 7.8.

148 7 Numerical Simulation of Wave Reflection Measurements
0
20
40
60
80
100
0.1 1 10 100
Particle Diameter (µm)
Vo
lum
eF
ractio
n(%
)
Experiment
Simulation
Portland cement powder
Fig. 7.7: Comparison between the particle sizedistributions determined by experiments andcalculated by HYMOSTRUC3D
0.0
0.1
0.2
0.3
0.4
0.5
0.6
0.7
0 24 48 72 96 120 144 168
Time (h)
De
gre
eo
fH
yd
ratio
n(-
)
w/c = 0.6
w/c = 0.5
w/c = 0.35
HYMOSTRUC(simulation)
Fig. 7.8: Degree of hydration derived from thenon-evaporable water content and simulated byHYMOSTRUC3D
7.3.3 Results of the Numerical Modeling
7.3.3.1 Solid Phase
Volume Fraction and Connectivity The volume fraction of the total and theconnected solid phase are important parameters describing the properties of themicrostructure simulated by HYMOSTRUC3D. The evolution of these two pa-rameters in time for the cement pastes with w/c = 0.35 and 0.6 is given infigure 7.9. The initial value for the volume fraction of the total solid phase St isdetermined by the w/c-ratio. Except for the difference in the initial value thatcauses a vertical shift between the two curves no other significant influence of thew/c-ratio can be identified in the further evolution of parameter St. Both curvesshow similar patterns during their development in time.
The development of the volume fraction of the connected solid phase Sc is muchmore influenced by the w/c-ratio. The first difference is the time of increase ofthe curve, which marks the time of the percolation threshold tp. As shown infigure 7.9 the percolation threshold of the solid phase for the paste with w/c = 0.6occurs more than three hours later compared to the paste with w/c = 0.35.Another characteristic influenced by the w/c-ratio is how fast the values of theconnected solid phase approach those of the total solid phase. The parameters St
and Sc for w/c = 0.35 have very similar values after only five hours of hydrationand thereafter the change in the difference between the two parameters is verysmall. On the contrary, the difference between St and Sc for w/c = 0.6 remainslarge for a significantly longer time. Both values start to develop after a paralleltrend after about fifty hours.

7.3 Application of HYMOSTRUC3D 149
Specific Contact Area As already mentioned before the specific contact areais a measure of the degree of the interparticle bonding of the cement particlesconsidered by HYMOSTRUC3D. The development of this parameter in time forcement pastes with w/c-ratios of 0.35, 0.5 and 0.6 is given in figure 7.10. Ifthe specific contact area is compared to, for example, the volume fraction of theconnected solid phase (fig. 7.9) it is obvious that both parameters have a differentsensitivity to the hydration process. The volume fraction of the connected solidphase exhibits a very sensitive behavior at very early ages, immediately after theoccurrence of the percolation threshold. For later ages, when this parameter hasapproached the values of the volume fraction of the total solid phase, it losessensitivity and does not provide any additional information. The specific contactarea shows a more balanced development. The values increase in a continuousmanner in the beginning of the hydration indicating that the percolation of thecement grains that leads to the formation of contacts is a gradual process. Atlater ages the contact area still exhibits a relatively high rate of change, which isespecially pronounced for the w/c-ratios of 0.35 and 0.5.
7.3.3.2 Pore Phase
Volume Fraction As it was mentioned previously, HYMOSTRUC3D distin-guishes between solid and pore phases. The pore phase represents the volumeof the 3D-body that is not occupied by the solid phase (fig. 7.4, p. 144) andcorresponds to the capillary porosity of cement paste. The volume fraction of
0
20
40
60
80
100
1 10 100 1000
Time (hours)
Volu
me
Fra
ction
ofS
olid
Phase
(%)
w/c = 0.6
w/c = 0.35
percolationthreshold
Portland cement pastehydration temperature: 25°C
total solid phase (S )
connected solid phase (S )
47.2
34.2
2.0 5.2
c
t
Fig. 7.9: Volume fraction and percolationthreshold of the solid phase for the cementpastes with w/c = 0.35 and 0.6 as simulatedwith HYMOSTRUC3D
0.00
0.05
0.10
0.15
0.20
1 10 100 1000
Time (h)
Sp
ecific
Co
nta
ctA
rea
(m
/m
)ì
ì2
3
w/c = 0.6
w/c = 0.35
w/c = 0.5
Portland cement pastehydration temperature: 25°C
Fig. 7.10: Evolution of the specific contact areacalculated by HYMOSTRUC3D

150 7 Numerical Simulation of Wave Reflection Measurements
0.0
0.1
0.2
0.3
0.4
0.5
0.6
0.7
1 10 100 1000
Time (hours)
w/c = 0.6
w/c = 0.35
w/c = 0.5
Portland cement pastehydration temperature: 25°CV
olu
me F
raction o
fTota
l P
ore
Phase (
%)
Fig. 7.11: Development of the volume fractionof the total pore phase for different w/c-ratios ascalculated by HYMOSTRUC
0
10
20
30
40
50
0.01 0.1 1 10
Diameter d (µm)
Po
reV
olu
me
Fra
ctio
n(%
)
0
10
20
30
40
50
Diffe
ren
tia
lC
urv
ed
V/d
log
d
V
hydration age: 21 h
degree of hydration: 0.33
porosity: 0.28
w/c = 0.35
Fig. 7.12: Pore size distribution of cement pastewith w/c=0.35 at age of 21 hours simulated withHYMOSTRUC3D (Sun, 2004)
the total pore phase calculated for cement pastes with the w/c-ratios of 0.35, 0.5,and 0.6 is given in figure 7.11. The figure shows clearly the influence of the w/c-ratio on the amount of the capillary pores and the trends of the curves resemblethe development of the capillary porosity determined from TG-measurements asgiven in figure 6.42 (p. 133).
Pore Size Distribution The 3-D pore structure simulated by HYMOSTRUC3Dalso allows the analysis of the pore size distribution of the capillary pores atany given time. The pore size distribution simulated by the numerical modelhas been compared to the results of other techniques, such as mercury intrusionporosimetry (MIP), image analysis of scattered electron micrography (SEM), andWood’s metal intrusion porosimetry (WMIP) by Ye (2003, pp. 119). It was foundthat the results of the latter two techniques agree well with the simulated poresize distribution. The results of the numerical simulation and MIP are differentby one order of magnitude, which was attributed to the inkbottel effect thatinfluences the MIP-measurements.
7.3.4 Comparison of Numerical Simulation and Experimental Results
7.3.4.1 Volume Fraction of Solid Phase vs. Reflection Loss
In figure 7.9 (p. 149) it was shown that the volume fraction of the total andconnected solid phase can be used to identify differences in the hydration kineticsand the microstructural development of cement pastes of different compositions.It will now be investigated if the trends found for the parameters St and Sc can

7.3 Application of HYMOSTRUC3D 151
be used to explain the development of the reflection loss measured on cementmortars prepared with the appropriate pastes. The comparison between thereflection loss and the parameters St and Sc in time for the different w/c-ratiosis given in the bottom parts of figures 7.13a–c. Additionally, the ratio of thevolume fraction of total to the connected solid phase is given in the upper partof each figure. This ratio will be used to further characterize the development ofthe connected solid phase.
From the three figures it can be seen that the time of the percolation thresholdand the time of increase of the reflection loss are very similar for all three testedw/c-ratios. This indicates that the initial stage of the reflection loss developmentis governed by the connectivity of the cement particles. This assumption seemsreasonable since the ability of the cement paste to transmit shear waves, whichin turn governs the reflection loss, requires a shear-rigid microstructure that canonly be created by interconnected solid particles. A similar relationship betweenthe shear wave reflection coefficient and the percolation threshold of reactivepowder concrete was reported by Feylessoufi et al. (2001). In this study thetime of the initial decrease of the shear wave reflection coefficient was foundto be related to the time of the percolation threshold, determined by chemicalshrinkage measurements.
After the occurrence of the percolation threshold the volume fraction of theconnected solid phase increases rapidly, which results in a steep rise of the re-flection loss. The creation of additional inter-particle bonds during this timeobviously improves the shear wave propagation properties of the material furthercausing the reflection loss to increase.
Based on this characterization of the volume fraction of the solid phase, thedevelopment of the reflection loss can be evaluated accordingly. The initial devel-opment of the reflection loss is governed by the evolution of the connected solidphase and is characterized by a steep increase. The development of the reflectionloss at the later age follows that of the total solid phase and is represented bya moderate or low growth rate. Except for the mortar with w/c = 0.35, thetransition between the two stages is approximately marked by the time when thedifference between connected and solid phase becomes constant. It is assumedthat the difference between the connected and solid phase is constant when thefirst derivative of the ratio of those parameters (d(Sc/St)/dt) reaches a value of0.05.

152 7 Numerical Simulation of Wave Reflection Measurements
0
20
40
60
80
0 24 48 72 96
Time (hours)
0
1
2
3
4
reflection loss
w/c = 0.35
0.92
0.94
0.96
0.98
1.00
Sc/S
t(-)
14.9
d(S /S )
dt= 0.05%
c t
total solid (S )
connected solid (S )cc
t
b)
a)
Volu
me F
raction o
f S
olid
Phase (
%)
Refle
ctio
n L
oss (d
B)
(a)
0 24 48 72 96
Time (hours)
0
1
2
3
4
reflection loss
w/c = 0.50
0.92
0.94
0.96
0.98
1.00
d(S /S )
dt= 0.05%
c t
24.9
total solid (S )
connected solid (S )cc
t
b)
a)
0
20
40
60
80
Volu
me F
raction o
f S
olid
Phase (
%)
Refle
ctio
n L
oss (d
B)
Sc/S
t(-)
(b)
0 24 48 72 96
Time (hours)
0
1
2
3
total solid (S )
connected solid (S )
reflection loss
w/c = 0.60
0.92
0.94
0.96
0.98
1.00
d(S /S )
dt= 0.05%
c t
52.1
cc
t
b)
a)
0
20
40
60
80
Volu
me F
raction o
f S
olid
Phase (
%)
Refle
ctio
n L
oss (d
B)
Sc/S
t(-)
(c)
Fig. 7.13: Comparison between reflection loss of cement mortar and volume fraction of total andconnected solid phase for cement paste with different w/c-ratios
7.3.4.2 Specific Contact Area vs. Reflection Loss
In the previous section it was shown that the evolution of the reflection lossmeasured on mortar mixtures can be explained based on the development of thevolume fraction of the total and connected solid phase of cement paste with thesame w/c-ratio. However, a general relationship, valid independently from thecomposition of the cement pastes could not be formulated. In the following itis presented how the previously introduced specific contact area of the cementparticles can be used to describe the wave reflection measurements of cementitiousmaterials in a more unique manner.
The relationship between the specific contact area and the degree of hydrationfor the different cement pastes is given in figure 7.14. For any given degree ofhydration the specific contact area is larger for smaller w/c-ratios. This can

7.3 Application of HYMOSTRUC3D 153
0
0.05
0.1
0.15
0.2
0.25
0 0.2 0.4 0.6 0.8 1
Degree of hydration (-)
w/c = 0.6
w/c = 0.35
w/c = 0.5
Portland cement pastehydration temperature: 25°C
Specific
Conta
ctA
rea
A(
m/
m)
Cì
ì2
3
Fig. 7.14: Relationship between specific contact areaand degree of hydration for the tested cement pastes
0.00
0.02
0.04
0.06
0.08
0.10
0.12
0.14
0.16
0 1 2 3 4
A = 0.025,c
Time
w/c = 0.35: 9.3 h
w/c = 0.50: 16.5 h
w/c = 0.60: 21.9 h
Transition Point
A Rc L= 0.0546 - 0.0588
R = 0.96782
A Rc L= 0.0153 + 0.0007
R = 0.98292A
B
Trend Lines
A
B
TransitionPoint
Specific
Conta
ctA
rea
A(
m/
m)
C2
3ì
ì
Reflection Loss R (dB)L
0.025
Portland cement mortarhydration temperature: 25°C
1.46
R = 1.46L
Fig. 7.15: Relationship between reflectionloss (mortar) and specific contact area (ce-ment paste)
be attributed to the higher volume of cement contained in those mixtures. Itshould also be noted that the rate at which the specific contact area increasesis higher for the pastes with low w/c-ratios. Considering these characteristics itcan be concluded that the development of the specific contact area of the threecement pastes shown in figure 7.14 exhibits the same patterns as the developmentof reflection loss versus the degree of hydration given in figure 6.35 (page 126).This suggests to further investigate how reflection loss and specific contact areaare related.
In figure 7.15 the relationship between these parameters is plotted, where thereflection loss was measured on mortars and the specific contact area refers tocement paste. It can be seen that the reflection loss and the specific contact areaof all three tested w/c-ratios have a unique bilinear relationship. The trend linedescribing the early age behavior (trend A in fig. 7.15 ) can be considered to passthrough the origin. This indicates that the reflection loss directly depends on thespecific contact area during this time, since no reflection loss can be measuredwhen no contacts between cement particles have been created and the specificcontact area is zero. This behavior shows differences compared to the relationshipbetween the reflection loss and the percolation threshold shown in figures 7.13a–c. These figures show that the reflection loss already starts to increase slightlybefore the occurrence of the percolation threshold.
The initial trend changes its slope after a certain value of reflection loss orspecific contact area is reached. The time of this transition is different for the

154 7 Numerical Simulation of Wave Reflection Measurements
different w/c-ratios and is given in figure 7.15. The trend lines A and B have ahigh statistical significance expressed by their coefficients of determination R2,which are also given in figure 7.15. Based on these observations it can be con-cluded that the reflection loss is strongly correlated with the specific contactarea. This implies that the wave reflection technique is not only sensitive tothe volume of the connected solid particles as concluded in the previous section,but also a measure of the degree of the interparticle bonding in the cementitiousmicrostructure.
7.3.4.3 Specific Contact Area vs. Compressive Strength
To evaluate the potential of the specific contact area for explaining the evolutionof other properties of cementitious materials its relationship to the compres-sive strength development will be investigated in this section. The compressivestrength was determined on mortar mixtures with the three w/c-ratios accord-ing to ASTM C109. The relationship between the specific contact area and thecompressive strength is given in figure 7.16. It can be seen from the figure, thatalso the compressive strength has a very unique relationship to the specific con-tact area. Similar to the reflection loss the dependency is divided into two parts.In the early age both parameters are related by a power law and in the laterages a linear trend can be found (trend lines A and B in fig. 7.16). It should benoted that the transition between both trend lines occurs at exactly the samevalue of the specific surface area that was already found for the reflection loss infigure 7.15.
The dependency that was found between the compressive strength and the spe-cific contact area seems logical since the weakest point of a microstructure builtup by hydrated cement particles (see fig. 7.6, p. 146) is the connection betweenthe individual particles. The specific contact area seems to be a good parameterto quantitatively describe the properties of this inter-particle connection. Sincethe compressive strength was measured on mortar it can be expected that therelationship given in figure 7.16 changes when, for example, the volume ratio ofsand to cement of the mortar is changed. The investigation of these relationshipswill be subject of further research.

7.4 Application of CEMHYD3D 155
0
10
20
30
40
50
0.00 0.025 0.08 0.12 0.16
Specific Contact Area A ( m / m )C2 3ì ì
S = 282.56 A + 4.8913C
R = 0.98642
S = 13074 AC1.9143
R = 0.99282A
B
Contact Area
A = 0.025C
Time
Trend Lines
TransitionPoint
A
B
Portland cement mortarhydration temperature: 25°C
Transition Point
w/c = 0.35: 9.3 hw/c = 0.50: 16.5 hw/c = 0.60: 21.9 h
0.04
Co
mp
ressiv
e S
tre
ng
th (
MP
a)
Fig. 7.16: Relationship between compressive strength (mortar) and specific contact area (cementpaste)
7.4 Application of CEMHYD3D
7.4.1 General Remarks
This section describes the application of the CEMHYD3D hydration model tovalidate the results of degree of hydration, chemical shrinkage and the amount ofcalcium hydroxide obtained from experimental measurements described in chap-ter 6. The mentioned parameters are direct measures of the cement hydrationand are used to analyze the mechanism of the wave reflection measurements.Given this background, the verification of these experimental parameters is alsoa verification of the relationship between the reflection loss measurements andthe microstructural evolution on cement-based materials.
As it is explained in section 7.2.2, CEMHYD3D generates a three-dimensionalmicrostructure of the cement paste at any desired stage of hydration. This digi-tized microstructure was used as input for two finite element models, which arecapable of simulating the development of the shear modulus of cement paste andmortar. A detailed description of these models is given by Garboczi et al. (2004,pt. II, chap. 2) and Garboczi and Berryman (2001). All data obtained fromthe CEMHYD3D hydration model and the finite element models that will bediscussed in this section were provided by Garboczi (2004).

156 7 Numerical Simulation of Wave Reflection Measurements
7.4.2 Calibration of the Model
To ensure that the simulation results are comparable to results obtained fromactual experiments the numerical model must calibrated. This calibration is doneby analyzing the properties of the cement used for the experiments and using thisdata as input for the CEMHYD3D hydration model. The parameters needed forcalibration are the particle size distribution, the chemical composition of thecement and the resulting content of the different clinker phases, and the Blainesurface area of the cement. The exact values of these parameters determined forthe used type I cement are given in appendix D. The simulations were conductedfor an hydration at saturated conditions at an isothermal curing temperature of25°C. This matches the conditions of the actual experiments.
7.4.3 Simulation of Chemical Shrinkage
The development of the chemical shrinkage of cement pastes with the w/c-ratiosof 0.35, 0.5, and 0.6 was experimentally determined by dilatometric measure-ments (see sec. 5.9, p. 89). The results of the measurements and their discussionis given in section 6.5.4. It was found that the chemical shrinkage of cement pasteis linearly related to the reflection loss measured on mortars prepared with theappropriate pastes. Based on this finding it was concluded that the results ob-tained WR-method are intimately and directly related to the hydration processof the cement.
To verify the experimental results the chemical shrinkage measurements and bythis the sensitivity of the WR-method to the cement hydration, the numericallysimulated chemical shrinkage of the considered cement pastes will be used as acomparison. The numerically and experimentally determined values for chemicalshrinkage are given in figure 7.17. First it can be seen from the figure thatthe original simulated (dashed lines) and experimental shrinkage data exhibit adifferent in the absolute values.
This difference is most likely due to the nature of the shrinkage measurements.In these measurements the thickness of the cement paste layer that was filledinto the flask was 2.5 cm. Several references can be found that indicate thatthe thickness of this paste layer influences the amount of the chemical shrinkagethat is measured (Geiker, 1983; Tazawa et al., 1995; Boivin et al., 1999). Itwas found that the chemical shrinkage decreases with increasing sample height.The underlying theory is that due to the generation of the hydration productsthe permeability of the sample as a whole reduces with time. The thicker the

7.4 Application of CEMHYD3D 157
0
1
2
3
4
5
0 24 48 72 96 120 144 168
Time (h)
Ch
em
ica
lS
hri
nka
ge
(ml/1
00
g)
Portland cement pasteisothermal curing, 25°C
measured by dilatometry
(sample height: 3.5 cm)
w/c = 0.35
w/c = 0.50
w/c = 0.60
simulated with CEMHYD3D
original values
values reducedby 14%
w/c = 0.60
w/c = 0.50
w/c = 0.35
Fig. 7.17: Comparison of experimentally de-termined (dilatometry) and numerically simulated(CEMHYD3D) amount of chemical shrinkage
0
1
2
3
4
0 1 2 3 4
Reflection Loss (dB)
Ch
em
ica
lS
hri
nka
ge
(%)
Portland cement paste
isothermal curing, 25°C
�
�
�
w/c = 0.60: R = 0.9774w/c = 0.50: R = 0.9864w/c = 0.35: R = 0.9962
2
2
2
�
�
�
chemical shrinkage simulated
with CEMHYD3D (reduced by 13%)
Fig. 7.18: Relationship between reflectionloss (mortar) and chemical shrinkage (ce-ment paste, simulated with CEMHYD3D)
paste layer is the less likely it is that the pores at the bottom of the layer can befilled with water. Consequently, the internal volume reduction underestimatedby decrease of the water level in the measuring pipette.
However, it was also found that the overall trend of the chemical shrinkageis not influenced by the sample height. To allow a comparison of the presenteddata, the simulated shrinkage values were reduced to fit the absolute values mea-sured by the experiments. The same reduction factor of 0.86 was used for thethree w/c-ratios. It can be seen that, except for the later age of w/c-ratio of0.35, the experimental and simulated shrinkage values agree reasonably well afterthe reduction and develop according to almost identical trends. This compari-son verifies that, on a qualitative basis, the experimentally determined chemicalshrinkage accurately describes the hydration process of the cement pastes.
The direct comparison between the reduced simulated shrinkage data of thecement paste and the reflection loss measured on the appropriate mortars is givenin figure 7.18. Similar to the results presented in figure 6.40, both quantities arerelated by a strong linear trend for the considered time frame (55–90 h).
7.4.4 Simulation of the Amount of Calcium Hydroxide
The development of the amount of free calcium hydroxide generated by the hy-dration process of cement was measured using thermogravimetry and compared

158 7 Numerical Simulation of Wave Reflection Measurements
0.00
0.05
0.10
0.15
0.20
0.25
0.30
0 24 48 72 96 120 144 168
Time (h)
Ca
(OH
) 2C
on
ten
t(g
/gce
me
nt)
w/c = 0.35
Ca(OH)2 from CEMHYD3D
(a)
0 24 48 72 96 120 144 168
Time (h)
w/c = 0.5
0 24 48 72 96 120 144 168
Time (h)
w/c = 0.6
(b) (c)
total Ca(OH)2 free Ca(OH)2
Portland cement paste
isothermal curing, 25°C
Fig. 7.19: Comparison of the amount of total, free and numerically simulated calcium hydroxide(Ca(OH)2)
to reflection loss measurements on mortar in section 6.5.3. It was found thatboth quantities are linearly related for early ages (up to 90 hours). It will nowbe investigated if the experimentally determined values of the calcium hydroxide(Ca(OH)2 or CH) content can be verified by the results of the numerical simu-lations. The CEMHYD3D model distinguishes between the hydration productsC-S-H and CH, which allows the determination of the Ca(OH)2 by analyzing thesimulated microstructure.
The comparison between the numerically and experimentally determined amountof Ca(OH)2 for cement pastes with three w/c-ratios is given in figure 7.19. Inthis figure, two different amounts of the experimentally determined Ca(OH)2 aregiven, that is the total and the free Ca(OH)2. The amount of the free Ca(OH)2has a crystalline morphology and describes that part of the Ca(OH)2 present inthe paste that has not reacted with carbon dioxide (CO2) to calcium carbonate(CaCO3). It is calculated from the weight loss of a cement paste sample measuredbetween temperatures of 380°C and 550°C (see sec. 5.8.3, p. 87 and sec. 6.5.3,p. 126).
The figures show that the experimental data of the amount of the total Ca(OH)2matches with results of the simulations. Some deviations at later ages can besen for w/c-ratio of 0.35. The amount of the free Ca(OH)2 has consistentlylower values than the simulated Ca(OH)2 content. This seems reasonable, sinceCEMHYD3D does not simulate any carbonation reactions. Given the fact, that

7.4 Application of CEMHYD3D 159
0.00
0.05
0.10
0.15
0.20
0.25
0 1 2 3 4
Reflection Loss (dB)
To
talC
a(O
H) 2
Co
nte
nt(g
/gce
me
nt)
�
�
�
w/c = 0.60: R = 0.9770
w/c = 0.50: R = 0.9909
w/c = 0.35: R = 0.9973
2
2
2
Portland cement paste
isothermal curing, 25°C �
�
�
Ca(OH) simulated
with CEMHYD3D2
Fig. 7.20: Relationship between reflection loss (mortar) and numerically determined amount of totalcalcium hydroxide (paste, CEMHYD3D)
the cement paste samples were cured in a water bath, the carbonation of thesamples must have been occurred during the preparation of the cement hardenedpastes for the TG-measurements, which was done at atmospheric conditions.
The agreement between the data sets given in figure 7.19 validate the resultsobtained from the TG-measurements. The direct relationship between the nu-merical values for the Ca(OH)2 content of the cement pastes and the reflectionloss measured on the appropriate mortars is given in figure 7.20. Essentially, thesame linear trends between both parameters as found in section 6.5.3 (fig. 6.38)are observed. The direct relationship between reflection loss measured on mortarand the hydration progress as indicated by the Ca(OH)2 content of the pasteportion of this mortar can be considered to be confirmed.
7.4.5 Simulation of the Shear Modulus of Cement Paste and Mortar
The simulation of the cement hydration with the CEMHYD3D model requiresthe generation of a three-dimensional microstructure, that in the initial phase,consists of unhydrated cement particles surrounded by pore space. With pro-ceeding hydration, simulated by the dissolution, diffusion, and reaction of thecement particles, this microstructure is subjected to a continuous change. Theavailability of such a digitized microstructure at any given time of hydration,offers the possibility to use this microstructure as input for finite element models

160 7 Numerical Simulation of Wave Reflection Measurements
0
5
10
15
20
0 12 24 36 48 60 72 84 96 108 120
Time (h)
Dy
na
mic
Sh
ea
rM
od
ulu
s(G
Pa
)
Gd,WR
w/c = 0.35
(a)
0
2
4
6
8
10
12
14
0 24 48 72 96 120
Time (h)
Dy
na
mic
Sh
ea
rM
od
ulu
s(G
Pa
)
w/c = 0.50
Gd,WR
(b)
0
2
4
6
8
10
0 24 48 72 96 120
Time (h)
Dy
na
mic
Sh
ea
rM
od
ulu
s(G
Pa
)
Gd,WR
w/c = 0.60
(c)
of mortar (experiment)
shear modulus . . .
of mortar (simulation)
of paste (simulation)
of paste (experiment)
from reflection loss
Fig. 7.21: Comparison of the dynamic shear moduli of mortars and the corresponding cement pastesobtained from the wave reflection method, forced resonance method, and numerical simulation(CEMHYD3D)
and to calculate elastic parameters of the simulated systems.Garboczi et al. (2004, pt. II, chap. 2) and Garboczi and Berryman (2001) have
introduced such finite element models capable of simulating the elastic moduliof cement paste and cement mortar, respectively. These models were used incombination with the microstructure simulated by CEMHYD3D to calculate theevolution of the shear moduli of cement pastes and mortars with the w/c-ratiosof 0.35, 0.5, and 0.6.
The simulations of the shear moduli were conducted to verify the results ob-tained from the investigations about the relationship between WR-measurementsand the shear modulus of cement paste and mortar presented in section 6.4. The

7.5 Conclusions 161
results obtained there indicated that the reflection loss measured on concrete ormortar is governed primarily by the properties (i.e. shear modulus) of the cementpaste portion of the tested material. The comparison between the numericallydetermined shear moduli and moduli obtained from dynamic measurements pro-vides a convenient tool to verify the validity of the latter conclusion.
The comparison between the simulated and measured shear moduli of cementpaste and mortar is given in figure 7.21. The shear modulus of the mortars wasmeasured with the forced resonance method (see sec. 5.6, p. 80) within the exper-imental program of this thesis. The shear modulus of the pastes was measuredwith the same method and provided by Sun (2004) to allow the verification of thedeveloped theory. The figures also show the development of the dynamic shearmodulus Gd,WR derived from the measured reflection loss using equation 3.12.The shear moduli simulated with CEMHYD3D are only available for ages greaterthan 24 hours since the reliability of the finite element models for very early agesis not yet accurate enough.
From the presented figures can be seen that the measured and simulated shearmoduli of the cement pastes have almost identical values. The measured andsimulated shear moduli of the mortars exhibit a somewhat higher deviation witha maximum of ca. 25% for the w/c-ratio of 0.35. However, despite the exis-tent deviations, the relationship of the shear modulus Gd,WR derived from thereflection loss measured on mortar to the moduli obtained from the other meth-ods/materials is clear. For all three w/c-ratios the shear modulus Gd,WR derivedfrom the reflection loss develops much closer to the shear modulus of the cementpastes.
Based on the data presented in figure 7.21 it can be concluded that the re-sults obtained from the numerical simulations can verify the findings reported insection 6.4.3. The reflection loss measured on cement mortar is governed by theshear modulus of the cement paste portion of the mortar.
7.5 Conclusions
The investigations conducted in this chapter have shown that the numerical sim-ulation of the cement hydration process can be a very useful tool for explainingthe results of wave reflection measurements. The comparison between the wavereflection measurements and simulated microstructural parameters has indicatedthat the connectivity of the hydrated cement particles has a major influence onthe development of the measured reflection loss. In this context, the connectivity

162 7 Numerical Simulation of Wave Reflection Measurements
is characterized by the percolation threshold, the volume fraction of the connectedsolid phase and the specific contact area of the cement particles. The hydrationmodel HYMOSTRUC3D was used to numerically determine these parameters.
In particular, it was found that in the initial period the reflection loss startsto increase close to the time of the occurrence of the percolation threshold of thecement particles. The subsequent reflection loss development follows the trendof the volume fraction of the connected solid phase. At later ages the reflectionloss is governed by the volume fraction of the total solid phase.
The specific contact area of the cement particles was found to have a uniquerelationship to reflection loss and compressive strength measured on mortars.This relationship is not influenced by the w/c-ratio of the tested mortars, whichoffers various possibilities for the further use of these dependencies. An examplefor the application in a constitutive model to relate reflection loss measurementson mortar to the mechanical parameters of the material is given in section 9.
Another result of the numerical simulations is the verification of importantexperimental measurements. The hydration model CEMHYD3D was applied tonumerically determine the amount of the chemical shrinkage and the amount ofcalcium hydroxide of the tested cement pastes. A reasonable agreement betweenthe measured and calculated parameters was observed.

Chapter 8
Evaluation of the Pulse Velocity Method
8.1 General Remarks
The comparison between the wave reflection and pulse velocity method will bebased on experiments conducted within a series of round robin tests coordi-nated by the RILEM Technical Committee TC ATC-185 — Advanced testing ofcement-based materials during setting and hardening. The aim of these roundrobin tests is to compare results of different test methods obtained from mea-surements conducted on identical materials at the same time and at the samelocation. The measurements reported here were performed at the Center for Ad-vanced Cement-Based Materials (ACBM) at Northwestern University, Evanston,USA in February 2002. The tests were conducted to compare the WR-methodwith an application of the pulse velocity method developed at the Institute ofConstruction Materials of the University of Stuttgart in Germany (Grosse andReinhardt, 1994).
This method allows monitoring the setting behavior of fresh mortar or concrete.The test material is placed in a container and the velocity of P-waves travelingthrough the material is measured (Reinhardt et al., 2000). The method has beenshown to be sensitive to the hydration process of mortar and concrete as affectedby different w/c-ratios, retarders in different contents, and different cement types(Grosse, 1996; Reinhardt and Grosse, 2004). A schematic and a photograph ofthe container used for the pulse velocity measurements with mortar are shownin figure 8.1.

164 8 Evaluation of the Pulse Velocity Method
(a) Schematic (b) Photograph
Fig. 8.1: Container for pulse velocity measurements of fresh and hardened mortar developed byStuttgart University, Germany (Grosse, 2004)
8.2 Experimental Program
The mix proportions of the mortars and concretes tested during the round robintests as well as details of the used ingredients are given in table 8.1. In total, twoconcrete and six mortar mixtures were tested. The experiments were performedin an air-conditioned laboratory with a relatively constant room temperature of22°C to 23°C. Simultaneously to the ultrasonic measurements the in-situ temper-
Tab. 8.1: Mix proportions of mortars and concretes tested in RILEM round robin tests
RA1 RA2 RA3 RA4 RA5 RA6 RA9 RA10
cementa 1 1 1 1 1 1 1 1
water 0.49 0.52 0.37 0.39 0.60 0.55 0.50 0.60
fine aggregatesb 4.63 1.82 1.98 4.89 4.62 4.89 4.89 4.61
coarse aggregatesc – 2.73 2.97 – – – – –
superplasticizer – – – 0.008d – – 0.004e –
retarderf – – – – 0.004 – – –
acceleratorg – – – – – – – 0.008
air entrainerh – – – – – 0.002 – –
aType I, briver sand, oven dry, cgravel, max. size 16 mm, oven drydRheobuild 3000FC (Master Builders Technology [MBT])eSIKA Viscocrete 5010, fDaratard 17 (W.R. Grace)gPolarset (W.R. Grace), hSIKA AEA-15

8.3 Results 165
ature development in each test sample and the adiabatic heat evolution of theconcretes and mortars were tested. After the completion of the round robin testprogram, the development of the penetration resistance and the chemical shrink-age of some of the mixtures in table 8.1 was determined. The results of these twotechniques help to evaluate the two ultrasonic methods on a more fundamentalbasis.
In the following sections it will be investigated how the results of the wavereflection and pulse velocity measurements (reflection loss and P-wave velocity)are related to the setting and hardening process of the tested materials as itis described by the results of the complimentary experiments. Due to the factthat the two methods use different wave types (primary and shear waves) itcan be expected that the test results will show significant differences. Furtherdifferences will occur due to the different principles of measurement (reflectionvs. transmission).
8.3 Results
8.3.1 Comparison with Penetration Resistance
In figure 8.2 the penetration resistance of two mortar and one concrete mixture iscompared to the appropriate development of reflection loss and P-wave velocity.Details to the experimental determination of the penetration resistance can befound in section 5.3, page 79. It is common practice to determine the time ofinitial and final setting from the results of the pin penetration tests and to useonly these parameters for the further analysis. For the comparison presentedhere, the complete development of the penetration resistance will be used sincethese data include important information about the setting behavior of the testedmaterials.
The comparison of reflection loss and penetration resistance given in the up-per parts of figures 8.2a–c shows that the time when the penetration resistancestarts to increase and develop after a power law trend coincides well with thetime when also a significant increase of the reflection loss values can be observed.The stiffening process of the cement paste as a constituent of the tested mortarsis due to the development of rigid connections between the cement grains causedby the hydration products. It is this gradual development of solid microstruc-ture that causes the penetration resistance to gain higher values with increasinghydration time. The results indicate that the reflection loss measured with shear

166 8 Evaluation of the Pulse Velocity Method
0
10
20
30
40
50P
en
etr
atio
nR
esis
tan
ce
(MP
a)
0.0
0.1
0.2
0.3
Re
fle
ctio
nL
oss
(dB
)
0
10
20
30
40
50
0 2 4 6 8 10
Time (h)
Pe
ne
tra
tio
nR
esis
tan
ce
(MP
a)
0.0
0.5
1.0
1.5
2.0
2.5
3.0
P-w
ave
ve
locity
(km
/s)
w/c = 0.52
(a) Concrete RA2
0
10
20
30
40
50
Pe
ne
tra
tio
nR
esis
tan
ce
(MP
a)
0.0
0.1
0.2
0.3
0.4
0.5
0.6
0.7
0
10
20
30
40
50
0 2 4 6 8 10
Time (h)
Pe
ne
tra
tio
nR
esis
tan
ce
(MP
a)
0.0
0.5
1.0
1.5
2.0
2.5
3.0
3.5
Re
fle
ctio
nL
oss
(dB
)P
-wa
ve
ve
locity
(km
/s)
w/c = 0.39superplactizicer
(b) Mortar RA4
0
10
20
30
40
50
0.0
0.1
0.2
0.3
0
10
20
30
40
50
0 10
Time (h)
0.0
0.5
1.0
1.5
2.0
2.5
Re
fle
ctio
nL
oss
(dB
)P
-wa
ve
ve
locity
(km
/s)Pe
ne
tra
tio
nR
esis
tan
ce
(MP
a)
Pe
ne
tra
tio
nR
esis
tan
ce
(MP
a)
2 4 6 8
w/c = 0.55air entrainer
(c) Mortar RA6
Fig. 8.2: Comparison of pin penetration resistance, reflection loss, and P-wave velocity for concretesand mortars tested during RILEM round robin tests
waves is influenced by the creation of inter-particle bonds in a similar way asthe penetration resistance. This finding agrees also with the results reported insection 6.2.3, page 93.
The P-wave velocity in figures 8.2a–c, which was measured on mortars, exhibitsa different relationship to the penetration resistance. At the time of increase ofthe penetration resistance the P-wave velocity has already reached values thatare significantly larger than those measured during the initial stage of the wavevelocity development. In other words: the P-wave velocity starts to increasealthough no change in the setting behavior can be detected by the penetrationresistance.

8.3 Results 167
This phenomenon can be attributed primarily to the different wave types usedby the test methods. Shear waves, as used by the wave reflection method, prop-agate only in solid materials, which means that the reflection loss measured onfresh mortar is zero. With ongoing hydration the cement grains become connectedproviding a path for the shear waves to propagate. Hence, the fluid (visco-elastic)cement suspension gradually transforms to a solid (elastic) material and the re-flection loss starts to increase, since the shear waves can now be transmitted overthe steel/mortar interface.
The propagation of P-waves, which are used by the pulse velocity method, isnot limited to the existence of a solid microstructure. This type of waves prop-agates also in liquid and gaseous media. When the pulse velocity measurementson fresh mortar are started an initial value of the wave velocity (greater thanzero) can be measured, which remains relatively constant for a certain amount oftime. The following increase of the P-wave velocity (at ca. 3 hours) can only beattributed to the formation of hydration products that have no or little influenceon the stiffening process and thus on the penetration resistance. According toScrivener (1989), during the first three hours of cement hydration mainly ettrin-gite is formed outside of the primarily still unhydrated cement grains in the shapeof small rods. Depending on the w/c-ratio, which determines the inter-particledistance of the cement grains, and the chemical composition of the used cementthese ettringite needles have no or only a small influence on the stiffening of thecement paste (Aıtcin and Neville, 2003). In contrast to the stiffening behavior,the P-wave velocity is strongly affected by the formation of the ettringite. Al-though these needles do not create bonds between the cement particles they dofill pore space that was previously occupied by water with solid products, whichis very beneficial for the propagation of P-waves. Since, as mentioned, no bondsare created the shear wave propagation properties remain unaffected.
Another phenomenon contributing to the early increase of the P-wave velocitycan be internal settling processes in the mortar. This settling, mainly caused bygravity, densifies the internal structure by providing a better mechanical couplingbetween the solid particles (cement, sand) present in the mortar without thecreation of actual bonds between them. The reduced distances between theparticles improve the P-wave propagation properties of the mortars but do notaffect the shear wave propagation, which is primarily dependent on interparticlebonds. Results obtained from a comparison of wave reflection measurementswith P- and S-waves on reactive powder cement that support this theory werereported by Feylessoufi et al. (2001).

168 8 Evaluation of the Pulse Velocity Method
23
24
25
26
In-s
itu
Te
mp
era
ture
Ris
e(°
C)
0
0.1
0.2
0.3
0.4
0.5
0.6
0.7
Re
fle
ctio
nL
oss
(dB
)
23
24
25
26
0 5 10 15 20
Time (h)
In-s
itu
Te
mp
era
ture
Ris
e(°
C)
0
0.5
1
1.5
2
2.5
3
3.5
4
4.5
P-w
ave
ve
locity
(km
s)
/
w/c = 0.52w/c = 0.52
(a) Concrete RA2
25
26
27
28
0.0
0.4
0.8
1.2
1.6
22.2
22.4
22.6
22.8
23.0
23.2
0 6 12 18 24
Time (h)
0.0
0.5
1.0
1.5
2.0
2.5
3.0
3.5
4.0
4.5
ectio
nL
oss
(dB
)P
-wa
ve
ity
(km
/s)
ve
loc
In-s
itu
Te
mp
era
ture
Ris
e(°
C)
In-s
itu
Te
mp
era
ture
Ris
e(°
C)
Re
fl
w/c = 0.39superplactizicer
(b) Mortar RA4
23
24
25
26
0.0
0.2
0.4
0.6
0.8
1.0
1.2
1.4
22.0
22.4
22.8
23.2
0 10 20 30 40
Time (h)
0.0
0.5
1.0
1.5
2.0
2.5
3.0
3.5
4.0
P-w
ave
ve
locity
/)
In-s
itu
Te
mp
era
ture
Ris
e(°
C)
Re
fle
ctio
nL
dB
)
In-s
itu
Te
mp
era
ture
Ris
e(°
C)
(km
so
ss
(
w/c = 0.50superplactizicer
(c) Mortar RA9
Fig. 8.3: Comparison of in-situ temperature rise, reflection loss, and P-wave velocity for concretesand mortars tested during RILEM round robin tests
8.3.2 Comparison with In-situ Temperature Rise
Another important indicator of the progress of cement hydration is the devel-opment of the temperature, which rises as a result of the exothermic reactionbetween cement and water. The temperature of the specimens tested by thewave reflection and pulse velocity method was directly measured by embeddedthermocouples. Further details about the in-situ temperature measurements canbe found in section 5.4, page 80. The comparison between the in-situ temperatureand the appropriate reflection loss and pulse velocity is shown in figure 8.3. Firstit should be noted that the temperatures measured in the specimens used for theWR-tests are generally higher than those measured in the specimens subjected

8.3 Results 169
to the pulse velocity tests. This difference is due to different specimen sizes. Thepulse velocity test were conducted on much smaller specimens, which resultedalso in lower temperatures. The pulse velocity test with concrete were conductedon larger specimens, which resulted in almost no difference between the in-situtemperatures.
Similar to the observations in the previous section, it can be seen in the up-per parts of figures 8.3a–c that the increase of the reflection loss occurres atapproximately the same time when also the temperature starts to increase. Sim-ilar observations are reported in section 6.2.1, page 92. The in-situ temperaturereaches its maximum when the reflection loss exhibits the highest rate of change(corresponding to the steepest slope of the curve). During the descending branchof the in-situ temperature curve the rate of the reflection loss change is slowlydecreasing.
Except for the concrete mixture (fig. 8.3a, bottom) the P-wave velocity is al-ready on a steady rise at the time when the in-situ temperature starts to increase.The possible reason for this difference was explained in the previous section. Atthe time of the maximum in-situ temperature the P-wave velocity has reached avalue that is much closer to the final value of the entire curve as it is the casefor the reflection loss at the corresponding time. When the in-situ temperatureis decreasing due to deceleration of the cement hydration, the P-wave velocityshows only little change and is approaching its final value.
8.3.3 Comparison with Adiabatic Heat Release
Similar to measuring the in-situ temperature of specimens the hydration be-havior of cement-based materials can effectively be monitored by calorimetry.Semi-adiabatic measurements were conducted with all materials that were testedwithin the round robin test program. Further details about the semi-adiabaticcalorimetry can be found in section 5.5, page 80. The parameter that is derivedfrom these measurements is the adiabatic heat release, which describes the totalamount of heat that is generated by the hydration of one mass unit of cement.This quantity can be considered as a direct measure of the cement hydration ofthe material investigated and is therefore commonly used to calculate the degreeof hydration.
The comparison between the adiabatic heat release and reflection loss for oneconcrete and two mortar mixtures is given in the upper parts of figures 8.4a–c.It can be seen that both parameters follow very similar trends over the entireperiod of time that was investigated. The development of the P-wave velocity

170 8 Evaluation of the Pulse Velocity Method
Ad
iab
atic
He
at
Re
lea
se
(J/g
)
0
100
200
300
400
500
600
0.0
0.1
0.2
0.3
0.4
0.5
0.6
0.7
0.8
0
100
200
300
400
500
600
0 6 12 18 24
0.0
1.0
2.0
3.0
4.0
5.0
Re
fle
ctio
nL
oss
(dB
)
Equivalent Age (h)
Ad
iab
atic
He
at
Re
lea
se
(J/g
)
P-w
ave
Ve
locity
(km
/s)
w/c = 0.52
Ad
iab
atic
He
at
Re
lea
se
(J/g
)
(a) Concrete RA2
0
100
200
300
400
0 6 12 18 24
Equivalent Age (h)
0.0
0.5
1.0
1.5
2.0
2.5
3.0
3.5
4.0
P-w
ave
Ve
locity
(km
/s)
0
100
200
300
400
0.0
0.1
0.2
0.3
0.4
0.5
0.6
0.7
0.8
Re
fle
ctio
nL
oss
(dB
)
Ad
iab
atic
He
at
Re
lea
se
(J/g
)A
dia
ba
tic
He
at
Re
lea
se
(J/g
)
w/c = 0.55air entrainer
(b) Mortar RA6
0
100
200
300
400
500
600
0.0
0.2
0.4
0.6
0.8
1.0
1.2
1.4
1.6
0
100
200
300
400
500
600
0 12 24 36 48
0.0
1.0
2.0
3.0
4.0
Equivalent Age (h)
Re
fle
ctio
nL
oss
(dB
)
Ad
iab
atic
He
at
Re
lea
se
(J/g
)
P-w
ave
Ve
locity
(km
/s)
w/c = 0.50superplactizicer
Ad
iab
atic
He
at
Re
lea
se
(J/g
)
(c) Mortar RA9
Fig. 8.4: Comparison of adiabatic heat release, reflection loss, and P-wave velocity for concretesand mortars tested during RILEM round robin tests
and adiabatic heat release shown in the bottom parts of figures 8.4a–c shows moredifferences. Especially at early ages (5 to 18 hours) the pulse velocity increases ata much higher rate than the adiabatic heat release. To allow definite conclusionsabout the dependencies of the discussed parameter the direct relationships amongthem must be evaluated. This will be done in the following section.
8.3.4 Direct Relationship to Adiabatic Heat Release and Chemical Shrinkage
In the previous sections a comparison of the results of the two ultrasonic methodswith measurements of other experimental techniques was presented. This typeof comparison is very effective in obtaining information about the general nature

8.3 Results 171
0.0
0.5
1.0
1.5
0.0 0.3 0.5 0.8 1.0
Reflection Loss (dB)
Ch
em
ica
lS
hri
nka
ge
(ml/1
00
g)
0
100
200
300
400
500
600
Ad
iab
atic
He
at
Re
lea
se
(J/g
)
R = 0.98972
R = 0.99622
0.0
0.4
0.8
1.2
0 1000 2000 3000 4000
P-wave Velocity (m/s)
Ch
em
ica
lS
hri
nka
ge
(ml/1
00
g)
0
100
200
300
400
500
Ad
iab
atic
He
at
Re
lea
se
(J/g
)
R = 0.98032
R = 0.99072
w/c = 0.52
(a) Concrete RA2
0.0
0.5
1.0
1.5
0 1000 3000 4000
P-wave Velocity (m/s)
Ch
em
ica
lS
hri
nka
ge
(ml/1
00
g)
0
100
200
300
400
Ad
iab
atic
He
at
Re
lea
se
(J/g
)
R = 0.96972
R = 0.99072
2000
0.0
0.5
1.0
1.5
2.0
2.5
0.0 0.5 1.0 1.5
Reflection Loss (dB)
Ch
em
ica
lS
hri
nka
ge
(ml/1
00
g)
0
100
200
300
400
500
Ad
iab
atic
He
at
Re
lea
se
(J/g
)
R = 0.99612
R = 0.99062
w/c = 0.50superplactizicer
(b) Mortar RA9
0.0
1.0
2.0
3.0
0 1000 2000 3000 4000
P-wave Velocity (m/s)
Ch
em
ica
lS
hri
nka
ge
(ml/1
00
g)
0
100
200
300
Ad
iab
atic
He
at
Re
lea
se
(J/g
)
R = 0.94142
R = 0.98652
0
1
3
0.0 0.2 0.4 0.6 0.8
Reflection Loss (dB)
Ch
em
ica
lS
hri
nka
ge
(ml/1
00
g)
0
100
200
300
Ad
iab
atic
He
at
Re
lea
se
(J/g
)
0.0
2R = 0.98942
R = 0.95862
w/c = 0.60accelerator
(c) Mortar RA10
Fig. 8.5: Relationship between chemical shrinkage, adiabatic heat release, reflection loss, and P-wave velocity for concretes and mortars tested during RILEM round robin tests
of the existent relationships and allows drawing conclusions on a qualitative ba-sis. To obtain information about the sensitivity of the test methods to certainparameters of cement-based materials on a quantitative basis it is necessary torelate the considered parameters directly. The analysis of such relationships willbe done by using the adiabatic heat release as a direct measure of the hydrationprocess. Additionally, the results of chemical shrinkage tests conducted on thecement paste phase of the investigated materials will be used to complement thecalorimetric measurements. In various studies the chemical shrinkage was foundto be directly related to key parameters of cementitious materials, such as heatof hydration, non-evaporable water content and compressive strength (Geiker,1983). A detailed description of the chemical shrinkage measurements can be

172 8 Evaluation of the Pulse Velocity Method
found in section 5.9, page 89.The relationships between the adiabatic heat release, chemical shrinkage, and
reflection loss are shown in figure 8.5. In section 6.5.4, page 129, it was alreadyfound that, for early ages, the reflection loss measured on mortar is linearlyrelated to the chemical shrinkage of the cement paste phase of the consideredmortar. The data presented in the upper parts of figures 8.5a–c confirm theseresults and extend the latter statement to concrete (fig. 8.5a, top). The depen-dency between reflection loss and adiabatic heat release of the tested concreteand mortars exhibits also a strong linear trend as it is shown in the upper partof figure 8.5. This type of relationship was already suggested by the very similartrends of both parameters shown in figure 8.4.
The relationships between adiabatic heat release, chemical shrinkage, and P-wave velocity are given in the bottom parts of figure 8.5a–c. It can be seen thatthe chemical shrinkage as well as the adiabatic heat release are related to theP-wave velocity by a power law trend (y = atb). It should be noted that thistrend exists consistently regardless of the addition of admixtures, the type of thetest material (mortar, concrete) or the w/c-ratio.
8.3.5 Comparison of the Sensitivity of the Methods
To objectively compare the wave reflection and pulse velocity method in theirability to monitor the setting process of fresh mortar or concrete it is important toanalyse how sensitive these methods are when applied to materials with differenthydration kinetics. In figure 8.6 the results of wave reflection and pulse velocitymeasurements on mortars containing different chemical admixtures are presented.It can be seen that distinct differences can be found in the developments of thereflection loss (subfigure a) and the P-wave velocity (subfigure b). The curvesrepresenting the mortar containing accelerator start to increase first and with thehighest rate of change. Accordingly, reflection loss and P-wave velocity measuredfor the mortar containing retarder increase at a much later time with a lower rateof change.
Based on this comparison it can be stated that both methods reproduce thedifferences in the setting behavior of the mortars caused by the admixtures.Evaluated on a qualitative basis the methods give almost identical results. Thecurves have the same order with the same relative separation in time. If theresults are compared quantitatively important differences can be found that originfrom the different wave types used for the measurements. The reflection loss ofthe the mortar containing retarder, for example, remains on a very low and

8.4 Conclusions 173
0.0
0.2
0.4
0.6
0.8
1.0
0 6 12 18 24 30 36 42 48
Time (h)
Re
fle
ctio
nL
oss
(dB
)
Portland cement mortar
w/c = 0.6,accelerator 0.8% of cement
w/c = 0.55,air entrainer 0.2% of cement
w/c = 0.6,retarder 0.4% of cement
(a) Wave reflection method
0
1000
2000
3000
4000
0 6 12 18 24 30 36 42 48
Time (h)
P-W
ave
Ve
locity
(m/s
)
w/c = 0.6,accelerator 0.8% of cement
w/c = 0.55,air entrainer 0.2% of cement
w/c = 0.6,retarder 0.4% of cement
Portland cement mortar
(b) Pulse velocity method
Fig. 8.6: Comparison of wave reflection and P-wave velocity measurements on mortars containingaccelerator, retarder, and air entrainer
constant level until it increases relatively rapidly at about nine hours. Whereasthe P-wave velocity of the same mortar starts to increase steadily immediatelyafter the beginning of the measurements. The onset of the hydration reaction isindicated by a slope change of the curve at about nine hours signaling a fasterincrease of the wave velocity.
8.4 Conclusions
The investigations described in the previous sections have shown that both, thewave reflection and the pulse velocity method have the ability to qualitativelyand quantitatively monitor the hydration behavior of early age cementitious ma-terials. The reflection loss measured with shear waves is per definition related tothe dynamic shear modulus of the tested material whereas the P-wave velocity isphysically related to the dynamic Young’s modulus. The consistent existence ofthe linear and power law type relationships of reflection loss and P-wave velocityto chemical shrinkage and adiabatic heat release as direct measures of cement hy-dration can be attributed without much doubt to these physical relationships. Toeffectively apply either of the proposed methods it is essential to know and cor-rectly account for the relationship between the ultrasonic measurements and thedifferent parameters that describe the setting and hardening of the test material.
Chapter 9
A Constitutive Model for Early-Age Cement
Mortar
9.1 Objective
The investigations presented in this chapter are aimed at developing a conceptthat uses and combines essential relationships determined in the experimentalstudy and the numerical simulation. The primary purpose of this concept is toprovide a tool to explain the interrelation between WR-measurements, key me-chanical properties and fundamental microstructural characteristics of the ma-terials tested within this study. The development of the model consequentlyfollows the strategy of applying constitutive relationships between reflection loss,mechanical properties and intrinsic parameters of cementitious materials, insteadof using traditional empirical laws.
The results of the experimental and numerical investigations discussed in chap-ters 6 and 7 indicate that the reflection loss is governed by the properties of thecement paste or mortar phase of the tested materials. Consequently, the consti-tutive material model to be developed will provide the basis for determining earlyage properties of cement paste and mortar based on composition (e.g. w/c-ratio)and reflection loss measurements. The final goal is to develop the model in aform that requires no further experimental calibration.

9.2 Development of the Model 175
reflection loss
gel-space ratio concept
contact area concept
compressive strength
Fig. 9.1: Outline of constitutive material model to predict compressive strength from reflection lossmeasurements
9.2 Development of the Model
9.2.1 General Outline
The model is based on relationships originating from two different concepts. Onecomponent will include the results obtained from the experimental studies. Theinvestigations on the relationship between the reflection loss and microstructuralparameters of the tested materials (see sec. 6.6) have shown that the reflectionloss has a unique relationship to the gel-space ratio of the cement paste. Thisrelationship was found to be independent from the w/c-ratio. Results reportedby Powers (1958a,b) show that gel-space ratio has a unique relationship to thecompressive strength of cement paste and mortar, which makes this gel-spaceratio concept very useful for strength prediction purposes.
The second component of the model is based on the results of the numericalsimulations using HYMOSTRUC3D presented in chapter 7. It was found thatthe numerically determined specific contact area, as a parameter of cement paste,is uniquely related to the reflection loss measured on mortar. This relationshipis also not influenced by the w/c-ratio. The specific contact area itself was foundto be uniquely related to the compressive strength of the tested mortars.
In the following sections it will be shown how the mentioned relationships canbe used to determine the development of the compressive strength of plain cementpaste and mortar based on reflection loss measurements. First, each relationshipwill be analyzed and evaluated separately. For the benefit of a higher predictionaccuracy the relationships will then be combined to a single model by meansof multiple nonlinear regression analysis. The outline of the proposed model isgiven in figure 9.1.
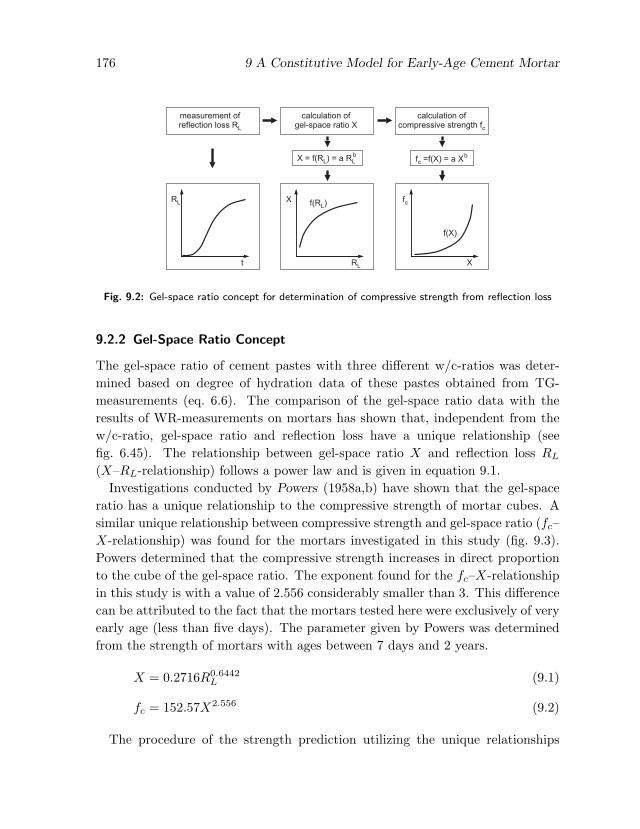
176 9 A Constitutive Model for Early-Age Cement Mortar
RL
X
X = f( = a RLb
R )L fc =f(X) = a Xb
fc
X
f(R )L
f(X)
calculation ofgel-space ratio X
calculation ofcompressive strength fc
measurement ofreflection loss RL
t
RL
Fig. 9.2: Gel-space ratio concept for determination of compressive strength from reflection loss
9.2.2 Gel-Space Ratio Concept
The gel-space ratio of cement pastes with three different w/c-ratios was deter-mined based on degree of hydration data of these pastes obtained from TG-measurements (eq. 6.6). The comparison of the gel-space ratio data with theresults of WR-measurements on mortars has shown that, independent from thew/c-ratio, gel-space ratio and reflection loss have a unique relationship (seefig. 6.45). The relationship between gel-space ratio X and reflection loss RL
(X–RL-relationship) follows a power law and is given in equation 9.1.Investigations conducted by Powers (1958a,b) have shown that the gel-space
ratio has a unique relationship to the compressive strength of mortar cubes. Asimilar unique relationship between compressive strength and gel-space ratio (fc–X-relationship) was found for the mortars investigated in this study (fig. 9.3).Powers determined that the compressive strength increases in direct proportionto the cube of the gel-space ratio. The exponent found for the fc–X-relationshipin this study is with a value of 2.556 considerably smaller than 3. This differencecan be attributed to the fact that the mortars tested here were exclusively of veryearly age (less than five days). The parameter given by Powers was determinedfrom the strength of mortars with ages between 7 days and 2 years.
X = 0.2716R0.6442L (9.1)
fc = 152.57X2.556 (9.2)
The procedure of the strength prediction utilizing the unique relationships

9.2 Development of the Model 177
0
10
20
30
40
50
60
0.0 0.2 0.4 0.6 0.8
Gel-Space Ratio X (-)
Co
mp
ressiv
eS
tre
ng
th(M
Pa
) w/c = 0.35w/c = 0.50 R = 0.9736w/c = 0.60
2
f = 152.57 Xc2.556
f c
Fig. 9.3: Relationship between compressivestrength and gel-space ratio for mortars withw/c = 0.35, 0.50, 0.60
0
10
20
30
40
50
0 10 20 30 40 50
calculated Compressive Strength (MPa)m
ea
su
red
Co
mp
ressiv
eS
tre
ng
th(M
Pa
) w/c = 0.35w/c = 0.50 R = 0.9426w/c = 0.60
2
prediction range: 4 - 102 h
prediction basis: gel-space ratio
Fig. 9.4: Comparison of compressive strengthmeasured and calculated from gel-space ratioconcept (Eqs. 9.1 and 9.2)
between reflection loss, gel-space ratio and compressive strength is given in fig-ure 9.2. Starting with the in-situ measured reflection loss, the gel-space ratio isdetermined using the X–RL-relationship (eq. 9.1), which is then translated intocompressive strength using the fc–X-relationship from equation 9.2. The com-parison between the measured compressive strength and that computed with thegel-space ratio concept is given in figure 9.4. The quality of the correlation be-tween the two values is described by a coefficient of determination of R2 = 0.9426.
9.2.3 Contact Area Concept
The specific contact area Ac was introduced in chapter 7 as one of the outputparameters of the HYMOSTRUC3D model. The parameter describes the areathat provides contact between the single cement grains (fig. 7.6) and is a measureof the degree of the interparticle bonding of the cement particles considered bythe HYMOSTRUC3D model. The comparison between the specific contact areacalculated for cement pastes and the reflection loss measured on appropriate mor-tars has shown that both parameters are related by a unique trend independentfrom the w/c-ratio. The corresponding relationship (Ac–RL-relationship), whichis shown in figure 7.15, follows a bilinear trend. The transition point betweenthe two linear sub-trends is marked by the specific contact area value of 0.025.The parameters of the bilinear Ac–RL-relationship are given in equation 9.3.

178 9 A Constitutive Model for Early-Age Cement Mortar
RL
Ac
f ( ) = m R1 LRL + n
fc
Ac
f ( ) = a1b
A Ac c
calculation ofspec. contact area Ac
calculation ofcompressive strength fc
measurement ofreflection loss RL
t
RL
f ( ) = m R2 L + nRLf ( ) = m + n2 A Ac c
f (A )1 c
f ( )2 Acf (R )2 L
f (R )1 L
A =c f =c
Fig. 9.5: Contact area concept for determination of compressive strength from reflection loss
Ac =
{0.0153RL + 0.0007 for 0 < Ac ≤ 0.025
0.0546RL − 0.0588 for Ac ≥ 0.025(9.3)
fc =
{13074A1.9143
c for 0 < Ac ≤ 0.025
282.56Ac + 4.8913 for Ac ≥ 0.025(9.4)
Furthermore, it was found that the specific contact area of the simulated ce-ment pastes is also uniquely related to the compressive strength of the appropriatemortars. The relationship between these two parameters (fc–Ac-relationship) issubdivided into two separate trends, one following a power law (early age) andone being linear in nature (later age). The fc–Ac-relationship is shown in fig-ure 7.16 and the parameters are given in equation 9.4. The transition betweenthe sub-trends is marked by the same specific contact area value found for theAc–RL-relationship (Ac = 0.025).
The application of the contact area concept for the strength prediction ofmortar is schematized in figure 9.5. By using the Ac–RL-relationship from equa-tion 9.3 and the fc–Ac-relationship from equation 9.4 the measured reflectionloss is converted into compressive strength. The agreement between the mea-sured and calculated compressive strength values for the tested mortar mixturesis given in figure 9.6. The accuracy of the prediction achieved by the contactarea concept, which is expressed by a R2-value of 0.9307, is somewhat lower thanthat obtained with the gel-space ratio concept.

9.2 Development of the Model 179
0
10
20
30
40
50
0 10 20 30 40 50
calculated Compressive Strength (MPa)
me
asu
red
Co
mp
ressiv
eS
tre
ng
th(M
Pa
) w/c = 0.35w/c = 0.50 R = 0.9307w/c = 0.60
2
prediction range: 3 - 102 h
prediction basis: spec. contact area
Fig. 9.6: Comparison of compressive strength measured and calculated from specific contact areaconcept (Eqs. 9.3 and 9.4)
9.2.4 Combination of Gel-Space Ratio and Contact Area Concept
In the previous two sections the gel-space ratio and contact area concepts wereused separately for determining the compressive strength of mortar. However, toincrease the accuracy of the strength prediction it is beneficial to combine the twoconcepts. This combined concept, which is outlined in figure 9.7, incorporatesthe relationships between reflection loss and the parameters gel-space ratio andspecific contact area in the same form as they were used before (eqs. 9.1 and9.3). Based on the reflection loss the gel-space ratio (fig. 9.7b) and the specificcontact area (fig. 9.7c) are calculated and then used to determine the compressivestrength. The improvement of the new combined concept originates from a two-parameter model that accounts for the influence of gel-space ratio and specificcontact area on compressive strength at the same time. The constants of thetwo-parameter model are determined by multiple nonlinear regression of gel-space ratio, specific contact area and compressive strength data. The generalform of the two-parameter model can be derived as shown in figure 9.7d.
fc =
{124.1144X2.3715 − 0.0368A−0.3384
c for 0 < Ac ≤ 0.025
30.7155X1.3220 + 208.278Ac − 1.6717 for Ac ≥ 0.025(9.5)
The two-parameter model as determined by the regression analysis is givenin equation 9.5. The model distinguishes between two ranges of values for the

180 9 A Constitutive Model for Early-Age Cement Mortar
RL
X
X = f ( = a RLb
R )L
calculation ofgel-space ratio X
measurement ofreflection loss RL
t
RL
RL
Ac
f ( ) = m R1 LRL + n
calculation ofspec. contact area Ac
f ( ) = m R2 L + nRL
f (R )2 L
f (R )1 L
calculation ofcompressive strength fc
f (X, ) = a X + a1b
A Acb
c
f (X, ) = + m + n2 A a X Acb
c
f(R )Lfc
X
f(X)
fc
Ac
f (A )1 c
f (A )2 c
+
+
A =c f =c
(a) (b) (c) (d)
Fig. 9.7: Combined concept for determination of compressive strength from reflection loss
specific contact area, with each range having a different form. The differentiationinto cases is necessary because of the type of the Ac–RL-relationship as part ofthe two-parameter model (eq. 9.4 and fig. 9.7d). The comparison of the measuredcompressive strength values and those calculated with the two-parameter modelis given in figure 9.8. The accuracy of the strength prediction is described bythe R2-value of 0.9897. To illustrate the improvement of the strength prediction
0
10
20
30
40
50
0 10 20 30 40 50
calculated Compressive Strength (MPa)
me
asu
red
Co
mp
ressiv
eS
tre
ng
th(M
Pa
)
w/c = 0.35w/c = 0.50 R = 0.9897w/c = 0.60
2
prediction range: 6 - 102 h
prediction basis: gel-space ratio andspec. contact area
Fig. 9.8: Comparison of measured and calcu-lated compressive strength for the combinedconcept (eqs. 9.1, 9.3 and 9.5)
Tab. 9.1: Parameters describing the accuracy ofthe strength prediction of the different concepts
concept R2 SEEa RSEEb
(–) (MPa) (%)
gel-space ratio 0.9426 3.07 18.4contact area 0.9307 3.61 20.8combined 0.9897 1.80 10.4astandard error of the estimatebrelative standard error of the estimate(see appendix B for definition)

9.3 Application of the Model 181
accuracy achieved by the combined concept the R2-values obtained from the gel-space ratio, contact area and combined concept are compared in table 9.1. Thistable also contains the values of the standard error of the estimate (SSE) andthe relative standard error of the estimate (RSEE) for the predictions basedon the three different concepts. The definitions of SEE and RSEE are givenin appendix B. It can be seen that the combined concept could decrease theparameters SEE and RSEE by nearly 50%.
9.3 Application of the Model
9.3.1 General Remarks
In the previous section, the developed model was applied to explain the experi-mental and numerical data that were used to calibrate the various constants ofthe different equations. These data were obtained from experiments and simu-lations conducted with cement paste and mortars with a certain mix proportioncured under defined conditions. In the interest of the general applicability of thederived model it has to be investigated if the relationships that form the basis ofthe model are valid also for materials or curing conditions different from thoseused for formulating the model. Since the range of the w/c-ratio that was usedfor the calibration experiments corresponds to that typically used for practicalapplications it will be investigated, if the developed concept can be applied formortars cured under different temperature conditions.
9.3.2 Portland Cement Mortars cured at different Temperatures
In this section it will be investigated if the developed model is applicable tomortars cured at temperatures different from that used for the calibration ex-periments (25°C). To conduct the verification, results of experiments on mortars,cured at temperatures of 15°C and 35°C, are used. The mortars, which havea w/c-ratio of 0.5, were cured isothermally in a water bath with the respectivewater temperature. During the period of the first four days after casting thereflection loss and compressive strength of the mortars was determined. Theexperimental results used in this section were provided by Sun (2004).
The results of the compressive strength predictions obtained with the com-bined concept as derived in section 9.2.4 is given in figure 9.9. It should be notedthat the shown strength predictions are solely based on the reflection loss mea-surements. The appropriate equations relating reflection loss, gel-space ratio,specific contact area and compressive strength were not modified by any means.

182 9 A Constitutive Model for Early-Age Cement Mortar
0
5
10
15
20
25
30
0 5 10 15 20 25 30
calculated Compressive Strength (MPa)
me
asu
red
Co
mp
ressiv
eS
tre
ng
th(M
Pa
)
prediction basis: gel-space ratio andspec. contact area
15°C: R = 0.9897
35
2
°C: R = 0.9783
15°C + 35°C: R = 0.9822
2
2
Portland cement mortarw/c = 0.5
Fig. 9.9: Verification of the compressivestrength prediction model for mortars curedat 15°C and 35°C (experimental data pro-vided by Sun, 2004)
Tab. 9.2: Accuracy of the strength predictionshown in figure 9.9
data R2 SEEa RSEEb
(–) (MPa) (%)
15°C 0.9897 1.58 10.135°C 0.9783 1.91 14.015°C + 15°C 0.9822 1.77 12.1astandard error of the estimatebrelative standard error of the estimate(see appendix B for definition)
The parameters describing the accuracy of the calculated compressive strengthvalues are given in table 9.2. The comparison of this data with the appropriatevalues for the combined concept listed in table 9.1 shows that the accuracy ofboth strength predictions is on a very similar level.
9.4 The Physical Nature of the Model
The model proposed in this chapter relates reflection loss measured on Portlandcement mortar to its compressive strength development at early ages. The modelis not based on a simple empirical correlation between both parameters. Instead,relationships are employed that relate reflection loss and compressive strength byusing two intermediate parameters that describe microstructural properties of theconsidered cementitious materials. These intermediate parameters are gel-spaceratio and specific contact area.
Both of these parameters have unique relationships to the reflection loss (mea-sured on cement mortars) that are independent from the investigated w/c-ratiosand curing temperatures. The uniqueness of these relationships arises from thenature of the WR-measurements. The reflection loss, measured on cement-basedmaterials with shear waves at early ages, is governed by the ability of the ce-

9.5 Further Research 183
ment particles to transfer shear forces. This ability, in turn, depends on how wellthese cement particles have become connected (percolated) due to the hydra-tion process. The specific contact area is a measure of exactly this interparticleconnectivity of the cement particles.
The discussed percolation process is a result of the expansion of the cementparticles due to the creation of hydration products. This expansion consumesthe unhydrous cement and by this is directly related to the overall degree ofhydration of the cement originally present in the mixture. The expansion alsoleads to a densification of the cementitious microstructure, since capillary porespace, originally filled with water, becomes occupied by various hydration prod-ucts. This densification, or decrease of capillary porosity, directly influences thepropagation of shear waves and by this the development of the reflection loss.Accordingly, the relationship between reflection loss and gel-space ratio, as aparameter combining degree of hydration and capillary porosity, seems to bephysically well founded.
Similar statements can be made concerning the compressive strength. Theability of a cementitious matrix to sustain external stresses intimately depends onhow much cement has hydrated to form a rigid lattice and on the amount of poresweakening the microstructure. The resulting relationship between gel-space ratioand compressive strength is well established and considered to be fundamentalin nature. The relationship between the specific contact area and compressivestrength is new and can be explained from a micromechanical point of view. Thelarger the area that connects the load transferring cement particles the higherthe force can be, until the critical stress is reached causing the considered systemto fail. Although the specific contact area is a theoretical parameter, obtainedfrom numerical simulation using a defined model approach, it can be very usefulin explaining microstructural phenomena in hydrating cement-based materials.
Based on this argumentation it can be concluded that the relationships thatform the proposed model have a physical origin. This justifies the assumptionthat the model can be applied to a defined group of cementitious materials with-out the need of individual calibration. Experimental evidence indicating thatthis assumption is correct has been presented.
9.5 Further Research
Further research is necessary to allow the application of this concept to a widerrange of materials. In its present form, the assumptions are valid for mortar

184 9 A Constitutive Model for Early-Age Cement Mortar
containing plain cement paste only. An important aspect would be to investigatethe effect of mineral admixtures, such as silica fume or fly ash, on the parametersgel-space ratio and contact area. Given the much smaller particle size of thesematerials it is to be expected that the determined relationships will be different.
Another important issue is to use this model to predict the compressive strengthof concrete. In this context it has to be determined to what extent the compres-sive strength of early age concrete is affected by the type and amount of coarseaggregates.

Chapter 10
Practical Application in Precast Production
10.1 Introduction
The industrial applicability of the wave reflection method was evaluated in afield trial in collaboration with the precast production plant, Rocky MountainPrestress, Denver, Colorado. The objective of this first field trial was to assessthe general suitability of the test method to monitor the curing process of full-scale concrete structures during the production process. The field measurementsshould also give information about how the test arrangement performs underfield conditions with respect to measuring location, equipment reliability, andpreparation efforts. This field trial can be considered as a first step towardscommercial application of the wave reflection method.
In agreement with the precast plant it was decided to choose the productionof prestressed box girders for the field trial. The production schedule of theprecast plant required the removal of the girders from the steel bed as soon asthe concrete has reached the critical strength that allows lifting the girders witha crane. A schematic and a photograph of a finished box girder are given infigures 10.1 and 10.2, respectively.
The aim of the field trial was to evaluate the ability of the wave reflectionmethod in determining the time when the critical concrete strength is reached.The determination of the compressive strength of a given concrete from in-situwave reflection measurements requires knowledge about the relationship betweenreflection loss and compressive strength for this specific concrete mix proportion.The current stage of the research requires the determination of this relationshipin advance with laboratory tests. In the following sections it will be described,

186 10 Practical Application in Precast Production
40 m
1.8 m
1.2 m
StyrofoamCore
PrestressCables
Fig. 10.1: Schematic of the box girder used forfield testing
Fig. 10.2: Finished box girder
how the results of the laboratory calibration experiments were used to allow thenondestructive determination of concrete strength in the field.
10.2 Laboratory Experiments
The laboratory experiments were conducted with concrete of the same mix pro-portion that were to be used for the box girder later in the plant. Additionally, theoriginal materials (cement, aggregates, admixtures) were provided by the plantand used for these experiments. The mix design of the tested concrete is iden-tical to that of Concrete C given in table 6.7. The laboratory experiments wereconducted in order to determine the relationship between compressive strengthand reflection loss (fc–RL-relationship) for the given concrete. Based on thisrelationship, the reflection loss measurements conducted in the field can be usedto derive the in-situ compressive strength.
Given the large size of the girder, it had to be expected that the in-situ temper-ature of the girder will be on a high level during the first hours of hydration. Toinvestigate the influence of high curing temperatures on the fc–RL-relationshipthe experiments were conducted at isothermal (25°C) and elevated temperatureconditions. The control of the curing temperature was accomplished by placingthe test specimens in the temperature controlled water bath given in figure 5.1.The results of the WR- and compressive strength measurements are given in fig-ures 10.3 and 10.4, respectively. It can be seen that the different curing regimesclearly affect the development of the tested parameters.
However, compressive strength and reflection loss are influenced by the differ-

10.3 Field Testing 187
ence in the curing temperature in the same way, which becomes obvious by com-paring the appropriate fc–RL-relationships given in figure 10.6. A single lineartrend line can be used to describe the dependency between compressive strengthand reflection loss despite the differences in the curing temperature. The fc–RL-relationship that will be used to evaluate the WR-measurements conducted inthe precast plant is given in equation 10.1.
fWRc = 19.253RL − 9.5312 (10.1)
10.3 Field Testing
10.3.1 Test Equipment and Setup
To conduct the field measurements it was necessary to make the test equipmentportable. This was achieved by placing the different electronic devices into aportable case. The arrangement of the equipment for the wave reflection testand in-situ temperature measurements in a durable and portable case is shownin figure 10.7. All components are connected ready for use, and the case featuresa main power switch and a main power inlet for all components. The case caneasily be moved on the construction site and allows for minimal setup timesduring field testing.
The WR-measurements were performed by instrumenting the girder with twoseparate transducer-steel plate combinations located on the top-surface of the
0
1
2
3
0 6 12 18 24 30 36
Time (h)
Re
fle
ctio
nL
oss
(dB
)
heat cured
cured at 25 C°
Concretew/c = 0.32
Fig. 10.3: Reflection loss development for dif-ferent curing regimes
0
10
20
30
40
50
0 6 12 18 24 30 36
Time (h)
Co
mp
ressiv
eS
tre
ng
th(M
Pa
)
heat cured
cured at 25°C
Concretew/c = 0.32
Fig. 10.4: Compressive strength developmentfor different curing regimes

188 10 Practical Application in Precast Production
20
25
30
35
40
45
50
0 6 12 18 24
Time (hours)
Co
ncre
teT
em
pe
ratu
re(°
C) heat curing
isothermal curing
Fig. 10.5: Temperature development for differ-ent curing regimes
f = 19.253 R - 9.5312c L
R = 0.95782
0
10
20
30
40
50
0.5 1.0 1.5 2.0 2.5 3.0
Reflection Loss (dB)
Co
mp
ressiv
eS
tre
ng
th(M
Pa
)
cured at 25°C
heat cured
Fig. 10.6: Relationship between compressivestrength and reflection loss determined from lab-oratory experiments
girder (arrows in fig. 10.8). Part of the objectives of the field trial was alsoto investigate the sensitivity of the WR-method to differences in the settingand hardening of the concrete within a given structure due to local temperaturedifferences. Therefore, one steel plate was placed above the massive end of thegirder and the other above the internal styropor block. The steel plates whereput in place after the concrete was completely placed and the top surface wasfinished with the rake.
Additionally, the girder was instrumented with thermocouples at different loca-tions to track the temperature rise in the girder during hydration. A data logger,which was part of the portable test setup, recorded the temperature in regulartime intervals throughout the hardening process. The complete field test setupshowing the locations of the wave reflection and temperature measurements isgiven in figure 10.9.
10.3.2 Results
The results of the field measurements consist of two components: the in-situtemperature developments (fig. 10.10) and the in-situ reflection loss evolution(fig. 10.11). The results of the temperature measurements give a good pictureabout the progress of the setting and hardening of the concrete with respect tothe location of the girder. It can be seen that hydration progresses fastest atlocations a○ and b○, which are at the end of the girder were the largest concretemass is concentrated. This is indicated by the earliest temperature increasewith the highest maximum value measured at these locations. The temperatures

10.3 Field Testing 189
Fig. 10.7: Equipment for wave reflection and in-situ temperature measurements for field testing
Fig. 10.8: Field measurements on box girdershortly after placing the concrete
measured near the top surface of the girder (locations d○ and e○), where theWR-measurements are performed, are on a much lower level (∆T ≈ 20K). Alsobetween these locations, differences in the setting and hardening progress canbe observed. At location d○, which is above the massive end part of the girderthe temperature increases earlier and faster than that at location e○. Duringthe course of hydration the temperature difference between these two locationsreaches up to 13 K.
Mode Gain
GainDampingMode
Pulse Height
styroportemperaturelogger
wave reflectionmeasurements
ch. 1 ch. 2concrete
prestress cables
ch. 1 ch. 2
steel formwork
b
ca
b
ca
side view
d ed e
f
companioncylinders
f
Fig. 10.9: Schematic of test setup for field trial

190 10 Practical Application in Precast Production
20
30
40
50
60
70
0 3 6 9 12 15 18
Time (h)
Co
ncre
teT
em
pe
ratu
re(°
C)
b
c
a
d
eheat cure(from lab tests)
in-situ temperature
16:00 19:00 22:00 1:00 4:00 7:00 10:00
temperature drop onsurface at night
average
Fig. 10.10: In-situ concrete temperature mea-sured during field testing
0.0
0.5
1.0
1.5
2.0
2.5
3.0
0 3 6 9 12 15 18
Time (h)
Re
fle
ctio
nL
oss
(dB
) d
e(ch. 1)
(ch. 2)
in-situ reflection loss
average
Fig. 10.11: In-situ reflection loss measured dur-ing field testing
The reflection loss curves measured at locations d○ and e○, which are givenin figure 10.11, reproduce the trend indicated by the corresponding temperaturemeasurements. The curve representing location d○ starts to increase earlier andwith a slightly higher rate of change. For the further evaluation the averageof the reflection loss values measured at the two locations will be used. Theresulting curve is also shown in figure 10.11. The temperature history that corre-sponds to this new reflection loss curve is obtained by averaging the appropriatetemperature developments (fig. 10.10).
The next step in analyzing the obtained measurements is to transform thereflection loss values into compressive strength (fWR
c ) by using the fc–RL-re-lationship from equation 10.1. To verify this prediction, the strength data willbe compared to results of actual compression test (fcyl
c ) obtained from cylinderspecimens conducted in the quality control laboratory of the precast plant. Thetested cylinders were cast with concrete belonging to the batch that was usedfor the part of the girder monitored by the wave reflection and temperaturemeasurements. These cylinders were cured in temperature controlled molds. Thetemperature of these molds was continuously adjusted to the in-situ temperatureof the girder measured at the midpoint of the girder length and half of the girderheight (location f○ in figure 10.9). The temperature history of this location issimilar, but not identical, to the average temperature of locations d○ and e○. Atotal number of four cylinders was tested.
Given the difference in the temperature history of the considered locations andthe resulting differences in hydration progress, the correct evaluation requires thedefinition of a common scale, which allows for these temperature discrepancies.

10.3 Field Testing 191
0
10
20
30
40
50
0 12 24 36 48
Equivalent Age (h)
Co
mp
ressiv
eS
tre
ng
th(M
Pa
)
strength determinedin precast plant(on cylinder)
strength from lab tests(on cylinder)
in-situ strength determinedwith WR-method
heat cured
cured at 25°C
data from lab testsresults from field
from reflection loss
plant quality control
Fig. 10.12: Comparison between compressive strength predicted from in-situ WR-measurementsand cylinder strength determined in the precast plant
This is accomplished by determining the equivalent age of the concrete at thelocations of interest with respect to isothermal curing conditions of 25°C. Theequivalent age te is determined with equation 10.2, which is based on the Arrhe-nius equation.
te =t∑0
e−ER ( 1
273+T − 1273+Tr
) ·∆t (10.2)
te equivalent age at the reference curing temperature, (h)T average temperature of concrete during time interval ∆t, (°C)Tr reference temperature, (°C)E activation energy, (E = 33500 J/mol for T ≥ 20°C, Carino, 2004a, 5-6)R universal gas constant, (R = 8.3144 J/(mol K))
The comparison of the cylinder strength (fcylc ) determined by the quality con-
trol of the precast plant and the compressive strength nondestructively deter-mined from the WR-measurements (fWR
c ) is given in figure 10.12. The compres-sive strength development of the concrete obtained from the advance laboratorytests is also given in the figure for reference. All compressive strength values areplotted with respect to the equivalent age of the individual locations or speci-mens. As mentioned previously, the compressive strength values were determinedfrom the average of the reflection loss curves shown in figure 10.11.
First, it should be noted that the nondestructively determined strength val-
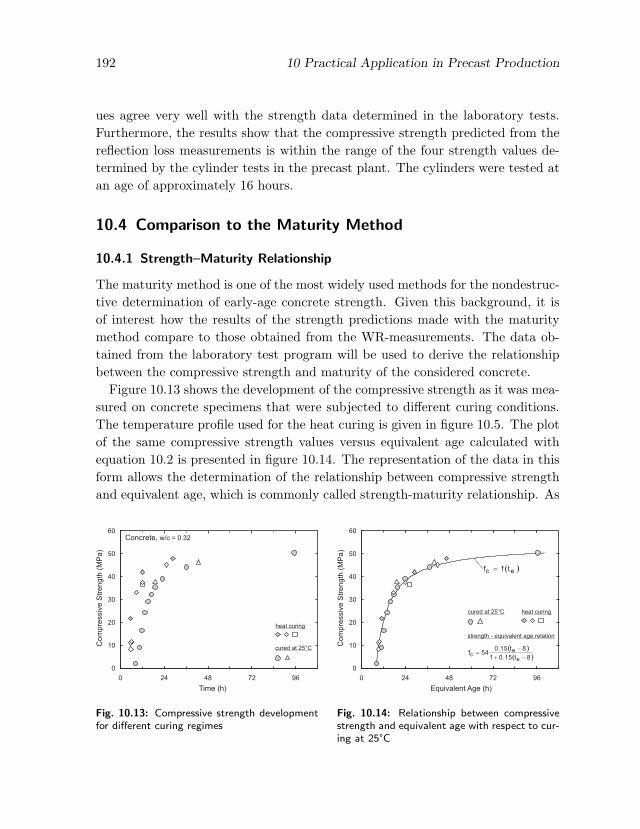
192 10 Practical Application in Precast Production
ues agree very well with the strength data determined in the laboratory tests.Furthermore, the results show that the compressive strength predicted from thereflection loss measurements is within the range of the four strength values de-termined by the cylinder tests in the precast plant. The cylinders were tested atan age of approximately 16 hours.
10.4 Comparison to the Maturity Method
10.4.1 Strength–Maturity Relationship
The maturity method is one of the most widely used methods for the nondestruc-tive determination of early-age concrete strength. Given this background, it isof interest how the results of the strength predictions made with the maturitymethod compare to those obtained from the WR-measurements. The data ob-tained from the laboratory test program will be used to derive the relationshipbetween the compressive strength and maturity of the considered concrete.
Figure 10.13 shows the development of the compressive strength as it was mea-sured on concrete specimens that were subjected to different curing conditions.The temperature profile used for the heat curing is given in figure 10.5. The plotof the same compressive strength values versus equivalent age calculated withequation 10.2 is presented in figure 10.14. The representation of the data in thisform allows the determination of the relationship between compressive strengthand equivalent age, which is commonly called strength-maturity relationship. As
Concrete, w/c = 0.32
0
10
20
30
40
50
60
0 24 48 72 96
Time (h)
Co
mp
ressiv
eS
tre
ng
th(M
Pa
)
cured at 25°C
heat curing
Fig. 10.13: Compressive strength developmentfor different curing regimes
0
10
20
30
40
50
60
0 24 48 72 96
Equivalent Age (h)
Co
mp
ressiv
eS
tre
ng
th(M
Pa
)
cured at 25°C heat curing
( )( )8t15.01
8t15.054f
e
ec
-+
-=
strength - equivalent age relation
( )ec tff =
Fig. 10.14: Relationship between compressivestrength and equivalent age with respect to cur-ing at 25°C

10.4 Comparison to the Maturity Method 193
the general form of this relationship the function from equation 6.1 was choosen;the exact form is given in equation 10.3.
fMc (t) = 54
0.15 (te − 8)1 + 0.15 (te − 8)
(10.3)
10.4.2 Comparison of Predictions
It will now be investigated how the strength predictions made with the twomethods compare to each other and to the strength of the companion cylinders(fcyl
c ) determined by the precast plant. To calculate the strength prediction ofthe maturity method (fM
c ), the equivalent age of the concrete at location f○ isused together with equation 10.3. Since the temperature measured at this pointwas also used for regulating the curing of the companion cylinders the concrete atlocation f○ and that of the companion cylinders has always the same equivalentage at any given moment in real time. Consequenlty, the strength values fcyl
c
and fMc can directly be compared in real time.
The strength predictions made by the WR-reflection method (fWRc ) refer by
definition to the location where the measurements are performed. To relate thestrength prediction fWR
c to the cylinder strength fcylc a simple comparison of the
equivalent age at the appropriate locations must be performed. The developmentof the equivalent ages at the location of the WR-measurements (tWR
e ) and at lo-cation f○ (tcyl
e ) is given in figure 10.15. The figure shows that if a comparison isto be made at an age of 14 hours then the strength value fcyl
c that was measured
0
5
10
15
20
25
0 2 4 6 8 10 12 14 16 18
Time (h)
Eq
uiv
ale
ntA
ge
(h)
teWR te
cyl
tWR
=14.5 h
te=19.6 h
tcyl
= 14.0 h
Fig. 10.15: Comparison of equivalent ageat location f○ and the location of the WR-measurements
10
15
20
25
30
35
40
8 10 12 14 18
Time (hours)
Co
mp
ressiv
eS
tre
ng
th(M
Pa
)
in-situ strength determinedwith WR-method
in-situ strength determinedwith maturity method
strength determinedin precast plant(on cylinder)
16
Fig. 10.16: Comparison of strength predictionsmade with maturity and WR-method with cylin-der strength determined in the precast plant

194 10 Practical Application in Precast Production
at that time must be compared to the strength value fWRc calculated from the
reflection loss measured 0.5 hours later, at 14.5 hours. Hence, given the availabil-ity of the temperature history, the compressive strength of the concrete at anylocation of the girder can be determined by local, near surface WR-measurementswhen this procedure is used.
The development of the in-place compressive strength as predicted with the twomethods along with the strength measured on the cylinder specimens are shownin figure 10.16. The data are plotted versus real age and refer to the location f○of the girder. It can be seen that the strength predictions obtained from bothmethods is located within the range of the cylinder strength values determinedin the plant. Except for ages earlier than ten hours the strength values predictedwith the WR-method and the maturity method follow very similar trends.
10.4.3 Comment on the Use of the Maturity Method
As it is shown in the previous section the application of the maturity method canbe very useful and effective in predicting the in-place strength gain of concrete atearly ages. However, the nature of the method, which is measuring the temper-ature, as a non-physical parameter of the concrete, bears a number of risks andpotential pitfalls. The Pennsylvania Department of Transportation has publishedan extensive report about the use of the maturity method for quality assuranceand quality control (Tikalsky et al., 2001). In that report it is emphasized thatthe in-situ strength can only reliably be predicted when the concrete that is usedin the field has exactly the same properties as the calibration concrete used inthe laboratory. Differences between field concrete and calibration concrete canbe caused by a number of reasons.
• It has been reported that maturity-strength relationships are sensitive tothe air content of the concrete, which can be influenced by pumping orother agitation. Concrete that was designed to be pumped but was notexposed to the pumping procedure during placing had about 10% to 15%lower strength than the calibration concrete.
• When field concrete is subjected to high temperatures in the very earlyage (e.g. hot weather concreting), the long-term strength potential is lowerthan that of the calibration concrete that was not subjected to high early-age temperatures. In this case the maturity method would overestimatecompressive strength at the later ages.

10.5 Conclusions 195
• Insufficient curing of the field concrete (e.g. evaporation of water from un-covered surface, self-desiccation of concretes with low w/c ratios when notmoist cured) will alter the strength gain with respect to the calibrationconcrete, which is usually cured properly.
Because of these and other limitations, the Standard Practice for Estimat-ing Concrete Strength by the Maturity Method ASTM C1074 requires that thematurity method is “to be supplemented by other indications of the potentialstrength of the concrete mixture”. In conclusion, since the maturity methoddoes not measure a physical material property, it cannot give any informationon how well the field concrete that is under testing matches the calibration con-crete that was used in the lab. Differences resulting from composition, handling,and/or curing remain undetected and impose inaccuracies to the strength pre-diction. The results of the field trial conducted in the precast plant demonstratethat the WR-technique can be considered as a serious alternative or supplemen-tal method with the ability to monitor fundamental concrete properties in-situon the structure.
10.5 Conclusions
The presented results of the field trial with the WR-method have shown thatthis method can be used to follow the early compressive strength gain of con-crete structures under field conditions. It was shown that the relationship be-tween compressive strength and reflection loss is not influenced by the curingtemperature of the tested concrete. This becomes clear especially by observ-ing the significant difference between the curing regime used for the laboratoryexperiments and the temperature history measured in-situ during the field test(fig. 10.10).
As another important outcome of the field trial it could be shown that thesetting and hardening process of the bulk concrete in the structure can be followedbased on near-surface WR-measurements. This is accomplished by combiningreflection loss readings with in-situ temperature measurements at the locationsof interest. Based on the temperature readings the equivalent age of the concreteat different locations can be determined easily. The compressive strength at acertain location (not accessible for WR-measurements) can then be determinedby relating the equivalent age of that location to the equivalent age of the locationwhere the reflection loss measurements were conducted.

Chapter 11
Conclusions and Future Work
11.1 Conclusions
In this section the conclusions that can be drawn from the conducted experimen-tal and numerical investigations are presented. The individual conclusions aresummarized into several groups according to the nature of the findings.
Setting Process The reflection loss measured with the wave reflection methodcan be used to qualitatively and quantitatively evaluate the setting behavior ofcementitious materials. This conclusion is based on the following findings:
(1) The comparison of reflection loss and in-situ temperature measurements onsetting cement mortar has shown that both parameters start to increase atthe same time. Since an increase of the temperature indicates the beginningof the cement setting the reflection loss can be considered as an indicatorof this process (see sec. 6.2.1 and 8.3.2).
(2) Wave reflection measurements on cement mortars containing acceleratorand retarder clearly show the effect of the admixtures. The patterns exis-tent in the reflection loss curves were also observed in the development ofthe rate of the adiabatic heat evolution, which is a well established measureof the setting behavior of mortar (see sec. 6.2.2).
(3) The development of the penetration resistance and the reflection loss mea-sured on mortars with three different w/c-ratios show very similar patterns.The initial setting time derived from the penetration resistance refers to adefined range of the reflection loss independent of the w/c-ratio. This indi-

11.1 Conclusions 197
cates that the reflection loss can be used as a quantitative measure of theinitial setting time (see sec. 6.2.3 and sec. 8.3.1).
Compressive Strength The reflection loss was found to be in close relationshipwith the evolution of the compressive strength of mortar and concrete and canbe used to quantitatively follow the compressive strength gain. The followingfindings can be reported:
(1) It was found that under the condition of isothermal curing, reflection lossand compressive strength of mortar and concrete start to increase accordingto a power law. After the setting process the growth characteristic of bothparameters changes to a hyperbolic trend (see sec. 6.3.1).
(2) Reflection loss and compressive strength measured on mortar or concretehave a bilinear relationship for early ages. After approximately 15 hoursboth parameters are related by a single linear trend function, which is validfor up to three to five days (see sec. 6.3.1 and 6.3.3.1).
(3) Experiments conducted under outdoor temperature and humidity condi-tions have shown that the linearity of the relationship between reflectionloss and compressive strength is not affected by changing curing tempera-tures (see sec. 6.3.3.2).
(4) The relationship between reflection loss and compressive strength measuredon plain cement mortars was found to be independent of the w/c-ratio.However, from experiments conducted with concrete it can be assumedthat the addition of mineral admixtures, such as fly ash, influences thisrelationship (see sec. 6.3.1 and 6.3.3.1).
Dynamic Shear Modulus The reflection loss measured with shear waves is phys-ically related to the dynamic shear modulus of the tested materials. The exper-iments have shown that the reflection loss is governed by the dynamic shearmodulus of the cement paste phase of mortar and concrete. This conclusion issupported by the following findings:
(1) The dynamic shear modulus derived from reflection loss measured on con-crete is linearly related to that determined from the concrete compressivestrength using empirical relationships. The comparison of the absolute val-ues of these parameters shows that the wave reflection method measures

198 11 Conclusions and Future Work
the shear modulus of the mortar or cement paste phase of the concrete (seesec. 6.4.2).
(2) The dynamic shear modulus derived from reflection loss measured on mor-tar (Gd,WR) follows the trend of the dynamic shear modulus calculatedfrom the torsional resonant frequency (Gd,RF ). The absolute value of themodulus measured with the reflection loss is only about 50% of that mea-sured with the resonant frequency method. The dynamic shear modulus de-rived from resonant frequency measurements on appropriate cement pastesand the dynamic shear modulus Gd,WR develop on very similar levels (seesec. 6.4.3).
Measures of Cement Hydration The reflection loss measured on mortar wasfound to be directly and linearly related to the progress of cement hydration asmeasured by several, well established parameters. The following results can bereported:
(1) The reflection loss measured on mortar follows the exact same trend as thedegree of hydration of the cement paste phase of this mortar determinedfrom the amount of the non-evaporable water. Hence, both parameters arelinearly related (see sec. 6.5.2).
(2) The reflection loss and adiabatic heat release measured on mortar are lin-early related for early ages (see sec. 8.3.3).
(3) The reflection loss measured on mortar is linearly related to the amount ofcalcium hydroxide (Ca(OH)2) of the cement paste phase of the mortar (seesec. 6.5.3).
(4) The reflection loss measured on mortar is linearly related to the chemicalshrinkage of the cement paste phase of the mortar (see sec. 6.5.4).
Microstructural Parameters The reflection loss is intimately related to para-meters directly describing the microstructure of cementitious materials. Some ofthese relationships are general in nature, that is independent from the w/c-ratioof the tested materials. It was shown that the reflection loss can be consideredas a direct measure of the gradual evolution of solid microstructure caused bythe hydrating cement particles. The following results were obtained from exper-imental and numerical investigations:
11.1 Conclusions 199
(1) The reflection loss measured on mortar is linearly related to the capillaryporosity of the cement paste phase of the mortar (see sec. 6.6.2).
(2) The reflection loss measured on mortar is uniquely related to the gel-spaceratio of the cement paste phase of the mortar. This relationship is inde-pendent of the w/c-ratio and follows a power law (see sec. 6.6.3).
(3) The HYMOSTRUC3D model was used to numerically determine the occur-rence of the percolation threshold of the hydrating cement particles. Theoccurrence of this percolation threshold and the time of increase of the ap-propriate reflection loss are very similar for the tested cement mortars (seesec. 7.3.4.1).
(4) After the percolation threshold has occurred the reflection loss follows thetrend of the volume fraction of the connected solid phase of the cementpastes simulated by the HYMOSTRUC3D model (see sec. 7.3.4.1).
(5) The development of the reflection loss at later ages follows that of thetotal solid phase and is represented by a moderate or low growth rate (seesec. 7.3.4.1).
(6) The reflection loss measured on mortar is uniquely related to the specificcontact area of simulated cement paste. This implies that the reflection lossis a measure of the degree of the interparticle bonding in the cementitiousmicrostructure (see sec. 7.3.4.2).
(7) The compressive strength of cement mortar is uniquely related to the spe-cific contact area calculated by HYMOSTRUC3D (see sec. 7.3.4.3).
Constitutive Modeling The unique relationships between reflection loss, gel-space ratio, specific contact area, and compressive strength can be combinedto a two-parameter model that allows the prediction of the mortar compressivestrength at early ages (up to 4 days) from the measured reflection loss only. Themodel has the following salient features:
(1) This model requires no further calibration for w/c-ratio or curing temper-ature if it is applied to plain Portland cement mortar (see sec. 9.2.4 and9.3).
(2) Instead of using simple empirical correlations, the model employs physi-cally defendable relationships of the parameters reflection loss and com-pressive strength to intrinsic properties of the cementitious microstructure(see sec. 9.4).

200 11 Conclusions and Future Work
Comparison to Pulse Velocity Method Comparative measurements on identi-cal materials with the wave reflection and the P-wave velocity method have shownthat both methods have a good ability to monitor the transition of cement-basedmaterials from fresh to hardened state. Reflection loss (measured with shearwaves) and P-wave velocity are physically related to the dynamic shear andYoung’s modulus, respectively. To effectively apply either of the two methodsit is essential to know and correctly account for the relationship between theultrasonic measurements and the material parameter of interest. The followingstatements can be made to detail this conclusion.
(1) While the reflection loss has a linear relationship to direct measures of ce-ment hydration, such as chemical shrinkage and adiabatic heat release, theP-wave velocity was found to be related to these parameters by a powerlaw trend. This trend exists consistently regardless of the addition of ad-mixtures, the type of the test material (mortar, concrete) or the w/c-ratio(see sec. 8.3.4).
(2) The differences in the measurements of the two methods origin from thetype of the stress waves that are used. The experiments showed that the P-wave velocity is sensitive to the very early formation of hydration products(ettringite) as well as to the internal settlement of the cement and sandparticles due to gravity. The reflection loss, which is based on shear wavepropagation, remains unaffected at this early stage, since no rigid bondsare created by those processes (see sec. 8.3.1).
(3) Measurements with both methods on mortars containing accelerator andretarder have reproduced the differences in the setting behavior caused bythe admixtures. Evaluated on a quantitative basis the methods give almostidentical results. The curves have the same order with the same relativeseparation in time (see sec. 8.3.5).
Practical Application of the Wave Reflection Method A field trial with thewave reflection method has shown that this method can be used to nondestruc-tively determine the in-situ compressive strength of concrete structures at earlyages. This requires the advance determination of the relationship between reflec-tion loss and compressive strength by laboratory experiments. The applicabilityof the wave reflection method for field testing is further detailed by the followingfindings:
11.2 Future Work 201
(1) The relationship between compressive strength and reflection loss is notinfluenced by the curing temperature of the tested concrete. This impliesthat the temperature conditions of the laboratory calibration experimentsand the curing of the concrete in the field can be different (see sec. 10.2).
(2) The near-surface reflection loss measurements can be used to follow thesetting and hardening process of the bulk concrete in a structure. This isaccomplished by combining reflection loss readings with in-situ temperaturemeasurements at the locations of interest (see sec. 10.4.2).
(3) The comparison of the strength predictions made with the wave reflectionmethod and the maturity method has shown that both methods can predictthe in-situ concrete strength with similar accuracy (see sec. 10.4).
11.2 Future Work
Based on the investigations conducted within the scope of this thesis it wasidentified that further work on the issues given below would be very beneficialfor the development of the proposed wave reflection method.
• The electronic equipment necessary to conduct the wave reflection measure-ments should be condensed to a handheld device that would result in anultimate portability of the method. This would also allow to perform dis-continuous measurements on multiple locations with a single data collectiondevice and reduce the equipment costs for potential users.
• To promote a better acceptance of the wave reflection method by the prac-titioner community, recommendations for the proper use of the methodshould be developed. The RILEM Committee TC ATC-185 — Advancedtesting of cement-based materials during setting and hardening — is work-ing in this direction. The wave reflection method will be part of a State-of-the-Art-Report that will be compiled by the committee by the end of2004.
• The constitutive model developed in chapter 9 should be extended to allowits application to materials containing different mineral admixtures, suchas fly ash and silica fume. It should also be investigated how the knowl-edge about the compressive strength of mortar can be used to predict thestrength of the appropriate concrete.
Appendix A
Evaluation of Thermogravimetric
Measurements
A.1 Determination of Loss of Ignition
For the correct evaluation of thermogravimetric measurements the loss of ignitionof the used cement must be known. The determination of the loss of ignition ofthe original cement relative to its original mass (L0/900) and its mass at 105°C(L105/900) is derived below.
initial mass of original cement powder: mc0 = c
mass of original cement powder at 105 °C : mc105 = c
mass of original cement powder at 900 °C : mc900 = c− cL = c (1− L)
A.2 The Non-evaporable Water Content after Powers
Powers (1949) has derived a procedure to determine the non-evaporable wa-ter content of hydrated cement paste from its loss of ignition after heating to1000°C. The procedure was developed for cement paste samples that were testedin dry condition (evaporable water was removed). For the presented investi-gations, Powers method was extended for the determination of the evaporablewater content of cement paste samples in saturated surface dry condition. Thecomplete derivation of the equations for calculating the amount of the total andnon-evaporable water in grams per gram of original cement is given below.

A.2 The Non-evaporable Water Content after Powers 203
loss of ignition of cement
relative to initial mass relative to mass at 105°C
mc900
mc0
=c(1− L0/900
)c
mc900
mc105
=c(1− L105/900
)c
mc900
mc0
= 1− L0/900mc
900
mc105
= 1− L105/900
L0/900 = 1− mc900
mc0
L105/900 = 1− mc900
mc105
amount of total water: wt
amount of non-evaporable water: wn
mass of original cement: c
loss of ignition: L
initial mass of cement paste: m0 = c + wt
mass retained at 105 °C: m105 = c + wn
mass retained at 900 °C: m900 = c− cL
amount of total water amount of non-evaporable water
m0
m900=
c + wt
c(1− L0/900
) m105
m900=
c + wn
c(1− L105/900
)1 +
wt
c=
m0
m900
(1− L0/900
)1 +
wn
c=
m105
m900
(1− L105/900
)wt
c=
m0
m900
(1− L0/900
)− 1
wn
c=
m105
m900
(1− L105/900
)− 1

204 A Evaluation of Thermogravimetric Measurements
A.3 The Non-evaporable Water and Calcium Hydroxide Contentafter El-Jazairi and Illston
El-Jazairi and Illston (1977, 1980) have developed a procedure to determine theamount of non-evaporable water and calcium hydroxide. Their original methoddoes not account for the loss of ignition of the cement. For the purpose of thisinvestigation the concept of El-Jazairi and Illston was extended to allow for thecorrection of the loss of ignition. The derivation of the necessary equations aregiven below on the example of the dehydration and dehydroxylation loss. Thethe equation for determining the decarbonation loss can be derived analogous.
mass retained at 105 °C: m105 = c + wdh + wdx + wdc
mass retained at 440 °C: m440 = c + wdx + wdc
mass retained at 580 °C: m580 = c + wdc
mass retained at 900 °C: m900 = c− cL
dehydration loss: wdh = m105 −m440
dehydroxylation loss: wdx = m440 −m580
decarbonation loss wdc = m580 −m900
dehydration dehydroxylation
m105 −m440
m900=
wdh
c(1− L105/900
) m440 −m580
m900=
wdx
c(1− L105/900
)wdh
c=
m105 −m440
m900
(1− L105/900
) wdx
c=
m440 −m580
m900
(1− L105/900
)

Appendix B
Standard Error of the Estimate
The standard error of the estimate (SEE) is a measure of the accuracy of predic-tions made by a given function. It is calculated as the square root of the averageof the squared prediction residuals over the prediction period (eq. B.1). The SEEexpresses the error made by the compressive strength prediction in MPa inde-pendent from how large the compressive strength is. The relative standard errorof the estimate (RSEE) is the ratio of SEE and the average of the calculatedstrength values (Popovics 2001).
SEE =
√∑(fc,meas − fc,est)
2
n(B.1)
RSEE = SEEn∑fc,est
× 100 [%] (B.2)
SEE standard error of the estimateRSEE relative standard error of the estimatefc,meas compressive strength measured by compression testsfc,est estimated compressive strengthn number of considered data points or pairs

Appendix C
Definition of Decibel
Rather than being a unit, the descriptor decibel (dB) is a parameter describ-ing the relative difference between sound intensities or pressures on a logarithmicscale. The logarithmic scale is used since differences of sound intensities typicallyencountered in acoustics are of the order of several magnitudes. The general dif-ference (∆J) between two sound intensities (J1 and J2) is given in equation C.1.This expression can be rewritten with equation C.2. The difference between thetwo sound intensities (J1 and J2) as shown in equation C.2 is assigned to the de-scriptor Bel (B, named after Alexander Graham Bell). In practice it turned outthat the value ∆J(B) results in small numbers that are inconvenient to handle.Therefore, the factor 10 was introduced as shown in equation C.3. The newlycreated intensity difference ∆J(dB) corresponds to the descriptor decibel (dB),with one decibel being one tenth of a Bel (eq. C.4).
∆J = log J1 − log J2 (C.1)
∆J(B) = log(
J1
J2
)[B] (C.2)
∆J(dB) = 10 · log(
J1
J2
)[dB] (C.3)
∆J(B) = 10 ·∆J(dB) (C.4)
If instead of sound intensities two sound pressures (p1 and p2) are considered(such as the amplitude X of a sound wave expressed in volts) then equation C.1changes to equation C.5 because of the relation p ≈ X2. If this is rewritten

207
in form of equation C.6 then equation C.7 can be derived, which represents thedescriptor Bel. According to the procedure explained previously, the factor 10is then introduced in equation C.8. This equation expresses the difference of thesound pressures or voltages in decibel and has the same form as the expressionthat is used to transform the reflection coefficient to the reflection loss (eq. 4.6).
∆p = log X21 − log X2
2 (C.5)
∆p = 2 log X1 − 2 log X2 (C.6)
∆p(B) = 2 · log(
X1
X2
)[B] (C.7)
∆p(dB) = 20 · log(
X1
X2
)[dB] (C.8)

Index
acoustic emission, 44acoustic impedance, 59, 61, 63, 75attenuation
determination, 84
break-off method, 13
calcium hydroxide content, 129, 161determination, 88from numerical simulation, 161relationship to
reflection loss, 130, 161calorimetry, see heat of hydrationcapillary porosity, 135capillary water, 135CEMHYD3D, 142–144, 158–165chemical shrinkage, 131
determination, 90from numerical simulation, 159relationship to
p-wave velocity, 173reflection loss, 159, 173
compression waves, see p-wavescompressive strength
determination, 79of concrete, 110of extruded mortar, 102of mortar, 98
contact area, 181relationship to
compressive strength, 181degree of hydration, 156reflection loss, 156, 181
degree of hydration, 126, 127, 135relationship to
contact area, 156reflection loss, 128
early age concretedefinitions, 2
electrical methods, 51extrusion, 91
gel water, 135gel-space ratio, 136, 179
relationship tocompressive strength, 179reflection loss, 137, 179
green strength, 102determination, 80
heat of hydrationcomparison with
p-wave velocity, 172reflection loss, 172
determination, 81relationship to
p-wave velocity, 173reflection loss, 173
HYMOSTRUC3D, 148–157
impact echo method, 38–42in-situ temperature
comparison withp-wave velocity, 171reflection loss, 171
measurement, 81

Index 209
indentation methods, 8initial setting
determination, 81
maturity method, 14, 195application of, 196
microwave absorption method, 50
non-evaporable water content, 126after El-Jazairi and Illston, 88after Powers, 86
optical fibers, 48
p-wave velocity, 105, 166–176comparison with
adiabatic heat release, 172, 173chemical shrinkage, 173in-situ temperature, 171penetration resistance, 168reflection loss, 166–176
determination, 83influence of admixtures, 175
p-waves, 54, 73, 83penetration resistance
comparison withp-wave velocity, 168reflection loss, 168
determination, 81percolation threshold, 147, 154
relationship toreflection loss, 154
phase shift, 63pin penetration method, 12PMMA-buffer, 75primary waves, see p-wavesprobe penetration method, 12pullout method, 11pulse velocity method, 16–25, 166–176
using shear waves, 17
quartz-buffer, 75
radioactive methodsgamma radiometry, 45X-ray microscopy, 45
X-ray Microtomography, 46rebound hammer
application, 10principle, 8
reflection coefficient, 67complex, 62
reflection losscomparison with
adiabatic heat release, 172determination, 71general development, 71influence of
admixtures, 94, 175buffer material, 75curing temperature, 190water/cement ratio, 95wave type, 73
measured onconcrete, 111, 115extruded mortar, 105regular mortar, 98
relationship toadiabatic heat release, 173attenuation, 108calcium hydroxide content, 130capillary porosity, 135chemical shrinkage, 132, 173compressive strength of concrete,
112, 115, 191compressive strength of mortar,
100, 109contact area, 156degree of hydration, 128gel-space ratio, 137in-situ temperature, 94, 171initial setting, 95p-wave velocity, 108penetration resistance, 168percolation threshold, 154s-wave velocity, 108
resonant frequencydetermination, 81
resonant frequency method, 42
s-wave velocity, 75, 105

210 Index
determination, 83s-waves, 54, 73, 83shear modulus, 57, 83
complex, 59derived from
compressive strength, 117, 118numerical simulation, 161reflection loss, 118, 124resonant frequency, 122, 124s-wave velocity, 124
of cement paste, 124, 161of concrete, 118of mortar, 124, 161
shear waves, see s-wavesshrinkage, see chemical shrinkage
thermogravimetry, 85, 129transverse waves, see s-waves
viscositycomplex, 60determination, 64
wave propagation, 54wave reflection, 55wave reflection method
comparison tomaturity method, 195–197pulse velocity method, 166–176
field application, 190history, 66literature review, 25–38principle, 67strength prediction, 180, 182, 183,
185, 194test setup, 72
wave types, 54

References
ACI 318-02 (2002). Building code requirements for structural concrete. American ConcreteInstitute (ACI International), Farmington Hills.
Aıtcin, P. C., A. M. Neville (2003). How the water-cement ratio affects concrete strength.Concrete International, vol. 25, no. 8, pp. 51–58.
Akkaya, Y., T. Voigt, K. V. Subramaniam, S. P. Shah (2003). Nondestructive measurement ofconcrete strength gain by an ultrasonic wave reflection method. Materials and Structures,vol. 36, no. 262, pp. 507–514.
Al-Manaseer, A. A., E. B. Aquino (1999). Windsor probe test for nondestructive evaluation ofnormal and high-strength concrete. ACI Materials Journal, vol. 96, no. 4, pp. 440–447.
Ansari, F. (1990). New method for assessment of air voids in plastic concrete. Cement andConcrete Research, vol. 20, no. 6, pp. 901–909.
Ansari, F. (1991a). In-situ determination of entrained air in freshly mixed concrete using fiberoptics. In Reinhardt, H. W. (Ed.), Proceedings of the International Workshop on TestingDuring Concrete Construction. Chapman and Hall, London, RILEM Proceedings PRO 11,pp. 82–91.
Ansari, F. (1991b). Rapid in-place air content determination in fresh concrete. ConcreteInternational, vol. 13, no. 1, pp. 39–43.
Ansari, F. (1997). State-of-the-art in the applications of fiber-optic sensors to cementitiouscomposites. Cement and Concrete Composites, vol. 19, no. 1, pp. 3–19.
Anson, M., K. Newman (1966). The effect of mix proportions and method of testing on Poisson’sratio for mortars and concretes. Magazine of Concrete Research, vol. 18, no. 56, pp. 115–130.
ASTM C1074 (1998). Standard Practice for Estimating Concrete Strength by the MaturityMethod. American Society for Testing and Materials (ASTM International), Philadelphia.
ASTM C109 (2002). Standard Test Method for Compressive Strength of Hydraulic CementMortars (Using 2-in. or [50-mm] Cube Specimens). American Society for Testing and Ma-terials (ASTM International), Philadelphia.
ASTM C215 (2002). Standard Test Method for Fundamental Transverse, Longitudinal, andTorsional Frequencies of Concrete Specimens. American Society for Testing and Materials(ASTM International), Philadelphia.
ASTM C39 (2003). Standard Test Method for Compressive Strength of Cylindrical ConcreteSpecimens. American Society for Testing and Materials (ASTM International), Philadelphia.
ASTM C403 (1999). Standard Test Method for Time of Setting of Concrete Mixtures byPenetration Resistance. American Society for Testing and Materials (ASTM International),Philadelphia.
ASTM C597 (2002). Standard test method for pulse velocity through concrete. American Societyfor Testing and Materials (ASTM International), Philadelphia.
Avrami, M. (1939). Kinetics of phase change I. General theory. Journal of Chemical Physics,vol. 7, no. 12, pp. 1103–1112.
Avrami, M. (1940). Kinetics of phase change II. Transformation-time relations for random

212 References
distribution of nuclei. Journal of Chemical Physics, vol. 8, no. 2, pp. 212–224.
Avrami, M. (1941). Kinetics of phase change III. Granulation, phase change, and microstruc-ture. Journal of Chemical Physics, vol. 9, no. 2, pp. 177–184.
Barker, M. G., J. A. Ramirez (1988). Determination of concrete strengths with break-off tester.ACI Materials Journal, vol. 85, no. 4, pp. 221–228.
Bartos, M. J. (1979). Testing concrete in place. Civil Engineering (New York), vol. 49, no. 10,pp. 66–69.
van Beek, A. (2000). Dielectric properties of young concrete – Non-destructive dielectric sensorfor monitoring the strength development of young concrete. PhD thesis, Delft TechnicalUniversity, Delft, The Netherlands.
Belkheiri, L., M. Bocquet, M. L. Abidi, M. Zoukaghe (1999). Continuous ultrasonic measure-ments during setting and hardening of building materials. Materials and Structures, vol. 32,no. 215, pp. 59–62. (in french).
Bentz, D. P. (1997). Three-dimensional computer simulation of Portland cement hydration andmicrostructure development. Journal of the American Ceramic Society, vol. 80, no. 1, pp.3–21.
Bentz, D. P. (2000). CEMHYD3D: A three-dimensional cement hydration and microstructuredevelopment modelling package. Version 2. NIST Internal Report 6485, U.S. Department ofCommerce, Washington, DC.
Bentz, D. P., E. J. Garboczi (1991). Percolation of phases in a three-dimensional cement pastemicrostructural model. Cement and Concrete Research, vol. 21, no. 2-3, pp. 325–344.
Bentz, D. P., S. Mizell, S. Satterfield, J. Devaney, W. George, P. Ketcham, J. Graham, J. Porter-field, D. Quenard, F. Vallee, H. Sallee, E. Boller, J. Baruchel (2002). The visible cementdata set. Journal of Research of the National Institute of Standards and Technology, vol.107, no. 2, pp. 137–148. URL http://visiblecement.nist.gov.
Bergstrom, S. G. (1982). Conclusion of the conference. In RILEM (Ed.), International Con-ference of Concrete at Early Ages. Editions Anciens ENPC, Paris, vol. 2, pp. 255–260.
Bhatty, J. I. (1993). Application of thermal analysis to problems in cement chemistry. InWinefordner, J. D., D. Dollimore, J. Dunn (Eds.), Treatise on Analytical Chemistry, JohnWiley & Sons, Inc., vol. 13, chap. 6. pp. 355–396. Part I.
Bhatty, J. I., D. Dollimore, G. A. Gamlen, R. J. Mangabhai, H. Olmez (1986). Estimationof calcium hydroxide in OPC, OPC/PFA and OPC/PFA/polymer modified systems. Ther-mochimica Acta, vol. 106, pp. 115–123.
Bhatty, J. I., K. J. Reid (1985). Use of thermal analysis in the hydration studies of a type IPortland cement produced from mineral tailings. Thermochimica Acta, vol. 91, no. 1, pp.95–105.
Bogue, R. H. (1947). The chemistry of Portland cement. Reinhold Publishing Corporation,New York, 572 pp.
Boivin, S., P. Acker, S. Rigaud, B. Clavaud (1999). Experimental assessment of chemicalshrinkage of hydrating cement pastes. In Tazawa, E. (Ed.), Autogenous shrinkage of con-crete. Spon Press, Proceedings of the International Workshop organized by the JCI (JapanConcrete Institute), pp. 81–92.
Boumiz, A., C. Vernet, F. Cohen-Tenoudji (1996). Mechanical properties of cement pastes andmortars at early ages. Advanced Cement Based Materials, vol. 3, no. 3-4, pp. 94–106.
Brameshuber, W., M. Willmes (1997). Quality control of concrete tunnel shells using impactecho methods. Insight: Non-Destructive Testing and Condition Monitoring, vol. 39, no. 7,pp. 479–481.
van Breugel, K. (1991). Simulation of hydration and formation of structure in hardeningcement-based materials. PhD thesis, Delft University of Technology, Delft, The Netherlands.
van Breugel, K. (1995a). Numerical simulation of hydration and microstructural developmentin hardening cement-based materials. (I) Theory. Cement and Concrete Research, vol. 25,no. 2, pp. 319–331.

References 213
van Breugel, K. (1995b). Numerical simulation of hydration and microstructural developmentin hardening cement-based materials (II) Applications. Cement and Concrete Research,vol. 25, no. 3, pp. 522–530.
Bungey, J. H., S. G. Millard (1996). Testing of concrete in structures. Blackie Academic andProfessional, London; New York, 3rd ed., 286 pp.
Byfors, J. (1980). Plain concrete at early ages. CBI-Report 3:80, Swedish Cement and ConcreteResearch Institute, Stockholm.
Byfors, J. (1982). Pulse velocity measurements for indication of the compressive strength atearly ages. In RILEM (Ed.), International Conference on Concrete of Early Ages. EditionsAnciens ENPC, Paris, vol. 1, pp. 117–122.
Calleja, J. (1952). New techniques in the study of setting and hardening of hydraulic materials.Journal of the American Concrete Institute, vol. 48, pp. 525–536.
Carette, G. G., V. M. Malhotra (1984). In situ tests: Variability and strength prediction ofconcrete at early ages. In Malhotra, V. M. (Ed.), In Situ/Nondestructive Testing of Concrete.American Concrete Institute, Detroit, ACI Special Publication SP-82, pp. 111–141.
Carino, N. J. (1984). The maturity method: Theory and application. Cement, Concrete, andAggregates, vol. 6, no. 2, pp. 61–73.
Carino, N. J. (1994). Nondestructive testing of concrete: History and challenges. In Mehta, P. K.(Ed.), Concrete technology: past, present, and future, proceedings of V. Mohan Malhotrasymposium. American Concrete Institute, Detroit, Michigan, ACI Special Publication SP-144, pp. 623–678.
Carino, N. J. (2004a). The maturity method. In Malhotra, V. M., N. J. Carino (Eds.),Handbook on nondestructive testing of concrete, CRC Press, Boca Raton; London. 2nd ed.,pp. 5.1–5.47.
Carino, N. J. (2004b). Pullout test. In Malhotra, V. M., N. J. Carino (Eds.), Handbook onnondestructive testing of concrete, CRC Press, Boca Raton; London. 2nd ed., pp. 3.1–3.40.
Carino, N. J. (2004c). Stress wave propagation methods. In Malhotra, V. M., N. J. Carino(Eds.), Handbook on nondestructive testing of concrete, CRC Press, Boca Raton; London.2nd ed., pp. 14.1–14.34.
Carino, N. J., H. J. M. Jennings, L. M. Snell (1989). Properties of concrete at early ages.Cement, Concrete and Aggregates, vol. 11, no. 2, pp. 129–131.
Carlsson, M., I. R. Eeg, P. Jahren (1984). Field experience in the use of the “break-off tester”.In Malhotra, V. M. (Ed.), In Situ/Nondestructive Testing of Concrete. American ConcreteInstitute, Detroit, ACI Special Publication SP-82, pp. 277–292.
Casson, R. B. J., P. I. J. Domone (1982). Ultrasonic monitoring of the early age properties ofconcrete. In RILEM (Ed.), International Conference on Concrete of Early Ages. EditionsAnciens ENPC, Paris, vol. 1, pp. 129–135.
CEB-FIP Model Code 90 (1990). CEB Bulletin No. 213/214. Federation for Structural Con-crete (fib - federation internationale du beton) (CEB-FIP), Lausanne.
Chabowski, A. J., D. Bryden-Smith (1979). Simple pull-out test to assess the in situ strengthof concrete. Concrete International, vol. 1, no. 12, pp. 35–40.
Cheesman, W. J. (1949). Dynamic testing of concrete with the soniscope apparatus. Proceedingsof the Highway Research Board, vol. 29, pp. 176–183.
Chotard, T. J., N. Gimet-Breart, A. Smith, D. Fargeot, J. P. Bonnet, C. Gault (2001a). Ap-plication of ultrasonic testing to describe the hydration of calcium aluminate cement at theearly age. Cement and Concrete Research, vol. 31, no. 3, pp. 405–412.
Chotard, T. J., N. Gimet-Breart, A. Smith, D. Fargeot, J. P. Bonnet, C. Gault (2001b). Char-acterisation of calcium aluminate cement hydration at young age by ultrasonic testing. InMangabhai, R. J., F. P. Glasser (Eds.), Proceedings of the International Conference onCalcium Aluminate Cements (CAC). The University Press, Cambridge, pp. 155–167.
Chotard, T. J., A. Smith, D. Rotureau, D. Fargeot, C. Gault (2003). Acoustic emission charac-terisation of calcium aluminate cement hydration at an early stage. Journal of the European

214 References
Ceramic Society, vol. 23, no. 3, pp. 387–398.
Clemena, G. G. (2004). Short-pulse radar methods. In Malhotra, V. M., N. J. Carino (Eds.),Handbook on nondestructive testing of concrete, CRC Press, Boca Raton; London. 2nd ed.,pp. 13.1–13.21.
Cros, B., J. Y. Ferrandis (1999). Characterization of the cement setting by acoustic near field.Sensors and Actuators, B: Chemical, vol. B60, no. 2-3, pp. 200–207.
Czernin, W. (1962). Cement chemistry and physics for civil engineers. Chemical PublishingCo., Inc, New York, 139 pp.
D’Angelo, R., T. J. Plona, L. M. Schwartz, P. Coveney (1995). Ultrasonic measurements onhydrating cement slurries – Onset of shear wave propagation. Advanced Cement BasedMaterials, vol. 2, no. 1, pp. 8–14.
Dehn, F., G. Konig, G. Marzahn (2003). Konstruktionswerkstoffe im Bauwesen (Constructionmaterials in civil engineering). Ernst und Sohn, Berlin, 625 pp. (in German).
DIN 1045-1 (2001). Tragwerke aus Beton, Stahlbeton und Spannbeton – Teil 1: Bemessung undKonstruktion (Concrete, reinforced and prestressed concrete structures – Part 1: Design).DIN Deutsches Institut fur Normung e.V., Berlin, Germany. (in German).
Domone, P. L., H. Thurairatnam (1990). The relationship between early age property measure-ments on cement pastes. In Banfill, P. F. G. (Ed.), Rheology of Fresh Cement and Concrete:Proceedings of the International Conference organized by the British Society of Rheology. E.& F.N. Spon, London; New York, pp. 181–191.
Dunn, J. G., J. H. Sharp (1993). Thermogravimetry. In Winefordner, J. D., D. Dollimore,J. Dunn (Eds.), Treatise on Analytical Chemistry, John Wiley & Sons, Inc., vol. 13, chap. 3.pp. 127–266. Part I.
El-Jazairi, B., J. M. Illston (1977). A simultaneous semi-isothermal method of thermogravime-try and derivative thermogravimetry, and its application to cement pastes. Cement andConcrete Research, vol. 7, no. 3, pp. 247–258.
El-Jazairi, B., J. M. Illston (1980). Hydration of cement paste using the semi-isothermal methodof derivative thermogravimetry. Cement and Concrete Research, vol. 10, no. 3, pp. 361–366.
Elvery, R. H., L. A. M. Ibrahim (1976). Ultrasonic assessment of concrete strength at earlyages. Magazine of Concrete Research, vol. 28, no. 97, pp. 181–190.
Erfurt, W. (2002). Erfassung von Gefugeveranderungen in Beton durch Anwendungzerstorungsfreier Prufverfahren zur Einschatzung der Dauerhaftigkeit (Determination of mi-crostructural changes in concrete with nondestructive test methods to evaluate the concretedurability). PhD thesis, Bauhaus–University Weimar, Weimar, Germany. (in German).
Eurocode 2 (2000). Design of concrete structure.
Ferrandis, J. Y., G. Leveque (2003). In situ measurement of elastic properties of cement by anultrasonic resonant sensor. Cement and Concrete Research, vol. 33, no. 8, pp. 1183–1187.
Feylessoufi, A., F. Cohen-Tenoudji, V. Morin, P. Richard (2001). Early ages shrinkage mech-anisms of ultra-high-performance cement-based materials. Cement and Concrete Research,vol. 31, no. 11, pp. 1573–1579.
Fu, H. C., N. J. Gardner (1986). Effect of high early-age construction loads on the long termbehavior of slab structures. In Young, J. F. (Ed.), Properties of concrete at early ages.American Concrete Institut, Detroit, MI, USA, ACI Special Publication SP-95, pp. 173–200.
Gaede, K. (1934). Ein neues Verfahren zur Festigkeitsprufung des Betons im Bauwerk (A newmethod for concrete strength testing in structures). Der Bauingenieur, vol. 15, no. 35/36,pp. 356–357. (in German).
Gaede, K. (1941). Die Prufung der Betonfestigkeit im Bauwerk (Testing of concrete strengthin structures). Der Bauingenieur, vol. 22, no. 13/16, pp. 138–142. (in German).
Garboczi, E. J. (1993). Computational materials science of cement-based materials. Materialsand Structures, vol. 26, no. 158, pp. 191–195.
Garboczi, E. J. (2004). personal communication. National Institute of Standards and Technol-ogy (NIST), Gaithersburg, USA.

References 215
Garboczi, E. J., D. P. Bentz (1991). Fundamental computer simulation models for cement-basedmaterials. In Skalny, J., S. Mindess (Eds.), Materials Science of Concrete, The AmericanCeramic Society, Inc., Westerville, Ohio, vol. 2. pp. 249–277.
Garboczi, E. J., D. P. Bentz, K. A. Snyder, N. S. Martys, P. E. Stutzman, C. F. Ferraris,J. W. Bullard (2004). An electronic monograph: Modeling and measuring the structure andproperties of cement-based materials. URL http://ciks.cbt.nist.gov/monograph.
Garboczi, E. J., J. G. Berryman (2001). Elastic moduli of a material containing composite in-clusions: Effective medium theory and finite element computations. Mechanics of Materials,vol. 33, no. 8, pp. 455–470.
Gardner, N. J. (1990). Effect of temperature on the early-age properties of Type I, Type III,and Type I/fly ash concretes. ACI Materials Journal, vol. 87, no. 1, pp. 68–78.
Gartner, E. M., K. E. Kurtis, P. J. M. Monteiro (2000). Proposed mechanism of C-S-H growthtested by soft X-ray microscopy. Cement and Concrete Research, vol. 30, no. 5, pp. 817–822.
Gebauer, G. (2001). Programm zur Berechnung von Ehartungsdruckfestigkeiten (program forthe computation of strength development of hardening concrete). Betonwerk + Fertigteil-Technik (Concrete Plant + Precast Technology), vol. 67, no. 1, pp. 100–101.
Geiker, M. (1983). Studies of Portland cement hydration by measurements of chemical shrink-age and a systematic evaluation of hydration curves by means of the dispersion model. PhDthesis, Institute of Mineral Industry, Technical University of Denmark, Denmark.
Geiker, M., T. Knudsen (1982). Chemical shrinkage of Portland cement pastes. Cement andConcrete Research, vol. 12, no. 5, pp. 603–610.
Gimet, N., D. Fargeot, J. M. Gaillard, A. Smith, C. Gault, J. P. Bonnet (1999). Ultrasonicassessment of Portland cement at the early stages of hydration. Journal of Materials ScienceLetters, vol. 18, no. 16, pp. 1335–1337.
Glisic, B., N. Simon (2000). Monitoring of concrete at very early age using stiff SOFO sensor.Cement and Concrete Composites, vol. 22, no. 2, pp. 115–119.
Greene, G. W. (1954). Test hammer provides new method of evaluating hardened concrete.Journal of the American Concrete Institute, vol. 51, no. 3, pp. 249–256.
Grosse, C. U. (1996). Quantitative zerstorungsfreie Prufung von Baustoffen mittels Schallem-misionsanalyse und Ultraschall (Qantitative nondestructive evaluation of construction mate-rials using acoustic emission and ultrasound). PhD thesis, University of Stuttgart, Stuttgart,Germany. (in German).
Grosse, C. U. (2001). Verbesserung der Qualitatssicherung von Frischbeton mit Ultraschall (im-proving the quality control of hardening concrete using ultrasound). Betonwerk + Fertigteil-Technik (Concrete Plant + Precast Technology), vol. 67, no. 1, pp. 102–104.
Grosse, C. U. (2004). personal communication. University of Stuttgart, Stuttgart, Germany.
Grosse, C. U., H. W. Reinhardt (1994). Continous ultrasound measurements during settingand hardening of concrete. Otto-Graf-Journal, vol. 5, pp. 76–98.
Grosse, C. U., H. W. Reinhardt, R. Beutel (2004). Impact-echo measurements on fresh andhardening concrete. In Kovler, K., J. Marchand, S. Mindess, J. Weiss (Eds.), Proceedingsof the International RILEM Symposium on Concrete Science and Engineering: A Tributeto Arnon Bentur. RILEM Publications s.a.r.l., Bagneux, France, RILEM Proceedings PRO36, pp. 95–104.
Grubl, P., H. Weigler, S. Karl (2001). Beton: Arten, Herstellung und Eigenschaften (Concrete:Types, technology, and properties). Ernst und Sohn Verlag, Berlin, 2nd ed., 788 pp. (inGerman).
Gutsch, A. W. (1998). Stoffeigenschaften jungen Betons – Versuche und Modelle (Materialproperties of young concrete – Experiments and models). PhD thesis, Technical Universityof Braunschweig, Braunschweig, Germany. (in German).
Han, S. H., J. K. Kim (2004). Effect of temperature and age on the relationship betweendynamic and static elastic modulus of concrete. Cement and Concrete Research, vol. 34,no. 7, pp. 1219–1227.

216 References
Hansen, T. C. (1986a). Physical structure of hardened cement paste. a classical approach.Materials and Structures, vol. 19, no. 114, pp. 423–436.
Hansen, W. (1986b). Static and dynamic elastic modulus of concrete as affected by mix compo-sition and compressive strength. In Young, J. F. (Ed.), Properties of concrete at early ages.American Concrete Institut, Detroit, MI, USA, ACI Special Publication SP-95, pp. 115–137.
Harrison, G., A. J. Barlow (1981). Dynamic viscosity measurement. In Edmunds, P. D. (Ed.),Methods of Experimental Physics, Academic Press, New York, vol. 19, chap. 3. pp. 137–178.
Heal, G. R. (2002). Thermogravimetry and derivative thermogravimetry. In Haines, P. J.(Ed.), Principles of Thermal Analysis and Calorimetry, The Royal Society of Chemistry,Cambridge, UK, chap. 2. pp. 10–54.
Honig, A. (1991). Radiometry of compaction of fresh concrete in-situ. In Reinhardt, H. W.(Ed.), Proceedings of the International Workshop on Testing During Concrete Construction.Chapman and Hall, London, RILEM Proceedings PRO 11, pp. 138–149.
Hornibrook, F. B. (1939). Application of sonic method to freezing and thawing studies ofconcrete. ASTM Bulletin, , no. 101, pp. 5–8.
Iwaki, K., A. Hirama, K. Mitani, S. Kaise, K. Nakagawa (2001). A quality control method forshotcrete strength by pneumatic pin penetration test. NDT and E International, vol. 34,no. 6, pp. 395–402.
Jaegermann, C. (1989). Simple pull-out test for in situ determination of early strength ofconcrete. Magazine of Concrete Research, vol. 41, no. 149, pp. 235–242.
Jennings, H. M., S. K. Johnson (1986). Simulation of microstructure development during thehydration of a cement compound. Journal of the American Ceramic Society, vol. 69, no. 11,pp. 790–795.
Jin, X., Z. Li (2001). Dynamic property determination for early-age concrete. ACI MaterialsJournal, vol. 98, no. 5, pp. 365–370.
Johansen, R. (1979). In situ strength evaluation of concrete em dash the “break-off” method.Concrete International, vol. 1, no. 9, pp. 45–51.
Jones, R. (1949). A non-destructive method of testing concrete during hardening. Concreteand Constructional Engineering, vol. 44, no. 4, pp. 127–128.
Jones, R. (1962). Non-destructive testing of concrete. Cambridge engineering series. CambridgeUniversity Press, Cambridge, 104 pp.
Jones, R. (1963). The ultrasonic testing of concrete. Ultrasonics, vol. 1, no. 2, pp. 78–82.
Juenger, M. C. G., H. R. Lamour, P. J. M. Monteiro, E. M. Gartner, G. P. Denbeaux (2003a).Direct observation of cement hydration by soft X-ray transmission microscopy. Journal ofMaterials Science Letters, vol. 22, no. 19, pp. 1335–1338.
Juenger, M. C. G., P. J. M. Monteiro, V. H. R. Lamour, E. M. Gartner, G. P. Denbeaux(2003b). Examining cement hydration in situ using soft X-ray transmission microscopy. InLange, D. A., K. L. Scrivener, J. Marchand (Eds.), Advances in Cement and Concrete IX:Volume Changes, Cracking, and Durability. University of Illinois at Urbana-Champaign, pp.9–17.
Jung, F. (1974). Ein einfaches Verfahren zur zerstorungsfreien Prufung der Festigkeit vonBeton (A simple method for nondestructive testing of the strength of concrete). Beton- undStahlbeton, vol. 69, no. 1, pp. 16–19. (in German).
Kaminetzky, D., P. C. Stivaros (1994). Early-age concrete: construction loads, behavior, andfailures. Concrete International, vol. 16, no. 1, pp. 58–63.
Kaßner, B. (2001). Zerstorungsfreie und kontinuierliche Bestimmung von Erhartungsdruck-festigkeiten durch Ultraschall-Messung (Non-destructive and continuous determination ofstrength development by ultrasonic measurement). Betonwerk + Fertigteil-Technik (Con-crete Plant + Precast Technology), vol. 67, no. 1, pp. 107–108.
Keating, J., D. J. Hannant, A. P. Hibbert (1989a). Comparison of shear modulus and pulsevelocity techniques to measure the build-up of structure in fresh cement pastes used in oilwell cementing. Cement and Concrete Research, vol. 19, no. 4, pp. 554–566.

References 217
Keating, J., D. J. Hannant, A. P. Hibbert (1989b). Correlation between cube strength, ultra-sonic pulse velocity and volume change for oil well cement slurries. Cement and ConcreteResearch, vol. 19, no. 5, pp. 715–726.
Klieger, P. (1957). Long-time study of cement performance in concrete. Chapter 10–Progressreport on strength and elastic properties of concrete. Journal of the American ConcreteInstitute, vol. 29, no. 6, pp. 481–504.
Knudsen, T. (1980). On the particle size distribution in cement hydration. In Proceedings of the7th International Congress in Chemistry of Cement. vol. II, pp. I–170–175. Note: EditionsSeptima, Paris.
Knudsen, T. (1984). The dispersion model for hydration of Portland cement i. General concepts.Cement and Concrete Research, vol. 14, no. 5, pp. 622–630.
Knudsen, T., M. Geiker (1982). Chemical shrinkage as an indicator of the stage of hardening.In RILEM (Ed.), International Conference on Concrete of Early Ages. Editions AnciensENPC, Paris, vol. 1, pp. 163–165.
Koenders, E. A. B. (1997). Simulation of volume changes in hardening cement-based materials.PhD thesis, Delft University of Technology, Delft, The Netherlands.
Kolek, J. (1958). An appreciation of the Schmidt hammer. Magazine of Concrete Research,vol. 10, no. 28, pp. 27–36.
Krautkramer, J., H. Krautkramer (1990). Ultrasonic Testing of Materials. Springer Verlag.
Kruml, F. (1990). Setting process of concrete. In Wierig, H. J. (Ed.), Properties of freshconcrete: Proceedings of the colloquium organized on behalf of the Coordinating Committeefor Concrete Technology of RILEM. Chapman and Hall, London; New York, pp. 10–16.
Kurtis, K. E., F. A. Rodrigues (2003). Early age hydration of rice hull ash cement examinedby transmission soft X-ray microscopy. Cement and Concrete Research, vol. 33, no. 4, pp.509–515.
Labouret, S., I. Looten-Baquet, C. Bruneel, J. Frohly (1998). Ultrasound method for monitoringrheology properties evolution of cement. Ultrasonics, vol. 36, no. 1-5, pp. 205–208.
Lacouture, J. C., P. A. Johnson, F. Cohen-Tenoudji (2003). Study of critical behavior inconcrete during curing by application of dynamic linear and nonlinear means. Journal ofthe Acoustical Society of America, vol. 113, no. 3, pp. 1325–1332.
Laube, M. (1990). Werkstoffmodell zur Berechnung von Temperaturspannungen in massigenBetonbauteilen im jungen Alter (Material model for determination of stresses due to tem-perature in massive concrete structures at early ages). PhD thesis, Technical University ofBraunschweig, Braunschweig, Germany. (In German).
Lasic, D. D., J. Stepisnik (1984). An investigation of the osmotic model of cement curing byultrasonics. Cement and Concrete Research, vol. 14, no. 3, pp. 345–348.
Lee, H. K., K. M. Lee, Y. H. Kim, H. Yim, D. B. Bae (2004). Ultrasonic in-situ monitoring ofsetting process of high-performance concrete. Cement and Concrete Research, vol. 34, no. 4,pp. 631–640.
Lee, H. K., H. Yim, K. M. Lee (2003). Velocity-strength relationship of concrete by impact-echomethod. ACI Materials Journal, vol. 100, no. 1, pp. 49–54.
Li, Z., X. Wei, W. Li (2003). Preliminary interpretation of Portland cement hydration processusing resistivity measurements. ACI Materials Journal, vol. 100, no. 3, pp. 253–257.
Litovitz, T. A., C. M. Davis (1964). Structural and shear relaxation in liquids. In Mason,W. P. (Ed.), Physical Acoustics, Principals and Methods, Academic Press, New York, vol. II,chap. 5. pp. 281–349.
Maekawa, K., R. Chaube, T. Kishi (1999). Modelling of concrete performance: Hydration,microstructure formation, and mass transport. Spon Press, London; New York, 328 pp.
Maekawa, K., R. P. Chaube, T. Kishi (2004). Coupled mass transport, hydration and structureformation theory for durability design of concrete structures. URL http://concrete.t.u-tokyo.ac.jp/en/demos/ducom/brieftheory/consec1.html.
Maekawa, K., T. Ishida, T. Kishi (2003). Multi-scale modeling of concrete performance –

218 References
Integrated material and structural mechanics. Journal of Advanced Concrete Technology,vol. 1, no. 2, pp. 91–126.
Malhotra, V. M. (1975). Evaluation of the pull-out test to determine strength of in-situ concrete.Materials and Structures, , no. 43, pp. 19–31.
Malhotra, V. M. (1976). Testing hardened concrete: Nondestructive methods. ACI MonographNo. 9. Iowa State University Press, Ames, 188 pp.
Malhotra, V. M. (1977). Contract strength requirements – Cores versus in situ evaluation.Journal of the American Concrete Institute, vol. 74, no. 4, pp. 163–172.
Malhotra, V. M. (2004). Surface hardness methods. In Malhotra, V. M., N. J. Carino (Eds.),Handbook on nondestructive testing of concrete, CRC Press, Boca Raton; London. 2nd ed.,pp. 1.1–1.13.
Malhotra, V. M., G. G. Carette (2004). Penetration resistance methods. In Malhotra, V. M.,N. J. Carino (Eds.), Handbook on nondestructive testing of concrete, CRC Press, BocaRaton; London. 2nd ed., pp. 2.1–2.15.
Malhotra, V. M., N. J. Carino (Eds.) (2004). Handbook on Nondestructive Testing of Concrete.CRC Press, Boca Raton.
Malhotra, V. M., V. Sivasundaram (2004). Resonant frequency methods. In Malhotra, V. M.,N. J. Carino (Eds.), Handbook on nondestructive testing of concrete, CRC Press, BocaRaton; London. 2nd ed., pp. 7.1–7.21.
Mason, W. P. (1958). Physical acoustics and the properties of solids. The Bell TelephoneLaboratories series. Van Nostrand, Princeton, N.J., 402 pp.
Mason, W. P., W. O. Baker, H. J. McSkimin, J. H. Heiss (1949). Measurement of shear elasticityand viscosity of liquids at ultrasonic frequencies. Physical Review, vol. 75, no. 6, pp. 936–946.
McCarter, W. J., A. B. Afshar (1984). Some aspects of the electrical properties of cementpaste. Journal of Materials Science Letters, vol. 3, no. 12, pp. 1083–1086.
McCarter, W. J., A. B. Afshar (1985a). Diagnostic monitoring of the physio-chemical processesin hydrating cement paste. Cement, Concrete and Aggregates, vol. 7, no. 2, pp. 57–68.
McCarter, W. J., A. B. Afshar (1985b). Further studies on the early hydration of Portlandcement paste. Journal of Materials Science Letters, vol. 4, no. 4, pp. 405–408.
McCarter, W. J., A. B. Afshar (1985c). Study of the early hydration of Portland cement.Proceedings of the Institution of Civil Engineers (London), vol. 79, no. pt 2 1, pp. 585–604.
McCarter, W. J., T. M. Chrisp, G. Starrs, J. Blewett (2003). Characterization and monitor-ing of cement-based systems using intrinsic electrical property measurements. Cement andConcrete Research, vol. 33, no. 2, pp. 197–206.
McSkimin, H. J. (1950). Ultrasonic measurement techniques applicable to small specimens.Journal of the Acoustical Society of America, vol. 22, no. 4, pp. 413–418.
McSkimin, H. J. (1953). Measurements of elastic constants at low temperatures by means ofultrasonic waves. data for silicon and germanium single crystals, and for fused silica. Journalof Applied Physics, vol. 24, no. 8, pp. 988–997.
McSkimin, H. J. (1964). Ultrasonic methods for measuring the mechanical properties of liquidsand solids. In Mason, W. P. (Ed.), Physical Acoustics, Principles and Methods, AcademicPress, New York, vol. I-A, chap. 4. pp. 271–334.
Mehta, P. K., P. J. M. Monteiro (1993). Concrete: Structure, properties, and methods. PrenticeHall, Englewood Cliffs, N.J., 2nd ed., 548 pp.
Merzbacher, C. I., A. D. Kersey, E. J. Friebele (1996). Fiber optic sensors in concrete structures:A review. Smart Materials and Structures, vol. 5, no. 2, pp. 196–208.
Midgley, H. G. (1979). Determination of calcium hydroxide in set Portland cements. Cementand Concrete Research, vol. 9, no. 1, pp. 77–82.
Mindess, S. (2004). Acoustic emission method. In Malhotra, V. M., N. J. Carino (Eds.),Handbook on nondestructive testing of concrete, CRC Press, Boca Raton; London. 2nd ed.,pp. 16.1–16.17.

References 219
Mindess, S., J. F. Young, D. Darwin (2003). Concrete. Prentice Hall, Upper Saddle River, NJ,2nd ed., 644 pp.
Mitchell, T. M. (2004). Radioactive/nuclear methods. In Malhotra, V. M., N. J. Carino (Eds.),Handbook on nondestructive testing of concrete, CRC Press, Boca Raton; London. 2nd ed.,pp. 12.1–12.22.
Moore, R. S., H. J. McSkimin (1970). Dynamic shear properties of solvents and polystyrenesolutions from 20 to 200 MHz. In Mason, W. P., R. N. Thurston (Eds.), Physical Acoustics,Principals and Methods, Academic Press, New York, vol. VI, chap. 4. pp. 167–242.
Morin, V., F. Cohen-Tenoudji, A. Feylessoufi, P. Richard (2001). Superplasticizer effects on set-ting and structuration mechanisms of ultrahigh-performance concrete. Cement and ConcreteResearch, vol. 31, no. 1, pp. 63–71.
Morin, V., F. Cohen-Tenoudji, A. Feylessoufi, P. Richard (2002). Evolution of the capillarynetwork in a reactive powder concrete during hydration process. Cement and ConcreteResearch, vol. 32, no. 12, pp. 1907–1914.
Morin, V., F. Cohen-Tenoudji, C. Vernet (2000). Study of the viscoelastic behaviour of ce-ment pastes at early ages with ultrasonic waves in echographic mode. In Nonat, A. (Ed.),Proceedings of the Second International RILEM Workshop on Hydration and Setting. pp.317–327.
Morin, V., F. Cohen-Tenoudji, C. Vernet, A. Feylessoufi, P. Richard (1998). Ultrasonic spec-troscopic investigation of the structural and mechanical evolutions of a reactive powderconcrete. In Aıtcin, P. C., Y. Delagrave (Eds.), Proceedings of the International Symposiumon High-Performance and Reactive Powder Concrete. vol. 3, pp. 119–126.
Moukwa, M., M. Brodwin, S. Christo, J. Chang, S. P. Shah (1991). Influence of the hydrationprocess upon microwave properties of cements. Cement and Concrete Research, vol. 21,no. 5, pp. 863–872.
Mounanga, P., A. Khelidj, A. Loukili, V. Baroghel-Bouny (2004). Predicting Ca(OH)2 contentand chemical shrinkage of hydrating cement pastes using analytical approach. Cement andConcrete Research, vol. 34, no. 2, pp. 255–265.
Mubarak, K., K. J. Bois, R. Zoughi (2001). A simple, robust, and on-site microwave techniquefor determining water-to-cement ratio (w/c) of fresh Portland cement-based materials. IEEETransactions on Instrumentation and Measurement, vol. 50, no. 5, pp. 1255–1263.
Mullick, A. K., S. C. Maiti, R. C. Wason (1982). Measurement of hardening oc concrete at earlyages and influence oc cement characteristics. In RILEM (Ed.), International Conference onConcrete of Early Ages. Editions Anciens ENPC, Paris, vol. 1, pp. 167–172.
Nagy, A. (1997). Determination of e-modulus of young concrete with nondestructive method.Journal of Materials in Civil Engineering, vol. 9, no. 1, pp. 15–20.
Naik, T. R. (2004). The break-off test method. In Malhotra, V. M., N. J. Carino (Eds.),Handbook on nondestructive testing of concrete, CRC Press, Boca Raton; London. 2nd ed.,pp. 4.1–4.16.
Nasser, K. W., A. A. Al-Manaseer (1987a). Comparison of nondestructive testers of hardenedconcrete. ACI Materials Journal, vol. 84, no. 5, pp. 374–380.
Nasser, K. W., A. A. Al-Manaseer (1987b). New nondestructive test. Concrete International,vol. 9, no. 1, pp. 41–44.
Navi, P., C. Pignat (1996). Simulation of cement hydration and the connectivity of the capillarypore space. Advanced Cement Based Materials, vol. 4, no. 2, pp. 58–67.
Navi, P., C. Pignat (1999). Three-dimensional characterization of the pore structure of asimulated cement paste. Cement and Concrete Research, vol. 29, no. 4, pp. 507–514.
Neisecke, J. (1974). Ein dreiparametriges, komplexes Ultraschall-Prufverfahren fur diezerstorungsfreie Materialprufung im Bauwesen (A three parameter, complex ultrasonic testmethod for nondestructive testing of materials in civil engineering). PhD thesis, TechnischeUniversitat Braunschweig, Braunschweig. (in German).
Neuffer, W. (1951). Stahlbeton im Ausland (Reinforced concrete abroad). Beton- und Stahlbe-

220 References
tonbau, vol. 46, no. 2, pp. 26–30. (in German).
O’Neil, H. T. (1949). Reflection and refraction of plane shear waves in viscoelastic media.Physical Review, vol. 75, no. 6, pp. 928–935.
Ozturk, T., O. Kroggel, P. Grubl (2004). The influence of temperature on the hydration processof concrete evaluated through ultrasound technique. In Proceedings of the InternationalRILEM Symposium: Advances in Concrete through Science and Engineering. On CD-ROM.
Ozturk, T., J. R. Rapoport, J. S. Popovics, S. P. Shah (1999). Monitoring the setting andhardening of cement-based materials with ultrasound. Concrete Science and Engineering,vol. 1, no. 2, pp. 83–91.
Papadakis, E. P. (1968a). Buffer-rod system for ultrasonic attenuation measurements. Journalof the Acoustical Society of America, vol. 44, no. 5, pp. 1437–1441.
Papadakis, E. P. (1968b). Ultrasonic attenuation in thin specimens driven through buffer rods.Journal of the Acoustical Society of America, vol. 44, no. 3, pp. 724–734.
Parrott, L. J., M. Geiker, W. A. Gutteridge, D. Killoh (1990). Monitoring Portland cementhydration: Comparison of methods. Cement and Concrete Research, vol. 20, no. 6, pp.919–926.
Pessiki, S., M. Johnson (1994). In-place determination of concrete strength by the impact-echomethod. In Baker, N. C., B. J. Goodno (Eds.), Proceedings of the Structures Congress XII.Lehigh Univ, Bethlehem, PA, USA, American Society of Civil Engineers (ASCE), New York,vol. 2, pp. 1340–1345.
Pessiki, S., M. R. Johnson (1996). Nondestructive evaluation of early-age concrete strengthin plate structures by the impact-echo method. ACI Materials Journal, vol. 93, no. 3, pp.260–271.
Pessiki, S. P., N. J. Carino (1988). Setting time and strength to concrete using the impact-echomethod. ACI Materials Journal, vol. 85, no. 5, pp. 389–399.
Philleo, R. E. (1974). In-place heresy. Journal of The American Concrete Institute, vol. 71,no. 3, p. N1.
Philleo, R. E. (1979). A need for in situ testing of concrete. Concrete International, vol. 1,no. 9, pp. 43–44.
Pimenov, V. V., R. D. Barkan, V. B. Grapp (1972). Ultraschall zur Kontrolle der Herstellung-stechnologie des Betons (Use of ultrasound for the control of concrete production technology).Bauplanung–Bautechnik, vol. 26, no. 8, pp. 378–380. (in German).
Pinto, R. C. A., K. C. Hover (1999). Application of maturity approach to setting times. ACIMaterials Journal, vol. 96, no. 6, pp. 686–691.
Pohl, E. (1966). Zerstorungsfreie Prufmethoden fur Beton (Methods for nondestructive testingof concrete). VEB Verlag fur Bauwesen, Berlin, 160 pp. (in German).
Popovics, J. S. (2003). Nondestructive evaluation: Past, present, and future. Journal ofMaterials in Civil Engineering, vol. 15, no. 3, p. 211. Editorial to the special issue onadvances and developments in NDE techniques for concrete structures.
Popovics, S. (1971). Physical aspects of the setting of Portland cement concrete. Journal ofMaterials, vol. 6, no. 1, pp. 150–162.
Popovics, S., J. S. Popovics (1998). Ultrasonic testing to determine water-cement ratio forfreshly mixed concrete. Cement, Concrete and Aggregates, vol. 20, no. 2, pp. 262–268.
Popovics, S., R. Silva-Rodrigez, J. S. Popovics, V. Martucci (1994). Behavior of ultrasonicpulses in fresh concrete. In Stevens, D. J., M. A. Issa (Eds.), New experimental techniquesfor evaluating concrete material and structural performance, ACI Special Publication SP-143, American Concrete Institute, Detroit. pp. 207–225.
Powers, T. C. (1935). Absorption of water by Portland cement paste during the hardeningprocess. Industrial and Engineering Chemistry, vol. 27, no. 7, pp. 790–794.
Powers, T. C. (1938). Measuring Young’s modulus of elasticity by means of sonic vibrations.ASTM Proceedings, vol. 38, pp. 460–467.

References 221
Powers, T. C. (1949). The nonevaporable water content of hardened Portland-cement paste –Its significance for concrete research and its method of determination. ASTM Bulletin, , no.158, pp. 68–76. Reprinted as Research and Development Bulletin No. 29, Portland CementAssociation.
Powers, T. C. (1958a). The physical structure and engineering properties of concrete. Bul-letin 90, Research Laboratories of the Portland Cement Association, Chicago.
Powers, T. C. (1958b). Structure and physical properties of hardened Portland cement paste.Journal of the American Ceramic Society, vol. 41, no. 1, pp. 1–6. Reprinted as Researchand Development Bulletin No. 92, Portland Cement Association.
Powers, T. C., T. L. Brownyard (1949). Studies of the physical properties of hardened Port-land cement paste. Bulletin 22, Research Laboratories of the Portland Cement Association,Chicago.
Radji, F. F., W. V. Douglas (1994). Heat signature testing of concrete. In Scandella, R. J.(Ed.), Structural Materials Technology: An NDT Conference. CRC Press.
Rapoport, J. R., J. S. Popovics, K. V. Subramaniam, S. P. Shah (2000). Using ultrasoundto monitor stiffening process of concrete with admixtures. ACI Materials Journal, vol. 97,no. 6, pp. 675–683.
Ravindrajah, R. S., Y. H. Loo, C. T. Tam (1988). Strength evaluation of recycled-aggregateconcrete by in-situ tests. Materials and Structures, vol. 21, no. 124, pp. 289–295.
Reinhardt, H. W. (1991). Relevance of testing during construction. In Reinhardt, H. W.(Ed.), Proceedings of the International Workshop on Testing During Concrete Construction.Chapman and Hall, London, New York, RILEM Proceedings PRO 11, pp. 3–7.
Reinhardt, H. W., C. U. Grosse (2004). Continuous monitoring of setting and hardening ofmortar and concrete. Construction and Building Materials, vol. 18, no. 3, pp. 145–154.
Reinhardt, H. W., C. U. Grosse, A. Herb (1998). Kontinuierliche Ultraschallmessung wahrenddes Erstarrens und Erhartens von Beton als Werkzeug des Qualitatsmanagements (Continu-ous ultrasonic testing during setting and hardening of concrete as a tool of quality control).In DAfStb Heft 490, Deutscher Ausschuss fur Stahlbeton. pp. 21–64. (in German).
Reinhardt, H. W., C. U. Grosse, A. T. Herb (2000). Ultrasonic monitoring of setting andhardening of cement mortar – A new device. Materials and Structures, vol. 33, no. 233, pp.581–583.
RI-ZFP-TU (2001). Richtlinie fur die Anwendung der zerstorungsfreien Prufung von Tun-nelinnenschalen (Guidelines for the application of nondestructive testing of inner tunnellinings). Bundesministerium fur Verkehr, Bau- und Wohnungswesen.
RILEM TC 42–CEA (1981). Properties of set concrete at early ages – state of the art report.Materials and Structures, vol. 14, no. 84, pp. 399–450.
Roderick, R. L., R. Truell (1952). The measurement of ultrasonic attenuation in solids by thepulse technique and some results in steel. Journal of Applied Physics, vol. 23, no. 2, pp.267–279.
Rostasy, F., M. Krauß, H. Budelmann (2002). Planungswerkzeug zur Kontrolle der fruhen Riss-bildung in massigen Betonbauteilen, Teil 1 (Planning tool for controlling early age crackingin massive concrete members, part 1). Bautechnik, vol. 79, no. 7, pp. 431–435. Part 2, no.8, pp. 523–527. Part 3, no. 9, pp. 641–647. Part 4, no. 10, pp. 697–703. Part 5, no. 11, pp.778–789. Part 6 + Part 7, no. 12, pp. 869–874. (in German).
Sansalone, M. (1997). Impact-echo: the complete story. ACI Structural Journal, vol. 94, no. 6,pp. 777–786.
Sansalone, M., W. B. Streett (1997). Impact-echo: Non-destructive evaluation of concrete andmasonry. Bullbrier Press, Ithaca, N.Y., 339 pp.
Sayers, C. M., A. Dahlin (1993). Propagation of ultrasound through hydrating cement pastesat early times. Advanced Cement Based Materials, vol. 1, no. 1, pp. 12–21.
Sayers, C. M., R. L. Grenfell (1993). Ultrasonic propagation through hydrating cements. Ul-trasonics, vol. 31, no. 3, pp. 147–153.

222 References
Schickert, G. (1984). Critical reflections on non-destructive testing of concrete. Materials andStructures, vol. 17, no. 99, pp. 217–223.
Schickert, G., J. Henschen, M. Krause, C. Maierhofer, F. Weise, H. Wiggenhauser, K. Bor-chardt (1999). Zfpbau-kompendium (NDT-CE Compendium). URL http://www.bam.de/zfpbau-kompendium.htm. (in German).
Schindler, A. K. (2004). Effect of temperature on hydration of cementitious materials. ACIMaterials Journal, vol. 101, no. 1, pp. 72–81.
Schmidt, E. (1950). Der Beton-Prufhammer (The concrete test hammer). SchweizerischeBauzeitung, vol. 68, no. 28, pp. 378–379. (in German).
Schmidt, E. (1951). Versuche mit dem neuen Beton-Prufhammer zur Qualitatsbestimmungdes Betons (Experiments with the new concrete test hammer for determining the quality ofconcrete). Schweizer Archiv fur angewandte Wissenschaft und Technik, vol. 17, no. 5, pp.139–143. (in German).
Schreiber, E., O. L. Anderson, N. Soga (1973). Elastic Constants and their Measurement.McGraw-Hill Inc, 196 pp.
Scrivener, K. L. (1989). The microstructure of concrete. In Skalny, J. (Ed.), Materials Scienceof Concrete, The American Ceramic Society, Inc., Westerville, Ohio, vol. 1. pp. 127–161.
Shah, S. P., K. V. Subramaniam, J. S. Popovics (2000). Use of nondestructive ultrasonictechniques for material assessment and in-service monitoring of concrete structures. OnlineJournal NDT.net, vol. 5, no. 2. URL http://www.ndt.net.
Shalaby, W., R. Zoughi (1995). Microwave compressive strength estimation of cement pasteusing monopole probes. Research in Nondestructive Evaluation, vol. 7, no. 2-3, pp. 101–115.
Simmons, J. C. (1955). Poisson’s ratio of concrete: a comparison of dynamic and static mea-surements. Magazine of Concrete Research, vol. 7, no. 20, pp. 61–68.
Skramtajew, B. G. (1938). Determining concrete strength for control of concrete in structures.Journal of the American Concrete Institute, vol. 34, no. 1, pp. 285–303.
Slowik, V., E. Schlattner, T. Klink (2004). Experimental investigation into early age shrinkageof cement paste by using fibre Bragg gratings. Cement and Concrete Composites, vol. 26,no. 5, pp. 473–479.
Smith, A., T. J. Chotard, N. Gimet-Breart, D. Fargeot (2002). Correlation between hydrationmechanism and ultrasonic measurements in an aluminous cement: Effect of setting timeand temperature on the early hydration. Journal of the European Ceramic Society, vol. 22,no. 12, pp. 1947–1958.
Srinivasan, R., D. DeFord, S. P. Shah (1999). The use of extrusion rheometry in the developmentof extruded fiber-reinforced cement composites. Concrete Science and Engineering, vol. 1,no. 1, pp. 26–36.
Sriravindrarajah, R., R. N. Swamy (1982). Development of a conductivity probe to monitorsetting time and moisture movement in concrete. Cement, Concrete, and Aggregates, vol. 4,no. 2, pp. 73–80.
Stepisnik, J., M. Lukac, I. Kocuvan (1981). Measurement of cement hydration by ultrasonics.American Ceramic Society Bulletin, vol. 60, no. 4, pp. 481–483.
Subramaniam, K. V., J. P. Mohsen, C. K. Shaw, S. P. Shah (2002). Ultrasonic technique formonitoring concrete strength gain at early age. ACI Materials Journal, vol. 99, no. 5, pp.458–462.
Subramaniam, K. V., J. R. Rapoport, S. P. Shah (2000). Nondestructive technique for moni-toring strength gain in concrete structures. Cementing the Future, Newsletter of the Centerfor Advanced Cement-Based Materials, vol. 12, no. 1, pp. 4–5.
Sun, Z. (2004). personal communication. Northwestern University, Evanston, USA.
Sun, Z., G. Ye, T. Voigt, S. P. Shah, K. van Breugel (2004). Early age properties of Portlandcement pastes investigated with ultrasonic shear waves and numerical simulation. In RILEMInternational Symposium of Advances in Concrete through Science and Engineering.
Swamy, N., G. Rigby (1971). Dynamic properties of hardened paste, mortar and concrete.

References 223
Materials and Structures, vol. 4, no. 19, pp. 13–40.
Swamy, R. N. (1971). Dynamic Poisson’s ratio of Portland cement paste, mortar and concrete.Cement and Concrete Research, vol. 1, no. 5, pp. 559–83.
Tan, K. S., K. C. Chan, B. S. Wong, L. W. Guan (1996). Ultrasonic evaluation of cementadhesion in wall tiles. Cement and Concrete Composites, vol. 18, no. 2, pp. 119–124.
Taylor, H. F. W. (1997). Cement chemistry. Thomas Telford, London, 2nd ed., 459 pp.
Tazawa, E. (Ed.) (1999). Autogenous Shrinkage of Concrete, Proceedings of the InternationalWorkshop organized by the JCI (Japan Concrete Institute). Spon Press, Hiroshima.
Tazawa, E., S. Miyazawa, T. Kasai (1995). Chemical shrinkage and autogenous shrinkage ofhydrating cement paste. Cement and Concrete Research, vol. 25, no. 2, pp. 288–292.
Tennis, P. D., Y. Xi, H. M. Jennings (1997). Mathematical modeling of cement paste mi-crostructure by mosaic pattern. Part II. Application. Journal of Materials Research, vol. 12,no. 7, pp. 1741–1746.
Thomson, W. T. (1940). Measuring changes in physical properties of concrete by the dynamicmethod. ASTM Proceedings, vol. 40, pp. 1113–1121.
Tikalsky, P. J., B. E. Scheetz, D. G. Tepke (2001). Using the concrete maturity meter forQA/QC. Pennsylvania department of transportation research report, Pennsylvania Trans-portation Institute, The Pennsylvania State University, University Park.
Tremper, B. (1944). The measurement of concrete strength by embedded pull-out bars. ASTMProceedings, vol. 44, pp. 880–887.
Tzschichholz, F., H. J. Herrmann, H. Zanni (1996). Reaction-diffusion model for the hydrationand setting of cement. Physical Review E.Statistical Physics, Plasmas, Fluids, and RelatedInterdisciplinary Topics, vol. 53, no. 3, p. 2629.
Valic, M. I. (2000). Hydration of cementitious materials by pulse echo USWR. Method, ap-paratus and application examples. Cement and Concrete Research, vol. 30, no. 10, pp.1633–1640.
Valic, M. I., J. Stepisnik (1998a). Rheology of cement pastes with ultrasonic shear wave method.In Emri, I. (Ed.), Proceedings of the Fifth European Rheology Conference: Progress andTrends in Rheology V. pp. 501–502.
Valic, M. I., J. Stepisnik (1998b). A study of hydration of cement pastes by reflection ofultrasonic shear waves. Part I: Apparatus, experimental method and application examples.Kovine, Zlitine, Tehnologije, vol. 32, no. 6, pp. 551–560.
Valic, M. I., J. Stepisnik (1999). Applications of pulsed USWR method for materials studies.Kovine, Zlitine, Tehnologije, vol. 33, no. 5, pp. 341–344.
Valic, M. I., J. Stepisnik, M. Gabrijelcic, T. Vuk, L. Rescic (1999). Setting times measurementsof Portland cements with pulsed USWR method. Kovine, Zlitine, Tehnologije, vol. 33, no.1-2, pp. 83–86.
Valic, M. I., T. Vuk (2000). A study of the influence of additives and admixtures on thehydration of cement with the pulsed USWR method. Materiali in Tehnologije, vol. 34,no. 5, pp. 249–255. Note: in Slowenian.
Voigt, T., Y. Akkaya, S. P. Shah (2002). Determination of early age concrete strength by areflective ultrasonic technique. In Konig, G., F. Dehn, T. Faust (Eds.), Proceedings of theSixth International Symposium on Utilization of High Strength/High Performance Concrete.vol. 2, pp. 1489–1501.
Voigt, T., Y. Akkaya, S. P. Shah (2003). Determination of early age mortar and concretestrength by ultrasonic wave reflections. Journal of Materials in Civil Engineering, vol. 15,no. 3, pp. 247–254.
Voigt, T., S. P. Shah (2002-2003). Nondestructive testing of early age concrete. Cementing theFuture, Newsletter of the Center for Advanced Cement-Based Materials, vol. 14, no. 1, pp.4–5. URL http://acbm.northwestern.edu/cfpub.html.
Voigt, T., S. P. Shah (2003). Nondestructive monitoring of setting and hardening of Portlandcement mortar with sonic methods. In Proceedings of the Sixth International Symposium on

224 References
Non-Destructive Testing in Civil Engineering (NDT-CE 2003).
Voigt, T., S. P. Shah (2004). Properties of early age Portland cement mortar monitored withshear wave reflection method. ACI Materials Journal, vol. 101, no. 6, pp. 473–482.
Voigt, T., Z. Sun, S. P. Shah (2004a). Health monitoring of early age concrete. In Oh, B. H.,K. Sakai, O. E. Gjørf, N. Banthia (Eds.), Proceedings of the Fourth International Conferenceon Concrete under Severe Conditions (CONSEC 04). vol. 1, pp. 17–29.
Voigt, T., G. Ye, Z. Sun, S. P. Shah, K. van Breugel (2004b). Early age microstructure ofPortland cement mortar investigated by ultrasonic shear waves and numerical simulation.Cement and Concrete Research. In press.
Weigler, H., S. Karl (1974). Junger Beton. Teil 1: Beanspruchung–Festigkeit–Verformung.Betonwerk+Fertigteiltechnik, vol. 40, no. 6, pp. 392–401. Teil 2. no. 7, pp. 481–484.
Whitehurst, E. A. (1951). Use of the soniscope for measuring setting time of concrete. ASTMProceedings, vol. 51, pp. 1166–1183.
Willmes, M. (2004). personal communication. Bilfinger Berger AG, Mannheim, Germany.
van der Winden, N. G. B. (1991). Ultrasonic measurement for setting control of concrete.In Reinhardt, H. W. (Ed.), Proceedings of the International Workshop on Testing DuringConcrete Construction. Chapman and Hall, London, New York, RILEM Proceedings 11, pp.122–137.
van der Winden, N. G. B., A. W. Brant (1977). Ultrasonic testing for fresh mixes. Concrete,vol. 11, no. 12, pp. 25–28.
Wittmann, F. H., P. E. Roelfstra, H. Sadouki (1985). Simulation and analysis of compositestructures. Materials Science and Engineering, vol. 68, no. 2, pp. 239–248.
Xi, Y., P. D. Tennis, H. M. Jennings (1996). Mathematical modeling of cement paste mi-crostructure by mosaic pattern: Part I. Formulation. Journal of Materials Research, vol. 11,no. 8, pp. 1943–1952.
Ye, G. (2003). Experimental study and numerical simulation of the development of the mi-crostructure and permeability of cementitious materials. PhD thesis, Delft University ofTechnology, Delft, The Netherlands.
Ye, G., K. van Breugel, A. L. A. Fraaij (2003a). Experimental study and numerical simulationon the formation of microstructure in cementitious materials at early age. Cement andConcrete Research, vol. 33, no. 2, pp. 233–239.
Ye, G., K. van Breugel, A. L. A. Fraaij (2003b). Three-dimensional microstructure analysisof numerically simulated cementitious materials. Cement and Concrete Research, vol. 33,no. 2, pp. 215–222.
Ye, G., J. Hu, K. van Breugel, P. Stroeven (2002). Characterization of the development ofmicrostructure and porosity of cement-based materials by numerical simulation and ESEMimage analysis. Materials and Structures, vol. 35, no. 254, pp. 603–613.
Ye, G., P. Lura, K. van Breugel, A. L. A. Fraaij (2004). Study on the development of themicrostructure in cement-based materials by means of numerical simulation and ultrasonicpulse velocity measurement. Cement and Concrete Composites, vol. 26, no. 5, pp. 491–497.
Yener, M., W. F. Chen (1984). On in-place strength of concrete and pullout tests. Cement,Concrete, and Aggregates, vol. 6, no. 2, pp. 90–99.
Zoldners, N. G. (1957). Calibration and use of impact test hammer. Journal of the AmericanConcrete Institute, vol. 54, no. 2, pp. 161–165.
Zoughi, R., S. D. Gray, P. S. Nowak (1995). Microwave nondestructive estimation of cementpaste compressive strength. ACI Materials Journal, vol. 92, no. 1, pp. 64–70.

This book is a reprint of the author’s PhD thesis, which was submitted to theUniversity of Leipzig, Germany. The defense of the thesis took place in Leipzigon September 27th, 2004. The primary reviewer of the thesis and the defensewas Prof. Dr.-Ing. Stefan Winter, University of Leipzig, Germany. As secondaryreviewers served Prof. Surendra P. Shah, Northwestern University, USA andDr.-Ing. Frank Dehn, Institute of Materials Research and Testing in Civil En-gineering in Leipzig, Ltd (MFPA Leipzig GmbH), Germany.