the apparent - carlo alberto
TRANSCRIPT


The Apparent Diversification Discount.
Michela Altieri1 Giovanna Nicodano2
Abstract
Our model highlights the impact of bankruptcy on (true and apparent) firm value. We show
that the pricing of diversified firms suffers from a survivorship bias, due to their lower
mortality relative to focused ones. This difference in mortality is able to turn a true
diversification premium, deriving from saved bankruptcy costs, into an apparent
diversification discount. Such apparent discount is larger the larger is the true premium due
to coinsurance across diversified units. We show how this insight contributes to explain value
paradoxes in diversified companies such as multi-unit groups, multi-segment conglomerates,
and parent companies.
October 18th, 2016
JEL code: G32, D23, K19.
Keywords: bankruptcy costs, coinsurance, contagion, limited liability, diversification discount,
survivorship bias, parent company discount, cost of debt.
__________________ We are grateful for comments and suggestions on earlier drafts to Patrick Bolton, Arnoud Boot, Bernardo Bortolotti, Gabriella Chiesa, Raffaele Corvino, Marc Deloof, Marco Da Rin, Bernard Dumas, Zsuzsanna Fluck, Arie Melnik, Fausto Panunzi, Alessandro Penati, Enrico Perotti, Rafael Repullo, Kristian Rydquist, Alessandro Sembenelli and Elu von Thadden as well as participants to the S.I.E. Meetings and to the 2014 SIDE conference. The usual disclaimer applies. 1 SAFE- Goethe University of Frankfurt, House of Finance, Theodor-W-Arnoldo-Platz 3, 60323 Frankfurt am Main, Germany. e-mail: [email protected] 2Collegio Carlo Alberto and ESOMAS, via Real Collegio 30,10024 Moncalieri (TO), Italy. email: [email protected]
2
1. Introduction
Diversified business groups and conglomerates are common corporate organizations, generating a total
value added of 28 US$ trillion in over 200 countries (Altomonte and Rungi, 2013; Herring and
Carmassi, 2009). Despite the relevance of diversified firms, the link between their economic role and
their market value remains an open question in finance. On the one hand, a large literature argues that
diversification distorts investment choices, thereby lowering the value of diversified firms below that
of specialized, stand-alone ones. On the other hand, recent empirical investigations cast doubts on a
causal link between investment inefficiency and the observed discount on diversified firms.
This paper sheds new light on the nature of the diversification discount. We develop a framework
where firm diversification increases value because coinsurance saves on bankruptcy costs, as in Boot
and Schmeits (2000) and Lewellen (1971). We thus set aside the change in incentives highlighted in the
prior literature. In our framework, diversified firms should trade at a relative premium with respect to
stand-alone firms. However, what we observe in databases are the stronger stand-alone firms, which
were able to survive to industry downturns, while the weaker ones failed and disappeared from
databases. Therefore, one ends up comparing the relative value of diversified firms with respect to the
best stand-alone firms, thus measuring a relative discount for diversified firms. Such discount is only
apparent, as it is purely due to the survivorship selection. The first, and main, insight of our paper, then,
is that a survivorship bias is the source of an apparent discount for value-increasing diversified firms.
While this insight is straightforward once made explicit, it also applies to subtle differences across
types of diversified firms. We juxtapose conglomerate organizations to parent-subsidiary structures
(also known as business groups), where parent and subsidiary firms have separate legal liability. In a
conglomerate, an unprofitable unit may drag the profitable units into bankruptcy, because they are
jointly liable for their debt obligations. Thus, bankruptcy costs in conglomerates may exceed the ones
of stand-alone firms, due to contagion, as discussed in Banal, Ottaviani and Winton (2013) and Leland

3
(2007), implying that the true excess conglomerate value relative to stand-alone firms is positive only
if coinsurance benefits exceed contagion costs. Business groups avoid instead contagion because the
parent company enjoys limited liability for its subsidiaries’ debt obligations. At the same time, a group
affiliate may support other affiliates, thus providing the coinsurance benefits that are open to
conglomerate units. For these reasons, the true value of business groups exceeds that of both equally
diversified conglomerates and less diversified stand-alone firms. However, groups appear to trade at a
discount relative to both types of firms because of the survivorship bias. The second insight of our
paper is that a survivorship bias distorts the relative price of diversified firms, punishing those
organizations that survive more often to industry downturns.
Our main insight carries over to other relative pricing puzzles1. We show that the survivorship bias
may contribute to explain why the parent company trades at a discount relative to its stand-alone
valuation. This apparent discount originates from the parent surviving more often thanks to the dividend
receipts from its subsidiaries. Clearly, a listed subsidiary provides a smaller dividend to its parent
company, thereby reducing the parent company survival in industry downturns. The pricing implication
of this reasoning is that the apparent discount of the parent company, induced by the survivorship bias,
is lower in pyramidal groups than in private groups, and disappears when subsidiaries are spun-off.
Our model also implies that the true profit volatility in groups is lower than the one of the stand-
alone units. Some previous studies of the diversification role of groups examine whether such lower
volatility appears in the data, finding mixed results (He et al., 2013; Khanna and Yafeh, 2005). Our
reasoning implies that the apparent profit volatility of surviving groups exceeds the one of surviving
1 A summary of the early, but ongoing, debate on the conglomerate discount appears in Maksimovic and Phillips
(2007). See Cornell and Liu (2001) on the parent company discount. See also Almeida, Park, Subrahmanhyam
and Wolfenzon (2011) and references in Khanna and Yafeh (2007) on value and profitability of group affiliates.

4
independent companies, due to the survivorship bias. Thus, the bias may also explain why there is so
little evidence on the risk- sharing role of groups.
As a by-product, our pricing model clarifies the subtle link between diversification, contagion and
the true cost of debt. It shows that diversified firms always enjoy a lower interest rate than the one
charged to specialized companies (as in Hann et al., 2013). The paradox is that conglomerates may
enjoy a lower interest rate even when they destroy value with respect to (focused) stand-alone firms.
The reason is that lenders anticipate a larger recovery-upon-default due to the contagion of healthy
segments. We thus highlight that conglomerate diversification may counterintuitively reduce both the
interest rate and conglomerate value below the ones of focused firms. This is due to a transfer of lenders’
wealth across states of nature. Previous papers highlight instead that conglomerate diversification
implies a transfer of wealth between lenders and shareholders (Kim and McConnell, 1977; Mansi and
Reeb, 2002) due to lower profit volatility.
The rest of the paper proceeds as follow. Section 2 presents our model, focusing on bankruptcy costs.
Section 3 derives the true and apparent relative firm value and the relationship between the
diversification discount and the survival skills of conglomerates and groups. In Section 4 we present
our robustness checks. Conclusions follow. Appendix A highlights the origins of the corporate limited
liability embedded in business groups and reports about its enforcement by courts. All proofs are in
Appendix B.
1.1 RELATED LITERATURE
This paper provides new insight into the diversification-value controversy, bringing into this arena the
known problem of survivorship bias in empirical finance. We know that databases, including
COMPUSTAT, contain only those companies that are currently viable entities. Thus, they exclude
companies that filed for bankruptcy or have otherwise ceased to exist. Banz and Breen (1986) observe
that this induces an ex-post-selection bias that disturbs the comparison of returns between different

5
types of firms, such as firms with low and high price/earnings. Kothari, Shanken and Sloan (1995)
show that ex-post selection overstates the excess return on high book-to-market portfolios. Brown,
Goetzmann and Ross (1995) highlight how survival distorts return predictability and the equity
premium. Our model shows that it biases our inference on the relative value of diversified and focused
organizations. We thus suggest a plausible explanation for the most puzzling aspect of the controversy,
namely the existence of a large discount for diversified firms in the raw data together with the difficulty
in associating it to a blatant inefficiency.
In this light, the closest paper on the diversification discount is Gomes and Livdan (2014), which
also considers the discount as consistent with the neoclassical view of efficient firm diversification.
Gomes and Livdan stress that diversification helps the search for better productive opportunities, while
we point to its role in saving bankruptcy costs. They argue that the conglomerate discount reflects the
endogenous selection of less productive firms into diversified conglomerates. We claim that it is, at
least in part, a pure artifact of the data.
Our argument generalizes to settings where other features of diversified firms cause a true
diversification discount or premium. These may stem from the internal capital market (Almeida et al.,
2011; Rajan, Servaes and Zingales, 2000; Stein, 2002), from employee incentives (Cestone and
Fumagalli, 2005; Fulghieri and Sevilir, 2011), as well as production decisions (Alonso, Dessein and
Matouschek, 2015). However, a true value discount for diversified firms may also stem from
coinsurance of units, distorting effort incentives of unit managers (Boot and Schmeits, 2000). Our
general point is that any true discount (or premium) due to such motives is upward (downward) biased
by enhanced survival.
Last, but not least, our paper relates to the literature on bailouts between members of business groups.
Several papers highlight the role of the parent company in providing both informal and formal support
in groups (see Gopalan Nanda and Seru (2007) and Kolasinsky (2009)), with the exception of groups
involved in project financing (Shah and Thakor (1987)). Our model recognizes that internal dividends

6
are a vehicle for the internal support of the parent. This makes explicit the similarity between the
coinsurance function of groups and conglomerates, as long as the parent company fully owns its
subsidiary. As in Luciano and Nicodano (2014), we study the pricing implications of coinsurance and
corporate limited liability, focusing however on the survivorship bias rather than tax distortions.
2. The Model
An entrepreneur chooses how to organize two production units in order to maximize their value. Each
unit funds itself through debt. The organizations do not alter the operating profits of each unit, but differ
in the extent of support that each can provide to the other one, as well as in the extent of liability for the
debt of the other unit. This affects both credit conditions and profits, net of funding costs, to each
organization.
2.1. CASH FLOWS AND BANKRUPTCY COSTS
Each unit, indexed by i = (A, B), raises an amount of debt, Di=1, to invest in a project at the initial time
(t = 0). The operating profit of each unit is realized in t = 1. It will be High, and equal to Xi>0, with
probability pi∈(0, 1), and it will be Low, and equal to zero, with probability (1 - pi). We define four
states of the world, {HH, LL, HL, LH}, where the first (second) letter in each pair refers to the profit
of unit A (B). Our choice of values implies that each unit has insufficient operating profits in state L to
honor its own debt obligations. Without support, it defaults, and the future profit of unit i, Ki > 0, is lost.2
Finally, we assume that the profit of unit A, in state HL, exceeds combined debt repayment of the
two units, whereas the profit of unit B is lower than the combined service of debt. We will later assess
that payoffs satisfy these restrictions.
2 Hennessy and Whited (2007) estimate bankruptcy costs in the range of 8%-15% of capital for US Compustat
firms, while Leland (2007) calibrates them to 23% for BBB-rated firms.

7
2.2. ORGANIZATIONAL STRUCTURES
The entrepreneur chooses among three organizations: stand-alone firms, business groups and
conglomerates. Stand-alone firms operate separately. Each is independently liable to competitive
lenders, who require a rate Ri. Given the assumptions concerning cash flows, firm A defaults in states
{LH} and {LL} while firm B defaults in {HL} and {LL}.
In a conglomerate, segments A and B belong to the same firm. They are therefore jointly liable vis-
à-vis lenders. The conglomerate defaults in state {LL}, when both units either have zero profits, and in
state {LH}, when segment A drags the profitable segment B into bankruptcy. However, there are
coinsurance benefits in state {HL}, because profits from segment A save B from insolvency. Thus, the
conglomerate organization allows for coinsurance, while stand-alone companies do not, but it suffers
from contagion. So far, we are following the setup of Boot and Schmeits (2000) without incentive
problems, adding instead the assumption of asymmetric profits. This assumption makes contagion
possible, a feature that is prominent in other analyses of conglomerate mergers such as Banal, Ottaviani
and Winton (2013) and Leland (2007).
We now extend the analysis to groups. In a group, the incorporation of companies is separate and
lenders fund them individually. The parent company (B) owns its subsidiary (A) and receives dividends
that allow the parent to meet its debt obligations when the former is profitable and the latter is not, in
state {HL}. Despite this ownership link, the parent company B enjoys corporate limited liability vis-à-
vis the debt obligations of unit A. This limit on liability implies that unit A selectively defaults in state
{LH}.3 Thus, the group organization allows for diversification, as in conglomerates, without incurring
into contagion costs. In the first part of our analysis, we assume that the parent company (B) owns
100% of the shares of its subsidiary (A).
3 This is the situation when Indian groups fail to provide support to ailing subsidiaries (Gopalan et al., 2007).

8
It is worthwhile discussing a few features of our model. First, a maintained assumption is that the
costs of mergers prevent them from occurring. At the other extreme, if such costs are negligible, the
provision of support becomes possible for a profitable stand-alone company through acquisitions of an
insolvent one (as in Fluck and Lynch, 1999). Second, corporate limited liability is central to the
argument that groups save on bankruptcy costs. Courts may occasionally repeal corporate limited
liability asking the parent company to meet its subsidiary debt obligations. Appendix A reports on court
practice in several jurisdictions, that usually “pierce the corporate veil” in case of fraud, only. Third, in
the model, both conglomerate and group support takes the form of a transfer from A to B, only. We
could enlarge this minimalist state space to define an additional state in which B rescues A from
bankruptcy and more generally to eliminate asymmetries in profits. These algebraic complications do
not affect the key insight concerning the cost of credit and value in each organization – to which we
turn in the next section.
2.3. COINSURANCE, CONTAGION AND THE TRUE COST OF DEBT
We now determine the interest factors charged by the lenders, assuming risk-neutrality and a zero risk-
free rate. Lenders of stand-alone firms, i =A, B, receive the debt repayment in state {H} and collect
nothing in state {L}. It follows that the interest factor for unit i, Ri, satisfying the lenders’ zero expected
profit condition, 1= (1- pi)* 0 + pi Ri, is equal to:
Ri = 1−ip . (1)
Conglomerate’s lenders receive the debt repayment in state {HH} and {HL}. They also recover the
cash flow XB in state {LH}, when segment A drags segment B into bankruptcy, but B is profitable.
Thus, the interest factor for the Conglomerate (C) is equal to:
1[2 (1 ) ]C A B A BR p p p X−= − − (2)
9
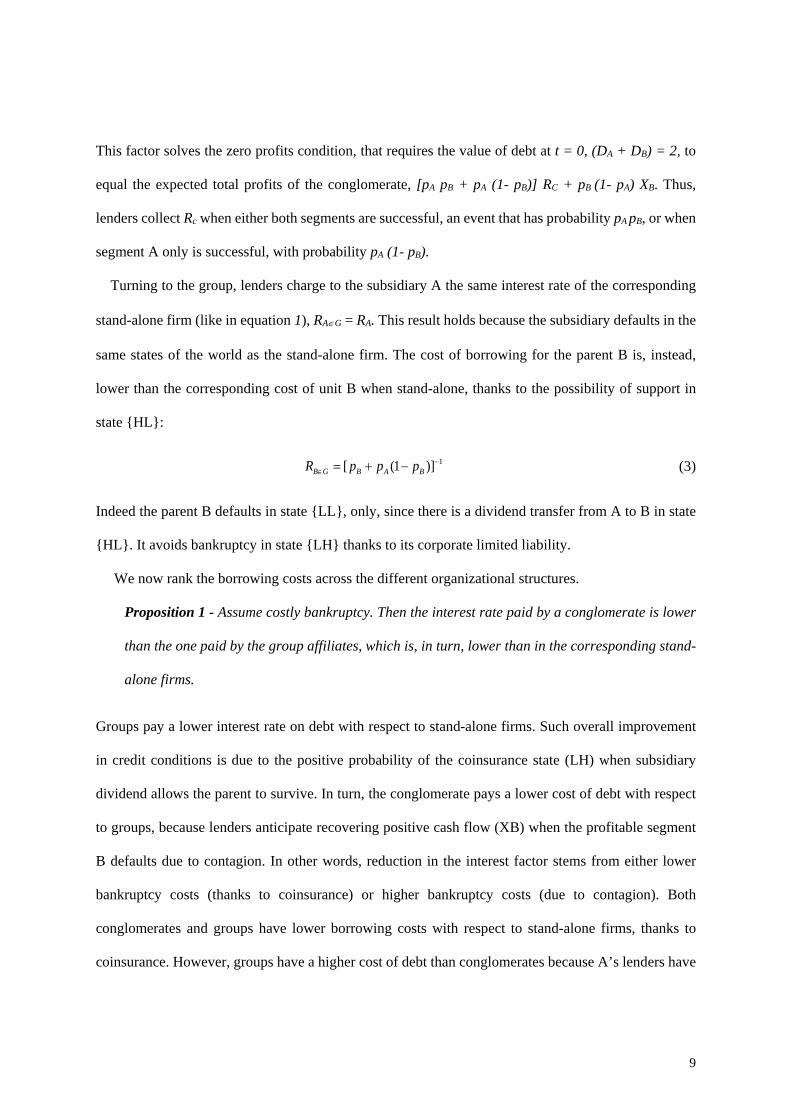
This factor solves the zero profits condition, that requires the value of debt at t = 0, (DA + DB) = 2, to
equal the expected total profits of the conglomerate, [pA pB + pA (1- pB)] RC + pB (1- pA) XB. Thus,
lenders collect Rc when either both segments are successful, an event that has probability pA pB, or when
segment A only is successful, with probability pA (1- pB).
Turning to the group, lenders charge to the subsidiary A the same interest rate of the corresponding
stand-alone firm (like in equation 1), RA∈G = RA. This result holds because the subsidiary defaults in the
same states of the world as the stand-alone firm. The cost of borrowing for the parent B is, instead,
lower than the corresponding cost of unit B when stand-alone, thanks to the possibility of support in
state {HL}:
1[ (1 )]B G B A BR p p p −∈ = + − (3)
Indeed the parent B defaults in state {LL}, only, since there is a dividend transfer from A to B in state
{HL}. It avoids bankruptcy in state {LH} thanks to its corporate limited liability.
We now rank the borrowing costs across the different organizational structures.
Proposition 1 - Assume costly bankruptcy. Then the interest rate paid by a conglomerate is lower
than the one paid by the group affiliates, which is, in turn, lower than in the corresponding stand-
alone firms.
Groups pay a lower interest rate on debt with respect to stand-alone firms. Such overall improvement
in credit conditions is due to the positive probability of the coinsurance state (LH) when subsidiary
dividend allows the parent to survive. In turn, the conglomerate pays a lower cost of debt with respect
to groups, because lenders anticipate recovering positive cash flow (XB) when the profitable segment
B defaults due to contagion. In other words, reduction in the interest factor stems from either lower
bankruptcy costs (thanks to coinsurance) or higher bankruptcy costs (due to contagion). Both
conglomerates and groups have lower borrowing costs with respect to stand-alone firms, thanks to
coinsurance. However, groups have a higher cost of debt than conglomerates because A’s lenders have

10
no claim to B’s profits. We can now make explicit the restrictions on asymmetric cash flows, underlying
the derivations of the previous equations. The assumption that profits in state H allow to service debt
implies that the cash flow in state H, Xi, exceeds the total debt repayment, that is Xi ≥ 1−ip for each unit
i. Recall now that the subsidiary, A, selectively defaults in state LH while the parent company, B,
receives support by A in state HL. This holds if the profit of unit A, XA, exceeds both units’ debt, that
is:
XA ≥ max(RC, RA∈G+RB∈G) (4)
A sufficient condition is that XA ≥ 11 −− + BA pp , since the highest cost of debt is the one of the stand-
alone firms by Proposition 1. The profit of unit B, XB, must in turn fall short the combined interest
factor:
XB < min(RC, RA∈G+RB∈G)
(5)
Restriction (5) implies XB < 2/[pA+pB(1-pA)], since the lowest cost of debt is the one in conglomerates,
by Proposition 1. The next section computes the value of each organization. We will show that a lower
cost of debt in conglomerates does not imply that they have the highest value, completing the reasoning
in Hann et al. (2013). Moreover, we will derive the average ex-post value that an econometrician
estimates when (s)he does control for differential survival.
3. The Apparent Diversification Discount
3.1. THE TRUE VALUE OF DIVERSIFICATION
The value of each organization coincides with profit after the service of debt, thanks to the zero risk-
free rate assumption. It is straightforward to show that it is respectively equal to: πI = (XA + KA) pA +
pB (XB+ KB) – 2 for two stand-alone firms; to πC = (XA + KA + KB) pA + pB XB – 2 for a conglomerate;
and πG = (XA+ KA) pA + (XB + KB) pB+ KB (1- pB) pA – 2 for a group.

11
We now compare them, in order to assess both the true diversification discounts as well as the effects
of coinsurance and limited liability on firm value. Some easy algebra (in Appendix C) leads to the
following statement:
Proposition 2: Assume costly bankruptcy. Then:
a. Groups have the highest true value.
b. The group premium relative to conglomerates represents the value of corporate limited liability. The
one relative to two stand-alone firms represents the value of coinsurance. They are, respectively, equal
to KB (1-pA) pB and KB (1- pB) pA.
c. Conglomerate excess value relative to stand-alone firms is positive if, and only if, contagion costs
are lower than diversification gains (pB < pA).
This proposition highlights the economic role of diversified firms, that increases firm value. Absent
bankruptcy costs, there should be no discount or premium because the differential survival ability of
organizations does not affect firm value. With bankruptcy costs, statement (a) indicates that groups
trade at a premium relative to both conglomerates and focused firms, because they best protect firm
activity. This result abstracts from incentive problems that may reduce (minority) shareholders’ value
relative to the stand-alone case. It also abstracts from higher value due to tax distortions (as in Luciano
and Nicodano, 2014). These assumptions allow highlighting, in Statement (b), the connection between
the excess group value and avoided bankruptcy costs. Corporate limited liability saves future profits
(KB) from being lost in the bankruptcy procedure due to contagion. This happens with probability (1-
pA) pB, which is the probability that unit B, while solvent by itself, is unable to provide support to the
insolvent one. Coinsurance allows saving unit B from insolvency. This occurs with probability (1-pA)
pB, which is the probability that B is insolvent but unit A generates enough profits to support it.
Statement (c) indicates that the excess value of conglomerates is positive only if contagion problems

12
are limited. It is not a new result, reminding of previous insight due to Banal et al. (2013) without tax
distortions and Leland (2007) with tax distortions.
The following section explains how a true diversification premium becomes an apparent
diversification discount.
3.2 SURVIVORSHIP BIAS
We now show that group affiliates and conglomerates appear to trade at a discount relative to stand-
alone companies if the econometrician does not account for survival. We thus address the methodology
of several papers investigating the excess value of multi-unit firms. These papers typically match single-
unit to multi-unit firms, when all of them are alive and appear in the database. The survivorship bias
originates from three facts. First, datasets do not contain information on bankrupt firms. Second, both
group affiliates and conglomerates exploit diversification in order to survive during industry downturns.
Third, the econometrician does not control for the survival ability of different organizations.
In order to be able to infer the apparent value of each organization, we must ask whether the state is
high or low when the econometrician finds firms in her dataset. This will determine the chances of
observing a high or a low cash flow. Let us, therefore, start with stand-alone units. The probability of
state {H}, when the econometrician notes that a stand-alone firm is present in her dataset, is 1. Indeed,
a stand-alone unit goes bankrupt and exits from the database in state {L}. It follows that the apparent
value of a stand-alone is equal to the high cash flow realizations net of the debt repayment, that is:
Vi =Xi+Ki - RB i=A,B (6)
We now determine the probability of being in a good or bad state when the econometrician observes
a parent or a subsidiary firm in the dataset. The probability of state H, when the subsidiary A is alive,
equals one because affiliation does not influence the default of the subsidiary. On the contrary, the state
is H with probability equal to [pB + (1- pB) pA]-1 pB, and low with probability equal to [pB + (1 - pB) pA]-
1(1- pB) pA when the parent company, B, appears in the dataset. This occurs because B survives in low

13
states, when it generates zero cash flows, thanks to the subsidiary support. The econometrician,
therefore, estimates the value of the parent company B as being equal to:
[(XB+KB -RB∈G) pB + (KB -RB∈G)(1- pB)pA] (7)
The apparent parent value, (7), is always lower than the apparent value of an independent unit, (6), that
is:
[pB + (1- pB) pA]-1 [(XB+KB -RB∈G) pB + (KB -RB∈G)(1- pB)pA] < KB+XB - RB ≡ XB > pB –1 (8)
It follows that parent companies appear to trade at a discount, while in reality, they are saving on
dissipative bankruptcy.
We now carry out a similar comparison between conglomerates and stand-alone units, when an
econometrician observes all units in operations. The probability of state {HH}, conditional on observing
both stand-alone companies alive, is one. On the contrary, the probability of state {HH} conditional on
observing a conglomerate is lower, because of the conglomerate ability to survive when A rescues B.
Such probability is equal to Pr[HH / (HH+LH)], that is:
pA pB /[ pA pB +(1- pB) pA]-1 ≡ pB < 1. (9)
The probability of state {LH} is (1 - pB). Thus, the estimated value of the conglomerate equals:
pB (XB +KB+ XA+KA-Rc) + (1 - pB)(KA+ XA+KB-Rc) ≡ (KB+ XA+KA-Rc) + pBXB. (10)
Let us now compare equations (7) and (10). The conglomerate appears to have a lower market value
with respect to stand-alone firms if
XB > (RA + RB –RC) (1- pB)-1, that is if: (11)
XB > pB –1

14
This inequality always holds, since the profit in each unit always exceeds the value of its debt by
assumption. Thus, conglomerates trade at an apparent discount relative to stand-alone whether or not
they save on bankruptcy costs. The survivorship bias is, therefore, tricky when it comes to
conglomerates. We know already the rationale for the apparent discount when conglomerates save on
bankruptcy costs, that is, when pB < pA.. When the opposite holds, contagion cancels segment B with
positive profits more often than it saves segment A with zero profits. Hence, a profitable segment
disappears from the database, thereby contributing all the same to the conglomerate discount.
In summary, the survivorship bias affects both conglomerates and business groups. However, the
Appendix shows that the diversification discount for business groups is more severe because the group
survives more often when profitability is low. The analyst will thus observe a lower value for groups in
operations than for conglomerates in operation. We summarize our results as follows:
Proposition 3: Assume an econometrician matches groups and conglomerates to the corresponding
stand-alone firms, conditional on available data. Then the value of matched groups appears lower than
the value of matched conglomerates, which appears, in turn, lower than the value of stand-alone firms.
This proposition implies that comparing average market values of different organizations lead to the
wrong inference concerning their relative efficiency. This is not due to distortions in market prices:
prices are rational, and there are no limits to arbitrage. The wrong inference derives from the different
survival ability of organizations, which investors, analysts and econometrician alike fail to consider.
Our proposition provides the same rationale for puzzling discounts uncovered by empirical analysis,
concerning different types of diversified organizations. The same rationale may also be able to explain
the apparent excess profit volatility of groups (see Khanna and Yafeh, 2005). Three empirical studies
contain promising signals that align with our theory. If the hypothesis of survivorship bias is true, there
should be an inconsistency between ex-ante predictions and ex-post measurement. Lamont and Polk
(2001) find that larger conglomerates discounts - obtained with a matching procedure - predict higher

15
realized returns. However, both standard risk factors, as well as liquidity or arbitrage impediments, are
unable to explain such a pattern. According to our model, the higher realized returns are the gain from
coinsurance (net of contagion). In turn, the ex-post diversification discount they find appears because
of the survivorship bias inherent in the standard measurement method. Second, an analysis that accounts
for defaulted units - and is, therefore, free from survivorship bias– should reveal that diversified firms
outperform during industry distress. Gopalan and Xie (2011) measure the average discount on multi-
units firms just before and during unexpected industry distress. Thus they take into account the
disappearance (through delisting, i.e. bankruptcies, mergers, etc.) of weak stand-alone firms. They find
that the average conglomerate discount reduces from 20% the year before industry distress to 6.9% in
the three years after industry distress. This suggests a fair value of coinsurance equal to 13.1%,
conditional on industry distress. Third, survey data should not be subject to selection bias. Accordingly,
it appears that diversification creates value when the analyst uses survey data to estimate ex-ante returns
(see Hann et al., 2013).
4. Robustness
This section qualifies previous results. It suggests that the apparent discount is larger when unit B is
able to support unit A (section1). It then suggests other modifications to relative pricing that derive
from partial ownership of the subsidiary (section 2) and non-contractible managerial effort (section 3).
4.1. PARENT COMPANY BAILOUTS AND SUBSIDIARY PRICING.
Parent companies often support their subsidiaries, without being subject to contractual guarantees. For
example, they write “comfort letters” assuring subsidiaries’ lenders that they would assist them in
distress. These letters do not undermine their limited liability, because they are legally unenforceable,
but allow the parent company to choose whether to honor them ex post (Boot et al., 1993). Our model
set-up allows only the subsidiary to support its parent through dividends. Consequently, the subsidiary

16
does not suffer from the survivorship bias. It is, however, easy to add a state of nature with parent profits
that are larger than the sum of debt obligations for both units. In that state, the parent shareholders
would honor their comfort letters. The survivorship bias in groups would then become more severe
relative to stand-alone firms. The pricing relationship with respect to conglomerates would be
qualitatively unaltered, as long as division B may both rescue and contaminate division B in some states
of the world.
4.2 DIVERSIFICATION BENEFITS IN PYRAMIDAL GROUPS
Previous sections deal with groups with fully owned subsidiaries, which are common in several
jurisdictions, as mentioned in Appendix A. However, pyramidal groups with listed subsidiaries are also
common (see La Porta et al. (1999)). This section investigates the consequences of partial subsidiary
ownership for the diversification role of groups and their pricing, continuing to sidestep the
expropriation of minority shareholders taking place with separation of ownership from control. A
simple argument implies that the listing of affiliates does not, in general, improve, and may worsen,
group survival thereby reducing both the true premium and the apparent discount.
Let the parent firm own a percentage, γ, of subsidiary equity. Then the dividends it receives from the
subsidiary reduce to γXA. Lower dividends increase the costs of parent debt, as lenders anticipate a
higher default probability. Let variable λ account for the bailout probability, we assume that it might
assume two values, conditional to the realization of cash flow of units A and B:
λ = 1 ( )A A G B GX R Rγ ∈ ∈+≥ (11)
λ = 0 < ( )A A G B GX R Rγ ∈ ∈+ (12)
We can determine the threshold value of γ, which we indicate with γ*, such that λ = 1:
1 1 1* 1( ) ( ) [ (1 ) ] A AB B A B AA X p p p p XR Rγ γ − − − −> = + = + − . (13)
17
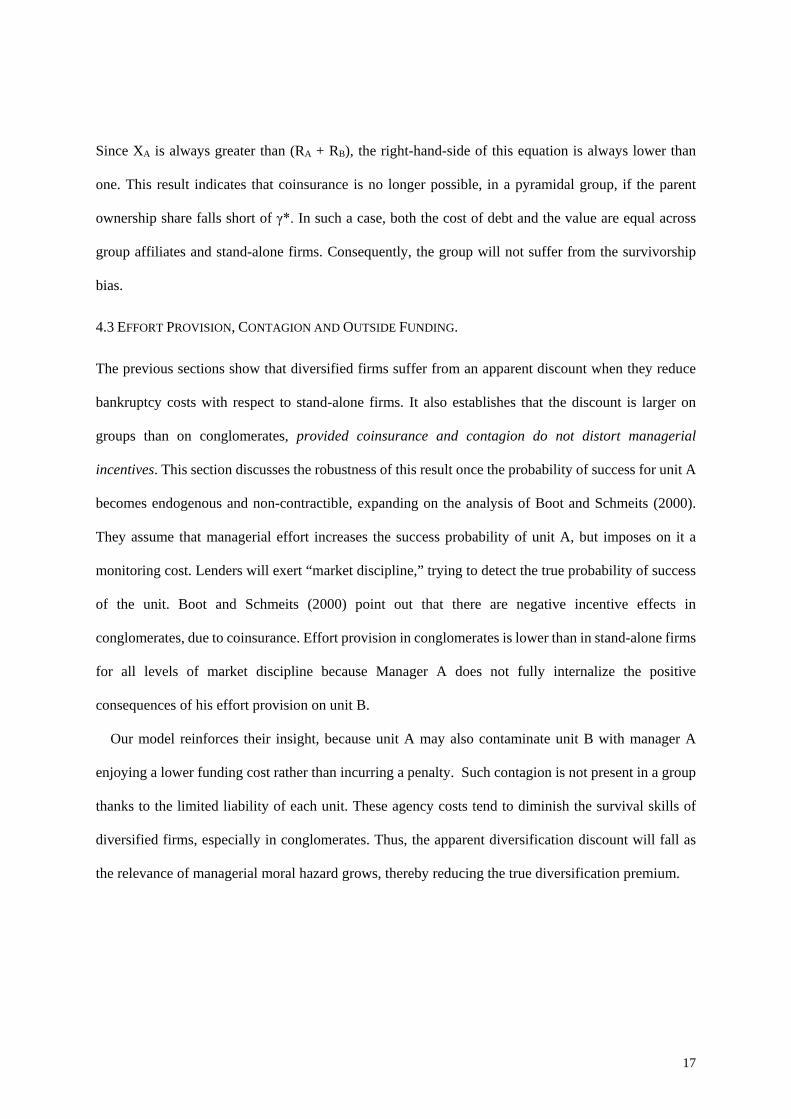
Since XA is always greater than (RA + RB), the right-hand-side of this equation is always lower than
one. This result indicates that coinsurance is no longer possible, in a pyramidal group, if the parent
ownership share falls short of γ*. In such a case, both the cost of debt and the value are equal across
group affiliates and stand-alone firms. Consequently, the group will not suffer from the survivorship
bias.
4.3 EFFORT PROVISION, CONTAGION AND OUTSIDE FUNDING.
The previous sections show that diversified firms suffer from an apparent discount when they reduce
bankruptcy costs with respect to stand-alone firms. It also establishes that the discount is larger on
groups than on conglomerates, provided coinsurance and contagion do not distort managerial
incentives. This section discusses the robustness of this result once the probability of success for unit A
becomes endogenous and non-contractible, expanding on the analysis of Boot and Schmeits (2000).
They assume that managerial effort increases the success probability of unit A, but imposes on it a
monitoring cost. Lenders will exert “market discipline,” trying to detect the true probability of success
of the unit. Boot and Schmeits (2000) point out that there are negative incentive effects in
conglomerates, due to coinsurance. Effort provision in conglomerates is lower than in stand-alone firms
for all levels of market discipline because Manager A does not fully internalize the positive
consequences of his effort provision on unit B.
Our model reinforces their insight, because unit A may also contaminate unit B with manager A
enjoying a lower funding cost rather than incurring a penalty. Such contagion is not present in a group
thanks to the limited liability of each unit. These agency costs tend to diminish the survival skills of
diversified firms, especially in conglomerates. Thus, the apparent diversification discount will fall as
the relevance of managerial moral hazard grows, thereby reducing the true diversification premium.

18
5. Conclusion
There is conflicting evidence on the performance of diversified organizations. While owners choose
diversified organizations for their firms, several works find that corporate diversification reduces firm
value. This paper proposes a resolution of this conflict going back to an old economic rationale for
diversification, which is enhanced firm survival. We point out that the diversification discount may
artificially arise in empirical analysis because of the better survival skills of diversified organizations.
This pricing paradox is due to a known problem of existing databases, namely the ex-post selection
bias. Databases do not contain price information on stand-alone firms that disappeared in a downturn
due to defaults and mergers, while they do include the diversified affiliates that survived. Thus, ex-post
relative average price does not reflect relative firm value because such measurement does not control
for selection bias.
Our pricing model shows that the implied apparent diversification discount, conditional on databases
that cancel out bankrupt firms, is even larger for groups than for conglomerates, because of their better
survival skills. An extensive literature considers such discount as true, relating it to the possibility of
using minority shareholders’ resources to the benefit of the controlling party. Our paper points out an
alternative reason for group discounts, which rests in the ability to avoid contagion thanks to their
corporate limited liability. Corporate limited liability is a persistent legal provision of groups across
several jurisdictions, which policy-makers consider a benefit of the group organization (see Winter et
al., 2002).
This reasoning leads to conclude that the economic function of diversification, consisting in limiting
dissipative bankruptcy costs, is hard to detect in the data. We leave it to future work to correct the
survivorship bias, downsizing the empirical estimates of the diversification discount and possibly
turning it into a premium - thereby explaining owners’ preferences for diversification.

19
Appendix A. Corporate Limited Liability in Groups around the World
In our model, groups save on bankruptcy costs because they enjoy corporate limited liability. This
feature allows them to avoid contagion among affiliates. This Appendix sheds light on the way such
provision emerged in the US. It also informs on its enforcement in the US and selected EU countries,
as well as on the type of group organization that prevails. Courts may in fact “pierce the corporate veil,”
that is repeal corporate limited liability asking the parent company to meet its subsidiary debt
obligations.
In the US, the legal theories of the separate legal personalities of corporations (entity law) and the
limited liability of shareholders applied to parent and subsidiary corporations. After the first Limited
Liability Act in 1855, the courts expanded the concept of limited liability to protect each layer in the
group from the liability of the junior company. Successively, legislators added further layers of limited
liability on top of the primary limitation on the liability of the ultimate individual investor, for the
obligations of the parent company. In time, the law created the possibility for judicial escape in cases
of abuse. This safety valve was the doctrine of “piercing of the corporate veil.” U.S. courts now impose
liability on the parent when it is possible to prove the lack of separate existence of the subsidiary, and
that the plaintiff has been a victim of conduct “akin to fraud” through the parent’s use of such dominated
corporation (Blumberg 1989). However, the justification for piercing the corporate veil remains
obscure, according to Easterbrook and Fischel (1985). Special regulations - such as the Public Utility
Holding Company Act of 1935 and the Investment Company Act of 1940 - have restricted group
activities in the US during and after the New Deal. There are also adverse tax provisions allowing
consolidation of income statements only if subsidiaries are at least 80% owned (Kandel et al., 2016).
Despite these obstacles, in the US group-like organizations are active in family firms (Villalonga and
Amit, 2008), in financial conglomerates (Herring and Carmassi, 2009), in innovative firms and venture

20
capital (Allen, 1998; Sahlman, 1990) and multinationals (Altomonte and Rungi, 2013). Since 1995,
subsidiaries of non-financial groups have accounted for 13% of total US debt issues (Kolasinski, 2009).
As far as continental Europe is concerned, the group form is common in several countries (see Aganin
and Volpin, 2005; Barca and Becht, 2001). In the UK, as the top fifty listed companies have on average
230 subsidiaries. Courts strictly adhere to the corporate entity doctrine and are reluctant to pierce the
corporate veil. They consider that a company should be able to limit its risk by the use of a subsidiary,
but it should not use this device to impose unreasonable risks on others. There is a presumption of no
abuse if each company internalizes the risk, as in a contractual relationship.
In the Netherlands, groups are also common since there are no legal or tax obstacles. There is usually
a listed company at the top and private companies as subsidiaries. As far as limited liability is
concerned, the trend in case law is not towards an automatic liability of a parent company vis-à-vis the
subsidiary’s creditors. Rather, its liability depends on showing some further act on its part
(Timmermann, 1996). As far as Switzerland is concerned, at least fifty percent of registered companies
were group affiliated. Subsidiaries tend to be 100% owned. The legal basis is also the entity law. No
compensation is, therefore, possible for a debtor by a claim he has against another company in the same
group (Duey, 1996).
Thus, the starting point in every major jurisdiction, including also Germany, France, Italy or Belgium,
remains the separate legal status and the separate liability of each company within the group for its
debts and only its debts (Hadden, 1989). Nevertheless, there has been a general trend towards imposing
liability on parent companies for the debts of insolvent subsidiaries, when the insolvency resulted from
some fault on the part of the parent company.

21
Appendix B. Proofs
This section gathers proofs of propositions in the main body of the paper.
Proposition 1- Borrowing costs.
We first need to prove that Rc < RA + RB, that is: (pA)-1 [2- pB (1- pA ) XB ] < (pA)-1 + (pB)-1. This
simplifies to: pB [2- pB (1- pA ) XB ] < pA + pB; that reduces to: - pB2 (1- pA ) XB < pA - pB; that is: pB
2
(1- pA ) XB > pB - pA or XB > (pB - pA)[pB2 (1- pA)]-1.
This inequality always holds because the threshold level of the cash flow, xB=(pB - pA)[pB2 (1- pA)]1, is
lower than the minimum level required for unit B cash flow (see Equation 6) when successful, that is:
(pB - pA)[pB2 (1- pA )]-1< (pB)-1 . This inequality reduces to:
(pB - pA)[pB (1- pA )]-1< 1, or (pB - pA) < pB (1- pA ), that is -1 < - pB or pB < 1.
This inequality always holds by assumption. We now need to show that the combined cost of debt is
lower for business groups, that is:
RG < RA + RB
Recall that the interest factor in unit A is the same for both organizational forms, RA∈G = RA. Then the
following must hold:
≡ [pB + pA (1- pB )] -1< (pB)-1 ≡ pA (1- pB ) > 0.
This inequality is always satisfied.
Finally, we need to show that the cost of debt for business groups is lower than the conglomerate
case, that is RA + RB∈G < RC. This inequality becomes:
(pA)-1[2- pB (1- pA )XB] > (pA)-1 + [pB + pA (1- pB )]-1 ≡(pA)-1 [1- pB (1- pA )XB ] > [pB + pA (1- pB )]-1
that is: (pA)-1 [- pB (1- pA )XB ] > [pB + pA (1- pB )]-1- (pA)-1,
BGB RR <∈

22
or: - (pA)-1 [pB (1- pA )XB ] > - (pA)-1 { 1 - pA[pB + pA (1- pB )]-1}.
This expression simplifies to:
[pB (1- pA )XB ] <1 - pA[pB + pA (1- pB )]-1 or [pB (1- pA )XB ] < pB (1- pA ) [pB + pA (1- pB )]- 1
that is: XB < [pB + pA (1- pB )]-1
This last inequality never holds because profits for unit B, when successful, are sufficient to repay its
own debt by assumption. The difference between the cost of borrowing of conglomerates and business
groups equals: pB (1- pA)[XB – RB∈G.]. Recall that the minimum level for XB is (pB)-1. It follows that the
cost of borrowing in business groups exceeds the one of conglomerates by, at least, [pB + pA(1- pB)]-
1[pB + pA(1- 2pB)]-1> 0.
Proposition 2 - Firm value.
The combined profits of the two stand-alone units are equal to:
πI = (XA + KA- RA) pA + pB (XB+ KB – RB) = (XA + KA) pA + pB (XB+ KB) – 2 (B.1)
In turn, conglomerate profits, πC(m), are equal to:
πC = (XA + KA + XB+ KB – RC) pA pB + (XA + KA + KB – RC) pA (1- pB) =
= pA pB XB + (XA + KA + KB – RC) pA = (XA + KA + KB) pA + pB XB – 2. (B.2)
Group profits are equal to:
πG = (XA+ KA + XB + KB -RA -RB∈G ) pA pB + (XA + KA+ KB -RA - RB∈G) (1-pB) pA +
+ (XB + KB -RB∈G) pB (1-pA) = (XA+ KA)pA - 1 + pB XB + (KB -RB∈G )[pApB (1-pA)]=
= (XA+ KA) pA + (XB + KB) pB+ KB (1- pB) pA – 2 (B.3)
We write Equation (B.3) using Equation (B.1) as:
πG = πI + KB (1- pB) pA (B.4)
23
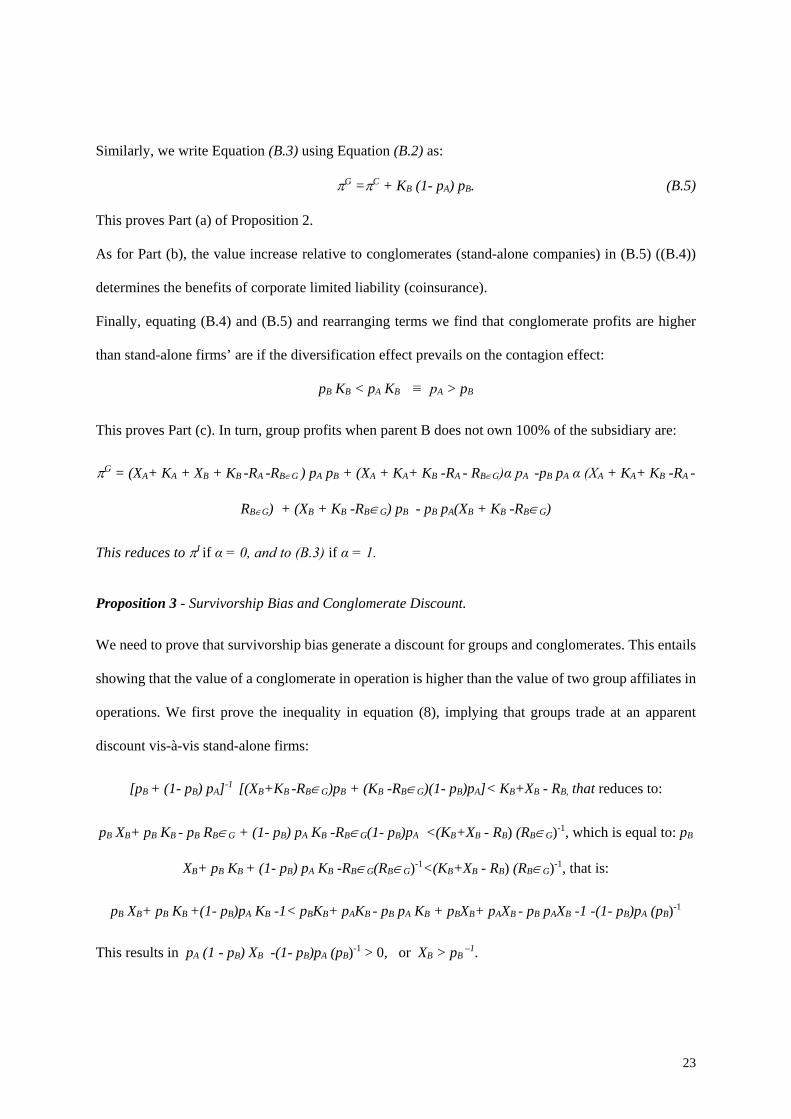
Similarly, we write Equation (B.3) using Equation (B.2) as:
πG =πC + KB (1- pA) pB. (B.5)
This proves Part (a) of Proposition 2.
As for Part (b), the value increase relative to conglomerates (stand-alone companies) in (B.5) ((B.4))
determines the benefits of corporate limited liability (coinsurance).
Finally, equating (B.4) and (B.5) and rearranging terms we find that conglomerate profits are higher
than stand-alone firms’ are if the diversification effect prevails on the contagion effect:
pB KB < pA KB ≡ pA > pB
This proves Part (c). In turn, group profits when parent B does not own 100% of the subsidiary are:
πG = (XA+ KA + XB + KB -RA -RB∈G ) pA pB + (XA + KA+ KB -RA - RB∈G)α pA -pB pA α (XA + KA+ KB -RA -
RB∈G) + (XB + KB -RB∈G) pB - pB pA(XB + KB -RB∈G)
This reduces to πI if α = 0, and to (B.3) if α = 1.
Proposition 3 - Survivorship Bias and Conglomerate Discount.
We need to prove that survivorship bias generate a discount for groups and conglomerates. This entails
showing that the value of a conglomerate in operation is higher than the value of two group affiliates in
operations. We first prove the inequality in equation (8), implying that groups trade at an apparent
discount vis-à-vis stand-alone firms:
[pB + (1- pB) pA]-1 [(XB+KB -RB∈G)pB + (KB -RB∈G)(1- pB)pA]< KB+XB - RB, that reduces to:
pB XB+ pB KB - pB RB∈G + (1- pB) pA KB -RB∈G(1- pB)pA <(KB+XB - RB) (RB∈G)-1, which is equal to: pB
XB+ pB KB + (1- pB) pA KB -RB∈G(RB∈G)-1<(KB+XB - RB) (RB∈G)-1, that is:
pB XB+ pB KB +(1- pB)pA KB -1< pBKB+ pAKB - pB pA KB + pBXB+ pAXB - pB pAXB -1 -(1- pB)pA (pB)-1
This results in pA (1 - pB) XB -(1- pB)pA (pB)-1 > 0, or XB > pB –1.

24
We now need to prove the inequality in (11), implying that conglomerates trade at an apparent
discount relative to stand-alone firms:
(KB+ XA+KA-Rc) + pBXB.< XB+KB+ XA+KA - RA - RB ; that is: -Rc + pBXB. < XB - RA - RB
that is: (1- pB) XB > (RA – (½) RC) + (RB – (½) RC);
that is (1- pB) XB > (pA)-1- (2pA)-1 [2- pB (1- pA) XB ]+ (pB)-1- (2pA)-1 [2- pB (1- pA ) XB ]; that is:
pB pA (1- pB) XB > pA - pB [2- pB (1- pA )XB ]+pB ; or pB pA XB - pB2pA XB - pB
2XB + pB2pA XB > pA - pB
which simplifies to pB pA XB - pB2XB > pA - pB, or XB > pB
–1 .
Finally, we compare the price of a group to that of a conglomerate when both are alive. The value of
the conglomerate in operation is equal to:
pB (XB +KB+ XA+KA-Rc) + (1-pB)(KA+ XA+KB-Rc) = (KB+ XA+KA) - Rc + pBXB
whereas the value of the group in operations is equal to:
pB (XB +KB – RB∈G) + (1-pB)(KB – RB∈G ) + XA + KA - RA = ( XA+KA + KB)– RA – RB∈G + pBXB.
Then the difference between the two expressions is equal to RB∈G + RA - Rc, which is always positive
because we know that RB∈G + RA > Rc.
References
Aganin, A., and P. Volpin, 2005, The History of Corporate Ownership in Italy. In “A History of Corporate Governance around the World: Family Business Groups to Professional Managers,” University of Chicago Press 7, 325-365. Allen, J.W., 1998, Capital Markets and Corporate Structure: The Equity Carve-Outs of Thermo Electron, Journal of Financial Economics 48, 99-124. Almeida, H., S.Y. Park, D. Wolfenzon, M. Subrahmanyam, 2011, The Structure and Formation of Business Groups: Evidence from Korean Chaebols, Journal of Financial Economics. Alonso, R., W. Dessein and N. Matouschek (2015), Organizing to Adapt and Compete, American Economic Journal: Microeconomics, 7(2), 158-187

25
Altomonte C., and A. Rungi, 2013, Business Groups as Hierarchies of Firms, ECB WP. 1554. Banal-Estanol, A., Ottaviani, M., and A. Winton, 2013, The Flip Side of Financial Synergies: Coinsurance versus Risk Contamination, Review of Financial Studies 26 (12), 3142-3181 Barca F., and M. Becht, The Control of Corporate Europe, Oxford University Press, 2001 Blumberg P. I., 1989, The Law of Corporate Groups, Boston: Little, Brown and Company. Boot, A. W.A., and A. Schmeits, 2000, Market Discipline and Incentive Problems in Conglomerate Firms with Application to Banking, Journal of Financial Intermediation 9, 240-273. Boot, A. W.A., S. I. Greenbaum, and A. V. Thakor, 1993, Reputation and Discretion in Financial Contracting, American Economic Review 83(5), 1165-1183. Brown, S. J, Goetzmann W.N., and S.A. Ross, 1995, Survival, The Journal of Finance, 50(3), 853-873 Cestone, G., and C. Fumagalli, 2005, The strategic impact of resource flexibility in business groups, RAND Journal of Economics 72, 193-214 Cornell, B., and Liu, Q., 2001,The Parent Company Puzzle: When is the Whole less than One of the Parts, Journal of Corporate Finance, 59(2), 507-535 Druey, J. N., 1996, The Law on Groups of Companies in Switzerland, in Rossi G. et al. (eds.), 473-490. Easterbrook, F., and D. Fischel, 1985, Limited Liability and the Corporation, University of Chicago Law Review 52 (1), 89–117. Fluck Z. and A. Lynch, 1999, Why Do Firms Merge and Then Divest? A Theory of Financial Synergy, Journal of Business 72 (3), 319-346.
Fulghieri, P. and M. Sevilir, 2011, Mergers, Spin-Offs and Employee Incentives, Review of Financial Studies 24, 2207-2241.
Gomes, J.F, and D. Livdan (2004), Optimal Diversification: Reconciling Theory and Evidence, Journal of Finance, 59(2), 507-535 Gopalan, R., V. Nanda, and A. Seru, 2007, Affiliated firms and financial support: evidence from Indian business groups, Journal of Financial Economics 86, 759- 795. Gopalan, R., and K. Xie, 2011, Conglomerates and Industry distress, Review of Financial Studies 22, 1-20. Hadden, T., 1996, Liabilities in Corporate Groups, in Rossi et al. (eds.), 1361-1388.

26
Hann, R.N., M. Ogneva and O. Ozbas, 2013, Corporate Diversification and the Cost of Capital, Journal of Finance 68(5), 1961–99 He, J., Mao, X., Rui, O.M., and X., Zha, 2013. Business groups in China, Journal of Corporate Finance, 22, 2013, 166-192 Hennessy, C.A., and T. Whited, 2007, How Costly Is External Financing? Evidence from a Structural Estimation, Journal of Finance 62, 1705-1745. Herring, R., and J. Carmassi, 2009, The corporate structure of international financial conglomerates. In A. Berger, P. Molyneux, and J.Wilson (eds.) The Oxford Handbook of Banking. Oxford: Oxford University Press. Kandel, E., Kosenko, K., Morck, R., and Y. Yafeh, 2015, The Great Pyramids of America: A Revised History of US Business Groups, Corporate Ownership and Regulation, 1930-1950, ECGI Finance WP 449 Khanna, T., and Y. Yafeh, 2007, Business Groups in Emerging Markets: Paragons or Parasites? Journal of Economic Literature 45 (2), 331-372. Khanna, T., and Y. Yafeh, 2005, Business groups and risk sharing around the world, Journal of Business 78, 301-340. La Porta Rafael, Lopez-de-Silanes F., Shleifer, A., 1999, Corporate Ownership around the World, Journal of Finance 54(2), 471-517. Lamont, O., Polk, C., 2001. The diversification discount: cash flows vs. returns. Journal of Finance 56, 1693–1701. Leland, H., 2007, Purely Financial Synergies and the Optimal Scope of the Firm: Implications for Mergers, Spinoffs and Structured Finance, Journal of Finance 62, 765-807. Lewellen, W. G., 1971, A pure financial rationale for the conglomerate merger, Journal of Finance 26, 521-537 Luciano, E. and G. Nicodano, 2014, Guarantees, Leverage and Taxes, Review of Financial Studies, 27(9), 2736-2772 Kim, E.H., and J.J. McConnell, 1977, Corporate Mergers and the Co-Insurance of Corporate Debt, The Journal of Finance 32 (2), 349-365. Maksimovic, V. and G. Phillips, 2007, Conglomerate firms and internal capital markets”, in Eckbo. E, ed., The Handbook of Empirical Corporate Finance, North Holland, 424-479 Mansi, S. A., and D. M. Reeb, Corporate Diversification: What Gets Discounted?, Journal of Finance 57, 2167-2183.

27
Rajan, R.G., Servaes, H., and L. Zingales, 2000, The Cost of Diversity: The Diversification Discount and Inefficient Investment, Journal of Finance 55(1), 35-80. Sahlman W.A., 1990, The Structure and Governance of Venture-Capital Organizations, Journal of Financial Economics, 473-521. Shah, S., and A.V. Thakor, Optimal Capital Structure and Project Financing, 1987, Journal of Economic Theory, 42, 209-243. Stein, J., 2002, Information Production and Capital Allocation: Decentralized Versus Hierarchical Firms, Journal of Finance 62(5), 1891-1921. Timmerman L., 1996, The Law on Corporate Groups in the Netherlands, in Rossi G. et al. (eds.), 313-354. Villalonga, B., and R. Amit, 2009, How are US Family Firms Controlled, Review of Financial Studies 22, 3047-3091. Winter, J. et al., Final Report of the High-Level Group of Company Law Experts, Brussels: European Commission, 2002.