the annual required contribution experience of … annual required contribution, ... mathematics,...
TRANSCRIPT
Executive Summary After its creation in the 1990s, the annual required contribution (ARC) quickly became recognized as the unofficial measuring stick of the effort states and local governments are making to fund their pension plans. A government that has paid the ARC in full has made an appropriation to the pension trust to cover the benefits accrued that year and to pay down a portion of any liabilities that were not pre-funded in previous years. Assuming projections of actuarial experience hold true, an allocation short of the full ARC means the unfunded liability will grow and require greater contributions in future years.
This study evaluates the ARC that was received by 112 state public pension plans, including the District of Columbia, from fiscal years 2001 to 2013. This study finds that although variation exists in ARC effort among states and other pension plan sponsors, i.e., cities, school districts, etc., most governments made good-faith efforts to fund their pension plans, and only a few severely neglected their pension funding responsibilities. This ARC experience unfolded during a tumultuous period, as capital markets declined sharply in 2000-02 and again in 2008-09, and states and local governments twice experienced economic recessions. Combined with other factors, the market declines caused required pension contributions to rise significantly, while the economic recessions challenged the ability of states and local governments to respond.
States and their political subdivisions establish and main-tain funding policies in the form of statutes, ordinances, board rules, and case law that prescribe how public pension benefits will be funded. While federal regulations govern-ing private sector pension plans often are cited as onerous
and creating volatility and uncertainty,i funding policies for public plans typically are designed to establish contribu-tions that will remain approximately level as a percent of payroll over time. This objective is intended to promote intergenerational cost equity and budget predictability.
Although many factors play a role in determining how a pension plan is financed, this study finds that plans with strong required contribution governance arrangements generally have received a significantly higher portion of their ARC during this study’s measurement period. Some states, however, have consistently received a high portion of their ARC even without a statutory requirement to do so. Conversely, some of the plans that have received a small portion of their ARC, have statutory requirements but failed to receive their ARC. Nevertheless, even in the periods of recession during this study, most state and local govern-ments increased pension contributions and continued to provide pension benefits for former, current and future employees.
Keith Brainard is research director at the National Association of State Retirement Administrators Alex Brown is research manager at the National Association of State Retirement Administrators NASRA gratefully acknowledges the financial support from AARP to undertake this research project
The Annual Required Contribution Experience of State Retirement Plans, FY 01 to FY 13
Keith Brainard and Alex Brown National Association of State Retirement Administrators March 2015
Spotlight on

NASRA: The ARC Experience of State Retirement Plans, FY 01 to FY 13, March 2015 2
Introduction About the Annual Required Contribution The annual required contribution, or ARC, refers to the amount needed to be contributed by employers to ade-quately fund a public pension plan. The ARC is the sum of two factors: a) the cost of pension benefits being accrued in the current year (known as the normal cost), plus b) the cost to amortize, or pay off, the plan’s unfunded liability. The ARC is the required employer contribution after accounting for other revenue, chiefly expected investment earnings and contributions from employee participants.
The ARC was introduced by the Governmental Accounting Standards Board (GASB) in 1994 in its Statements 25 and 27 and was intended to provide a measure of the extent to which employers were funding the pension benefits they were promising their workers. Although GASB standards do not have the force of law, they are an integral part of Generally Accepted Accounting Principles, with which the vast majority of pension plan sponsors (the entities that sponsor pension plans, such as states, cities, school districts, counties, etc.) seek to comply.
For many pension plan sponsors, public sector pension funding policies (in the form of statutes, ordinances, board rules, legal rulings, etc.) prescribe how pension benefits will be funded. Funding policies for many plan sponsors require pension contributions to be made in a manner con-sistent with the ARC, i.e., an amount to fund benefits accrued in the current year (the normal cost) and an amount to eliminate the unfunded liability over the course of the funding period. Funding policies generally do not specif-ically mention GASB or the ARC.
Countless studies document the importance of making consistent and adequate contributions to fund pension benefits.ii In general, these studies find that adequate contri-butions play a vital role in the long-term funding condition of public pension plans. Moreover, as a matter of simple mathematics, just as a failure to consistently and fully pay one’s mortgage will increase its long-term cost, so also will a failure to pay the ARC increase the long-term cost of funding a pension plan.
New GASB statements governing public pensions (State-ment 67) and the employers that sponsor them (Statement 68), supplant Statements 25 and 27 and eliminate the ARC as a required disclosure by public retirement systems and their sponsoring employers. Statements 67 and 68 were issued in 2012 and take effect in fiscal years 2014 and 2015, respectively. Public retirement systems are, none-theless, expected to continue to calculate an actuarially determined contribution (ADC, which is a contribution amount, similar to the ARC, determined in compliance with professional actuarial practices and methods). Plans that do
calculate an ADC are required by the new GASB standards to report this amount, along with the assumptions used to make the calculation and a history of contributions paid by employers and received by the pension plan. Thus, public retirement systems and their employers beginning in FY 14 and FY 15, respectively, no longer will be required to report an ARC as defined by GASB. Instead, they must include in the required supplementary information of their financial reports detailed information regarding the calculation and payment of an ADC.
The new GASB Statements, 67 and 68, stipulate the calcu-lation and disclosure of public pension liabilities on an accounting basis only and no longer serve as an indicator of a pension plan’s funding condition.
Some pension plan sponsors issued pension obligation bonds (POBs) during the measurement period of this study and used the proceeds from those bonds to make contribu-tions to their pension plan(s). A POB is a security, issued by a government that sponsors a pension plan, whose pro-ceeds are used to fund the pension plan, typically to reduce the plan’s unfunded liability, and sometimes to fund the cost of current contributions. POB proceeds typically are invested with other assets held in the pension trust fund. POB’s are issued with the expectation that the return on the invested proceeds will exceed the cost of borrowing.
The addition of POB proceeds can cause an ARC payment to spike in the year in which the proceeds are received by the plan. This study treats POB proceeds as a normal employer contribution, and, for retirement systems that have considered POB proceeds as contributions and reported on them, incorporates the contribution into the calculations.
The ARC is affected by the many factors on which it is based, including actuarial methods and assumptions. Thus, as investment return assumptions, actuarial cost methods, mortality assumptions, amortization periods, etc., differ from one another, so will the ARC be different. As a result, the ARC for two hypothetical plans with identical financial and demographic compositions could differ. The discussion that follows includes examples of actuarial methods and assumptions that can affect the ARC.
About this study NASRA compiled comprehensive information regarding the ARC experience of 112 state-sponsored and statewide public pension plans in the U.S. for fiscal years 2001 through 2013. Together, these plans account for more than 80 percent of all public pension assets and participants in the U.S. As the new GASB policies take effect, and the ARC as defined and prescribed in outgoing Statements 25 and 27 comes to a close, this effort to compile and review this information is intended to provide an assessment of the

NASRA: The ARC Experience of State Retirement Plans, FY 01 to FY 13, March 2015 3
ARC experience of individual states and for statewide plans in the aggregate.
The data in this study includes the ARC experience for each state, including the weighted average of the ARC paid to the statewide plans in each state for the fiscal year 2001-2013 period. In addition to covering much of the lifetime of the ARC, this period also was eventful due to the effects of two momentous market declines, in 2000-02 and again in 2008-09, and two economic recessions, in 2001 and 2007-09. The market declines inflicted significant investment losses on public pension portfolios, and the recessions, particularly the latter one, decimated state and local government revenues. Each of these events challenged the ability of state and local pension plan sponsors to pay their annual required contribu-tion: the market declines increased the ARC, while the recessions impaired the ability of employers to make required contributions.
For each of the 112 plans for each fiscal year from 2001 to 2013, the information collected for this study includes the ARC, expressed in dollars, and the percentage of the ARC received. The data was aggregated by year and by plan, to identify a median and weighted average ARC effort, ex-pressed as a percentage, for each FY and a weighted average for each state for each FY.
Key Findings 1. Policies (i.e., statutes, constitutional provisions, or
retirement board requirements) that require payment of the ARC generally produce better pension funding out-comes than polices that do not require payment of the
ARC. Some plan sponsors, however, consistently pay their ARC without a requirement to do so, and some have challenged requirements to pay their ARC and underfunded their pension plans.
2. Only a few states have conspicuously failed to adequate-ly fund their pension plans.
3. The few states that conspicuously failed to fund their pension plans have a disproportionate effect on the total ARC experience.
4. Most states made a good-faith effort to fund their pension plans; a good-faith effort is defined here as paying 95 percent or more of the ARC.
5. Failing to make even a good-faith effort to fund the ARC increases future costs of funding the pension.
6. Policy constraints that prevent payment of the ARC can negatively affect the ability of employers to fund the pension plan.
Review of Findings As shown in Figure A, the actual ARC combined for all plans rose sharply during the measurement period from $27.7 billion to $93.7 billion. Other studies suggest that FY 2001 was at or near the low point of required pension contributions during the past 30 years.iii The increase that began in FY 01 is due to several factors, including the fact that required costs of public pensions as a group were unusually low in FY 01 due to the strong investment returns enjoyed by public pen-sion funds from 1995 to early 2000. In addition to reducing
Figure A. Combined Annual Required Contribution and ARC received, for statewide plans
NASRA: The ARC Experience of State Retirement Plans, FY 01 to FY 13, March 2015 4
required contributions (including to as low as zero in some cases), these investment returns also strengthened pension funding levels, which created pressure in many states to increase pension benefit levels, resulting in higher required pension contributions. (Most employees are required to contribute to their pension plan, and these required contribu-tions continued unabated, as employer contributions in many cases declined.)
In some states, the combination of the benefit increases approved in the late 1990s made at the end of the millenni-um, followed by the market losses in 2000-02 created what some have referred to as a “perfect storm” for public pensions and their sponsoring employers. Employers whose required pension costs reached unusually low levels, faced significant cost increases to counteract the effects of market
losses and/or benefit increases at a time when economic conditions created fiscal struggles for state and local governments.
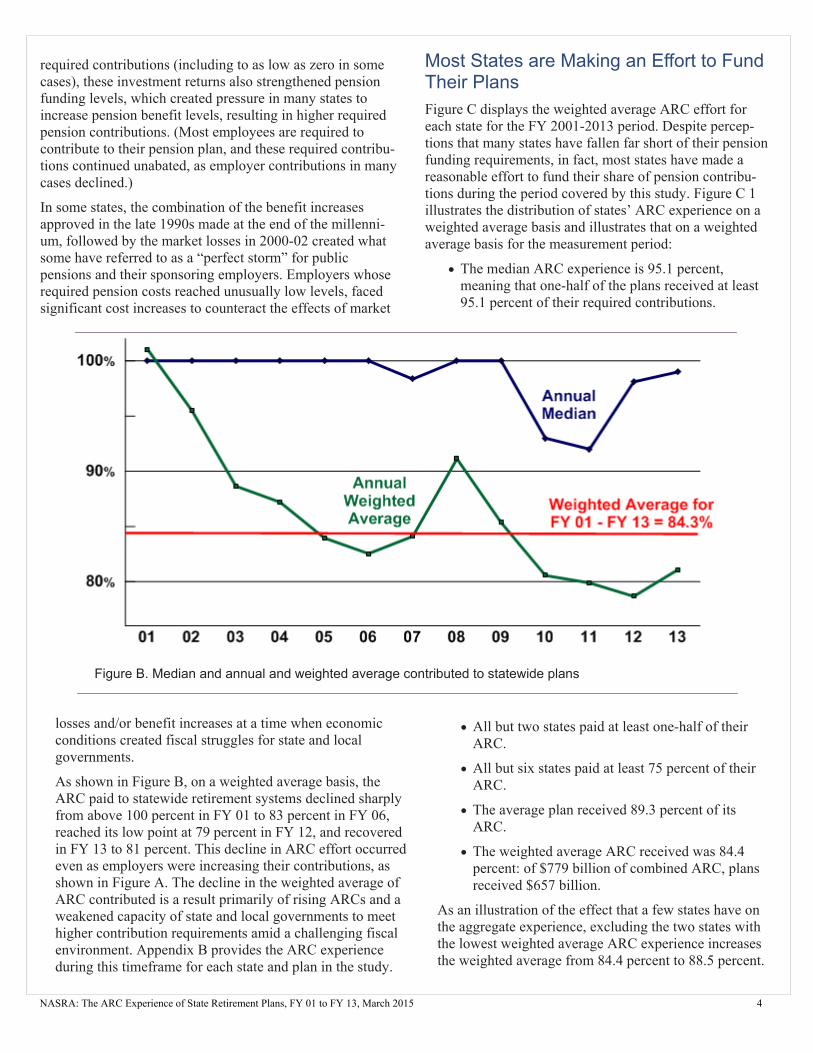
As shown in Figure B, on a weighted average basis, the ARC paid to statewide retirement systems declined sharply from above 100 percent in FY 01 to 83 percent in FY 06, reached its low point at 79 percent in FY 12, and recovered in FY 13 to 81 percent. This decline in ARC effort occurred even as employers were increasing their contributions, as shown in Figure A. The decline in the weighted average of ARC contributed is a result primarily of rising ARCs and a weakened capacity of state and local governments to meet higher contribution requirements amid a challenging fiscal environment. Appendix B provides the ARC experience during this timeframe for each state and plan in the study.
Most States are Making an Effort to Fund Their Plans Figure C displays the weighted average ARC effort for each state for the FY 2001-2013 period. Despite percep-tions that many states have fallen far short of their pension funding requirements, in fact, most states have made a reasonable effort to fund their share of pension contribu-tions during the period covered by this study. Figure C 1 illustrates the distribution of states’ ARC experience on a weighted average basis and illustrates that on a weighted average basis for the measurement period:
The median ARC experience is 95.1 percent, meaning that one-half of the plans received at least 95.1 percent of their required contributions.
All but two states paid at least one-half of their ARC.
All but six states paid at least 75 percent of their ARC.
The average plan received 89.3 percent of its ARC.
The weighted average ARC received was 84.4 percent: of $779 billion of combined ARC, plans received $657 billion.
As an illustration of the effect that a few states have on the aggregate experience, excluding the two states with the lowest weighted average ARC experience increases the weighted average from 84.4 percent to 88.5 percent.
Figure B. Median and annual and weighted average contributed to statewide plans

NASRA: The ARC Experience of State Retirement Plans, FY 01 to FY 13, March 2015 5
Figure C 2. Weighted average of Annual Required Contribution paid, by state
Figure C 1. Weighted average of Annual Required Contribution paid, by state

NASRA: The ARC Experience of State Retirement Plans, FY 01 to FY 13, March 2015 6
Notably, this effort to fund pension plans occurred as the ARC grew sharply during the period measured. From 2001 to 2013, the ARC grew by 239 percent, from $27.7 billion to $93.8 billion. Actual contributions grew more slowly, albeit significantly: by 174 percent, from $27.8 billion to $76.2 billion.
Measured as a percentage of total worker payroll, employer pension contributions declined steadily over the 20-year period from 1983 to 2002, reaching a low point in 2002 following the strong investment gains of 1995 to 1999.iv Much of the increase in required contributions that followed 2002 was caused by some combination (depending on the plan) of a) the significant investment market declines in 2000-02 and 2008-09; b) higher benefit levels approved by many plans in the late 1990s; and c) the failure by some employers to make required contributions.
ARC Background
Key actuarial factors affect the ARC Although the ARC is defined by GASB in its Statements 25 and 27 (now replaced by Statements 67 and 68), required contributions differ significantly for plans because of the actuarial factors a plan uses. Some of the factors that have the largest effect on the ARC include the investment return assumption, the amortization method and period, and the actuarial cost method. Other actuarial methods and assump-tions also affect a plan’s ARC, although to a lesser extent than these.
Actuarial Assumptions The condition and cost of a pension plan is measured by a series of mathematical calculations known as an actuarial valuation. An actuarial valuation involves the use of numer-ous assumptions, which fall into one of two broad categories: demographic and economic. Demographic assumptions are those associated with the behavior of plan participants, e.g., the age when they will retire, life expectancy, etc. Economic assumptions are associated with such factors as the rate of salary growth and the expected return on invested assets. These assumptions affect the plan’s cost and funding condition differently, as some assumptions have a larger effect than others.
Investment Return Assumption Of all the factors used in actuarial assumptions, the invest-ment return typically has the greatest effect on the plan’s ARC (i.e., the contribution needed to fund the plan). This is because, for most public pension plans, actual investment earnings account for a majority of revenue over time; as a result, even a relatively minor change in the assumed rate of investment return can significantly affect the required contribution to the plan.
As an illustration, the Colorado Public Employees’ Retire-ment Association (PERA) publishes in its annual financial report a sensitivity analysis showing the effect minor changes in the investment return assumption would have on the ARC of PERA’s five pension plans. At the time of this study, PERA’s investment return assumption is 7.5 percent. Accord-ing to its FY 13 annual financial report, a reduction in the investment return assumption to 7.0 percent would result in an increase to the plans’ ARC ranging from 11 percent for one PERA plan to more than 25 percent for another. Like-wise, an increase in the investment return assumption would have a similar, but opposite, effect.
Amortization Policy A plan’s amortization policy is “the length of time and the structure selected for increasing or decreasing contributions to systematically eliminate any unfunded actuarial accrued liability or surplus.”v Funding a pension plan is analogous to paying off a home mortgage: just as home mortgages can be structured differently, such as fixed vs. variable rates, and paid over varying lengths of time, such as 15 or 30 years, so too are the amortization policies of public pension plans. One of the main factors that determine the ARC is the cost to amortize the plan’s unfunded liability, so the ARC can be significantly affected by both the structure and the length of time used to eliminate the unfunded liability.
The amortization structure, or method, determines the amount and timing of paying down the plan’s unfunded liability, which is the amount owed in future benefits for which assets have not been accumulated. As a result, the structure or method the plan chooses affects the ARC.
The two primary amortization methods are the Level Dollar and Level Percent of Payroll. Most plans, by far, use the level percent of payroll method. As its name implies, the Level Percent of Payroll method identifies an annual required payment, expressed as a percentage of payroll, that remains steady from one year to the next. Under this approach, the dollar amount typically increases each year to reflect salary growth. Typically, the Level Percent of Payroll method begins the amortization period with a lower annual payment that increases steadily throughout the amortization period. This is the most common amortization method used among public pension plans.vi
The differing approaches of level percentage and level dollar result in different ARC outcomes, although both are intended to pay off a plan’s unfunded liability within a designated amortization period.
Amortization Period The period over which the obligation is amortized, or paid off, affects the annual cost to pay off the unfunded liability. Under its previous standards,vii GASB established a maxi-mum amortization period of 30 years, meaning that public
NASRA: The ARC Experience of State Retirement Plans, FY 01 to FY 13, March 2015 7
pension plans and their sponsoring employers wishing to comply with GASB standards would need to calculate the annual cost of amortizing their pension plan’s unfunded liability on the basis of an amortization period not to exceed 30 years. Some plans used amortization periods shorter than 30 years.
Similar to a home mortgage, other factors held equal, the ARC for a plan using a 30-year amortization period is less than the ARC for a plan using a 15-year amortization period. Of course, the plan using the shorter amortization period would also be in a position to eliminate their unfunded liability more quickly than the plan using the longer amorti-zation period, and the total cost of amortizing the ARC over a longer period will be higher. A pension plan may elect to use a longer amortization period to reduce the annual cost of the plan.
Investment returns and the ARC Although the ARC is affected by multiple factors, actual returns on the plan’s investment portfolio can have a major effect on the required contributions to a public pension plan. The ARC usually increases following periods of poor invest-ment performance, and decreases following periods of strong investment performance. Similar to a credit card or a home mortgage, missing a payment will cause future payments and costs to be higher.
The payment of required contributions can have an effect on a plan’s investment earnings. The typical public plan model is to invest accumulated contributions over time to grow the pension trust fund from which benefits are distributed. As a result, a shortfall in required contributions has a compound-ing effect on a fund’s revenues. Since contributions form the basis for investments, a contributions shortfall reduces revenue both from the missed contributions and the foregone investment earnings those revenues would have otherwise generated.
As shown in Figure A, the aggregate ARC for the plans included in this study has been growing steadily throughout the measurement period. This increase in the ARC is due primarily to two factors: a) strong investment returns from 1995 to 1999 that reduced required contributions to low levels by historical standards; and b) the steep market losses of 2000-2002 and 2008-09. In some states, higher ARCs are attributable to the chronic failure to pay their full ARC, which increased unfunded liabilities and the cost associated with amortizing those liabilities.
Actuarial Cost Method An actuarial cost method determines how pension costs are allocated during the portion of plan participants’ lives. Out-going GASB standardsviii permitted the use of one of six different cost methods, although the one used most often (by
far) was Entry Age, followed by Projected Unit Credit, then Aggregate Cost. The entry age and aggregate cost methods are designed to produce a pension contribution that is a level percent of pay throughout the working life of a plan partici-pant. The aggregate cost method differs from entry age in that under the aggregate cost method, the actuarial value of assets and liabilities are always equal, so there is no unfunded liability. By contrast, the projected unit credit method produces lower costs in the early years of an employee’s career, and increases those costs in the latter years of the employee’s career. As a result, plan costs using the projected unit credit method are projected to rise, whereas costs for plans using the entry age and aggregate cost methods are projected to remain stable.
The Process for Approving Pension Contributions Laws and practices governing payment of pension contribu-tions vary widely among states: some states require that the amount recommended by the retirement system actuary be paid; some states consistently pay the amount recommended by the retirement system actuary, even if it is not legally required; other states appropriate pension contributions in amounts that are not linked to an actuarial calculation. Still other states base their contributions on a statutorily fixed rate, such as a percentage of employee payroll.
Because employer pension contributions generally are approved as part of a budgeting and legislative appropriations process, there is a delay between identification of the required contribution and the actual appropriation. Depending on the state’s basis for determining and funding pension contribu-tions, this delay can result in a delay in meeting the full ARC, as the budgeting and legislative appropriations process requires time to “catch up” with the pension plan’s actuarial experience. (New GASB standards, effective in FY 14, re-quire the use of the entry age method for purposes calculating the condition of the plan in compliance with GASB State-ment 67.)
Pension Obligation Bonds A pension obligation bond (POB) is a type of bond issued by the sponsoring employer of a governmental pension plan in exchange for periodic payments, typically over a 20- to 30-year period. Governments that issue POBs typically seek to invest borrowed funds that will produce investment earnings greater than the interest rate at which the funds are borrowed. POBs do not enjoy the tax-exempt status of other municipal bonds, such as those used to finance infrastructure and other public works. Some states and local governments issued POBs during the measurement period of this study, and the proceeds of these bonds are counted in the ARC experience.
Following are examples of three POB issuances that materially affected the plan’s ARC:

NASRA: The ARC Experience of State Retirement Plans, FY 01 to FY 13, March 2015 8
The State of Illinois issued $10 billion in pension
obligation bonds in 2004 and distributed the proceeds among five statewide pension funds, including the State Employees’ Retirement System, the Teachers’ Retirement System, and the State Universities Retirement System (SURS) . Of these three plans, only the SURS counted their portion of the bond proceeds, in the amount of $1.4 billion, toward their ARC.
The State of Connecticut issued $2.28 billion in FY 2008 to reduce the unfunded liability of the Teachers’ Retirement System.
The Denver Public Schools plan issued $750 million in POBs in FY 2008 which was deposited into the pension fund and counted as employer contributions
The proceeds from a POB can cause the appearance of a spike in a retirement system’s financial report, and is evident in Appendix B of this report, which details the ARC experi-ence of plans included in this study. The Government Finance Officers Association (GFOA) has prepared a Best Practice on the use of POBs, in which GFOA recommends the use of caution in using POBs.ix Also, a Center for State & Local Government Excellence issue brief on this topic suggests that POBs issued to-date generally have not fared well.x
Of course, employers who issue POBs must pay for them, usually via annual debt amortization payments, over the life of the issuance. The cost of paying off these issuances is not always reflected in public retirement system financial reports.
States’ Experiences
Outlier States New Jersey and Pennsylvania have weighted average ARC experiences that are notably lower than those of other states. New Jersey’s average is 38.0 percent and Pennsylvania’s is 41.2 percent. For both states, the chronic underfunding began when required contributions had dropped to very low levels by historical standards, including to as low as zero for some plans, chiefly as a result of strong investment gains experienced from 1995 to 1999. When required contribution rates rose, chiefly as a result of the 2000-02 market decline, the states experienced great difficulty in restoring the stream of pension funding payments that had previously been in place.
The predictable result of this underfunding was a precipitous decline in the funding level of the plans in these states that are part of this analysis. The average percentage drop in funding level from FY 01 to FY 13 for the five total plans in New Jersey and Pennsylvania that are included in this study was 47 percent, which is nearly twice the size of the decline
in the funding level for the full group.
Unsurprisingly, the issue of how pensions in New Jersey and Pennsylvania are funded has become a prominent topic of discussion in these states. A 2010 budget agreement between the New Jersey governor and legislature provided that the state would fund at least one-seventh of its ARC in FY 11, growing by another one-seventh each year until reaching full funding of the ARC in FY 17. This agreement was not fulfilled in FY 2014.
Pennsylvania’s pension funding effort began to show positive effects as the state began making progress toward restoring its pension funding effort. Employer contribution rates over the past three years (rising from 12 percent of pay to 21 percent) are higher than at any time over the past 20 years and are scheduled to increase to even higher levels over the coming years. Prior projections of employer contri-bution rates have declined from their original level over the last several years as a result of recent efforts made to fund the state’s plans: employer contribution rates would have been higher were it not for actions taken by the Pennsylvania General Assembly to fund the plans.
Contribution Governance Arrangements As stated previously, state contributory arrangements vary. Generally these arrangements take one of three forms: a requirement that the amount recommended by the plan actuary be paid in full; a commitment by the plan to pay the full actuarially recommended amount, regardless of a formal requirement; or the appropriation of contributions as a fixed rate payment over time, such as a percentage of employee payroll or other specified amount. Public plans generally adhere to the following objectives in establishing a funding policy regardless of the method used to determine contribution rates:xi
Payment of earned benefits: Required contributions should be sufficient to ensure accumulation of assets to pay promised benefits to current plan participants. This objective should be inclusive of the benefits promised to current retirees, accrued benefits earned by active workers, as well as future benefits projected to be earned by current workers.
Contribution rate and budgetary predictability: Plan funding policy should be developed in such a way that contributions, as a percent of payroll, are kept relatively level and free from year-to-year volatility.
Intergenerational equity: Contributions by a given generation of taxpayers should be commensurate with the costs of the benefits for plan participants who provide essential government services to those taxpayers during their lifetime. Efforts should be made to ensure that current taxpayers are not under,
NASRA: The ARC Experience of State Retirement Plans, FY 01 to FY 13, March 2015 9
or overcharged at the expense, or to the advantage of future taxpayers.
Most states’ contribution governance arrangement is estab-lished in state statute or constitutions, or both. For most states, the statutory language contains an implicit or explicit obligation to pay the full ARC amount as identified by its component parts, i.e., the normal cost and the amount required to pay down the unfunded liability over a specified timeframe. For those states subject to such requirements, it is generally required that these figures are to be determined and reported to the board by the plan’s actuary. Some state laws require payment of the ARC while also placing a limit on increases in contributions by capping the amount by which the employer contribution may rise in subsequent years.
Kansas statutes, for example, until FY 13 imposed a limit of 0.6 percent of the prior year’s rate on increases to required contribution rates. This restriction is intended to protect public employers from the budgetary consequences of rising pension costs. This limitation also prevented the pension plan from receiving adequate contributions, resulting in a weighted average ARC received during the measurement period of 70.2 percent. Legislation approved in 2012 increased the annual rate caps to 1.1 percent, and then 1.2 percent of the prior year’s rate in FY16 and FY17, respectively.
Similar to Kansas, Iowa statutes until FY 13 imposed a limit on changes to the required contribution rate of one-half of one percentage point annually in either direction from the prior year’s rate. This limit was increased to one percentage point annually beginning in FY 13. This restriction is also intended to shield public employers (and perhaps also em-ployees, who pay a fixed percentage of the total rate) from the effects of volatile contribution rates. Iowa PERS received 90.2 percent of its ARC, on a weighted average basis, during this study’s measurement period.
Drivers of Contribution Shortfalls in States with ARC Requirements Even though some states have a policy that requires payment of the ARC, other factors can affect those policies and the actual payment of the ARC. For example, in New Jersey, two separate legal rulings found that the state’s ARC requirement, set in statute, did not constitute a “self-executing appropria-tion.”xii, xiii Agreements negotiated in 1995 and 1997 between the State of Connecticut and the State Employees Bargaining Agent Coalition (SEBAC) reduced the amount of the state’s contributions to the State Employees Retirement System below the amounts recommended by the plan’s actuaries.xiv These are two examples of distinct causes for a state’s pension contribution experience conflicting with statutory obligations. These examples illustrate that a strong funding requirement and weak funding discipline are not mutually exclusive.
Because employer pension contributions generally are approved as part of a budgeting and legislative appropriations process, often a delay exists between identification of the required contribution and the actual appropriation. Depending on the state’s basis for determining and funding pension contributions, this delay can result in a delay in meeting the full ARC, as the budgeting and legislative appropriations process requires time to “catch up” with the pension plan’s actuarial experience.
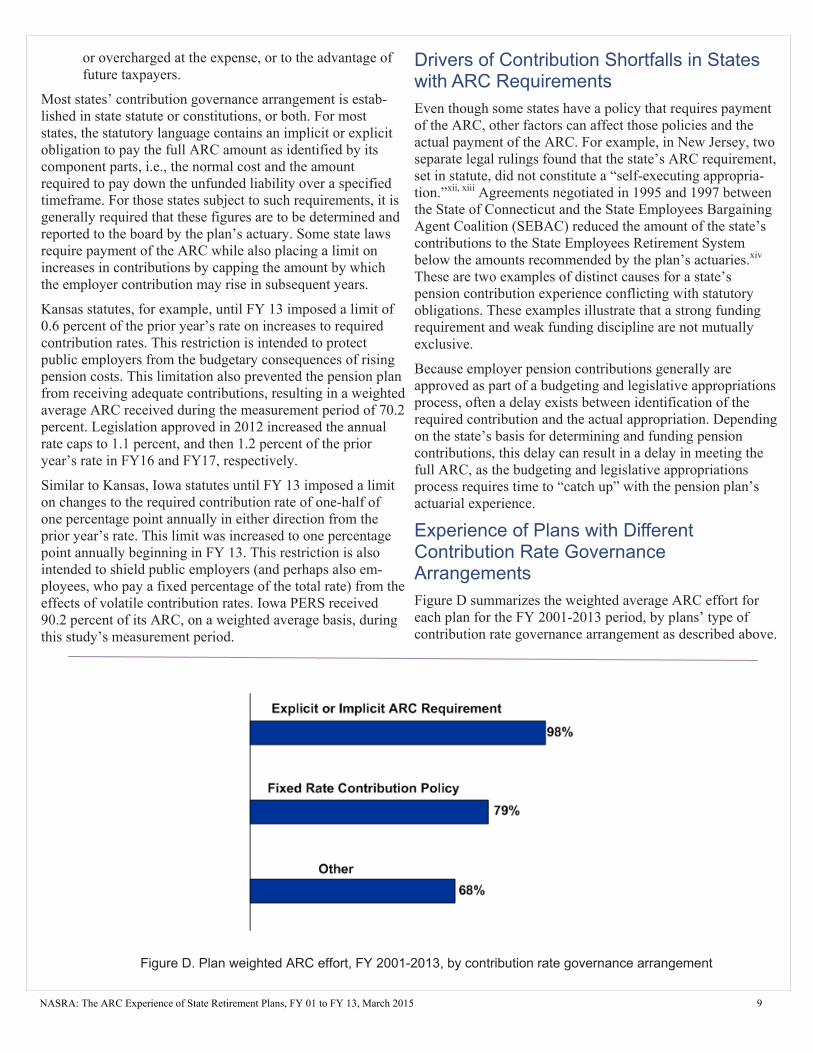
Experience of Plans with Different Contribution Rate Governance Arrangements Figure D summarizes the weighted average ARC effort for each plan for the FY 2001-2013 period, by plans’ type of contribution rate governance arrangement as described above.
Figure D. Plan weighted ARC effort, FY 2001-2013, by contribution rate governance arrangement
NASRA: The ARC Experience of State Retirement Plans, FY 01 to FY 13, March 2015 10
To determine whether the statutory reference is a determi-nant in whether or not a plan is more likely to receive a higher percentage of its’ ARC over the timeframe, plans were categorized as either having a) a law requiring payment of the ARC; b) having an ARC requirement that is subject to a cap (established by statute or other method); or c) having no ARC requirement. Of the 112 plans analyzed, 56 are governed under laws that contain an implicit or explicit ARC requirement, 25 plans have a fixed-rate contribution policy (in most cases set by statute),xv and 31 plans are governed by other funding arrangements constrained by peripheral requirements such as cap on annual contribution rate increases or other state policy which supersedes an ARC requirement.
While not representing a guarantee that the ARC will be received, the plans in this study that have ARC requirements set in statute have, over the balance of the term, received a higher percentage of their ARC than those plans whose ARC statute is subject to a cap and those states with a fixed-rate contribution policy. The plan ARC experience on a weighted average basis for the FY 2001-2013 period is shown in Figure D.
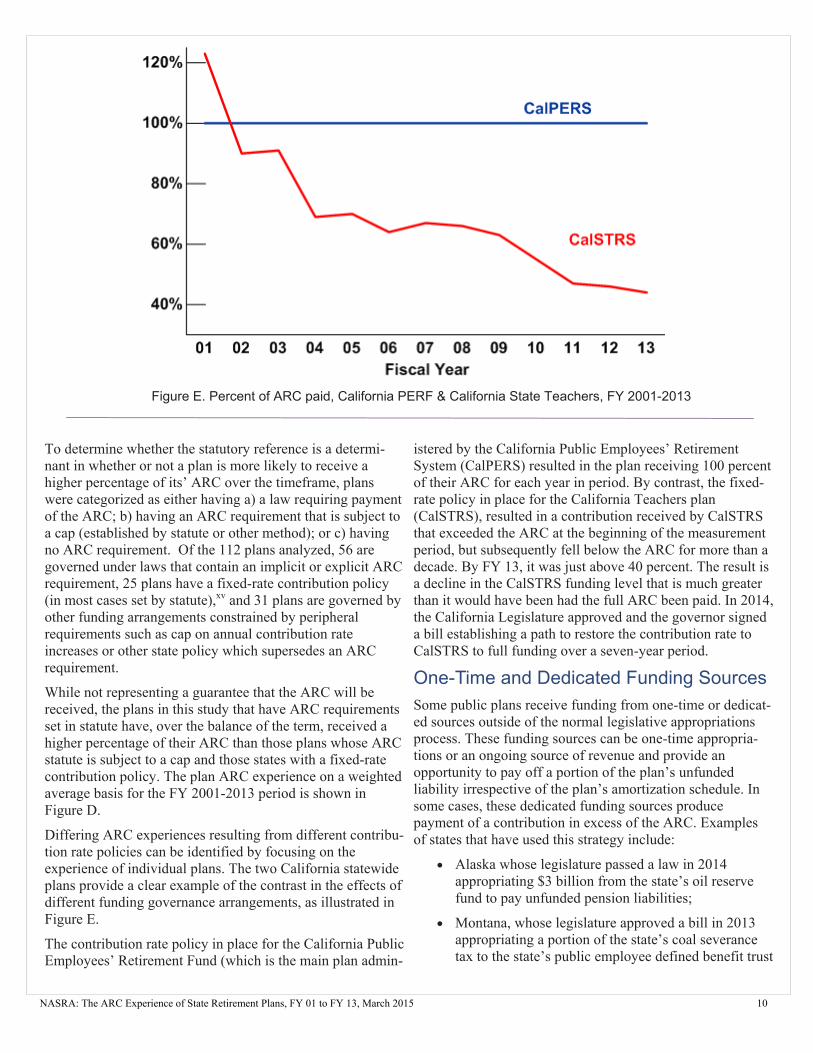
Differing ARC experiences resulting from different contribu-tion rate policies can be identified by focusing on the experience of individual plans. The two California statewide plans provide a clear example of the contrast in the effects of different funding governance arrangements, as illustrated in Figure E.
The contribution rate policy in place for the California Public Employees’ Retirement Fund (which is the main plan admin-
istered by the California Public Employees’ Retirement System (CalPERS) resulted in the plan receiving 100 percent of their ARC for each year in period. By contrast, the fixed-rate policy in place for the California Teachers plan (CalSTRS), resulted in a contribution received by CalSTRS that exceeded the ARC at the beginning of the measurement period, but subsequently fell below the ARC for more than a decade. By FY 13, it was just above 40 percent. The result is a decline in the CalSTRS funding level that is much greater than it would have been had the full ARC been paid. In 2014, the California Legislature approved and the governor signed a bill establishing a path to restore the contribution rate to CalSTRS to full funding over a seven-year period.
One-Time and Dedicated Funding Sources Some public plans receive funding from one-time or dedicat-ed sources outside of the normal legislative appropriations process. These funding sources can be one-time appropria-tions or an ongoing source of revenue and provide an opportunity to pay off a portion of the plan’s unfunded liability irrespective of the plan’s amortization schedule. In some cases, these dedicated funding sources produce payment of a contribution in excess of the ARC. Examples of states that have used this strategy include:
Alaska whose legislature passed a law in 2014 appropriating $3 billion from the state’s oil reserve fund to pay unfunded pension liabilities;
Montana, whose legislature approved a bill in 2013 appropriating a portion of the state’s coal severance tax to the state’s public employee defined benefit trust
Figure E. Percent of ARC paid, California PERF & California State Teachers, FY 2001-2013
NASRA: The ARC Experience of State Retirement Plans, FY 01 to FY 13, March 2015 11
funds until such time as the funds are actuarially sound;
Oklahoma, whose Teacher Retirement System receives 5 percent of the state’s sales, use, and corporate and individual income taxes; 1 percent of cigarette taxes; and 5 percent of net lottery proceeds as an ongoing, dedicated funding source;
Rhode Island, whose statutes require additional contributions from the state in any year in which the actuarially determined contribution rate for state employees and teachers is lower than the rate for the prior fiscal year. The additional contributions are specified in statute as equal to twenty percent of the rate reduction. Rhode Island statutes also require that any general fund surplus monies be used to pay down the state retirement plan’s unfunded pension liability.
For states using a one-time or ongoing dedicated funding source, the additional funds affect plan funding in a way that examining the percentage of ARC received in a given year cannot identify.
The ARC and Political Culture A review of states’ collective ARC record shows that some states have statutes requiring payment of the ARC, yet somehow the ARC is not consistently funded. And other states have statutes that do not require payment of the ARC, yet the ARC is consistently paid in those places. One possi-ble explanation for this paradox is that a state’s political culture affects whether or not pensions are appropriately funded.
For example, despite the fact that Kentucky has long had a statute that required payment of the ARC, state policymakers also were able and willing to find reasons to not fund their pensions. By contrast, although South Dakota relies on a fixed rate to fund its pension plans, the state has consistently paid its full ARC. The difference may be simply a matter of different political climates, with different degrees of im-portance placed on funding pension benefits and on funding discipline.
Conclusion Evidence strongly indicates that most states and local governments sponsoring pension plans in this study made a good-faith effort to fund all or most of their required contributions since 2001, and that the minority of states who fell well short of their ARC requirements disproportionately impact the overall average experience of public pensions receiving their annual required contributions. The ARC grew substantially during this study’s measurement period, and evidence suggests that plans operating under a legal structure
in which the ARC must be paid are more likely to receive their required contribution, which is vital to the long-term success of a pension plan.
Whether a pension plan’s sponsoring employer is governed by an ARC requirement is not the sole factor in determining whether the full ARC is received, although the findings in this study indicate that plans with ARC requirements gener-ally received a higher percentage of their required contribu-tions than those plans governed under less stringent funding arrangements. Other factors to consider when examining a plan’s ARC history is whether or not extraneous agreements or legal rulings have bearing or whether the state has utilized dedicated funding sources to service the unfunded liability.
The onset of new accounting standards for public pensions and the employers that sponsor them herald the end of the ARC as defined by these statements. The closing of this chapter presents an opportunity to review and assess the public pension experience with a uniform reporting standard for required contributions.
In their paper, “The Miracle of Funding of State and Local Pension Plans,” the Center for Retirement Research attrib-utes the sharp improvement in public pension funding levels to the establishment of the ARC by the Governmental Accounting Standards Board:
The miraculous aspect of the funding of state and local pensions is that it occurred without any national legislation. Public plans were not in very good shape in the late 1970s. The 1978 Pension Task Force Report on Public Employee Retirement Systems noted a “high degree of pension cost blindness.” But public officials responded and took action to manage their pensions on a business-like basis. Assets per worker increased markedly by the mid-1990s when GASB issued Statements No. 25 and No. 27. Since then, the funding status of public plans has looked very much like that of their private sector counterparts.xvi
Even though the ARC as defined in previous GASB state-ments no longer will be included in government accounting standards, public pensions are expected to continue to calcu-late an actuarially determined annual contribution amount, and new GASB standards will require disclosure of the effort made to fund this amount. The previous standards resulted in a broad recognition and appreciation for the value of adequately and appropriately calculating and funding an annual public pension contribution. Indeed, many profes-sional groups associated with the public pension community have acknowledged the importance of continuing to properly calculate and fund annual pension contributions, and have prepared guidance to how to do so.xvii
NASRA: The ARC Experience of State Retirement Plans, FY 01 to FY 13, March 2015 12
i National Institute on Retirement Security, Issue Brief: “Who Killed the Private Sector DB Plan?”, March 2011 ii For example, National Institute on Retirement Security, “Lessons from Well-Funded Public Pensions: An Analysis of
Plans that Weathered the Financial Storm,” June 2011; Center for Retirement Research, “The Miracle of Funding by State and Local Pension Plans,” April 2008, etc.
iii National Association of State Retirement Administrators, “State and Local Government Spending on Public
Employee Retirement Systems,” May 2014 iv Ibid v Government Finance Officers Association, “Best Practice: Core Elements of a Funding Policy,” March 2013 vi Texas Pension Review Board, “Understanding the Basics of Actuarial Methods,” April 2013 vii Governmental Accounting Standards Board, “Statement 25, Financial Reporting for Defined Benefit Pension Plans
and Note Disclosures for Defined Contribution Plans,” and “Statement 27, Accounting for Pensions by State and Local Governmental Employers”
viii Ibid ix Government Finance Officers Association, “Best Practice: Evaluating the Use of Pension Obligation Bonds,“ March
2005 x Center for State & Local Government Excellence, “Issue Brief: An Update on Pension Obligation Bonds,” July 2014 xi For example, “Planning a Successful Pension Funding Policy,” Segal Public Sector Letter, November 2011; “Pension
Funding: A Guide for Elected Officials,” Pension Funding Task Force, 2013; and Resolution 2011-01 –“Funding Discipline in Public Employee Retirement Systems,” National Association of State Retirement Administrators
xii Camden v. Byrne, 82 N.J. 133 (1980) and Jersey Education Assoc. v. State, 412 N.J. Super. 192 (App. Div.) (March
4, 2010) xiii 1995 Memorandum of Agreement http://www.ct.gov/opm/lib/opm/pensioncommission/sebac_4.pdf/ 1997
Memorandum of Agreement http://www.ct.gov/opm/lib/opm/pensioncommission/sebac_5.pdf xiv In 2014, the California state legislature passed a law establishing a path to full funding for the California State
Teachers Retirement System xv Center for Retirement Research, “Issue Brief: The Miracle of Funding of State and Local Pension Plans,” April 2008 xvi See Funding Policies @NASRA.org, esp. Pension Funding Task Force, “Pension Funding: An Elected Official’s
Guide,” 2013, and Multiple authors, “Understanding New Public Pension Funding Guidelines and Calculations,” 2013
NASRA: The ARC Experience of State Retirement Plans, FY 01 to FY 13, March 2015 13
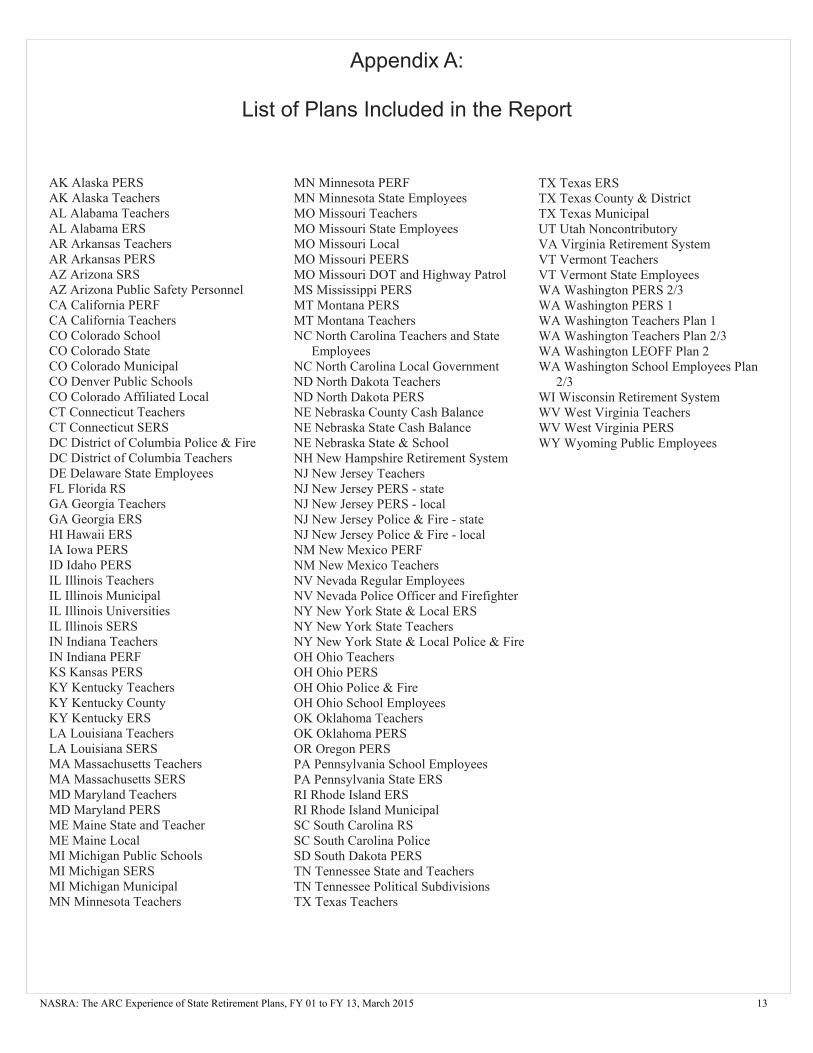
Appendix A:
List of Plans Included in the Report
AK Alaska PERS AK Alaska Teachers AL Alabama Teachers AL Alabama ERS AR Arkansas Teachers AR Arkansas PERS AZ Arizona SRS AZ Arizona Public Safety Personnel CA California PERF CA California Teachers CO Colorado School CO Colorado State CO Colorado Municipal CO Denver Public Schools CO Colorado Affiliated Local CT Connecticut Teachers CT Connecticut SERS DC District of Columbia Police & Fire DC District of Columbia Teachers DE Delaware State Employees FL Florida RS GA Georgia Teachers GA Georgia ERS HI Hawaii ERS IA Iowa PERS ID Idaho PERS IL Illinois Teachers IL Illinois Municipal IL Illinois Universities IL Illinois SERS IN Indiana Teachers IN Indiana PERF KS Kansas PERS KY Kentucky Teachers KY Kentucky County KY Kentucky ERS LA Louisiana Teachers LA Louisiana SERS MA Massachusetts Teachers MA Massachusetts SERS MD Maryland Teachers MD Maryland PERS ME Maine State and Teacher ME Maine Local MI Michigan Public Schools MI Michigan SERS MI Michigan Municipal MN Minnesota Teachers
MN Minnesota PERF MN Minnesota State Employees MO Missouri Teachers MO Missouri State Employees MO Missouri Local MO Missouri PEERS MO Missouri DOT and Highway Patrol MS Mississippi PERS MT Montana PERS MT Montana Teachers NC North Carolina Teachers and State
Employees NC North Carolina Local Government ND North Dakota Teachers ND North Dakota PERS NE Nebraska County Cash Balance NE Nebraska State Cash Balance NE Nebraska State & School NH New Hampshire Retirement System NJ New Jersey Teachers NJ New Jersey PERS - state NJ New Jersey PERS - local NJ New Jersey Police & Fire - state NJ New Jersey Police & Fire - local NM New Mexico PERF NM New Mexico Teachers NV Nevada Regular Employees NV Nevada Police Officer and Firefighter NY New York State & Local ERS NY New York State Teachers NY New York State & Local Police & Fire OH Ohio Teachers OH Ohio PERS OH Ohio Police & Fire OH Ohio School Employees OK Oklahoma Teachers OK Oklahoma PERS OR Oregon PERS PA Pennsylvania School Employees PA Pennsylvania State ERS RI Rhode Island ERS RI Rhode Island Municipal SC South Carolina RS SC South Carolina Police SD South Dakota PERS TN Tennessee State and Teachers TN Tennessee Political Subdivisions TX Texas Teachers
TX Texas ERS TX Texas County & District TX Texas Municipal UT Utah Noncontributory VA Virginia Retirement System VT Vermont Teachers VT Vermont State Employees WA Washington PERS 2/3 WA Washington PERS 1 WA Washington Teachers Plan 1 WA Washington Teachers Plan 2/3 WA Washington LEOFF Plan 2 WA Washington School Employees Plan
2/3 WI Wisconsin Retirement System WV West Virginia Teachers WV West Virginia PERS WY Wyoming Public Employees
NASRA: The ARC Experience of State Retirement Plans, FY 01 to FY 13, March 2015 14
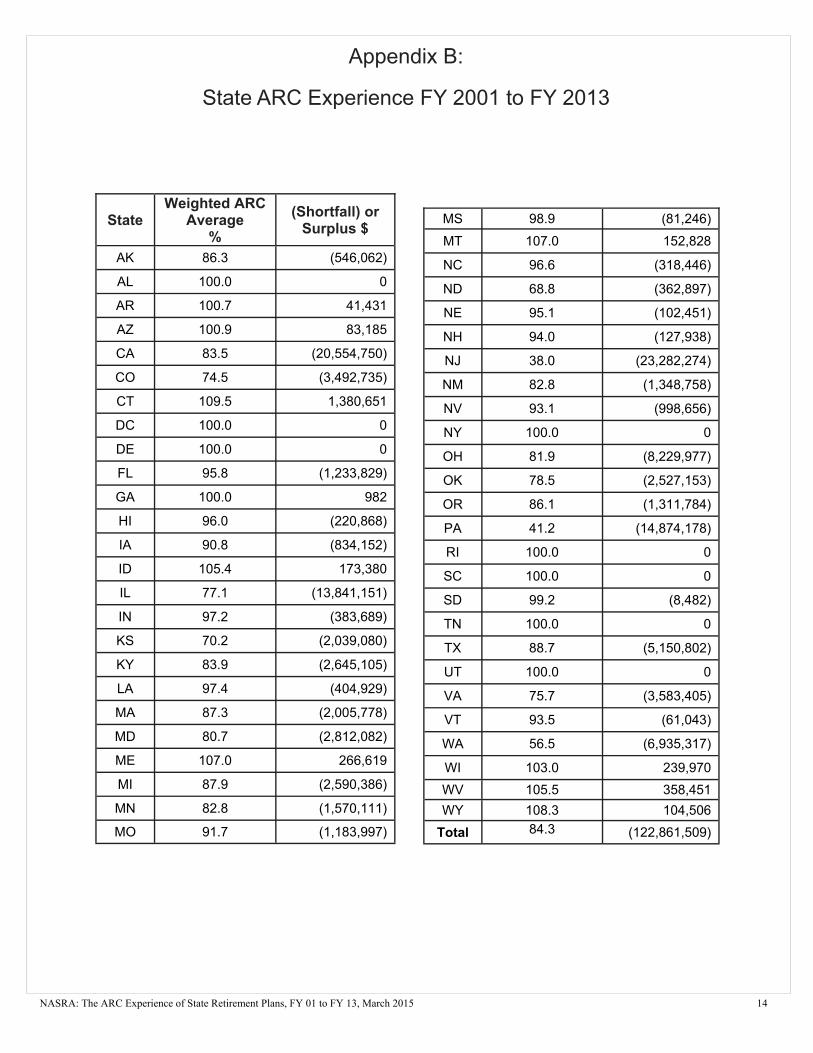
Appendix B:
State ARC Experience FY 2001 to FY 2013
State Weighted ARC
Average %
(Shortfall) or Surplus $
AK 86.3 (546,062)
AL 100.0 0
AR 100.7 41,431
AZ 100.9 83,185
CA 83.5 (20,554,750)
CO 74.5 (3,492,735)
CT 109.5 1,380,651
DC 100.0 0
DE 100.0 0
FL 95.8 (1,233,829)
GA 100.0 982
HI 96.0 (220,868)
IA 90.8 (834,152)
ID 105.4 173,380
IL 77.1 (13,841,151)
IN 97.2 (383,689)
KS 70.2 (2,039,080)
KY 83.9 (2,645,105)
LA 97.4 (404,929)
MA 87.3 (2,005,778)
MD 80.7 (2,812,082)
ME 107.0 266,619
MI 87.9 (2,590,386)
MN 82.8 (1,570,111)
MO 91.7 (1,183,997)
MS 98.9 (81,246)
MT 107.0 152,828
NC 96.6 (318,446)
ND 68.8 (362,897)
NE 95.1 (102,451)
NH 94.0 (127,938)
NJ 38.0 (23,282,274)
NM 82.8 (1,348,758)
NV 93.1 (998,656)
NY 100.0 0
OH 81.9 (8,229,977)
OK 78.5 (2,527,153)
OR 86.1 (1,311,784)
PA 41.2 (14,874,178)
RI 100.0 0
SC 100.0 0
SD 99.2 (8,482)
TN 100.0 0
TX 88.7 (5,150,802)
UT 100.0 0
VA 75.7 (3,583,405)
VT 93.5 (61,043)
WA 56.5 (6,935,317)
WI 103.0 239,970
WV 105.5 358,451
WY 108.3 104,506
Total 84.3 (122,861,509)

NASRA: The ARC Experience of State Retirement Plans, FY 01 to FY 13, March 2015 15
Appendix C:
Individual State and Plan ARC Experiences

Alaska Statewide Retirement Plan ARC Experience
Systems/Plans measured:
• Alaska Public Employees’ Retirement System (PERS) • Alaska Teachers’ Retirement System (TRS)
Employer Contribution Legal Framework
For both Alaska PERS and TRS, statutes require employers to fund the actuarially determined contribution. Both plans were closed to new hires effective July 1, 2006.
2014 legislation directed $3 billion from the state’s oil reserve fund for the purpose of reducing the state’s unfunded pension liabilities.
Key Results and ARC Parameters
Plan
Weighted Average ARC Experience, FY01-FY13
(Shortfall) or Surplus (in thousands)
Actuarial Cost Method
Investment Return
Assumption
Alaska PERS 88.4% ($272,172) Entry age 8.0%
Alaska TRS 83.2% ($273,891) Entry age 8.0%
AK PERS ARC Experience
AK TRS ARC Experience
NASRA: The ARC Experience of State Retirement Plans, FY 01 to FY 13, March 2015 16
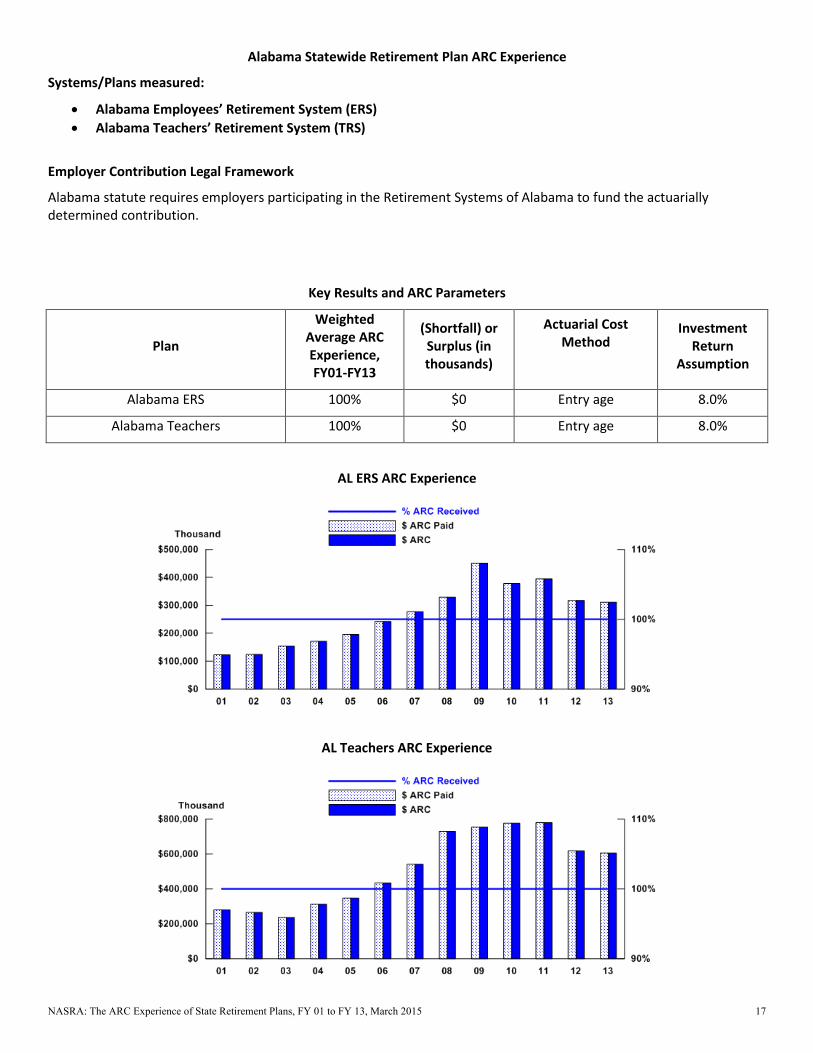
Alabama Statewide Retirement Plan ARC Experience
Systems/Plans measured:
• Alabama Employees’ Retirement System (ERS) • Alabama Teachers’ Retirement System (TRS)
Employer Contribution Legal Framework
Alabama statute requires employers participating in the Retirement Systems of Alabama to fund the actuarially determined contribution.
Key Results and ARC Parameters
Plan
Weighted Average ARC Experience, FY01-FY13
(Shortfall) or Surplus (in thousands)
Actuarial Cost Method
Investment Return
Assumption
Alabama ERS 100% $0 Entry age 8.0%
Alabama Teachers 100% $0 Entry age 8.0%
AL ERS ARC Experience
AL Teachers ARC Experience
NASRA: The ARC Experience of State Retirement Plans, FY 01 to FY 13, March 2015 17

Arkansas Statewide Retirement Plan ARC Experience
Systems/Plans measured:
• Arkansas Public Employees Retirement System (PERS) • Arkansas Teacher Retirement System (TRS)
Employer Contribution Legal Framework
Arkansas PERS and TRS employers are statutorily required to fund the actuarially determined contribution, although for the TRS, statute also limits the employer contribution rate to 14% of compensation.
Key Results and ARC Parameters
Plan
Weighted Average ARC Experience, FY01-FY13
(Shortfall) or Surplus (in thousands)
Actuarial Cost Method
Investment Return
Assumption
Arkansas PERS 100% $0 Entry age 8.0%
Arkansas Teachers 101% $41,431 Entry age 8.0%
AR PERS ARC Experience
AR Teachers ARC Experience
NASRA: The ARC Experience of State Retirement Plans, FY 01 to FY 13, March 2015 18

Arizona Statewide Retirement Plan ARC Experience
Systems/Plans measured:
• Arizona State Retirement System (SRS) • Arizona Public Safety Personnel Retirement System (PSPRS)
Employer Contribution Legal Framework
For both the Arizona SRS and the PSPRS, statutes require employers to fund the actuarially determined contribution.
Key Results and ARC Parameters
Plan
Weighted Average ARC Experience, FY01-FY13
(Shortfall) or Surplus (in thousands)
Actuarial Cost Method
Investment Return
Assumption
Arizona State Retirement System 100% $0 Projected Unit Credit 8.0%
Arizona Public Safety Personnel 103.5% $83,185 Entry age 7.85%
AZ State Retirement System ARC Experience
AZ Public Safety Personnel ARC Experience
NASRA: The ARC Experience of State Retirement Plans, FY 01 to FY 13, March 2015 19
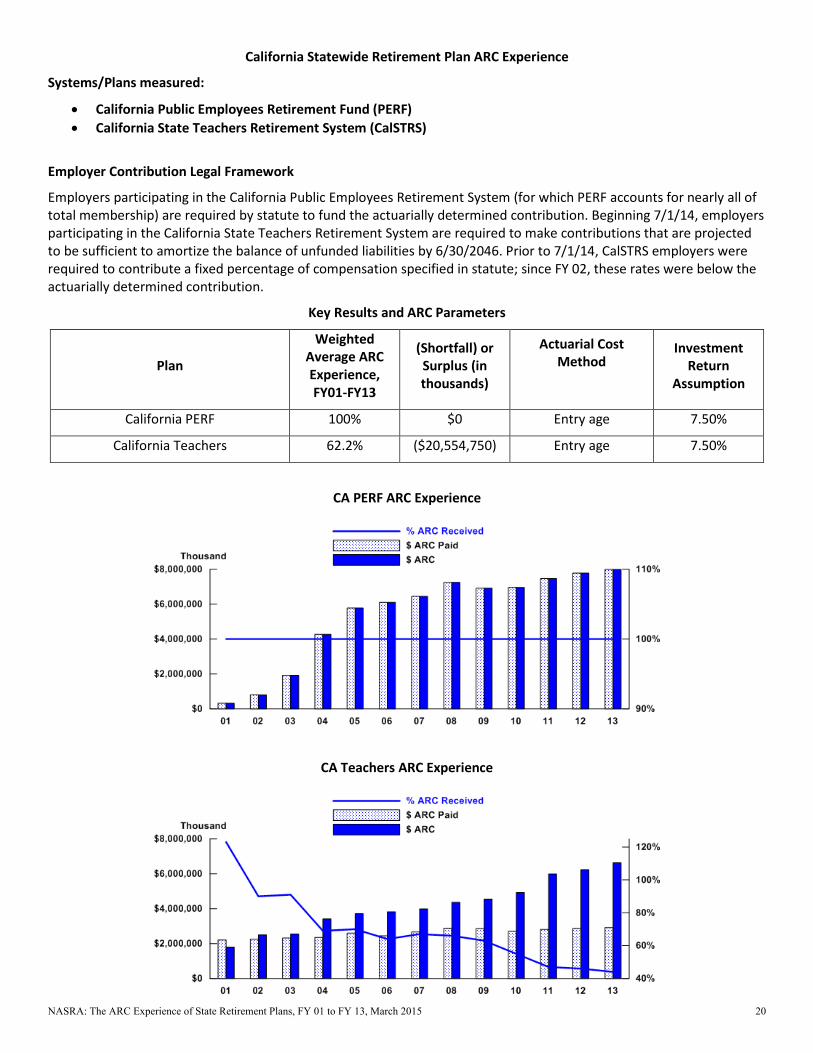
California Statewide Retirement Plan ARC Experience
Systems/Plans measured:
• California Public Employees Retirement Fund (PERF) • California State Teachers Retirement System (CalSTRS)
Employer Contribution Legal Framework
Employers participating in the California Public Employees Retirement System (for which PERF accounts for nearly all of total membership) are required by statute to fund the actuarially determined contribution. Beginning 7/1/14, employers participating in the California State Teachers Retirement System are required to make contributions that are projected to be sufficient to amortize the balance of unfunded liabilities by 6/30/2046. Prior to 7/1/14, CalSTRS employers were required to contribute a fixed percentage of compensation specified in statute; since FY 02, these rates were below the actuarially determined contribution.
Key Results and ARC Parameters
Plan
Weighted Average ARC Experience, FY01-FY13
(Shortfall) or Surplus (in thousands)
Actuarial Cost Method
Investment Return
Assumption
California PERF 100% $0 Entry age 7.50%
California Teachers 62.2% ($20,554,750) Entry age 7.50%
CA PERF ARC Experience
CA Teachers ARC Experience
NASRA: The ARC Experience of State Retirement Plans, FY 01 to FY 13, March 2015 20
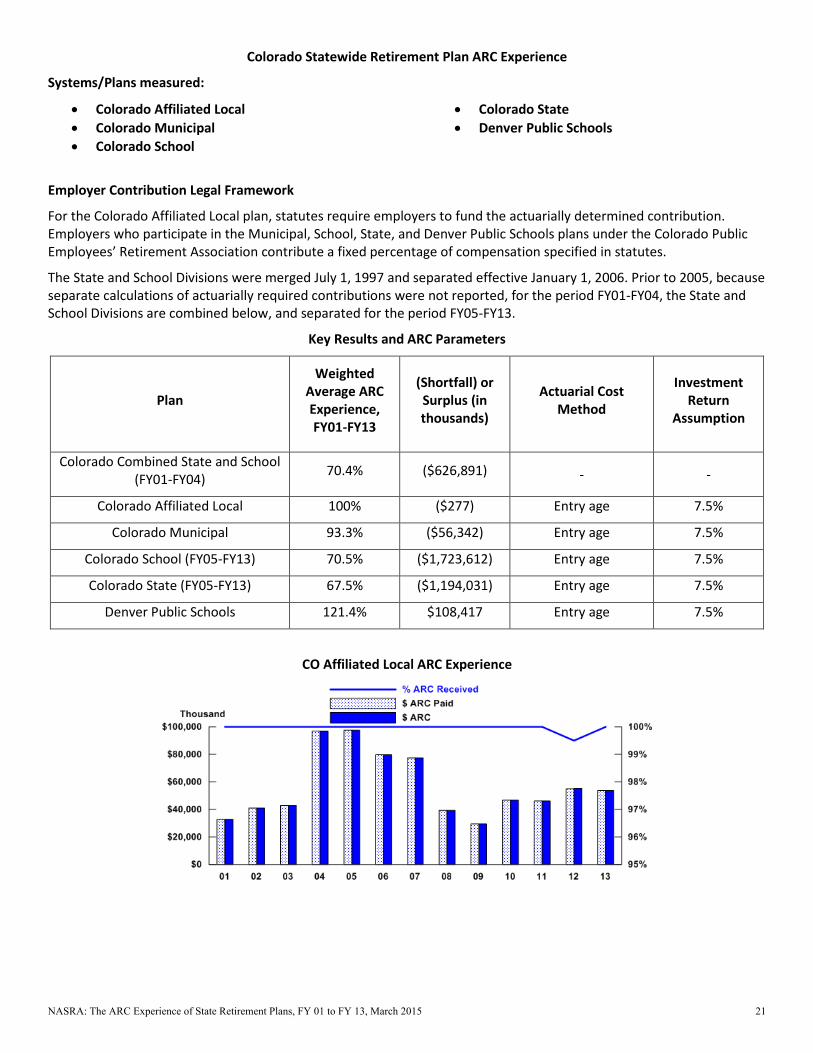
Colorado Statewide Retirement Plan ARC Experience
Systems/Plans measured:
• Colorado Affiliated Local • Colorado Municipal • Colorado School
• Colorado State • Denver Public Schools
Employer Contribution Legal Framework
For the Colorado Affiliated Local plan, statutes require employers to fund the actuarially determined contribution. Employers who participate in the Municipal, School, State, and Denver Public Schools plans under the Colorado Public Employees’ Retirement Association contribute a fixed percentage of compensation specified in statutes.
The State and School Divisions were merged July 1, 1997 and separated effective January 1, 2006. Prior to 2005, because separate calculations of actuarially required contributions were not reported, for the period FY01-FY04, the State and School Divisions are combined below, and separated for the period FY05-FY13.
Key Results and ARC Parameters
Plan
Weighted Average ARC Experience, FY01-FY13
(Shortfall) or Surplus (in thousands)
Actuarial Cost Method
Investment Return
Assumption
Colorado Combined State and School (FY01-FY04) 70.4% ($626,891) - -
Colorado Affiliated Local 100% ($277) Entry age 7.5%
Colorado Municipal 93.3% ($56,342) Entry age 7.5%
Colorado School (FY05-FY13) 70.5% ($1,723,612) Entry age 7.5%
Colorado State (FY05-FY13) 67.5% ($1,194,031) Entry age 7.5%
Denver Public Schools 121.4% $108,417 Entry age 7.5%
CO Affiliated Local ARC Experience
NASRA: The ARC Experience of State Retirement Plans, FY 01 to FY 13, March 2015 21
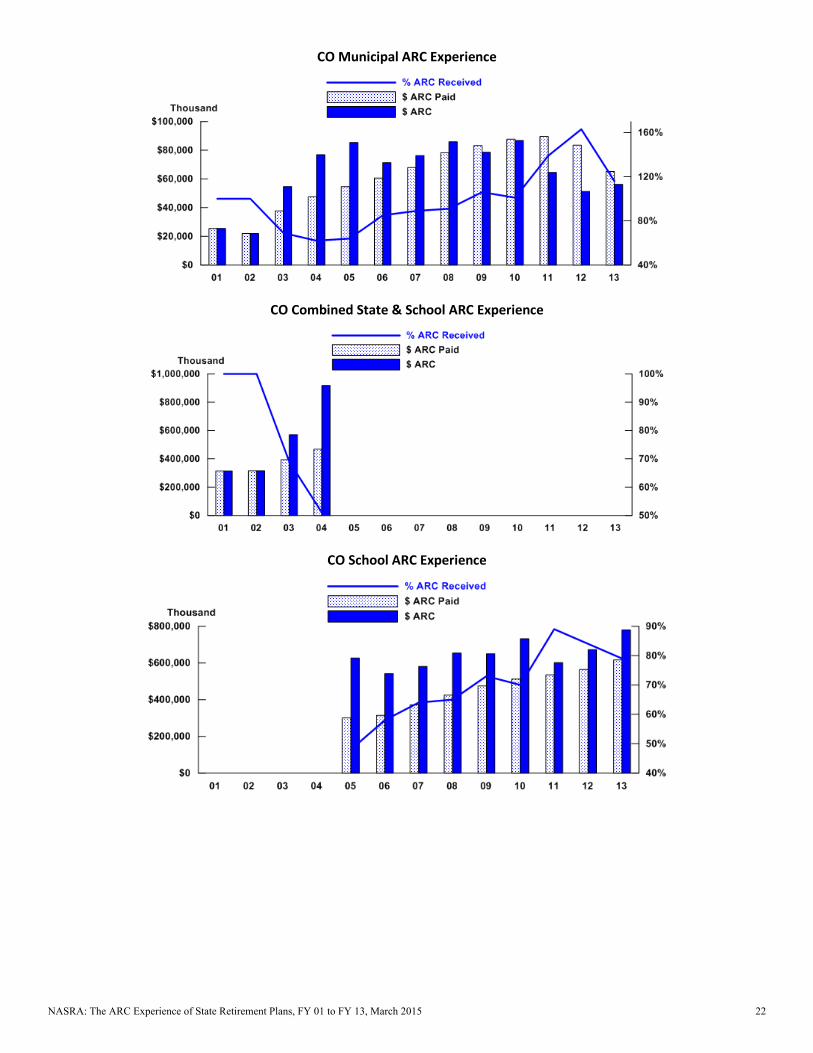
CO Municipal ARC Experience
CO Combined State & School ARC Experience
CO School ARC Experience
NASRA: The ARC Experience of State Retirement Plans, FY 01 to FY 13, March 2015 22

CO State ARC Experience
Denver Public Schools ARC Experience
NASRA: The ARC Experience of State Retirement Plans, FY 01 to FY 13, March 2015 23
Connecticut Statewide Retirement Plan ARC Experience
Systems/Plans measured:
• Connecticut State Employees Retirement System (SERS) • Connecticut Teachers’ Retirement Board (TRB)
Employer Contribution Legal Framework
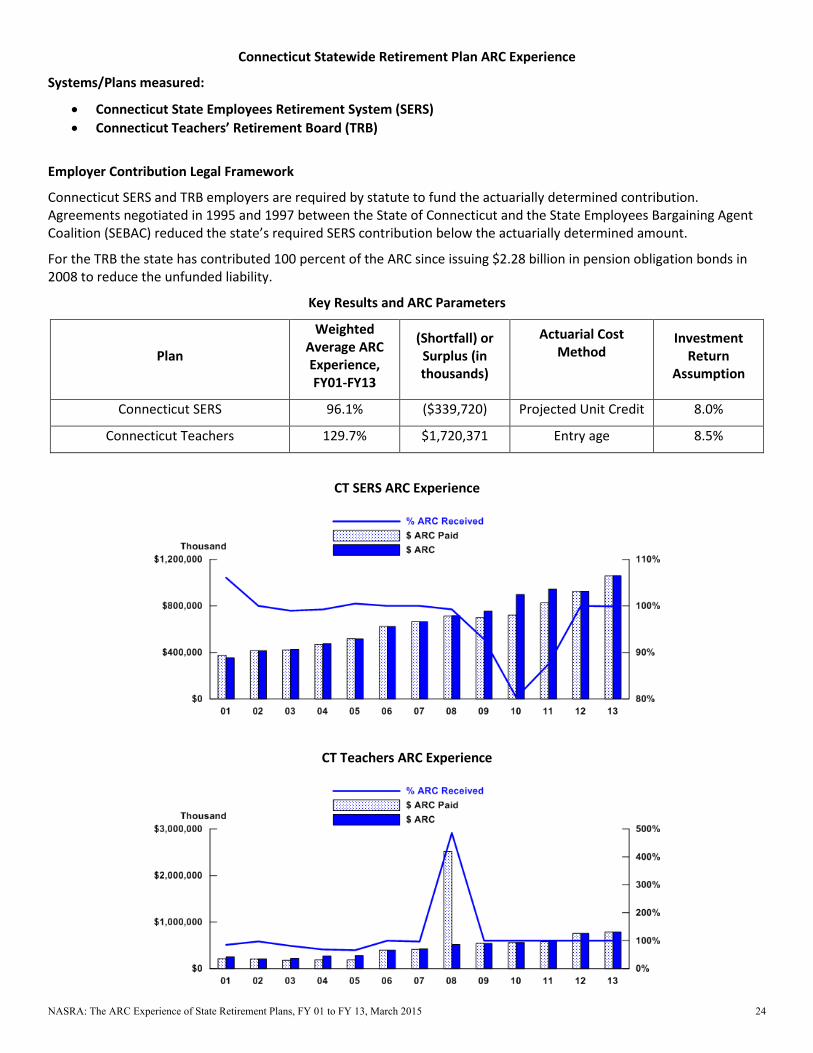
Connecticut SERS and TRB employers are required by statute to fund the actuarially determined contribution. Agreements negotiated in 1995 and 1997 between the State of Connecticut and the State Employees Bargaining Agent Coalition (SEBAC) reduced the state’s required SERS contribution below the actuarially determined amount.
For the TRB the state has contributed 100 percent of the ARC since issuing $2.28 billion in pension obligation bonds in 2008 to reduce the unfunded liability.
Key Results and ARC Parameters
Plan
Weighted Average ARC Experience, FY01-FY13
(Shortfall) or Surplus (in thousands)
Actuarial Cost Method
Investment Return
Assumption
Connecticut SERS 96.1% ($339,720) Projected Unit Credit 8.0%
Connecticut Teachers 129.7% $1,720,371 Entry age 8.5%
CT SERS ARC Experience
CT Teachers ARC Experience
NASRA: The ARC Experience of State Retirement Plans, FY 01 to FY 13, March 2015 24
District of Columbia Statewide Retirement Plan ARC Experience
Systems/Plans measured:
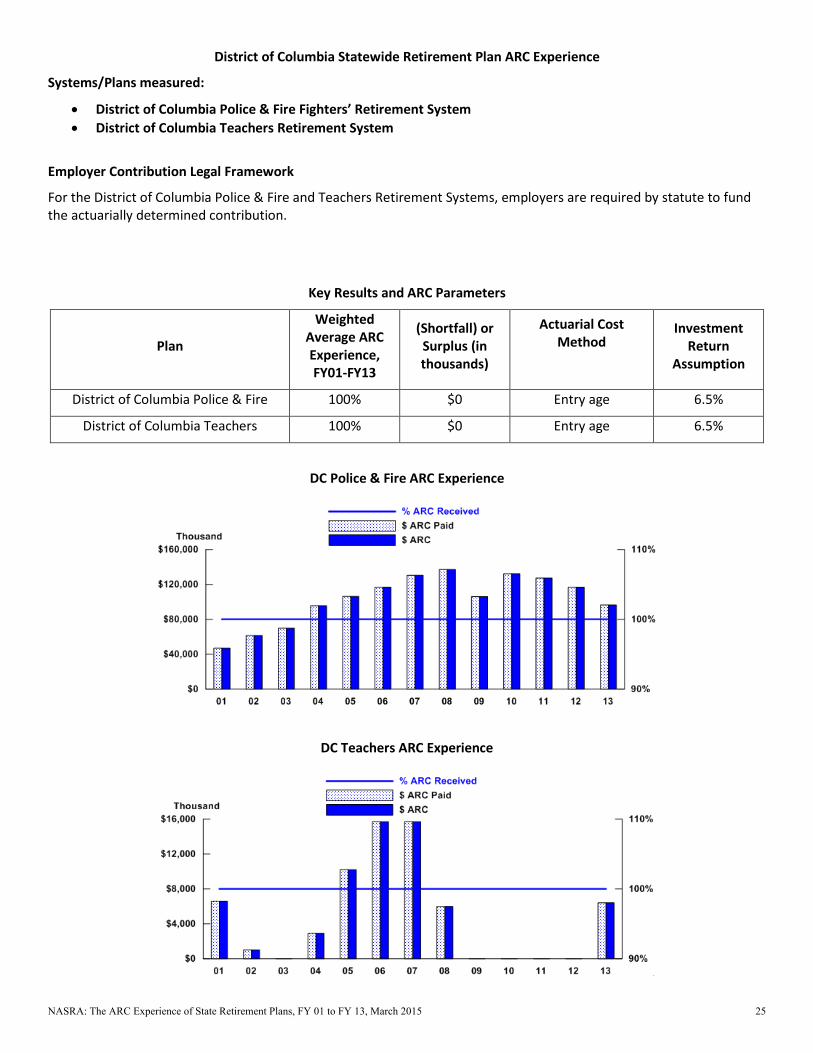
• District of Columbia Police & Fire Fighters’ Retirement System • District of Columbia Teachers Retirement System
Employer Contribution Legal Framework
For the District of Columbia Police & Fire and Teachers Retirement Systems, employers are required by statute to fund the actuarially determined contribution.
Key Results and ARC Parameters
Plan
Weighted Average ARC Experience, FY01-FY13
(Shortfall) or Surplus (in thousands)
Actuarial Cost Method
Investment Return
Assumption
District of Columbia Police & Fire 100% $0 Entry age 6.5%
District of Columbia Teachers 100% $0 Entry age 6.5%
DC Police & Fire ARC Experience
DC Teachers ARC Experience
NASRA: The ARC Experience of State Retirement Plans, FY 01 to FY 13, March 2015 25

Delaware Statewide Retirement Plan ARC Experience
Systems/Plans measured:
• Delaware State Employees’ Pension Plan
Employer Contribution Legal Framework
Employers participating in the Delaware Public Employees Retirement System are required by statute to fund the actuarially determined contribution.
Key Results and ARC Parameters
Plan
Weighted Average ARC Experience, FY01-FY13
(Shortfall) or Surplus (in thousands)
Actuarial Cost Method
Investment Return
Assumption
Delaware State Employees 100% $0 Entry age 7.50%
DE State Employees ARC Experience
NASRA: The ARC Experience of State Retirement Plans, FY 01 to FY 13, March 2015 26
Florida Statewide Retirement Plan ARC Experience
Systems/Plans measured:
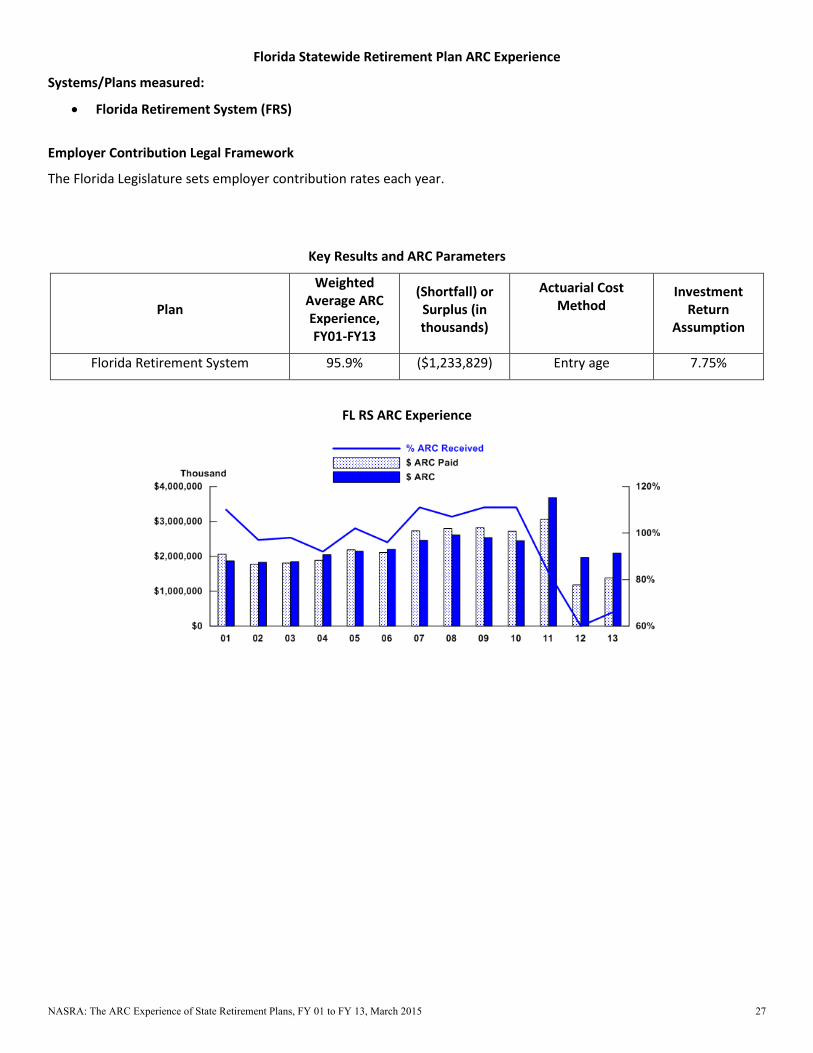
• Florida Retirement System (FRS)
Employer Contribution Legal Framework
The Florida Legislature sets employer contribution rates each year.
Key Results and ARC Parameters
Plan
Weighted Average ARC Experience, FY01-FY13
(Shortfall) or Surplus (in thousands)
Actuarial Cost Method
Investment Return
Assumption
Florida Retirement System 95.9% ($1,233,829) Entry age 7.75%
FL RS ARC Experience
NASRA: The ARC Experience of State Retirement Plans, FY 01 to FY 13, March 2015 27
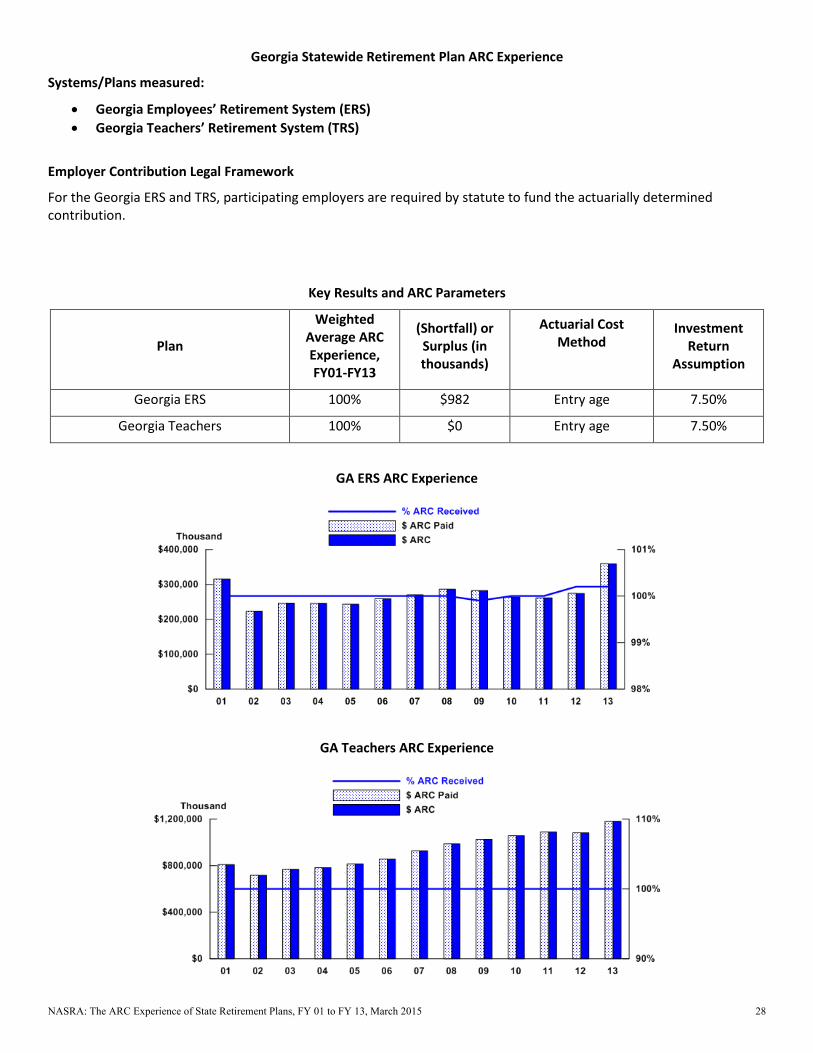
Georgia Statewide Retirement Plan ARC Experience
Systems/Plans measured:
• Georgia Employees’ Retirement System (ERS) • Georgia Teachers’ Retirement System (TRS)
Employer Contribution Legal Framework
For the Georgia ERS and TRS, participating employers are required by statute to fund the actuarially determined contribution.
Key Results and ARC Parameters
Plan
Weighted Average ARC Experience, FY01-FY13
(Shortfall) or Surplus (in thousands)
Actuarial Cost Method
Investment Return
Assumption
Georgia ERS 100% $982 Entry age 7.50%
Georgia Teachers 100% $0 Entry age 7.50%
GA ERS ARC Experience
GA Teachers ARC Experience
NASRA: The ARC Experience of State Retirement Plans, FY 01 to FY 13, March 2015 28

Hawaii Statewide Retirement Plan ARC Experience
Systems/Plans measured:
• Hawaii Employees’ Retirement System (ERS)
Employer Contribution Legal Framework
Employers participating in the Hawaii ERS are required to fund a fixed percentage of compensation specified in statute.
Key Results and ARC Parameters
Plan
Weighted Average ARC Experience, FY01-FY13
(Shortfall) or Surplus (in thousands)
Actuarial Cost Method
Investment Return
Assumption
Hawaii ERS 96.0% ($220,868) Entry age 7.75%
HI ERS ARC Experience
NASRA: The ARC Experience of State Retirement Plans, FY 01 to FY 13, March 2015 29
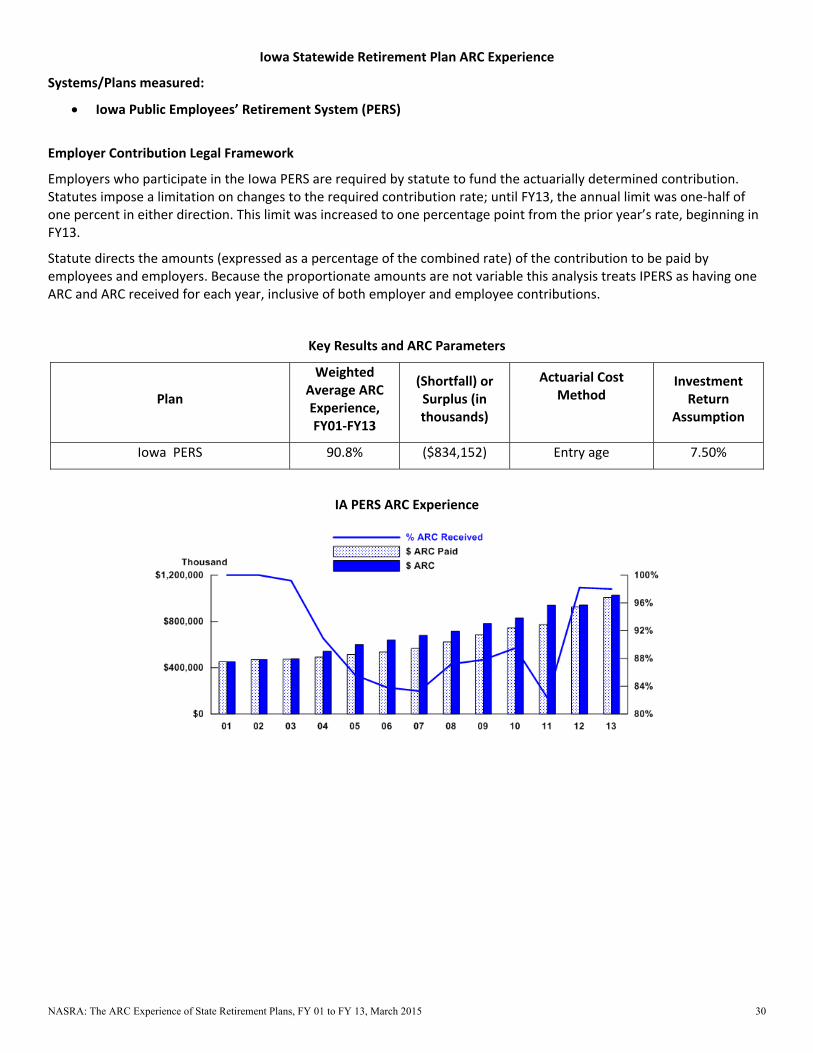
Iowa Statewide Retirement Plan ARC Experience
Systems/Plans measured:
Iowa Public Employees’ Retirement System (PERS)
Employer Contribution Legal Framework
Employers who participate in the Iowa PERS are required by statute to fund the actuarially determined contribution. Statutes impose a limitation on changes to the required contribution rate; until FY13, the annual limit was one‐half of one percent in either direction. This limit was increased to one percentage point from the prior year’s rate, beginning in FY13.
Statute directs the amounts (expressed as a percentage of the combined rate) of the contribution to be paid by employees and employers. Because the proportionate amounts are not variable this analysis treats IPERS as having one ARC and ARC received for each year, inclusive of both employer and employee contributions.
Key Results and ARC Parameters
Plan
Weighted Average ARC Experience, FY01‐FY13
(Shortfall) or Surplus (in thousands)
Actuarial Cost Method
Investment Return
Assumption
Iowa PERS 90.8% ($834,152) Entry age 7.50%
IA PERS ARC Experience
NASRA: The ARC Experience of State Retirement Plans, FY 01 to FY 13, March 2015 30

Idaho Statewide Retirement Plan ARC Experience
Systems/Plans measured:
• Idaho Public Employee Retirement System (PERSI)
Employer Contribution Legal Framework
Employers participating in the PERSI are required by statute to fund the actuarially determined contribution. Because of a lag between the date of the actuarial valuation and the implementation of the approved contribution rate, the actual contribution does not always equal the ARC.
Key Results and ARC Parameters
Plan
Weighted Average ARC Experience, FY01-FY13
(Shortfall) or Surplus (in thousands)
Actuarial Cost Method
Investment Return
Assumption
Idaho PERS 105.5% $173,380 Entry age 7.50%
ID PERS ARC Experience
NASRA: The ARC Experience of State Retirement Plans, FY 01 to FY 13, March 2015 31

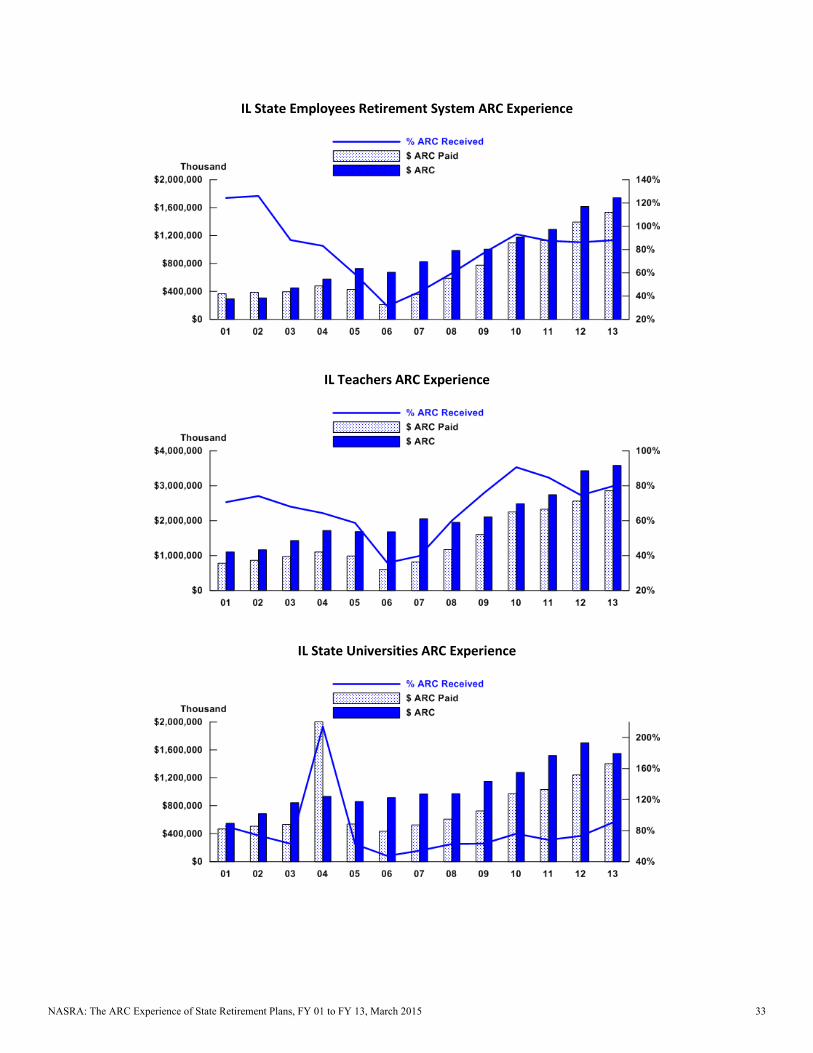
Illinois Statewide Retirement Plan ARC Experience
Systems/Plans measured:
• Illinois Municipal Retirement Fund (IMRF) • Illinois State Employees’ Retirement System (SERS) • Illinois Teachers’ Retirement System (TRS) • Illinois State Universities’ Retirement System (SURS)
Employer Contribution Legal Framework
For the Illinois SERS, TRS, and SURS, employers are required to make contributions which are determined to be sufficient to bring the total system’s assets up to 90 percent of the total plan’s liabilities over a timeframe specified in statute. A 2014 law established a path to full funding by 2044 for the three plans, and provides for supplemental contributions of $364 million in FY19 and $1 billion annually thereafter through 2045, or until the plan is 100 percent funded. The law also states that if the State fails to fund the actuarially determined contribution, the retirement system may appeal to the Illinois Supreme Court to compel payment. The law currently is under legal challenge.
For the Illinois MRF, employers are required by statute to fund the actuarially determined contribution. Due to the investment losses related to the 2008 recession, employers were given the option to pay either a) the normal cost (for those employers which were previously overfunded and paying less than the normal cost); b) the normal cost plus a 10% increase (which was less than the ARC); or c) the full ARC.
Key Results and ARC Parameters
Plan
Weighted Average ARC Experience, FY01-FY13
(Shortfall) or Surplus (in thousands)
Actuarial Cost Method
Investment Return
Assumption
Illinois Municipal 98.3% ($136,327) Entry age 7.50%
Illinois SERS 78.3% ($2,527,458) Projected unit credit 7.75%
Illinois Teachers 69.6% ($8,240,186) Projected unit credit 7.50%
Illinois Universities 78.9% ($2,937,180) Projected unit credit 7.75%
IL Municipal ARC Experience
NASRA: The ARC Experience of State Retirement Plans, FY 01 to FY 13, March 2015 32
IL State Employees Retirement System ARC Experience
IL Teachers ARC Experience
IL State Universities ARC Experience
NASRA: The ARC Experience of State Retirement Plans, FY 01 to FY 13, March 2015 33
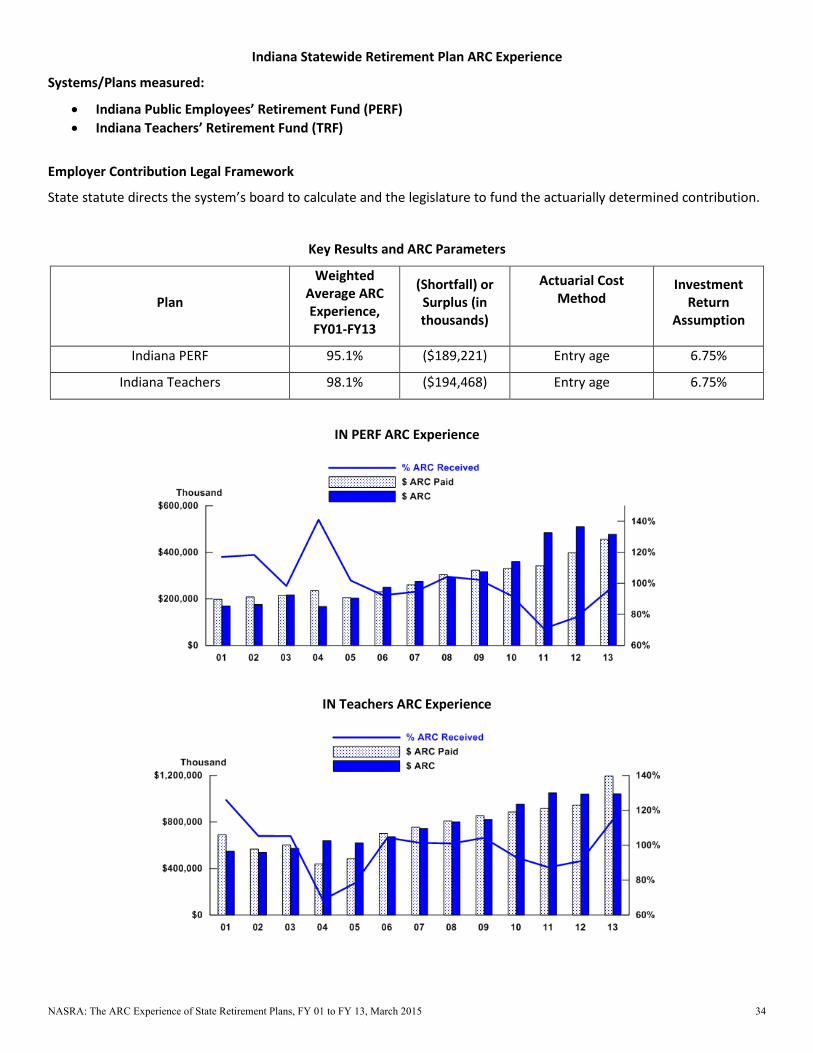
Indiana Statewide Retirement Plan ARC Experience
Systems/Plans measured:
• Indiana Public Employees’ Retirement Fund (PERF) • Indiana Teachers’ Retirement Fund (TRF)
Employer Contribution Legal Framework
State statute directs the system’s board to calculate and the legislature to fund the actuarially determined contribution.
Key Results and ARC Parameters
Plan
Weighted Average ARC Experience, FY01-FY13
(Shortfall) or Surplus (in thousands)
Actuarial Cost Method
Investment Return
Assumption
Indiana PERF 95.1% ($189,221) Entry age 6.75%
Indiana Teachers 98.1% ($194,468) Entry age 6.75%
IN PERF ARC Experience
IN Teachers ARC Experience
NASRA: The ARC Experience of State Retirement Plans, FY 01 to FY 13, March 2015 34

Kansas Statewide Retirement Plan ARC Experience
Systems/Plans measured:
Kansas Public Employees Retirement System (PERS)
Employer Contribution Legal Framework
Employers participating in the Kansas PERS are required by statute to fund the actuarially determined contribution. Statute imposes a limit on increases to required contribution rates: until FY 13, this limit was 0.6 percent. 2011 legislation increased the annual rate caps gradually, beginning in FY14, eventually rising to 1.2% of the prior years’ rate in FY17.
2012 legislation directs, beginning in FY14, 50 percent of the annual revenues from the state’s Expanded Lottery Reserve Fund (after a $10.5 million annual commitment through 2021 has been met), for purposes of reducing KPERS unfunded liability. Additionally, the law directs 80 percent of the proceeds from any sale of state surplus real estate to KPERS until the system reaches an 80 percent funded level.
Key Results and ARC Parameters
Plan
Weighted Average ARC Experience, FY01‐FY13
(Shortfall) or Surplus (in thousands)
Actuarial Cost Method
Investment Return
Assumption
Kansas PERS 70.2% ($2,039,080) Entry age 8.0%
Kansas PERS ARC Experience
NASRA: The ARC Experience of State Retirement Plans, FY 01 to FY 13, March 2015 35
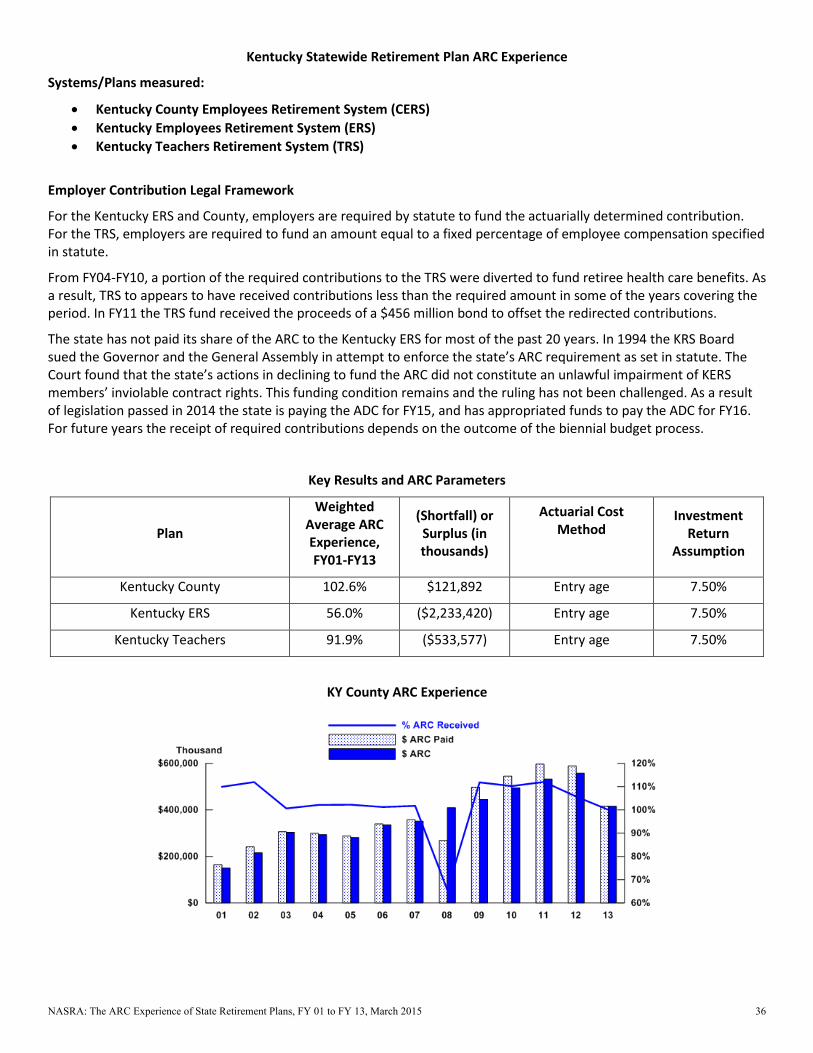
Kentucky Statewide Retirement Plan ARC Experience
Systems/Plans measured:
• Kentucky County Employees Retirement System (CERS) • Kentucky Employees Retirement System (ERS) • Kentucky Teachers Retirement System (TRS)
Employer Contribution Legal Framework
For the Kentucky ERS and County, employers are required by statute to fund the actuarially determined contribution. For the TRS, employers are required to fund an amount equal to a fixed percentage of employee compensation specified in statute.
From FY04-FY10, a portion of the required contributions to the TRS were diverted to fund retiree health care benefits. As a result, TRS to appears to have received contributions less than the required amount in some of the years covering the period. In FY11 the TRS fund received the proceeds of a $456 million bond to offset the redirected contributions.
The state has not paid its share of the ARC to the Kentucky ERS for most of the past 20 years. In 1994 the KRS Board sued the Governor and the General Assembly in attempt to enforce the state’s ARC requirement as set in statute. The Court found that the state’s actions in declining to fund the ARC did not constitute an unlawful impairment of KERS members’ inviolable contract rights. This funding condition remains and the ruling has not been challenged. As a result of legislation passed in 2014 the state is paying the ADC for FY15, and has appropriated funds to pay the ADC for FY16. For future years the receipt of required contributions depends on the outcome of the biennial budget process.
Key Results and ARC Parameters
Plan
Weighted Average ARC Experience, FY01-FY13
(Shortfall) or Surplus (in thousands)
Actuarial Cost Method
Investment Return
Assumption
Kentucky County 102.6% $121,892 Entry age 7.50%
Kentucky ERS 56.0% ($2,233,420) Entry age 7.50%
Kentucky Teachers 91.9% ($533,577) Entry age 7.50%
KY County ARC Experience
NASRA: The ARC Experience of State Retirement Plans, FY 01 to FY 13, March 2015 36

KY ERS ARC Experience
KY Teachers ARC Experience
NASRA: The ARC Experience of State Retirement Plans, FY 01 to FY 13, March 2015 37

Louisiana Statewide Retirement Plan ARC Experience
Systems/Plans measured:
• Louisiana State Employees’ Retirement System (SERS) • Louisiana Teachers’ Retirement System (TRS)
Employer Contribution Legal Framework
For the Louisiana SERS and TRS, the state constitution mandates payment of the actuarially determined contribution. Shortfalls in the ARC for the SERS and TRS are a result of timing differences between the date of actuarial valuations and the legislative appropriations process.
Key Results and ARC Parameters
Plan
Weighted Average ARC Experience, FY01-FY13
(Shortfall) or Surplus (in thousands)
Actuarial Cost Method
Investment Return
Assumption
Louisiana SERS 93.6% ($394,227) Entry age 7.75%
Louisiana Teachers 99.9% ($10,702) Entry age 7.75%
LA SERS ARC Experience
LA Teachers ARC Experience
NASRA: The ARC Experience of State Retirement Plans, FY 01 to FY 13, March 2015 38
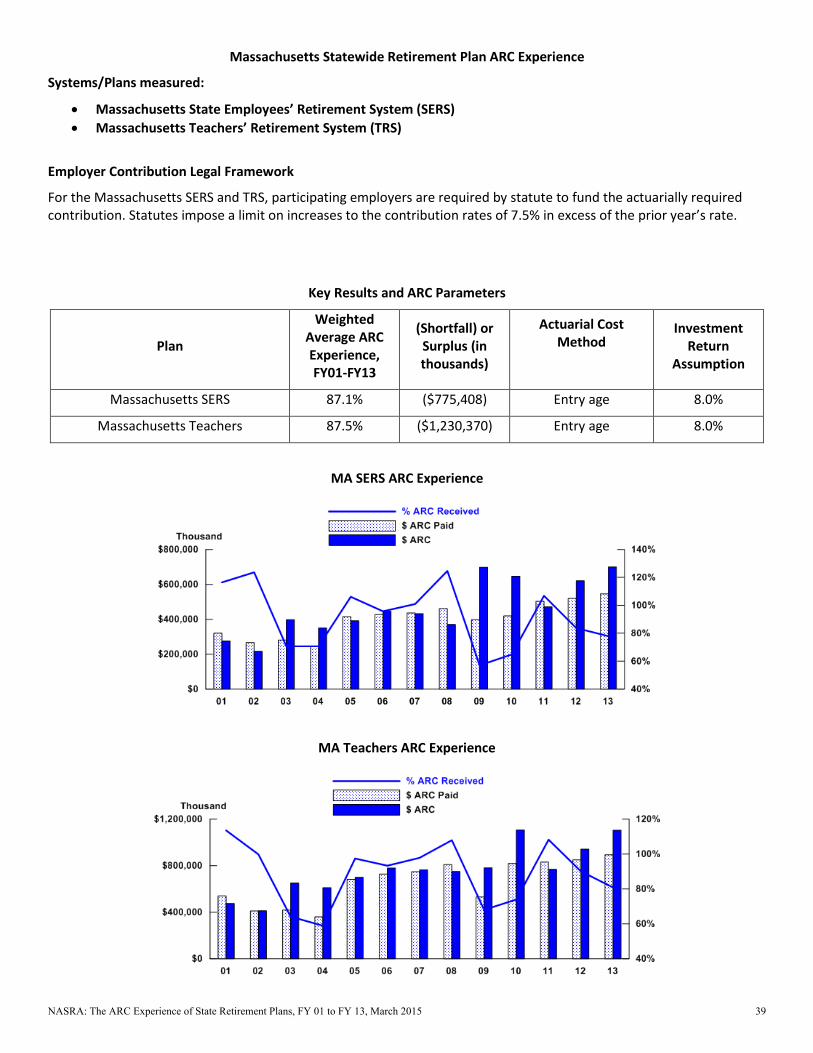
Massachusetts Statewide Retirement Plan ARC Experience
Systems/Plans measured:
• Massachusetts State Employees’ Retirement System (SERS) • Massachusetts Teachers’ Retirement System (TRS)
Employer Contribution Legal Framework
For the Massachusetts SERS and TRS, participating employers are required by statute to fund the actuarially required contribution. Statutes impose a limit on increases to the contribution rates of 7.5% in excess of the prior year’s rate.
Key Results and ARC Parameters
Plan
Weighted Average ARC Experience, FY01-FY13
(Shortfall) or Surplus (in thousands)
Actuarial Cost Method
Investment Return
Assumption
Massachusetts SERS 87.1% ($775,408) Entry age 8.0%
Massachusetts Teachers 87.5% ($1,230,370) Entry age 8.0%
MA SERS ARC Experience
MA Teachers ARC Experience
NASRA: The ARC Experience of State Retirement Plans, FY 01 to FY 13, March 2015 39
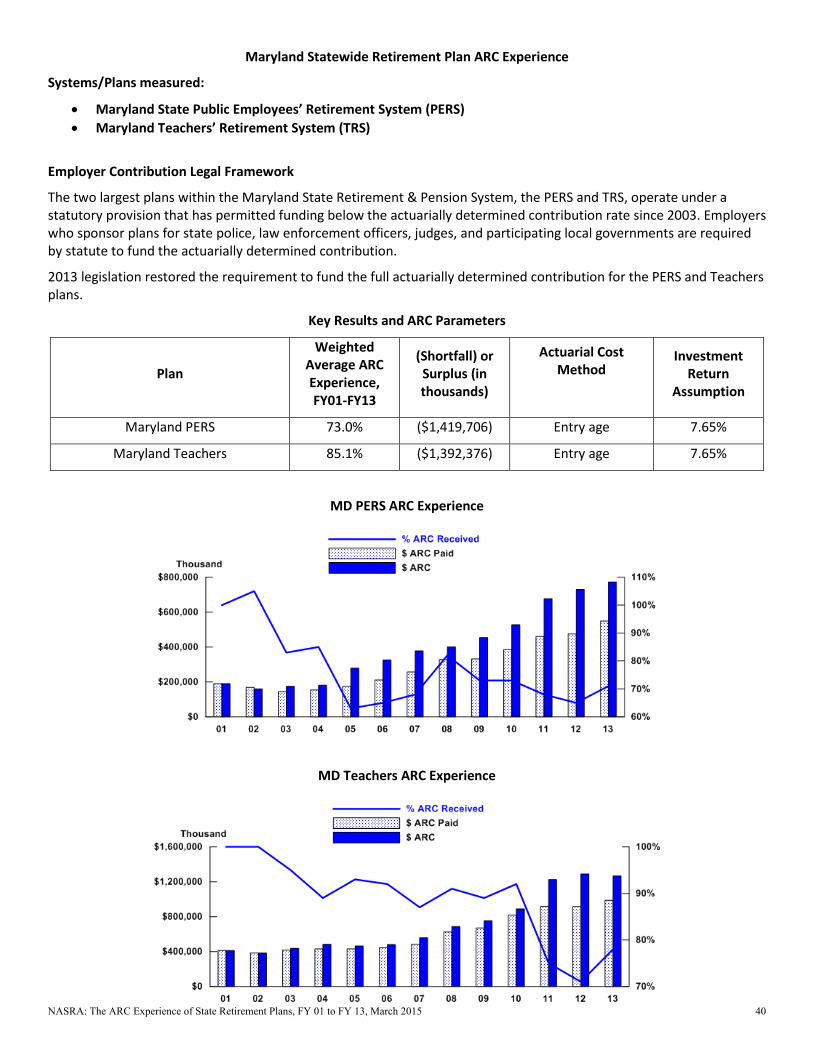
Maryland Statewide Retirement Plan ARC Experience
Systems/Plans measured:
• Maryland State Public Employees’ Retirement System (PERS) • Maryland Teachers’ Retirement System (TRS)
Employer Contribution Legal Framework
The two largest plans within the Maryland State Retirement & Pension System, the PERS and TRS, operate under a statutory provision that has permitted funding below the actuarially determined contribution rate since 2003. Employers who sponsor plans for state police, law enforcement officers, judges, and participating local governments are required by statute to fund the actuarially determined contribution.
2013 legislation restored the requirement to fund the full actuarially determined contribution for the PERS and Teachers plans.
Key Results and ARC Parameters
Plan
Weighted Average ARC Experience, FY01-FY13
(Shortfall) or Surplus (in thousands)
Actuarial Cost Method
Investment Return
Assumption
Maryland PERS 73.0% ($1,419,706) Entry age 7.65%
Maryland Teachers 85.1% ($1,392,376) Entry age 7.65%
MD PERS ARC Experience
MD Teachers ARC Experience
NASRA: The ARC Experience of State Retirement Plans, FY 01 to FY 13, March 2015 40

Maine Statewide Retirement Plan ARC Experience
Systems/Plans measured:
• Maine Local • Maine State and Teacher
Employer Contribution Legal Framework
The Maine State Constitution establishes a requirement that participating employers in the Maine PERS fund the actuarially determined contribution.
Key Results and ARC Parameters
Plan
Weighted Average ARC Experience, FY01-FY13
(Shortfall) or Surplus (in thousands)
Actuarial Cost Method
Investment Return
Assumption
Maine Local 204.7% $187,107 Entry age 7.125%
Maine State and Teacher 102.2% $79,513 Entry age 7.125%
ME Local ARC Experience
ME State and Teacher ARC Experience
NASRA: The ARC Experience of State Retirement Plans, FY 01 to FY 13, March 2015 41
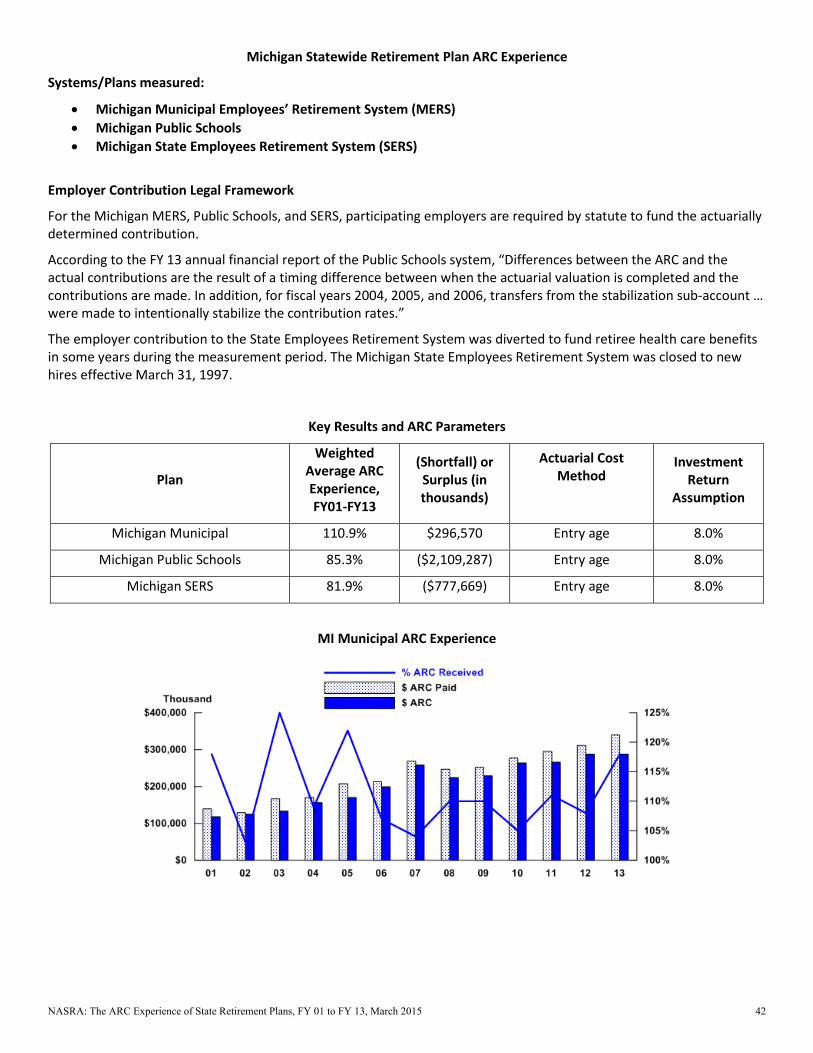
Michigan Statewide Retirement Plan ARC Experience
Systems/Plans measured:
• Michigan Municipal Employees’ Retirement System (MERS) • Michigan Public Schools • Michigan State Employees Retirement System (SERS)
Employer Contribution Legal Framework
For the Michigan MERS, Public Schools, and SERS, participating employers are required by statute to fund the actuarially determined contribution.
According to the FY 13 annual financial report of the Public Schools system, “Differences between the ARC and the actual contributions are the result of a timing difference between when the actuarial valuation is completed and the contributions are made. In addition, for fiscal years 2004, 2005, and 2006, transfers from the stabilization sub-account … were made to intentionally stabilize the contribution rates.”
The employer contribution to the State Employees Retirement System was diverted to fund retiree health care benefits in some years during the measurement period. The Michigan State Employees Retirement System was closed to new hires effective March 31, 1997.
Key Results and ARC Parameters
Plan
Weighted Average ARC Experience, FY01-FY13
(Shortfall) or Surplus (in thousands)
Actuarial Cost Method
Investment Return
Assumption
Michigan Municipal 110.9% $296,570 Entry age 8.0%
Michigan Public Schools 85.3% ($2,109,287) Entry age 8.0%
Michigan SERS 81.9% ($777,669) Entry age 8.0%
MI Municipal ARC Experience
NASRA: The ARC Experience of State Retirement Plans, FY 01 to FY 13, March 2015 42

MI Public Schools ARC Experience
MI SERS ARC Experience
NASRA: The ARC Experience of State Retirement Plans, FY 01 to FY 13, March 2015 43
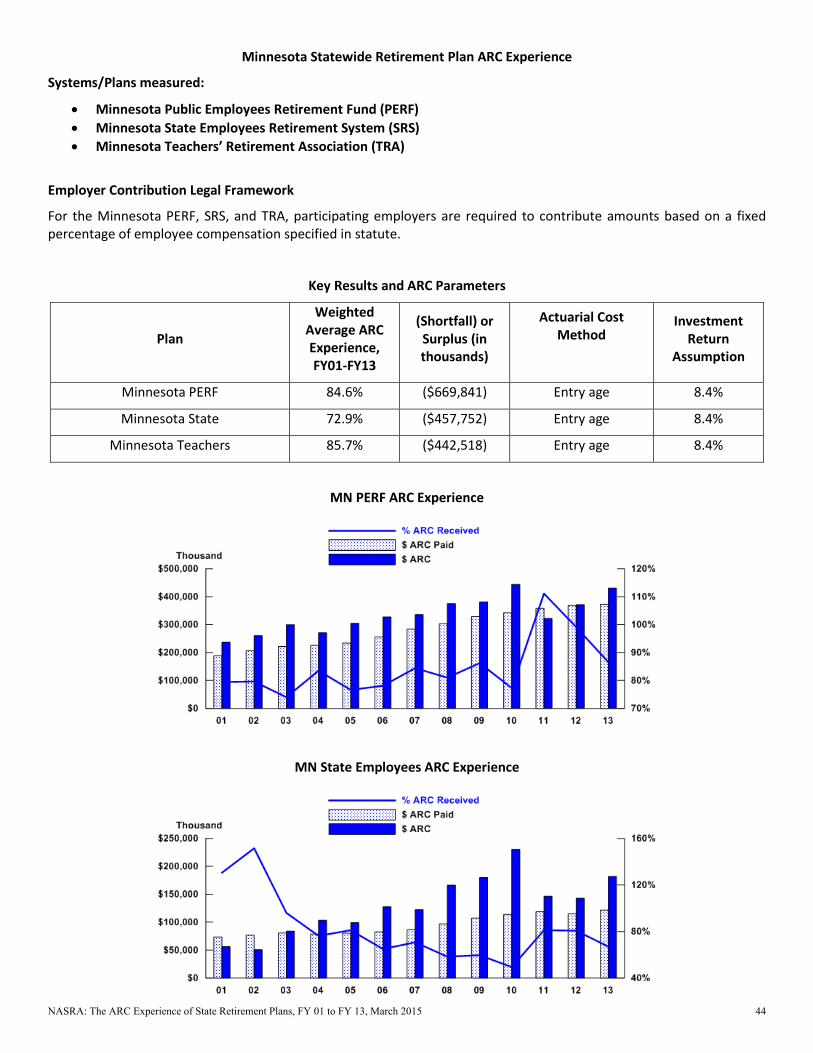
Minnesota Statewide Retirement Plan ARC Experience
Systems/Plans measured:
• Minnesota Public Employees Retirement Fund (PERF) • Minnesota State Employees Retirement System (SRS) • Minnesota Teachers’ Retirement Association (TRA)
Employer Contribution Legal Framework
For the Minnesota PERF, SRS, and TRA, participating employers are required to contribute amounts based on a fixed percentage of employee compensation specified in statute.
Key Results and ARC Parameters
Plan
Weighted Average ARC Experience, FY01-FY13
(Shortfall) or Surplus (in thousands)
Actuarial Cost Method
Investment Return
Assumption
Minnesota PERF 84.6% ($669,841) Entry age 8.4%
Minnesota State 72.9% ($457,752) Entry age 8.4%
Minnesota Teachers 85.7% ($442,518) Entry age 8.4%
MN PERF ARC Experience
MN State Employees ARC Experience
NASRA: The ARC Experience of State Retirement Plans, FY 01 to FY 13, March 2015 44

MN Teachers ARC Experience
NASRA: The ARC Experience of State Retirement Plans, FY 01 to FY 13, March 2015 45

Missouri Statewide Retirement Plan ARC Experience
Systems/Plans measured:
• Missouri Department of Transportation and Highway Patrol Employees’ Retirement System
• Missouri Local Government Employees’ Retirement System (LAGERS)
• Missouri Public Education Employee Retirement System (PEERS)
• Missouri State Employees Retirement System (SERS)
• Missouri Teachers
Employer Contribution Legal Framework
Employers participating in the Missouri SERS, PEERS, and DoT & Highway Patrol Retirement System are required by statute to fund the actuarially determined contribution. Statute imposes a limitation of one-half percent of the prior year’s contribution rate on the increase of the required rate for PEERS employers.
Employers participating in the Missouri LAGERS are required by statute to fund the actuarially determined contribution. Statute imposes a limitation of one percent of the prior year’s contribution rate on the increase of the required rate for LAGERS employers.
Employers participating in the Missouri Teachers plan are required to fund an amount equal to a fixed percentage of employee compensation specified in statute.
Key Results and ARC Parameters
Plan
Weighted Average ARC Experience, FY01-FY13
(Shortfall) or Surplus (in thousands)
Actuarial Cost Method
Investment Return
Assumption
Missouri DOT & Highway Patrol 100% $0 Entry age 7.75%
Missouri Local 100% $0 Entry age 7.25%
Missouri PEERS 90.6% ($93,571) Entry age 8.0%
Missouri State Employees 100% $0 Entry age 8.0%
Missouri Teachers 85.0% ($1,090,426) Entry age 8.0%
MO DoT & Highway Patrol ARC Experience
NASRA: The ARC Experience of State Retirement Plans, FY 01 to FY 13, March 2015 46
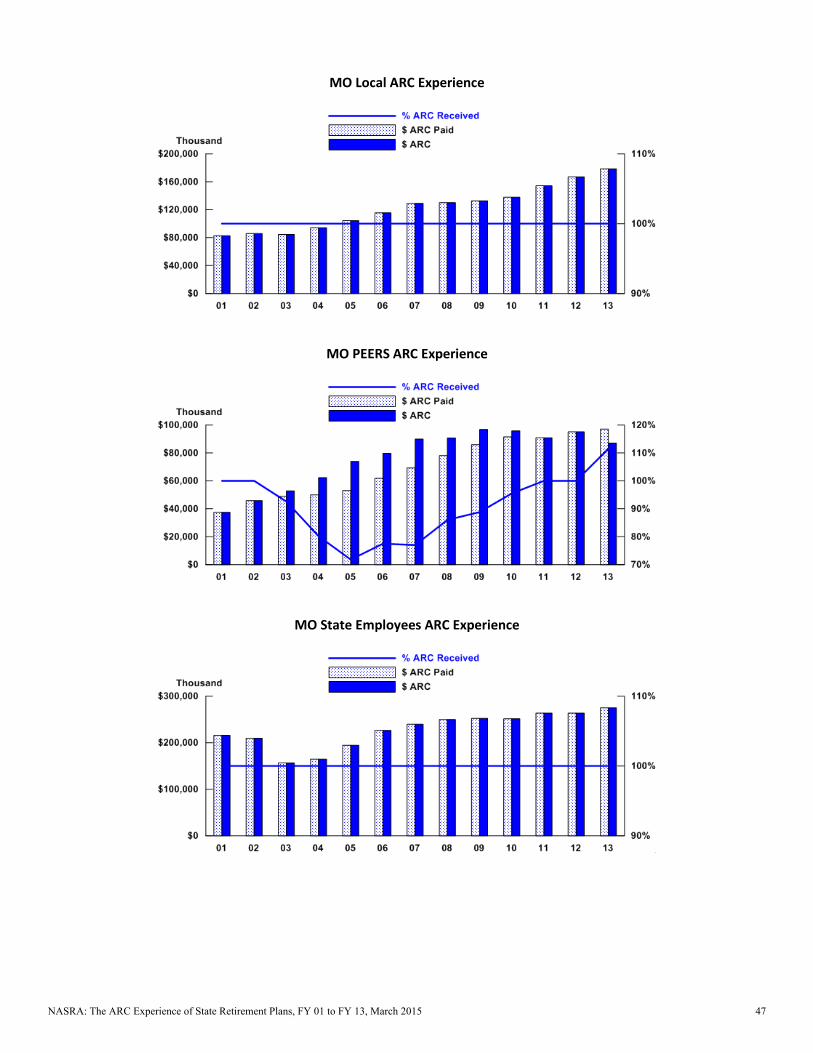
MO Local ARC Experience
MO PEERS ARC Experience
MO State Employees ARC Experience
NASRA: The ARC Experience of State Retirement Plans, FY 01 to FY 13, March 2015 47

MO Teachers ARC Experience
NASRA: The ARC Experience of State Retirement Plans, FY 01 to FY 13, March 2015 48
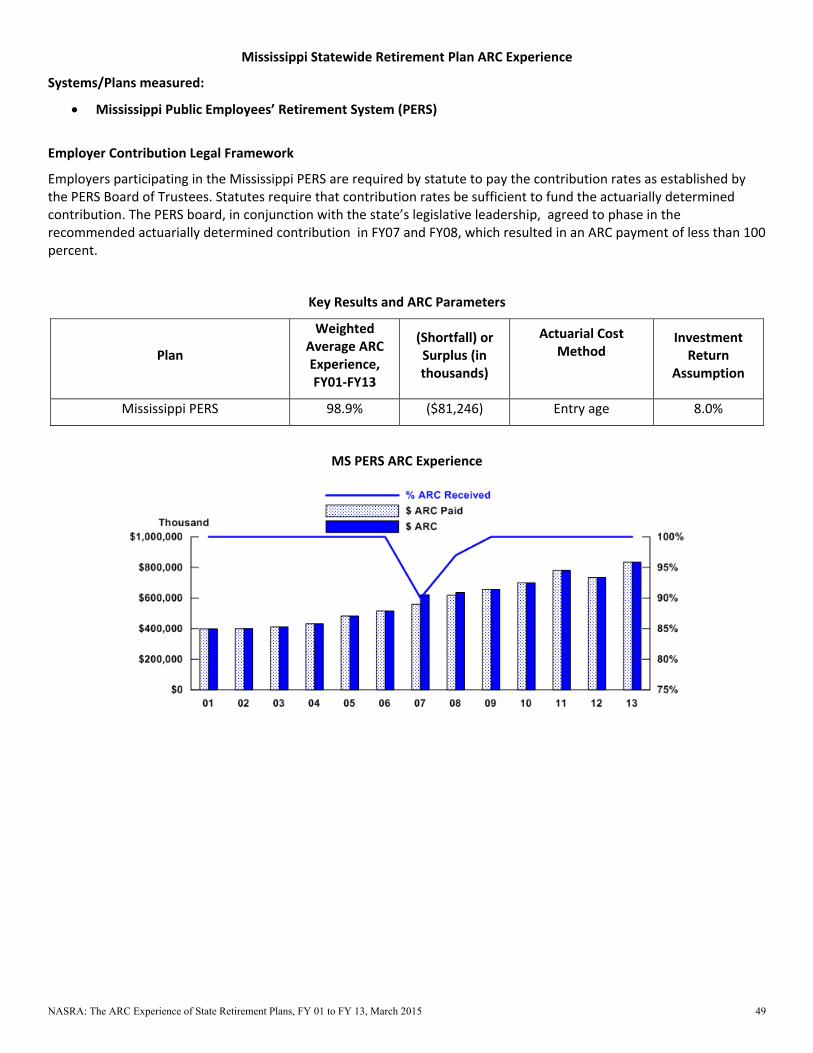
Mississippi Statewide Retirement Plan ARC Experience
Systems/Plans measured:
Mississippi Public Employees’ Retirement System (PERS)
Employer Contribution Legal Framework
Employers participating in the Mississippi PERS are required by statute to pay the contribution rates as established by the PERS Board of Trustees. Statutes require that contribution rates be sufficient to fund the actuarially determined contribution. The PERS board, in conjunction with the state’s legislative leadership, agreed to phase in the recommended actuarially determined contribution in FY07 and FY08, which resulted in an ARC payment of less than 100 percent.
Key Results and ARC Parameters
Plan
Weighted Average ARC Experience, FY01‐FY13
(Shortfall) or Surplus (in thousands)
Actuarial Cost Method
Investment Return
Assumption
Mississippi PERS 98.9% ($81,246) Entry age 8.0%
MS PERS ARC Experience
NASRA: The ARC Experience of State Retirement Plans, FY 01 to FY 13, March 2015 49

Montana Statewide Retirement Plan ARC Experience
Systems/Plans measured:
• Montana Public Employees’ Retirement System (PERS) • Montana Teachers’ Retirement System (TRS)
Employer Contribution Legal Framework
For the Montana PERS and TRS, participating employers are required to contribute an amount equal to a fixed percentage of employee compensation specified in statute. In FY 06, the legislature approved a one-time payment to the Teachers plan to reduced its unfunded liability.
2013 legislation directs a portion of the state’s coal severance tax to reducing the state’s unfunded pension liabilities.
Key Results and ARC Parameters
Plan
Weighted Average ARC Experience, FY01-FY13
(Shortfall) or Surplus (in thousands)
Actuarial Cost Method
Investment Return
Assumption
Montana PERS 99.5% ($5,287) Entry age 7.75%
Montana Teachers 114.6% $158,114 Entry age 7.75%
MT PERS ARC Experience
MT Teachers ARC Experience
NASRA: The ARC Experience of State Retirement Plans, FY 01 to FY 13, March 2015 50

North Carolina Statewide Retirement Plan ARC Experience
Systems/Plans measured:
• North Carolina Local Government Employees’ Retirement System • North Carolina Teachers’ and State Employees’ Retirement System
Employer Contribution Legal Framework
Employers participating in the North Carolina Retirement Systems are required by statute to fund the actuarially determined contribution. In FY 11, the legislature reduced the state contribution as a budget-balancing measure.
Key Results and ARC Parameters
Plan
Weighted Average ARC Experience, FY01-FY13
(Shortfall) or Surplus (in thousands)
Actuarial Cost Method
Investment Return
Assumption
North Carolina Local 100.3% $10,568 Entry age 7.25%
North Carolina Teachers and State 94.4% ($329,014) Entry age 7.25%
NC Local Government ARC Experience
NC Teachers and State Employees ARC Experience
NASRA: The ARC Experience of State Retirement Plans, FY 01 to FY 13, March 2015 51
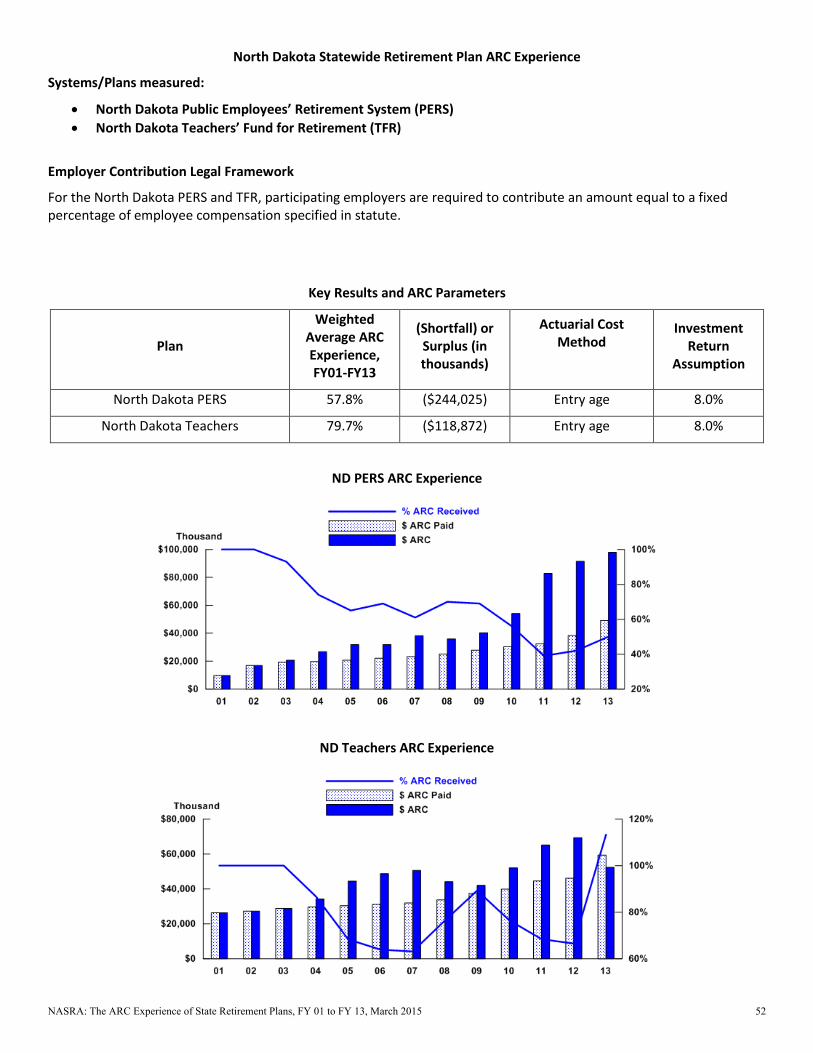
North Dakota Statewide Retirement Plan ARC Experience
Systems/Plans measured:
• North Dakota Public Employees’ Retirement System (PERS) • North Dakota Teachers’ Fund for Retirement (TFR)
Employer Contribution Legal Framework
For the North Dakota PERS and TFR, participating employers are required to contribute an amount equal to a fixed percentage of employee compensation specified in statute.
Key Results and ARC Parameters
Plan
Weighted Average ARC Experience, FY01-FY13
(Shortfall) or Surplus (in thousands)
Actuarial Cost Method
Investment Return
Assumption
North Dakota PERS 57.8% ($244,025) Entry age 8.0%
North Dakota Teachers 79.7% ($118,872) Entry age 8.0%
ND PERS ARC Experience
ND Teachers ARC Experience
NASRA: The ARC Experience of State Retirement Plans, FY 01 to FY 13, March 2015 52
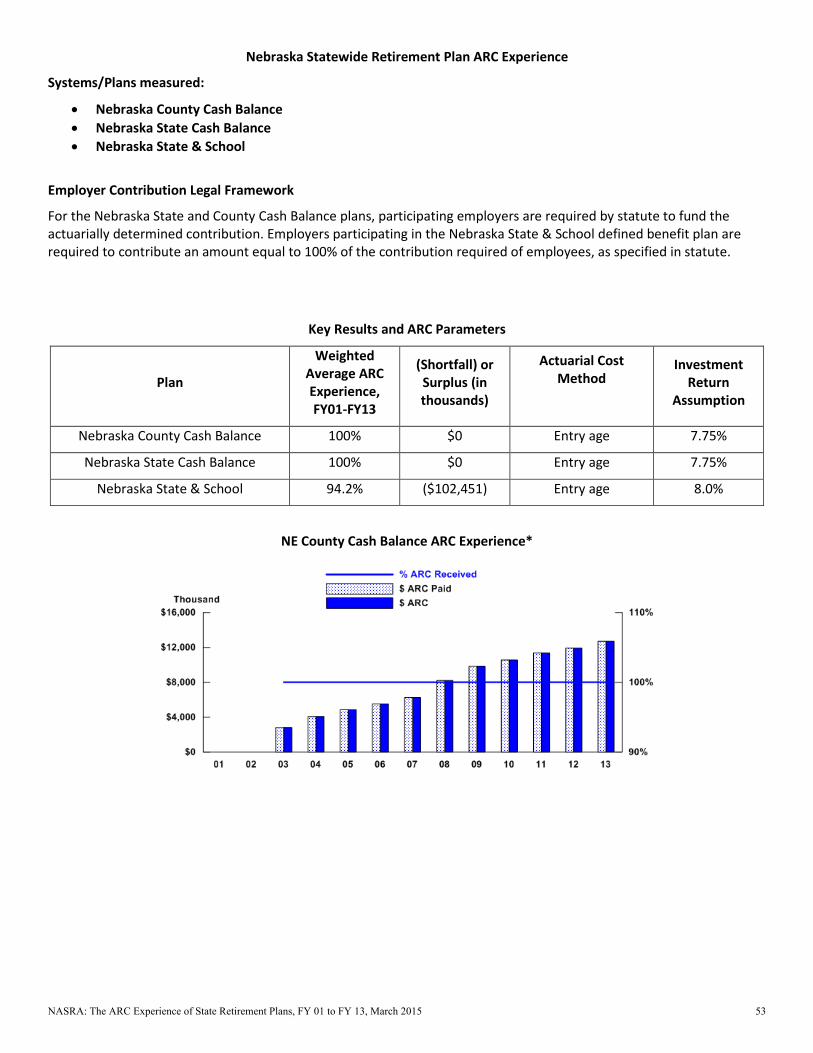
Nebraska Statewide Retirement Plan ARC Experience
Systems/Plans measured:
• Nebraska County Cash Balance • Nebraska State Cash Balance • Nebraska State & School
Employer Contribution Legal Framework
For the Nebraska State and County Cash Balance plans, participating employers are required by statute to fund the actuarially determined contribution. Employers participating in the Nebraska State & School defined benefit plan are required to contribute an amount equal to 100% of the contribution required of employees, as specified in statute.
Key Results and ARC Parameters
Plan
Weighted Average ARC Experience, FY01-FY13
(Shortfall) or Surplus (in thousands)
Actuarial Cost Method
Investment Return
Assumption
Nebraska County Cash Balance 100% $0 Entry age 7.75%
Nebraska State Cash Balance 100% $0 Entry age 7.75%
Nebraska State & School 94.2% ($102,451) Entry age 8.0%
NE County Cash Balance ARC Experience*
NASRA: The ARC Experience of State Retirement Plans, FY 01 to FY 13, March 2015 53
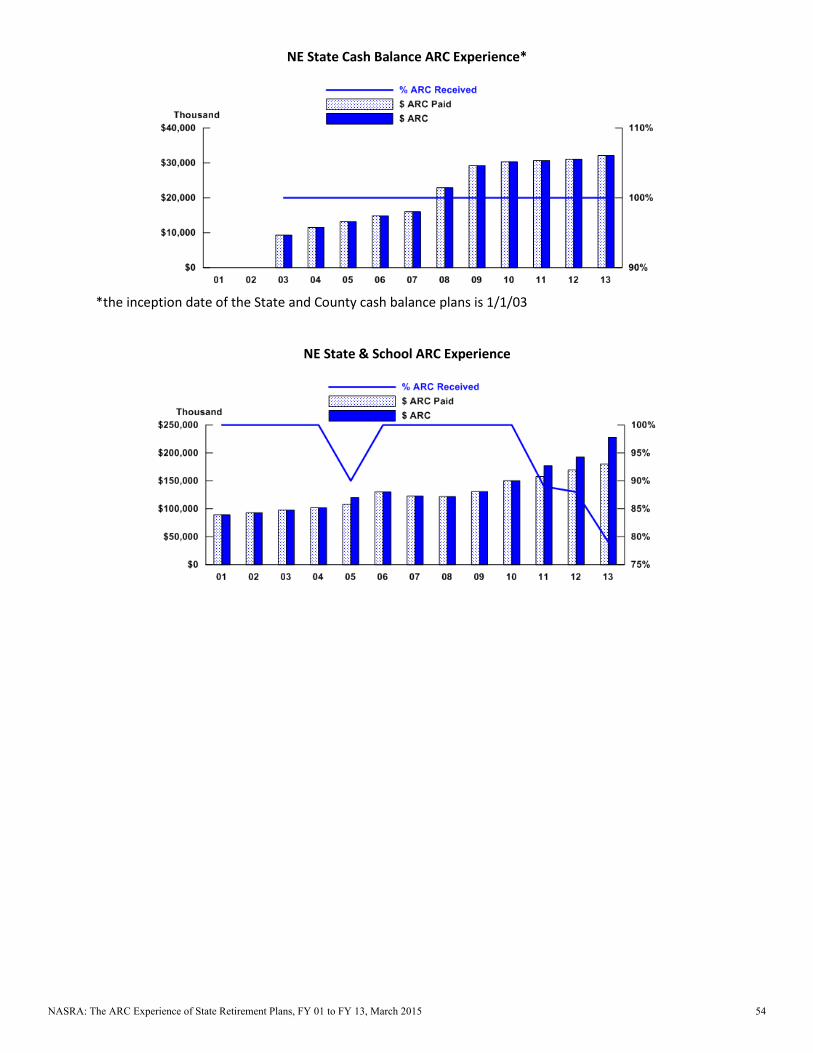
NE State Cash Balance ARC Experience*
*the inception date of the State and County cash balance plans is 1/1/03
NE State & School ARC Experience
NASRA: The ARC Experience of State Retirement Plans, FY 01 to FY 13, March 2015 54

New Hampshire Statewide Retirement Plan ARC Experience
Systems/Plans measured:
New Hampshire Retirement System
Employer Contribution Legal Framework
Employers participating in the New Hampshire Retirement System are required by statute and the state constitution to fully fund the actuarially determined contribution. NHRS reported an underfunded ARC in 2008‐09 because of an IRS compliance issue detected and addressed after the statutory deadline for certifying employer contribution rates had passed. Employers paid 100% of the employer contributions rates certified to them for fiscal years 2009 and 2008. The shortfall in the ARC paid by employers in 2008‐09 is being recovered through future employer rates beginning in fiscal year 2010, when separate and distinct rates were established for both the pension plan and the OPEB plans.
Key Results and ARC Parameters
Plan
Weighted Average ARC Experience, FY01‐FY13
(Shortfall) or Surplus (in thousands)
Actuarial Cost Method
Investment Return
Assumption
New Hampshire Retirement System 94.0% ($127,937) Entry age 7.75%
NH RS ARC Experience
NASRA: The ARC Experience of State Retirement Plans, FY 01 to FY 13, March 2015 55
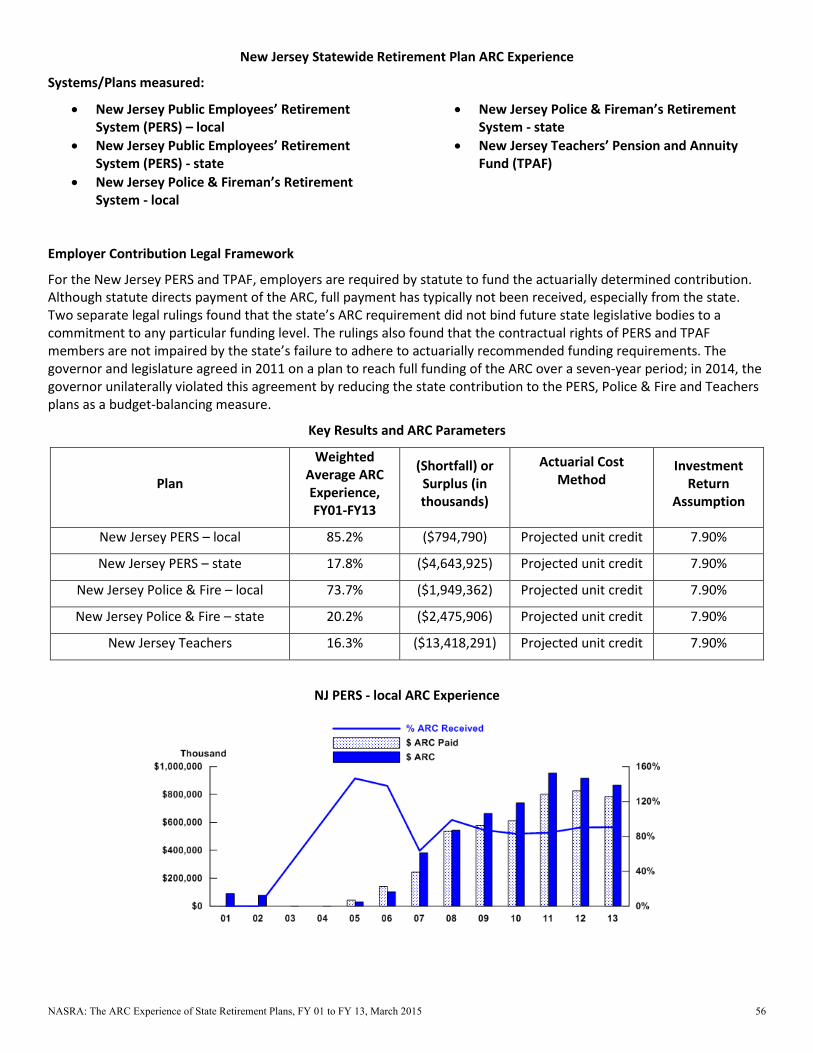
New Jersey Statewide Retirement Plan ARC Experience
Systems/Plans measured:
• New Jersey Public Employees’ Retirement System (PERS) – local
• New Jersey Public Employees’ Retirement System (PERS) - state
• New Jersey Police & Fireman’s Retirement System - local
• New Jersey Police & Fireman’s Retirement System - state
• New Jersey Teachers’ Pension and Annuity Fund (TPAF)
Employer Contribution Legal Framework
For the New Jersey PERS and TPAF, employers are required by statute to fund the actuarially determined contribution. Although statute directs payment of the ARC, full payment has typically not been received, especially from the state. Two separate legal rulings found that the state’s ARC requirement did not bind future state legislative bodies to a commitment to any particular funding level. The rulings also found that the contractual rights of PERS and TPAF members are not impaired by the state’s failure to adhere to actuarially recommended funding requirements. The governor and legislature agreed in 2011 on a plan to reach full funding of the ARC over a seven-year period; in 2014, the governor unilaterally violated this agreement by reducing the state contribution to the PERS, Police & Fire and Teachers plans as a budget-balancing measure.
Key Results and ARC Parameters
Plan
Weighted Average ARC Experience, FY01-FY13
(Shortfall) or Surplus (in thousands)
Actuarial Cost Method
Investment Return
Assumption
New Jersey PERS – local 85.2% ($794,790) Projected unit credit 7.90%
New Jersey PERS – state 17.8% ($4,643,925) Projected unit credit 7.90%
New Jersey Police & Fire – local 73.7% ($1,949,362) Projected unit credit 7.90%
New Jersey Police & Fire – state 20.2% ($2,475,906) Projected unit credit 7.90%
New Jersey Teachers 16.3% ($13,418,291) Projected unit credit 7.90%
NJ PERS - local ARC Experience
NASRA: The ARC Experience of State Retirement Plans, FY 01 to FY 13, March 2015 56
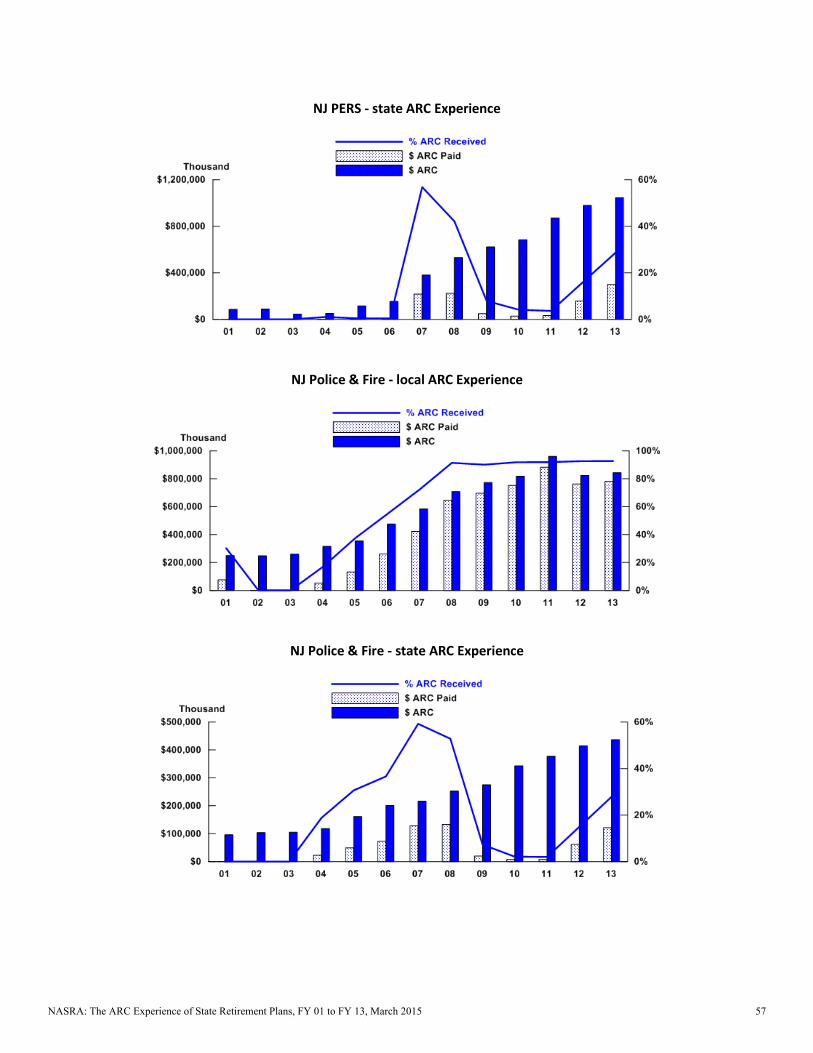
NJ PERS - state ARC Experience
NJ Police & Fire - local ARC Experience
NJ Police & Fire - state ARC Experience
NASRA: The ARC Experience of State Retirement Plans, FY 01 to FY 13, March 2015 57
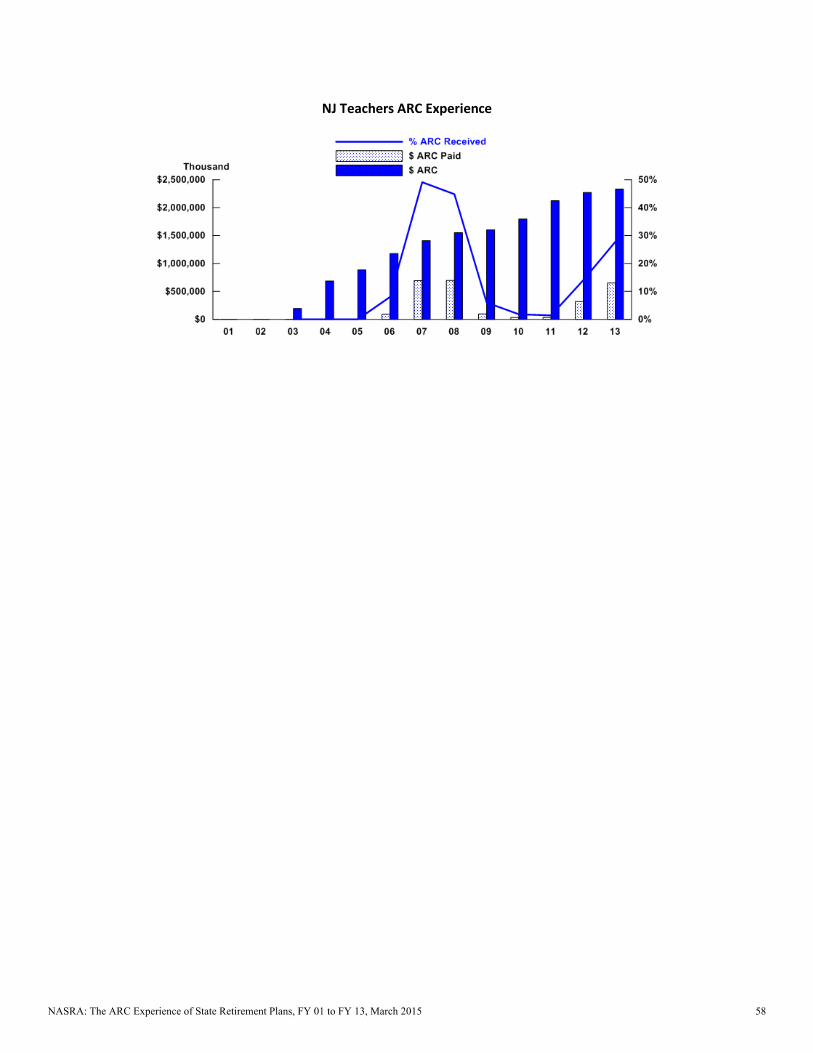
NJ Teachers ARC Experience
NASRA: The ARC Experience of State Retirement Plans, FY 01 to FY 13, March 2015 58
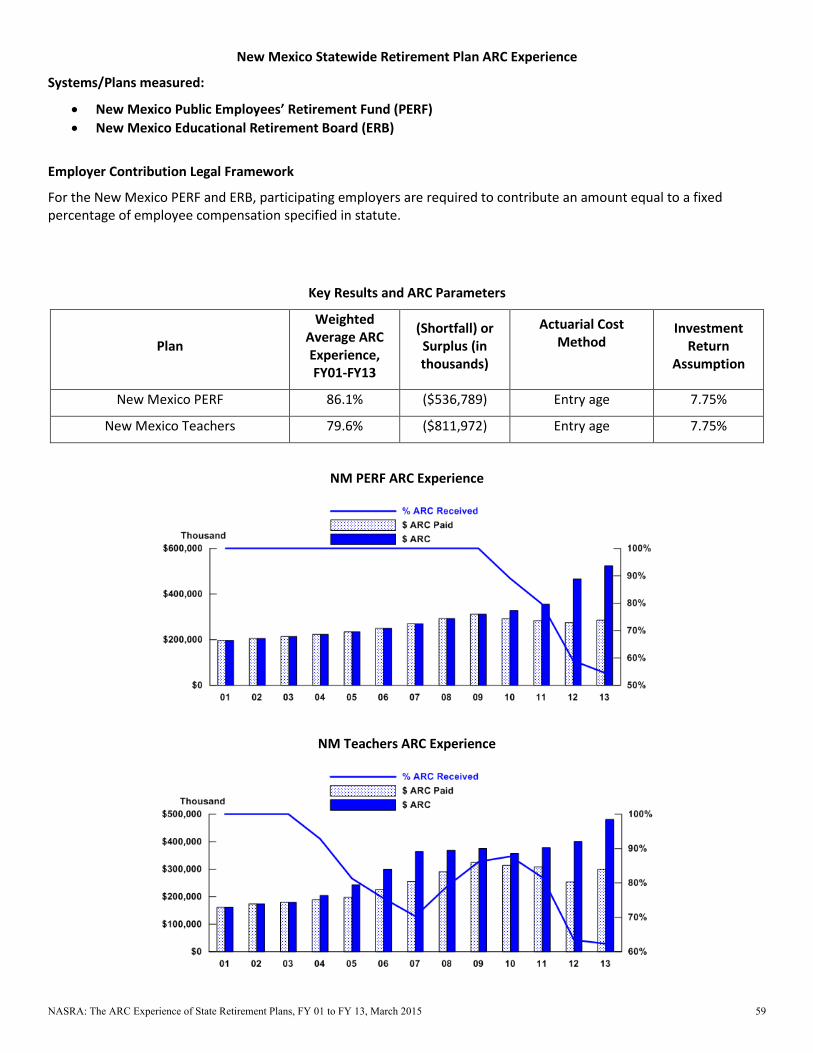
New Mexico Statewide Retirement Plan ARC Experience
Systems/Plans measured:
• New Mexico Public Employees’ Retirement Fund (PERF) • New Mexico Educational Retirement Board (ERB)
Employer Contribution Legal Framework
For the New Mexico PERF and ERB, participating employers are required to contribute an amount equal to a fixed percentage of employee compensation specified in statute.
Key Results and ARC Parameters
Plan
Weighted Average ARC Experience, FY01-FY13
(Shortfall) or Surplus (in thousands)
Actuarial Cost Method
Investment Return
Assumption
New Mexico PERF 86.1% ($536,789) Entry age 7.75%
New Mexico Teachers 79.6% ($811,972) Entry age 7.75%
NM PERF ARC Experience
NM Teachers ARC Experience
NASRA: The ARC Experience of State Retirement Plans, FY 01 to FY 13, March 2015 59

Nevada Statewide Retirement Plan ARC Experience
Systems/Plans measured:
• Nevada Police Officer and Firefighter • Nevada Regular Employees
Employer Contribution Legal Framework
Employers participating in the Nevada Public Employees’ Retirement System (PERS) are required by statute to fund the actuarially determined contribution. Differences between the ARC and amounts contributed are due to variations in the timing of the actuarial valuation and the legislative appropriations schedule.
Key Results and ARC Parameters
Plan
Weighted Average ARC Experience, FY01-FY13
(Shortfall) or Surplus (in thousands)
Actuarial Cost Method
Investment Return
Assumption
Nevada Police Officer and Firefighter 90.0% ($361,778) Entry age 8.0%
Nevada Regular Employees 94.1% ($636,878) Entry age 8.0%
NV Police Officer and Firefighter ARC Experience
NV Regular Employees ARC Experience
NASRA: The ARC Experience of State Retirement Plans, FY 01 to FY 13, March 2015 60
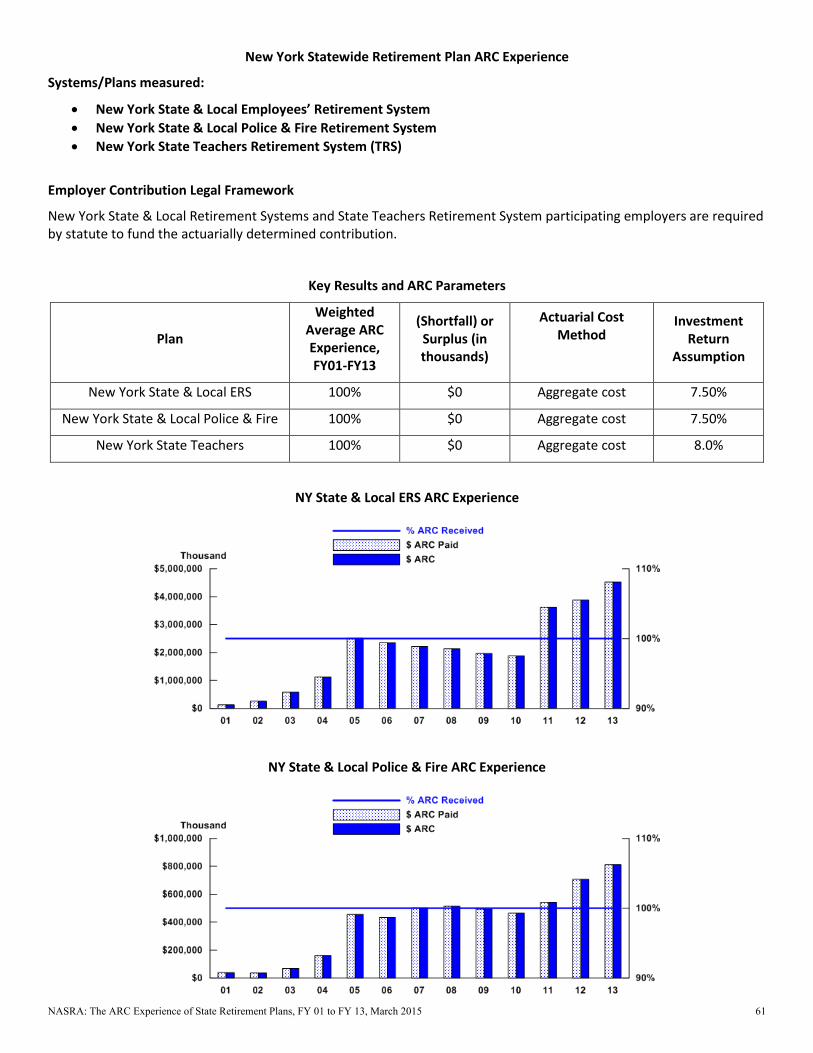
New York Statewide Retirement Plan ARC Experience
Systems/Plans measured:
• New York State & Local Employees’ Retirement System • New York State & Local Police & Fire Retirement System • New York State Teachers Retirement System (TRS)
Employer Contribution Legal Framework
New York State & Local Retirement Systems and State Teachers Retirement System participating employers are required by statute to fund the actuarially determined contribution.
Key Results and ARC Parameters
Plan
Weighted Average ARC Experience, FY01-FY13
(Shortfall) or Surplus (in thousands)
Actuarial Cost Method
Investment Return
Assumption
New York State & Local ERS 100% $0 Aggregate cost 7.50%
New York State & Local Police & Fire 100% $0 Aggregate cost 7.50%
New York State Teachers 100% $0 Aggregate cost 8.0%
NY State & Local ERS ARC Experience
NY State & Local Police & Fire ARC Experience
NASRA: The ARC Experience of State Retirement Plans, FY 01 to FY 13, March 2015 61

NY State Teachers ARC Experience
NASRA: The ARC Experience of State Retirement Plans, FY 01 to FY 13, March 2015 62
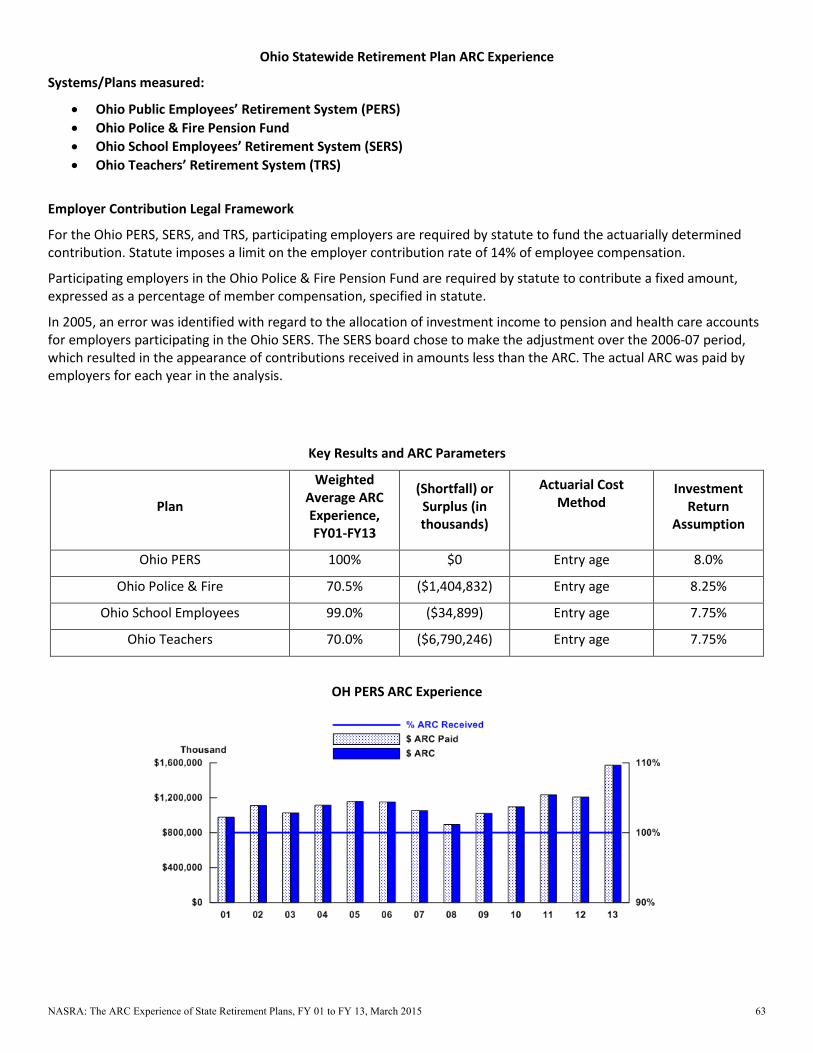
Ohio Statewide Retirement Plan ARC Experience
Systems/Plans measured:
• Ohio Public Employees’ Retirement System (PERS) • Ohio Police & Fire Pension Fund • Ohio School Employees’ Retirement System (SERS) • Ohio Teachers’ Retirement System (TRS)
Employer Contribution Legal Framework
For the Ohio PERS, SERS, and TRS, participating employers are required by statute to fund the actuarially determined contribution. Statute imposes a limit on the employer contribution rate of 14% of employee compensation.
Participating employers in the Ohio Police & Fire Pension Fund are required by statute to contribute a fixed amount, expressed as a percentage of member compensation, specified in statute.
In 2005, an error was identified with regard to the allocation of investment income to pension and health care accounts for employers participating in the Ohio SERS. The SERS board chose to make the adjustment over the 2006-07 period, which resulted in the appearance of contributions received in amounts less than the ARC. The actual ARC was paid by employers for each year in the analysis.
Key Results and ARC Parameters
Plan
Weighted Average ARC Experience, FY01-FY13
(Shortfall) or Surplus (in thousands)
Actuarial Cost Method
Investment Return
Assumption
Ohio PERS 100% $0 Entry age 8.0%
Ohio Police & Fire 70.5% ($1,404,832) Entry age 8.25%
Ohio School Employees 99.0% ($34,899) Entry age 7.75%
Ohio Teachers 70.0% ($6,790,246) Entry age 7.75%
OH PERS ARC Experience
NASRA: The ARC Experience of State Retirement Plans, FY 01 to FY 13, March 2015 63
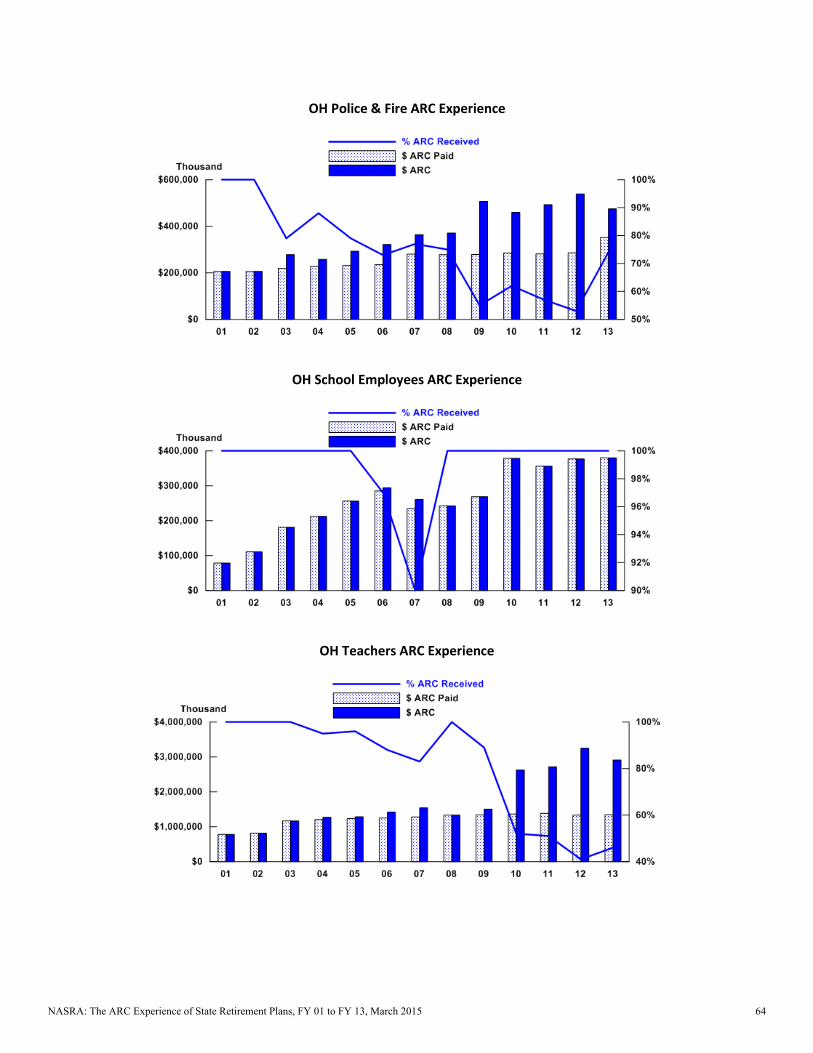
OH Police & Fire ARC Experience
OH School Employees ARC Experience
OH Teachers ARC Experience
NASRA: The ARC Experience of State Retirement Plans, FY 01 to FY 13, March 2015 64

Oklahoma Statewide Retirement Plan ARC Experience
Systems/Plans measured:
• Oklahoma Public Employees Retirement System (PERS) • Oklahoma Teachers Retirement System (TRS)
Employer Contribution Legal Framework
For the Oklahoma PERS and TRS, employers are required to fund an amount equal to a fixed percentage of employee compensation specified in statute.
The TRS receives an annual appropriation of five percent of the State’s sales, use and corporate and individual income taxes, as well as one percent of the cigarette taxes and five percent of the State’s net lottery proceeds. In 2013 the state established the Oklahoma Pension Stabilization Fund, to be funded with budget surplus monies, for the purpose of allocating funds to Oklahoma pension systems whose funding ratio is below ninety percent.
Key Results and ARC Parameters
Plan
Weighted Average ARC Experience, FY01-FY13
(Shortfall) or Surplus (in thousands)
Actuarial Cost Method
Investment Return
Assumption
Oklahoma PERS 68.5% ($1,177,786) Entry age 7.5%
Oklahoma Teachers 83.2% ($1,349,367) Entry age 8.0%
OK PERS ARC Experience
OK Teachers ARC Experience
NASRA: The ARC Experience of State Retirement Plans, FY 01 to FY 13, March 2015 65

Oregon Statewide Retirement Plan ARC Experience
Systems/Plans measured:
• Oregon Public Employees Retirement System (PERS)
Employer Contribution Legal Framework
Employers participating in the Oregon PERS are required by statute to fund the actuarially determined contribution. Contributions below 100 percent are due chiefly to variations in timing between the actuarial valuation date and the legislative appropriations schedule, and to the presence of a rate collar, which restricts the annual change in the contribution rate.
Key Results and ARC Parameters
Plan
Weighted Average ARC Experience, FY01-FY13
(Shortfall) or Surplus (in thousands)
Actuarial Cost Method
Investment Return
Assumption
Oregon PERS 86.1% ($1,311,784) Entry age 7.75%
OR PERS ARC Experience
NASRA: The ARC Experience of State Retirement Plans, FY 01 to FY 13, March 2015 66
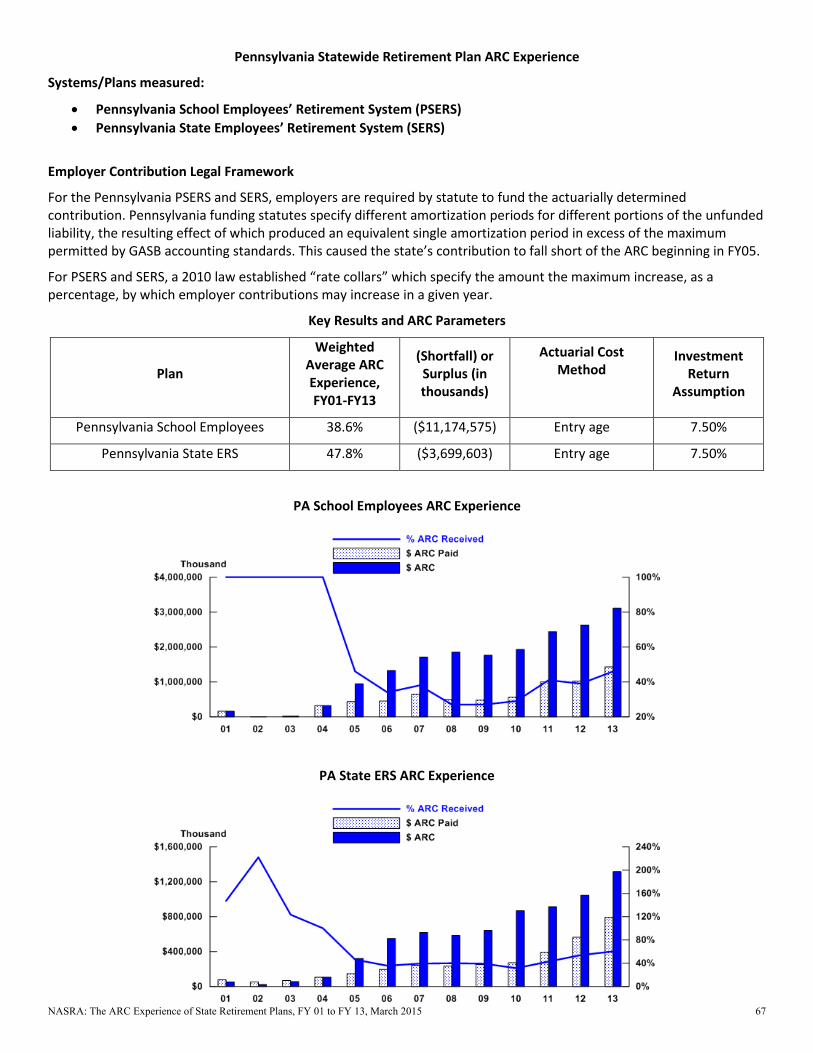
Pennsylvania Statewide Retirement Plan ARC Experience
Systems/Plans measured:
• Pennsylvania School Employees’ Retirement System (PSERS) • Pennsylvania State Employees’ Retirement System (SERS)
Employer Contribution Legal Framework
For the Pennsylvania PSERS and SERS, employers are required by statute to fund the actuarially determined contribution. Pennsylvania funding statutes specify different amortization periods for different portions of the unfunded liability, the resulting effect of which produced an equivalent single amortization period in excess of the maximum permitted by GASB accounting standards. This caused the state’s contribution to fall short of the ARC beginning in FY05.
For PSERS and SERS, a 2010 law established “rate collars” which specify the amount the maximum increase, as a percentage, by which employer contributions may increase in a given year.
Key Results and ARC Parameters
Plan
Weighted Average ARC Experience, FY01-FY13
(Shortfall) or Surplus (in thousands)
Actuarial Cost Method
Investment Return
Assumption
Pennsylvania School Employees 38.6% ($11,174,575) Entry age 7.50%
Pennsylvania State ERS 47.8% ($3,699,603) Entry age 7.50%
PA School Employees ARC Experience
PA State ERS ARC Experience
NASRA: The ARC Experience of State Retirement Plans, FY 01 to FY 13, March 2015 67
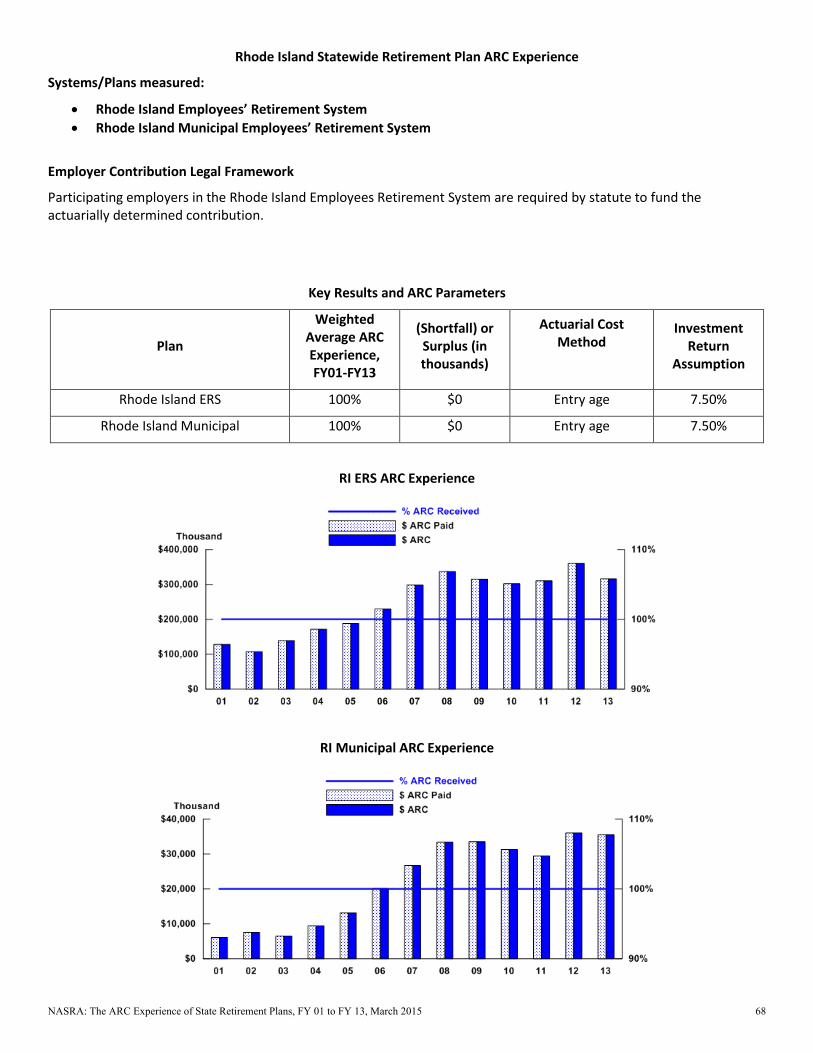
Rhode Island Statewide Retirement Plan ARC Experience
Systems/Plans measured:
• Rhode Island Employees’ Retirement System • Rhode Island Municipal Employees’ Retirement System
Employer Contribution Legal Framework
Participating employers in the Rhode Island Employees Retirement System are required by statute to fund the actuarially determined contribution.
Key Results and ARC Parameters
Plan
Weighted Average ARC Experience, FY01-FY13
(Shortfall) or Surplus (in thousands)
Actuarial Cost Method
Investment Return
Assumption
Rhode Island ERS 100% $0 Entry age 7.50%
Rhode Island Municipal 100% $0 Entry age 7.50%
RI ERS ARC Experience
RI Municipal ARC Experience
NASRA: The ARC Experience of State Retirement Plans, FY 01 to FY 13, March 2015 68

South Carolina Statewide Retirement Plan ARC Experience
Systems/Plans measured:
• South Carolina Police • South Carolina Retirement System (RS)
Employer Contribution Legal Framework
Employers participating in the South Carolina Retirement Systems are required by statute to fund the actuarially determined contribution.
Key Results and ARC Parameters
Plan
Weighted Average ARC Experience, FY01-FY13
(Shortfall) or Surplus (in thousands)
Actuarial Cost Method
Investment Return
Assumption
South Carolina Police 100% $0 Entry age 7.50%
South Carolina RS 100% $0 Entry age 7.50%
SC Police ARC Experience
SC RS ARC Experience
NASRA: The ARC Experience of State Retirement Plans, FY 01 to FY 13, March 2015 69
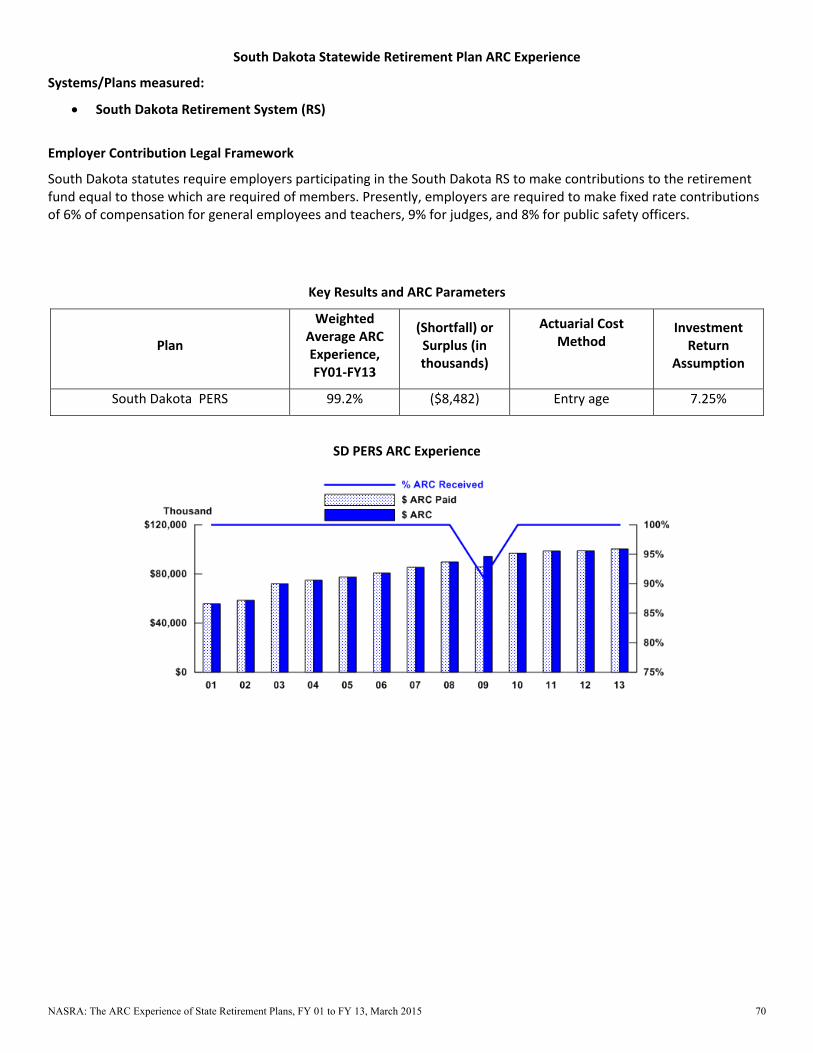
South Dakota Statewide Retirement Plan ARC Experience
Systems/Plans measured:
South Dakota Retirement System (RS)
Employer Contribution Legal Framework
South Dakota statutes require employers participating in the South Dakota RS to make contributions to the retirement fund equal to those which are required of members. Presently, employers are required to make fixed rate contributions of 6% of compensation for general employees and teachers, 9% for judges, and 8% for public safety officers.
Key Results and ARC Parameters
Plan
Weighted Average ARC Experience, FY01‐FY13
(Shortfall) or Surplus (in thousands)
Actuarial Cost Method
Investment Return
Assumption
South Dakota PERS 99.2% ($8,482) Entry age 7.25%
SD PERS ARC Experience
NASRA: The ARC Experience of State Retirement Plans, FY 01 to FY 13, March 2015 70

Texas Statewide Retirement Plan ARC Experience
Systems/Plans measured:
Texas County & District Retirement System
Texas Employees’ Retirement System (ERS)
Texas Municipal Retirement System (TMRS)
Texas Teachers Retirement System (TRS)
Employer Contribution Legal Framework
Statutes require employers of the Texas County & District and Texas Municipal Retirement systems to pay the actuarially determined contribution rate. Following a switch in its actuarial cost method that had the effect of increasing employer contribution rates, the TMRS permitted employers to elect to phase in the higher rates over an eight‐year period beginning in FY 2009. For the TRS and Teacher Retirement System of Texas, participating employers are required to fund a fixed percentage of compensation specified in statute. Except in cases of emergency, the Texas constitution restricts employer contributions for the TRS and ERS to no less than six percent of pay and no more than ten percent of pay.
In 2013, the Texas legislature adopted contribution rate increases for employers and school districts participating in the ERS and TRS that will be phased in over a four‐year period. For the TRS, the ultimate contribution rate (which includes increases to member contributions) is sufficient to amortize the remaining unfunded liability in less than 30 years.
Key Results and ARC Parameters
Plan
Weighted Average ARC Experience, FY01‐FY13
(Shortfall) or Surplus (in thousands)
Actuarial Cost Method
Investment Return
Assumption
Texas County & District 103.6% $195,380 Entry age 8.0%
Texas ERS 74.1% ($1,526,415) Entry age 8.0%
Texas Municipal 96.4% ($256,022) Entry age 7.0%
Texas Teachers 86.8% ($3,563,746) Entry age 8.0%
TX County & District ARC Experience
NASRA: The ARC Experience of State Retirement Plans, FY 01 to FY 13, March 2015 71

TX ERS ARC Experience
TX Municipal ARC Experience
TX Teachers ARC Experience
NASRA: The ARC Experience of State Retirement Plans, FY 01 to FY 13, March 2015 72

Tennessee Statewide Retirement Plan ARC Experience
Systems/Plans measured:
• TN State and Teachers • TN Political Subdivisions
Employer Contribution Legal Framework
Employers participating in the Tennessee Consolidated Retirement System are required by statute to fund the actuarially determined contribution.
Key Results and ARC Parameters
Plan
Weighted Average ARC Experience, FY01-FY13
(Shortfall) or Surplus (in thousands)
Actuarial Cost Method
Investment Return
Assumption
TN Political Subdivisions 100% $0 Entry age 7.50%
TN State and Teachers 100% $0 Entry age 7.50%
TN Political Subdivisions ARC Experience
TN State and Teachers ARC Experience
NASRA: The ARC Experience of State Retirement Plans, FY 01 to FY 13, March 2015 73

Utah Statewide Retirement Plan ARC Experience
Systems/Plans measured:
• Utah Noncontributory
Employer Contribution Legal Framework
Utah statutes require employers participating in the Utah Retirement Systems to fund the actuarially determined contribution.
Key Results and ARC Parameters
Plan
Weighted Average ARC Experience, FY01-FY13
(Shortfall) or Surplus (in thousands)
Actuarial Cost Method
Investment Return
Assumption
Utah Noncontributory 100% $0 Entry age 7.50%
Utah Noncontributory ARC Experience
NASRA: The ARC Experience of State Retirement Plans, FY 01 to FY 13, March 2015 74
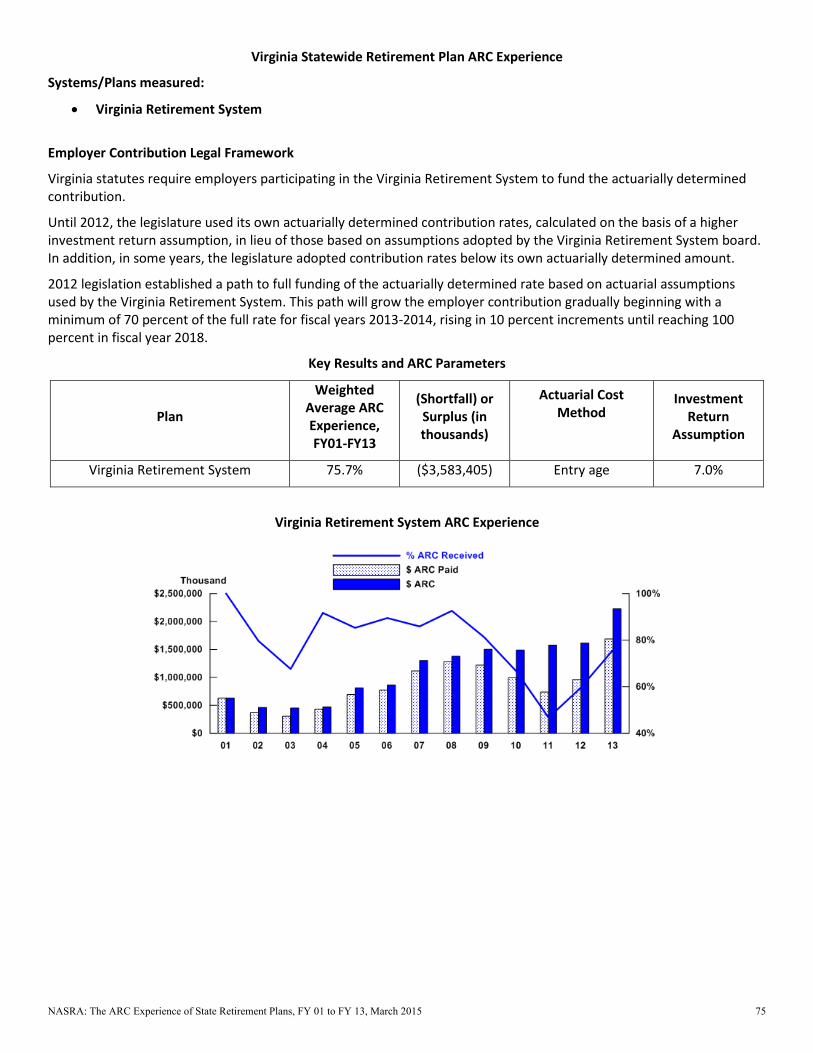
Virginia Statewide Retirement Plan ARC Experience
Systems/Plans measured:
• Virginia Retirement System
Employer Contribution Legal Framework
Virginia statutes require employers participating in the Virginia Retirement System to fund the actuarially determined contribution.
Until 2012, the legislature used its own actuarially determined contribution rates, calculated on the basis of a higher investment return assumption, in lieu of those based on assumptions adopted by the Virginia Retirement System board. In addition, in some years, the legislature adopted contribution rates below its own actuarially determined amount.
2012 legislation established a path to full funding of the actuarially determined rate based on actuarial assumptions used by the Virginia Retirement System. This path will grow the employer contribution gradually beginning with a minimum of 70 percent of the full rate for fiscal years 2013-2014, rising in 10 percent increments until reaching 100 percent in fiscal year 2018.
Key Results and ARC Parameters
Plan
Weighted Average ARC Experience, FY01-FY13
(Shortfall) or Surplus (in thousands)
Actuarial Cost Method
Investment Return
Assumption
Virginia Retirement System 75.7% ($3,583,405) Entry age 7.0%
Virginia Retirement System ARC Experience
NASRA: The ARC Experience of State Retirement Plans, FY 01 to FY 13, March 2015 75

Vermont Statewide Retirement Plan ARC Experience
Systems/Plans measured:
• Vermont State Employees Retirement System (SERS) • Vermont Teachers Retirement System (TRS)
Employer Contribution Legal Framework
For both Vermont SERS and TRS, statutes require employers to fund the actuarially determined contribution. Prior to 2006, the TRS used an actuarial cost method that understated the ARC relative to cost method being used, resulting in insufficient employer contributions. 2006 legislation changed the actuarial cost method for the TRS to entry age and required a commitment to full funding of the actuarially determined contribution beginning in FY 2007.
Key Results and ARC Parameters
Plan
Weighted Average ARC Experience, FY01-FY13
(Shortfall) or Surplus (in thousands)
Actuarial Cost Method
Investment Return
Assumption
Vermont State Employees 99.7% ($1,374) Entry age 8.1%
Vermont Teachers 88.2% ($59,669) Entry age 7.9%
VT State Employees ARC Experience
VT Teachers ARC Experience
NASRA: The ARC Experience of State Retirement Plans, FY 01 to FY 13, March 2015 76

Washington Statewide Retirement Plan ARC Experience
Systems/Plans measured:
• Washington Law Enforcement Officers’ and Fire Fighters’ (LEOFF) Plan 2
• Washington Public Employees’ Retirement System (PERS) Plan 1
• Washington Public Employees’ Retirement System (PERS) Plan 2/3
• Washington School Employees Retirement System (SERS) Plan 2/3
• Washington Teachers Retirement System (TRS) Plan 1
• Washington Teachers Retirement System (TRS) Plan 2/3
Employer Contribution Legal Framework
Contribution rates for most plans are approved by the Pension Funding Council, whose membership includes four legislators, the director of the Washington Department of Retirement Systems and the state office of financial management. The LEOFF Plan 2 board adopts rates for that plan.
PERS 1 and TRS 1 closed to new hires October 1, 1977.
Key Results and ARC Parameters
Plan
Weighted Average ARC Experience, FY01-FY13
(Shortfall) or Surplus (in thousands)
Actuarial Cost Method
Investment Return
Assumption
Washington LEOFF Plan 2 110.9% $116,821 Aggregate cost 7.5%
Washington PERS 1 36.4% ($3,287,769) Entry age 7.9%
Washington PERS 2/3 79.7% ($744,379) Aggregate cost 7.9%
Washington School Employees Plan 2/3 63.4% ($303,701) Aggregate cost 7.9%
Washington Teachers Plan 1 33.4% ($2,089,844) Entry age 7.9%
Washington Teachers Plan 2/3 69.4% ($626,445) Aggregate cost 7.9%
WA LEOFF Plan 2 ARC Experience
NASRA: The ARC Experience of State Retirement Plans, FY 01 to FY 13, March 2015 77

WA PERS 1 ARC Experience
WA PERS 2 ARC Experience
WA School Employees Plan 2/3 ARC Experience
NASRA: The ARC Experience of State Retirement Plans, FY 01 to FY 13, March 2015 78

WA Teachers Plan 1 ARC Experience
WA Teachers Plan 2/3 ARC Experience
NASRA: The ARC Experience of State Retirement Plans, FY 01 to FY 13, March 2015 79

Wisconsin Statewide Retirement Plan ARC Experience
Systems/Plans measured:
• Wisconsin Retirement System
Employer Contribution Legal Framework
Wisconsin statutes require employers participating in the Wisconsin Retirement System to fund the actuarially determined contribution.
Key Results and ARC Parameters
Plan
Weighted Average ARC Experience, FY01-FY13
(Shortfall) or Surplus (in thousands)
Actuarial Cost Method
Investment Return
Assumption
Wisconsin Retirement System 103.0% $239,970 Entry age 7.2%
Wisconsin Retirement System ARC Experience
NASRA: The ARC Experience of State Retirement Plans, FY 01 to FY 13, March 2015 80
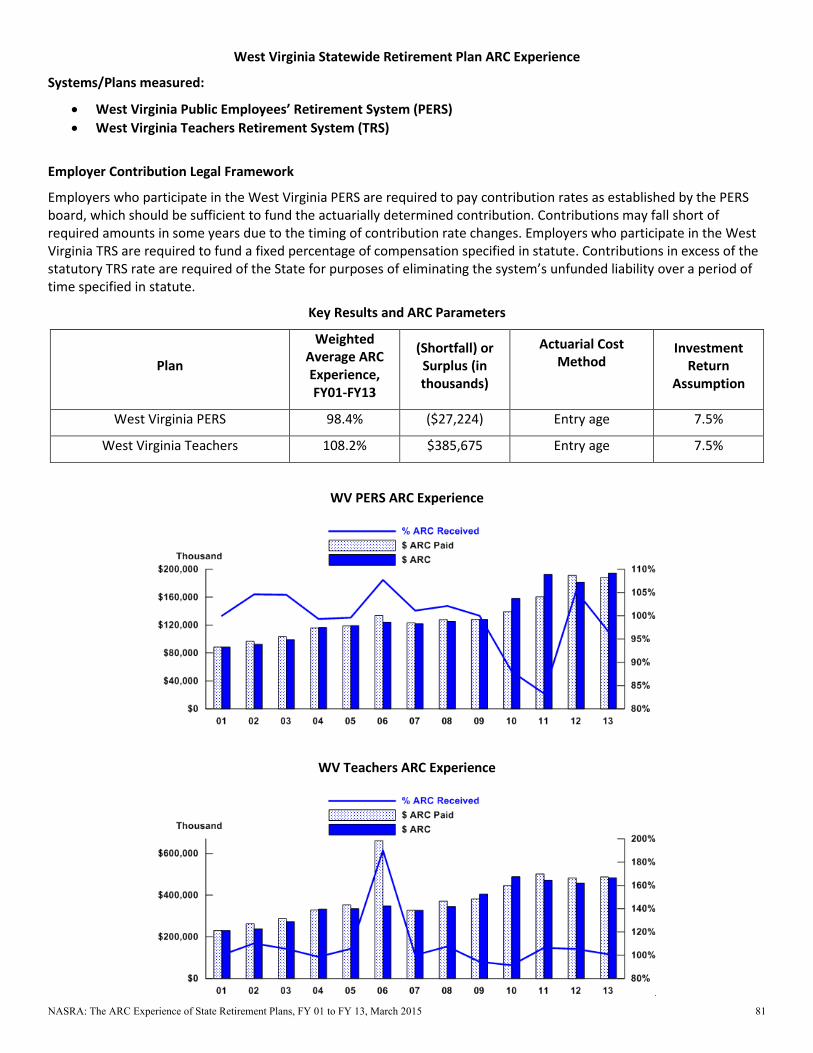
West Virginia Statewide Retirement Plan ARC Experience
Systems/Plans measured:
• West Virginia Public Employees’ Retirement System (PERS) • West Virginia Teachers Retirement System (TRS)
Employer Contribution Legal Framework
Employers who participate in the West Virginia PERS are required to pay contribution rates as established by the PERS board, which should be sufficient to fund the actuarially determined contribution. Contributions may fall short of required amounts in some years due to the timing of contribution rate changes. Employers who participate in the West Virginia TRS are required to fund a fixed percentage of compensation specified in statute. Contributions in excess of the statutory TRS rate are required of the State for purposes of eliminating the system’s unfunded liability over a period of time specified in statute.
Key Results and ARC Parameters
Plan
Weighted Average ARC Experience, FY01-FY13
(Shortfall) or Surplus (in thousands)
Actuarial Cost Method
Investment Return
Assumption
West Virginia PERS 98.4% ($27,224) Entry age 7.5%
West Virginia Teachers 108.2% $385,675 Entry age 7.5%
WV PERS ARC Experience
WV Teachers ARC Experience
NASRA: The ARC Experience of State Retirement Plans, FY 01 to FY 13, March 2015 81
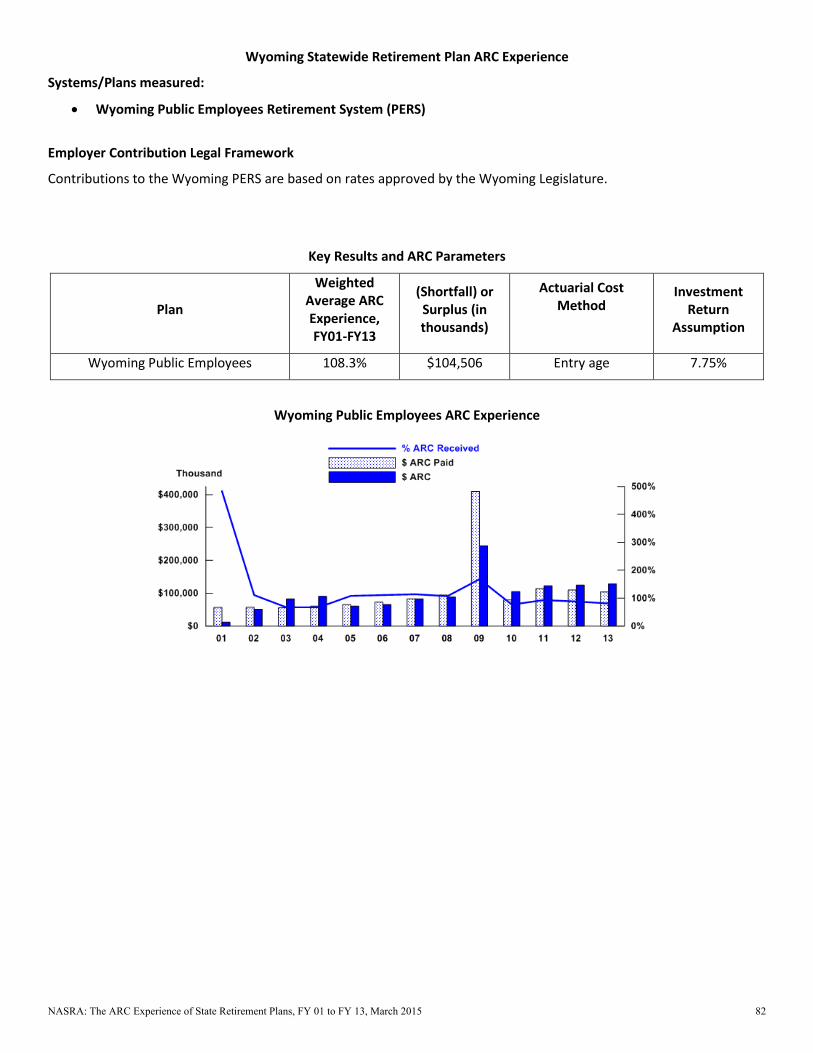
Wyoming Statewide Retirement Plan ARC Experience
Systems/Plans measured:
• Wyoming Public Employees Retirement System (PERS)
Employer Contribution Legal Framework
Contributions to the Wyoming PERS are based on rates approved by the Wyoming Legislature.
Key Results and ARC Parameters
Plan
Weighted Average ARC Experience, FY01-FY13
(Shortfall) or Surplus (in thousands)
Actuarial Cost Method
Investment Return
Assumption
Wyoming Public Employees 108.3% $104,506 Entry age 7.75%
Wyoming Public Employees ARC Experience
NASRA: The ARC Experience of State Retirement Plans, FY 01 to FY 13, March 2015 82

Contacts:
Keith Brainard, Research Director, 202.624.8464, [email protected] Alex Brown, Research Manager, 202.624.8461, [email protected]
nasra.org