the andrew w. mellon foundation · the andrew w. mellon foundation: ... archaic racial...
TRANSCRIPT

REPORT
The Andrew W. Mellon Foundation Art Museum Staff Demographic Survey
July 28, 2015
Roger Schonfeld Mariët Westermann With Liam Sweeney
The Andrew W. Mellon Foundation: Art Museum Staff Demographic Survey 1
The Andrew W. Mellon Foundation
endeavors to strengthen, promote,
and, where necessary, defend the
contributions of the humanities and
the arts to human flourishing and to
the wellbeing of diverse and
democratic societies.
Copyright 2015 The Andrew W. Mellon
Foundation. This work is licensed under a
Creative Commons Attribution-
NonCommercial 4.0 International
License. To view a copy of the license,
please see http://creative-
commons.org/licenses/by-nc/4.0/.
The Mellon Foundation encourages
distribution of the report. For questions,
please write to [email protected].

The Andrew W. Mellon Foundation: Art Museum Staff Demographic Survey 2
Introduction
In June 2013, the Andrew W. Mellon Foundation made a $2.07 million grant to the Los
Angeles County Museum of Art to enable the museum and four other major metropolitan
museums in the United States (Art Institute of Chicago, High Museum of Art, Museum
of Fine Arts, Houston, and Nelson-Atkins Museum of Art) to launch a pilot program of
undergraduate curatorial fellowships.1 The initiative was designed to open up the
museum as a potential workplace to students from historically underrepresented
minorities and other undergraduates who are committed to diversifying our cultural
organizations. At a time of unprecedented rates of demographic change in the United
States, the program was intended as an experiment in what may need to be a concerted
effort, supported by many organizations, to make the country’s art museums more
representative of the growing diversity of the American people. In each of its five sites,
the program met with enthusiastic responses, but also with questions. Why was such a
program needed? How did the art museums and the Mellon Foundation know that
demographic homogeneity was a problem in art museums?
To people familiar with the professional profiles of American art museums or with the
graduate programs that prepare students for jobs at the intellectual heart of museums,
the questions may seem naïve. Both the relative underrepresentation of people of color
on art museum staff and the preponderance of men in museum leadership positions are
well known phenomena, subject to regular discussion in the Association of Art Museum
Directors (AAMD), American Alliance of Museums (AAM), Association of Art Museum
Curators (AAMC), and Center for Curatorial Leadership. Nevertheless, the questions
focused the Foundation’s attention on the absence of reliable data about the
demographic makeup of art museum staff across the country. Aware of AAMD’s recent
finding of a pronounced gender gap in museum directorships,2 the Mellon Foundation
proposed partnering with AAMD to conduct a demographic survey of art museum staff
and boards. In the fall of 2014, the Foundation commissioned Ithaka S+R to design and
implement a survey with the assistance of an advisory committee of AAMD staff and
member museum leaders. AAM supported the effort by enabling distribution of the
survey to art museums that are not AAMD members. In the winter of 2015, 77% of
AAMD institutions and 15% of the additional AAM cohort completed the staff survey.
AAMD and AAM response rates for board diversity were considerably lower (38% and
4%, respectively), and too unrepresentative for inclusion in this report. While the report
below is generally limited to the AAMD respondents, the findings for the smaller AAM
1 http://www.lacma.org/node/13365. 2 Anne-Marie Gan et al., “The Gender Gap in Art Museum Directorships,” report of the Association of Art Museum
Directors and SMU National Center for Arts Research, March 7, 2014; available at
https://aamd.org/sites/default/files/document/The%20Gender%20Gap%20in%20Art%20Museum%20Directorships_0.pdf.
The Andrew W. Mellon Foundation: Art Museum Staff Demographic Survey 3
group are not substantively different from those for AAMD museums. More than 90% of
respondents were in the United States; there are a few institutions from Canada and
Mexico in the sample.
The results summarized by Ithaka S+R below lead to a range of conclusions, many of
which are perhaps best addressed by museums on the local level, as local and regional
demographics tend to differ considerably across the continent. The headline is
unsurprising: utilizing the categories employed by the 2000 U.S. Census, 72% of AAMD
staff is Non-Hispanic White, and 28% belongs to historically underrepresented
minorities.3 As the American population is today 62% Non-Hispanic White, the
overrepresentation of this group on museum staff may at first not seem as dramatic as
one might have expected. Ithaka S+R’s analysis shows, however, that there is significant
variation in demographic diversity across different types of museum employment. Non-
Hispanic White staff continue to dominate the job categories most closely associated
with the intellectual and educational mission of museums, including those of curators,
conservators, educators, and leadership (from director and chief curator to head of
education or conservation). In that subset of positions, 84% is Non-Hispanic White, 6%
Asian, 4% Black, 3% Hispanic White, and 3% Two or More Races. With the exception of
the Asian demographic category, which makes up 5% of the United States population
today, these proportions do not come close to representing the diversity of the American
population.
Two specific results point to pathways for diversifying museum leadership and the
positions that shape museums as venues of research and lifelong education. First,
progress is likely to be swifter and easier on gender equality than on minority
representation. As museum staff has become 60% female over the past decade or so,
there is now also a preponderance of women in the curatorial, conservation, and
educational roles that constitute the pipeline for leadership positions such as museum
director, chief curator, and head of conservation or education. With close attention to
equitable promotion and hiring practices for senior positions, art museums should be
able to achieve greater gender equality in their leadership cohorts within the foreseeable
future.
Second, there is no comparable “youth bulge” of staff from historically underrepresented
minorities in curatorial, education, or conservation departments. The percentages of
3 For the purposes of producing a baseline picture of the demographic composition of art museum staff in North America,
the survey employed the widely used racial and ethnic categories introduced in the 2000 U.S. Census. They are the most
convenient tool for measuring diversity, but there is a growing and cogent critique that they do not adequately capture the
true diversity of the American population. For an introduction to this problematic, see Kenneth Prewitt, “Fix the Census’
Archaic Racial Categories,” New York Times, August 22, 2013; Prewitt was director of the United States Census Bureau
from 1998 to 2000. The categorizations are of even more limited value for institutions in Canada and Mexico.

The Andrew W. Mellon Foundation: Art Museum Staff Demographic Survey 4
staff from underrepresented communities in such positions are basically level at 27.5%
across the different age cohorts born from the 1960s to 1990s. Therefore, even
promotion protocols that are maximally intentional about the organizational benefits of
diversity are not going to make museum leadership cohorts notably more diverse if there
is no simultaneous increase in the presence of historically underrepresented minorities
on museum staff altogether, and particularly in the professions that drive the museum’s
programs in collection development, research, exhibitions, and education. This finding
suggests that diverse educational pipelines into curatorial, conservation, and other art
museum careers are going to be critical if art museums wish to have truly diverse staff
and inclusive cultures. It also indicates that the nation will need more programs that
encourage students of color to pursue graduate education in preparation for museum
positions, such as the AAMD/UNCF diversity initiative and the undergraduate curatorial
fellowship program supported by the Mellon Foundation.
While the results of the 2015 art museum staff demographic survey may seem
discouraging, they provide baseline data against which future surveys can be measured,
and, one hopes, progress tracked. For their energetic and thoughtful collaboration on
the survey, the Mellon Foundation is deeply grateful to AAMD President Susan Taylor
and Executive Director Christine Anagnos, former AAM President Ford Bell, Director
Elizabeth Merritt of AAM’s Center for the Future of Museums, and all the directors and
HR directors of the art museums who responded to the survey and reacted to an initial
presentation of results at the 2015 AAMD annual meeting in Detroit. Directors of AAMD
member institutions lent invaluable advice to the Foundation and to Ithaka S+R; for
their time and insights, we thank Gail Andrews, Andrea Barnwell, Johnnetta Cole,
Timothy Rub, and Julián Zugazagoitia. At Ithaka S+R, Deanna Marcum, Roger
Schonfeld, and Liam Sweeney were tirelessly persistent and thoughtful in the design,
administration, and interpretation of the survey.
As a small beginning, the 2015 art museum staff demographic survey lends support to
the resolve of the many institutions that seek to mirror the country’s demographic
transformation and become fully inclusive of the interests of their diverse communities.
The case is clear and urgent, and constructive responses to it will be critical to the
continued vitality of art museums as public resources for a democratic society.
Mariët Westermann
Vice President
The Andrew W. Mellon Foundation
The Andrew W. Mellon Foundation: Art Museum Staff Demographic Survey 5
Methodology
Ithaka S+R developed the survey with the advice of AAMD museum leaders and HR
directors, AAMD staff, and Mellon Foundation program staff. The questionnaire was
split into three components: A spreadsheet that each museum was asked to fill out
indicating the demographic categories into which each of its employees fell; a survey
questionnaire targeted at HR directors, which focused on museum diversity programs;
and a survey questionnaire targeted at museum directors, which focused on board
member diversity and policy issues.
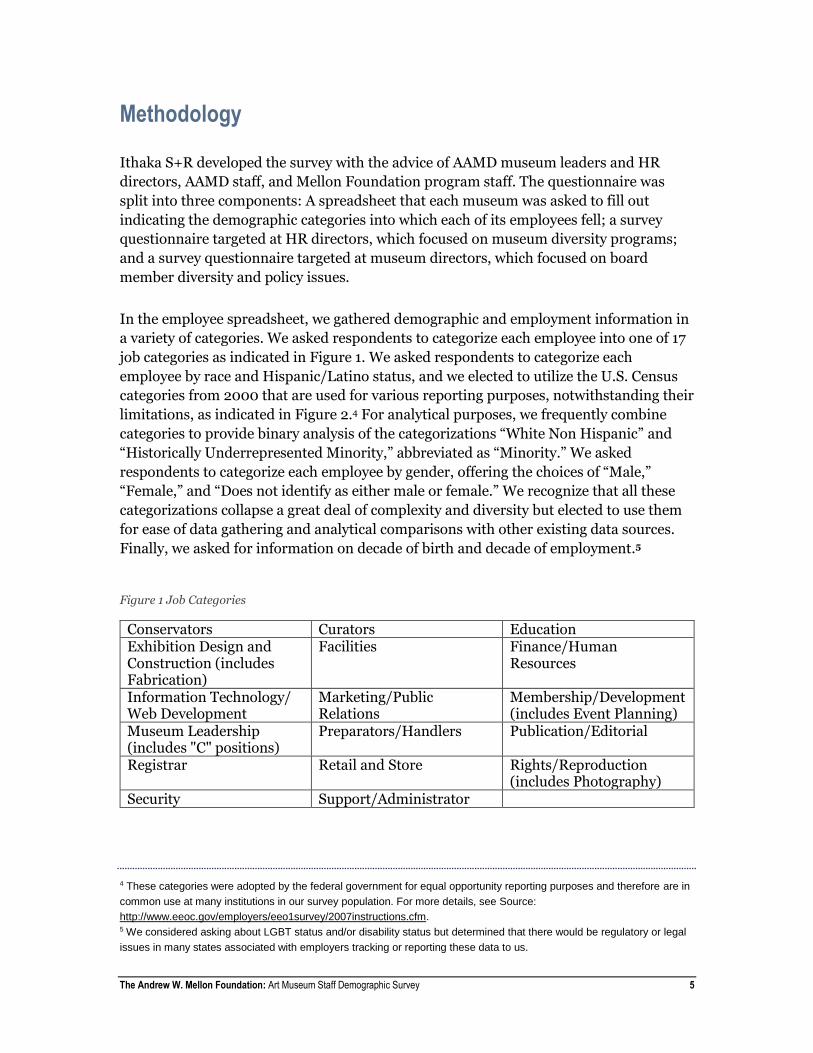
In the employee spreadsheet, we gathered demographic and employment information in
a variety of categories. We asked respondents to categorize each employee into one of 17
job categories as indicated in Figure 1. We asked respondents to categorize each
employee by race and Hispanic/Latino status, and we elected to utilize the U.S. Census
categories from 2000 that are used for various reporting purposes, notwithstanding their
limitations, as indicated in Figure 2.4 For analytical purposes, we frequently combine
categories to provide binary analysis of the categorizations “White Non Hispanic” and
“Historically Underrepresented Minority,” abbreviated as “Minority.” We asked
respondents to categorize each employee by gender, offering the choices of “Male,”
“Female,” and “Does not identify as either male or female.” We recognize that all these
categorizations collapse a great deal of complexity and diversity but elected to use them
for ease of data gathering and analytical comparisons with other existing data sources.
Finally, we asked for information on decade of birth and decade of employment.5
Figure 1 Job Categories
Conservators Curators Education Exhibition Design and Construction (includes Fabrication)
Facilities Finance/Human Resources
Information Technology/ Web Development
Marketing/Public Relations
Membership/Development (includes Event Planning)
Museum Leadership (includes "C" positions)
Preparators/Handlers Publication/Editorial
Registrar Retail and Store Rights/Reproduction (includes Photography)
Security Support/Administrator
4 These categories were adopted by the federal government for equal opportunity reporting purposes and therefore are in
common use at many institutions in our survey population. For more details, see Source:
http://www.eeoc.gov/employers/eeo1survey/2007instructions.cfm. 5 We considered asking about LGBT status and/or disability status but determined that there would be regulatory or legal
issues in many states associated with employers tracking or reporting these data to us.

The Andrew W. Mellon Foundation: Art Museum Staff Demographic Survey 6
Figure 2 Race and Ethnicity Categories
The survey was fielded from February 2, 2015 and was closed on March 13, 2015.
Invitation messages were sent to AAMD museums by Mellon vice president Mariët
Westermann and AAMD president Susan Taylor, and to other AAM art museums by vice
president Westermann and AAM president Ford Bell. Several reminder messages were
issued by the same individuals. The message to AAMD members indicated that the
survey was mandatory, and AAMD also conducted direct outreach to its members.
Response rates varied between the AAMD and AAM populations, and also by the
different survey components, as seen in Figure 3. In this overview report, we focus on
AAMD respondents, drawing demographic data from the employee spreadsheets. Those
findings are based on a 77% AAMD response rate to that component of the survey.
Race
• White – A person having origins in any of the original peoples of Europe, the
Middle East, or North Africa.
• Black or African American – A person having origins in any of the Black racial
groups of Africa.
• American Indian or Alaska Native – A person having origins in any of the
original peoples of North and South America (including Central America) and
who maintains tribal affiliation or community attachment.
• Asian – A person having origins in any of the original peoples of the Far East,
Southeast Asia, or the Indian subcontinent including, for example, Cambodia,
China, India, Japan, Korea, Malaysia, Pakistan, the Philippine Islands,
Thailand, and Vietnam.
• Native Hawaiian or Other Pacific Islander – A person having origins in any of
the original peoples of Hawaii, Guam, Samoa, or other Pacific Islands.
• Two or More Races – All persons who identify with more than one of the
above five races.
Hispanic or Latino – A person of Cuban, Mexican, Puerto Rican, South or Central
American, or other Spanish culture or origin regardless of race.
• Yes
• No

The Andrew W. Mellon Foundation: Art Museum Staff Demographic Survey 7
Figure 3 Levels of Response
AAM AAMD
Number Percent Number Percent
Total Art Museums 643 100% 235 100%
Spreadsheets Returned 97 15% 181 77%
HR Surveys Completed 105 16% 206 88%
Director Surveys Completed 27 4% 90 38%
Executive Summary: Race and Ethnicity
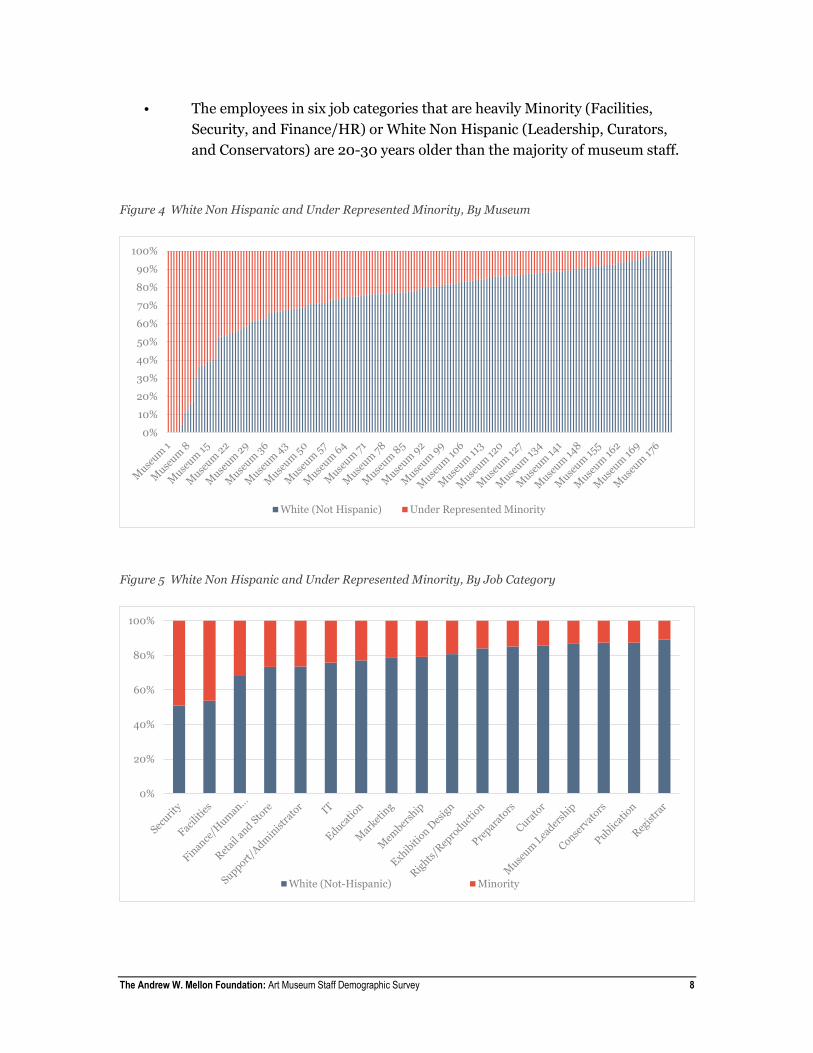
• In the aggregate, AAMD museum staff are 72% White Non Hispanic and 28%
Minority. Staff composition varies significantly across respondents, ranging
from 100% White Non Hispanic to 100% Minority, as illustrated in Figure 4.
Many but not all of the museums that are majority Minority are culturally
specific institutions. Some but not all of the museums that are 100% white are
located in geographical areas that may have comparatively lower Minority
populations.
• Many job categories are highly specific to White Non Hispanic employees or,
to a lesser extent, to Minority employees. As Figure 5 shows, Security and
Facilities staff are split fairly evenly between these two groupings. Other job
categories are majority White Non Hispanic, with approximately 9 out of 10
Registrar staff being White Non Hispanic. Figure 6 drills in on a subset of Job
Categories that includes Curators, Conservators, Educators, and Leadership
(a category that is broader than just the director to include other “C-level”
employees), showing that this group is 84% White Non Hispanic, 6% Asian,
4% Black, 3% White Hispanic, and 3% Two or More Races.
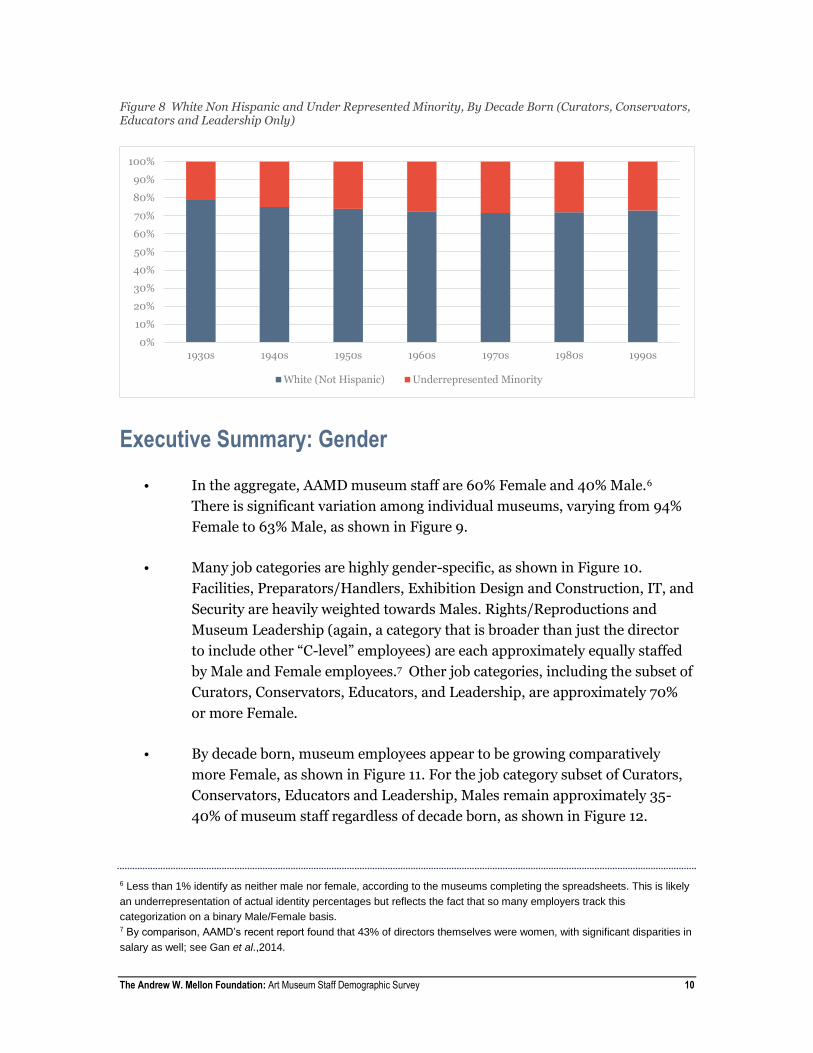
• In terms of year of birth, younger employee cohorts appear to be somewhat
more diverse. Of employees born in the 1930s, about 20% is minority; this
percentage grows to approximately 30 for employees born in the 1980s and
1990s, as shown in Figure 7. In the Job category subset (Figure 8) of
Curators, Conservators, Educators, and Leadership, the pattern of apparent
change is even more gradual, with percentages hovering around an almost
steady 27.5% for Minority employees born in the 1960s, 1970s, 1980s, and
1990s.
The Andrew W. Mellon Foundation: Art Museum Staff Demographic Survey 8
• The employees in six job categories that are heavily Minority (Facilities,
Security, and Finance/HR) or White Non Hispanic (Leadership, Curators,
and Conservators) are 20-30 years older than the majority of museum staff.
Figure 4 White Non Hispanic and Under Represented Minority, By Museum
Figure 5 White Non Hispanic and Under Represented Minority, By Job Category
0%
10%
20%
30%
40%
50%
60%
70%
80%
90%
100%
White (Not Hispanic) Under Represented Minority
0%
20%
40%
60%
80%
100%
White (Not-Hispanic) Minority

The Andrew W. Mellon Foundation: Art Museum Staff Demographic Survey 9
Figure 6 Race and Ethnicity (Curators, Conservators, Educators and Leadership Only)
Figure 7 White Non Hispanic and Under Represented Minority, By Decade of Birth
White (Not Hispanic)84%
Native Hawaiian
0%
Black4%
Asian6%
American Indian0%
White (Hispanic)3%
Two or More Races3%
0%
10%
20%
30%
40%
50%
60%
70%
80%
90%
100%
1930s 1940s 1950s 1960s 1970s 1980s 1990s
White (Not Hispanic) Underrepresented Minority
The Andrew W. Mellon Foundation: Art Museum Staff Demographic Survey 10
Figure 8 White Non Hispanic and Under Represented Minority, By Decade Born (Curators, Conservators, Educators and Leadership Only)
Executive Summary: Gender
• In the aggregate, AAMD museum staff are 60% Female and 40% Male.6
There is significant variation among individual museums, varying from 94%
Female to 63% Male, as shown in Figure 9.
• Many job categories are highly gender-specific, as shown in Figure 10.
Facilities, Preparators/Handlers, Exhibition Design and Construction, IT, and
Security are heavily weighted towards Males. Rights/Reproductions and
Museum Leadership (again, a category that is broader than just the director
to include other “C-level” employees) are each approximately equally staffed
by Male and Female employees.7 Other job categories, including the subset of
Curators, Conservators, Educators, and Leadership, are approximately 70%
or more Female.
• By decade born, museum employees appear to be growing comparatively
more Female, as shown in Figure 11. For the job category subset of Curators,
Conservators, Educators and Leadership, Males remain approximately 35-
40% of museum staff regardless of decade born, as shown in Figure 12.
6 Less than 1% identify as neither male nor female, according to the museums completing the spreadsheets. This is likely
an underrepresentation of actual identity percentages but reflects the fact that so many employers track this
categorization on a binary Male/Female basis. 7 By comparison, AAMD’s recent report found that 43% of directors themselves were women, with significant disparities in
salary as well; see Gan et al.,2014.
0%
10%
20%
30%
40%
50%
60%
70%
80%
90%
100%
1930s 1940s 1950s 1960s 1970s 1980s 1990s
White (Not Hispanic) Underrepresented Minority

The Andrew W. Mellon Foundation: Art Museum Staff Demographic Survey 11
These findings show a notable difference between race/ethnicity and gender in terms
of the availability of younger professionals to move into leadership positions over
time.
Figure 9 Gender, By Museum
Figure 10 Gender, By Job Category
0%
10%
20%
30%
40%
50%
60%
70%
80%
90%
100%
Female Male
0%
20%
40%
60%
80%
100%
Female Male

The Andrew W. Mellon Foundation: Art Museum Staff Demographic Survey 12
Figure 11 Gender, By Decade Born
Figure 12 Gender, By Decade Born (Curators, Conservators, Educators and Leadership Only)
0%
10%
20%
30%
40%
50%
60%
70%
80%
90%
100%
1930s 1940s 1950s 1960s 1970s 1980s 1990s
Female Male
0%
10%
20%
30%
40%
50%
60%
70%
80%
1930s 1940s 1950s 1960s 1970s 1980s 1990s
Female Male