the analysis of determinant of foreign direct investment
TRANSCRIPT
QE Journal │Vol.08 - No.01 - 50
THE ANALYSIS OF DETERMINANT OF FOREIGN DIRECT INVESTMENT IN INDONESIA
Etsuco Siomi1*), Wawan Hermawan2
1*) Postgraduate Program, Universitas Negeri Medan 2Faculty of Economics and Business Universitas Padjadjaran
Email: [email protected]
Abstract
The analysis results show that changes in macroeconomic conditions such as exchange rate, government expenditure and gross domestic product in Indonesia have a significant effect on foreign direct investment (FDI) Indonesia, while Inflation has a negative effect on foreign direct investment FDI and the monetary crisis has a negative effect on the development of FDI in Indonesia. So that the severe financial crisis in the American and European regions today, the impact on foreign direct investment (FDI) Indonesia is still within the limits of tolerance. Therefore, although there are still problems in the investment climate in Indonesia, the outlook for investment in Indonesia over the next period is still good, although perhaps with the growth of investment slows down. _________________________________ Key words: Foreign Direct Investment (FDI), Inflation, Exchange Rate, Government
Expenditure, Economic Growth, Multiple Linear. INTRODUCTION
ndonesia as a developing country needs a large enough fund to finance development. Investment can be used as a source of financing to cover the limitations of financing in Indonesia's economic development (Thirafi, 2013). In
addition to efforts to mobilize funds from within the country, efforts are also being made outside of government loans such as the flow of capital between countries in the form of foreign direct investment (Foreign Direct Investment), direct foreign investment will have an impact on economic growth in recipient countries, namely through direct capital transfers. , technology, managerial capabilities or those closely related to production efficiency issues and have an indirect impact through external spillover effects.
The history of the existence of foreign direct investment or foreign direct investment (hereinafter used the abbreviation FDI) in Indonesia has been started since the Dutch colonial government in 1870. This period was marked by the issuance of the Agrarian Law which then started the flow of FDI into Indonesia (Bank Indonesia, 1987) . The role of FDI in the economy in Indonesia from 1972-2012 reached 70 percent of total investment.
The development of foreign direct investment (FDI) in Indonesia is basically motivated by problems related to poor infrastructure, inefficient bureaucracy, limited access to funds, unfavorable labor regulations, unstable policies, not conducive tax regulations,
QE Journal │Vol.08 - No.01 - 51
lack of manpower. uneducated, inflation, corruption, foreign currency regulation, unstable government, tax too much, bad labor ethic, crime, and theft.
Foreign direct investment (FDI) as a flow of lending to, or buying ownership of, foreign companies, the majority of whose capital is owned by residents of the investing country. As an element of aggregate demand, an increase in the rate of investment in general has an effect on increasing the output of a country. So that foreign direct investment (FDI) has a positive effect on the economic development of a country. Conversely, a decrease in the rate of investment will result in lower economic growth. For this reason, the government intensively tries to attract investors to invest.
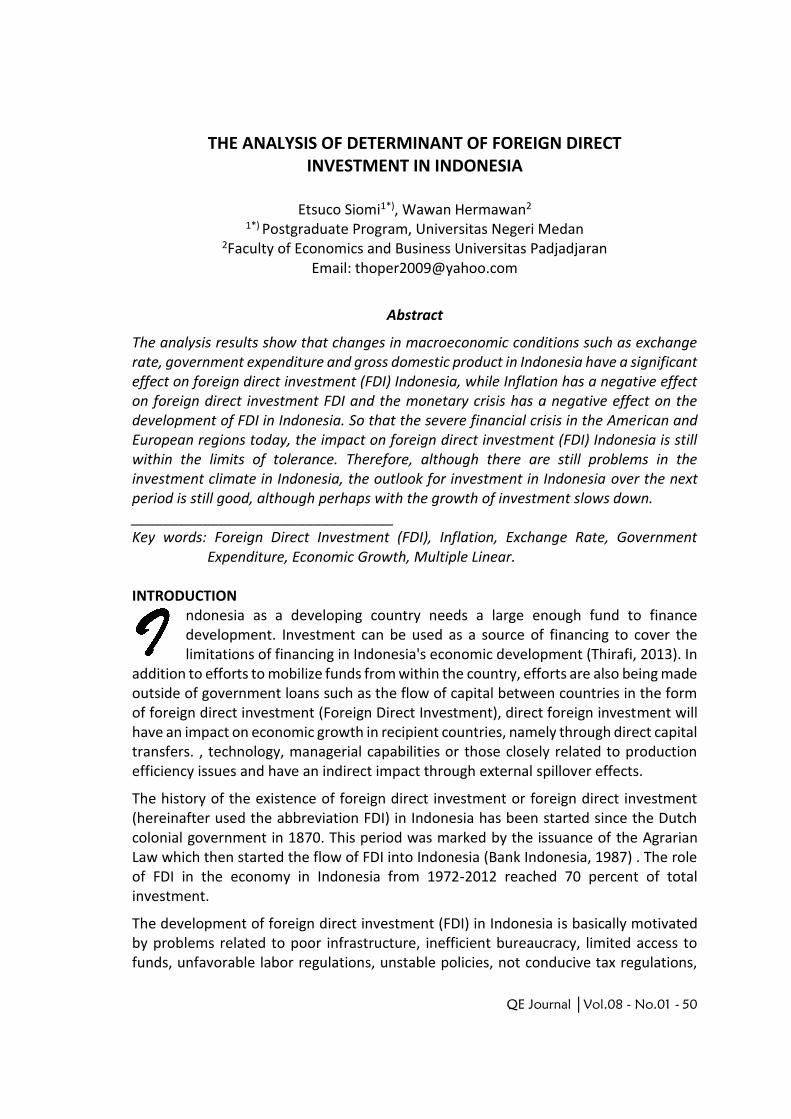
The conditions for the development of foreign direct investment (FDI) in Indonesia from 2009 to 2013 are presented in the following figure:
Figure 1: Foreign Direct Investment (FDI) Development Chart
The picture above shows that foreign direct investment (FDI) in Indonesia from 2009 to 2013 experienced fluctuating developments. Global economic shocks, such as those that have occurred recently, significantly affect the Indonesian economy. The global economic crisis that was still ongoing in 2009 put considerable pressure on monetary policy. The continuing global economic crisis prompted a fairly large flow of portfolio investment compared to foreign direct investment (FDI), which significantly depressed the Rupiah exchange rate and increased domestic banking risk.
The process of global economic recovery is getting stronger with the pace of economic growth returning but at an uneven pace. The confidence of economic actors, both at home and abroad, in the condition of the Indonesian economy continues to increase, thus encouraging increased foreign direct investment in Indonesia. So in 2010 the value of foreign direct investment (FDI) in Indonesia increased by US$ 16,214.80 billion, as a result of the return to confidence of economic actors, both at home and abroad, in Indonesia's economic conditions which continued to increase, thus encouraging an increase in foreign direct investment (FDI) in Indonesia.
Based on the UNCTAD report, the performance of FDI in Indonesia is the lowest compared to other ASEAN member countries, apart from Cambodia which also experienced a decline, all countries in Southeast Asia experienced growth in the value of foreign direct investment. (Setiawan, 2014).
QE Journal │Vol.08 - No.01 - 52
The global crisis, which began in the US in 2007, began to be increasingly felt throughout the world, including developing countries in 2008. In Indonesia, the effects of the crisis began to be felt especially towards the end of 2008. However, Indonesia's position in general was not the worst among other countries. . The occurrence of fluctuations in the amount of real interest rates in Indonesia is caused by inflation and government policies in determining the level of interest rates. The various dynamics that have occurred in the global economy have influenced developments in the Rupiah exchange rate.
Inflation is an important indicator in analyzing a country's economy, especially in relation to its broad impact on aggregate macroeconomic variables: economic growth, external balance, competitiveness, interest rates, and even income distribution. Inflation also plays a major role in influencing the mobilization of funds through formal financial institutions.
The price level is the opportunity cost for society to hold financial assets. The higher the change in the price level, the higher the opportunity cost to hold financial assets. This means that people will feel lucky if they hold assets in real form compared to financial assets if the price level remains high. If foreign financial assets are included as an asset option, the difference in the rate of domestic and international inflation can overvaluate the Rupiah exchange rate against foreign currencies and in turn will eliminate the competitiveness of Indonesian commodities.
The effect of inflation on investment activities has a negative relationship. Where a high inflation rate will reduce the level of investment due to the high cost of investment itself. Conversely, a low inflation rate will cause investment costs to be cheap so that it will stimulate foreign direct investment (FDI) in domestic countries. Therefore, investors will feel more secure to invest when the inflation rate in a country tends to be stable or low, in other words an increase in inflation will reduce investors' interest in investing, on the other hand, if inflation decreases, investment will increase (Nopirin, 2000).
Prior to the Asian financial crisis that hit the Indonesian economy in 1998, Bank Indonesia, as the institution responsible for the stability of the inflation rate, had early formulated and implemented monetary policy to maintain low inflation, as well as maintaining and managing exchange rate stability. However, in reality the achievement of the goal of maintaining exchange rate stability dominates the target of monetary policy, on the other hand, the achievement of growth in monetary magnitude and inflation is often neglected. Moreover, with the increase in capital inflows in the early 1990s, the target target of working on a money base became less controllable. With increasing pressure on the Rupiah, in August 1997 Bank Indonesia abandoned its intervention and floated the Rupiah exchange rate.
The effect of the exchange rate on investment occurs in several ways, namely through the demand side and the supply side. In the short term, a decrease in the exchange rate will reduce investment through its negative effect on domestic absorption or what is known as the expexditure reducing effect. This is because a decrease in the exchange rate will cause the real value of public assets due to an increase in the level of prices in

QE Journal │Vol.08 - No.01 - 53
general and will further reduce the domestic demand of the community. The above symptoms at the company level will be processed by a decrease in expenditure / capital allocation on investment. On the supply side, the effect of the expenditure switching aspect will change the exchange rate of investment relatively erratically. An exchange rate that is depreciating (weakening exchange rate) can increase foreign direct investment (FDI) because investors can invest at low prices with high yields.
For this reason, it is necessary to pay attention to the development of fundamental factors affecting foreign direct investment in Indonesia such as: Inflation, Exchange Rates, Government Expenditures and GDP which can be seen from the graph data presented below:
Figure 2: Graph of Inflation Development and the Rupiah Exchange Rate in Indonesia Source: Statistics Indonesia (processed)
In 2008, there was an increase in international commodity prices, which put strong pressure on inflation. In 2009, amidst the continuing improvement in the global economy, inflation decreased. Meanwhile, inflation in 2010 has increased. In 2011 to 2012 inflation was 4.30 percent. Amid the slowing trend in the domestic economy, inflation increased sharply by 8.38 percent as a result of the increase in subsidized fuel prices and rising food prices.
In 2010, the Rupiah exchange rate strengthened by an average of 3.8 percent by Rp 8,991 compared to the end of 2009 of Rp 9,400. However, from 2011 to 2013 the Rupiah exchange rate weakened. This is due to the deepening global financial crisis that has put pressure on the Rupiah and triggered tight global liquidity, thereby increasing risk perceptions of emerging markets, including Indonesia. In addition, investors' negative perceptions grew in line with the rising current account deficit and rising inflation expectations and the actual inflation rate which had risen sharply after the increase in subsidized fuel prices. The widening current account deficit did not prevent the Rupiah from moving on a weakening trend.
Another factor that is no less important is the active role of the government to continue to assist and facilitate the growth of these sectors, because without government support it will be difficult to develop against other sectors that have very large capacities to
QE Journal │Vol.08 - No.01 - 54
compete in the current free market era. The importance of the role of the Government in an economic system has been widely discussed in public economic theory. So far, there has been debate about how far the role the government should play. This is because everyone is different in their assessment of the cost of benefits obtained from programs made by the government. However, it cannot be denied that the life of the people has so far been very dependent on the services provided by the government. The government must be recognized and trusted to assume a bigger and more decisive role in efforts to manage the national economy in regulating government spending.
In the middle stage of economic development, government investment is still needed to increase economic growth so that it can take off, but at this stage the role of private investment is getting bigger. The role of the government remains large in the intermediate stage, because this growing role of the private sector causes many market failures, and also causes the government to provide public goods and services in large quantities and of better quality. In addition, at this stage economic development makes inter-sectoral relations increasingly complicated. For example, the economic growth caused by the development of the industrial sector has resulted in higher levels of air and water pollution, and the government must step in to regulate and reduce the negative impact of this pollution on society. The government must also protect workers who are in a weak position in order to improve their welfare.
Government spending that is aimed at creating future benefits, such as infrastructure investment or research spending, is referred to as gross fixed capital formation, or government investment, which is usually the largest share of government. The government takes over of goods and services through production (using government-owned labor, fixed assets and purchasing goods and services for intermediate consumption) or through the purchase of goods and services from the market. In economic theory or in macroeconomics, investment is the amount purchased per unit of goods that are not consumed but are used for future production (eg capital). Examples are railroads or factory construction.
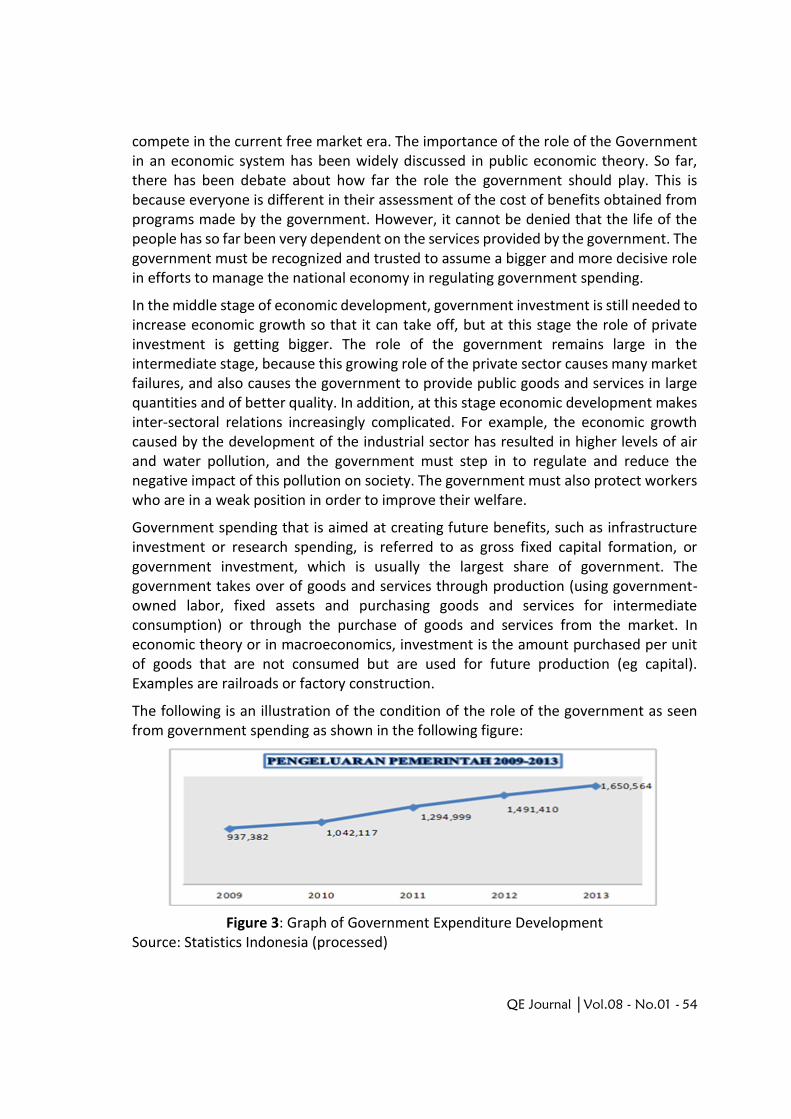
The following is an illustration of the condition of the role of the government as seen from government spending as shown in the following figure:
Figure 3: Graph of Government Expenditure Development Source: Statistics Indonesia (processed)
QE Journal │Vol.08 - No.01 - 55
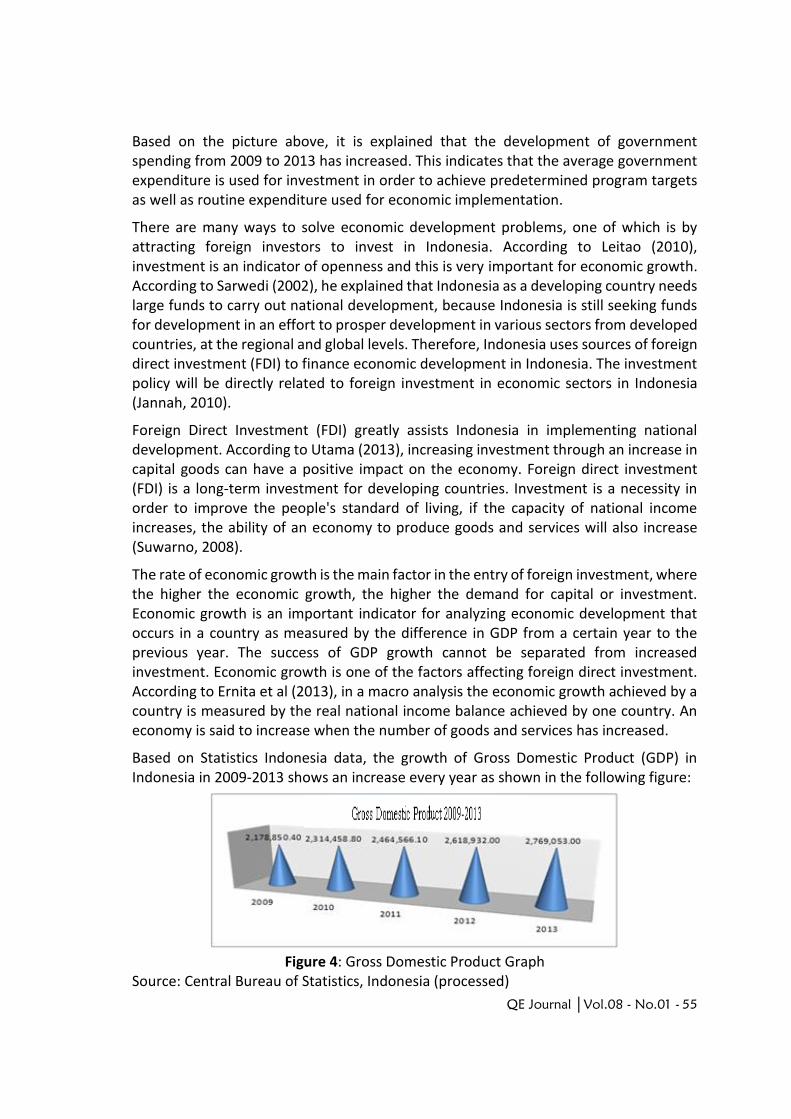
Based on the picture above, it is explained that the development of government spending from 2009 to 2013 has increased. This indicates that the average government expenditure is used for investment in order to achieve predetermined program targets as well as routine expenditure used for economic implementation.
There are many ways to solve economic development problems, one of which is by attracting foreign investors to invest in Indonesia. According to Leitao (2010), investment is an indicator of openness and this is very important for economic growth. According to Sarwedi (2002), he explained that Indonesia as a developing country needs large funds to carry out national development, because Indonesia is still seeking funds for development in an effort to prosper development in various sectors from developed countries, at the regional and global levels. Therefore, Indonesia uses sources of foreign direct investment (FDI) to finance economic development in Indonesia. The investment policy will be directly related to foreign investment in economic sectors in Indonesia (Jannah, 2010).
Foreign Direct Investment (FDI) greatly assists Indonesia in implementing national development. According to Utama (2013), increasing investment through an increase in capital goods can have a positive impact on the economy. Foreign direct investment (FDI) is a long-term investment for developing countries. Investment is a necessity in order to improve the people's standard of living, if the capacity of national income increases, the ability of an economy to produce goods and services will also increase (Suwarno, 2008).
The rate of economic growth is the main factor in the entry of foreign investment, where the higher the economic growth, the higher the demand for capital or investment. Economic growth is an important indicator for analyzing economic development that occurs in a country as measured by the difference in GDP from a certain year to the previous year. The success of GDP growth cannot be separated from increased investment. Economic growth is one of the factors affecting foreign direct investment. According to Ernita et al (2013), in a macro analysis the economic growth achieved by a country is measured by the real national income balance achieved by one country. An economy is said to increase when the number of goods and services has increased.
Based on Statistics Indonesia data, the growth of Gross Domestic Product (GDP) in Indonesia in 2009-2013 shows an increase every year as shown in the following figure:
Figure 4: Gross Domestic Product Graph
Source: Central Bureau of Statistics, Indonesia (processed)
QE Journal │Vol.08 - No.01 - 56
A good GDP growth rate will have a positive effect on the country because it will attract investors to invest (Shahzad, 2013). Different research is put forward by Jayachandran (2010), in his research it was found that high or low levels of economic growth have no effect on the existence of foreign direct investment.
Gross Domestic Product (GDP) is another factor that affects FDI. Previous research in Pakistan by Awan (2011) states that the Gross Domestic Product has a positive and significant effect on FDI inflows, because the increase in Gross Domestic Product (GDP) causes an increase in the attractiveness of FDI to Pakistan. Sarwedi's research (2002) found that Gross Domestic Product is an indicator of economic growth that has a positive relationship to FDI, because the economic factors of a country can attract investors to invest in that country.
In order for the Indonesian economy to grow and improve people's welfare, it needs funds for financing. In this case, foreign direct investment is one of the reliable sources of funds. However, in view of the level of investment entering Indonesia, it appears to have fluctuated, especially when entering a time of economic crisis, the entry of investment in Indonesia experienced a sharp decline, whereas at the same time large funds were needed for Indonesia's economic development.
RESEARCH METHOD
This research was conducted to examine how inflation, exchange rates, economic growth (GDP) and government spending affect the development of foreign direct investment (FDI) in Indonesia. This research uses secondary data and time series data in the period 1997-2013. The type of research data used is secondary data obtained from Economic and Financial Statistics of BI, BPS and several publications that support and relate to this study. Data processing was carried out by descriptive analysis and quantitative analysis. Data were analyzed using Microsoft Ecxel 2007 and E-Views 9.0 software. The analytical model used to identify the determinants of foreign direct investment in Indonesia is an analytical model using the quantitative method of multiple regression analysis with the Ordinary Least Square (OLS) method or the ordinary least squares method to obtain multiple regression coefficients.
RESULT AND DISCUSSION
Development of Foreign Direct Investment in Indonesia
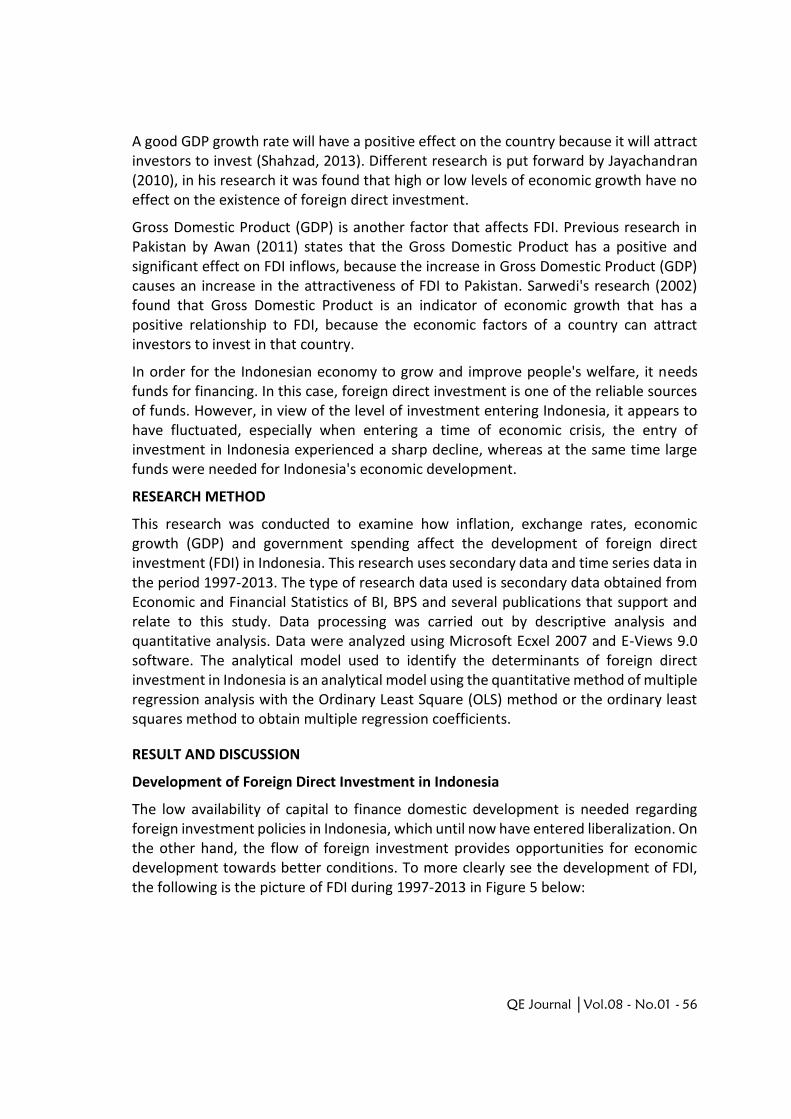
The low availability of capital to finance domestic development is needed regarding foreign investment policies in Indonesia, which until now have entered liberalization. On the other hand, the flow of foreign investment provides opportunities for economic development towards better conditions. To more clearly see the development of FDI, the following is the picture of FDI during 1997-2013 in Figure 5 below:
QE Journal │Vol.08 - No.01 - 57
Figure 5: Development of FDI in Indonesia Source: Central Statistics Agency, 1997-2013 (processed)
It can be seen that the development of FDI realization in Indonesia has fluctuated every year, in 1996 amounting to US $ 4,629.10 million and FDI in Indonesia also experiencing a decline during the 1997 monetary crisis amounting to US$ 3,473.41 million. However, in 1998 the realization of FDI in Indonesia increased to US$ 5,015.83 million compared to 1997. Then in 1999 there was a sharp increase of US $ 7,914.07 million. In 2000, the amount of FDI realized in Indonesia reached 11,205.90 million. However, in 2001 FDI realization decreased to US $ 3,502.4 million. This is due to the fact that national stability is not yet conducive so that many investors do not want to invest their capital due to the unstable investment climate. Likewise in 2002, a decrease of 12.16 percent to US $ 3,086.7 million. In 2003, FDI realization increased again by 76.65 percent to US $ 5,445.3 million.
The less conducive economic climate in 2004 due to the increase in fuel prices caused FDI realization to decline by US $ 4,550.5 million. However, in 2005, it had increased back to US $ 8,915.5 million or an increase of 94.87 percent. However, this did not last long, because in 2006 the realization of FDI fell to US $ 5,975.9 million. In the following two years, the realization of FDI in Indonesia has increased. In 2007, it increased by 72.59 percent or a value of US $ 10,341.4 million. Then in 2008 the realization of FDI reached US $ 14,883.5 million. The increase was 43.80 percent from the previous year. However, in 2009, the realization of FDI decreased again at US $ 10,814.8 million. Foreign investment in the form of portfolios also has an impact on domestic capital inflows, so that in 2010 it had increased to reach 16,214.80 and continued to experience a high enough increase until 2013 amounted to 28,617.50.
Inflation in Indonesia
Inflation is an indicator in reviewing the development of economic growth in a country. The inflation rate is usually caused by fluctuations in the production of goods and services, their distribution and circulation of money. In Indonesia, the inflation rate is largely influenced by price changes caused by government policies, for example, fuel prices and tariff increases. A high inflation rate will harm the economy of a country, because it will result in high prices and result in the country being unable to compete with other countries in the free market.
QE Journal │Vol.08 - No.01 - 58
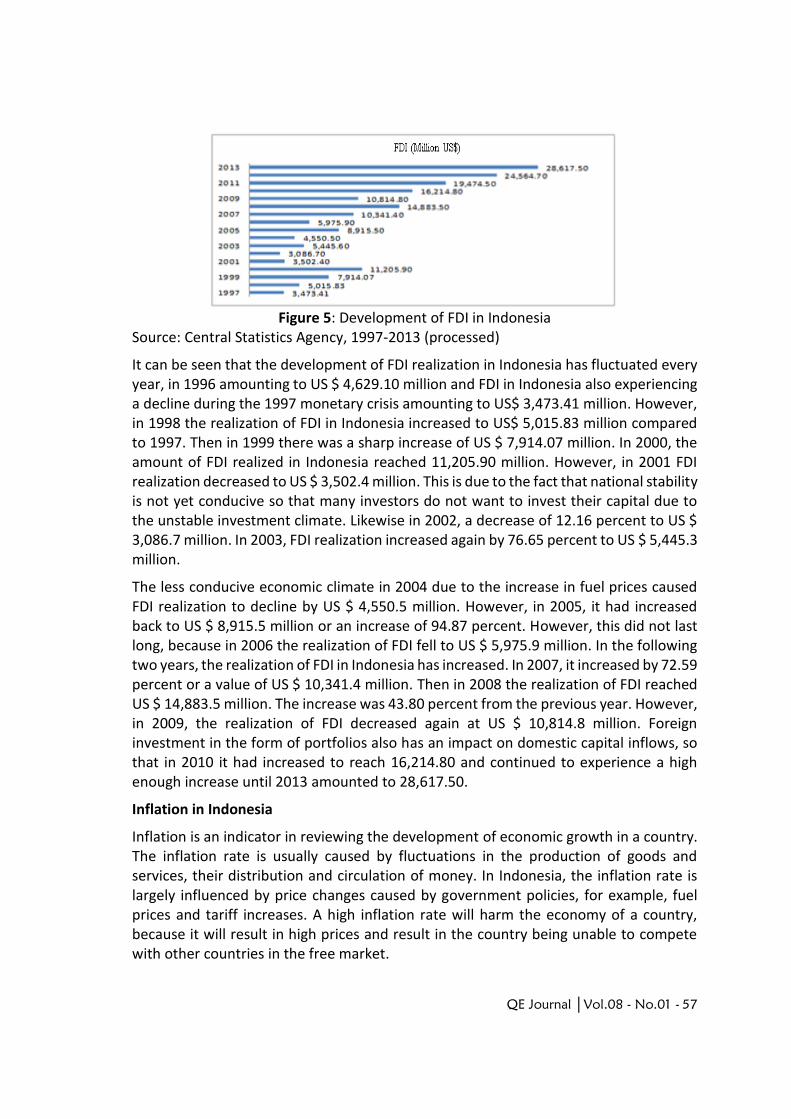
Based on Statistics Indonesia data, the development of Indonesia's inflation rate from 1997 to 2013 is presented in Figure 6 below:
Figure 6: Inflation in Indonesia
Source: Central Bureau of Statistics, 2007-20013 (processed)
In general, the inflation rate in Indonesia from 1997 to 2013 did not experience a significant increase or decrease. Where in 1996 the inflation rate was 6.47 percent, increasing in 1997 by 11.05 percent. Inflation in Indonesia experienced its highest point in 1998, where in that year which was an economic crisis it also had an impact on the inflation rate in Indonesia. As a result, the inflation rate in Indonesia in 1998 exceeded 77.63 percent, which resulted in paralyzing the real sector and business world in Indonesia.
The end of the economic crisis in 1998 was marked by a significant drop in the inflation rate in 1999 at the level of 2.01 percent. This identifies improvements in the Indonesian economy after the economic crisis. Until 2002, the position of the inflation rate was at the level of 9.35 percent in 2000, 12.55 percent in 2001 and 10.03 percent in 2002. In 2003 it reached the level of 5.06 percent while in 2004 it was 6, 40 percent. In 2005 the inflation rate again increased to the position of 17.11 percent. From 2006 to 2010 the inflation rate was respectively 6.60 percent in 2006; 6.59 percent in 2007; 11.06 percent in 2008 and 2.78 percent in 2009 and 6.96 percent at the end of 2010.
Development of Exchange Rate in Indonesia
Currency exchange rates are always expressed in two ways, namely if there is an increase in the change in the exchange rate of one country's currency against the currencies of another country because the market mechanism is called exchange rate appreciation and vice versa, if the change has decreased the value of the currency against foreign currencies then the change is called depreciation. The development of the Rupiah exchange rate as measured by an index shows a positive trend. This means that the general price level of Indonesian exported goods becomes cheaper than the general price level of the same goods from other producing / exporting countries and this encourages the growth of investment. Figure 7 shows the development of the Rupiah exchange rate against the USD from 1997 to 2013.

QE Journal │Vol.08 - No.01 - 59
Figure 7: Development of the Rupiah Exchange Rate Source: Word Bank, 1997-2013 (processed)
In 1996 the Rupiah exchange rate was quite stable at Rp 2,383 per 1 USD. However, the Rupiah exchange rate began to weaken against the US$ since mid-1997 as a result of the economic crisis that hit the world which paralyzed the Indonesian economy and resulted in a weakening of the Rupiah exchange rate. In 1998 the Rupiah weakened against the Dollar at an exchange rate of 8,025 per US$. In 1999 the Rupiah exchange rate fell to a level of Rp7,100 but again increased in 2000 to reach Rp9,595 and Rp10,400 in 2001. At the end of 2002 to 2003 the position of the Rupiah had strengthened again where it was at the level of Rp8. 940 in 2002 and Rp8,465 in 2003. From 2004 to 2005 the Rupiah again weakened to the position of Rp 9,290 in 2004 and Rp 9,830 in 2005.
In 2006 the position of the Rupiah was at Rp9,020. As a result of the economic crisis that hit the Indonesian economy again so that the Rupiah slumped again in 2007 to reach the level of Rp9,419 and in 2008, which was the peak of the crisis, the Rupiah again fell to the level of Rp10,950. the position in 2008 was the worst position during the last ten years the Rupiah exchange rate against the USD. With the end of the economic crisis in 2008, the Indonesian economy was reviving with the strengthening of the Rupiah exchange rate against the USD, this was indicated by the decline in the position of the Rupiah exchange rate in 2009 to Rp9,400 and at the end of 2010 it was at the level of Rp8,991.
In early 2001 to April 2001, the exchange rate showed a tendency to weaken, reaching a low of Rp12,090. Furthermore, the exchange rate moved stable in the range of Rp. 11,200 until July 2001. After the MPR Special session the Rupiah strengthened sharply to a high of Rp. 8,485 per dollar and subsequently weakened again to reach Rp. 10,400 per dollar at the end of 2001. Throughout 2003 the exchange rate Rupiah moved more stable and tended to strengthen from Rp8,940 with a growth rate of -14.04% in 2002 to Rp8,465. The stability and appreciation of the Rupiah was driven by improving country risk, adequate supply of foreign currency, attractive differences in interest rates and the emergence of several positive sentiments.
In 2006, 2007, 2008 the rupiah exchange rate against the dollar generally tended to strengthen -8.24% from Rp9,830 per dollar in 2005 to Rp9,020 per dollar, Rp9,419 per dollar, and Rp10,950. the stability of the Rupiah exchange rate was supported by more
QE Journal │Vol.08 - No.01 - 60
conducive external conditions and improving domestic economic fundamentals. On the external side, developments in the Rupiah exchange rate were influenced by the abundance of liquidity on global financial markets and the weakening trend of the dollar against world currencies, especially Asia. The amount of global liquidity comes from global saving which continues to increase in line with the widening current account surplus experienced by oil exporting countries.
Development of Government Expenditure in Indonesia
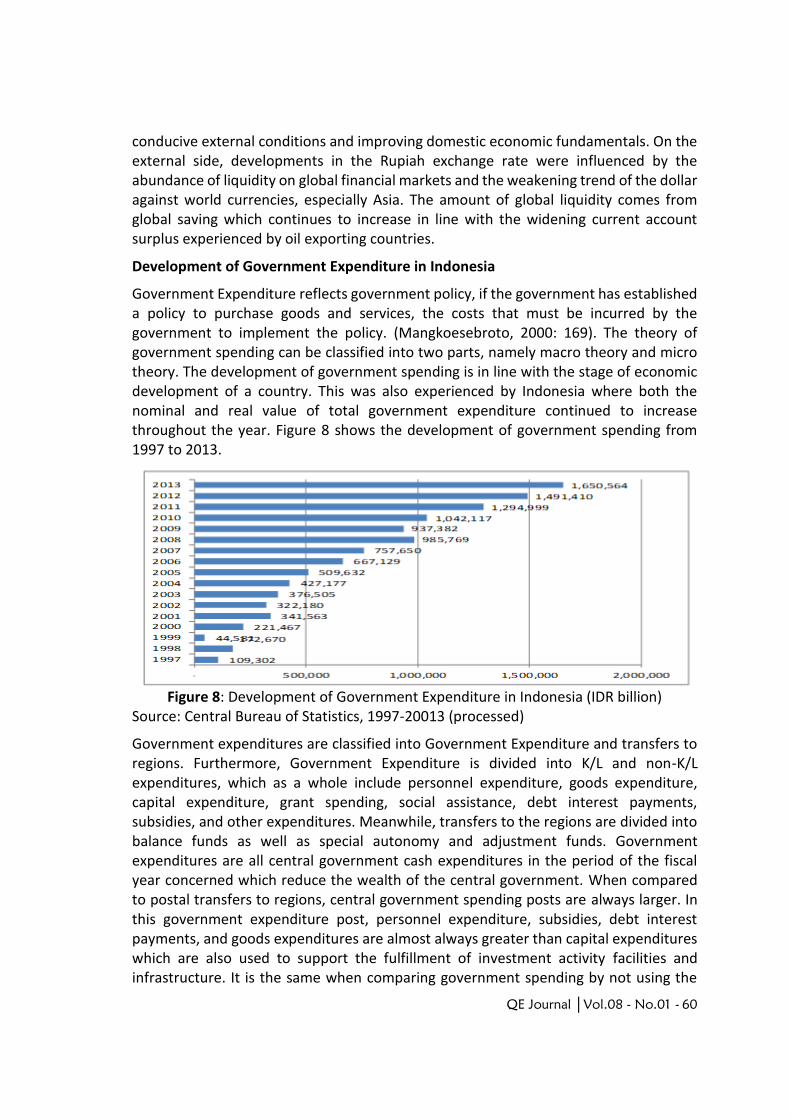
Government Expenditure reflects government policy, if the government has established a policy to purchase goods and services, the costs that must be incurred by the government to implement the policy. (Mangkoesebroto, 2000: 169). The theory of government spending can be classified into two parts, namely macro theory and micro theory. The development of government spending is in line with the stage of economic development of a country. This was also experienced by Indonesia where both the nominal and real value of total government expenditure continued to increase throughout the year. Figure 8 shows the development of government spending from 1997 to 2013.
Figure 8: Development of Government Expenditure in Indonesia (IDR billion) Source: Central Bureau of Statistics, 1997-20013 (processed)
Government expenditures are classified into Government Expenditure and transfers to regions. Furthermore, Government Expenditure is divided into K/L and non-K/L expenditures, which as a whole include personnel expenditure, goods expenditure, capital expenditure, grant spending, social assistance, debt interest payments, subsidies, and other expenditures. Meanwhile, transfers to the regions are divided into balance funds as well as special autonomy and adjustment funds. Government expenditures are all central government cash expenditures in the period of the fiscal year concerned which reduce the wealth of the central government. When compared to postal transfers to regions, central government spending posts are always larger. In this government expenditure post, personnel expenditure, subsidies, debt interest payments, and goods expenditures are almost always greater than capital expenditures which are also used to support the fulfillment of investment activity facilities and infrastructure. It is the same when comparing government spending by not using the
QE Journal │Vol.08 - No.01 - 61
unified budget format, or in other words using the old format, where development spending. Of the two posts, routine expenditure items are always greater than development expenditures. The size of this relatively small development expenditure item can also indicate the investment value of the government. Thus, this illustrates that the increasing income, because the increase in aggregate demand will encourage an increase in investment and ultimately will lead to an increase in production.
However, in real terms, the value of government spending after the 1997-1998 crisis actually experienced a decline, where the value at the time before the crisis tended to be greater than after the crisis. This can indicate that the government in the New Order regime continued to strive to increase growth by increasing development. However, it is very unfortunate because these development expenditures are in fact financed by foreign debt which in the end has brought Indonesia to dependence on the IMF. The nominal value of development spending tends to increase. A significant increase occurred during the crisis in 1997-1998 and decreased again in 2000. The increased development spending was needed by the government to stabilize the economy which was currently in recession. After economic conditions improved, spending on development began to increase even though in certain years it had decreased.
Development of Gross Domestic Product (GDP)
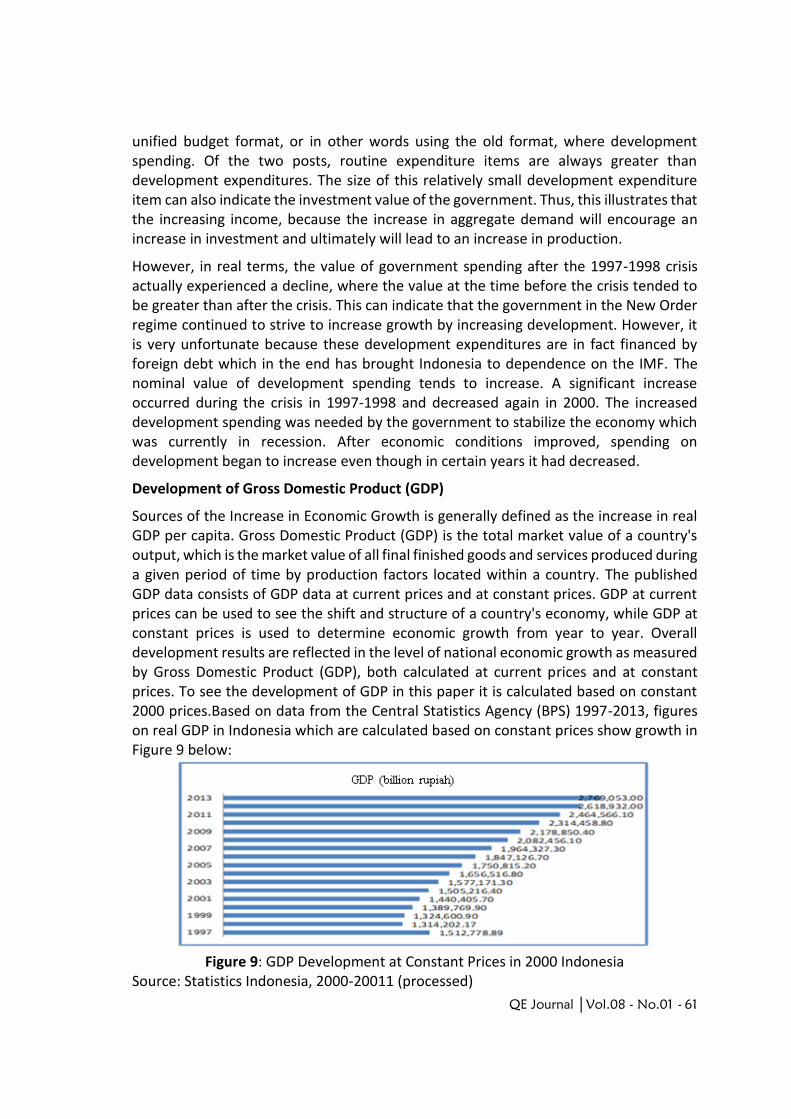
Sources of the Increase in Economic Growth is generally defined as the increase in real GDP per capita. Gross Domestic Product (GDP) is the total market value of a country's output, which is the market value of all final finished goods and services produced during a given period of time by production factors located within a country. The published GDP data consists of GDP data at current prices and at constant prices. GDP at current prices can be used to see the shift and structure of a country's economy, while GDP at constant prices is used to determine economic growth from year to year. Overall development results are reflected in the level of national economic growth as measured by Gross Domestic Product (GDP), both calculated at current prices and at constant prices. To see the development of GDP in this paper it is calculated based on constant 2000 prices.Based on data from the Central Statistics Agency (BPS) 1997-2013, figures on real GDP in Indonesia which are calculated based on constant prices show growth in Figure 9 below:
Figure 9: GDP Development at Constant Prices in 2000 Indonesia
Source: Statistics Indonesia, 2000-20011 (processed)
QE Journal │Vol.08 - No.01 - 62
Indonesia's economic growth fluctuates from year to year, but shows an increasing trend, this can be seen from the data on the development of the Gross Domestic Product. When Indonesia released a path to continue developing, economic turmoil emerged in 1997-1998 with the monetary crisis. The monetary crisis that occurred in 1997 brought the Indonesian economy to a very difficult condition as several economic indicators experienced sharp turmoil. The economic turmoil made the Indonesian economy unstable. Inflation rose very sharply from 11.05 percent in 1997 to 77.63 percent at the end of 1998 or increased by 602.53 percent. Not to mention the exchange rate of Rupah against US $ which weakened from Rp4,650 to Rp8,025 at the end of 1998.
The Indonesian economy in 1998 was marked by an alarming growth rate, the protracted monetary crisis has resulted in negative economic growth. The GDP value based on current prices was recorded at IDR 1,314,202 billion. This means that the Indonesian economy recorded a decline of 13.3 percent. All sectors experienced negative growth, except for the agricultural sector which grew by 0.2 percent. In 1999 as a whole, Indonesia's economic growth rate had gradually become positive. This shows one of the signs of Indonesia's economic recovery. After the Indonesian economic crisis in 1998, economic turmoil returned to Indonesia in 200. The global economy experienced a financial crisis caused by the crisis experienced by the United States which indirectly affected the Indonesian economy. In 2000 GDP increased to IDR 1,389,770.2 billion with a growth of 4.9% and in 2001 the economic growth rate decreased to 3.83% although in terms of value it had increased to IDR 1,442,982.6 billion, because the influence of world economic development with the bombing of the WTC (World Trade Center) which also had an impact on the national economy.
Research Model Estimation Results
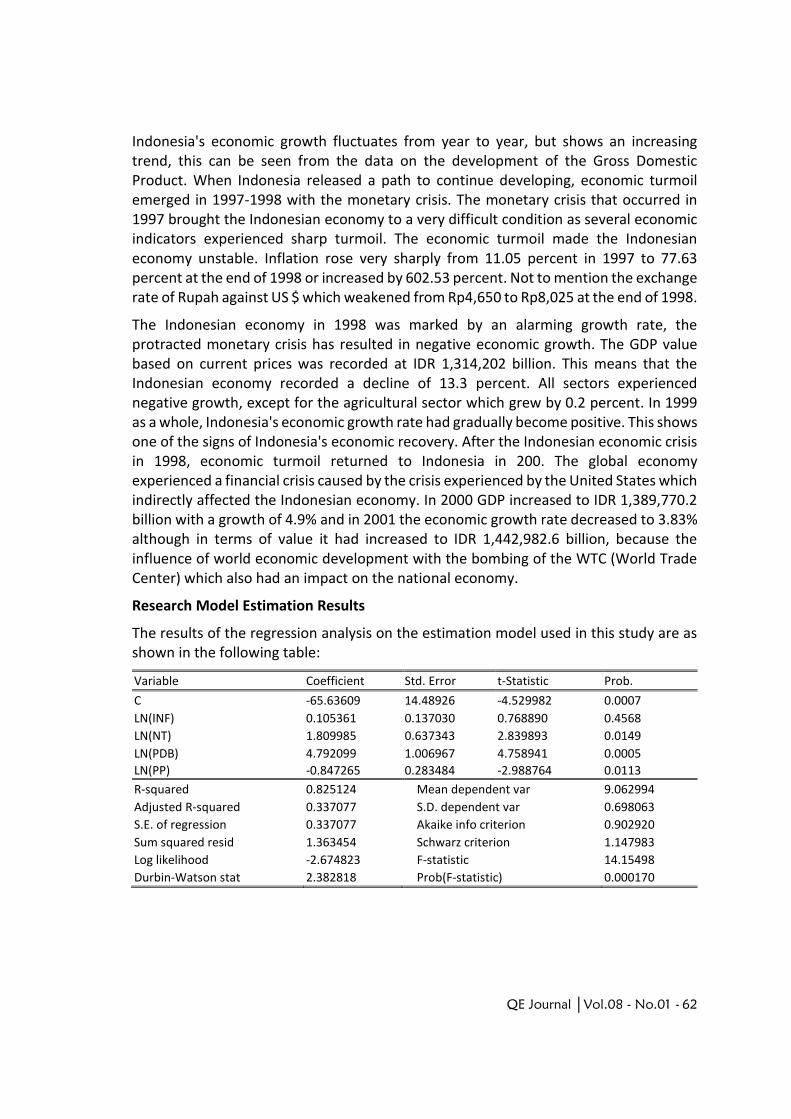
The results of the regression analysis on the estimation model used in this study are as shown in the following table:
Variable Coefficient Std. Error t-Statistic Prob.
C -65.63609 14.48926 -4.529982 0.0007
LN(INF) 0.105361 0.137030 0.768890 0.4568
LN(NT) 1.809985 0.637343 2.839893 0.0149
LN(PDB) 4.792099 1.006967 4.758941 0.0005
LN(PP) -0.847265 0.283484 -2.988764 0.0113
R-squared 0.825124 Mean dependent var 9.062994
Adjusted R-squared 0.337077 S.D. dependent var 0.698063
S.E. of regression 0.337077 Akaike info criterion 0.902920
Sum squared resid 1.363454 Schwarz criterion 1.147983
Log likelihood -2.674823 F-statistic 14.15498
Durbin-Watson stat 2.382818 Prob(F-statistic) 0.000170

QE Journal │Vol.08 - No.01 - 63
In reality, the simple regression model does not reflect the actual behavioral conditions of economic variables. Multiple regression model (multiple regression) which consists of more than one independent variable. In this study, Foreign Direct Investment as the dependent variable and inflation, exchange rates, government spending, and Gross Domestic Product (GDP) as independent variables. This indicates that the multiple linear regression model used is valid (correct / appropriate).
The results of multiple linear regression analysis for Premium Demand can be written in a linear equation as follows:
Based on this model, it is known that the variables of inflation, exchange rate, government spending, and GDP have an effect on foreign direct investment in Indonesia.
Simultaneous Test Results (f-test)
The statistical test results obtained from the estimation results of the research model can be seen in table 1, it can be seen that the F-statistic value is 14.15498 with a statistical probability of 0.000170 which is smaller than α = 0.05 which indicates that together (simultaneous test) all independent variables, namely inflation, exchange rates, government spending and GDP have an influence on foreign direct investment.
Partial Test Result (t-test)
The t-test (partial) in this study was conducted to determine whether there is a significant influence between inflation (INF), the exchange rate (ER), government spending (GE), and GDP have an effect on foreign direct investment (FDI). Through the t test with each level of significance, the estimated results of the t-statistic value and the probability of each variable can be seen in the following table:
Table 2: Hypothesis Test Results Partial Test
Variable Coefficient t-Statistic Prob.
LNINF 0.105361 0.768890 0.4568
LNNT 1.809985 2.839893 0.0149**
LNPDB 4.792099 4.758941 0.0005**
LNPP -0.847265 -2.988764 0.0113**
Source: Eviews 9.0 (processed)
The table above proves that the t-count of the inflation variable with tstat = 0.768890 and prob. = 0.4568, meaning that it can be interpreted that statistically the inflation variable (INF) has no significant effect on foreign direct investment (FDI) in Indonesia. Exchange rate variable with tstat value = 2.839893 and prob. = 0.0149, meaning that it can be interpreted that statistically the exchange rate variable (ER) has a significant effect on foreign direct investment (FDI) in Indonesia. The government expenditure variable with tstat value = -2.988764 and prob. = 0.0113, meaning that it can be interpreted that statistically the government expenditure variable (PP) has a significant effect on foreign
LnFDI = -65.63609 + 0.105361 Ln(INF) + 1.809985 Ln(NT) – 0.847265
Ln(GE) + 4.792099 Ln(GDP) + et

QE Journal │Vol.08 - No.01 - 64
direct investment (FDI) in Indonesia. The gross domestic product variable with tstat value = 4.758941 and prob. = 0.0005, meaning that it can be interpreted that statistically the gross domestic product (GDP) variable has a significant effect on foreign direct investment (FDI) in Indonesia.
Estimated Accuracy Test Results
Based on table 1, it is known that the coefficient of determination (R-square) of the research model is 0.825124, meaning that 82.51 percent of the variation in changes in the foreign direct investment (FDI) variable in Indonesia can be explained by the variables of inflation, exchange rates, government spending, and products. gross domestic product (GDP). While the remaining 17.49 percent is influenced by other variables not examined in this study.
CONCLUSIONS AND RECOMMENDATIONS
Conclusion
Based on the estimation results of the determinant demand equation for foreign direct investment in Indonesia using the OLS (Ordinary Least Square) method through multiple linear regression estimation models regarding the influence of independent variables such as inflation (INF), exchange rate (ER), government expenditure (GE), and gross domestic product (GDP) in Indonesia in 1997-2013, it can be concluded as follows:
1. The estimation results of the determination coefficient of foreign direct investment in Indonesia can be explained by the variables of inflation, exchange rates, government spending and gross domestic product.
2. From the estimation results obtained, the inflation variable, exchange rate and gross domestic product have a positive effect, only the inflation variable is not significant, while other variables have a significant effect on foreign direct investment. Government expenditure variables have a negative and significant effect on foreign direct investment in Indonesia.
3. The magnitude of the coefficient value of the variables that explains the foreign direct investment variable, the biggest is the exchange rate variable and economic growth.
Suggestion
1. Investors should pay attention to the factors that affect FDI, such as inflation, exchange rates, government spending and economic growth, so that these factors can be used as the basis for making foreign direct investment decisions. The government is expected to equalize economic growth, create a conducive investment climate, simplify the licensing process. Improvement of infrastructure, as well as improving the quality of human resources, so it is hoped that foreign direct investment can increase.
2. The government should control the inflation rate, control interest rates and control the rupiah exchange rate. With effective control, the inflation rate, rupiah exchange rate and real interest rates will be more stable and controllable,
QE Journal │Vol.08 - No.01 - 65
which in turn will encourage an increase in foreign direct investment in Indonesia.
3. For further researchers to add several other variables such as inflation, exports, libor and political stability that have the potential to affect foreign direct investment. In addition, it can also use different analytical techniques to provide a different perspective in similar research.
REFERENCES
Anna, Chingarande. 2012. The impact of interest rates on foreign direct investment: A case study of the Zimbabwean economy (February 2009-June 2011). International Journal of Management Sciences and Business Research, 1(5), pp:1-24
Awan, M. Z., Khan, B., & Uz Zaman, K. 2011. Economic determinants of Foreign Direct Investment (FDI) in commodity producing sector: A case study of Pakistan. African Journal of Business Management, 5(2), pp: 537-545.
Bank Indonesia. (2000). Laporan Tahunan Perekonomian Bank Indonesia.
Case, Karl E dan Fair Ray C. 2007. Prinsip-prinsip Ekonomi. Edisi Kedelapan. Alih bahasa Wibi Hardani dan Devri Barnadi. Jakarta: Erlangga.
Dumairy (2006). Perekonomian Indonesia. Jakarta : Erlangga.
Ernita, Dewi, Syamsul Amar, Efrizal Syofyan. 2013. Analisis Pertumbuhan Ekonomi, Investasi, dan Konsumsi di Indonesia. Jurnal Kajian Ekonomi. 1(02): h: 176-193.
Febriana, Muqorobbin. 2014. Investasi Asing Langsung di Indonesia dan Faktor-faktor yang Mempengaruhinya. Jurnal Ekonomi dan Studi Pembangunan Volume 15, Nomor 2, Oktober 2014, hlm.109-117.
Gujarati, D. N. dan Porter, D.C. 2010. Dasar-dasar Ekonometrika. Jilid 1. Edisi Kelima. Salemba Empat. Jakarta
Hidayat, R. Rustam, Monica Letarisky, dan Darminto. 2014. Pengaruh Indikator Fundamental Makroekonomi Terhadap Foreign Direct Investment di Indonesia (Periode Tahun 2004-2013) Jurnal Administrasi Bisnis (JAB) Vol. 15 No. 2 Oktober 2014.
Insah Baba. 2013. Foreign Direct Investment Inflows and Economic Growth in Ghana. International Journal of Economic Practices and Theories, 3(2), pp:115-121.
Jhingan, M. L. 2010. Ekonomi Pembangunan dan Perencanaan. PT. Raja Grafindo Persada. Jakarta
Jhingan, M.L., Prasmuko, A dan Yanfitri. 2007. Determinan FDI: Faktor-faktor yang mempengaruhi Investasi Langsung. Working Paper. Agustus 2007.
Jannah, Aliyatul. 2010. Analisis Beberapa Faktor yang Mempengaruhi Penanaman Modal Asing (PMA) Di Indonesia. Skripsi Jawa Timur. Universitas Pembangunan Nasional Veteran.
QE Journal │Vol.08 - No.01 - 66
Jayachandran, G. and A. Seilan. 2010. A Causal Relationship between Trade, Foreign Direct Investment and Economic Growth for India. International Research Journal of Finance and Economics Issue 42: pp: 74-88.
Jhingan M.L. (1988). Ekonomi pembangunan dan perencanaan, Edisi Keenam Belas. Jakarta: Rajawali.
Krugman, Paul R. dan Obstfeld, Maurice. 2003. Ekonomi Internasional. Edisi Kedua. PT. Raja Grafindo Persada. Jakarta
Kurniati, Yati., Prasmuka, Andry. dan Yanfitri. 2007. Determinan FDI (Faktor-faktor yang Menentukan Investasi Asing Langsung). BI Working Paper
Leitao MM Jr, Chi DS., 2002. Recurrent Cervical Cancer. Curr Treat Options Oncol [serial online].
Leitao, Nuno Carlos. 2010. Foreign Direct Investment: The Canadian Experience. International Journal of Economics and Finance, 2(4), pp: 82-88.
Mangkoesoebroto, Guritno (2002). Ekonomi Publik. Yogyakarta: BPFE. Sukirno, Sadono (2002). Makro Ekonomi. Jakarta :Raja Grafindo Persada. Sukirno, Sadono (2006). Ekonomi Pembangunan: Proses, Masalah, dan Dasar Kebijakan. Jakarta: Kencana.
Mankiw, G. (2007). Macroeconomics, 6th ed., New York: Worth Publishers.
Mankiw, N Georgy. 2007. Makroekonomi. Edisi Keenam. Erlangga. Jakarta
Mohammad Vandnahidi, dkk. 2012. The Determinants of Foreign Direct Investment in Iran: Bounds Testing Approach. Ekonomic Research-Ekonomisca Istrazivanja. Vol. 25 (3).
Nuana, Nanga.” Makroekonomi teori, masalah dan kebijakan, edisi perdana”, PT. Raja Grafindo Persada, Jakarta, 2001.
Nopirin. 2011. Ekonomi Internasional. Edisi 3. BPFE. Yogyakarta
Nopirin. 2013. Ekonomi Moneter. BPFE. Yogyakarta
Sarwedi. 2002. “Investasi Asing Langsung di Indonesia dan Faktor Yang Mempengaruhinya”. Jurnal Ekonomi Akuntansi.
Setiawan, Gandy. 2002. The Impact of Foreign Direct Investment on Indonesia’s Economic Growth. KDI School of Public Policy and Management. Master Thesis.
Sugiyono. 2009. Metode Penelitian Kuantitatif dan Kualitatif. Alfabeta. Bandung
Salvatore, Dominick. 1997. Ekonomi Internasional. Jilid 1. Erlangga. Jakarta
Suwarno. 2008. Analisis Beberapa Faktor yang Mempengaruhi Penanaman Modal Asing pada Industri Manufaktur di Jawa Timur. Jurnal Riset Ekonomi dan Bisnis, 8(1): h: 50-57.

QE Journal │Vol.08 - No.01 - 67
Shahzad, Arfan dan Abdullah Kaid Al-Swidi. 2013. Effect of Macroeconomic Variables on the FDI inflows: The Moderating Role of Political Stability: An Evidence from Pakistan. Asian Social Science. 9(9), pp: 270- 279.
Sarwedi. 2002. Investasi Asing Langsung Di Indonesia Dan Faktor Yang Mempengaruhinya. Jurnal Akuntansi & Keuangan, 4(1): h: 17-35. Jember: Universitas Kristen Petra
Sugiyono . 2012. Metode penelitian Bisnis Bandung: CV. Alfabeta.
Sukirno, Sadono. 2006. Pengantar Teori Makroekonomi. Jakarta: PT Raja Grafindo Persada.
Sarwedi. 2002. Investasi Asing Langsung di Indonesia dan faktor-faktor yang mempengaruhinya, Jurnal Akuntasi dan Keuangan, vol. 4 No. 1, Universitas Petra Surabaya.
Susanto, Joko. 2012. Determinan Penanaman Modal Asing Langsung di ASEAN. JRMB. Vol. 7 No. 1, Juni 2012.
Thirafi, Muhammad Aulia Zul. 2013. Pengaruh Pertumbuhan Ekonomi, Ketersediaan Tenaga Kerja, Infrastruktur dan Kepadatan Penduduk terhadap Penanaman Modal Asing di Kabupaten Kendal. Economics Development Analysis Journal, 2(1): h:1-9.
Todaro, M. P. C., 2004. Pembangunan Ekonomi di Dunia Ketiga. Edisi Kedelapan. Jakarta: Penerbit Erlangga.
Utama, Made Suyana. 2013. Potensi dan Peningkatan Investasi di Sektor Pertanian dalam Rangka Peningkatan Kontribusi terhadap Perekonomian di Provinsi Bali, Buletin Studi Ekonomi , 18(1): h: 51-57.
Widarjono, Agus. 2013. Ekonometrika: Teori dan Aplikasi Untuk Ekonomi dan Bisnis. Edisi Keempat. UPP STIM YKPN. Yogyakarta.