the american customer satisfaction index
TRANSCRIPT

and CSBG’S PERFORMANCE MANAGEMENT
FRAMEWORK
PRESENTED BY: SETH HASSETT, Office of Community Services
and KATE BLUNT, Federal Consulting Group
THE AMERICAN CUSTOMER SATISFACTION INDEX

Session Goals
Learn more about the ACSI Understand the ACSI Methodology Review the Survey of Eligible Entities
Know what information to expect and
how to identify what action(s) to take
9/17/2015 2

WHY NOW? WHY USE THE ACSI?
9/17/2015 3

Why OCS is Using the ACSI
ACSI methodology is the “gold standard” for customer satisfaction surveys
Independently administered; a third-party research group
(CFI) will collect the survey data and conduct an analysis Cost-effective
Allows for the collection of consistent, uniform information
across the network Help OCS and the States understand our customers’
expectations and measure our performance Guide OCS and the States to make smart decisions
about resource allocation, including our training and technical assistance funds
9/17/2015 4

Why the ACSI Now
Integral part of the new CSBG Performance Management Framework • Measure the Success of Community Action and CSBG
• Enhance Accountability- State and Federal Measures
• Drive Improvements in how the State and Federal
Levels of the CSBG Network perform Executive Order 13571: Improving Customer
Service
9/17/2015 5

MEASURING THE SUCCESS OF COMMUNITY ACTION AND CSBG
HOW WELL DID THE NETWORK PERFORM?
FEDERAL ACCOUNTABILITY MEASURES
ORGANIZATIONAL STANDARDS: ELIGIBLE ENTITIES STATE ACCOUNTABILITY MEASURES
WHAT DIFFERENCE DID THE NETWORK MAKE?
RESULTS FOR LOW-INCOME
FAMILIES AND COMMUNITIES
NATIONAL PERFORMANCE INDICATORS FOR FAMILIES
SERVICES DELIVERED
COMMUNITY
ACTION NETWORK
AND CSBG
NATIONAL PERFORMANCE INDICATORS FOR COMMUNITIES
SERVICES DELIVERED
9/17/2015 6

Why the ACSI Now
How well did the network perform? ACSI Surveys are one way for the Network to
determine how well it performs. The Survey of Eligible Entities is going on this month.
This survey will give the States information for improving their performance, and will give OCS insights into what T&TA the States may need.
The second Survey of the States is scheduled for
October. This survey will give OCS information for improving its performance.
We will have the results from both surveys by the end
of the year. 9/17/2015 7

A QUICK SNAPSHOT THE ACSI
9/17/2015 8

9
The only uniform measure of customer satisfaction in the U.S. economy A quarterly measure of the national economy’s health; complementary to
measures such as inflation and unemployment More than 200 companies, 41 industries in 7 economic sectors; companies
measured account for roughly one-third of the total U.S. GDP Since 1999, the ACSI is the only standardized, cross-agency measure of
customer satisfaction in the federal government; measured annually 200+ departments, agencies, programs and websites of the U.S. Federal
Government Used by OCS programs (AFI, LIHEAP, CSBG) over the past five years www.theacsi.org for more information
What is the American Customer Satisfaction Index (ACSI)? The ACSI is the only measure of customer satisfaction whose predictive link to results are confirmed by third party independent peer review.

10
ACSI Scores – National, Sector & Industry
Cooperative Utilities 81 Investor-Owned Utilities 75
Municipal Utilities 76
Airlines 69 Consumer Shipping 81 U.S. Postal Service 72
76 Computer Software 73 Fixed-Line Telephone Service 63 Internet Service Providers 65 Subscription Television Service 72 Wireless Telephone Service
82 Full-Service Restaurants 75 Hotels 80 Limited-Service Restaurants
Energy Utilities 74.3
E-Business 74.4
Manufacturing/ Nondurable Goods
79.5
Information 68.8
Public Administration/ Government
65.1
Health Care & Social Assistance
75.1
Transportation 74.0
Accommodation & Food Services
78.3
Retail Trade 76.8
Finance & Insurance
75.1
Manufacturing/ Durable Goods
81.2
E-Commerce 81.7
74 Internet News & Opinion 80 Internet Portals & Search Engines 71 Internet Social Media
Federal Government 64.4 Local Government 65.8
Department & Discount Stores 77 Gasoline Stations 73
Health & Personal Care Stores 77 Specialty Retail Stores 79
Supermarkets 76
82 Internet Brokerage 82 Internet Retail 77 Internet Travel
76 Banks 85 Credit Unions 70 Health Insurance 80 Life Insurance 79 Property & Casualty Insurance
Automobiles & Light Vehicles 82 Cellular Telephones 78
Televisions & Video Players 86 Household Appliances 80
Personal Computers 78
Apparel 78 Athletic Shoes 80
Breweries 79 Food Manufacturing 79
Personal Care & Cleaning Products 82 Soft Drinks 82
79 Ambulatory Care 76 Hospitals
74.7

METHODOLOGY THE ACSI
9/17/2015 11

12
Proven methodology that provides credible, precise, and reliable data
Uses multiple-item indicators to assess drivers of satisfaction Explains the linkage between satisfaction and desired outcomes Allows for apples-to-apples comparison across the private and
public sectors Utilizes a cause-and-effect methodology to generate actionable
recommendations to improve performance Recognized by academia, media and business as the gold standard
for measuring customer satisfaction
The ACSI Methodology
The ACSI is the only measure of customer satisfaction whose predictive link to results are confirmed by third party independent peer review.

13
A Few Definitions
Quality Component: Set of Quality Attributes that fit together conceptually and empirically. Also known as a Latent Variable.
Quality Components
Billing
Product Quality
Quality Attributes
The bill is accurate The bill is easy to read
Etc...
The connection is reliable The connection is fast
Etc...
Quality Attribute: Specific measure which may contribute to Satisfaction. Each Quality Attribute reflects a question from the survey.

14
Scores and Impacts
Attribute Score: Average respondent score for questions asked in the survey. Questions are asked on 1–10 scale, translated to 0–100. Also known as a Manifest Variable Score.
Component Score: Average of Attributes that make up a Component. Scores range from 0–100; note that scores are averages, not percentages. Also known as a Latent Variable Score.
Impact: Increase in Satisfaction expected from a 5-point
increase in a Quality Component Score.
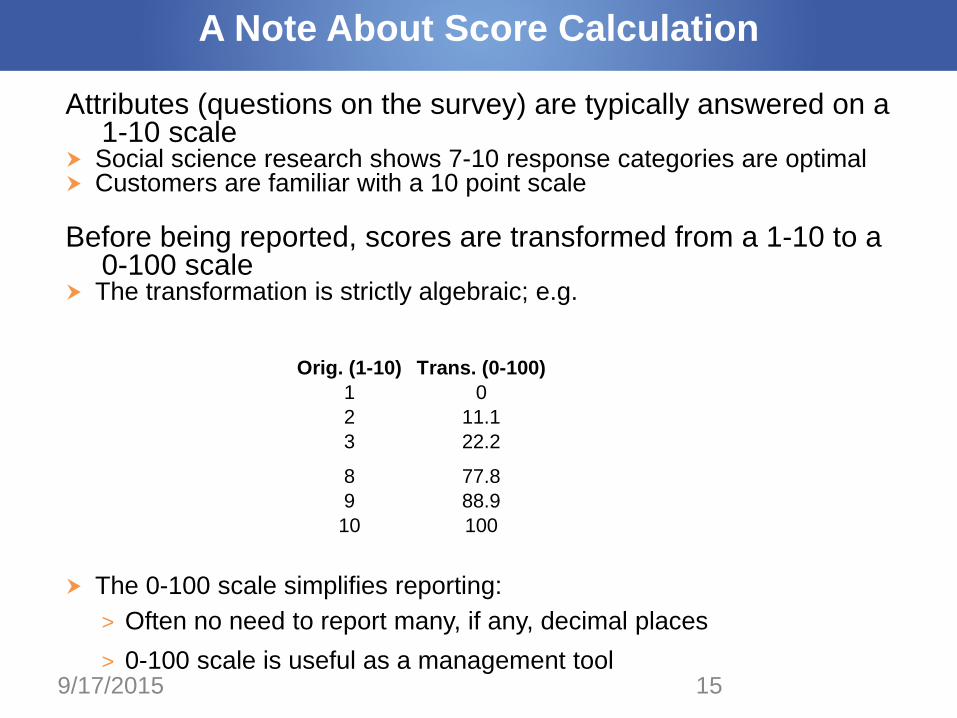
A Note About Score Calculation
Attributes (questions on the survey) are typically answered on a 1-10 scale
Social science research shows 7-10 response categories are optimal Customers are familiar with a 10 point scale Before being reported, scores are transformed from a 1-10 to a
0-100 scale The transformation is strictly algebraic; e.g.
The 0-100 scale simplifies reporting:
> Often no need to report many, if any, decimal places > 0-100 scale is useful as a management tool
Orig. (1-10) Trans. (0-100)1 02 11.13 22.2
8 77.89 88.910 100
9/17/2015 15

16
Customer Satisfaction Model An Example
General Call Quality
Value for Money
Tariffs
Handset
Customer Service
Billing
Image
Customer Satisfaction Index
Overall Satisfaction Compared to expectations
Compared to ideal
In general Compared to fixed
lines etc.
Price of having mobile phone
Relative to competition
etc.
Ease of understanding Variety of plans
etc.
Ease of use Battery
etc.
Ease of getting in contact
Speed in answering call etc.
Accuracy Completeness of
information etc.
Innovative Market leader
etc.
Loyalty
Recommendation
Likelihood to recommend provider to others
Likelihood to keep provider as primary supplier

17
Customer Satisfaction Model An Example
General Call Quality
Value for Money
Tariffs
Handset
Customer Service
Billing
Image
Customer Satisfaction Index
Loyalty
Recommendation
72
77
70
70 Score
66
75
74
72
73
64 0.8
Impact on Satisfaction 0.5
1.5
0.4
0.6
1.3
0.3
3.2
3.0 Impact of a 5-point
increase in Satisfaction
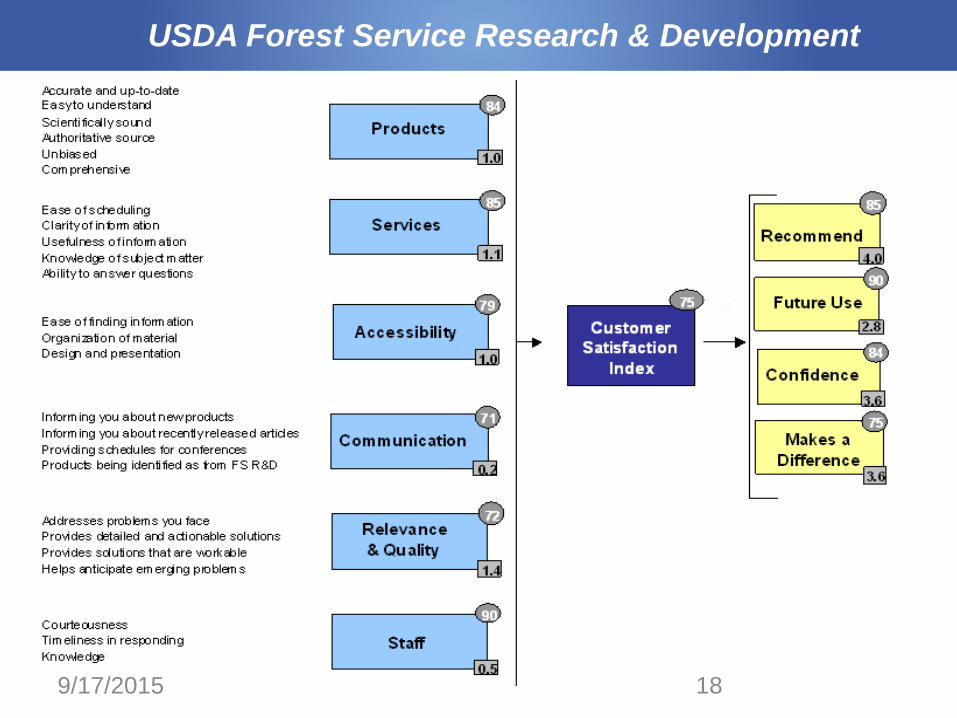
USDA Forest Service Research & Development
9/17/2015 18

Invest Where It Matters Most
ACSI methodology designed to understand…
1. How satisfied customers are overall
2. What improvements have the greatest effect on satisfaction (programs/products, customer service, technical support, billing, pricing, etc.)
3. How to define and implement action plans
9/17/2015 19
QUESTIONS? COMMENTS?
9/17/2015 20

LISTENING TO CUSTOMERS AND ACTING ON THE RESULTS USING THE ACSI

OF THE ELIGIBLE ENTITIES
ACSI SURVEY
9/17/2015 22

Goals for the First Survey of Eligible Entities
Establish a baseline measure of satisfaction using the methodology of the ACSI
Better understand and determine where OCS would best focus its training and technical assistance efforts for the State CSBG Lead Agencies
Provide data to inform the 2017 State Plan
9/17/2015 23

Benefits for the Network
Provide OCS and the States with actionable insights to improve the customer experience and boost program results (in the context of the State and Federal Accountability Measures)
9/17/2015 24
Benefits for the Network
Provide OCS, the States, and Eligible Entities with: • Information about priority areas needing focus and assistance
• Information about best practices in the areas covered by the survey
9/17/2015 25

Benefits for the States
Help the States become better at what they do—partnering with the local agencies to improve the lives of low-income people.
9/17/2015 26

Benefits for the Eligible Entities
Opportunity for the Eligible Entities to: • Provide constructive feedback • Open a dialogue about program improvements
9/17/2015 27

Eligible Entity Survey Instrument
26 Questions Developed Around Five of the State Accountability Measures
1. Development of the State Plan: Participation of
Local Entities 2. Grant Administration: Distribution of Funds 3. Use of Remainder/Discretionary Funds including
Training and Technical Assistance provided to local entities
4. Grant Monitoring and Corrective Action 5. Linkages and Communication Efforts 9/17/2015 28

Eligible Entity Survey Instrument
Open-Ended Questions How could the process of the developing the State Plan be improved? What training and technical assistance for developing the State Plan
would you recommend OCS provide to the State CSBG Lead Agency? What technical assistance would you recommend OCS provide to the
state regarding its grant award process? What technical assistance would you recommend OCS provide to the
state regarding its use of discretionary funds? What training and technical assistance needs do you want OCS to
address? What, if any, additional training and technical assistance needs do you
want the State CSBG Lead Agency to address?
9/17/2015 29

Eligible Entity Survey Instrument
Open-Ended Questions, cont. What, if any, suggestions do you have for how the State CSBG Lead Agency
could improve its monitoring process?
What technical assistance would you recommend OCS provide to the State
CSBG Lead Agency regarding its grant monitoring process?
What kinds of information, if any, would you like to receive from the State CSBG
Lead Agency that you are not now getting?
What technical assistance would you recommend OCS provide to the CSBG
Lead Agency regarding its communication efforts?
What more could OCS do to help the states and eligible entities meet the needs
of low-income people in the state?
9/17/2015 30

Eligible Entity Survey Instrument
Overall Satisfaction How satisfied are you with the services provided by the
State CSBG Lead Agency as it relates to CSBG?
How well do the services from the State CSBG Lead Agency meet your expectations?
How do the services from the State CSBG Lead Agency compare to an ideal grant awarding agency?
9/17/2015 31

Eligible Entity Survey Instrument
Outcome Behaviors How confident are you that the State CSBG Lead
Agency is fulfilling its mission of supporting eligible entities in their mission of helping low-income individuals out of poverty?
How much to you trust the CSBG Stat Lead Agency to work with you to meet your organization’s needs?
9/17/2015 32

QUESTIONS? COMMENTS?
9/17/2015 33
ACTING ON THE RESULTS ACSI SURVEY
9/17/2015 34
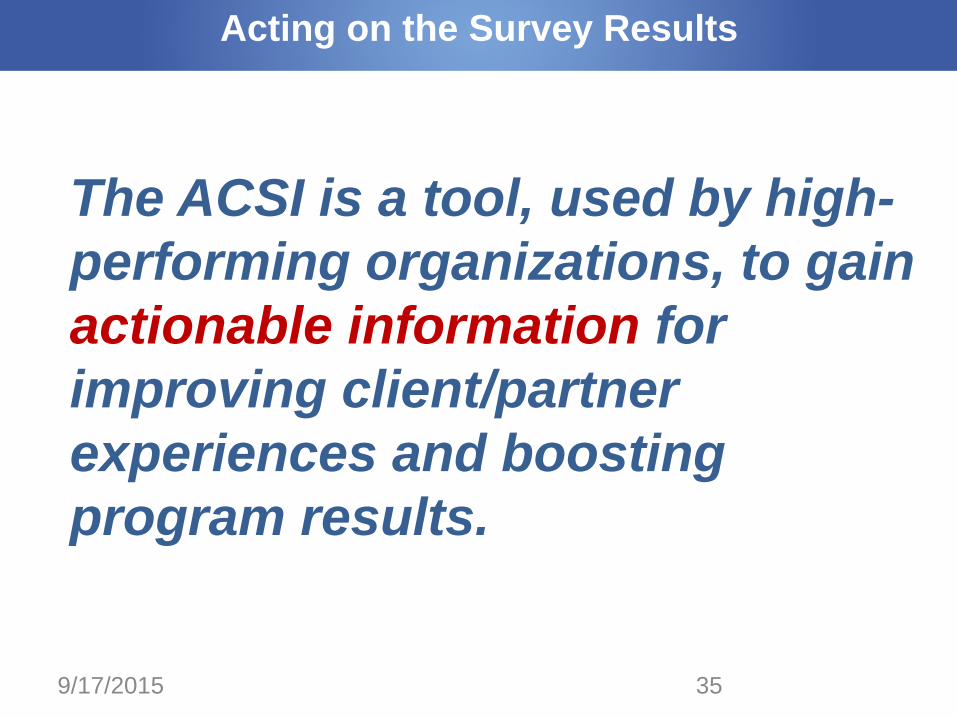
Acting on the Survey Results
The ACSI is a tool, used by high-performing organizations, to gain actionable information for improving client/partner experiences and boosting program results.
9/17/2015 35

Acting on the Survey Results
OCS 2012 Survey of the States Survey
Survey Results indicated OCS should focus on
improving:
• Timeliness of grant award information
• Grant Reporting Requirements
• Training and Technical Assistance
9/17/2015 36

Acting on the Survey Results
Actions Taken by OCS Frequent Dear Colleague Letters and Webinars to the
Network Revisions and Automation to the State Plan and Annual
Report Training and Technical Assistance (T/TA)
• Organizational Standards Center of Excellence • Learning Communities Resource Center • Risk Mitigation T/TA Center • Legal T/TA Center
Efforts to get out grant award information more quickly Federal Accountability Measures Grant Monitoring Improvements (Working Group)
9/17/2015 37

Acting on the Survey Results
Second State Survey in October
Questions Developed About Performance on the Federal Accountability Measures 1. State Plan Review and Acceptance
2. Grant Monitoring and Corrective Action
3. Data Collection, Analysis, and Reporting
4. Training and Technical Assistance
5. Communication
9/17/2015 38

Acting on the Survey Results
Key Points to Remember The survey results are an integral part of the
Federal and State Accountability Measures. The ACSI is a sophisticated “cause and effect”
model that identifies where to focus improvement efforts.
This is an opportunity!! Encourage your local
agencies to participate in the survey.
9/17/2015 39

Acting on the Survey Results
The Survey Report will… Show only aggregated results in order to preserve
the anonymity of the survey respondents. Be provided to the CSBG Lead Agencies and
eligible entities in early 2016 to use in developing the 2017 State Plans.
9/17/2015 40

Acting on the Survey Results
The Survey Report will… Identify key drivers of satisfaction for the eligible
entities that the State serves. Evaluate performance in each of these driver
areas where enough data has been collected Include the responses to the open-ended
questions. Give you an overall satisfaction score. (Not to be
published or be part of a ranking).
9/17/2015 41

The Survey Report: An Example
77
1.0
78
0.672
0.4
80
1.6
80
0.3
72
1.5
Outreach & Application
Review/AwardProcess
Accessing GrantFunds
AFI Staff
Network Staff
Reports
Customer Satisfaction
Index
73
79
2.5
Apply for future grant
82
3.0
84
2.8
Confidence
Recommend
75
1.3
Training andTA
77
1.0
78
0.672
0.4
80
1.6
80
0.3
72
1.5
Outreach & Application
Review/AwardProcess
Accessing GrantFunds
AFI Staff
Network Staff
Reports
Customer Satisfaction
Index
73
79
2.5
Apply for future grant
82
3.0
84
2.8
Confidence
Recommend
75
1.3
Training andTA
CSI Outcomes Components
77
1.0
78
0.672
0.4
80
1.6
80
0.3
72
1.5
Outreach & Application
Review/AwardProcess
Accessing GrantFunds
AFI Staff
Network Staff
Reports
Customer Satisfaction
Index
73
79
2.5
Apply for future grant
82
3.0
84
2.8
Confidence
Recommend
75
1.3
Training andTA
77
1.0
78
0.672
0.4
80
1.6
80
0.3
72
1.5
Outreach & Application
Review/AwardProcess
Accessing GrantFunds
AFI Staff
Network Staff
Reports
Customer Satisfaction
Index
73
79
2.5
Apply for future grant
82
3.0
84
2.8
Confidence
Recommend
75
1.3
Training andTA
CSI Outcomes Components
Scores: Measure performance. These are averages reported on 0 to 100 scale. Impacts: Indicate the impact a 5-point increase in a driver will have on Satisfaction. E.g. a 5-point improvement in Outreach & Application (impact of 1.0) will result in a 1.0 improvement in Customer Satisfaction Index.
9/17/2015 42

Satisfaction Index: Other Data (TBD)
73
70
73
77
50 60 70 80 90 100
Customer SatisfactionIndex
Overall satisfaction
Satisfaction compared toexpectations
Satisfaction compared toideal
Grantee Sub-Grantee/Contractor
Customer Satisfaction Index 74 72Overall satisfaction 77 76Satisfaction compared to expectations 74 72Satisfaction compared to ideal 71 67Sample Size 132 99
Satisfaction Index is 73 overall. No significant difference between Grantee (74) and Subgrantee (72) satisfaction.
9/17/2015 43

Satisfaction Index: Benchmarks
AFI compares favorably to other Grantee benchmarks.
75
74
73
72
71
69
65
63
63
Corporation for National andCommunity Service - Grantees
AFI - Grantees
AFI - Overall
AFI - Subgrantees
Corporation for National andCommunity Service - Senior Corps
Grantees
Federal Government Average
Office of the CFO, Education -State Grantees
Office of Disaster Assistance, SBA- Business Loan Recipients
Corporation for National andCommunity Service - AmeriCorps
State and National Grantees
9/17/2015 44

Acting on the Survey Results
The Goal: Continuous Improvement Discussions with OCS/Eligible
Entities Refine 2017 State Plan “Using data from a nationally administered
survey of eligible entities, and feedback for OCS and other sources, the State adjusted its plan to improve…”
9/17/2015 45

Final Word
The survey is now in the field. It’s was sent to all the eligible entities and the state associations on Monday.
The more people that respond to the survey, the better the
data. The better the data, the more actionable information you will
have to work with. So, now is the time to encourage your local agencies to
participate in the survey. You want to get their feedback. Their responses will be anonymous.
9/17/2015 46

QUESTIONS? COMMENTS?
9/17/2015 47