the alignment gap between creating value, performance...
TRANSCRIPT

IRRCi Research Report
The Alignment Gap Between Creating Value, Performance Measurement,
and Long-Term Incentive Design

The Alignment Gap between Creating Value, Performance Measurement, and Long-Term Incentive Design 2
The analysis, opinions and perspectives herein are the sole responsibility of the authors.
The copyright for this report is held by the IRRC Institute. The material in this report may be reproduced and distributed without advanced permission, but only if attributed. If reproduced substantially or entirely, it should include all copyright and trademark notices.
© Copyright 2014, Investor Responsibility Research Center Institute (IRRCi)
For more information, please contact:
Jon Lukomnik, Executive Director Investor Responsibility Research Center Institute (IRRCi) 40 Wall Street, 28th Floor New York, New York, 10005, United States of America T: (+1) 646-512-5807 [email protected] www.irrcinstitute.org
Report authors:
Mark Van Clieaf, Partner Karel Leeflang, Partner Organizational Capital Partners Organizational Capital Partners 3001 North Rocky Point Dr. E, Suite 200 14 Rue du Rhône Tampa, Florida, 33607, United States of America 1204 Geneva, Switzerland T: (+1) 813-600-5259 (+41) 76 512-2980 [email protected] [email protected] www.orgcapitalpartners.com Twitter: @OC_Partners
Stephen O’Byrne, President Shareholder Value Advisors 1865 Palmer Avenue Larchmont, New York, 10538, United States of America T: (+1) 914-833-5891 [email protected] www.valueadvisors.com

The Alignment Gap between Creating Value, Performance Measurement, and Long-Term Incentive Design 3
Table of Contents
Acknowledgements ................................................................................................................................................. 4
Background ............................................................................................................................................................. 5
Executive Summary ................................................................................................................................................. 8
Chapter 1: A primer in performance measurement, economic performance & total shareholder value alignment .............................................................................................................................................................. 11
Chapter 2: Research methodology ........................................................................................................................ 16
Chapter 3: Value creation fundamentals .............................................................................................................. 19
Chapter 4: Applying ‘Total Shareholder Return, EPS, Economic Profit & ROIC’ as performance metrics ............ 28
Chapter 5: A simple, four quadrant framework for understanding long-term performance .............................. 36
Chapter 6: An analysis of corporate life cycle and value quadrant performance ................................................. 44
Chapter 7: Does executive compensation align with value creation? .................................................................. 51
Chapter 8: Current state of long-term incentive plan design ............................................................................... 53
Chapter 9: Insights on Alignment .......................................................................................................................... 61
Chapter 10: Key Conclusions and Recommendations ........................................................................................... 64
Appendices ............................................................................................................................................................ 66
Glossary – Key terms ............................................................................................................................................. 79
List of tables and figures ....................................................................................................................................... 81

The Alignment Gap between Creating Value, Performance Measurement, and Long-Term Incentive Design 4
Acknowledgements
This is the first in a series of two reports. This report focuses on performance measurement, value creation, long-term incentive plan design, and pay for performance. The second report will examine Say-on-Pay proxy voting.
The research project was made possible by a research grant from the Investor Responsibility Research Center Institute (IRRCi). IRRCi Executive Director Jon Lukomnik played a critical in defining the project, offering feedback, and guiding the development of the work products.
The analysis and the related two reports in this series are unique; it is the first time that multiple databases have been woven together to create integrated insights about:
1. Economic performance and shareholder value (Data source: Organizational Capital Partners and Shareholder Value Advisors)
2. Pay for performance alignment and long-term incentive plan design (Data source: Incentive Lab and Shareholders Value Advisors)
3. Proxy voting for Say on Pay by institutional shareholders (Data source: FundVotes).
The insights from this research and series of reports for IRRCi would not have been possible without the analytical input, insights, collaborative teamwork of Steve O'Byrne, Shareholder Value Advisors as co-author; Jack Zwingli, Incentive Lab; Jackie Cook, FundVotes; Tom Hillman, Credit Suisse HOLT; and members of the team at Organizational Capital Partners: Mark Van Clieaf, Karel Leeflang, Marg Soden, Roland Burgman, Kelly Boyden, Lori Mattes, Al Risdorfer. We thank them all for their collaboration.

The Alignment Gap between Creating Value, Performance Measurement, and Long-Term Incentive Design 5
Background
Early in 2014 the Investor Responsibility Research Center Institute (IRRCi) asked Organizational Capital Partners to research the Standard & Poor’s 1500 companies relating to a question it had developed. This question was:
“What is the relationship between company economic performance, shareholder return and executive compensation?”
This seemingly simple question masks a highly complex piece of research and analysis to be performed. There are various studies looking at parts of the question, but none that undertake a comparative analysis to look at the level of alignment between:
1. Company performance (strategy development, strategy execution, intrinsic value creation) with a focus on economic profit and return on invested capital;
2. Shareholder return performance;
3. Executive compensation design and pay for performance alignment;
4. Say on Pay proxy voting by institutional investors and economic performance.
This research has required us to integrate the various databases that do exist in each of these areas. This resulted in a highly complex data set with no obvious connection points. We therefore had to introduce a number of measurement methods and analyses to contrast and compare, so as to create real insight about the level of alignment. We also note that the databases used for analysis overlap, but are not exactly the same. We believe the analysis of economic performance and long-term incentive design is valid despite those differences.
To focus the analyses, the research has been divided into two reports. This first report is focused on longer-term value creation fundamentals and whether or not economic value creation is aligned with executive compensation incentive design. This report also examines whether the existing metrics and design of executive compensation plans are fit for purpose as key inputs to value creation.
The second report will analyze how institutional investors and proxy advisory firms consider (or don’t) economic value creation in their analyses of executive compensation for “say on pay” voting.
We hope these reports will be of value to a number of audiences:
Institutional Investors - as a more effective basis for investment decision-making, say-on-pay proxy voting and corporate engagements.
Boards of Directors - as a more effective basis for setting, approving and monitoring overall business performance metrics; and for designing an executive compensation program that aligns to business strategy and incents real sustainable value creation;
Executive Management - as a more effective basis for aligning business strategy and performance measurement with longer-term strategic value creation;
Chief Financial Officers - as a basis for supporting executive management and the Board in the design and execution of business performance metrics and systems that provide insight into value creation;

The Alignment Gap between Creating Value, Performance Measurement, and Long-Term Incentive Design 6
Investor relations - as a basis for creating a more comprehensive narrative regarding business performance metrics and insight into value creation;
Chief Human Resources Officers, Compensation & Benefits leaders and Executive Compensation advisors - as a basis for supporting executive management and the Board in the design and execution of performance metrics, design of management structure and delegation of accountability design, executive incentive design, and enterprise talent management that enables innovation and sustainable total shareholder returns.
The Alignment Gap between Creating Value, Performance Measurement, and Long-Term Incentive Design 7
Introduction
To create sustainable value requires that, over time, the value of the outputs of a company exceed the total value of the inputs. Therefore, to determine financial value creation, a number of foundational principles are important. They are explained more fully later in this report, as appropriate, but here is a brief listing:
The best measure of economic value creation is economic profit, i.e. net operating profit minus a capital charge for invested capital. Economic profit, unlike conventional profit, subtracts input cost from output value to get true value creation. Economic profit (EP) can also be converted to return on invested capital (ROIC) as a measure of capital productivity;
Sound business strategy choices sometimes call for sacrificing current economic profit in order to increase future economic profit by an even greater amount, even after considering the time value of money. In evaluating business strategy and management performance, directors will have to evaluate whether the required future increase in economic profit is reasonably likely to occur;
The market enterprise value of a public company has two components: (1) the current value of capital and economic profit and (2) future value, i.e., the value of expected improvements in economic profit;
Understanding the current and future value components of total shareholder return can help executive management and directors understand the requirements of, and threats to, sustainable value creation, and thereby, do a better job evaluating business strategy and performance;
Meaningful economic value creation is ideally measured over the longer term. For the purposes of this report, we define this to mean a period of at least five years.
Mathematically, therefore this report uses the following formulas to measure corporate performance:
Economic profit = Net Operating Profit After Tax (NOPAT) minus Capital Charge
Net Operating Profit After Tax = EBIT minus Cash Taxes Paid
Capital charge = Invested Capital times Weighted Average Cost of Capital (WACC)
Current value = Invested Capital plus the Present Value of Current Economic Profit
Future value = Market Enterprise Value minus Current Value = the Present Value of Future Economic Profit Improvement
These financial formulas jointly provide the building blocks to compare performance between companies and to determine whether economic value is created and if this value creation is sustainable over time. It therefore provides insight into real company performance over longer time periods, and allows stakeholders to determine its alignment with shareholder value creation (economic profit growth and enterprise value growth), total compensation and long-term incentive-plan design for the most senior executives.
This report also provides a framework to segment companies by performance based on economic profit (including return on invested capital) and relative total shareholder return. This segmentation follows the life cycle of the firm, and the growth and decline of return on invested capital over time.

The Alignment Gap between Creating Value, Performance Measurement, and Long-Term Incentive Design 8
Executive Summary
Investors, directors and corporate executive management share common interests when it comes to company performance and economic value creation.
Yet, whilst this commonality is laudable, a review of performance measurement and long-term incentive plan design for USA public companies identifies that current practice is less than clear in measuring and aligning these interests in a manner that is robust and meaningful.
Existing approaches do not deliver a clear line of sight by which to manage or measure a company’s performance.
This report began by seeking to answer the degree of alignment that currently exists between company economic performance, shareholder return and executive compensation for the S&P 1500 companies.
The expectation was that the analysis could usefully serve as a marker in the ground and yet what it uncovered was unexpected.
The most common measurement tools and metrics used in enterprise performance measurement and the design of long-term incentives do not necessarily directly align with underlying sustainable value creation for shareholders.
Some 75% of companies have no balance sheet or capital efficiency metrics in their long-term incentive plan design,
Total shareholder return is, by far, the most dominant performance metric in long-term incentive plans, present in over 50% all plans,
Only about 17% of companies specifically disclose the use of return on invested capital or economic profit as a long-term performance measure for long-term executive compensation,
More than 85% of the S&P 1500 have no disclosed ‘line of sight’ process metrics aligned to future value, such as innovation, and related drivers.
On the positive side, the use of performance-based incentive vehicles in long-term incentive plan design has increased every year since 2009 - from 52% in 2009 to 76% in 2013
Amongst the most problematic of the findings is the lack of use of any balance sheet and capital-efficiency performance metrics in over 75% of listed companies.
Also, the focus on share price appreciation through total shareholder return (TSR) obscures more than it reveals with share price as a capital markets performance metric. Factors which impact TSR such as fund flows, central bank policies, macroeconomics, geo-political risks and regulatory changes are all beyond the control of executive management.

The Alignment Gap between Creating Value, Performance Measurement, and Long-Term Incentive Design 9
Compensation alignment
Economic performance explains only 12% of variance in CEO pay. The remainder is based on other factors largely beyond management control, for example:
Over 44% of CEO pay variance was explained by the size of the company based on revenues, the industry itself, and inflation.
Another 19% of CEO pay variance is explained by the consistency of corporate-specific compensation policy; that is, how much did the company pay in previous time periods.
“Long-term” incentive plan designs are, at best, “medium-term”
Only 10% of all long-term incentives have their disclosed longest performance period for named officers greater than three years.
Nearly a quarter of companies have no long-term performance based awards, relying instead stock options and time-based restricted stock in their long-term compensation plans.
Fewer than 15% of long-term plans include operating metrics such as innovation, new products, customer loyalty, environment and employee engagement; which drive future value creation.
Nearly 60% of companies changed their performance metrics for incentive design in 2013. The lack of stability of performance metrics, as well as frequent changes in the composition of the peer groups used for relative performance benchmarking -- one-third of companies changed 25% or more of their peer group in 2013 -- further reinforces a short-term focus despite the ostensible long-term nature of these incentive plans.
The short-term focus in most companies is further reinforced by long-term incentive plans with the longest performance period of three years or less.
A new performance lens
This report details how a reliance on traditional accounting metrics obscures a line of sight to the underlying drivers of current value and future value, which in turn drives total shareholder return.
That said, there are, of course, factors that executive teams can directly control and this report reveals that across all industry sectors, there are leadership teams that are forging ahead, consistently driving and building value creating growth and enterprise value over a five- to ten-year performance cycle. What also emerged from the analysis was a stark indication of the factors necessary to drive sustainable shareholder value and economic value creation over the longer-term.
The report suggests that companies have distinct life cycles characteristics. These life cycle stages of development or value quadrants directly correlate to performance and future prospects. Companies were segmented into four value quadrants:
Only 35% of S&P 1500 companies generated both five-year positive relative TSR and five-year (2008 – 2012) positive cumulative economic profit (ROIC exceeding cost of capital).
18% of companies over five years (2008 – 2012) had a negative relative TSR, while at the same time achieving a positive cumulative five-year economic profit (ROIC exceeding cost of capital).

The Alignment Gap between Creating Value, Performance Measurement, and Long-Term Incentive Design 10
17% of companies over five years (2008 -2012) had a positive relative TSR, but a negative five-year cumulative economic profit (ROIC less than cost of capital).
30% of companies over five years (2008-2012) had negative relative TSR and negative five-year cumulative economic profit (ROIC less than cost of capital).
By utilizing this analytical framework, or value quadrants, it is possible to identify consistently negative economic performance. Conversely, it is possible to identify value-creating growth and sustainable performance.
This framework is not industry sector specific. Every sector had both challenged companies, and companies whose leadership, strategy and execution allowed them to excel, as evidenced by the dispersion in results. On average, the performance spread between the 20th and 80th percentile for revenue growth was eleven times. The ROIC performance spread between the 80th percentile and 20th percentile was in the 300 to 400 basis point range. In other words, high performers are high performers no matter the sector. The high performers in almost every sector boasted both annual revenue growth greater than 15%, and also a ROIC greater than 15%.
Other
There is no single, silver bullet performance measure. Traditional accounting metrics such as EBITDA, earnings, and EPS have correlations to five-year shareholder returns in the 29% to 38% range. By including sales, growth in NOPAT, economic profit growth, and ROIC, the alignment between these operating drivers and shareholder returns on average rises to the 45% to 48% range, depending on the industry sector.
Median future value, as a percentage of enterprise value for the S&P 1500 has declined from 50% of enterprise value in 2001 to 27% in 2013. One reason may be that research and development investment and net, new capital expenditure investment, as a percentage of revenues, at the median, has also declined from 2.9% at its peak in 1998, to 1.7% in 2012. This is a 41% or 116 basis point decline in investment to create future enterprise value.
The Alignment Gap between Creating Value, Performance Measurement, and Long-Term Incentive Design 11
Chapter 1: A primer in performance measurement, economic performance & total shareholder value alignment
1.1. Current practice vs. value creation principles
Most companies use capital market and operating metrics to both to measure their performance and incent executives. The most common measures of capital market performance are total shareholder return (TSR) and relative TSR1. The most common measures of operating performance are earnings and earnings per share (EPS) growth.
TSR is significantly affected by market and industry factors, and hence, is not a robust measure of management performance or business strategy success. Relative TSR provides a better measure of management performance and business strategy success, but does not provide much insight about the requirements for, and threats to, sustainable value creation. In addition, relative TSR, as conventionally calculated, also assumes re-investment of all dividends, and hence, does not properly capture those situations where value is created by decreasing the level of capital invested in the business.
Earnings and EPS do not take into account the level of invested capital, cost of capital or future value built into enterprise valuation. So, for example, a company could boost higher earnings and higher earnings per share following a value-destroying acquisition, if that acquisition were paid for with debt that did not come due during the measurement period.
Economic profit is an enhanced and more effective value creation performance measure because it takes into account the amount of invested capital as part of measuring overall value creation. This is calculated as:
Economic Profit = Net Operating Profit After Tax (NOPAT) minus Capital Charge
Net Operating Profit After Tax = EBIT minus Cash Taxes Paid
Capital Charge in dollars = Invested Capital times Weighted Average Cost of Capital
Economic profit is actually a measure of profit after a minimum return for both invested equity and debt capital. Economic Profit can be converted to a return on invested capital number by dividing NOPAT by Invested Capital.
Economic profit is particularly useful for thinking about sustainable value creation because it can be used to split a company’s market enterprise value into current and future value, that is, the portion of the market value which represents the discounted cash flows from current operations and that which is based on expectations of future improvements, such as new products/services/markets, expected margin improvements, etc. This report uses five-year cumulative economic profit as a proxy for value creation from current operations and relative TSR as a proxy for value creation from increases in future value.
1 TSR is defined as the percentage gain or loss to shareholders (share price end of period minus share price beginning of period, plus dividends, divided by share price beginning of period). Relative TSR is defined as the company’s TSR relative to that of a specific comparator group

The Alignment Gap between Creating Value, Performance Measurement, and Long-Term Incentive Design 12
The premise that enterprise value is a discounted cash flow valuation has important implications:
Enterprise value can be expressed as the sum of invested capital and the present value of future economic profit. Economic profit is profit after a charge for all capital including equity capital.
Enterprise value is the sum of current value and future value. Current value is the sum of invested capital and the present value of current economic profit. For this report, we assume that the present value of current economic profit is its perpetuity value, i.e. current economic profit divided by weighted average cost of capital. Future value is the difference between market enterprise value and current value. It is also equal to the present value of expected future economic profit improvement or deterioration. Future value and its drivers are outlined in greater detail in chapter 3.2 of this report.
Investors can achieve a cost of capital return on market value even when economic profit declines. This does not mean that positive economic profit and or return on invested capital is unimportant, it just means that it is possible – and sometimes desirable – to sacrifice current economic profit and return on capital for expectations of even greater economic profit improvement and return on capital in the future.
A sustainable and viable business model must eventually provide consistent positive economic profit and a return on invested capital greater than its cost of capital. Without a reasonable expectation of positive economic profit then no amount of sales or earnings growth will create sustainable shareholder value.
However, current company executive compensation practices only weakly align operating performance and sustainable value creation.
Operating performance measures such as EPS growth and sales growth, are widely used to evaluate business strategies and determine executive compensation. However, in cases where the company has a cost of capital exceeding its return on capital, EPS growth and sales growth is in fact creating greater economic loss and in most cases are unsuitable as a measure for business strategy execution and incentive design.
TSR in excess of the cost of capital or positive relative TSR is widely accepted as evidence that more of the same operating performance – typically viewed as EPS growth and sales growth – will lead to positive excess returns in future. This linkage is accepted even when economic profit or economic profit improvement, return on invested capital (ROIC minus Cost of Capital) are negative. In those situations, positive excess returns cannot be sustained forever. Economic profit or economic profit improvement must turn positive before capital and liquidity run out, if the company is to be economically sustainable.
75% of companies do not disclose performance metrics aligned with balance sheet and capital efficiency such as ROA, ROE and ROIC.
90% of companies use of short-term performance periods, i.e., three years or less, in “long term” incentive plan designs.
Additionally, very few companies use a measure of future value in their executive incentive design, which would include measures such as return on innovation, growth and return from new product development and new markets.

The Alignment Gap between Creating Value, Performance Measurement, and Long-Term Incentive Design 13
1.2. Key findings from the research
1.2.1. General findings
Sustainable value creation is hindered by the shorter-term focus that is prevalent in the corporate world. This is illustrated by proxy statement disclosures, as 90% of 1200 listed companies CEO’s longest-accountable business-performance period as three years or less.2
As companies have become less capital intensive over the last fifteen years, both the amount of intangible capital that needs to be managed and other future value drivers are becoming more important. Managing future value and intangible capital has become a new executive management imperative.
Company results as reported by analysts and financial data providers tend to focus on top-line revenues and bottom-line earnings and EPS-type metrics. These metrics do not provide effective insight into the value-creating capacity of a company, as they do not take into account the level of invested capital.
The future value of mature and high-performing companies is relatively lower than companies with major performance problems and those that are in turn-around mode. Put another way, the management challenge (and risk of failure) for companies that destroy economic value and trade on future expectations is to create and implement a viable economic and business model that delivers sustainable value and higher returns on capital longer term.
Long-term enterprise performance
Total Shareholder Return (TSR) is the most frequently used performance metrics in long-term incentive compensation design. TSR is heavily influenced by market and industry factors outside of control of management. It is not a sufficiently robust metric to measure overall longer-term enterprise health and sustained performance. Relative TSR provides a better measure of management performance and strategy success, but does not, by itself, show whether value creation comes from current operations or increases in future value, and hence, does not help executive management, board or investors understand the requirements of, and threats to, sustainable value creation. Earnings and other common earnings related metrics are also insufficient measures of value generation.
Only 35% of S&P 1500 companies generated both five-year positive relative TSR and five-year positive cumulative economic profit (ROIC exceeding cost of capital).
43% of the S&P 1500 over the last ten years (2003 - 2012) had negative five-year cumulative economic profit. They failed to provide a return on invested capital (ROIC) greater than their weighted average cost of capital (WACC) over rolling five-year performance periods measured over ten years of observation.
Fewer than 15% of companies used performance metrics and long-term incentive-plan designs that align directly with future value drivers, such as innovation, new products, customer loyalty, environment and employee engagement.
2 Throughout this report, the pay for performance alignment analysis is based on the Incentive Lab universe of 1200 companies across the S&P 500, 400 and 600. The incentive Lab database includes details on compensation plan metrics and incentive plan design.
The Alignment Gap between Creating Value, Performance Measurement, and Long-Term Incentive Design 14
The future value (FV) for the S&P 1500 ranges from 33% at the median to 65% at the 80th percentile of enterprise value over the last ten years, depending on the company and sector. This implies that the capital market has a material expectation for growth and innovation beyond the next three years built into the company valuation. The corresponding (disclosed) measurement system to understand how executive management is explicitly creating future value is – in most companies – missing.
Median future value, as a percentage of enterprise value for the S&P 1500, has declined from 50% of enterprise value in 2001 to 27% in 2013. One reason may be that R&D and net, new capital expenditure investment, as a percentage of revenues, at the median, has also declined from 2.9% at its peak in 1998, to 1.7% in 2012. This is a 41% or 116 basis point decline in investment to create future enterprise value.
Executive compensation
90% of CEOs longest-accountable business performance period is three years or less, based on proxy statement disclosures for long-term incentive design.
75% of the 1200 company Incentive Lab universe disclosed metrics for named executive officer (NEO) performance measurement and long-term incentive design that are not aligned with value creation fundamentals. These performance metrics do not measure capital efficiency or balance sheet management performance. In other words, there is no disclosed performance metric similar to return on equity, return on invested capital, economic profit, or cash flow return on investment.
One out of five companies analyzed (250 of 1200 companies) in both the Incentive Lab executive compensation database and the Shareholder Value Advisors performance database were identified as value-destroyer companies. These companies delivered (1) five-year negative performance spread on invested capital, and (2) a five-year cumulative economic loss. At the same time these companies had no disclosed balance sheet or capital efficiency metrics aligned to long-term incentive plan design to monitor and reward value creation improvement.
For the S&P 1500, only 12% of the variance in CEO pay is explained by performance including relative TSR, ROIC and growth in Economic Profit.

The Alignment Gap between Creating Value, Performance Measurement, and Long-Term Incentive Design 15
1.3. Key insights
Enterprise value (EV) is the sum of two components: current value (CV) and future value (FV). Future value as a percentage of enterprise value for a ten-year period (2003 – 2012) for the S&P 1500 is 33% of EV at the median and 65% of EV at the 80th percentile for the S&P 1500.
In other words, future value is a significant contributor to enterprise and company valuation, though it is rarely isolated in performance measurement design and executive compensation plan design. As a consequence it is unlikely that the drivers of future value are being explicitly managed.
Figure 1: Excess shareholder returns value tree
This means a material contributor of the expected value of the firm is about the future strategy, innovation and growth beyond the next two to three years, but there is no direct alignment to disclosed value building metrics or executive incentive plan design for 85% of listed companies. Consequently, this lack of performance metrics alignment creates a risk for boards and investors.
Investors, directors, and executive management would enable enhanced value creation and shareholder alignment if they applied value-based performance measurement fundamentals in company performance management and planning, as well as in executive reward structures.
As a start, companies and investors could examine performance measures that:
Measure capital efficiency and economic value creation over time
Measure changes in future value
Measure value based on actual, not hypothetical, re-investment in the business3
3 For the advanced reader additional insights about excess returns can be referenced in the book ‘EVA and Value-Based Management’ by David Young and Stephen O’Byrne 3 See the appendix for a more detailed technical explanation of economic profit, TSR, excess returns and the impact on enterprise value

The Alignment Gap between Creating Value, Performance Measurement, and Long-Term Incentive Design 16
Chapter 2: Research methodology
Organizational Capital Partners and Shareholder Value Advisors provided the databases for the S&P 1500 and the data analytics used for this performance analysis. The core raw-data feeds and data sources for quality assurance checking were provided by: Compustat, ExecuComp, Morningstar, Hoovers and Credit Suisse HOLT. Incentive Lab provided their database and analytics for executive compensation incentive design for over 1200 S&P companies including the complete S&P 500, 80% of S&P 400 mid-cap and 5% of the S&P 600 small-cap universe.
As indicated in the charts below (figures 2,3,4), the companies in the ten-year performance analysis data set period (2003 - 2012) covered the S&P 1500 and spanned all 10 major global industrial classification (GICS) sectors and market capitalization (Large Cap: exceeding $4.6 billion, mid cap: between $1.0-4.5 billion, small cap: below $1 billion).
Figure 2: Market capitalization coverage by percent of companies
Figure 3: Global industrial classification sector (GICS) coverage

The Alignment Gap between Creating Value, Performance Measurement, and Long-Term Incentive Design 17
Figure 4: Market capitalization coverage in trillions for 2012
We analyzed by Global Industrial Classification Codes (GICS) at the 2-digit and 4-digit levels and by market capitalization size (S&P 500, 400, 600). The total market capitalization of the S&P 1500 companies analyzed represented over 90% of US market capitalization at $15 trillion.
We then classified companies in the S&P 1500 into four value-creation quadrants (based on economic profit versus relative total shareholder return). Adjustments were made for normalizing GAAP accounting data in calculating net operating profit after tax (NOPAT), invested capital, return on invested capital (ROIC), capital charge, economic profit (EP), performance spread (ROIC minus WACC) and cash flow return on investment (CFROI). These commonly applied adjustments are used to convert GAAP accounting data to value-based performance measurement.4
An additional performance analysis of the S&P 500 and 400, including the value quadrants, was completed to most closely align the economic profit and ROIC analysis with available long-term incentive plan design analysis and universe coverage from Incentive Lab. There was 91% coverage of the same companies for both economic performance analysis (Organizational Capital Partners and Shareholder Value Advisors) and long-term incentive plan design analysis (Incentive Lab) and the combined resulting insights. 4 ‘The Little Book of Valuation: How to Value a Company, Pick a Stock and Profit’, Aswath Damodaran, 2011, Wiley; ‘The Dark Side of Valuation: Valuing Young, Distressed and Complex Businesses’, Aswath Damodaran, 2010, Pearson Education; ‘Valuation: Measuring and Managing the Value of Companies’, McKinsey & Company, Tim Koller, Marc Goedhart, David Wessels, 2010, Wiley; ‘Expectations Investing: Reading Stock Prices for Better Returns’, Al Rappaport and Michael Mauboussin, 2001, Harvard Business School Publishing; ‘The Little Book That Builds Wealth: The Knockout Formula for Finding Great Investments’, Pat Dorsey, 2009, Wiley; ‘Best Practice EVA: The Definitive Guide to Measuring and Maximizing Shareholder Value’, Bennett Stewart, 2013, Wiley; ‘EVA and Value Based Management’, David Young and Stephen O’Byrne, 2001, McGraw Hill; ‘Wealth Creation: A Systems Mindset for Building and Investing in Businesses for the Long Term’, Bart Madden, 2010, Wiley; ‘CFROI Valuation; A Total System Approach to Valuing the Firm’, Bart Madden, 1999, Butterworth-Heineman; ‘The Valuation Handbook: Valuation Techniques from Today’s Top Practitioners’, Rawley Thomas and Benton Gulp, editors, 2009, Wiley; ‘Driven: Business Strategy, Human Actions and the Creation of Wealth’, Mark Frigo and Joel Litman, 2007, Strategy and Execution LLC; ‘Board Perspectives: Building Value Through Strategy, Risk Assessment and Renewal’, William Hass and Shepherd Prior IV, 2006, CCH Incorporated; ‘The Private Equity Edge: How Private Equity Players and the World’s Top Companies Build Value and Wealth’, Arthur Laffer, William Hass and Shepherd Prior IV, 2009, McGraw Hill

The Alignment Gap between Creating Value, Performance Measurement, and Long-Term Incentive Design 18
A further deeper economic performance analysis of the combined S&P 500 and 400 was completed to highlight each value quadrant and identified 32 example companies first screened against largest five-year economic profit or economic loss and then further segmented by largest five-year relative positive or negative total shareholder return (2008-2012). The 128 sample companies, 32 companies per value quadrant, represent most industry sectors and are identified in their respective value quadrant tables in the appendix.
We also tested five-year rolling performance periods over five-year (2008-2012) and ten-year observation horizons (2003 - 2012) to ensure that the global financial crisis of 2007-2008 did not materially skew the economic performance and return on invested capital results across the S&P 1500 dataset.
Key adjustments and financial formulas (many which are defined in the glossary at the end of this report) for performance comparison normalization include:
R&D amortization over five years
Use of cash taxes paid in calculating NOPAT
Capitalized special items (after-tax) including discontinued operations and amortization on a five-year straight line basis
Subtraction of excess cash greater than 2% of revenue from invested capital
NOPAT = EBIT minus cash taxes paid
Invested Capital = total assets (including goodwill) minus non-interest bearing current liabilities minus capitalized special items (after-tax special items, discontinued operations) minus excess cash plus capitalized R&D
Return on invested capital = NOPAT divided by invested capital, including goodwill
Cash flow return on investment, including goodwill
Weighted average cost of capital (WACC) is done by GICS industry group and not by individual company
Capital charge = beginning-period invested capital times WACC
Enterprise value = market value of equity plus book value debt minus excess cash
Current value (CV) = economic profit divided by WACC plus invested capital
Enterprise value (EV) = [economic profit divided by WACC plus invested capital] plus future value
Future value (FV) as a percentage of enterprise value = FV divided by EV
Total shareholder return (TSR) assumes reinvestment of all dividends and cash equivalent distributions
Relative TSR is calculated using a company wealth index and a wealth index for the companies GICS industry group; TSR is calculated from monthly total returns

The Alignment Gap between Creating Value, Performance Measurement, and Long-Term Incentive Design 19
Chapter 3: Value creation fundamentals
3.1. Business strategy, return on invested capital and economic profit
Return on invested capital (ROIC) provides the clearest picture of exactly how efficiently a company is using all its capital, and whether or not its competitive positioning, innovation and growth strategy allows it to generate profitable returns from that capital. Consistent positive or negative ROIC is a powerful indicator of whether or not a company has a competitive advantage, a winning or losing strategy, and the quality of execution.
ROIC = Net Operating Profit After Taxes (NOPAT) divided by Invested Capital
NOPAT = (Earnings Before Interest & Taxes) minus Cash Taxes Paid
The numerator for ROIC, which is NOPAT, is a non-standard measure, meaning you will not find it on standard financial statements, though it is widely used. NOPAT, invested capital and ROIC are recognized widely in both the strategy and finance literature for being robust measures of strategic value creation, as well as by key business strategy consulting firms and sell-side analysts. The term ‘net operating profit after tax’ is fairly descriptive, but NOPAT can be seen as simply net income with interest expense (net of taxes) added back. These recognized adjustments determine what the profit would be without taking a company's capital structure (level of debt versus equity) into consideration.
For the denominator in ROIC, invested capital is another non-standard calculated measure that is not found on standard financial statements. Invested capital tries to measure exactly how much capital is required to operate a business. It can be defined as:
Invested Capital = Total Assets minus Non-Interest-Bearing Current Liabilities minus Excess Cash
This equation introduces two new terms that need some explanation.
The most salient examples of a non-interest-bearing current liability are accounts payable and taxes payable. The reason the value-creation literature subtracts accounts payable from the invested capital base is because accounts payable represent financing provided by a company's suppliers, not by the company’s investors. Since the financing costs of accounts payable are included in cost of goods sold and SG&A, we don’t need to include them in the capital base that requires a return from NOPAT. Similarly, taxes payable represent financing provided by the government, not by the company’s investors.
Excess cash can be defined as the cash a company has and that is not required to operate the business. For example, Apple clearly did not need the full $29 billion in cash and investments it had on hand in 2012 to keep the business running, and thus adjustments are made to subtract a portion of that cash (the excess over 2% of revenue) from invested capital, because that capital is not really invested in operating the current business, thought it may be invested eventually in future research and development efforts, marketing, acquisitions, etc., or perhaps used to fund share buybacks or special dividends.
When the ROIC is greater than weighted average cost of capital (WACC), then value is created. When the ROIC is less than WACC, then value is destroyed and the business strategy is not creating value.

The Alignment Gap between Creating Value, Performance Measurement, and Long-Term Incentive Design 20
The weighted average cost of capital (WACC) is calculated as a weighting of how a company’s assets are financed using debt and equity capital and the cost of capital for each financing category.
WACC = (Weight of Equity times Cost of Equity) plus (Weight of Debt times Cost of Debt)
The after tax weighted cost of capital is the hurdle rate or return the enterprise requires to achieve a minimum return to both debt and equity capital providers. The WACC is also usually the discount rate used to determine the net present value of investment projects in discounted cash flow analysis. The median WACC for the S&P 1500 for the last 5 and 10 years is approximately 8%.
The difference between ROIC minus cost of capital is known as the performance spread.
ROIC minus WACC = performance spread
ROIC exceeding WACC = value creation
ROIC lower than WACC = value destruction
The performance spread (ROIC minus WACC), and its growth or decline, is a measure of the business strategy and its effectiveness in creating competitive advantage and value creation for shareholders over time. This performance spread, as a key indicator of value creation, would ideally be key to the design of and metrics for executive compensation plans.
In general, when a business model has a consistently negative performance spread, it signals there is a potential business strategy, economic model and/or strategic leadership problem that executive management, directors and investors need to comprehend and address. Conversely, a longer-term positive performance spread indicates that the board and executive management team are providing effective stewardship of invested capital.
ROIC can also be converted from a return number into a dollar value, called economic profit (EP). Economic profit is another non-standard measure not found on standard financial statements. Economic profit is a recognized, value-based performance measure, and is the real profit generated after deducting a capital charge for the cost of capital from NOPAT. The capital charge is simply the level of invested capital multiplied by the weighted average cost of capital (WACC) and can be calculated at either the firm or industry-sector level.5
The diagram below (figure 5) shows the breakdown of these concepts into their relative sub-components. It visually illustrates the direct line of sight relationships between NOPAT, invested capital, cost of capital and the creation of economic profit.
5 For the purposes of this report, Weighted Average Cost of Capital (WACC) was calculated at the industry-sector level

The Alignment Gap between Creating Value, Performance Measurement, and Long-Term Incentive Design 21
Figure 5: Economic profit value driver tree
Economic profit (EP) is a performance metric that can be applied to assess the effectiveness of business strategy in creating value. Conversely, similar to a low ROIC company, a company with longer-term cumulative negative economic profit signals that the company has a significant challenge with its business strategy, economic model and/or executive leadership. Executive management, boards and investors who oversee companies with consistent negative economic profit would want to consider a review of their business strategy, performance metrics’ design and long-term incentive design, and consider the extent to which they align with achieving longer-term, positive economic profit. It may also be necessary to take a critical look at the firm’s management team itself and the organization structure.
A number of leading consulting firms apply economic profit and ROIC value-creation principles and performance metrics.6 This includes firms such as McKinsey, Marakon, L.E.K. Consulting, BCG, Deloitte, Accenture and Stern Stewart. These value-based performance metrics and analytics are also applied by a number of leading investment banks and equity research providers because of the strategic insights they provide into company valuation. They include: Goldman Sachs, Bank of America Merrill Lynch, Barclays, Credit Suisse, UBS and Morningstar.
While standard accounting measures offer a consistency of approach for financial reporting, compliance and corporate governance, they have drawbacks for defining value creation and thus as to their usefulness as the basis for long-term performance assessment and as incentive metrics for executive compensation plans. The key drawbacks of these common accounting-based performance metrics and reporting are (1) an emphasis on past performance, (2) limited insight on five-year or longer strategic performance and trending, (3) a failure to recognize the level of invested capital required to generate profits, and (4) a potential penalty for investing in new technologies, new
6 McKinsey on Finance, Spring 2002, ’Balancing ROIC and growth to build value’; McKinsey Quarterly, January 2011, ‘Have you tested your strategy lately’; Marakon Commentary, November 2013, ‘Economic Profit Growth: Simply the best single strategic indicator for managing value creation’

The Alignment Gap between Creating Value, Performance Measurement, and Long-Term Incentive Design 22
markets and new products. This penalty occurs because these investments usually negatively impact short-term earnings and earnings per share (EPS) performance results.
Why do value-based metrics (such as economic profit and ROIC relative to the cost of capital) have a tighter alignment to TSR and relative TSR than the more commonly used metrics such as net income, EPS or return on equity?
In contrast to traditional accounting metrics, value-based measures include the cost of capital (debt and equity), as a real expense against the income statement. The use of a capital charge (invested capital multiplied by WACC) also creates the bridge to a core-finance concept known as a discounted cash flow valuation. Discounted cash flow (DCF) valuation is a method of valuing an asset or a business using the time value of money. DCF value is the present value of expected future cash flows discounted at the cost of capital. It can also be expressed as the sum of book capital and the present value of future economic profit
By bridging this key gap between traditional accounting measures and performance metrics related to sustainable value creation, critical insights are generated into the longer-term value creation track record of a company (and its management team and Board), as well as the underlying economic performance trends.
As an illustration of this critical insight: revenue growth, when a company has a negative performance spread (ROIC lower than WACC), actually generates negative economic profit, proving that not all growth creates value. That, for example, was the case for many Japanese companies in the early 1990’s, when they pursued a growth-at-all-costs strategy. Such a strategy may be logical for a finite period of time, for instance when attempting to expand market share, but is not sustainable forever.
3.2. Current value and future value as drivers of total shareholder return
Total shareholder return (TSR) is the most frequently used metric in long-term incentive designs for named executive officers of public companies in the USA. The challenge is that not all TSR results are equal in terms of their performance implications. There are times when TSR is positive, while there is also a negative return on invested capital and negative economic profit. Indeed, this is common in start-up companies where investors understand that capital is being consumed to build products, services, or markets. The reverse can also be true when there is a negative TSR (for example during the most recent global financial crisis), yet the underlying business fundamentals have positive and or increasing economic profit and ROIC. Thus TSR, as a performance measure in the short-term, may not necessarily be aligned with underlying sustainable value creation such as growing economic profit and a positive ROIC.
Economic profit and invested capital are the two key inputs used in calculating the current value (CV) of the firm. In calculating the current value there are three key steps. First the economic profit of the firm needs to be calculated. From this step, the economic profit is divided by the firm’s cost of capital (WACC) that creates a net present value calculation of the value stream of current economic profit in perpetuity. This is the discounted cash flow calculation that is the foundational math to valuing the current value drivers of enterprise value. Adding the net present value of economic profit to the level of invested capital used to generate the operating profit stream establishes the current value of the firm.

The Alignment Gap between Creating Value, Performance Measurement, and Long-Term Incentive Design 23
Economic Profit = NOPAT minus Capital Charge
Net Present Value of Economic Profit = Economic Profit divided by WACC
Current Value (CV) = Economic Profit divided by WACC plus Invested Capital
The following diagram below (figure 6) shows the breakdown of these concepts into their relative sub-components. It illustrates the direct alignment and value creation math between NOPAT, capital charge, economic profit, invested Capital and the current value of the enterprise.
Figure 6: Current value driver tree
This more granular breakout of NOPAT and the capital charge, along with the growth in sales, ROIC together explained 48% of shareholder returns over the study period.7 Further details on these explanatory insights and correlation of operating driver metrics with shareholder returns are detailed in chapter 5. The reason why the more granular breakout has better correlation and explanatory insight with shareholder returns, than only economic profit, is that invested capital has a delayed productivity factor and does not provide a full return on day one. Capital invested in R&D, new capital expenditures, and other intangible capital such as brands, structural and human capital may take years after investment to reach maximum productivity impact in driving growing sales, economic profit and returns on invested capital.
7 The dependent variable in the regression is the five-year shareholder return standardized by beginning sales, or as a formula: [(market equity value [ending period] – market equity value [beginning period]) + future value of free cash flow to equity / sales [beginning period] calculated over a five-year period. The process standardizes by a size measure to ensure that large companies do not dominate the regressions. The process uses sales, rather than beginning market equity value as our size measure, because it makes predicted value creation independent of beginning market value. The process uses sales, rather than beginning book capital, as a size measure to distinguish the value contribution of income from the value contribution of ROIC.

The Alignment Gap between Creating Value, Performance Measurement, and Long-Term Incentive Design 24
Future value (FV) is the other core component of enterprise value (figure 7), yet it is rarely isolated to fully understand an integrated performance picture of what drives TSR. Future value, as a calculation, is a simple subtraction of current value from enterprise value (the enterprise value for a public company is easily found on the Internet through Yahoo Finance or other financial-content focused websites). The remaining number is the future value, or the present value of future economic profit improvement already built into company valuation and stock price by the market.
Future Value = Enterprise Value minus Current Value
Figure 7: Enterprise value driver tree
Future value is more than just a simple mathematical number decomposed from enterprise value; it represents what the capital markets expect with respect to:
Improvement in future economic profit from current operations;
Future economic profit from new growth and innovation beyond current operations, which it has built into enterprise valuation and discounted back to the present;
Future value represents expected growth, innovation, and discounted future economic profit, as well as ROIC from new products or services and entry into new markets, creating new business models and potentially new industries. The diagram below (figure 8) shows the breakdown of these concepts into their relative sub-components. It illustrates many of the key inputs to future value.

The Alignment Gap between Creating Value, Performance Measurement, and Long-Term Incentive Design 25
Figure 8: Future value driver tree
Together, current value (value being created from economic profit from current operations) and future value (expected value from innovation and growth from future economic profit) directly drive the growth in both enterprise value and TSR over time.
In addition, factors such as fund flows, market dynamics, central bank policies, macroeconomics, and geo-political risk – all of which are beyond the control of executive management - affect the future value because the capital market perceptions are built into the more speculative estimation of future growth, revenues from new products/services.
As companies have become less capital intensive over the last fifteen years, both the amount of intangible capital that needs to be managed and the future-value drivers are becoming more important to create sustainable longer-term shareholder returns. Managing them has become the new executive management imperative.
Examples of these FV and CV performance indicators and their respective contribution to enterprise value are in the following table (figure 9) for sample companies in the S&P 500. Current operating metrics like sales, earnings, and EPS will have a lower correlation to TSR at companies like Netflix, Amazon, Home Depot, Nike and MasterCard, because over 40% of the enterprise value for these companies is about future value, and not current value or current earnings. Material growth and innovation expectations are built into the current enterprise value of these companies.

The Alignment Gap between Creating Value, Performance Measurement, and Long-Term Incentive Design 26
Figure 9: Future value of sample companies, as of 2012 year end
Company
Enterprise Value 2012 $ M
Current Value 2012
$
Future Value 2012 $ M
CV% Enterprise
Value 2012
FV% Enterprise
Value 2012
SALESFORCE.COM $23,231 $2,404 $20,057 10.30% 89.70%
NETFLIX $11,384 $3,797 $7,587 33.40% 66.60%
AMAZON.COM $116,989 $51,572 $65,416 44.10% 55.90%
CARMAX $16,608 $8,053 $7,649 48.50% 51.50%
MASTERCARD $62,559 $33,730 $28,829 53.90% 46.10%
HOME DEPOT $121,800 $67,342 $54,458 55.30% 44.70%
ECOLAB $30,606 $17,557 $13,049 57.40% 42.60%
STANLEY BLACK & DECKER $17,859 $10,613 $5,028 59.40% 40.60%
HERSHEY CO $21,689 $13,007 $8,682 60.00% 40.00%
NIKE $53,613 $32,216 $21,397 60.10% 39.90%
SHERWIN-WILLIAMS $19,146 $11,666 $7,480 60.90% 39.10%
STARBUCKS $39,577 $24,259 $15,318 61.30% 38.70%
ALLERGAN $33,106 $21,063 $12,043 63.60% 36.40%
EBAY $66,624 $43,721 $22,903 65.60% 34.40%
PROGRESSIVE CORP $15,245 $10,042 $5,203 65.90% 34.10%
ADP $28,309 $19,203 $9,106 67.80% 32.20%
INTUITIVE SURGICAL $18,346 $12,734 $5,612 69.40% 30.60%
PPG INDUSTRIES $26,218 $18,288 $7,930 69.80% 30.20%
COLGATE-PALMOLIVE $63,016 $44,959 $18,057 71.30% 28.70%
HARLEY-DAVIDSON $16,667 $12,264 $4,403 73.60% 26.40%
DU PONT $68,929 $52,340 $16,589 75.90% 24.10%
MCDONALD'S CORP $114,071 $89,427 $24,644 78.40% 21.60%
Together these core inputs of current value and future value drive the change in enterprise value and stock price over the performance period and the level of dividends funded from current operations. In turn, mathematically they also drive the TSR calculation over the measurement period as illustrated in the below TSR value driver tree (figure 10).

The Alignment Gap between Creating Value, Performance Measurement, and Long-Term Incentive Design 27
Figure 10: Total shareholder return value driver tree
The key strategic question is therefore how much of enterprise value and TSR is being driven by current value and its economic profit value drivers, and how much is being driven by an expectation for growth and innovation beyond current operations, and how investors value those expectations.
Figure 48 in the appendix shows the median future value by industry sector. Future value is also reflected in the price earnings (P/E) ratio of the firm. The higher the future value is as a percentage of enterprise value (FV divided by EV), the higher the price-earnings ratio (Market Value of Equity divided Net Income).
Thus the real underlying drivers of enterprise value and total shareholder return are:
1. Growth in economic profit and current value (CV) over the measurement period
2. Growth in future value (FV) and future economic profit (EP) over the measurement period based on disclosed strategies for investment and growth disclosed to shareholders and equity analysts
In summary, the core value creation math and permutations of these formulas that need to be recognized and applied for enterprise performance management to directly align to total shareholder returns are:
1. Enterprise value = market value of equity plus market value debt minus excess cash;
2. Enterprise value = present value of free cash flows discounted at the weighted average cost of capital;
3. Enterprise value = invested capital plus present value of economic profit discounted at the weighted average cost of capital;
4. Enterprise value = invested capital plus present value of current economic profit plus present value of economic profit improvement;
5. Enterprise value = current value plus future value;
6. Amount of excess shareholder returns relative to weighted average cost of capital = dollar amount contribution from excess economic profit improvement plus dollar amount change in future value.

The Alignment Gap between Creating Value, Performance Measurement, and Long-Term Incentive Design 28
Chapter 4: Applying ‘Total Shareholder Return, EPS, Economic Profit & ROIC’ as performance metrics
4.1. Understanding TSR
Total shareholder return (TSR) has become the most frequently used performance measure in long-term incentive plan design for named officers. However, as noted above, TSR can reflect exogenous factors, such as investor sentiment and fund flows. Analysis of the S&P 1500 identifies that 17.3% of listed companies over five years (2008 -2012) had a positive relative TSR, while at the same time they achieved a five-year cumulative negative economic profit and a five-year return on invested capital which was less than their weighted average cost of capital (WACC).
Expressed another way, relative TSR was positive, while these companies generated an economic loss over five years (ROIC lower than WACC) with a five-year average ROIC of only 4.6%.
Figure 11: Five-year rolling cumulative economic profit versus five-year relative TSR (period: 2008 – 2012)
At the same time, our analysis of the S&P 1500 identified that 17.9% of companies over five years (2008 – 2012) had a negative relative total shareholder return, while at the same time achieving a positive cumulative five-year economic profit and a positive five-year ROIC greater than WACC (five-year average ROIC of 14.6%). These companies, in the upper left quadrant, have a value-creating business model, with a five-year positive cumulative economic profit and a return on invested capital greater than their cost of capital, but for a number of reasons their relative TSR has been negative over five years. Many examples of this occurred during the recent global credit crisis.
The upper right and lower left quadrants of respectively positive/positive or negative/negative relative TSR and economic profit, confirms a level of alignment between TSR and economic profit.
Over a ten-year (2003–2012) performance analysis of the S&P 1500 companies, with five-year rolling-performance periods (figure 12) the overall distribution of those companies falling into these quadrants with positive TSR and at the same time negative economic profit (bottom right) or negative TSR, while delivering positive economic profit and ROIC greater than their cost of capital (upper left), did not materially change.
When reviewed over the last ten years of observation, the two lower quadrants with rolling five-year cumulative negative economic profit add up to 42.5% of the S&P 1500 (figure 12). This means these

The Alignment Gap between Creating Value, Performance Measurement, and Long-Term Incentive Design 29
companies did not meet the sustainable value-creation test of providing a return on invested capital (ROIC) greater than their cost of capital (WACC) over rolling five-year performance periods over ten years of observation.
This performance classification by quadrant can help executive management and directors bring into high focus the key strategic value creation issues their company may be facing:
Quadrant 1 bottom right: will the business model allow the company to earn a positive return on capital in the near future and what is the plan to get there?; Strategic questions include whether scale, increased brand awareness and new products will create positive economic profit in the next three to five years? Is economic profit growth trending positive or further negative?
Quadrant 2 upper right: both current and future value are growing and how can the company sustain that performance?; Strategic questions include whether positive economic profit, economic profit growth, future value and TSR are all in alignment?
Quadrant 3 upper left: the company’s current economic fundamentals are robust with positive economic profit and return on invested capital; Strategic questions include whether economic profit growth may be declining due to competitive and margin pressure, the quality and quantity of the new products pipeline, and do investors see clouds on the horizon (creating negative relative TSR)?
Quadrant 4 lower left: the company’s economic fundamentals and expectations for future growth are poor; Strategic questions include whether the business should be right sized or divested, is there a sensible business model transformation plan to restore to a positive return on invested capital and economic profit?
Figure 12: Five-year rolling cumulative economic profit versus five-year relative TSR over ten years of observation (period: 2003 – 2012)

The Alignment Gap between Creating Value, Performance Measurement, and Long-Term Incentive Design 30
4.2. Implications of long-term business performance versus TSR review
Investors, Directors and executive management interested in creating long-term value and shareholder alignment should be concerned about the sustainability of value creation, not just TSR and the current share price. Sustainability is all about the company’s ability to achieve positive economic profit growth over time and an ROIC > WACC.
Due to the many factors beyond Board and management control, holding the CEO and named officers accountable for managing a company’s share price – or rewarding them for share price appreciation – does not focus on the longer-term economic fundamentals of the business. Share price is primarily a capital markets metric and not a business operating performance measure: it simply does not create the level of alignment between economic value creation fundamentals and executive accountability that investors ideally desire, and potentially encourages value-destroying action (e.g. some M&A activity, strong focus on value extraction, share buy-backs beyond what is economically rational, short-termism etc.).
However, executive management can be held accountable for and measured on business fundamentals and value creation drivers, which are core inputs into TSR. Value creation drivers, over which managers have more direct ‘line of sight’ decision authority, include growth in sales, NOPAT, capital charge, economic profit and the firm’s ROIC, relative to its cost of capital. Of course, those measures would ideally be calculated over the longer term.
Earnings and Earnings per Share (EPS) are the second most frequently used performance metrics in long-term incentive design. However, earnings and EPS are not adequate business performance metrics to align to sustained, longer-term TSR and relative TSR, as they do not take into account the level of invested capital, cost of capital, return on capital or future value built into enterprise valuation. Therefore, EPS as a longer-term performance metric is incomplete as it is only an income statement measure. For example, EPS is also subject to increase due to share buybacks with no underlying increase in the fundamental business performance. This is why net income and net income growth only have a correlation with shareholder returns in the 29% to 38% range (see section 5.3 for further details on correlations).
4.3. Sustainable TSR, Economic Profit, ROIC – a ten-year review for S&P 1500
Having established a core foundation for assessing value creating performance for public companies (intrinsic value creation and equity market returns) we have undertaken a performance review of the S&P 1500 over the last five-year (2008 – 2012) and ten-year (2003 – 2012) performance periods in setting benchmarks for review by executive management, boards and long-horizon investors.
Not all sales growth generates positive economic profit and thus ROIC in excess of its cost of capital. By analyzing both sales growth and economic profit we get a more comprehensive understanding of “value creating” and “value destroying” growth.
The upper right-hand performance quadrant in the table below (figure 13), illustrates that over the five-year performance period (2008 – 2012), only 33.9% of the S&P 1500 met two performance conditions: positive five-year sales growth relative to the median of their industry sector peer group and five-year positive cumulative economic profit.

The Alignment Gap between Creating Value, Performance Measurement, and Long-Term Incentive Design 31
Figure 13: Five-year sales growth & five-year cumulative economic profit (2008-2012)
Viewed in a different way, above-median sales growth does not necessarily create value: 32% generated a negative cumulative economic profit over five-years (the blue box in the figure above: 15.8% divided by 49.7%) and below-median growth is not necessarily value destroying: 39% of these companies actually created positive cumulative economic profit over five years (the amber box in the figure above: 19.6% divided by 50.3%).
This shows that the pursuit of sales growth in itself is not a value creating strategy unless the business model provides a positive return on capital and/or an underlying upward trend in increasing ROIC. The finding from this analysis illustrates the business strategy and performance challenges coming out of the global financial and credit crisis of 2007 – 2008.
If we take a longer-term, more granular analysis of performance of the S&P 1500 over the last ten years (2003 – 2012), the strategic performance challenge of finding the ‘sweet spot’ in balancing sustained revenue growth and higher returns on capital becomes clear (figure 14). Only 15% of the S&P 1500 were able to maintain a compounded yearly revenue growth over the ten-year performance review period greater than 10%, and at the same time achieve a sustained return on invested capital (ROIC) greater than 15% over the same period. The median weighted average cost of capital for the S&P 1500 is approximately 8% over the last 10 years and thus those companies with an ROIC less than 9% are generating a return close to if not below their cost of capital.

The Alignment Gap between Creating Value, Performance Measurement, and Long-Term Incentive Design 32
Figure 14: S&P 1500: Ten-year average ROIC versus ten-year compounded sales growth
Looking only at the S&P 500, which represents the largest companies, some 17% of companies boasted compounded sales growth in excess of 10% and ROIC exceeding 15%, including goodwill. This validates that the business models of some of the larger companies have been able to keep up their longer-term growth, innovation and higher return on capital.
Figure 15: S&P 500: Ten-year average ROIC versus ten-year compounded sales growth
4.4. A ten-year sector review of performance of the S&P 1500 – Key drivers
Over the last ten years, the top performing sectors with five-year rolling revenue growth over the ten years of observations were: life sciences, energy, software, healthcare, diversified financials, food and technology hardware sectors. All had a median, annual revenue growth rate over a rolling five-year performance period of more than 11%, including inflation.

The Alignment Gap between Creating Value, Performance Measurement, and Long-Term Incentive Design 33
See the chart below (figure 16) and in the appendix the table (figure 46) for the 24 major GICS sectors and their median sales growth, median ROIC, median WACC, median future value statistics.
Figure 16: Five-year rolling sales growth periods, over ten years (period: 2003 – 2012)
Over the last ten years the sectors with higher five-year median ROIC were: diversified financials, household products, banks, retail, health care equipment, food and beverage. All had a median ROIC greater than 11%. Figure 17 below and 48 in the appendix show ROIC statistics for the 24 major GICS sectors. (NB: For the financial services sector (banks, insurance, diversified financials) the analysis of ROIC uses only equity capital, and thus, is really a measure of return on equity. This is done because a majority of invested capital is provided by customers in the form of deposits and premiums and therefore technically is not investor capital.)
The Alignment Gap between Creating Value, Performance Measurement, and Long-Term Incentive Design 34
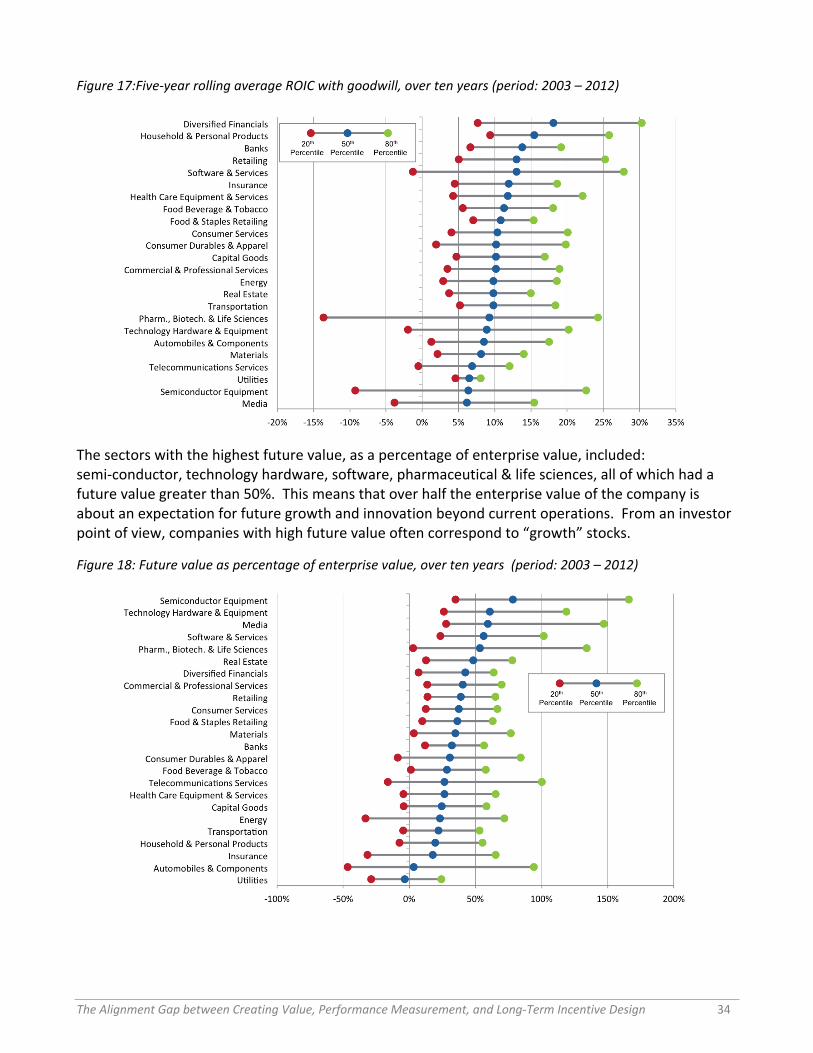
Figure 17:Five-year rolling average ROIC with goodwill, over ten years (period: 2003 – 2012)
The sectors with the highest future value, as a percentage of enterprise value, included: semi-conductor, technology hardware, software, pharmaceutical & life sciences, all of which had a future value greater than 50%. This means that over half the enterprise value of the company is about an expectation for future growth and innovation beyond current operations. From an investor point of view, companies with high future value often correspond to “growth” stocks.
Figure 18: Future value as percentage of enterprise value, over ten years (period: 2003 – 2012)
The Alignment Gap between Creating Value, Performance Measurement, and Long-Term Incentive Design 35
4.5. Key insights
Almost every sector had 80th percentile annual revenue growth greater than 15% with a ROIC greater than 15%. The performance spread between the 20th and 80th percentile for revenue growth was, on average, eleven times. The performance spread between the 80th percentile and 20th percentile in ROIC was in the 300 to 400 basis point range.
The other critical insight from this industry sector review is that 9 of the 24 industry sectors have a median future value of 40% or greater, and 19 of the 24 industry sectors had a future value median of 24% or greater. Thus, across the majority of sectors and companies, future value is a significant part of enterprise value, and the embedded expectation for future growth, innovation and economic profit improvement. Yet, as we will see, few companies have specific performance metrics directly aligned to innovation and growth value drivers to enable the creation of future value.
The implication of these performance analytics is that the industry sector alone does not explain differences in economic performance. Within each of the 24 major industry sectors, there are executive teams that have developed and implemented business strategies, business and economic models, and a level of innovation that has created sustained intrinsic shareholder value over five- to ten-year performance cycles. There are also many that have not, some of which are in the bottom quintile (below the 20th performance percentile) over five years and longer.

The Alignment Gap between Creating Value, Performance Measurement, and Long-Term Incentive Design 36
Chapter 5: A simple, four quadrant framework for understanding long-term performance
5.1. Value quadrants
The value quadrant model is a simple way for analyzing and segmenting performance based on two performance metrics for evaluating value creation:
1. Relative TSR (as a proxy for the change in future value)
2. Economic profit
These metrics provide four performance scenarios (value quadrants), which also equate to the life-cycle stages of a company as follows:
Figure 19: Value quadrant performance metrics
Value Quadrant Performance Metrics
1 Positive Relative TSR and Negative Economic Profit (ROIC lower than WACC)
2 Positive Relative TSR and Positive Economic Profit (ROIC exceeds WACC)
3 Negative Relative TSR and Positive Economic Profit (ROIC exceeds WACC)
4 Negative Relative TSR and Negative Economic Profit (ROIC lower than WACC)
The first metric for the value quadrant analysis is relative TSR (as a proxy indicator for the change in future-value). A high future-value change over time will show up in a relative TSR that is higher than the median of the peer group along with a price earnings (P/E) valuation ratio that is higher than the peer group. In other words, the capital markets will give the company’s future prospects more emphasis and value than it will give to competitors.
The second performance metric is economic profit.8
5.2. Corporate life cycle and the value creation quadrants
While there are numerous ways to interpret the changes in these metrics over time, one interpretation would suggest that there are four key stages that align to a firm’s lifecycle (figure 20).
8 An alternative to using economic profit would be to calculate the ROIC relative to WACC. Either measure provides exactly the same insight into the value creation or destruction capacity of the business model.
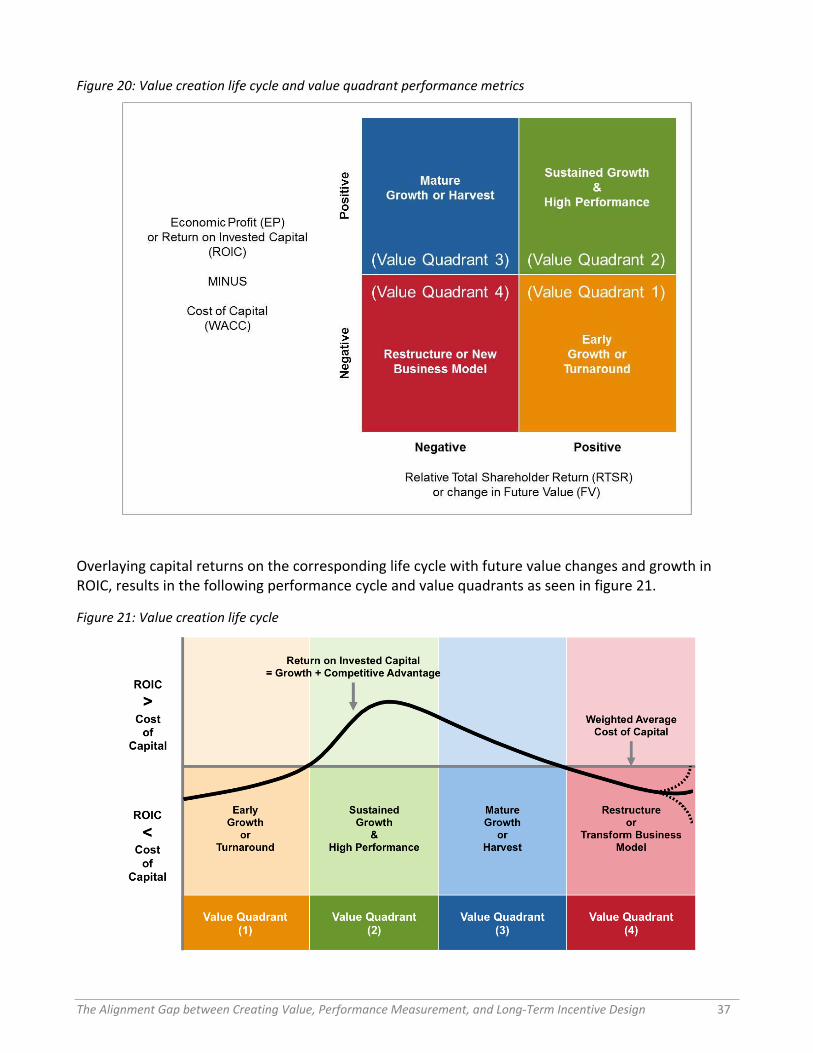
The Alignment Gap between Creating Value, Performance Measurement, and Long-Term Incentive Design 37
Figure 20: Value creation life cycle and value quadrant performance metrics
Overlaying capital returns on the corresponding life cycle with future value changes and growth in ROIC, results in the following performance cycle and value quadrants as seen in figure 21.
Figure 21: Value creation life cycle
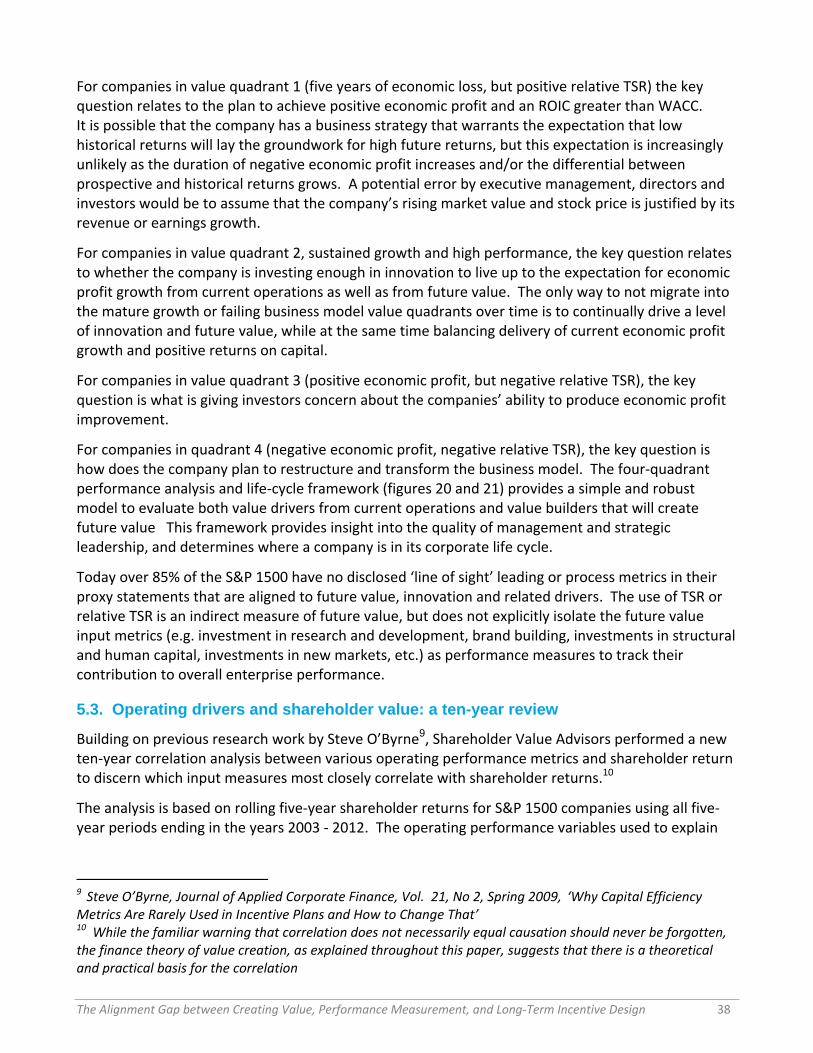
The Alignment Gap between Creating Value, Performance Measurement, and Long-Term Incentive Design 38
For companies in value quadrant 1 (five years of economic loss, but positive relative TSR) the key question relates to the plan to achieve positive economic profit and an ROIC greater than WACC. It is possible that the company has a business strategy that warrants the expectation that low historical returns will lay the groundwork for high future returns, but this expectation is increasingly unlikely as the duration of negative economic profit increases and/or the differential between prospective and historical returns grows. A potential error by executive management, directors and investors would be to assume that the company’s rising market value and stock price is justified by its revenue or earnings growth.
For companies in value quadrant 2, sustained growth and high performance, the key question relates to whether the company is investing enough in innovation to live up to the expectation for economic profit growth from current operations as well as from future value. The only way to not migrate into the mature growth or failing business model value quadrants over time is to continually drive a level of innovation and future value, while at the same time balancing delivery of current economic profit growth and positive returns on capital.
For companies in value quadrant 3 (positive economic profit, but negative relative TSR), the key question is what is giving investors concern about the companies’ ability to produce economic profit improvement.
For companies in quadrant 4 (negative economic profit, negative relative TSR), the key question is how does the company plan to restructure and transform the business model. The four-quadrant performance analysis and life-cycle framework (figures 20 and 21) provides a simple and robust model to evaluate both value drivers from current operations and value builders that will create future value This framework provides insight into the quality of management and strategic leadership, and determines where a company is in its corporate life cycle.
Today over 85% of the S&P 1500 have no disclosed ‘line of sight’ leading or process metrics in their proxy statements that are aligned to future value, innovation and related drivers. The use of TSR or relative TSR is an indirect measure of future value, but does not explicitly isolate the future value input metrics (e.g. investment in research and development, brand building, investments in structural and human capital, investments in new markets, etc.) as performance measures to track their contribution to overall enterprise performance.
5.3. Operating drivers and shareholder value: a ten-year review
Building on previous research work by Steve O’Byrne9, Shareholder Value Advisors performed a new ten-year correlation analysis between various operating performance metrics and shareholder return to discern which input measures most closely correlate with shareholder returns.10
The analysis is based on rolling five-year shareholder returns for S&P 1500 companies using all five-year periods ending in the years 2003 - 2012. The operating performance variables used to explain
9 Steve O’Byrne, Journal of Applied Corporate Finance, Vol. 21, No 2, Spring 2009, ‘Why Capital Efficiency Metrics Are Rarely Used in Incentive Plans and How to Change That’ 10 While the familiar warning that correlation does not necessarily equal causation should never be forgotten, the finance theory of value creation, as explained throughout this paper, suggests that there is a theoretical and practical basis for the correlation

The Alignment Gap between Creating Value, Performance Measurement, and Long-Term Incentive Design 39
shareholder return are net income, net income change, a derivative of NOPAT, economic profit change, ROIC and sales growth.
A one-factor model showed that cumulative net income explained 29% of the variation in five-year returns. This model shows that profit matters.
A two-factor model showed that cumulative net income and the change in net income from the beginning to the end of the five-year period explained 39% of the variation in five-year returns. This model shows that $1 of net income improvement makes a bigger contribution to shareholder wealth than $1 of cumulative net income that’s not sustained. This shows that investors capitalize current earnings, and hence, that the sustainability of current earnings is a critical issue for directors and investors.
A different two-factor model showed that a derivative of NOPAT (NEPAT = Net Equity Profit After Tax, similar to NOPAT but further down the income statement, i.e. excluding interest and therefore based on EBT rather than EBIT) and the change in EP from the beginning to the end of the five-year period explained 43% of the variation in five-year returns. This shows that more refined profit measures give us better operating proxies for shareholder return.
A more complex, five-factor model showed that NEPAT and EP change with the addition of three variables that help explain future value – sales growth, ROIC and ROIC times sales growth – explained 48% of the variation in five year returns. This shows that future value drivers are important even when we control for earnings and EP improvement.
One important implication of this analysis is that common operating measures leave a majority of the variation of the shareholder return unexplained. This implies the need for more refined measures of sustainability and future value to fully understand the drivers of shareholder return.
Another key insight is that the level of invested capital deployed to create economic profit and its related ROIC impacts return performance. See the table below (figure 22) and details on correlations of different operating metrics to shareholder return by industry sector in the appendix (figure 48).
Figure 22: Operating driver performance metric correlation with shareholder return over 10 years (period: 2003 - 2012)
Sector (average all
industry sectors) Net Income
Net Income &
Net Income Change
NEPAT &
Economic Profit Change
NEPAT, Economic Profit ∆
Sales growth, ROIC,
ROIC X Sales
Variance explained 29.2% 38.5% 43.1% 48.1%
Explained by other factors
71.8% 61.5% 56.9% 51.9%
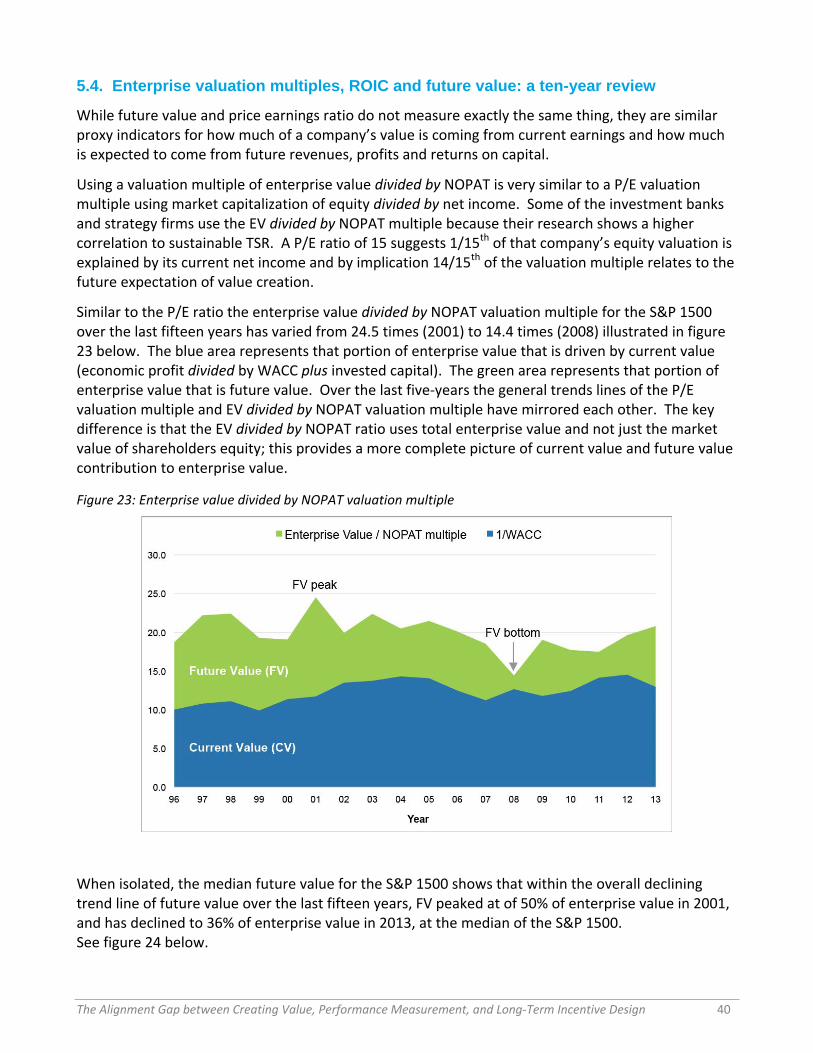
The Alignment Gap between Creating Value, Performance Measurement, and Long-Term Incentive Design 40
5.4. Enterprise valuation multiples, ROIC and future value: a ten-year review
While future value and price earnings ratio do not measure exactly the same thing, they are similar proxy indicators for how much of a company’s value is coming from current earnings and how much is expected to come from future revenues, profits and returns on capital.
Using a valuation multiple of enterprise value divided by NOPAT is very similar to a P/E valuation multiple using market capitalization of equity divided by net income. Some of the investment banks and strategy firms use the EV divided by NOPAT multiple because their research shows a higher correlation to sustainable TSR. A P/E ratio of 15 suggests 1/15th of that company’s equity valuation is explained by its current net income and by implication 14/15th of the valuation multiple relates to the future expectation of value creation.
Similar to the P/E ratio the enterprise value divided by NOPAT valuation multiple for the S&P 1500 over the last fifteen years has varied from 24.5 times (2001) to 14.4 times (2008) illustrated in figure 23 below. The blue area represents that portion of enterprise value that is driven by current value (economic profit divided by WACC plus invested capital). The green area represents that portion of enterprise value that is future value. Over the last five-years the general trends lines of the P/E valuation multiple and EV divided by NOPAT valuation multiple have mirrored each other. The key difference is that the EV divided by NOPAT ratio uses total enterprise value and not just the market value of shareholders equity; this provides a more complete picture of current value and future value contribution to enterprise value.
Figure 23: Enterprise value divided by NOPAT valuation multiple
When isolated, the median future value for the S&P 1500 shows that within the overall declining trend line of future value over the last fifteen years, FV peaked at of 50% of enterprise value in 2001, and has declined to 36% of enterprise value in 2013, at the median of the S&P 1500. See figure 24 below.

The Alignment Gap between Creating Value, Performance Measurement, and Long-Term Incentive Design 41
Figure 24: Future value median as a percentage of enterprise value – S&P 1500 (period: 1996-2013)
While noisy, and clearly affected by market events such as financial crisis of 2008, the secular decline in future value may have been partly explained by management teams focusing on generating short-term earnings and either not investing adequately for the longer term to create future value, or on not communicating those plans to the investing public.
The analysis shows that the declining investment level in R&D as a percentage of revenues and net new capital expenditures (CAPEX) as a percentage of revenues, and their five-year decline, mirrors very closely the decline in future value. The combined median R&D and net new CAPEX as a percentage of revenues has declined from 2.9% of revenues in 1998 to 1.6% of revenues in 2013. Our analysis indicates that this represents a 45% or 130 basis-point decline over the last five-years.
Figure 25: Median Annual Investments Levels in R&D and new capital expenditures for S&P 1500 (period: 1996-2013)

The Alignment Gap between Creating Value, Performance Measurement, and Long-Term Incentive Design 42
Over the same five year time period, median one-year sales growth for the S&P 1500 has declined from the 9.5% to the 11.5% range in the 1996 through 2000 time period to the 4.0% to 8.8% range in the recent 2010 to 2013 time period (figure 26). S&P 1500 median returns on invested capital has declined from the peak in the 11.4% to 12.5% range in 2000 to 2004 time periods, to the 8.7% to 9.9% range in the recent 2010 to 2013 time periods.
Figure 26: Median ROIC, sales growth – S&P 1500 (period: 1996-2013)
Of course, exceptional companies still exist. At the 80th performance percentile across all industry sectors, strategically and longer-term focused management teams are innovating and creating robust five-year growth in sustained revenue, and at the same time, returns on invested capital well in excess of their cost of capital.
5.5. No single performance measure is perfect
A review of the range of enterprise performance metrics used to evaluate long-term enterprise performance and health identifies that there is no single, silver bullet performance measure. Traditional accounting metrics such as EBITDA, earnings, and EPS have low correlations to five-year shareholder returns in the 29% to 38% range. They do not correlate well with sustained performance and relative TSR because they neither take into account the level of invested capital required to generate the earnings and cash flows, nor the level of innovation investment required for growth and future value.
The level of invested capital matters to intrinsic and shareholder returns over a five-year and longer performance cycle. Our analysis shows that the correlations with shareholder returns indicate that by including sales, growth in NOPAT, economic profit growth, and ROIC, the alignment between these operating drivers and shareholder returns rises to the 45% to 48% range, depending on the industry sector.
Not all revenue and earnings growth are value creating, for instance when the ROIC is less than the cost of capital. Return on equity (ROE), while a good performance metric, does not capture the total level of invested capital and may lead to over leveraging a company.

The Alignment Gap between Creating Value, Performance Measurement, and Long-Term Incentive Design 43
ROIC and ROE are good measures regarding the level of current competitive advantage built into the business model, but do not take into account the growth and innovation required to create future value. In turn, they may allow executives to under-invest in the business to meet short-term ROIC targets. A short-term focus on high returns on capital may starve business for longer-term growth and innovation.
NOPAT divided by ‘Full-Time Equivalent’ staff (FTE) is a good measure of the performance of the company’s management structure and its workforce productivity. Measuring NOPAT/FTE over time suggests labor force productivity improvement or decline. However, different businesses may be more or less labor or capital intensive, so cross-industry comparisons are difficult. Moreover, a very high NOPAT/FTE ratio may represent under-investment in the structural and human capital investment required for future innovation.
Economic profit itself may not be granular enough to identify underlying operating value drivers and specific sources for improvement. Decomposing economic profit into NOPAT and the capital-charge value drivers identifies sources of value-creating performance improvement.
As we have shown in the analysis, traditional financial accounting measures do not capture the future expectation for growth and innovation that are implicitly captured in enterprise value, stock price and relative TSR.
Among the problems with total shareholder return as a performance measure is that it is very end-point sensitive, meaning that TSR can be positive or negative over the measurement period solely because of the starting or ending point of the measurement period. Also, TSR calculations assume reinvestment of dividends. And, as previously indicated TSR can be affected by exogenous factors beyond the control of management. Therefore, TSR is more of a measure of capital market outcomes – how well did shareowners fare when looking back at a past performance period. A significant number of variables that explain TSR performance are not impacted by an input or output measure of business performance. Despite its prevalence, the majority of TSR performance therefore is not directly controllable by senior executives and so is problematic when used as the key metric for incentive compensation.

The Alignment Gap between Creating Value, Performance Measurement, and Long-Term Incentive Design 44
Chapter 6: An analysis of corporate life cycle and value quadrant performance
6.1. Applying value quadrant performance analysis to the S&P 1500
As outlined in the previous chapter the use of value quadrants provides a robust analytic framework to segment companies and determine where they are in the value-creation life cycle of the company.
Over the last five years (2008-2012) only 53.3% of complete S&P 1500 companies had a positive economic profit, and only 35.4% were in value quadrant 2, meaning they generated both a positive TSR relative to their 4-digit GICS peer group and an absolute positive economic profit over five years (figure 27).
Figure 27: Value quadrant distributions for S&P 1500 (five-year period: 2008-2012)
A ten-year review (2003 - 2012) of the S&P 500 and S&P 400 companies, (the larger companies and those which match most closely to the Incentive Lab database for further LTIP design analysis) further confirms the performance insights from the company life cycle and performance value quadrant framework. The ten-year review horizon further confirms the validity of the positive and negative economic profit and return on invested capital performance findings for the larger companies and that the 2007-2008 global financial crisis did not materially skew the performance analysis. Over ten years, only 57% of companies in the combined S&P 500 and 400 universes generated a positive five-year rolling cumulative economic profit. This compares to the 53% for the five-year rolling performance periods over 2008-2012 for the complete S&P 1500 universe. The economic profit and return on invested capital performance results were generally stable across five- and ten-year observation horizons and the combined S&P 500 and 400 versus S&P 1500 data sets.

The Alignment Gap between Creating Value, Performance Measurement, and Long-Term Incentive Design 45
Figure 28 provides summary performance statistics for a number of performance metrics for the combined S&P 500 and 400.
Figure 28: Value quadrant performance for S&P 500 and 400 (ten-year observation period: 2003 - 2012)
VQ Sums VQ Medians
Value Quadrant
Value Quadrant Dominant
Value Style
# Co's
Total 10 yr.
Economic Profit
Growth, yr. ending
2012, $ millions
10 yr. Cumulative Ecn Profit
(2003- 2012) $ millions
Total 10 yr. Rev
Growth%
10 yr. Median ROIC%
with Goodwill
10 yr. NOPAT / FTE% ∆
10 yr. Median Future Value%
Enterprise Value
Total 10 yr.
Relative TSR %
Total 10 yr.
Absolute TSR %
VQ1
Early Growth
or Turnaround
159 $72,439 -$604,199 46% 7% 13% 38% 20% 164%
VQ2
Sustained Growth &
High Performance
350 $322,999 $1,802,560 127% 14% 82% 24% 68% 342%
VQ3
Mature Growth
or Harvest
177 $86,492 $846,240 116% 15% 32% 19% -10% 164%
VQ4
Restructure or
Transform Business Model
211 -$37,357 -$958,728 63% 6% -50% 51% -46% 49%
Total 897 $444,573 $1,085,873
The 159 companies in value quadrant one are seen as investing for the future. At the median, they have 38% of their enterprise value relating to future value, in other words that portion of their value derives from an expectation for future growth and innovation rather than from current earnings. The five-year rolling performance periods over ten years of observations had 46% total growth in revenues, 18% growth in NOPAT, and an ROIC median at 7%, which is below the cost of capital. Despite the destruction of current value, the market’s expectation for future growth and future value creation at a future value median of 38% along with revenue and NOPAT growth, resulted in a positive median 20% relative TSR with five-year rolling performance periods over the ten years of observations.
This is the pattern of growth, ROIC and future value generally seen in early growth or turn around companies. Capital markets recognized the value creation potential of these companies. As a result, the future value of quadrant one companies is high. Whether companies in this quadrant can actually execute on their strategy and implement a value-creating business model over time and migrate into value quadrant two (positive economic profit, positive ROIC exceeding WACC and positive relative TSR), is an open question. Proactive executive management, directors and investors would want to monitor progress closely and ensure a plan to get to positive return on capital.
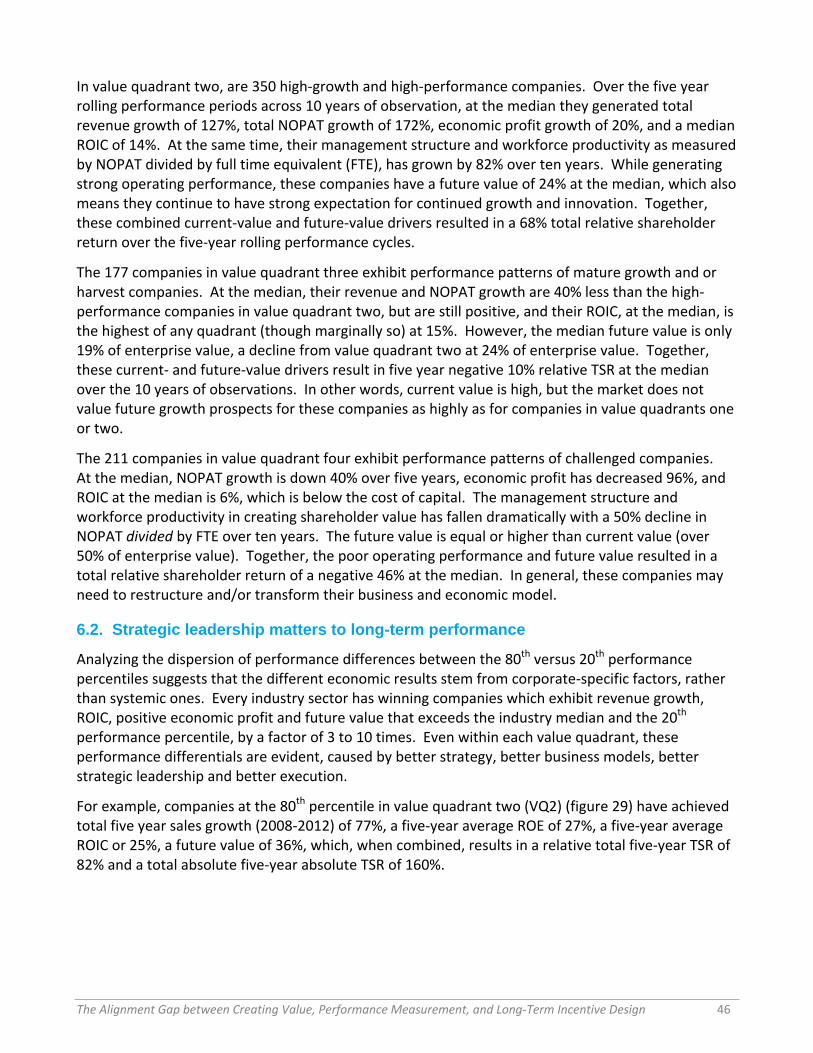
The Alignment Gap between Creating Value, Performance Measurement, and Long-Term Incentive Design 46
In value quadrant two, are 350 high-growth and high-performance companies. Over the five year rolling performance periods across 10 years of observation, at the median they generated total revenue growth of 127%, total NOPAT growth of 172%, economic profit growth of 20%, and a median ROIC of 14%. At the same time, their management structure and workforce productivity as measured by NOPAT divided by full time equivalent (FTE), has grown by 82% over ten years. While generating strong operating performance, these companies have a future value of 24% at the median, which also means they continue to have strong expectation for continued growth and innovation. Together, these combined current-value and future-value drivers resulted in a 68% total relative shareholder return over the five-year rolling performance cycles.
The 177 companies in value quadrant three exhibit performance patterns of mature growth and or harvest companies. At the median, their revenue and NOPAT growth are 40% less than the high-performance companies in value quadrant two, but are still positive, and their ROIC, at the median, is the highest of any quadrant (though marginally so) at 15%. However, the median future value is only 19% of enterprise value, a decline from value quadrant two at 24% of enterprise value. Together, these current- and future-value drivers result in five year negative 10% relative TSR at the median over the 10 years of observations. In other words, current value is high, but the market does not value future growth prospects for these companies as highly as for companies in value quadrants one or two.
The 211 companies in value quadrant four exhibit performance patterns of challenged companies. At the median, NOPAT growth is down 40% over five years, economic profit has decreased 96%, and ROIC at the median is 6%, which is below the cost of capital. The management structure and workforce productivity in creating shareholder value has fallen dramatically with a 50% decline in NOPAT divided by FTE over ten years. The future value is equal or higher than current value (over 50% of enterprise value). Together, the poor operating performance and future value resulted in a total relative shareholder return of a negative 46% at the median. In general, these companies may need to restructure and/or transform their business and economic model.
6.2. Strategic leadership matters to long-term performance
Analyzing the dispersion of performance differences between the 80th versus 20th performance percentiles suggests that the different economic results stem from corporate-specific factors, rather than systemic ones. Every industry sector has winning companies which exhibit revenue growth, ROIC, positive economic profit and future value that exceeds the industry median and the 20th performance percentile, by a factor of 3 to 10 times. Even within each value quadrant, these performance differentials are evident, caused by better strategy, better business models, better strategic leadership and better execution.
For example, companies at the 80th percentile in value quadrant two (VQ2) (figure 29) have achieved total five year sales growth (2008-2012) of 77%, a five-year average ROE of 27%, a five-year average ROIC or 25%, a future value of 36%, which, when combined, results in a relative total five-year TSR of 82% and a total absolute five-year absolute TSR of 160%.
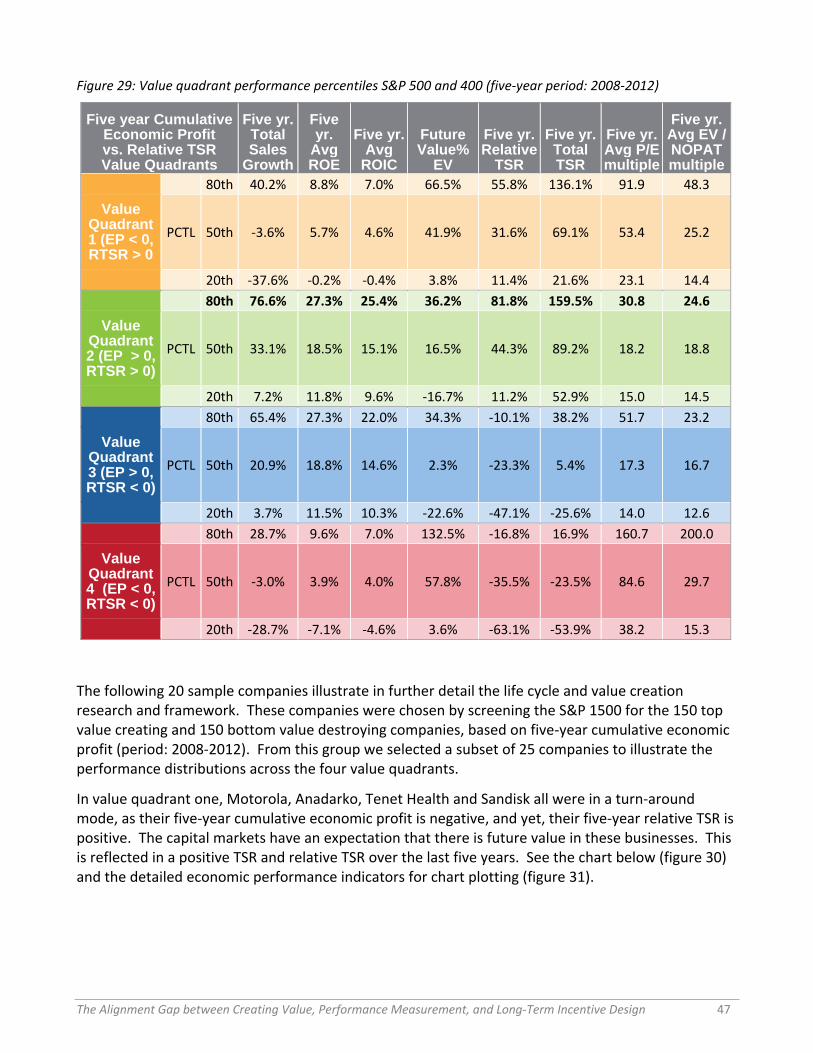
The Alignment Gap between Creating Value, Performance Measurement, and Long-Term Incentive Design 47
Figure 29: Value quadrant performance percentiles S&P 500 and 400 (five-year period: 2008-2012)
Five year Cumulative Economic Profit vs. Relative TSR Value Quadrants
Five yr. Total Sales
Growth
Five yr.
Avg ROE
Five yr. Avg
ROIC
Future Value%
EV
Five yr. Relative
TSR
Five yr. Total TSR
Five yr. Avg P/E multiple
Five yr. Avg EV / NOPAT multiple
80th 40.2% 8.8% 7.0% 66.5% 55.8% 136.1% 91.9 48.3
Value Quadrant 1 (EP < 0, RTSR > 0
PCTL 50th -3.6% 5.7% 4.6% 41.9% 31.6% 69.1% 53.4 25.2
20th -37.6% -0.2% -0.4% 3.8% 11.4% 21.6% 23.1 14.4
80th 76.6% 27.3% 25.4% 36.2% 81.8% 159.5% 30.8 24.6
Value Quadrant 2 (EP > 0, RTSR > 0)
PCTL 50th 33.1% 18.5% 15.1% 16.5% 44.3% 89.2% 18.2 18.8
20th 7.2% 11.8% 9.6% -16.7% 11.2% 52.9% 15.0 14.5
80th 65.4% 27.3% 22.0% 34.3% -10.1% 38.2% 51.7 23.2
Value Quadrant 3 (EP > 0, RTSR < 0)
PCTL 50th 20.9% 18.8% 14.6% 2.3% -23.3% 5.4% 17.3 16.7
20th 3.7% 11.5% 10.3% -22.6% -47.1% -25.6% 14.0 12.6
80th 28.7% 9.6% 7.0% 132.5% -16.8% 16.9% 160.7 200.0
Value Quadrant 4 (EP < 0, RTSR < 0)
PCTL 50th -3.0% 3.9% 4.0% 57.8% -35.5% -23.5% 84.6 29.7
20th -28.7% -7.1% -4.6% 3.6% -63.1% -53.9% 38.2 15.3
The following 20 sample companies illustrate in further detail the life cycle and value creation research and framework. These companies were chosen by screening the S&P 1500 for the 150 top value creating and 150 bottom value destroying companies, based on five-year cumulative economic profit (period: 2008-2012). From this group we selected a subset of 25 companies to illustrate the performance distributions across the four value quadrants.
In value quadrant one, Motorola, Anadarko, Tenet Health and Sandisk all were in a turn-around mode, as their five-year cumulative economic profit is negative, and yet, their five-year relative TSR is positive. The capital markets have an expectation that there is future value in these businesses. This is reflected in a positive TSR and relative TSR over the last five years. See the chart below (figure 30) and the detailed economic performance indicators for chart plotting (figure 31).

The Alignment Gap between Creating Value, Performance Measurement, and Long-Term Incentive Design 48
Figure 30: Value quadrant performance plotting - sample companies
Contrast the value quadrant one companies with the illustrated value quadrant four companies, which also feature five-year negative cumulative economic profit, but, in contrast to the earlier turn around companies, had a five year negative, relative TSR. These include such companies as Alcoa, Sears, Xerox, Carnival, and Jabil Circuit. Being negative on both performance measurement axes indicates that not only is the current business model not creating economic value, but also that executive management has yet to clearly disclose a future-value creation strategy that the capital markets believe has potential for economic profit.
A deeper analysis of the change in economic profit over five years (figure 31) illustrates that Alcoa, Sears, Carnival and Xerox all have a greater economic loss in 2012 than they did in 2008, which would suggest the business strategy, business model, and execution are not value creating and needs to be seriously reconsidered. Generally, the institutional investor community will see companies with this performance pattern as having a broken business strategy and business model, which requires transformation.
Of course, markets and companies are dynamic. For example, Jabil Circuit illustrates a positive growth in economic profit over five years and the potential to migrate into value quadrant 2 (sustained growth and high performance) over time.

The Alignment Gap between Creating Value, Performance Measurement, and Long-Term Incentive Design 49
Figure 31: Value quadrant performance analysis - sample companies
Value Quadrant Company Ticker
Five yr. Cumulative Economic
Profit 2008-2012
Five yr. Growth in Economic
Profit ending in 2012
Five yr. Relative
TSR 2008-2012
1 MOTOROLA SOLUTIONS MSI $(16,728) $293 19%
1 COCA-COLA ENTERPRISES CCE $(9,004) $(179) 36%
1 ANADARKO PETROLEUM APC $(6,027) $(1,631) 26%
1 TENET HEALTHCARE THC $(1,823) $1,442 45%
1 SANDISK SNDK $(1,285) $(71) 64%
2 AMERICAN EXPRESS AXP $18,989 $1,291 61%
2 MCDONALD'S MCD $17,138 $2,511 54%
2 QUALCOMM QCOM $12,752 $1,639 34%
2 DU PONT DD $4,999 $709 14%
2 ROCKWELL AUTOMATION ROK $3,229 $720 36%
3 PEPSICO PEP $23,463 $(1,018) -31%
3 SCHLUMBERGER SLB $13,653 $(924) -20%
3 MEDTRONIC MDT $6,728 $(402) -27%
3 AGILENT TECHNOLOGIES A $3,176 $260 -13%
3 AVON PRODUCTS AVP $1,381 $(621) -58%
4 ALCOA AA $(10,441) $(2,225) -78%
4 SEARS SHLD $(6,467) $(622) -72%
4 XEROX XRX $(4,270) $(8) -62%
4 CARNIVAL CCL $(1,619) $(1,401) -31%
4 JABIL CIRCUIT JBL $(1,273) $184 -7%
Value Quadrant two companies are the stars in the sample, as five-year cumulative economic profit, and ROIC are all positive and the growth in economic profit over five years has also increased over the five-year performance period. These core value-drivers along with further expectation for positive growth and economic returns have also resulted in positive relative TSR for American Express, McDonalds, Qualcomm, DuPont and Rockwell Automation. Companies in this sustained growth and high performance quadrant will usually have a future value percentage of enterprise value much higher than the median of their industry sector due to a higher expectation for growth, innovation and value creation relative to peers in the industry sector.
The value quadrant sample three companies show evidence of the challenge of being a mature company. All these companies have positive five-year cumulative economic profit and high return on invested capital. However, PepsiCo, Schlumberger, Medtronic and Avon all have negative growth in their economic profit over the five-year performance period, along with greater than 20% negative five-year relative TSR.

The Alignment Gap between Creating Value, Performance Measurement, and Long-Term Incentive Design 50
The appendix further illustrates 128 S&P 500 and S&P 400 companies (32 companies in each of the four value quadrants). These companies were chosen by screening the S&P 1500 for the 150 top value creating and 150 bottom value-destroying companies, based on five-year cumulative economic profit (period: 2008-2012) and five-year relative TSR. The final 128 were selected to represent multiple industry sectors.

The Alignment Gap between Creating Value, Performance Measurement, and Long-Term Incentive Design 51
Chapter 7: Does executive compensation align with value creation?
7.1. Introduction Modern executive compensation theory holds that senior corporate executives should be compensated to incent sustainable growth, value and wealth creation within the cultural, societal and regulatory environment of the company and its industry. The result, in theory, should be an alignment with shareowners who, in theory, are the claimants to the residual value of the company.
In reality, as we show in this chapter, performance has a modest impact on executive pay levels. Company revenue size, industry and company pay policy all dwarf the impact of performance. This is true even when we measure realizable pay, which includes the change in the value of unvested equity compensation.
7.2. Performance-based executive compensation
7.2.1. Which variables explain the level of CEO compensation?
Shareholder Value Advisors performed a ten-year correlation analysis (2003- 2012) over five-year rolling periods of realizable CEO compensation in the S&P 1500 and what variables explain the level of CEO pay. In this analysis, based on data for almost 1200 companies where there was available compensation data, the five-year geometric average realizable CEO pay is $22 million.
Analyzing the variables that explain company CEO pay variance from this five-year average shows the following results:
Figure 32: Five-year CEO realizable total pay correlation with variance factors S&P 1500
Total CEO pay
variance explained
Percent of total variance explained by
factor Variance factor explaining executive pay
44.0% 44.0% Revenue size / Industry / Inflation
56.4% 12.4% Economic Performance (Relative TSR, five-year ROIC, ∆ EP/Capital)
75.6% 19.2% Consistent company pay policy (i.e. prior grant date pay level)
24.4% 24.4% Remains unexplained
100% 100% Total
The first highlight is that current levels of total direct compensation for CEOs are correlated mostly with revenue size of company, industry and consistent company pay policy, and not with business performance and the level of value creation.

The Alignment Gap between Creating Value, Performance Measurement, and Long-Term Incentive Design 52
As the previous table illustrates, the correlation analysis against the S&P 1500 for the last ten years identifies statistically relevant factors explaining levels of CEO compensation.11
The main factors that explained over 44% of CEO pay variance were the size of the company based on revenues, the industry itself, and inflation (figure 32). We measure revenue at the start of the five-year period to avoid understating the impact of five-year performance due to correlation with revenue growth. After addressing size and industry, the correlation analysis identified that performance explained 12% of executive pay variance across the S&P 1500. Performance was measured by relative total shareholder return, return on invested capital and economic profit growth. The last large explanatory category was consistent company pay policy and pay philosophy, measured by company pay level prior to the start of the five-year period. Together these three categories explained 76% of CEO pay with pay for performance being the smallest explanatory variable.
To translate these correlations based on the geometric average of five-year realizable CEO pay into a hypothetical example, the variances explained imply that for every $1,000,000 of total realizable CEO pay, only $124,000 correlates to economic performance, while $632,000 is a function of industry and company size (who we compare with) and company pay policy (how we do it). The remaining amount is not explained by known factors. It is important to note that this example is based on a statistical model using a geometric average of the S&P 1500 and does not represent an individual company.
11 Stephen O’Byrne and David S. Young, Journal of Applied Corporate Finance, Vol. 22, No. 2, Spring 2010, ‘Six Factors That Explain Executive Pay (and its Problems)’; Stephen O’Byrne and Mark Gressle, Journal of Applied Corporate Finance, Vol. 25, No. 2, Spring 2010, ‘How 'Competitive Pay' Undermines Pay for Performance (and What Companies Can Do to Avoid That)’

The Alignment Gap between Creating Value, Performance Measurement, and Long-Term Incentive Design 53
Chapter 8: Current state of long-term incentive plan design
It is easy to get lost in the complexities of executive pay delivery design options for long-term incentives. This complexity includes issues relating to pay mix, type of equity awards, and time-based versus performance-based executive compensation, just to name a few. This chapter will analyze some of these aspects of long term incentive plan (LTIP) design, but will focus mostly on performance measurement alignment to long-term value creation.
Overall, the finding is that much of executive LTIP design is actually focused on the short term. Long-term is defined by 90% of companies as three years or less. Indeed, almost 25% of the companies do not even have long-term performance-based awards, preferring to use equity-linked compensation without any performance metrics, though that percentage has decreased markedly in the past five years. Less than 15% of companies disclose performance metrics that align with longer-term (five years or longer) future value drivers of sustainable cash flows, ROIC and or economic profit growth and shareholder returns.
The following LTIP design insights are derived from an analysis of the Incentive Lab executive compensation database, which covers over 1,200 companies (the complete S&P 500, 80% of S&P 400 mid-cap and 5% of the S&P 600 small-cap universe).
8.1. Long-term awards and performance vehicles
Nearly one-quarter of companies do not have long-term performance based awards, using instead stock options and time-based restricted stock in their long-term compensation plans. The use of performance-based incentive vehicles in long-term incentive plan design has increased every year since 2009 - from 52% in 2009 to 76% in 2013. Use of stock options continues to decline, while restricted stock awards (time-based) has held relatively constant.
Figure 33: Long-term incentive awards (fiscal year 2013)- source Incentive Lab

The Alignment Gap between Creating Value, Performance Measurement, and Long-Term Incentive Design 54
8.2. Performance management and long-term incentive plan design
There are a variety of performance metrics used by companies in their long-term incentive plans. These performance metrics fall into three broad categories; (1) financial/accounting (e.g. earnings, returns, revenue, cash flow), (2) stock market and (3) non-financial (e.g. innovation, customer loyalty, safety).
Figure 34: Common performance metrics
Total shareholder return (TSR) is the number one used metric in LTIP design with over 50% of companies using total shareholder return in long-term incentive plan design in 2013. While TSR has some positive characteristics, especially as a direct link back to an investor’s measure of successful performance, there are a number of drawbacks to TSR use. For any performance metric to truly be an incentive, executives should have line of sight between the decisions they make in running the business, business performance and value creation, capital markets performance and potential compensation to be earned. As outlined earlier, short- and mid-term changes in share price are affected by factors such as macroeconomics, geo-political risks, and funds flow – all of which are beyond the control of executive management. This lack of line of sight between business fundamental operating performance and value creation, and capital markets performance continue to raise questions about the effectiveness in incentive alignment when using TSR in performance-based incentive plans. A summary of drawbacks to over-reliance on TSR include:
TSR is not directly influenced or controlled by management, leading to “line of sight” issues;
Focus on TSR can lead management to use financial or business tactics (earnings management, share buybacks) to prop up stock price; these actions may or may not be in the best long-term interests of the company;
TSR may not correlate to financial measures that are better indicators of long-term performance and success i.e. TSR is not aligned with company strategy and success;
Common Performance Metrics
Financial Stock Market Other
- Earnings
EPS
EBITDA
Etc.
- Sales/Revenue - Cash Flow - Balance Sheet
ROIC
ROA
ROE
Economic profit
CFROI
- Total Shareholder Return (TSR) - absolute or relative
- Operational - Strategic
Innovation
Customer loyalty
Employee engagement
Safety
Environment

The Alignment Gap between Creating Value, Performance Measurement, and Long-Term Incentive Design 55
Use of relative TSR can be greatly influenced by decisions such as peer group selection and how relative TSR is calculated.
Based on these issues, some companies are using TSR not as a primary performance metric, but rather as a conditional or modifier metric. A conditional metric would condition payment of the performance award on meeting TSR goals (e.g. TSR greater than 0% over the performance period), while a TSR modifier metric raises or lowers the award payout depending on how well the company stock performed during the period.
Figure 35: Performance metrics used in performance-based awards (fiscal year 2013)- Incentive Lab
Earnings as a performance category (e.g. EBIT, EBITDA, Earnings per share) is the second most frequently used metric in long-term incentive design with 47% of companies using these measures in performance-based vehicles. The key challenge is that earnings, using traditional accounting measurement, does not a measure value creation, as it does not take into account the level of invested capital required to create the earnings. Earnings per share (EPS) is not an optimal measure as EPS can be increased by buying back shares with no economic value performance improvement in the business, something of increasing concern to major investors.12
Thus earnings growth without some type of balance sheet or capital efficiency measurement as part of the measurement mix will be a sub-optimal long-term incentive design. Where a company has a value-destroying business model, i.e. a return on invested capital is less than the cost of capital, then incentivizing management to drive revenue and earnings growth may actually destroy more value unless there is a clear plan to become a positive ROIC business model over time.
Metrics used across the different sectors are mostly consistent with total shareholder return or earnings as the number one performance measure used in each sector for those companies using performance-based vehicles as part of long-term incentive rewards.
12 See, for example, “Blackrock’s Fink Sounds The Alert”, Wall Street Journal, updated March 25, 2014. http://online.wsj.com/news/articles/SB10001424052702303949704579461773304558680. Accessed October 16, 2014.
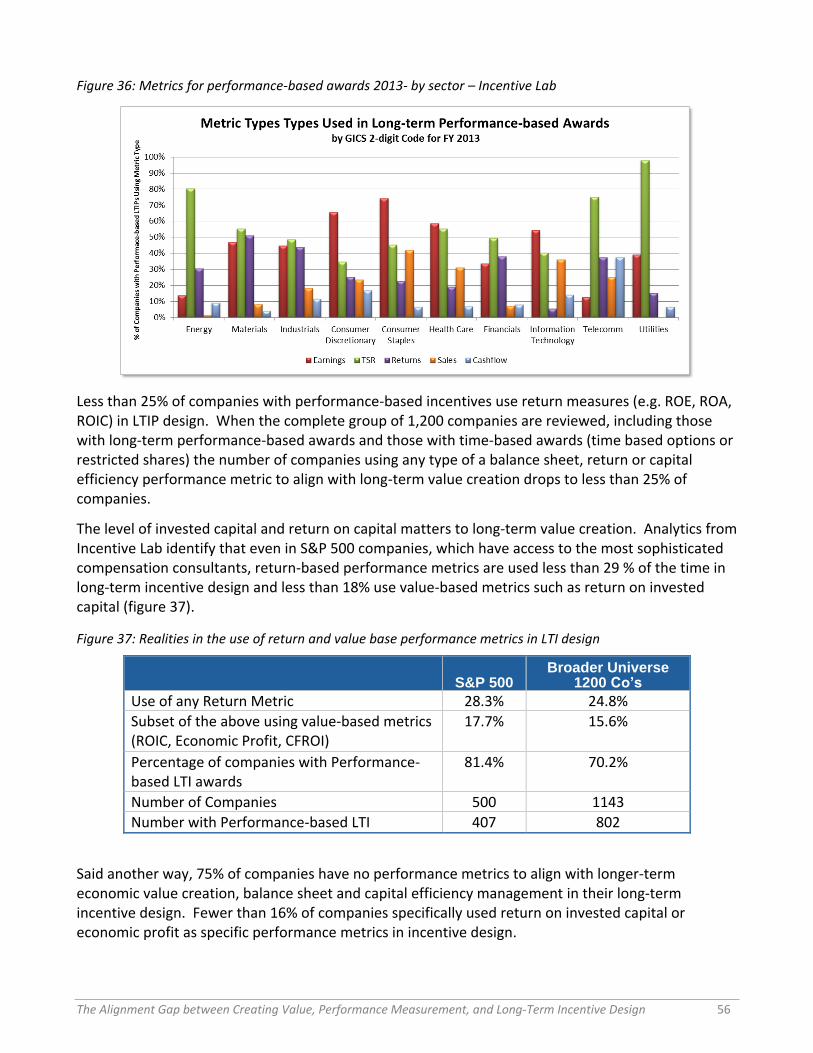
The Alignment Gap between Creating Value, Performance Measurement, and Long-Term Incentive Design 56
Figure 36: Metrics for performance-based awards 2013- by sector – Incentive Lab
Less than 25% of companies with performance-based incentives use return measures (e.g. ROE, ROA, ROIC) in LTIP design. When the complete group of 1,200 companies are reviewed, including those with long-term performance-based awards and those with time-based awards (time based options or restricted shares) the number of companies using any type of a balance sheet, return or capital efficiency performance metric to align with long-term value creation drops to less than 25% of companies.
The level of invested capital and return on capital matters to long-term value creation. Analytics from Incentive Lab identify that even in S&P 500 companies, which have access to the most sophisticated compensation consultants, return-based performance metrics are used less than 29 % of the time in long-term incentive design and less than 18% use value-based metrics such as return on invested capital (figure 37).
Figure 37: Realities in the use of return and value base performance metrics in LTI design
S&P 500 Broader Universe
1200 Co’s
Use of any Return Metric 28.3% 24.8%
Subset of the above using value-based metrics (ROIC, Economic Profit, CFROI)
17.7% 15.6%
Percentage of companies with Performance-based LTI awards
81.4% 70.2%
Number of Companies 500 1143
Number with Performance-based LTI 407 802
Said another way, 75% of companies have no performance metrics to align with longer-term economic value creation, balance sheet and capital efficiency management in their long-term incentive design. Fewer than 16% of companies specifically used return on invested capital or economic profit as specific performance metrics in incentive design.

The Alignment Gap between Creating Value, Performance Measurement, and Long-Term Incentive Design 57
Yet the finance literature recognizes ROIC and economic profit as two of the most effective performance metrics to evaluate competitive advantage of the business model and the quality of leadership in creating long-term sustainable value for shareholders.
The other performance measurement category in LTIP design is non-financial performance. These metrics do not show up in traditional filed financial statements and include such future-value leading indicators as innovation (new products, new markets), strategic milestones including acquisition integration, market share and brand perception, customer loyalty, employee engagement, safety and the environment.
Only 13% of companies (156/1200) disclose these leading performance indicators of future value in their LTIP design as part of a strategic and integrated scorecard. This is despite the fact that, as shown earlier, the future value of most companies is in the 30% to 70% range of enterprise value. This means that 87% of the companies have no incentive metrics with direct line-of-sight alignment to what drives future improvement and growth in economic profit and return on invested capital.
The business strategy and performance measurement design challenge is further compounded by the longest accountable performance period for named executive officers in LTIP design. Unlike a vesting period for compensation delivery, which has little direct line of sight to business strategy and actual business performance, the longest accountable performance period is the cycle of performance over a multiple-year time period over which business performance, return on capital or related relative capital markets performance is measured. The longest accountable rolling performance period for named executive officers in LTIP design is three years or less for 90% of named executive officers. This was found consistently across industries.
Figure 38: Longest performance period for LTI performance design – Incentive Lab

The Alignment Gap between Creating Value, Performance Measurement, and Long-Term Incentive Design 58
Figure 39: Longest performance period for LTI performance design – by sector – Incentive Lab
Companies invest capital into research and development, new product and new market development. The strategic horizon for a positive return on that newly invested capital can range from immediate to ten years or greater.
Best practice strategic planning is usually focused on at least a five-year or longer performance planning cycle. Yet for 90% of companies, long-term performance-based incentive plans today are measured over rolling three-years or less.
This “medium-term” approach appears to be a business strategy, return on capital and executive incentive design misalignment. A two- to- three-year performance cycle for incentive design is really mid-term, not longer term.
A recent survey highlighted the paradox. McKinsey’s and the Canada Pension Plan Investment Board’s recent survey of executives and boards members illustrates the strategy and long-term performance measurement challenge.13 The respondents said that moving beyond a two- to four-year mid-term planning horizon to a longer-term (greater than four year) horizon would allow them to focus on increased innovation and enhanced financial returns. However, the survey noted that the furthest into the future that executive teams are undertaking strategic planning was two years or less for 44% of companies and three to four years for 41% of companies. Only 15% of those surveyed identified that their strategic planning horizon was beyond four years.
Other long-horizon institutional investors are also stressing the need for investee companies to better balance short, mid and longer-term performance planning, management and LTIP design in their investee companies. The Rotman International Center for Pension Management white paper on
13 Dominic Barton & Mark Wiseman, December 2013, ‘Focusing capital on the long term’, Article published online, McKinsey Quarterly, www.mckinsey.com/insights/leading_in_the_21st_century/focusing_capital_on_the_long_term

The Alignment Gap between Creating Value, Performance Measurement, and Long-Term Incentive Design 59
“strategies to better serve pension beneficiaries”14 includes a call for the focus of institutional investors, board and executive management teams to be on the design and implementation of executive compensation at investee companies, so as to better align levels of compensation with long-term value creation for long horizon investors
The Council of Institutional Investors recently submitted to the SEC a comment letter asking the SEC for disclosures related to Pay for Performance and requesting five-year rolling performance periods to be included in disclosures by investee companies for institutional investors. This is consistent with many investor’s desire to define long-term in the context of a five-year rolling performance periods and not just three-year rolling performance. Indeed, in the United Kingdom, over half of long-term incentive plans are now measured on performance periods greater than three years.
8.3. Long-term incentive plan instability
Examining a company’s LTIP over time enables comparison not just of compensation, but also of the design of the plan. Nearly 60% of companies changed their performance metrics for incentive design in 2013. This level of change and performance metric instability has been consistent for over the last several years. The lack of stability of performance metrics used for LTIP design over time, as well as frequent changes in the composition of the peer groups used for relative performance benchmarking, further reinforces a short-term focus despite the ostensible long-term nature of these incentive plans. Incentive Lab data found significant changes in both dimensions on a yearly basis.
Figure 40: Performance metrics change for incentive design – Incentive Lab
While some peer group change is to be expected (because of merger and acquisition activity and other natural capital market changes), Incentive Lab data found that a large number of companies change a substantial number of peers each year – for example, one-third of companies changed 25%
14 Available online: www.rijpm.com/key_insight_files/Ten_Strategies_for_Pension_Funds_to_Better_Serve_Their_Beneficiaries_June_20_2013.pdf

The Alignment Gap between Creating Value, Performance Measurement, and Long-Term Incentive Design 60
or more of their peer group in 2013. This is consistent with results going back several years, and results in inconsistent benchmarking of performance.
This high level of change in performance metrics and peer group composition makes it difficult for executive management, boards and institutional investors to have a consistent and stable approach to understanding longer-term business strategy and pay for performance, as well as aligning incentives in a way that is logical and defensible for all stakeholders over time.
Figure 41: Peer group change for incentive design and relative performance benchmarking- Incentive Lab

The Alignment Gap between Creating Value, Performance Measurement, and Long-Term Incentive Design 61
Chapter 9: Insights on Alignment
To effectively drive longer-term business value creation, a hierarchy of performance measurement demands an alignment to:
1. Business performance and related value drivers;
2. Shareholder value creation as an outcome of these drivers; and
3. Executive compensation, as an incentive and reward mechanism.
9.1. Performance measurement
a) Missing capital efficiency performance measures
The analysis shows that 75% of companies, or 903 of 1200 companies in the Incentive Lab database, were identified as using no capital efficiency or balance sheet performance metrics (ROE, ROA, ROIC) in long-term incentive plan design.
Furthermore, 23% of companies (250 of 1200 companies in the Incentive Lab database when cross-referenced to the Shareholder Advisors Performance database) were identified as not creating sustainable shareholder value. They had:
Five-year negative return on invested capital (less than cost of capital), and
Five-year cumulative negative economic profit, and
At the same time had no disclosed balance sheet or capital efficiency performance metrics aligned to long-term incentive plan design to monitor and reward value creation improvement.
b) Missing the distinction between and measurement of current value and future value creation
The prevalence of traditional accounting-based metrics for performance measurement puts emphasis on shorter-term operational measures while having no line of sight to innovation and longer-term value creation.
This is underlined by the fact that 87% of companies do not disclose any non-financial future value metrics as part of their long-term incentive plan design. In terms of providing disclosure and alignment to future value, less than 13% of the companies disclosed future-value related non-financial performance metrics and alignment to LTIP design. These insightful non-financial performance metrics which impact future value and future cash flows and returns, include rate of innovation, customer loyalty, employee engagement, safety record and the like.
c) Missing the distinction between short-, medium- and long-term time periods
Some 90% of named executive officer long-term incentive plans have a longest accountable performance period of three years or less. This is consistent across most industry sectors. Three years is actually mid-term not long-term and increasingly institutional investors are seeking alignment to five-year rolling performance periods.

The Alignment Gap between Creating Value, Performance Measurement, and Long-Term Incentive Design 62
9.2. Stability of peer group and metrics
Over 35% of companies on a yearly basis changed performance metrics and/or the peer group composition used for incentive design. This instability in performance metrics and peer groups further reinforces a more short-term focus for measurement and incentives to executive management.
9.3. Competitive pay, not pay for performance, is the dominant executive compensation paradigm
Despite all the talk about pay for performance, competitive executive pay is the dominant executive pay paradigm. This means that comparing the pay structure and levels of executives in other similar companies is the main driver of executive pay design. It should not be surprising, therefore, that executive pay has a lower correlation with underlying five-year economic performance, economic returns and drivers of future enterprise value.
The size of company, industry and executive pay policy explain over 63% of the level of executive compensation today. Performance (e.g. relative TSR, sales growth, ROIC, economic profit) only accounts for 12% as the explanatory variables for CEO compensation.
This means that, by addressing the performance management and measurement gaps identified in this report, tighter alignment between business and shareholder value creation could be achieved. Nonetheless, a high level of disconnect between performance and executive compensation would continue to exist due to the fact that the majority of executive compensation levels are not driven by a combination of return on capital, economic profit growth and relative TSR performance. By segmenting the peer group used for benchmarking competitive pay in line with the value quadrant model introduced in this report (the stage of the business life cycle a company is in) a higher level of alignment between pay and value creation may be achieved.
9.4. Value creation and LTIP design realities – a sample analysis of 128 companies
The S&P 1500 was screened for 150 of the largest value creating companies and 150 of the largest value destroying companies using five-year cumulative economic profit (2008 – 2012) as the core performance measure. The companies were further screened based on five-year relative TSR using the 4-digit GICS peer group, and 32 sample companies were chosen as illustrative of each value quadrant and across industry sectors and are illustrated in the appendix (128 companies).
Of the sample 64 companies with five-year cumulative economic loss (five-year ROIC below WACC) analyzed in detail and disclosed in the appendix (figure 45 and 48), 50 of 64 or 78 % companies delivered a five-year negative ROIC below WACC and had no balance sheet performance metrics disclosed in their LTIP design.
The five-year median ROIC was 4% for value quadrant one and 5% for value quadrant four (the economic profit negative quadrants). When economic returns are converted to dollars, these 64 companies are estimated to have cumulatively generated a $650 billion economic loss over the five-year period (2008-2012). Additionally, 36 of these 64 companies or 56 % generated a greater economic loss in 2012 than in 2008 and thus their economic profit trend over five years is also negative, i.e. their track record of economic value creation has worsened.

The Alignment Gap between Creating Value, Performance Measurement, and Long-Term Incentive Design 63
The Incentive Lab LTIP design data provides further insights when the 64 value quadrant four and one companies and their LTIP designs are analyzed and compared. In value quadrant four, the value destroying companies (five-year negative ROIC and relative TSR), only 22% disclosed balance sheet metrics related to their LTIP design. In value quadrant one (five-year negative ROIC and positive relative TSR), only 28% disclosed balance sheet and capital efficiency metrics related to their LTIP design.
Particularly for companies with a ROIC less than WACC over five years, (i.e. a five-year cumulative economic loss), the use and disclosure of balance sheet and capital efficiency metrics and targets in performance measurement and long term incentive design would provide an enhanced measurement and rewards framework. Such a framework would create tighter alignment with the business strategy, tracking and measuring of economic performance improvement that could lead to a return to sustainable value creation for executive management, directors and investors.

The Alignment Gap between Creating Value, Performance Measurement, and Long-Term Incentive Design 64
Chapter 10: Key Conclusions and Recommendations
We set out to research the following question about the S&P 1500 companies: “What is the relationship and level of alignment between company economic performance, shareholder return and executive compensation?”
The research concludes that the vast majority of the S&P 1500 have a low relationship and alignment between economic performance, shareholder return and long term incentive plan design.
In summary the key conclusions from the research are:
Existing disclosed company performance metrics do not reflect shareholder value
Boards and executive management dedicate considerable attention to value drivers grounded in operational and process efficiency, which drive current value. Over 75% of companies, based on disclosures, are not equipped to explicitly recognize, measure and manage the true factors that will determine long-term enterprise health and future value.
Standard accounting-based metrics focus on top-line revenues and bottom-line earnings growth. Metrics such as EBITDA, earnings, EPS have a low correlation to five-year shareholder returns in the 29% to 38% range and they fail to take into account the level of invested capital required to generate growth and future value.
Current executive compensation is not aligned to long-term performance
Rather than longer-term enterprise performance, compensation for executive management is determined mostly by the role, the size of the company, industry and existing pay policies. Less than a quarter of the S&P 1500 include performance measures such as ROIC, ROE and or economic profit in long-term incentive plan design.
In addition, for 90% of named executive officers, the longest accountable rolling performance period for named executive officers in LTIP design is three years or less. This short-term outlook risks loosing sight of the factors that will determine future value, such as investment into research and development, innovation and human capital, which can take more than three years to fully impact sales, economic profit growth and return on invested capital.
Business performance is linked to life cycle measurements
Analysis of performance of the S&P 1500 companies over ten years identified four distinct value creation quadrants. Each quadrant reveals the characteristics of different stages of maturity, or life cycles, and brings to light the strategic and management challenges each faces to balance sustained revenue growth, economic profit growth and sustained return on invested capital greater than the cost of capital. The value quadrant analytical framework provides a coherent view of where a company is in its value creation corporate life cycle, the potential risks it faces over the longer-term and the opportunities to balance current performance with sustainable value creation.
With a clearer ‘line of sight’ to the underlying drivers of value creation, return on invested capital and or economic profit growth, it would be easier to align executive compensation to effective enterprise stewardship. Yet bringing into view the contribution of leadership teams to enterprise performance is only one part of a much more significant opportunity as management, boards and investors can

The Alignment Gap between Creating Value, Performance Measurement, and Long-Term Incentive Design 65
now reach an understanding and agreement of the performance measures to deploy that more closely aligns to sustainable value creation.
The alignment opportunity
75% of investee companies in the S&P 1500 have an opportunity to enhance long-term shareholder value alignment and long term incentive plan design by:
Applying value-based performance metrics such as ROIC relative to their weighted average cost of capital (WACC) and/or economic profit in performance measurement design and a move away from a dominant use of TSR or EPS;15
Adding future value improvement drivers (i.e. innovation, customer loyalty) to the performance metrics mix and long-term incentive plan design;
Extending the longest accountable performance-period for named executive officers to a period longer than three years, ideally to a five-year rolling performance cycle;
Stabilizing the performance metrics and peer groups used in long-term incentive design to the extent possible over multiple performance cycles;
Creating coherent and coordinated reporting on business performance, executive rewards, and disclosures for investors based on this framework.
15 Total Shareholder Return and Management Performance: An performance metric appropriately used or mostly abused; Roland Burgman and Mark Van Clieaf, Rotman International Journal of Pension Management, Vol 5, Issue 2, 2012

The Alignment Gap between Creating Value, Performance Measurement, and Long-Term Incentive Design 66
Appendices
A. Value creation principles: Excess return, economic profit and TSR
B. ROIC, WACC and Future Value by sector
C. Value Quadrants Sample Analysis
D. Shareholder return correlations by sector
E. Data providers and sources

The Alignment Gap between Creating Value, Performance Measurement, and Long-Term Incentive Design 67
A. Value creation principles: excess return, economic profit and TSR
by Steve O’Byrne
The mostly widely used measure of company performance is total shareholder return or TSR. TSR tells us the future value of an asset with a known beginning value. For example, if a stock is purchased for $100 and has a one-year TSR of 10%, we know that the stock value will be $110 at the end of the year. A more challenging question is “what’s a fair current price for a future cash flow?”. If we expect to receive $110 in a year, what’s the value of that promise now? If an appropriate discount rate, or cost of capital, is 10%, then a fair current price is $100. The process of going backwards from future cash flows to current price is called “discounted cash flow valuation.” It is the most fundamental concept in corporate finance and the source of a more useful performance measure than TSR called “excess return”.
If we buy a stock for $100 expecting a cost of capital return of 10% and the stock value increases to $125 at the end of the year, we have an excess return of $15, the difference between our ending stock value and our expected stock value of $110. We also have a TSR of 25%, but the excess return of $15 is a more useful number than the TSR of 25% because we can connect operating performance, i.e., economic profit, to the dollar excess return in a more precise and insightful way than we can connect it to TSR.
Economic profit (EP) is the operating analog of excess return. Economic profit is equal to net operating profit after-tax (or “NOPAT”) minus a charge for debt and equity capital invested in the business. Let us assume, in the example above, that the company has NOPAT of $10 and invested capital of $100. With a 10% cost of capital, this makes economic profit (EP) zero, i.e., $0 = $10 minus 10% times $100. For a company like this, $100 is a reasonable valuation because it is just equal to the perpetuity value of NOPAT, $10 divided by 10%.
Now let us assume that a new product is introduced during the year and NOPAT increases to $11.36 (we will explain why we are using this odd number shortly). This raises economic profit from $0 to $1.36 since $11.36 minus 10% times 100 = 1.36. Let us also assume that 100% of NOPAT is re-invested in the business, so capital increases to $111.36 and that the company just earns the cost of capital on the new capital. This will increase NOPAT from $11.36 to $12.50 (= $11.36 plus 10% times 11.36), but leave EP unchanged at $1.36 (= $12.50 minus 10% times 111.36). If we assume a steady state going forward, $125 is a reasonable valuation for the company because it is just equal to the perpetuity value of the NOPAT, $12.50 divided by 10%.
When we compare the excess return, $15.00, with the economic profit improvement, $1.36, we can see that the excess return is 11 times the EP improvement. The logic behind the multiple of 11 is that each dollar of ∆EP contributes $1 to cash or capital and $10 to the perpetuity value of NOPAT, increasing investor wealth by a total of $11. In the more general case where the cost of capital is WACC (for “weighted average cost of capital”), the multiple is 1 plus 1 divided by WACC.
This simple example leaves out three complications of the real world: the beginning market value isn’t equal to the perpetuity value of NOPAT, the ending market value is not equal to the perpetuity value of NOPAT, and the time horizon of analysis is longer than one year. To take account of these complications, we need to make three changes to the simple formula “excess return = [1 plus 1 divided by WACC] times ∆EP”.
The Alignment Gap between Creating Value, Performance Measurement, and Long-Term Incentive Design 68
We need to introduce the concept of “expected EP improvement” to take account of the fact that the beginning price is often higher than the perpetuity value of NOPAT, and hence, includes an expectation of EP improvement. Expected EP improvement just earns a cost of capital return because investors pay for it upfront. The amount investors pay upfront for expected EP improvement has a name; it is called “future value”. Future value is equal to the difference between market enterprise value and “current value”, which is the value of the business with no expectation of future EP improvement, i.e., capital plus EP divided by WACC. In our example above, current value is $100 at the start of the year and $125 at the end of the year. Recognizing that there is no excess return for expected EP improvement leads us to the concept of “excess EP improvement”, which is the difference between actual EP improvement and expected EP improvement. Excess ∆EP is only ∆EP that provides an excess return.
When we take account of these complications, the excess return formula changes from “excess return = [1 plus 1 divided by WACC] times ∆EP” to “excess return = [1 plus 1 divided by WACC] times FV of excess ∆EP plus unexpected ∆future value”. If we make the simplifying, and generally reasonable, assumption that the expected change in future value is zero, the formula becomes “excess return = [1 plus 1 divided by WACC] times FV of excess ∆EP plus ∆future value”. In this expression FV denotes mathematical “future valuing” to adjust for the time value of money, i.e., increasing each annual excess ∆EP by (1 plus WACC) for each year after the performance year through the end of the measurement horizon. It is regrettable that mathematicians have appropriated the term “future value” for a far more mundane calculation than the present value of expected EP improvement!
For investors, the most important formula in corporate finance is:
Excess return = [1 plus 1 divided by WACC] times FV of excess ∆EP plus ∆future value
We will extend our simple example to illustrate the calculation of expected ∆EP and show the contribution of ∆future value to the excess return. Let us assume that the price at the end of the year is $150, not $125. The excess return is now $40, not $15, but there is no change in ∆EP or the capitalized value of ∆EP. The missing piece of the excess return is the increase in future value. Future value, as we mentioned above, is the difference between market enterprise value and current value. Market enterprise value is $100 at the start of the year and $150 at the end of year, while current value is $100 (= $100 capital plus $0 EP divided by WACC) at the start of the year and $125 (= $111.36 plus $1.36 EP divided by WACC) at the end of the year. This implies that future value is $0 at the start year, but $25 at the end of the end of the year. The $25 increase in future value is the second component of the $40 excess return, $40 = [1 plus 1 divided by WACC] times ∆EP plus ∆future value = [1 plus 1 divided by 10%] times 1.36 plus $25.
The future value at the end of year 1 implies that investors expect EP improvement in year 2. Investors expect a cost of capital return on both current value, $125, and future value, $25. The total required return is $15 (= 10% times [$125 plus $25]), but expected year 2 NOPAT, with no EP improvement, is only $12.50. Expected NOPAT only provides an 8.3% return on market value, so 1.7% of investors’ required 10% return is missing. The missing return is the cost of capital return on future value. A 10% return on $25 of future value is 1.7% of market value (1.7% = (10% times $25) divided by $150). This is a universal result. Expected NOPAT with no EP improvement, that is, prior year NOPAT plus a cost of capital return on investment in the prior year, will always provide a cost of capital return on current value, but never provide any return on future value.

The Alignment Gap between Creating Value, Performance Measurement, and Long-Term Incentive Design 69
The required return on future value has to come from ∆EP or ∆future value. If we assume that ∆future value is zero, the required ∆EP, or “expected EP improvement”, is $0.23. We calculate the required ∆EP by dividing the required return on future value, $2.50, by the value of $1 of additional ∆EP. Since each $1 of ∆EP contributes $11 of value, $1 of cash or capital and $10 of capitalized EP, the expected EP improvement is $0.23 (= $2.50 divided by 11).
Let us first show that achieving expected EP improvement does not provide an excess return. The expected EP improvement will increase year 2 NOPAT to $12.73 (= $11.36 prior year NOPAT plus $1.14 return on new investment plus $0.23 expected improvement). With this NOPAT, year 2 EP is $1.59 (= $12.73 NOPAT minus 10% times $111.36 capital) and ending capital is $124.09 (= $111.36 beginning capital plus $12.73 retained NOPAT), making current value $140.00 (= $124.09 capital plus $1.59 EP divided by 10%). With no change in future value, market value is $165.00 (= $140.00 current value plus $25.00 future value). Ending market value of $165.00 provides a 10% on beginning market value of $150.00, but zero excess return. Figure 43 extends the example to year 3 and shows that expected EP improvement is an essential component of the expected return, not a source of excess return.
Figure 43: Economic Profit and Market Enterprise Value growth
Year 1 Year 2 Year 3
Beginning capital 100.00 111.36 124.09
NOPAT 11.36 12.73 14.23
Capital charge 10.00 11.14 12.41
Economic Profit 1.36 1.59 1.82
WACC 10% 10% 10%
Current value 125.00 140.00 156.50
Future value 25.00 25.00 25.00
Market value 150.00 165.00 181.50
Expected ∆EP (= beginning future value x WACC/EP multiple)
0.23 0.23
EP value multiple (= 1 + 1/WACC) 11.0 11.0 11.0
It is possible to achieve a cost of capital return on market value when EP is declining, but only if investors are projecting even higher EP in the future. For investors to get a cost of capital return on market value, ∆EP and ∆future value must be sufficient to provide a cost of capital return on future value, i.e., ∆EP times (1 plus 1 divided by WACC) plus ∆future value = WACC times beginning future value. It is possible for negative ∆EP to be fully offset by increases in future value for some years, but eventually this pattern leads to a huge discrepancy between the historical EP return on capital, i.e., ROIC minus WACC, and the prospective EP return on capital. It is possible that the company has a business strategy that warrants the expectation that low historical returns will lay the groundwork for high future returns, but this expectation is increasingly unlikely as the duration of negative EP increases and/or the differential between prospective and historical returns grows.
Figure 44 shows an extension of our simple example where we assume that the EP return on capital, i.e., ROIC minus WACC, declines by 50 bps each year for nine years, but that the increase in future value is sufficient each year to provide a cost of capital return on market value. By the tenth year, future value has increased to 52% of market value, versus 17% of market value in year 1. At this

The Alignment Gap between Creating Value, Performance Measurement, and Long-Term Incentive Design 70
point, the EP return on capital is -3.14%, but the difference between market value and book capital, $184.83, tells us that investors expect future EP with a present value of $184.83. If we assume that the year 10 capital growth of 7.4% continues forever, this expectation requires a positive EP return on capital of +1.27% in year 11 and every future year. If we assume that the year 10 capital growth of 7.4% only continues for 20 years, the future value expectation requires a positive EP return on capital of +2.31% in year 11 and every future year.
Figure 44: Economic Profit, Future Value and required Future Value return
Year 1
Year 2
Year 3
Year 4
Year 5
Year 6
Year 7
Year 8
Year 9
Year 10
Year 11
Beginning capital 100.00 111.36 123.46 136.26 149.70 163.71 178.22 193.13 208.32 223.66 239.01
NOPAT 11.36 12.10 12.80 13.44 14.02 14.51 14.91 15.19 15.34 15.35
Capital charge 10.00 11.14 12.35 13.63 14.97 16.37 17.82 19.31 20.83 22.37
Economic Profit 1.36 0.96 0.45 -0.19 -0.95 -1.86 -2.92 -4.13 -5.49 -7.01
ROIC - WACC (= EP return on capital)
1.36% 0.86% 0.36% -0.14% -0.64% -1.14% -1.64% -2.14% -2.64% -3.14%
WACC 10% 10% 10% 10% 10% 10% 10% 10% 10% 10%
Current value 125.00 133.08 140.75 147.84 154.19 159.62 163.97 167.06 168.74 168.86
Future value 25.00 31.92 40.75 51.81 65.43 81.96 101.77 125.25 152.80 184.83
Market value 150.00 165.00 181.50 199.65 219.62 241.58 265.73 292.31 321.54 353.69
Percent future value 17% 19% 22% 26% 30% 34% 38% 43% 48% 52%
PV of all future EP (= market value - ending capital)
38.64 41.54 45.24 49.95 55.90 63.35 72.60 83.99 97.88 114.68
Capital growth rate 11.4% 10.9% 10.4% 9.9% 9.4% 8.9% 8.4% 7.9% 7.4%
Required EP return on capital - infinite horizon of year 10 capital growth 1.27%
Required EP return on capital - 20 year horizon of year 10 capital growth 2.31%
Required return on future value
2.50% 3.19% 4.08% 5.18% 6.54% 8.20% 10.18% 12.52% 15.28%
Increase in future value 6.92% 8.83% 11.06% 13.62% 16.53% 19.81% 23.48% 27.55% 32.03%
Percent of required return on future value
277% 277% 271% 263% 253% 242% 231% 220% 210%
In Figure 44, investors observe nine years of declining EP return on capital, dropping the EP return on capital to -3.14%, but project going forward that the EP return on capital will be significantly positive, running 441 bps above year 10 (assuming infinite growth) or 545 bps above year 10 (assuming 20 year growth). This is not an impossible scenario, particularly for a company that is using low prices to build a dominant brand that will allow it to raise prices in the future. But executive management, directors and investors need to ask themselves do they have a sound business strategy that warrants future projections of positive EP when their history shows a persistent pattern of negative EP? A critical error for executive management, directors and investor would be to assume that the company’s rising market value is justified by its revenue or earnings growth.

The Alignment Gap between Creating Value, Performance Measurement, and Long-Term Incentive Design 71
B. ROIC, WACC and Future Value by sector
Figure 45: ROIC, WACC, Economic Profit and Future Value benchmarks by sector (period: 2008-2012)
GICS Industry Group
Five yr. median
Total Sales
Growth
Five yr. median ROIC
Five yr. median Cost of Capital (WACC)
Five yr. median
Performance Spread (ROIC -WACC)
Five yr. Avg%
Co's with cumulative
positive Economic Profit for
sector
Five yr. median Future Value%
Enterprise Value for
sector
Five yr. Change in
Future Value % EV
Energy 88.25% 9.85% 8.15% 1.62% 45.83% 24.14% 20.56%
Materials 32.89% 8.21% 8.18% 0.14% 50.89% 34.70% 14.74%
Capital Goods 38.97% 10.29% 7.44% 2.50% 67.35% 24.57% 6.77%
Commercial & Prof Srvs 42.94% 10.09% 8.62% 1.31% 48.08% 41.00% 12.91%
Transportation 44.78% 9.75% 7.39% 2.33% 58.33% 22.98% 8.13%
Automobiles & Components
34.79% 8.53% 5.83% 2.77% 54.55% 3.40% -8.95%
Consumer Durables & Apparel
34.16% 10.36% 8.57% 1.37% 37.50% 30.09% 9.82%
Consumer Services 47.72% 10.38% 7.89% 1.96% 53.73% 37.16% 15.76%
Media 34.33% 6.21% 9.11% -2.48% 26.32% 59.48% 20.84%
Retailing 53.15% 13.04% 9.15% 3.73% 62.75% 40.14% 14.00%
Food & Staples Retailing 62.91% 10.95% 7.68% 2.85% 75.00% 36.88% 6.67%
Food Beverage & Tobacco 30.25% 11.36% 7.17% 3.35% 62.75% 28.76% 4.25%
Household & Personal Products
42.98% 15.47% 6.89% 7.84% 82.35% 20.75% 2.85%
Health Care Equipment & Services
78.69% 11.81% 7.21% 4.56% 70.09% 26.44% 10.93%
Pharm., Biotech. & Life Sciences
94.54% 9.18% 7.75% 0.56% 69.09% 53.26% 37.32%
Banks 49.40% 13.80% 10.80% 2.96% 23.36% 33.16% 20.77%
Diversified Financials 72.60% 18.16% 10.82% 6.76% 50.00% 42.30% 23.74%
Insurance 40.16% 11.94% 10.56% 1.89% 32.20% 18.42% 6.57%
Real Estate 57.33% 9.76% 9.18% 0.66% 31.33% 48.69% 59.21%
Software & Services 81.85% 12.67% 10.67% 2.39% 64.75% 56.42% 19.29%
Technology Hardware & Equipment
60.09% 8.97% 11.60% -2.36% 39.39% 61.19% 27.92%
Semiconductor Equipment 49.50% 6.35% 13.26% -6.65% 42.03% 78.31% 28.12%
Telecom Srvs 49.15% 6.97% 7.51% -0.53% 58.82% 26.46% -0.24%
Utilities 28.21% 6.54% 5.95% 0.49% 78.67% -3.58% -11.23%

The Alignment Gap between Creating Value, Performance Measurement, and Long-Term Incentive Design 72
C. Value Quadrants Sample Analysis
This appendix illustrates 128 S&P 500 and S&P 400 companies, i.e. 32 companies in each of the four value quadrants. These companies were chosen by screening the S&P 1500 for the 150 largest value-creating and 150 largest value-destroying companies, based on five-year cumulative economic profit (period: 2008-2012) and five-year relative TSR using 4 digit GICS codes for the industry sector. They were further screened as representing multiple industry sectors to identify the 128 sample companies.
Below is a summary of these 128 companies’ performance across the four value quadrants.
Figure 46: Value quadrant summary – 128 sample companies (period: 2008-2012)
VQ Sums VQ Performance Statistics
Value Quadrant
Value Quadrant Dominant
Value Style
# Co's
Total Five yr.
Economic Profit
Growth, yr. ending
2012, $ millions
Five yr. Cumulative Ecn Profit
(2008- 2012)
$ millions
Total Five yr.
Rev Growth%
Five yr. Median ROIC%
with Goodwill
Five yr. Median CFROI with
Goodwill
Five yr. NOPAT / FTE%
∆
Five yr. Median Future Value%
Enterprise Value
Total Five yr. Relative
TSR %
Total Five yr.
Absolute TSR %
VQ1
Early Growth
or Turnaround
32 $3,185 -$147,926 -11% 4% 4.69 -32% 60% 31% 81%
VQ2
Sustained Growth &
High Performance
32 $88,350 $604,666 25% 16% 11.23 40% 8% 24% 60%
VQ3
Mature Growth
or Harvest
32 $777 $281,960 20% 15% 10.18 -7% 8% -19% 17%
VQ4
Restructure or
Transform Business Model
32 -$62,214 -$502,694 6% 5% 5.24 -63% 36% -52% -38%
Total 128 $30,098 $236,006
This type of value quadrant analysis can be undertaken on a sector and peer group within a sector basis and provides strategic insight into which companies and their leadership teams are creating or destroying the most value for long horizon investors.
The 128 companies have been segmented in more detail across the four value quadrants (figures 47, 48, 49 & 50) and their five-year performance results (2008 − 2012). The following tables use data feeds directly from a number of subscription databases that have not been 100% validated. These tables are therefore intended for illustrative purposes only in using economic profit and return on invested capital type performance metrics and the value quadrants. The median Transaction CFROI from Credit Suisse HOLT (CFROI with goodwill) is as of June 2014 for year end 2012.

The Alignment Gap between Creating Value, Performance Measurement, and Long-Term Incentive Design 73
Figure 47: Value quadrant 1 – 32 companies with detailed performance metrics
VQ Sums VQ Performance Statistics
Company Ticker
Total Five yr.
Economic Profit
Growth, yr.
Ending 2012,
$ millions
Five yr. Cumulative Ecn Profit
(2008- 2012)
$ millions
Total Five yr.
Revenue Growth%
Five yr. Median ROIC%
with Goodwill
Five yr. Median Trsntn CFROI
Five yr. NOPAT / FTE % ∆
Five yr. Median Future Value%
Enterprise Value
Total Five yr. Relative
TSR %
Total Five yr.
Absolute TSR %
ITT CORP ITT $27 ($116) -75% 10% 10% 142% 12% 13% 36%
SLM CORP SLM $2,234 ($137) -37% 7% N/A -177% 60% 31% 42%
TECH DATA CORP TECD $214 ($215) 8% 8% 8% 71% 18% 3% 39%
LEGGETT & PLATT INC LEG $255 ($356) -14% 7% 7% 172% 62% 55% 186%
GATX CORP GMT ($76) ($499) -1% 5% 5% -11% 32% 31% 58%
KEMPER CORP/DE KMPR ($17) ($707) -15% 5% 3% -26% 55% 11% 17%
FAIRCHILD SEMICONDUCTOR INTL FCS $20 ($713) -16% 0% 2% -92% 96% 4% 19%
OMNICARE INC OCR $27 ($919) -1% 4% 6% 29% 25% 60% 131%
VERTEX PHARMACEUTICALS INC VRTX $485 ($934) 667% -38% 12% -160% 167% 31% 130%
CYPRESS SEMICONDUCTOR CORP CY $177 ($958) -52% 0% 4% -111% 100% 76% 101%
CINCINNATI FINANCIAL CORP CINF ($18) ($975) -3% 7% 5% -38% 43% 54% 62%
NISOURCE INC NI $336 ($1,128) -37% 4% 2% 33% 18% 65% 123%
INTL PAPER CO IP $425 ($1,181) 27% 7% 3% -8% 24% 79% 104%
UNITED RENTALS INC URI $113 ($1,182) 10% 1% 7% -3% 102% 143% 192%
SANDISK CORP SNDK ($71) ($1,285) 30% 10% 12% -30% 27% 64% 144%
CONSTELLATION BRANDS -CL A STZ $266 ($1,428) -26% 4% 7% 153% 58% 40% 149%
TENET HEALTHCARE CORP THC $1,442 ($1,823) 3% 4% 5% -175% 59% 45% 110%
CHEMTURA CORP CHMT $135 ($2,585) -30% -8% 3% -13% 178% 158% 198%
MASCO CORP MAS ($393) ($3,041) -34% -1% 5% -123% 117% 1% 22%
JPMORGAN CHASE & CO JPM $878 ($3,812) -8% 11% 8% 2% 6% 79% 23%
MONDELEZ INTERNATIONAL INC MDLZ ($2,175) ($4,119) -6% 6% 7% -36% 25% 6% 84%
HUNTINGTON BANCSHARES HBAN ($428) ($4,325) -12% -1% 2% -31% 102% 0% -22%
RESOLUTE FOREST PRODUCTS INC RFP $441 ($4,441) 16% 1% 1% -120% 100% 8% 25%
ALLSTATE CORP ALL ($1,145) ($5,586) -10% 6% 7% -33% 38% 13% 19%
CIT GROUP INC CIT $1,446 ($6,011) -49% 1% 2% -152% 109% 400% 289%
ANADARKO PETROLEUM CORP APC ($1,631) ($6,027) 18% 6% 3% -58% 43% 26% 43%
COMCAST CORP CMCSA $4,888 ($6,063) 103% 6% N/A 59% 12% 15% 137%
XL GROUP PLC XL ($82) ($6,361) -19% -3% 3% -20% 60% 17% 23%
COCA-COLA ENTERPRISES INC CCE ($179) ($9,004) -61% -4% 6% -320% 209% 36% 137%
MOTOROLA SOLUTIONS INC MSI $293 ($16,728) -76% -5% 2% -872% 205% 19% 77%
CBS CORP CBS $5,576 ($23,503) 0% -4% 4% -136% 169% 16% 141%
CONOCOPHILLIPS COP ($10,281) ($31,765) -66% 3% 4% -56% 65% 12% 26%
SUM $3,185 ($147,926)
80th $477 ($754) 10% 7% 7% 24% 108% 65% 140%
Median $124 ($1,625) -11% 4% 5% -32% 60% 31% 81%
20th ($159) ($6,024) -37% -1% 3% -133% 25% 11% 23%
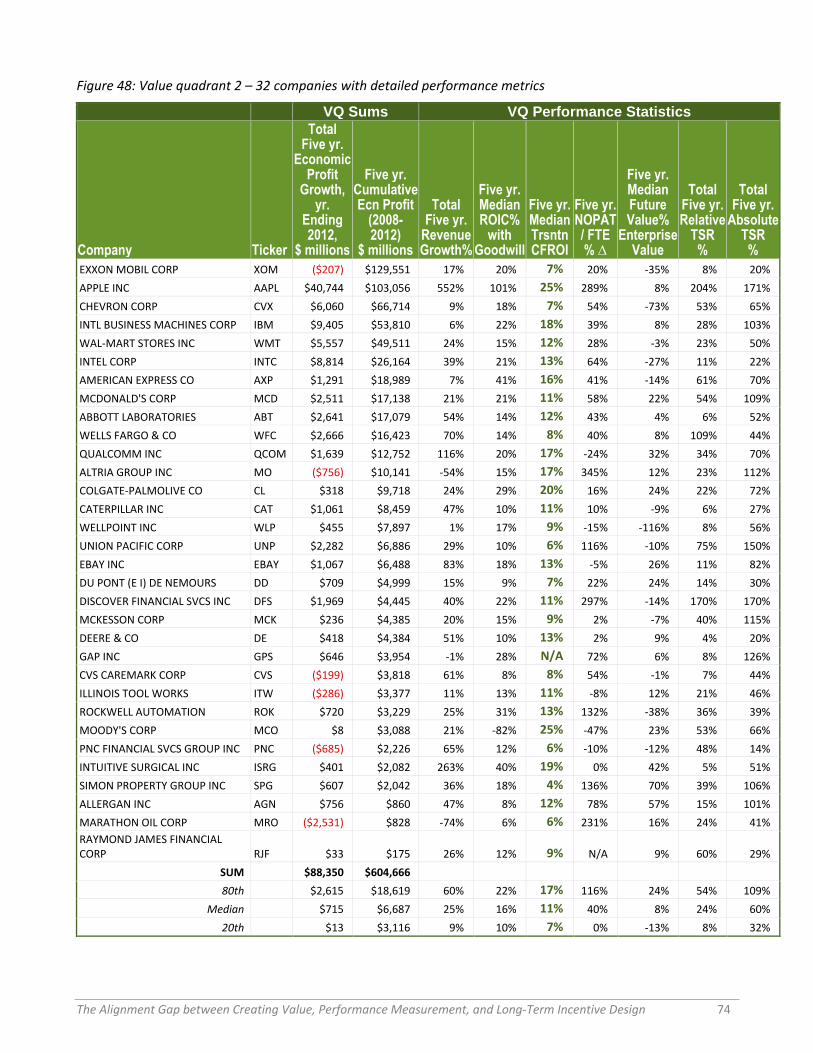
The Alignment Gap between Creating Value, Performance Measurement, and Long-Term Incentive Design 74
Figure 48: Value quadrant 2 – 32 companies with detailed performance metrics
VQ Sums VQ Performance Statistics
Company Ticker
Total Five yr.
Economic Profit
Growth, yr.
Ending 2012,
$ millions
Five yr. Cumulative Ecn Profit
(2008- 2012)
$ millions
Total Five yr.
Revenue Growth%
Five yr. Median ROIC%
with Goodwill
Five yr. Median Trsntn CFROI
Five yr. NOPAT / FTE % ∆
Five yr. Median Future Value%
Enterprise Value
Total Five yr. Relative
TSR %
Total Five yr.
Absolute TSR %
EXXON MOBIL CORP XOM ($207) $129,551 17% 20% 7% 20% -35% 8% 20%
APPLE INC AAPL $40,744 $103,056 552% 101% 25% 289% 8% 204% 171%
CHEVRON CORP CVX $6,060 $66,714 9% 18% 7% 54% -73% 53% 65%
INTL BUSINESS MACHINES CORP IBM $9,405 $53,810 6% 22% 18% 39% 8% 28% 103%
WAL-MART STORES INC WMT $5,557 $49,511 24% 15% 12% 28% -3% 23% 50%
INTEL CORP INTC $8,814 $26,164 39% 21% 13% 64% -27% 11% 22%
AMERICAN EXPRESS CO AXP $1,291 $18,989 7% 41% 16% 41% -14% 61% 70%
MCDONALD'S CORP MCD $2,511 $17,138 21% 21% 11% 58% 22% 54% 109%
ABBOTT LABORATORIES ABT $2,641 $17,079 54% 14% 12% 43% 4% 6% 52%
WELLS FARGO & CO WFC $2,666 $16,423 70% 14% 8% 40% 8% 109% 44%
QUALCOMM INC QCOM $1,639 $12,752 116% 20% 17% -24% 32% 34% 70%
ALTRIA GROUP INC MO ($756) $10,141 -54% 15% 17% 345% 12% 23% 112%
COLGATE-PALMOLIVE CO CL $318 $9,718 24% 29% 20% 16% 24% 22% 72%
CATERPILLAR INC CAT $1,061 $8,459 47% 10% 11% 10% -9% 6% 27%
WELLPOINT INC WLP $455 $7,897 1% 17% 9% -15% -116% 8% 56%
UNION PACIFIC CORP UNP $2,282 $6,886 29% 10% 6% 116% -10% 75% 150%
EBAY INC EBAY $1,067 $6,488 83% 18% 13% -5% 26% 11% 82%
DU PONT (E I) DE NEMOURS DD $709 $4,999 15% 9% 7% 22% 24% 14% 30%
DISCOVER FINANCIAL SVCS INC DFS $1,969 $4,445 40% 22% 11% 297% -14% 170% 170%
MCKESSON CORP MCK $236 $4,385 20% 15% 9% 2% -7% 40% 115%
DEERE & CO DE $418 $4,384 51% 10% 13% 2% 9% 4% 20%
GAP INC GPS $646 $3,954 -1% 28% N/A 72% 6% 8% 126%
CVS CAREMARK CORP CVS ($199) $3,818 61% 8% 8% 54% -1% 7% 44%
ILLINOIS TOOL WORKS ITW ($286) $3,377 11% 13% 11% -8% 12% 21% 46%
ROCKWELL AUTOMATION ROK $720 $3,229 25% 31% 13% 132% -38% 36% 39%
MOODY'S CORP MCO $8 $3,088 21% -82% 25% -47% 23% 53% 66%
PNC FINANCIAL SVCS GROUP INC PNC ($685) $2,226 65% 12% 6% -10% -12% 48% 14%
INTUITIVE SURGICAL INC ISRG $401 $2,082 263% 40% 19% 0% 42% 5% 51%
SIMON PROPERTY GROUP INC SPG $607 $2,042 36% 18% 4% 136% 70% 39% 106%
ALLERGAN INC AGN $756 $860 47% 8% 12% 78% 57% 15% 101%
MARATHON OIL CORP MRO ($2,531) $828 -74% 6% 6% 231% 16% 24% 41%
RAYMOND JAMES FINANCIAL CORP RJF $33 $175 26% 12% 9% N/A 9% 60% 29%
SUM $88,350 $604,666
80th $2,615 $18,619 60% 22% 17% 116% 24% 54% 109%
Median $715 $6,687 25% 16% 11% 40% 8% 24% 60%
20th $13 $3,116 9% 10% 7% 0% -13% 8% 32%

The Alignment Gap between Creating Value, Performance Measurement, and Long-Term Incentive Design 75
Figure 49: Value quadrant 3 – 32 companies with detailed performance metrics
VQ Sums VQ Performance Statistics
Company Ticker
Total Five yr.
Economic Profit
Growth, yr.
Ending 2012,
$ millions
Five yr. Cumulative Ecn Profit
(2008- 2012)
$ millions
Total Five yr.
Revenue Growth%
Five yr. Median ROIC%
with Goodwill
Five yr. Median Trsntn CFROI
Five yr. NOPAT / FTE % ∆
Five yr. Median Future Value%
Enterprise Value
Total Five yr. Relative
TSR %
Total Five yr.
Absolute TSR %
MICROSOFT CORP MSFT $7,793 $82,975 44% 46% 24% 31% -32% -21% 13%
COCA-COLA CO KO $3,577 $31,776 66% 21% 12% 11% 11% -15% 54%
PEPSICO INC PEP ($1,018) $23,463 66% 24% 10% -22% 8% -31% 27%
PROCTER & GAMBLE CO PG ($2,103) $20,605 9% 10% 10% 8% 22% -24% 14%
SCHLUMBERGER LTD SLB ($924) $13,653 81% 16% 10% -21% 32% -20% -8%
LILLY (ELI) & CO LLY ($2,339) $10,777 21% 11% 11% -35% -21% -20% 42%
AT&T INC T $3,118 $10,268 7% 8% 4% -11% 1% -12% 28%
LOCKHEED MARTIN CORP LMT ($51) $10,209 13% 15% 11% 19% -9% -3% 17%
RAYTHEON CO RTN $1,409 $7,906 15% 17% 10% 97% -57% -13% 5%
GOLDMAN SACHS GROUP INC GS ($5,458) $7,672 -53% 13% 10% -29% -11% -14% -8%
HALLIBURTON CO HAL $728 $7,402 87% 18% 10% 12% -19% -4% 9%
DISNEY (WALT) CO DIS $2,199 $7,366 19% 10% 7% 4% 1% -4% 65%
MEDTRONIC INC MDT ($402) $6,728 23% 11% 10% 2% 3% -27% 18%
AFLAC INC AFL $975 $5,014 65% 21% 17% 52% -3% -13% -8%
SCHWAB (CHARLES) CORP SCHW $219 $4,513 -11% 25% 8% 45% 36% -7% 1%
OMNICOM GROUP OMC $162 $3,822 12% 20% 14% 3% -16% -30% 48%
KELLOGG CO K ($181) $3,800 21% 16% 11% -29% 16% -19% 43%
COACH INC COH $375 $3,748 82% 73% 29% -7% 26% -6% 24%
UNITED PARCEL SERVICE INC UPS ($4,111) $3,598 9% 12% 10% -125% 43% -16% 37%
ARCHER-DANIELS-MIDLAND CO ADM ($1,209) $3,480 102% 12% 5% -16% -34% -43% -9%
VIACOM INC VIAB $1,175 $3,235 3% 11% 13% 55% 8% -24% 41%
AGILENT TECHNOLOGIES INC A $260 $3,176 27% 19% 9% 43% -16% -13% 34%
ADOBE SYSTEMS INC ADBE ($162) $2,106 39% 14% 13% -44% 22% -29% 17%
DUN & BRADSTREET CORP DNB ($64) $1,575 4% 48% 24% -6% 3% -21% 13%
AVON PRODUCTS AVP ($621) $1,381 8% 17% 14% -85% 38% -58% -38%
UDR INC UDR $78 $406 44% 20% 4% N/A 55% -12% 33%
NORTHERN TRUST CORP NTRS ($321) $401 -22% 10% 8% -36% 46% -16% -8%
SPX CORP SPW ($527) $385 6% 12% 7% -77% -16% -32% -18%
NUCOR CORP NUE ($1,364) $215 17% 7% 5% -67% 39% -30% -19%
SL GREEN REALTY CORP SLG ($150) $108 34% 8% 4% 76% 20% -22% 18%
CORRECTIONS CORP AMER CXW ($23) $103 19% 12% 6% 23% 42% -5% 45%
ABERCROMBIE & FITCH -CL A ANF ($262) $92 20% 8% 6% -52% 73% -65% -27%
SUM $777 $281,960
80th $925 $10,256 61% 21% 13% 31% 37% -12% 40%
Median ($107) $3,811 20% 15% 10% -6% 8% -19% 17%
20th ($999) $601 7% 10% 6% -36% -16% -30% -8%

The Alignment Gap between Creating Value, Performance Measurement, and Long-Term Incentive Design 76
Figure 50: Value quadrant 4 – 32 companies with detailed performance metrics
VQ Sums VQ Performance Statistics
Company Ticker
Total Five yr.
Economic Profit
Growth, yr.
Ending 2012,
$ millions
Five yr. Cumulative Ecn Profit
(2008- 2012)
$ millions
Total Five yr.
Revenue Growth%
Five yr. Median ROIC%
with Goodwill
Five yr. Median Trsntn CFROI
Five yr. NOPAT / FTE % ∆
Five yr. Median Future Value%
Enterprise Value
Total Five yr. Relative
TSR %
Total Five yr.
Absolute TSR %
HESS CORP HES ($722) ($276) 19% 7% 6% 0% 5% -27% -16%
MANPOWERGROUP MAN ($180) ($322) 1% 6% 7% -43% 31% -23% 10%
HEWLETT-PACKARD CO HPQ ($10,234) ($718) 15% 12% 13% -106% 11% -75% -60%
BARNES & NOBLE INC BKS ($381) ($873) 26% -2% 5% -277% 137% -73% -36%
AVNET INC AVT $108 ($879) 64% 8% 9% -29% 17% -48% -27%
INGRAM MICRO INC IM $146 ($1,007) 8% 6% 7% -36% 38% -17% 24%
SEALED AIR CORP SEE ($997) ($1,094) 64% 8% 6% -223% 18% -6% 9%
JABIL CIRCUIT INC JBL $184 ($1,273) 40% 5% 8% -17% 36% -7% 26%
CARNIVAL CORP/PLC (USA) CCL ($1,401) ($1,619) 18% 7% 6% -44% 27% -31% 3%
METLIFE INC MET ($6,240) ($1,680) 29% 16% 6% -67% -57% -36% -29%
NABORS INDUSTRIES LTD NBR ($649) ($1,904) 42% 3% 6% -61% 46% -58% -52%
TEXTRON INC TXT $305 ($2,056) -7% 6% 5% 27% 34% -53% -44%
PENNEY (J C) CO JCP ($2,093) ($2,705) -35% 6% 5% -270% 53% -80% -57%
NEWFIELD EXPLORATION CO NFX ($1,451) ($2,805) 44% -7% 3% -267% 184% -63% -58%
FREEPORT-MCMORAN COP&GOLD FCX ($2,144) ($2,807) 6% 20% 15% -37% -30% -34% -23%
ELECTRONIC ARTS INC EA ($295) ($3,329) 4% -3% 2% -176% 144% -68% -48%
VALERO ENERGY CORP VLO ($2,372) ($3,568) 46% 6% 5% -47% -13% -10% 2%
E TRADE FINANCIAL CORP ETFC $2,230 ($3,872) -2% -1% 0% -98% 114% -75% -72%
XEROX CORP XRX ($8) ($4,270) 30% 5% 8% -65% 35% -62% -36%
PFIZER INC PFE ($486) ($6,321) 22% 7% 6% 37% 20% 0% 75%
SEARS HOLDINGS CORP SHLD ($622) ($6,467) -21% 3% 3% -146% 67% -72% -41%
BANK OF NEW YORK MELLON CORP BK ($2,452) ($6,694) 2% 7% 7% -29% 30% -33% -26%
DOW CHEMICAL DOW ($2,928) ($7,328) 6% 5% 3% -51% 44% -10% 5%
AMERICAN AIRLINES GROUP INC AAL ($753) ($7,719) 9% -5% 3% -132% 142% -71% -54%
ADVANCED MICRO DEVICES AMD $2,060 ($8,250) -10% -4% 4% 2% 217% -62% -57%
MORGAN STANLEY MS ($1,195) ($9,535) -62% 0% 5% -105% 79% -48% -44%
DEVON ENERGY CORP DVN ($2,090) ($9,800) -16% 5% 2% -73% 30% -51% -43%
ALCOA INC AA ($2,225) ($10,441) -23% 3% 2% -72% 66% -78% -74%
BANK OF AMERICA CORP BAC ($23,785) ($60,970) -16% 3% 3% -93% 29% -60% -65%
CITIGROUP INC C $4,562 ($97,189) -38% 4% 2% -497% 31% -74% -78%
GENERAL ELECTRIC CO GE ($9,753) ($97,678) -15% 4% N/A -38% 55% -45% -23%
AMERICAN INTERNATIONAL GROUP AIG $3,649 ($137,246) -40% -7% %2 394% 63% -95% -94%
SUM ($62,214) ($502,694)
80th $139 ($1,130) 30% 7% 7% -29% 77% -24% 3%
Median ($738) ($3,449) 6% 5% 5% -63% 36% -52% -38%
20th ($2,343) ($9,278) -16% -1% 3% -143% 18% -73% -57%

The Alignment Gap between Creating Value, Performance Measurement, and Long-Term Incentive Design 77
D. Shareholder return correlations by sector
Figure 51: Shareholder return correlations with operating performance by sector for period 2003 – 2012 (rolling five-year performance periods over ten-years of observations)
Sector by four-digit GICS code
Variance explained by Net Income
Variance explained by Net Income
& Net Income
Change
Variance explained by
NEPAT &
Economic Profit Change
Variance explained by
NEPAT, Economic
Profit ∆ Sales growth, ROIC,
ROIC X Sales
1010 Energy 30.9% 37.5% 39.9% 44.2%
1510 Materials 46.0% 59.0% 57.7% 60.2%
2010 Capital Goods 19.0% 30.9% 43.0% 46.6%
2020 Commercial & Professional Services 11.5% 47.4% 65.2% 67.8%
2030 Transportation 36.1% 36.2% 44.3% 52.3%
2510 Automobiles & Components 32.0% 35.7% 46.0% 50.5%
2520 Consumer Durables & Apparel 40.9% 47.2% 57.2% 62.9%
2530 Consumer Services 29.1% 29.1% 35.3% 36.8%
2540 Media 49.5% 51.8% 50.7% 53.3%
2550 Retailing 31.3% 40.4% 44.5% 47.6%
3010 Food & Staples Retailing 8.5% 10.2% 12.0% 12.8%
3020 Food Beverage & Tobacco 48.6% 66.4% 68.6% 80.6%
3030 Household & Personal Products 38.4% 38.9% 46.9% 63.1%
3510 Health Care Equipment & Services 19.9% 37.2% 37.0% 43.1%
3520 Pharm., Biotech. & Life Sciences 2.7% 13.1% 28.4% 38.2%
4010 Banks 21.4% 52.4% 51.1% 53.3%
4020 Diversified Financials 23.7% 28.5% 36.2% 37.0%
4030 Insurance 49.7% 63.0% 64.8% 69.7%
4040 Real Estate 23.8% 34.7% 38.1% 40.2%
4510 Software & Services 22.1% 33.3% 29.8% 38.9%
4520 Technology Hardware & Equipment 25.1% 32.2% 33.5% 39.8%
4530 Semiconductor Equipment 27.0% 29.5% 29.4% 33.2%
5010 Telecommunications Services 36.7% 37.6% 31.5% 33.5%
5510 Utilities 27.9% 32.1% 43.6% 50.5%
Average 29.2% 38.5% 43.1% 48.1%

The Alignment Gap between Creating Value, Performance Measurement, and Long-Term Incentive Design 78
E. Data providers and sources
Databases and data analytics have been woven together to create integrated insights about:
1. Economic performance and shareholder value
a. Organizational Capital Partners
i. S&P 1500 with data feed from S&P Compustat and Hoovers and calculations for economic profit, adjusted ROIC and Future Value
b. Shareholder Value Advisors
i. S&P 1500 with data feed from S&P Compustat and calculations for economic profit, adjusted ROIC and Future Value
2. Pay for Performance alignment and long-term incentive plan design
a. Incentive Lab – with over 1200 companies across the S&P 500, 400 and 600 and their incentive design details including pay mix, short-term vs. long term, performance based vs. time based, performance metrics, performance periods for named officers
b. Shareholders Value Advisors
i. Perfect Pay for Performance model and analytics using the complete S&P 1500 and a broad range of economic profit and relative TSR performance metrics and S&P ExecuComp database
ii. Model and analytics for Pay for Performance Alignment, Pay Leverage and Excess Pay relative average peer group performance
3. Proxy voting for Say on Pay by institutional shareholders (mutual funds and pension funds)
a. FundVotes
i. A database covering mutual fund voting for over 100 mutual fund families representing over $11 trillion in global assets under management. The top 30 mutual fund groups include $9.4 trillion in global assets under management and $3.8 trillion in US domestic equities.
ii. This analysis also covers 11 of the larger North American pension funds with close to $2 trillion in global assets under management

The Alignment Gap between Creating Value, Performance Measurement, and Long-Term Incentive Design 79
Glossary – Key terms
Term Definition
Capital charge Capital charge in dollars = beginning invested capital times weighted average cost of capital.
Cash flow return on investment (CFROI)
The cash flow return on investment (CFROI) measures a company's cash return on invested assets. It is calculated as the internal rate of return assuming the maintenance of the current gross cash flow for the life of the asset base. Transaction CFROI includes goodwill from acquisitions (Credit Suisse Holt)
Company wealth index
The company wealth index is a cumulative measure of shareholder wealth per share calculated from monthly total returns.
Current value (CV)
The sum of invested capital plus the present value of the current economic profit level. Economic Profit / WACC + Invested Capital
Discounted Cash flow valuation (DCF)
Discounted cash flow (DCF) valuation is a method of valuing an asset using the time value of money. DCF value is the present value of expected future cash flows discounted at the cost of capital. It can also be expressed as the sum of book capital plus the present value of expected economic profit.
Earnings per share (EPS)
Net Income available to common shareholders divided by the weighted average number of shares outstanding.
Economic profit (EP)
Economic profit is a non-GAAP measure of true economic profitability and is a measure of profit after minimum return for both invested equity and debt capital. NOPAT minus capital charge equals economic profit.
Enterprise value (EV)
Market value of equity plus the market value of debt minus excess cash. We assume that the market value of debt is equal to its book value. Enterprise value is also made up of two components, which are the current value (CV) and the future value (FV) of the enterprise. Enterprise value can also be calculated as = present value of current economic profit plus current invested capital plus present value of economic profit improvement.
Enterprise value divided by NOPAT multiple
Enterprise value divided by net operating profit after tax. This valuation multiple includes the total value of the company (debt plus equity minus excess cash) versus only the market value of equity in a P/E multiple. This multiple provides a comparison free of capital structure differences of the operating-cash generating capacity of the company; some investment banks find this multiple has a higher correlation with TSR than other valuation multiples; a high enterprise value divided by NOPAT multiple means a high expectation for future growth
Excess cash Cash, cash equivalents and short-term investments beyond 2% of revenues that are not required to operate the business.
Excess shareholder returns relative to weighted average cost of capital
The dollar difference between actual shareholder wealth and shareholder wealth assuming a cost of capital return. The excess return can expressed as the sum of the future value of capitalized excess economic profit improvement and the dollar change in future value
Future value (FV)
Enterprise value minus current value equals future value. If the current economic profit level is fully sustainable, one can show mathematically that future value is equal to the present value of future economic profit improvement.
Generally Accepted Accounting Principles (GAAP)
Generally accepted accounting principles (GAAP) refer to the standard framework of guidelines for financial accounting used in any given jurisdiction; generally known as accounting standards or standard accounting practice. These include the standards, conventions, and rules that accountants follow in recording and summarizing and in the preparation of financial statements.

The Alignment Gap between Creating Value, Performance Measurement, and Long-Term Incentive Design 80
Term Definition
Invested capital Total asset (including goodwill) minus non-interest bearing current liabilities minus capitalized special items (including discontinued operations) minus excess cash plus capitalized R&D. Positive special items (gains) reduce capital, while negative special items (losses) increase capital
Net Equity Profit After Tax (NEPAT)
Earnings before taxes on the income statement (EBT), adjusted for special items and R&D, minus cash taxes paid from the cash flow statement. Special items (including discontinued operations) and R&D expense are capitalized and amortized over a five-year period.
Net Operating Profit After Tax (NOPAT)
Earnings before interest and taxes (EBIT) on the income statement, adjusted for special items and R&D, minus cash taxes paid from the cash flow statement and minus the tax savings from interest expense, calculated at the corporate marginal rate. Special items (including discontinued operations) and R&D expense are capitalized and amortized over a five-year period.
Non-interest-bearing current liabilities
Non-interest bearing current liabilities including accounts payable and taxes payable.
Performance-based equity compensation
Awards with market and/or performance conditions.
Performance spread Return on invested capital (ROIC) minus the cost of capital (WACC). A positive performance spread is where ROIC exceeds WACC and results in value creation for shareholders. A negative performance spread is where ROIC is lower than WACC and results in value destruction for shareholders.
Price divided by earnings multiple (P/E multiple or ratio)
Market value of equity divided by the net income for the period. This is usually calculated on a yearly or trailing twelve-month time period. This may be converted to stock price per share divided by earnings per share; the higher the P/E multiple is, the higher is the investors expectation of future growth and innovation from the company relative to current earnings. Conversely, a stock with a low P/E multiple suggests that investors have more modest expectations for its future growth compared to the market as a whole.
Relative total shareholder return
The company’s shareholder return relative to that of a specific comparator group, i.e., [(1 + TSR)/(1 + peer group TSR)] – 1. For this report, we use each company’s GICS industry group (four digit GICS) as its peer group.
Return on equity (ROE)
Net Income divided by beginning shareholders’ equity.
Return on invested capital (ROIC)
A non-GAAP measure of capital productivity and balance-sheet efficiency measured as net operating profit after tax divided by beginning invested capital; a measure of the competitive advantage of a company in creating value for shareholders.
Time-based equity compensation
Awards dependent on a defined time period.
Total shareholder return (TSR)
The point-to-point measurement of the percentage gain or loss to shareholders, i.e., (share price end of period minus share price beginning of period) plus dividends divided by share price beginning of period. TSR for periods longer than one month is calculated by compounding monthly TSR.
Weighted Average Cost of Capital (WACC)
A calculation of a firm's cost of capital in which each category of capital is proportionately weighted. All capital sources (i.e. common stock, preferred stock, bonds and any other long-term debt) are included in a WACC calculation. The median WACC for all S&P 1500 companies for the last 5 and 10 years is 8%.

The Alignment Gap between Creating Value, Performance Measurement, and Long-Term Incentive Design 81
List of tables and figures Figure 1: Excess shareholder returns value tree ................................................................................................... 15
Figure 2: Market capitalization coverage by percent of companies ..................................................................... 16
Figure 3: Global industrial classification sector (GICS) coverage .......................................................................... 16
Figure 4: Market capitalization coverage in trillions for 2012 .............................................................................. 17
Figure 5: Economic profit value driver tree .......................................................................................................... 21
Figure 6: Current value driver tree ........................................................................................................................ 23
Figure 7: Enterprise value driver tree ................................................................................................................... 24
Figure 8: Future value driver tree ........................................................................................................................ 25
Figure 9: Future value of sample companies, as of 2012 year end ....................................................................... 26
Figure 10: Total shareholder return value driver tree .......................................................................................... 27
Figure 11: Five-year rolling cumulative economic profit versus five-year relative TSR (period: 2008 – 2012) .... 28
Figure 12: Five-year rolling cumulative economic profit versus five-year relative TSR over ten years of observation (period: 2003 – 2012) ........................................................................................................................ 29
Figure 13: Five-year sales growth & five-year cumulative economic profit (2008-2012) ..................................... 31
Figure 14: S&P 1500: Ten-year average ROIC versus ten-year compounded sales growth.................................. 32
Figure 15: S&P 500: Ten-year average ROIC versus ten-year compounded sales growth.................................... 32
Figure 16: Five-year rolling sales growth periods, over ten years (period: 2003 – 2012)..................................... 33
Figure 17:Five-year rolling average ROIC with goodwill, over ten years (period: 2003 – 2012) .......................... 34
Figure 18: Future value as percentage of enterprise value, over ten years (period: 2003 – 2012) ..................... 34
Figure 19: Value quadrant performance metrics .................................................................................................. 36
Figure 20: Value creation life cycle and value quadrant performance metrics .................................................... 37
Figure 21: Value creation life cycle ....................................................................................................................... 37
Figure 22: Operating driver performance metric correlation with shareholder return over 10 years (period: 2003 - 2012) ............................................................................................................................................. 39
Figure 23: Enterprise value divided by NOPAT valuation multiple ....................................................................... 40
Figure 24: Future value median as a percentage of enterprise value – S&P 1500 (period: 1996-2013) .............. 41
Figure 25: Median Annual Investments Levels in R&D and new capital expenditures for S&P 1500 (period: 1996-2013) .............................................................................................................................................. 41
Figure 26: Median ROIC, sales growth – S&P 1500 (period: 1996-2013) ............................................................. 42
Figure 27: Value quadrant distributions for S&P 1500 (five-year period: 2008-2012) ......................................... 44
Figure 28: Value quadrant performance for S&P 500 and 400 (ten-year observation period: 2003 - 2012) ....... 45
Figure 29: Value quadrant performance percentiles S&P 500 and 400 (five-year period: 2008-2012) ............... 47
Figure 30: Value quadrant performance plotting - sample companies ................................................................ 48
Figure 31: Value quadrant performance analysis - sample companies ................................................................ 49
Figure 32: Five-year CEO realizable total pay correlation with variance factors S&P 1500 .................................. 51

The Alignment Gap between Creating Value, Performance Measurement, and Long-Term Incentive Design 82
Figure 33: Long-term incentive awards (fiscal year 2013)- source Incentive Lab ................................................. 53
Figure 34: Common performance metrics ............................................................................................................ 54
Figure 35: Performance metrics used in performance-based awards (fiscal year 2013)- Incentive Lab .............. 55
Figure 36: Metrics for performance-based awards 2013- by sector – Incentive Lab ........................................... 56
Figure 37: Realities in the use of return and value base performance metrics in LTI design ............................... 56
Figure 38: Longest performance period for LTI performance design – Incentive Lab .......................................... 57
Figure 39: Longest performance period for LTI performance design – by sector – Incentive Lab ....................... 58
Figure 40: Performance metrics change for incentive design – Incentive Lab ..................................................... 59
Figure 41: Peer group change for incentive design and relative performance benchmarking- Incentive Lab ..... 60
Figure 43: Economic Profit and Market Enterprise Value growth ........................................................................ 69
Figure 44: Economic Profit, Future Value and required Future Value return ....................................................... 70
Figure 45: ROIC, WACC, Economic Profit and Future Value benchmarks by sector (period: 2008-2012) ............ 71
Figure 46: Value quadrant summary – 128 sample companies (period: 2008-2012) ........................................... 72
Figure 47: Value quadrant 1 – 32 companies with detailed performance metrics .............................................. 73
Figure 48: Value quadrant 2 – 32 companies with detailed performance metrics .............................................. 74
Figure 49: Value quadrant 3 – 32 companies with detailed performance metrics .............................................. 75
Figure 50: Value quadrant 4 – 32 companies with detailed performance metrics .............................................. 76
Figure 51: Shareholder return correlations with operating performance by sector for period 2003 – 2012 (rolling five-year performance periods over ten-years of observations) .............................................................. 77