the airport commercial sales benchmarking report
TRANSCRIPT

THE AIRPORT COMMERCIAL SALES
BENCHMARKING REPORT
(sample document)
1
by
TABLE OF CONTENTS
Introduction
Disclaimer
Methodology and Assumptions
Summary of Findings : Duty-Free
Summary of Findings : Duty-Free and Duty-Paid
Summary of Findings : Food & Beverage
Summary Tables: Duty-Free
Summary Tables: Duty-Free and Duty-Paid
Summary Tables: Food & Beverage
Airport Profiles : Argentina – Aeropuertos Argentina 2000
Airport Profiles : Australia – Sydney Airport
Airport Profiles : Australia – Melbourne Airport
Airport Profiles : Australia – Selected Australian Airports
Airport Profiles : Austria – Vienna International Airport
Airport Profiles : Bahrain – Bahrain International Airport
Airport Profiles : Bulgaria – Sofia Airport
Airport Profiles : Belgium – Brussels Airport
Airport Profiles : Canada – Airports of Canada
Airport Profiles : Canada – Ottawa International Airport
The Airport Commercial Sales Benchmarking Report 2

TABLE OF CONTENTS
Airport Profiles : Canada – Toronto Pearson International Airport
Airport Profiles : China – Beijing Capital International Airport
Airport Profiles : China – Guangzhou Baiyun International Airport
Airport Profiles : China – Shenzhen Bao’an International Airport
Airport Profiles : China – Shanghai Airports
Airport Profiles : Croatia – Dubrovnik Airport
Airport Profiles : Costa Rica – Airports of Costa Rica
Airport Profiles : Croatia – Franjo Tuđman Airport Zagreb
Airport Profiles : Czech Republic - Václav Havel Airport Prague
Airport Profiles : Denmark – Copenhagen Airport
Airport Profiles : Estonia – Tallinn Airport
Airport Profiles : Finland – Helsinki Airport
Airport Profiles : France – Paris Aéroport
Airport Profiles : France – Ajaccio Napoleon Bonaparte Airport
Airport Profiles : Germany – Düsseldorf Airport
Airport Profiles : Germany – Munich Airport
Airport Profiles : Germany – Frankfurt am main Airport
Airport Profiles : Greece – Airports of Greece
Airport Profiles : Chile – Arturo Benitez International Airport
Airport Profiles : Hong Kong – Hong Kong International Airport
Airport Profiles : Hungary - Budapest Ferenc Liszt International Airport
Airport Profiles : Iceland – Keflavik International Airport
The Airport Commercial Sales Benchmarking Report 3

TABLE OF CONTENTS
Airport Profiles : India – Chhatrapati Shivaji Maharaj International Airport
Airport Profiles : India – Cochin International Airport
Airport Profiles : India – Hyderabad International Airport
Airport Profiles : Indonesia – PT Angkasa Pura 1 Airports
Airport Profiles : India – Indira Gandhi International Airport
Airport Profiles : Indonesia – Soekarno Hatta International Airport
Airport Profiles : Iraq – Airports of Iraq
Airport Profiles : Ireland – Dublin Airport
Airport Profiles : Israel – Ben Gurion International Airport
Airport Profiles : Italy – Rome Ciampino International Airport
Airport Profiles : Italy – Rome Fiumicino International Airport
Airport Profiles : Jamaica – Sangster International Airport
Airport Profiles : Japan – Fukuoka Airport
Airport Profiles : Japan – Centrair Chubu International Airport
Airport Profiles : Japan – Kansai Airports
Airport Profiles : Japan – Narita International Airport
Airport Profiles : Japan – Tokyo International Airport (Haneda)
Airport Profiles : Lebanon – Beirut–Rafic Hariri International Airport
Airport Profiles : Lithuania – Vilnius International Airport
Airport Profiles : Macau – Macau International Airport
Airport Profiles : Malaysia – Kuala Lumpur International Airport
Airport Profiles : Malaysia – Langkawi International Airport
The Airport Commercial Sales Benchmarking Report 4
TABLE OF CONTENTS
Airport Profiles : Mauritius – Airports of Mauritius
Airport Profiles : Malaysia – Malaysia Airport Holdings Bhd
Airport Profiles : Morocco – Airports of Morocco
Airport Profiles : Norway – Oslo Airport
Airport Profiles : Panama – Tocumen International Airport
Airport Profiles : Peru – Jorge Chávez International Airport
Airport Profiles : Philippines – Clark International Airport
Airport Profiles : Philippines – Davao Airport
Airport Profiles : Philippines – Mactan-Cebu International Airport
Airport Profiles : Poland – Airports of Poland
Airport Profiles : Philippines – Manila International Airport
Airport Profiles : Portugal – Azores Airport
Airport Profiles : Maldives – Velana International Airport
Airport Profiles : Portugal – Madeira Airport
Airport Profiles : Portugal – Lisbon Airport
Airport Profiles : Romania – Bucharest Henri Coandă International Airport
Airport Profiles : Russia – Domodedovo Airport
Airport Profiles : Russia – Pulkovo Airport
Airport Profiles : Portugal – Faro Airport
Airport Profiles : Russia – Sheremetyevo Airport
Airport Profiles : The Netherlands – Amsterdam Airport Schiphol
Airport Profiles : Portugal – Porto Airport
The Airport Commercial Sales Benchmarking Report 5

TABLE OF CONTENTS
Airport Profiles : Singapore – Singapore Changi Airport
Airport Profiles : South Korea – Gimpo International Airport
Airport Profiles : South Korea – Gimhae International Airport
Airport Profiles : South Korea – Incheon International Airport
Airport Profiles : South Korea – Jeju International Airport
Airport Profiles : Spain – Aena
Airport Profiles : Spain – Barcelona El Prat International Airport
Airport Profiles : Sri Lanka - Bandaranaike International Airport
Airport Profiles : Sweden – Swedavia
Airport Profiles : Thailand – Suvarnabhumi International Airport
Airport Profiles : Saipan – Saipan International Airport
Airport Profiles : Russia – Vnukovo Airport
Airport Profiles : Turkey – Sabiha Gokcen International Airport
Airport Profiles : Turkey – Istanbul Ataturk International Airport
Airport Profiles : Uganda – Entebbe International Airport
Airport Profiles : United Arab Emirates – Abu Dhabi International Airport
Airport Profiles : United Arab Emirates – Dubai Airport
Airport Profiles : United Kingdom – Bristol Airport
Airport Profiles : Thailand – Hat Yai, Chiangmai and Phuket Airports-
Airport Profiles : United Kingdom – London Gatwick Airport
Airport Profiles : United Kingdom – London Heathrow Airport
Airport Profiles : United Kingdom – London Stansted Airport
The Airport Commercial Sales Benchmarking Report 6

TABLE OF CONTENTS
Airport Profiles : United Kingdom – Manchester Airport
Airport Profiles : United States – Boston Logan Airport
Airport Profiles : United States – Charlotte Douglas International Airport
Airport Profiles : United States – Dallas Fortworth International Airport
Airport Profiles : United States – Dallas Lovefield International Airport
Airport Profiles : United States – Honolulu International Airport
Airport Profiles : United States – Houston George Bush Intercontinental Airport
Airport Profiles : United States – Indianapolis International Airport
Airport Profiles : United States – JFK International Airport
Airport Profiles : United States – Minneapolis/St. Paul International Airport
Airport Profiles : United States – Los Angeles International Airport
Airport Profiles : United States – Oakland International Airport
Airport Profiles : United States – Ports of Poland
Airport Profiles : United States – Raleigh-Durham Airport
Airport Profiles : United States – Ronald Reagan Washington National Airport
Airport Profiles : United States – San Diego International Airport
Airport Profiles : United States – San Antonio International Airport
Airport Profiles : United States – San Francisco International Airport
Airport Profiles : United States – JFK International Airport (Terminal 7)
Airport Profiles : United States – San Jose International Airport
Airport Profiles : United States – Seattle Tacoma International Airport
Airport Profiles : United States – Denver Airport
The Airport Commercial Sales Benchmarking Report 7

TABLE OF CONTENTS
Airport Profiles : United States – Washington Metropolitan Airports
Airport Profiles : Vietnam – Tân Sơn Nhất International Airport
Airport Profiles : United States – Washington Dulles International Airport
Data Sources
The Airport Commercial Sales Benchmarking Report 8
About Airport Insights

INTRODUCTION
The Airport Commercial Sales Benchmarking Report assesses the revenue performance of retail (including duty-free and duty-paid) and food & beverage operations
at over 140 airports and airport groups in 60 countries around the world based on the benchmarking of specific key performance indicators like spend per passenger
and sales per sqm.
Our information on the commercial business at the various airports and airport groups was collected from various sources in the public domain including government
agencies, news articles, press releases, equity research reports, bond statements, annual reports and financial statements. .
The information presented in this report will be useful to airport concessionaires, airport operators, airport investors, consultants and other organizations which are
interested in the benchmarking of commercial operations at airports around the world.
The Airport Commercial Sales Benchmarking Report 9
<< Back to Table of Contents
DISCLAIMER
Information in this report has been obtained by desktop research. The information used as well as statements of fact made are not guarantees, warranties or
representations as to their completeness or accuracy.
Airport Insights assumes no liability for any short term or long terms decision made by any clients based on analysis included in our reports
When purchasing a market research report from Airport Insights, it is intended that the analysis services are meant for customers’ internal use only and not
for general publication or disclosure to third parties.
No part of the report or service may be resold, circulated, lent or disclosed to non-customers without written permission of Airport Insights.
Furthermore, no part may be reproduced, or transmitted in any form or by any means, electronic, photocopying, mechanical, recording or otherwise without
the permission of the publisher, i.e. Airport Insights.
The Airport Commercial Sales Benchmarking Report 10
<< Back to Table of Contents

METHODOLOGY AND
ASSUMPTIONS
The Airport Commercial Sales Benchmarking Report 11

METHODOLOGY AND ASSUMPTIONS
The Airport Commercial Sales Benchmarking Report assesses the performance of retail (including duty-free and duty-paid) and food & beverage at over 140
airports and airport groups around the world based on the benchmarking of specific key performance indicators like spend per passenger and sales per sqm.
.
Some information has been inferred and estimated based on available public data.
Where possible, data obtained externally has been cross-referenced with that available in our proprietary database to ensure the accuracy of data.
While we have endeavoured to present a reasonable level of consistency and accuracy in terms of our data benchmarking, readers should take note of the
varied sources of our information, as well as differences in accounting and language used by the source of information.
Most of the data obtained for our analysis would be for a specific full-year of operations at each airport between 2015 and 2019.
For the "duty-free" and "duty-free & duty-paid" classifications, we have largely taken turnover and space operated by the retailer(s) to represent duty-free (or
duty-free & duty-paid) turnover and space at the airport. In the majority of cases, the duty-free (or duty-free & duty-paid) retailer would be the sole operator
of the duty-free (or duty-free & duty-paid) business at the airport. Where there are dual or multiple of such retailers at airport, this is also indicated.
We have also taken note of restrictions on duty-free retailing at airports in countries belonging to the European Union (EU) where information on pure duty-
free sales is largely unavailable in the public domain. Therefore, in this report, our research for such airports covers the “duty-free & duty-paid” business.
The Airport Commercial Sales Benchmarking Report 12
<< Back to Table of Contents

METHODOLOGY AND ASSUMPTIONS
The sample size of this study is shown by category in the table below.
The Airport Commercial Sales Benchmarking Report 13
Category n=
Duty-Free 72
Duty-Free and Duty-Paid 35
Food & Beverage 36
Sample size by category
<< Back to Table of Contents

SUMMARY OF FINDINGS
The Airport Commercial Sales Benchmarking Report 14

DUTY-FREE
The Airport Commercial Sales Benchmarking Report 15

DUTY-FREE SALES
Region n= Duty-Free Turnover (U$) Intl’ Pax Spend Per Int’l Pax (US$)
East Asia 15 x x x
Southeast Asia 12 x x x
South Asia 6 x x x
Oceania 5 x x x
Non-EU Europe 4 x x x
Middle East 6 x x x
Russia CIS 4 x x x
Latin America 5 x x x
North America 12 x x x
Africa 3 x x x
Duty-Free Spend Per International Passenger
The regions with the highest average duty-free spend per international passenger at the airports would be East Asia (US$XX.XX) and the Middle East ($XX.XX)
while North America is the region with the lowest average duty-free spend per international passenger.
A large domestic travel market in the United States as well as a focus on other commercial categories such as food & beverage would account for the low duty-free
spend per international passenger at North American airports.
Average duty-free spend per international passenger at airports/airport groups by region (2015-2019)
The Airport Commercial Sales Benchmarking Report 16
<< Back to Table of Contents

DUTY-FREE & DUTY-PAID
The Airport Commercial Sales Benchmarking Report 17

FOOD & BEVERAGE
The Airport Commercial Sales Benchmarking Report 18
FOOD & BEVERAGE SALES
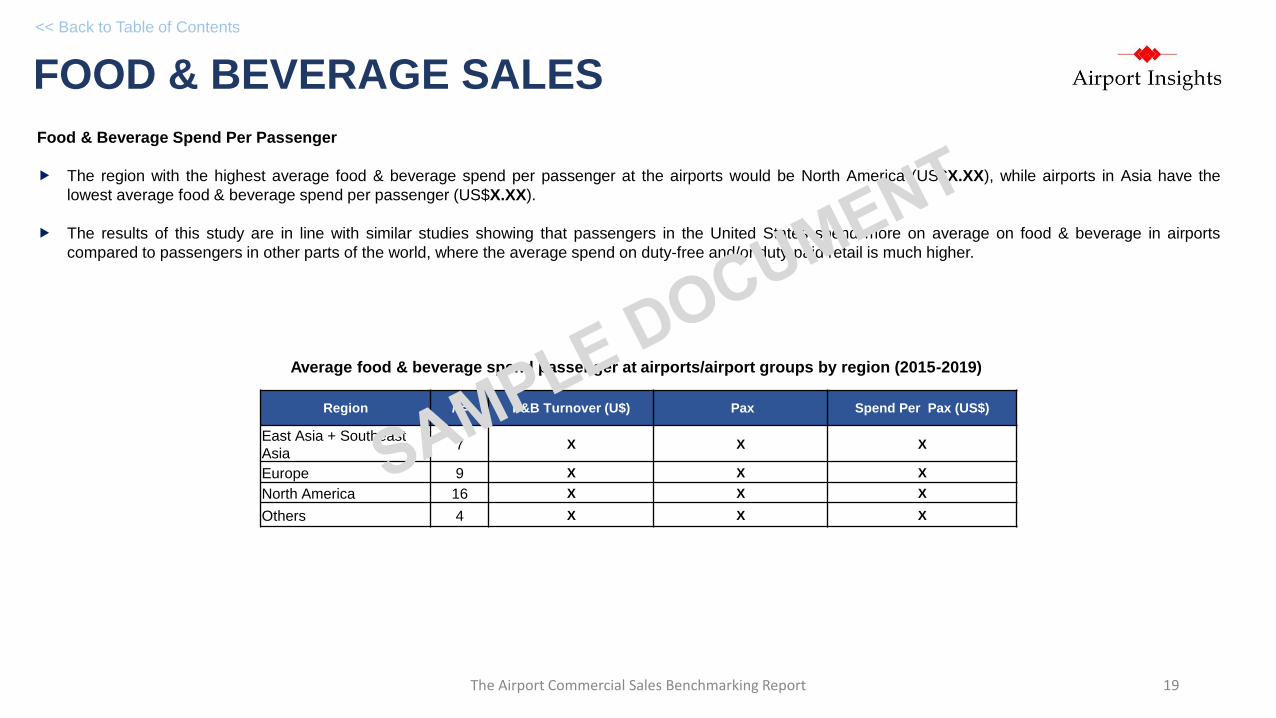
Region n= F&B Turnover (U$) Pax Spend Per Pax (US$)
East Asia + Southeast
Asia7 X X X
Europe 9 X X X
North America 16 X X X
Others 4 X X X
Food & Beverage Spend Per Passenger
The region with the highest average food & beverage spend per passenger at the airports would be North America (US$X.XX), while airports in Asia have the
lowest average food & beverage spend per passenger (US$X.XX).
The results of this study are in line with similar studies showing that passengers in the United States spend more on average on food & beverage in airports
compared to passengers in other parts of the world, where the average spend on duty-free and/or duty-paid retail is much higher.
Average food & beverage spend passenger at airports/airport groups by region (2015-2019)
The Airport Commercial Sales Benchmarking Report 19
<< Back to Table of Contents

SUMMARY TABLES
The Airport Commercial Sales Benchmarking Report 20

DUTY-FREE
The Airport Commercial Sales Benchmarking Report 21

Country/Territory Airport/Airports Year Key Operator(s)Sales per International
Passenger (US$)
China Beijing Capital International Airport Year Ending Dec 2019 CDF-Sunrise Duty Free X
China Shanghai Airports (Pudong + Hongqiao) Year Ending Dec 2019 CDF- Sunrise Duty Free X
Norway Oslo Airport Year Ending Dec 2017 Travel Retail Norway (Gebr Heinemann subsidiary) X
Japan Centrair Chubu International Airport Year Ending March 2019 Centrair Duty Free X
South Korea Incheon International Airport Year Ending Dec 2019 Lotte Duty Free/Shilla Duty Free/Shinsagae X
South Korea Gimpo International Airport Year Ending Dec 2018 Lotte Duty Free/Shilla Duty Free X
Lebanon Beirut–Rafic Hariri International Airport Year Ending Dec 2016 Phoenicia Aer Rianta Company X
Macau Macau International Airport Year Ending Dec 2017 King Power (HK) X
Japan Tokyo International Airport (Haneda) Year Ending March 2019 Tokyo International Air Terminal Corporation X
Japan Kansai Airports Year Ending March 2019 KIX Duty Free/ANA/Lotte X
Dubai Dubai Airport Year Ending Dec 2019 Dubai Duty Free X
Japan Fukuoka Airport Year Ending March 2019 Fukuoka Airport Building Company X
MauritiusSir Seewoosagur Ramgoolam International Airport /
Sir Gaëtan Duval AirportYear Ending Dec 2017 Mauritius Duty Free Paradise X
Japan Narita International Airport Year Ending March 2019 Narita Airport Retail/JAL/ANA X
Israel Ben Gurion International Airport Year Ending Dec 2018 Gebr Heinemann X
Australia Sydney Airport Year Ending Dec 2018 Gebr Heinemann X
Saipan Saipan Airport Year Ending Sept 2018 DFS Saipan Ltd X
Australia Australian Airports - Perth, Brisbane, Cairns, Darwin Year Ending June 2016 James Richardson X
South Korea Gimhae International Airport Year Ending Dec 2016 Dufry Thomas Julie Korea X
Iceland Keflavik International Airport Year Ending Dec 2019 Duty Free Stores (owned by Isavia) X
China Guangzhou Baiyun International Airport Year Ending Dec 2019 China Duty Free X
Singapore Singapore Changi Airport Year Ending Dec 2018 DFS/ The Shilla Duty Free X
Airports by Duty-Free Spend Per Int’l Pax
The Airport Commercial Sales Benchmarking Report 22
<< Back to Table of Contents

DUTY-FREE & DUTY-PAID
The Airport Commercial Sales Benchmarking Report 23

Country/Territory Airport/Airports Year Key Operator(s) Sales per Passenger (US$)
Italy Rome Fumicino International Airport Year Ending Dec 2019 LS Travel Retail and others X
Belgium Brussels Airport Year Ending Dec 2018 International Duty Free X
France Paris Orly and CDG Airports Year Ending Dec 2018 Société de Distribution Aeroportuaire ;Relay@ADP X
Netherlands Amsterdam Airport Schiphol - Airside Retail Year Ending Dec 2018 Schiphol Airport Retail, Kappe International and others X
United Kingdom London Heathrow Airport Year Ending Dec 2016 World Duty Free (Dufry) X
Croatia Dubrovnik Airport Year Ending Dec 2018 Dubrovnik Duty Free X
Romania Bucharest Henri Coandă International Airport Year Ending Dec 2018 Millenium Pro Design SRL X
Denmark Copenhagen Airport Year Ending Dec 2017 Gebr Heinemann X
Portugal Faro Airport Jan-Sept 2017 Lojas Francas de Portugal (Vinci Airports Subsidiary) X
Lithuania Vilnius International Airport Year Ending Dec 2019 Travel Retail Vilnius X
Portugal Lisbon Airport Jan-Sept 2017 Lojas Francas de Portugal (Vinci Airports Subsidiary) X
Hungary Budapest Ferenc Liszt International Airport Year Ending Dec 2015 Hungarian Duty Free (Gebr Heinemann subsidiary) X
Bulgaria Sofia Airport Year Ending Dec 2016 Sofia Airport EAD X
Sweden Swedavia-Operated Airports Year Ending Dec 2017 Nuance Group (Sweden) AB X
United Kingdom London Gatwick Airport Year Ending Dec 2016 World Duty Free (Dufry) X
Germany Munich Airport Year Ending Dec 2015 Eurotrade X
Airports by Duty-Free & Duty-Paid Spend Per Pax
The Airport Commercial Sales Benchmarking Report 24
<< Back to Table of Contents

FOOD & BEVERAGE
The Airport Commercial Sales Benchmarking Report 25
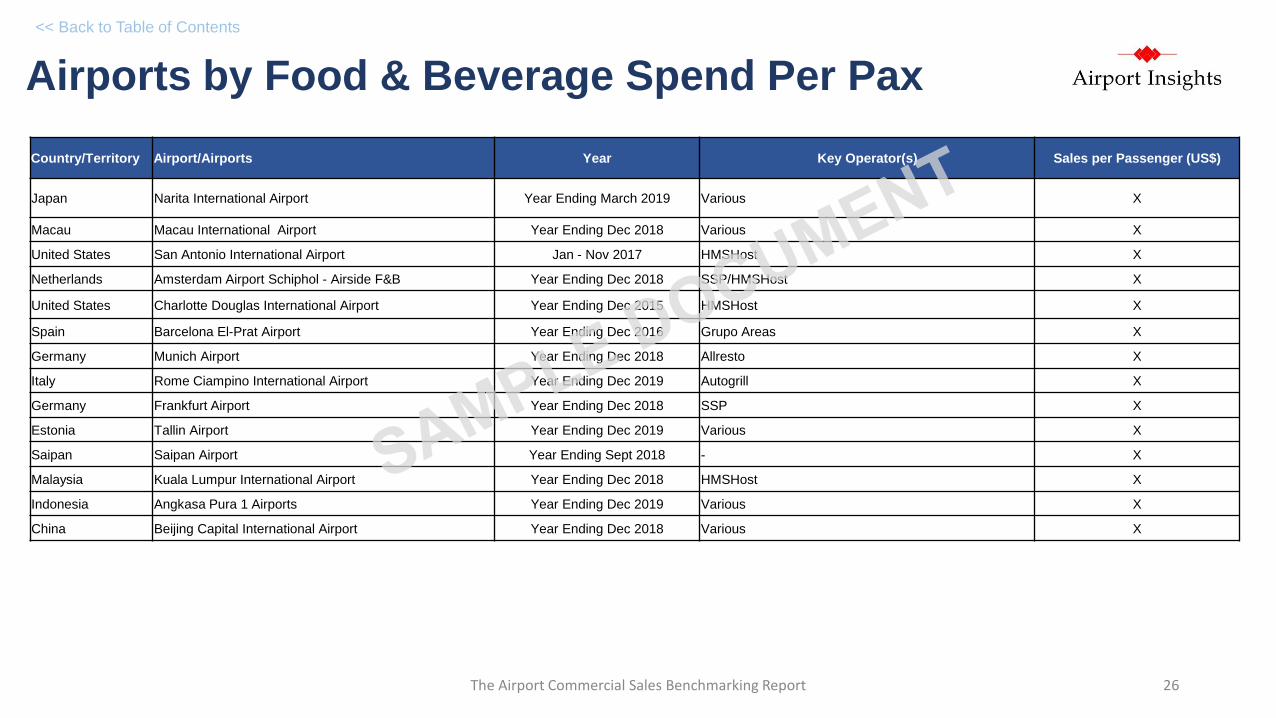
Country/Territory Airport/Airports Year Key Operator(s) Sales per Passenger (US$)
Japan Narita International Airport Year Ending March 2019 Various X
Macau Macau International Airport Year Ending Dec 2018 Various X
United States San Antonio International Airport Jan - Nov 2017 HMSHost X
Netherlands Amsterdam Airport Schiphol - Airside F&B Year Ending Dec 2018 SSP/HMSHost X
United States Charlotte Douglas International Airport Year Ending Dec 2015 HMSHost X
Spain Barcelona El-Prat Airport Year Ending Dec 2016 Grupo Areas X
Germany Munich Airport Year Ending Dec 2018 Allresto X
Italy Rome Ciampino International Airport Year Ending Dec 2019 Autogrill X
Germany Frankfurt Airport Year Ending Dec 2018 SSP X
Estonia Tallin Airport Year Ending Dec 2019 Various X
Saipan Saipan Airport Year Ending Sept 2018 - X
Malaysia Kuala Lumpur International Airport Year Ending Dec 2018 HMSHost X
Indonesia Angkasa Pura 1 Airports Year Ending Dec 2019 Various X
China Beijing Capital International Airport Year Ending Dec 2018 Various X
Airports by Food & Beverage Spend Per Pax
The Airport Commercial Sales Benchmarking Report 26
<< Back to Table of Contents

AIRPORT PROFILES
The Airport Commercial Sales Benchmarking Report 27

ARGENTINAARGENTINA
The Airport Commercial Sales Benchmarking Report 28

Aeropuertos Argentina 2000
Category
Year
Key Operator(s)
Turnover (ARS Mil)
Turnover (US$ Mil)
Total Pax Traffic (Mil)
Total Intl Pax Traffic (Mil)
Duty-Free
Year Ending Dec 2017
Interbaires
4,257
221.36
76.6
N.A
Duty-Free Spend Per
International Pax (US$)
US$8.23
26.9
Space (Sqm)
Operator of 35 airports in Argentina
The Airport Commercial Sales Benchmarking Report 29
<< Back to Table of Contents

SOURCES
The Airport Commercial Sales Benchmarking Report 30

SOURCES
ARGENTINA
Ranking of Top 1000 Companies in Argentina by Prensa Económica
AUSTRALIA
Corporación América Airports S.A Press Release via NYSE
Sydney Airport Release on 2018 traffic performance
"Introducing ‘The Analyst’: Australia bucks retailer consolidation trend", The Moodie Davitt Report, 8 June 2016
"Sydney Airport reports 12.7% retail revenue rise last year", TRBusiness, 21 Feb 2018
The Bureau of Infrastructure and Transport Research Economics
"Growth mindset: Gebr Heinemann reveals 2018 turnover of €4.6bn", DFNI, 16 April 2019
AUSTRIAFlughafen Wien Press Release on 22 Jan 2019
"Die T0P-200-Unternehmen aus Niederösterreich", Meta Communication International
BAHRAINKingdom of Bahrain Ministry of Transport and Telecommunications
Bahrain Duty Free Annual Report
The Airport Commercial Sales Benchmarking Report 31
BELGIUM"At 60, Brussels Airport turned in an excellent performance in 2018 with 25.7 million passengers and 732,000 tonnes of cargo", Brussels Airport Company
Press Release, 11 Jan 2019
<< Back to Table of Contents

About Airport Insights
Airport Insights (www.airportinsights.com) is a provider of market research, competitive intelligence and consulting services to the airport world, focusing on
Market, Financial & Competitive Intelligence for the airport and airport-related sectors
Airport Commercial Revenues and Space Benchmarking
Airport Commercial Space Planning
Airport Commercial Revenues Due Diligence
We also provide free-of-charge very useful information on the airport industry at www.airportprofiles.com
For more information about the services that we can provide, please contact us at
The Airport Commercial Sales Benchmarking Report 32
"65 83059423