the air quality impact of super storm sandy and the ... · sandy and the mitigation strategies that...
TRANSCRIPT

NYS Department of Environmental Conservation
The Air Quality Impact of Super Storm Sandy and the Mitigation Strategies
That Could Have Helped
Session A: Air Quality & Health Effects
Dirk Felton, RS III, P.E. Division of Air Resources Bureau of Air Quality Surveillance NYSERDA EMEP Conference Albany, NY November 6-7, 2013

Existing Network Monitoring Data • The Regional PM-2.5 network saw a slight
increase in site to site variability after Sandy – Normal between site range 2 - 6 µg/m3 – Post Sandy between site range 3 - 10 µg/m3
0
5
10
15
20
25
30
ug/m
3
Variation in Regional PM-2.5 The 24-Hr PM-2.5 averages did not exceed the Moderate AQI Category or the Daily NAAQS

NYS Department of Environmental Conservation
Air Quality Concerns • Concentrations of Air Pollutants are low during
hurricanes • Cleanup and Demolition Activities create
enormous quantities of fugitive dust – Increase in road dust: on and off road mobile
sources (Loaders, dump trucks) • Woody Debris Incineration: Floyd Bennett Field • Emissions from Emergency Generators and other
building support equipment – Necessary for business operation and
rehabilitation of flooded areas in lower Manhattan
Sandy Related Air Monitoring Objectives • Why: Data needed to evaluate air quality in
hardest hit neighborhoods • Data needed to address public concerns • Data needed to determine if existing network is adequate • Data must be accurate and not add to confusion
• When: To be useful, data must be available to the public within hours or at least daily via the NYSDEC, NYSDOH and NYCDOH Website • Data must be reviewed before release
• Where: Data must be representative of neighborhood scale air quality

NYS Department of Environmental Conservation
Network Design: Non-Routine Monitoring
• Which pollutant? • What method? • Where do we put monitors? • What is the representativeness of the data? • What is the background? • What do we compare the data to? • Where and how do we display data? • What is the appropriate message for the public? • When do we stop monitoring?

Website Map from Sandy Response
Floyd Bennett Field Air Curtain Incinerator

Website Map from Sandy Response
Floyd Bennett Field Air Curtain Incinerator
One site was moved after deployment because it was too close to sand sifting operations

Fugitive Dust: This Rockaway site was installed at the last operational light pole
heading east in Belle Harbor
• The EPA ERT provided samplers used for the Gulf Oil spill and for forest fires
• These samplers are not suited to high and variable humidity

NYS Department of Environmental Conservation
Fugitive Dust: High and Erratic Data
• Staff at the site said: “you could feel the sand and dust falling”
-50
0
50
100
150
200
250
300
35012
/5/1
2 15
:30
12/5
/12
19:1
512
/5/1
2 23
:00
12/6
/12
2:45
12/6
/12
6:30
12/6
/12
10:1
512
/6/1
2 14
:00
12/6
/12
17:4
512
/6/1
2 21
:30
12/7
/12
1:15
12/7
/12
5:00
12/7
/12
8:45
12/7
/12
12:3
012
/7/1
2 16
:15
12/7
/12
20:0
012
/7/1
2 23
:45
12/8
/12
3:30
12/8
/12
7:15
12/8
/12
11:0
012
/8/1
2 14
:45
12/8
/12
18:3
012
/8/1
2 22
:15
12/9
/12
2:00
12/9
/12
5:45
12/9
/12
9:30
12/9
/12
13:1
512
/9/1
2 17
:00
12/9
/12
20:4
512
/10/
12 0
:30
12/1
0/12
4:1
512
/10/
12 8
:00
ug/m
3
December 5 - 10, 2012 PM-2.5 (1-Hr EBAM)
Rockaway
Gerritsen
Mill Basin

Fugitive Dust: Sand collection and Sifting

NYS Department of Environmental Conservation
Fugitive Dust: Neighborhood Scale Sites
• We moved the site 9 blocks to the east in a Rockaway Neighborhood
• We replaced the EPA ERT samplers with TEOMs that can handle high humidity

NYS Department of Environmental Conservation
Fugitive Dust: Mitigation Strategy
• Target dust control measures – Assign street sweepers to impacted areas – Wet roads that are in use for debris handling – Wet or cover loose material piles
• Locate material handling and storage areas away from residential areas
• Provide relief if possible to residents that are unavoidably impacted by emergency response

Woody Debris Incineration: Air Curtain Incinerators at Floyd Bennett Field
• The public was concerned that the incineration of woody debris would negatively impact air quality

NYS Department of Environmental Conservation
Clean Woody Debris: 200,000 cu/yds
NYS Department of Environmental Conservation
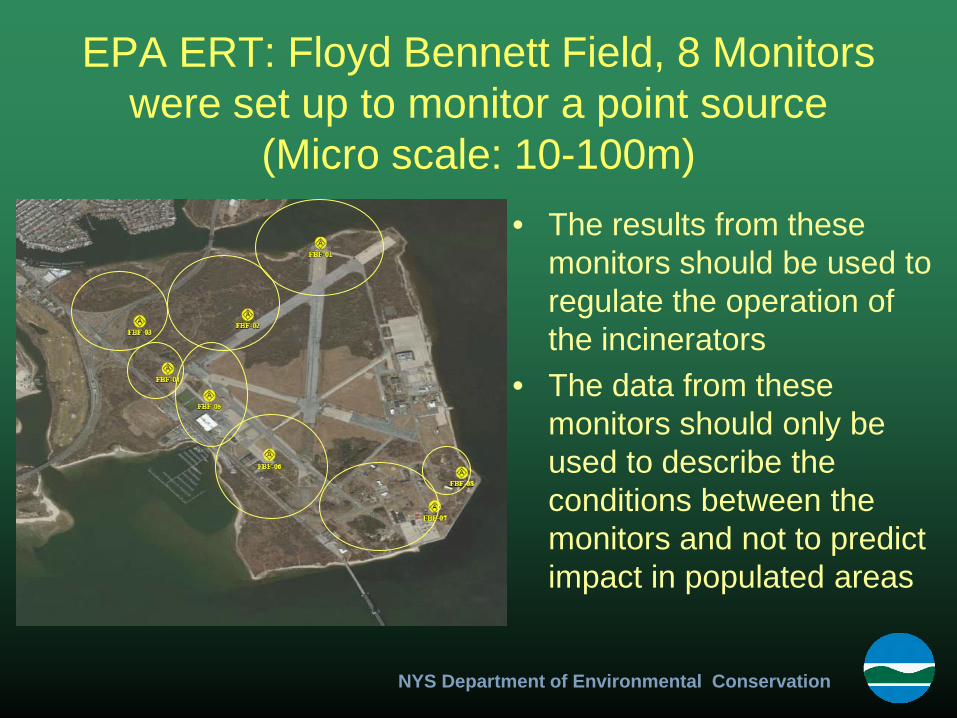
EPA ERT: Floyd Bennett Field, 8 Monitors were set up to monitor a point source
(Micro scale: 10-100m) • The results from these
monitors should be used to regulate the operation of the incinerators
• The data from these monitors should only be used to describe the conditions between the monitors and not to predict impact in populated areas

NYS Department of Environmental Conservation
The EPA ERT Monitors did not Perform Adequately in this Deployment
• The EPA website presented 24-Hr average results from the FBF monitors.
•
• The 1-Hr data (not public) indicated a RH filter artifact and most of the data should have been invalidated Black Line is 1-Hr PM-2.5
Purple Line is Ambient RH Red Line is Filter RH

41.2 39.4 39.4 37.2 36.5 41.6 34.9 33.7
January 9th
The Regional PM-2.5 ranged from 22 – 38 ug/m3
Suspect data included in report Regional Background not considered
NYS Department of Environmental Conservation
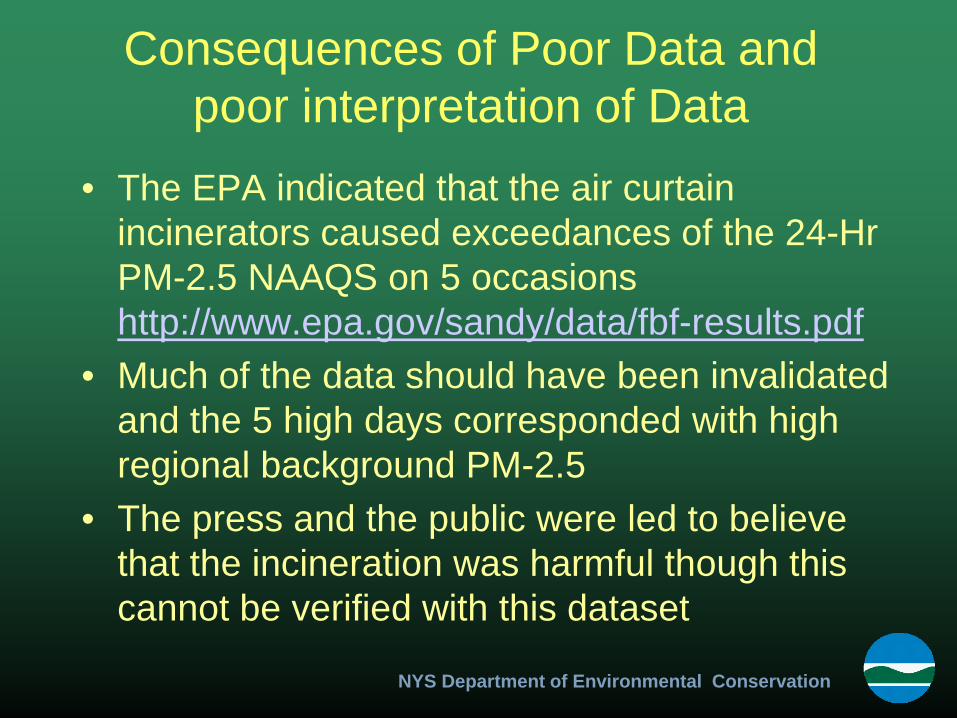
Consequences of Poor Data and poor interpretation of Data
• The EPA indicated that the air curtain incinerators caused exceedances of the 24-Hr PM-2.5 NAAQS on 5 occasions http://www.epa.gov/sandy/data/fbf-results.pdf
• Much of the data should have been invalidated and the 5 high days corresponded with high regional background PM-2.5
• The press and the public were led to believe that the incineration was harmful though this cannot be verified with this dataset
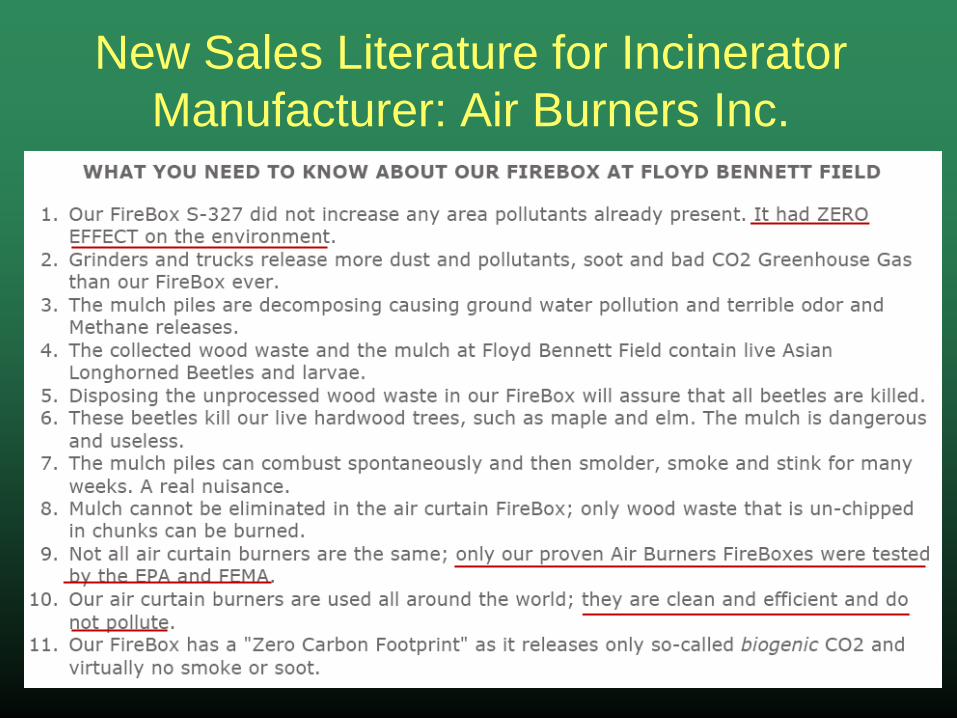
New Sales Literature for Incinerator Manufacturer: Air Burners Inc.

NYS Department of Environmental Conservation
Incineration: Mitigation Lessons Learned
• The monitoring data was not adequate to determine actual impact of air curtain incinerators
• The modeling results indicated that there was a near field impact but a negligible impact on off-site populated areas
• Lessons learned – Data must be Quality Assured – Data interpretation must account for background – Source characterization is complex, it requires
controlled conditions and a valid experimental design

NYS Department of Environmental Conservation
Lower Manhattan: Most of the Dots Represent Temporary Diesel Powered Equipment:
Generators, Boilers, Pumps and Dehumidifiers
Courtesy of LMCCC

NYS Department of Environmental Conservation

NYS Department of Environmental Conservation
Large Emergency Generators
• Trailer mounted, primarily diesel powered • Emissions Regulated by EPA non-road Tier
Rules based on Year of manufacture • Output from <1 MW up to 2.5 MW Engines from 1400 Hp and larger Fuel consumption 70 gph and up Emission points 3 - 4m from the ground • Provide power during emergencies, during
grid maintenance, for fairs and other planned activities

NYS Department of Environmental Conservation
Sandy Air Monitor in Manhattan Site established to address impact of emissions from temporary generators and building support equipment
• Water St between John St and Fletcher
• Public complained of soot and diesel odors
• This site would have recorded an exceedance if the generators remained

NYS Department of Environmental Conservation
Sandy NYSDEC Public Data Presentation

NYS Department of Environmental Conservation
Health Messaging for NYSDEC Sandy
Data
Sandy Data was directly compared
to Regional Average
(Background)

NYS Department of Environmental Conservation
Emergency Generator: Mitigation • Mobile source if not stationary for 1-Yr
– EPA no time limit for emergency use – DEC <500 hrs considered emergency use – DEC <30 days considered temporary – Mobile rules do not consider NAAQS
• Rules developed prior to 1-Hr NO2 NAAQS • Potential mitigation strategies: minimum in-
use emission tier, setback, stack height, installation density, fuel switching

NYS Department of Environmental Conservation
Public Messaging During an Emergency
• Notify public if air quality is poor – Clearly delineate area where poor air quality exists or
is expected to exist – Predict how long poor air quality will persist – Suggest protective measures for severely impacted
areas (masks, stay indoors, avoid area) • Explain that air quality during an emergency may
be impacted and unhealthy in affected areas – Control measures are being used but they cannot
completely mitigate temporary sources – Sources that contribute to poor air quality will diminish
once the emergency is over


NYS Department of Environmental Conservation
Portable Generators and Building Support Equipment
Status Date 12-Nov-12 12-Dec-12 25-Jan-13 25-Feb-13
Assessment
#1 Assessment
#2 Assessment
#3 Assessment
#4
Dehumidifiers 59 75 2 0
Generators 136 109 52 29
Containers 51 51 17 3
Trailers 15 29 12 8
Boilers 10 18 9 9
Pumps 13 8 0 0
Vac. Trucks 7 1 0 0
Oil Tanks 3 7 5 2
Frac. Tanks 8 3 0 0
Chillers 0 0 4 3
Total 302 301 101 54
Courtesy of LMCCC

Representativeness of Water St Monitor
Central Lower Manhattan Monitor operated by LMCCC

Modeled impact of 3 Air Curtain
Incinerators
Offsite impact was estimated to be
minimal
Operation was to be curtailed if
stagnant conditions were
forecast

January 9th
EPA ERT FBF Data