the agile success model: a mixed methods study of a large
TRANSCRIPT
111
The Agile Success Model: A Mixed Methods Study of aLarge-Scale Agile Transformation
DANIEL RUSSO, Aalborg University
Organizations are increasingly adopting Agile frameworks for their internal software development. Costreduction, rapid deployment, requirements and mental model alignment are typical reasons for an Agiletransformation. This paper presents an in-depth field study of a large-scale Agile transformation in a mission-critical environment, where stakeholders’ commitment was a critical success factor. The goal of such atransformation was to implement mission-oriented features, reducing costs and time to operate in criticalscenarios. The project lasted several years and involved over 40 professionals. We report how a hierarchical andplan-driven organization exploited Agile methods to develop a Command & Control (C2) system. Accordingly,we first abstract our experience, inducing a success model of general use for other comparable organizationsby performing a post-mortem study. The goal of the inductive research process was to identify critical successfactors and their relations. Finally, we validated and generalized our model through Partial Least Squares -Structural Equation Modelling, surveying 200 software engineers involved in similar projects. We concludethe paper with data-driven recommendations concerning the management of Agile projects.
CCS Concepts: • Social and professional topics→ Project and people management; Software manage-ment; Sustainability; • Software and its engineering→ Agile software development.
Additional Key Words and Phrases: Agile, Ethnography, Grounded Theory, Multivariate Analysis, StructuralEquation Modeling, Partial Least Squares, Mixed Methods Research
ACM Reference Format:Daniel Russo. 2021. The Agile Success Model: A Mixed Methods Study of a Large-Scale Agile Transformation.ACM Trans. Softw. Eng. Methodol. 37, 4, Article 111 (August 2021), 45 pages. https://doi.org/10.1145/1122445.1122456
1 INTRODUCTIONIt is increasingly common to observe software-intensive organizations shift from a plan-baseddevelopment process to an Agile one to improve efficiency and quality [67], shorten time-to-market,and enhance customer focus [89]. However, organizations might face plenty of external drivers toshift their software development paradigms, such as cost or risk reduction, or enhance productivityand team morale [132]. Most of these motivations are also shared by mission-critical organizations,which deploy software on critical systems that can not fail [72].
Although an increasing number of organizations are undergoing an Agile transformation [55],it has been poorly reported with sufficient academic rigor. As a literature review recently high-lighted, the vast majority of the relevant material (90%) about large-scale transformations are notpeer-reviewed experience or industry reports and do not directly focus on the transformationprocess [22]. Generally speaking, there is the awareness of our scholarly community that more
Author’s address: Daniel Russo, [email protected], Aalborg University, Department of Computer Science, SelmaLagerlofs Vej 300, Aalborg East, 9220, Denmark.
Permission to make digital or hard copies of all or part of this work for personal or classroom use is granted without feeprovided that copies are not made or distributed for profit or commercial advantage and that copies bear this notice and thefull citation on the first page. Copyrights for components of this work owned by others than the author(s) must be honored.Abstracting with credit is permitted. To copy otherwise, or republish, to post on servers or to redistribute to lists, requiresprior specific permission and/or a fee. Request permissions from [email protected].© 2021 Copyright held by the owner/author(s). Publication rights licensed to ACM.1049-331X/2021/8-ART111 $15.00https://doi.org/10.1145/1122445.1122456
ACM Trans. Softw. Eng. Methodol., Vol. 37, No. 4, Article 111. Publication date: August 2021.
111:2 D. Russo
academic primary studies on large-scale Agile transformation are needed to understand such awidespread phenomenon better [51]. Some scholars addressed this call by providing case studiesof large software companies, such as Erickson [84] or financial corporations [96]. However, noneof the previous research focused on mission-critical software components. Moreover, from anepistemic perspective, those papers are only carried out in natural research settings (they arecase studies), which is an excellent approach to provide theoretical understandings of a realisticphenomenon [121]. Nonetheless, researchers did not use so far neutral research settings (i.e., samplestudies) to investigate the phenomenon, with the specific purpose of generalizing the findings.Therefore, the aim of this paper is twofold. First, it addresses the call by Dikert et al. to provide moreextensive scholarly knowledge about large-scale Agile transformation phenomena by proposing atheory. Furthermore, through a sample study, it validates the induced theory by generalizing theproposed theoretical model.Through a post-mortem investigation, this article reports a large-scale Agile transformation
within a governmental agency (from now on addressed as Agency), which lasted three years andinvolved several stakeholders from most of the Agency’s departments in addition to the coredevelopment teams. The scope of the project was to develop an advanced Command & ControlSystem. Through a Mixed-Methods approach, we performed a field study to gather and organizedata into critical success factors which relate to the others. Thereafter, we surveyed a screenedsample of 190 software engineers who have participated in large-scale Agile projects to generalizethe model through Partial Least Squares Structural Equation Modelling. This paper makes thefollowing contributions:
• we report about a significant industrial project regarding the development of a real-worldmission-critical software;
• we induce a research model that describes the critical success factors faced along a large-scaleAgile transformation process;
• we validated the model rigorously using Partial Least Squares Structural Equation Modelling.
This article is organized as follows. In Section 2 we present the related literature. Then, wedescribe our research methodology in Section 3. In Section 4, we discuss our field study, while inSection 5, we validate our inducted model using a sample study of 190 software engineers whoworked on large-scale Agile projects. The analysis of our findings with the study limitations is inSection 6. Finally, Section 7 outlines future works and our conclusions.
2 RELATEDWORKAgile software development has a relatively recent history in software engineering. Since 2001, whena group of professionals wrote the Agile Manifesto, the intention is to focus on team interaction,working software, customers’ needs, and readiness to change [50]. Agile is in open contrast toplan-driven methodologies, such as Waterfall, a linear process consisting of sequential developmentphases [58].Since then, several software organizations ‘transformed’ their plan-driven approaches to Agile
ones. In other words, they modified their production ‘strategy’ to improve software quality andproductivity [1]. Strategy is a “sustained pattern of resource allocation” [74], as such organizationshave to choose in which direction to invest with a long-term commitment. Defining an organiza-tion’s strategy is a complex process, which typically involves all relevant stakeholders because anystrategic decision taken will have long-standing effects on a business [94]. Nevertheless, strategiesare not set in stone and are changed if the benefits of a transformation exceed the strategy revisionshortcomings. After each business transformation, a new ‘sustained pattern’ is established (i.e., Ag-ile), and adequate ‘resource allocations’ are put in place to enforce the new production paradigm to
ACM Trans. Softw. Eng. Methodol., Vol. 37, No. 4, Article 111. Publication date: August 2021.
The Agile Success Model: A Mixed Methods Study of a Large-Scale Agile Transformation 111:3
gain from the more efficient method chosen. Therefore, with ‘Agile transformation,’ we understandthe establishment of the Agile software development paradigm with a long-term commitment andthe adequate resources to transition from a former plan-driven development effectively.
Although Agile has been increasingly adopted as a development methodology [55], it has beencriticized by literature, suggesting that it might increase project failure [9]. Among the mostcontingent criticalities of large-scale transformations, size plays an important role. Originally, Agilehas been proposed for self-contained teams working in small projects, and scaling the numberof teams for large projects has proven quite problematic [23]. There are several explanations forthis phenomenon. Organizational routines are deeply rooted in people’s minds, and change takestime [80]. Changing the organizational culture is one of the most difficult challenges for an Agiletransformation [75]. Furthermore, it is more difficult to manage change throughout the wholeorganization compared to just one team, which might lead to organizational inertia and slowingdown the transformation process [67]. In this regard, the process integration of Agile with pre-existing organizational structures is a concrete challenge [10]. Working in large organizations,dealing with several stakeholders, and coordinating with many teams is a definite challenge whereAgile methods initially did not provide a clear answer. For example, the Agile Manifesto does notreference how to interact with other teams; it focuses only on the team’s practices.Therefore, ad hoc Agile methods have to be adopted, with the risk to reduce agility because of
the increase of formal communication [66]. Examples of such methods are SAFe – the Scaled AgileFramework [62], DAD – Disciplined Agile Delivery [4], and LeSS – Large-Scale Scrum [60]. Inaddition to these frameworks, a wide variety of tailor-made Agile methods exist to address specificcompany software development characteristics (such as security and quality assurance) [11, 72].Agile transformations typically involve more departments of an organization; each of those hasits routines [80]; therefore, transformations are effective if they are tailored to specific companyneeds [16].
During the Agile transformation, we experienced many challenges also reported in the literature.Departments management (the Product Owners, or PO) needed to be educated to move fromsequential model development into a feature-centric iterative one [81]. User Stories have replacedextensive and comprehensive upfront requirements documentation, changing the mindset about thesystem’s planning [16, 75]. Boehm and Turner correctly mentioned that short-term requirementsplanning for long and large-scale projects also require new contracting practices, such it was inour case [10].Literature also provides the motivations of organizations to take up an Agile transformation.
Reducing the time-to-market through frequent deliveries is an often-cited reason [33, 71], especiallyto be ahead of competitors [43, 120]. Project management-related concerns are also commonmotivators [30]. Up-front planning of large projects in an ever faster changing environment is agreat challenge, especially when it comes to meet new goals and redirect the project’s goals [13].Thus, a more flexible approach, such as a stage-gate model, enforces microplanning, and day-to-day work control and progress reporting, are strong competitive enablers for software-intensiveorganizations [56]. Moreover, Agile champions a more focused documentation production [95, 114],and removes whatever does not add value for the customer [118]. Simultaneously, it optimizestesting, especially in large-scale projects, since it redefines a software tester’s role in a more effectiveway [127].
Dikert et al. also provided a catalog of large-scale Agile transformation success factors andchallenges from a systematic literature review [22]. The most critical success factors identified fromprevious literature are coaching management support and the Agile method’s customization. On theother hand, the frequent challenges are lack of guidance, misunderstanding of Agile practices, andreverting to previous working routines. However, it is worth mentioning that the studies analyzed
ACM Trans. Softw. Eng. Methodol., Vol. 37, No. 4, Article 111. Publication date: August 2021.
111:4 D. Russo
by Dikert et al. for the review did not directly focus on the process; they typically highlightedspecific aspects. Thus, such success factors and challenges are observed in isolation rather thanalong a whole transformation process.
3 RESEARCH DESIGNFor this study, we commit to a pragmatic ontological perspective [32]. We investigate the researchproblem with concurrent research strategies, using a Mixed Methods approach for this goal [20]. Inthis way, it is possible to exploit one method’s advantages while mitigating its weaknesses throughanother concurrent method. We deemed our approach as the most suited methodological fit forour research problem [24]. Although the use of Mixed Methods might be an expensive researchpractice (because it is the synthesis of two independent investigations), it provides comprehensiveinsights into a research problem. To report the findings of our work, we used the ACM SIGSOFTEmpirical Standards [99].
Our effort is to provide a theory-driven understanding [46] of large-scale Agile transformationprocesses. Theory-building implies the development of empirical indicators and the subsequentempirical testing of research hypotheses [134]. We used a single case study approach, which is theappropriate practice when the case is rare [136].
We employed an inductive research approach for the first step, assuming real-world phenomenaas socially constructed [90] within a natural setting (i.e., the Agency). Theory building of the fieldstudies relies on the replication logic [26], which means that each experience serves as a differentexperiment that stands on its own as an analytic unit, inducing theory through observations ordata [27]. Informants are “knowledgeable agents” [36] since they “construct” the phenomenon(i.e., in our case, the large Agile scale transformation process), and as such, they are part of boththe “problem” and the “solution”. Results of such inquiries emerge after a substantial amount ofobservations and an extensive analysis period (over three years in our case) since the researcheraims to be sure that nothing other has been left out or misinterpret, thereby reaching theoreticalsaturation [38] i.e., the point up to that new data do not provide any significant contribution to theunderstanding of the phenomenon. In Section 4.4, we explain the qualitative analysis process ingreater detail.In the second step, we used a neutral research setting [121] to validate qualitative results and
make generalizable claims, using Structural Equation Modeling (SEM). During this research stage,the researcher is detached from the observed constructs and analyzes them through statistical means.The perspective of the inquiry is objective, and hypotheses are empirically validated. Therefore,these research findings are generalizable and independent from time and context [78]. In Section5.1, we described the details of our SEM analysis.We acknowledge to be epistemologically biased, as human beings and as researchers, and that
this bias remains typically hidden or implicit [119]; thus, empirical procedures are valuable aims tomitigate such researcher’s biases [92]. To this end, we commit to the MixedMethods epistemologicalparadigm in order to address the following research questions:
• RQ1:Which are themost compelling success factors of a large-scale Agile Software transformationprocess?
• RQ2: How do those success factors relate to each other?
4 FIELD STUDY OF LARGE-SCALE AGILE TRANSFORMATION4.1 ContextIn 2013 the Agency started to rethink its Waterfall-like development approach for its Command& Control system since the urgency for deploying new on-field requirements was particularly
ACM Trans. Softw. Eng. Methodol., Vol. 37, No. 4, Article 111. Publication date: August 2021.
The Agile Success Model: A Mixed Methods Study of a Large-Scale Agile Transformation 111:5
compelling. Moreover, decreasing government budgets demand managers to acquire software withfewer resources. Accordingly, the organization started to look for alternative development processescompared to the expensiveWaterfall one. Simultaneously, security standards and software reliabilitywere the Agency’s top priority since the new system had to be interoperable with internationalsystems deployed in mission-critical operations.The Command & Control project started in 2014 and ended successfully in 2016. It developed
mission-specific services called Functional Area Services (FAS). At an organizational level, theydeployed a kind of Scrum of Scrums development method [19, 85], where one or more Agile teamswere committed to developing one FAS. This tailored Scrum approach was designed to have Sprintsof five weeks, four for the development and one for security certifications. Up to six teams (one perFAS), 24 developers, six Scrum Masters, and six Product Owners of the Agency worked actively onthe project. Since not all FAS required the same effort, sometimes developers were reallocated toother teams of the project, depending on the customer’s priority.
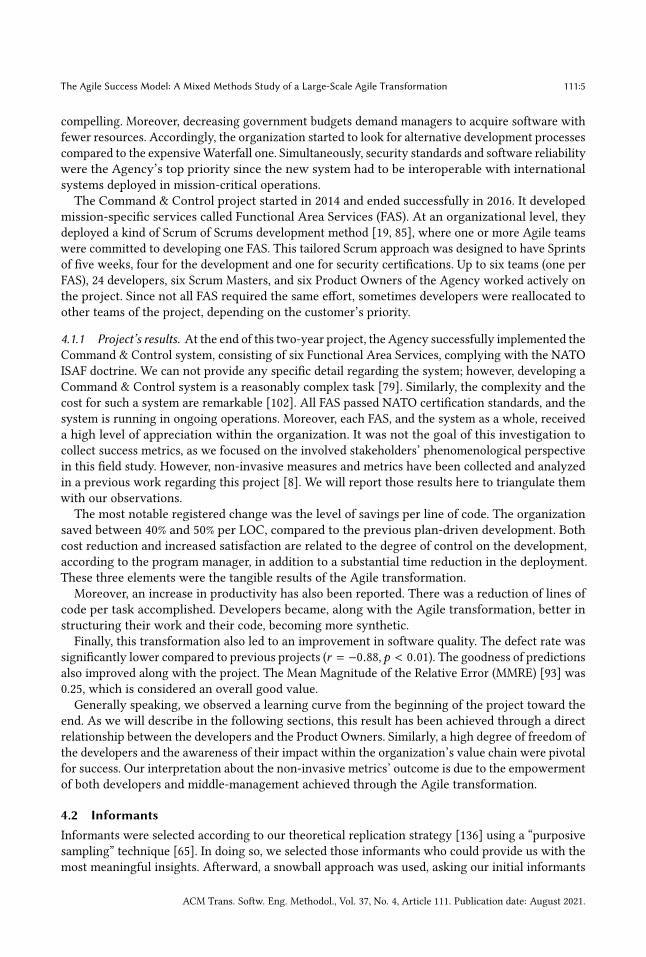
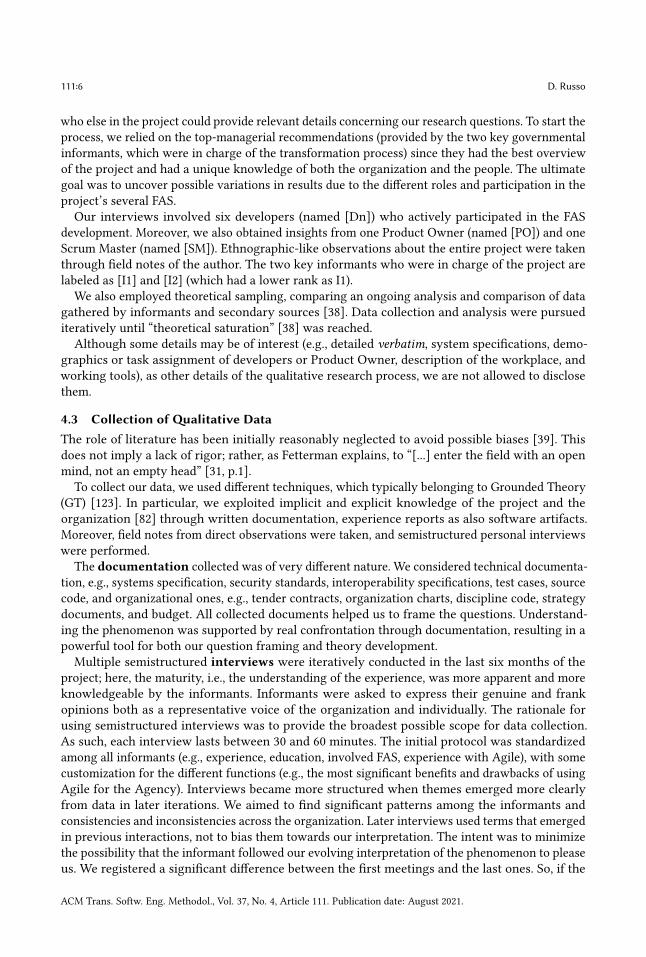
4.1.1 Project’s results. At the end of this two-year project, the Agency successfully implemented theCommand & Control system, consisting of six Functional Area Services, complying with the NATOISAF doctrine. We can not provide any specific detail regarding the system; however, developing aCommand & Control system is a reasonably complex task [79]. Similarly, the complexity and thecost for such a system are remarkable [102]. All FAS passed NATO certification standards, and thesystem is running in ongoing operations. Moreover, each FAS, and the system as a whole, receiveda high level of appreciation within the organization. It was not the goal of this investigation tocollect success metrics, as we focused on the involved stakeholders’ phenomenological perspectivein this field study. However, non-invasive measures and metrics have been collected and analyzedin a previous work regarding this project [8]. We will report those results here to triangulate themwith our observations.
The most notable registered change was the level of savings per line of code. The organizationsaved between 40% and 50% per LOC, compared to the previous plan-driven development. Bothcost reduction and increased satisfaction are related to the degree of control on the development,according to the program manager, in addition to a substantial time reduction in the deployment.These three elements were the tangible results of the Agile transformation.
Moreover, an increase in productivity has also been reported. There was a reduction of lines ofcode per task accomplished. Developers became, along with the Agile transformation, better instructuring their work and their code, becoming more synthetic.
Finally, this transformation also led to an improvement in software quality. The defect rate wassignificantly lower compared to previous projects (r = −0.88,p < 0.01). The goodness of predictionsalso improved along with the project. The Mean Magnitude of the Relative Error (MMRE) [93] was0.25, which is considered an overall good value.
Generally speaking, we observed a learning curve from the beginning of the project toward theend. As we will describe in the following sections, this result has been achieved through a directrelationship between the developers and the Product Owners. Similarly, a high degree of freedom ofthe developers and the awareness of their impact within the organization’s value chain were pivotalfor success. Our interpretation about the non-invasive metrics’ outcome is due to the empowermentof both developers and middle-management achieved through the Agile transformation.
4.2 InformantsInformants were selected according to our theoretical replication strategy [136] using a “purposivesampling” technique [65]. In doing so, we selected those informants who could provide us with themost meaningful insights. Afterward, a snowball approach was used, asking our initial informants
ACM Trans. Softw. Eng. Methodol., Vol. 37, No. 4, Article 111. Publication date: August 2021.
111:6 D. Russo
who else in the project could provide relevant details concerning our research questions. To start theprocess, we relied on the top-managerial recommendations (provided by the two key governmentalinformants, which were in charge of the transformation process) since they had the best overviewof the project and had a unique knowledge of both the organization and the people. The ultimategoal was to uncover possible variations in results due to the different roles and participation in theproject’s several FAS.Our interviews involved six developers (named [Dn]) who actively participated in the FAS
development. Moreover, we also obtained insights from one Product Owner (named [PO]) and oneScrum Master (named [SM]). Ethnographic-like observations about the entire project were takenthrough field notes of the author. The two key informants who were in charge of the project arelabeled as [I1] and [I2] (which had a lower rank as I1).
We also employed theoretical sampling, comparing an ongoing analysis and comparison of datagathered by informants and secondary sources [38]. Data collection and analysis were pursuediteratively until “theoretical saturation” [38] was reached.Although some details may be of interest (e.g., detailed verbatim, system specifications, demo-
graphics or task assignment of developers or Product Owner, description of the workplace, andworking tools), as other details of the qualitative research process, we are not allowed to disclosethem.
4.3 Collection ofQualitative DataThe role of literature has been initially reasonably neglected to avoid possible biases [39]. Thisdoes not imply a lack of rigor; rather, as Fetterman explains, to “[...] enter the field with an openmind, not an empty head” [31, p.1].
To collect our data, we used different techniques, which typically belonging to Grounded Theory(GT) [123]. In particular, we exploited implicit and explicit knowledge of the project and theorganization [82] through written documentation, experience reports as also software artifacts.Moreover, field notes from direct observations were taken, and semistructured personal interviewswere performed.
The documentation collected was of very different nature. We considered technical documenta-tion, e.g., systems specification, security standards, interoperability specifications, test cases, sourcecode, and organizational ones, e.g., tender contracts, organization charts, discipline code, strategydocuments, and budget. All collected documents helped us to frame the questions. Understand-ing the phenomenon was supported by real confrontation through documentation, resulting in apowerful tool for both our question framing and theory development.Multiple semistructured interviews were iteratively conducted in the last six months of the
project; here, the maturity, i.e., the understanding of the experience, was more apparent and moreknowledgeable by the informants. Informants were asked to express their genuine and frankopinions both as a representative voice of the organization and individually. The rationale forusing semistructured interviews was to provide the broadest possible scope for data collection.As such, each interview lasts between 30 and 60 minutes. The initial protocol was standardizedamong all informants (e.g., experience, education, involved FAS, experience with Agile), with somecustomization for the different functions (e.g., the most significant benefits and drawbacks of usingAgile for the Agency). Interviews became more structured when themes emerged more clearlyfrom data in later iterations. We aimed to find significant patterns among the informants andconsistencies and inconsistencies across the organization. Later interviews used terms that emergedin previous interactions, not to bias them towards our interpretation. The intent was to minimizethe possibility that the informant followed our evolving interpretation of the phenomenon to pleaseus. We registered a significant difference between the first meetings and the last ones. So, if the
ACM Trans. Softw. Eng. Methodol., Vol. 37, No. 4, Article 111. Publication date: August 2021.
The Agile Success Model: A Mixed Methods Study of a Large-Scale Agile Transformation 111:7
first contacts were very formal and provided poor implicit knowledge, in the end, we were alsoaware of very personal insights (e.g., group and promotion disputes). Our final data structure hasbeen discussed and validated by informants. This was a valuable process to confront the collectedevidence with potentially missing or redundant information.
Observations were aimed to grasp the most intimate knowledge out of informants, groupdynamics, and the organization. Such observations were performed during the project manage-ment, shadowing informants during work, and social interactions outside the working hours (e.g.,breaks, lunches). Field notes were taken after the observations to gather insights, which helped usunderstand the context of the studied phenomenon.The narrative of our findings is based on the systematic and coherent combination of our data
collection. Most interviews have been tape-recorded and transcribed if the informants expressedtheir consent. Also, we took notes after each observation.
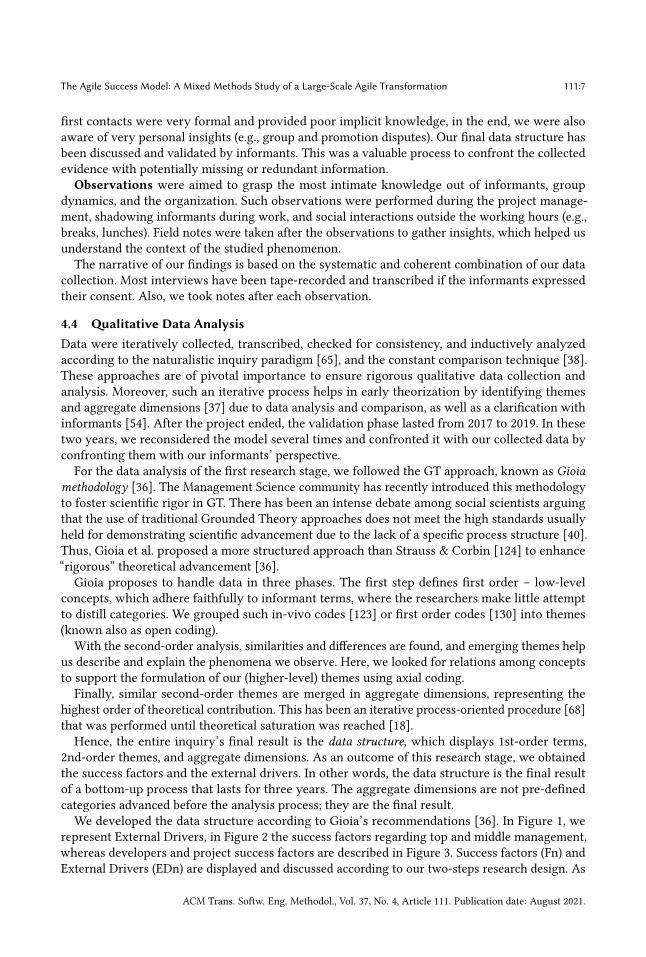
4.4 Qualitative Data AnalysisData were iteratively collected, transcribed, checked for consistency, and inductively analyzedaccording to the naturalistic inquiry paradigm [65], and the constant comparison technique [38].These approaches are of pivotal importance to ensure rigorous qualitative data collection andanalysis. Moreover, such an iterative process helps in early theorization by identifying themesand aggregate dimensions [37] due to data analysis and comparison, as well as a clarification withinformants [54]. After the project ended, the validation phase lasted from 2017 to 2019. In thesetwo years, we reconsidered the model several times and confronted it with our collected data byconfronting them with our informants’ perspective.For the data analysis of the first research stage, we followed the GT approach, known as Gioia
methodology [36]. The Management Science community has recently introduced this methodologyto foster scientific rigor in GT. There has been an intense debate among social scientists arguingthat the use of traditional Grounded Theory approaches does not meet the high standards usuallyheld for demonstrating scientific advancement due to the lack of a specific process structure [40].Thus, Gioia et al. proposed a more structured approach than Strauss & Corbin [124] to enhance“rigorous” theoretical advancement [36].
Gioia proposes to handle data in three phases. The first step defines first order – low-levelconcepts, which adhere faithfully to informant terms, where the researchers make little attemptto distill categories. We grouped such in-vivo codes [123] or first order codes [130] into themes(known also as open coding).
With the second-order analysis, similarities and differences are found, and emerging themes helpus describe and explain the phenomena we observe. Here, we looked for relations among conceptsto support the formulation of our (higher-level) themes using axial coding.Finally, similar second-order themes are merged in aggregate dimensions, representing the
highest order of theoretical contribution. This has been an iterative process-oriented procedure [68]that was performed until theoretical saturation was reached [18].Hence, the entire inquiry’s final result is the data structure, which displays 1st-order terms,
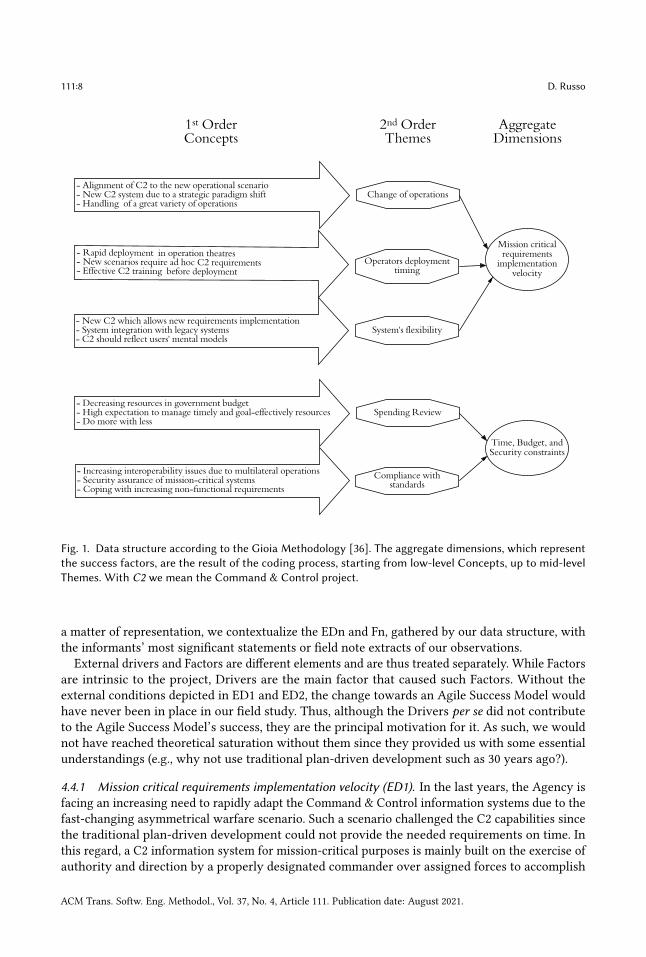
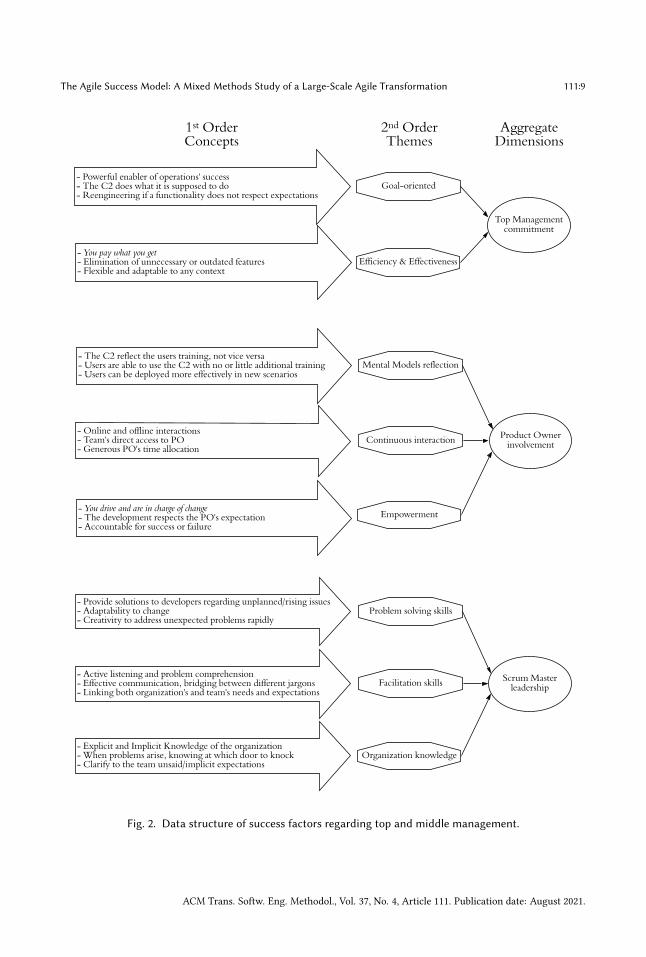
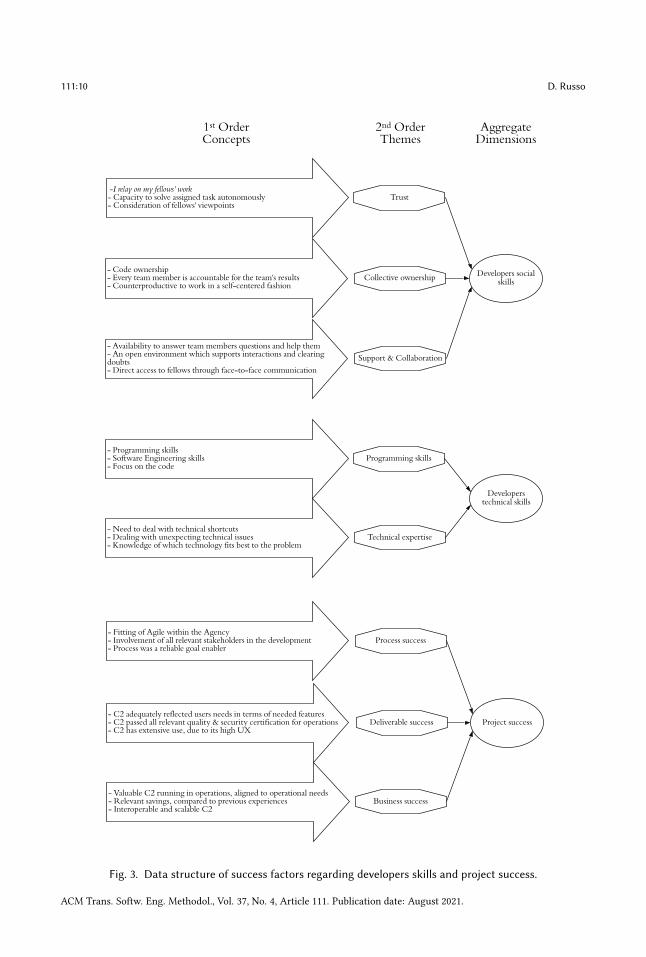
2nd-order themes, and aggregate dimensions. As an outcome of this research stage, we obtainedthe success factors and the external drivers. In other words, the data structure is the final resultof a bottom-up process that lasts for three years. The aggregate dimensions are not pre-definedcategories advanced before the analysis process; they are the final result.We developed the data structure according to Gioia’s recommendations [36]. In Figure 1, we
represent External Drivers, in Figure 2 the success factors regarding top and middle management,whereas developers and project success factors are described in Figure 3. Success factors (Fn) andExternal Drivers (EDn) are displayed and discussed according to our two-steps research design. As
ACM Trans. Softw. Eng. Methodol., Vol. 37, No. 4, Article 111. Publication date: August 2021.
111:8 D. Russo
Aggregate Dimensions
M ission critical requirements
implementation velocity
Time, Budget, and Security constraints
Change of operations
Spending Review
Operators deployment timing
2nd Order Themes
1st Order Concepts
Compliance with standards
- Alignment of C2 to the new operational scenario - N ew C2 system due to a strategic paradigm shift - H andling of a great variety of operations
- Rapid deployment in operation theatres - N ew scenarios require ad hoc C2 requirements - Effective C2 training before deployment
System's flexibility- N ew C2 which allows new requirements implementation - System integration with legacy systems - C2 should reflect users' mental models
- Decreasing resources in government budget - H igh expectation to manage timely and goal-effectively resources - Do more with less
- Increasing interoperability issues due to multilateral operations - Security assurance of mission-critical systems - Coping with increasing non-functional requirements
Fig. 1. Data structure according to the Gioia Methodology [36]. The aggregate dimensions, which representthe success factors, are the result of the coding process, starting from low-level Concepts, up to mid-levelThemes. With C2 we mean the Command & Control project.
a matter of representation, we contextualize the EDn and Fn, gathered by our data structure, withthe informants’ most significant statements or field note extracts of our observations.
External drivers and Factors are different elements and are thus treated separately. While Factorsare intrinsic to the project, Drivers are the main factor that caused such Factors. Without theexternal conditions depicted in ED1 and ED2, the change towards an Agile Success Model wouldhave never been in place in our field study. Thus, although the Drivers per se did not contributeto the Agile Success Model’s success, they are the principal motivation for it. As such, we wouldnot have reached theoretical saturation without them since they provided us with some essentialunderstandings (e.g., why not use traditional plan-driven development such as 30 years ago?).
4.4.1 Mission critical requirements implementation velocity (ED1). In the last years, the Agency isfacing an increasing need to rapidly adapt the Command & Control information systems due to thefast-changing asymmetrical warfare scenario. Such a scenario challenged the C2 capabilities sincethe traditional plan-driven development could not provide the needed requirements on time. Inthis regard, a C2 information system for mission-critical purposes is mainly built on the exercise ofauthority and direction by a properly designated commander over assigned forces to accomplish
ACM Trans. Softw. Eng. Methodol., Vol. 37, No. 4, Article 111. Publication date: August 2021.
The Agile Success Model: A Mixed Methods Study of a Large-Scale Agile Transformation 111:9
Scrum M aster leadership
Product Owner involvement
Top M anagement commitment
Goal-oriented- Powerful enabler of operations' success - The C2 does what it is supposed to do - Reengineering if a functionality does not respect expectations
M ental M odels reflection
Efficiency & Effectiveness
- The C2 reflect the users training, not vice versa - Users are able to use the C2 with no or little additional training - Users can be deployed more effectively in new scenarios
Empowerment
Continuous interaction
- You pay what you get - Elimination of unnecessary or outdated features - Flexible and adaptable to any context
- Online and offline interactions - Team's direct access to PO - Generous PO's time allocation
- You drive and are in charge of change - The development respects the PO's expectation - Accountable for success or failure
- Provide solutions to developers regarding unplanned/rising issues- Adaptability to change- Creativity to address unexpected problems rapidly
Problem solving skills
Facilitation skills
Organization knowledge
- Active listening and problem comprehension- Effective communication, bridging between different jargons- Linking both organization's and team's needs and expectations
- Explicit and Implicit Knowledge of the organization - When problems arise, knowing at which door to knock- Clarify to the team unsaid/implicit expectations
Aggregate Dimensions
2nd Order Themes
1st Order Concepts
Fig. 2. Data structure of success factors regarding top and middle management.
ACM Trans. Softw. Eng. Methodol., Vol. 37, No. 4, Article 111. Publication date: August 2021.
111:10 D. Russo
Developers social skills
- I relay on my fellows' work - Capacity to solve assigned task autonomously - Consideration of fellows' viewpoints
Trust
Collective ownership
Support & Collaboration
- Code ownership- Every team member is accountable for the team's results - Counterproductive to work in a self-centered fashion
- Availability to answer team members questions and help them- An open environment which supports interactions and clearing doubts - Direct access to fellows through face-to-face communication
Project success
- Fitting of Agile within the Agency- Involvement of all relevant stakeholders in the development - Process was a reliable goal enabler
Process success
Deliverable success
Business success
- C2 adequately reflected users needs in terms of needed features- C2 passed all relevant quality & security certification for operations- C2 has extensive use, due to its high U X
- Valuable C2 running in operations, aligned to operational needs- Relevant savings, compared to previous experiences- Interoperable and scalable C2
Developers technical skills
Programming skills- Programming skills - Software Engineering skills- Focus on the code
Technical expertise- N eed to deal with technical shortcuts - Dealing with unexpecting technical issues- Knowledge of which technology fits best to the problem
Aggregate Dimensions
2nd Order Themes
1st Order Concepts
Fig. 3. Data structure of success factors regarding developers skills and project success.
ACM Trans. Softw. Eng. Methodol., Vol. 37, No. 4, Article 111. Publication date: August 2021.
The Agile Success Model: A Mixed Methods Study of a Large-Scale Agile Transformation 111:11
the assigned mission [126]. However, the idea to develop a FAS-based Network Centric Warfaresystem (NCW) [2], to address new scenarios’ criticalities, had several difficulties:
The acquisition procedure started according to aWaterfall fashion in the early 2000s andwent on until recently. The obsolescence of the components and related functionalitiesand the maintenance and follow-up costs connected to the Waterfall software life cyclestarted soon to become a compelling issue. [I1]
Consequently, the Agency started to develop in 2014 a new C2 system; it aimed to support thelegacy Command and Control System with the evolution of new functionalities and assuring highercustomer satisfaction in a volatile requirements situation. In this sense, system integration withthe systems of Agencies of other countries was a strict project requirement. This urgency wasrequested from units involved in operations:
The new C2 is much better than previous projects since you have a direct influence onthe development. Before, we were sending troops with a C2 system, which does notreflect the reality on the ground. Today, months are years. Time is the most preciousresource. Since I was in charge of the development, I was able to start my unit’s trainingeven before the first release. [PO]
The strategic relevance to be able to provide rapidly novel useful functionalities was fully sharedalso among developers:
Before the new system, the Agency got functionalities that could take the risk ofbecoming obsolete before using them; now, we can provide them with what theyneed when they need it. Moreover, such functionalities were designed following the“doctrine” principles. Therefore, the use of the different C2 features reflected the users’“way of thinking”. [D2]
4.4.2 Time, Budget, and Security constraints (ED2). System alignment is always a challenging task,in particular, if the interoperability standards are complex. Providing software that is employedin very different operations with different partners has been among the toughest IT challengesfor the Agency. Working on on-field operations means providing high-security standards in ordernot to jeopardize joint operations with partners. This task is highly sensitive and hard to meet,considering decreasing resources year by year. As a consequence of the economic recession, theAgency’s budget shrunk in the last years [98]:
Due to budget cuts, the system had to perform better with fewer resources, and gen-erally speaking, we had to do more with less. Costs related to both development andmaintenance had to shrink rapidly, as also the deployment time, at the same securitylevels. These issues were perceived as highly critical for the operations within the topmanagement. [I1]
After the Agile transformation, the degree of control increased so that the Agency had a clearoversight on the costs, security, and flexibility in allocating budget to the needed functionalitieson the field. Before the Agile transformation, department managers provided the requirementsupfront, seeing the implemented functionalities only after years. By then, they were outdated inthe scenario they were supposed to face. The transformation led to an increase in efficiency, whichwas also shared in the Agency:
The new system saved us a lot of money compared to other similar systems. In fact,with the new C2, you have an active product line that develops in a fast way, only theneeded requirements in a decent way. Other comparable systems cost a lot more andprovide additional functionalities after a way too long time. [PO]
ACM Trans. Softw. Eng. Methodol., Vol. 37, No. 4, Article 111. Publication date: August 2021.
111:12 D. Russo
Particularly in terms of velocity, Agile is much more efficient. [D4]The Agile transformation started to fasten the deployment and decrease developmentcosts. [I2]
System security was a primary concern. During the whole project, all members were consciousof the security constraints they had to face. Accordingly, they had a high commitment to it sincethey perceived both the importance of their work and its effectiveness for the users involved in theoperation theatres. The transformation also had to handle compelling non-functional requirementsimplementation, such as software quality and security. As a result, requirements had a high customersatisfaction, and were able to pass also all certification phases:
There are no real issues on security; before deployment, each functionality had tocomply with multinational standards and national ones, which are quite stringent. [PO]
4.4.3 Top Management commitment (F1). The Agency’s top management is in charge of the entireAgency’s command chain. Such managers are in charge of the Agency’s strategic decisions. Besidessome criticalities, which are quite common when a large-scale Agile transformation is undergoing,the top management was committed since they perceived the success of the Agile transformationas a turning point element in their operational scenario. Moreover, from a project managementperspective, the transformation was very cost-effective since, in the end, the Agency paid for whatthey effectively got. The level of commitment to the Agile transformation was thus, highly relevantfor the overall outcome of the project:
At a top management level, we knew to pioneer something radically new. An Agiletransformation eventually meant to deploy within a month critical functionalities forthe operations. This gave our users a strategic asset and improved their capabilities inthe operation theatre. [I1]I recognized a commitment of the top management since the CEO ordered his entiresubordinate command chain to cooperate with us in an Agile fashion. [D5]
The top management commitment was not only empty words but tangible facts, such as invest-ments:
My manager was very committed to the project since he dedicated a significant amountof his time to it and not to other tasks. However, he saw the fast improvements sincethe developed features were highly relevant for operations, thus fully supported me inthat. What was also important is that if the developed features were not satisfactory,the team had to rework on it until I was fully satisfied. [PO]
One of the big motivator of the project was that at a department level, managers saw indeed thattheir desiderata were becoming a reality in a short time frame, in a way they never experiencedbefore:
I saw, at all levels, happy customers for the work we were able to ship continuously. Ihave never seen such thrilled customers in my working experience. [D4]According to my previous working experience on Waterfall-like development, myimpression is that the project was efficiently managed, also because a lot of standardor unnecessary features which software vendors tend to bundle, but are not necessaryfor the customer, were skipped. [D1]
The strong commitment was tightly related to the project’s success:Top managers were much more committed to this project compared to non-Agile ones.They had to take responsibility for what they asked. If something would have gonewrong, they had to share responsibility. The project’s success increased their level of
ACM Trans. Softw. Eng. Methodol., Vol. 37, No. 4, Article 111. Publication date: August 2021.
The Agile Success Model: A Mixed Methods Study of a Large-Scale Agile Transformation 111:13
commitment since they had the idea to influence the final product and have a higherdegree of control; in a way, they never experienced. [I2]
4.4.4 Product Owner involvement (F2). The typical Product Owner directly manages the unitswhich are deployed on the field. PO’s involvement was a definite success factor. In cases wherecommunication was jeopardized, the teams got no clear direction, delivering sub-optimal solutions.For this reason, the PO of one of the most successful Mission Threats said:
At least one day per week, I went to the development team to see if they had questionsor concerns to raise. Moreover, I was always able to replay quickly to every raised issuefor the rest of the week through our Agile management tool. I checked the evolution ofthe Sprint along with the development. This enabled us to remove defects also beforethe Sprint Review. The continuous interaction with my teamwas a confounding successfactor. [PO]
Developers had a definite effect on such new behavior. The possibility to continuously interactwith the PO empowered the team to rapidly deliver and deploy new functionalities, which alsoincreased the PO’s commitment. The relationship with the PO was a significant change compared toprevious experiences. Developers were generally not used to the Agile paradigm. Having immediatefeedback about the development increased the motivation among teams dramatically. Similarly,the PO’s commitment also increased since he saw a real opportunity to improve the Agency’s C2capabilities. As a consequence, the POs were always very present. When they were not present inperson during the development, they were always available through phone, email, or the Agile toolchatting system:
Before the Agile transformation, the customer lost any relation to the project. Now,with Agile, he is much more involved and committed, contributing to the project’ssuccess. They felt utterly part of the development team. [D5]
Moreover, the PO’s commitment increased, especially when the development team showedmutual effort. As a result, the project was driven by the PO, which felt clear ownership andresponsibility on the project:
I think that the PO is committed because he touches with his hand what is in his mind.Indeed, with this new approach, you drive and are in charge of change. Seeing theproblem from the other side means that you are accountable for failures. You can notshift responsibilities to the software house, stating that features do not represent theoperational scenario or complaining about very bad UX. [PO]
What project managers realized is that with plan-driven development, software houses do notfully understand end-users. It was PO’s job to explain end-users mental models to the developersand be sure that all features are effectively aligned to such mental models in the Sprint Reviews.For the first time, department heads were able to forge a tool that actively supported their
command and control capabilities, which is also a crucial issue for promotion. They saw with theirown eyes that the system did what was supposed to do, and could be deployed immediately inoperations:
One practical example is the training before each operation. Since the C2 system wasindeed designed for some particular users, the design already reflected users’ training,not vice versa. This shortened incredible training time. Such experience was totallynew to us. [I2]
4.4.5 Scrum Master leadership (F3). The Scrum Masters were domain experts employees withmid-management functions. They were rarely active in the development but acted as gate-keepers.
ACM Trans. Softw. Eng. Methodol., Vol. 37, No. 4, Article 111. Publication date: August 2021.
111:14 D. Russo
Their organization’s knowledge was critical to solve impediments, as also the closeness to users’mental models:
We have never really trained for this job role. It is very new. However, I am flatteredthat I was asked by the top management to act as a ScrumMaster during this strategicalAgile transformation process. [SM]
In the case of impediments, the Scrum Master worked to remove them. One manifest element ofsuccess was the effort of the Scrum Master in defending the team from unreasonable requests ofthe PO. In such cases, he explained to him the technical difficulties linked to such requests. Theindependence, reliability, and knowledge of the domain of the Scrum Master let the developmentteam focus on the development. Since developers were not domain experts, it was constructive tohave someone with an in-depth knowledge of how things work in the Agency:
So, when problems arise, knowing at which door to knock helps us incredibly further.[D4]
However, ScrumMasters not always had in-depth technical knowledge, which was not consideredpositively by team members since they also expected more technical advice:
Our Scrum Master was very effective in solving organizational issues, although he hadpoor software development skills. I believe that a good Scrum Master should be both amanager and a developer. These characteristics should empower him to be independentof the customers’ excessive requests and teams’ shortsightedness. [D2]
Still, when the Scrum Master was both skilled and expert in the domain, Sprints were concludedpositively. The coordination effort by the Scrum Master was crucial for the project’s success. Also,the ability to team up the Scrum team, the role of facilitator in case of controversy within the team,the solution of non-technical issues (like the relations with the organization), the role of the team’sprotector were all essential success factors:
I consider the leadership skills of the Scrum master very relevant since he was able tolead my high-level requirements into low-level software code. This, also when unex-pected requirements come out during the FAS development due to changes requiredfrom the field. The cooperation with him was an undeniable success factor since wecreated a strong team spirit, even making some personalized team t-shirts. [PO]
4.4.6 Developers social skills (F4). Developers were hired through a body-rental contract from astate-owned software house, specialized in governmental procurement. All developers had severalyears of working experience. Some had used Scrum in past project experience, while some othersnever heard about Agile development at all. The awareness of developing in a team, and for a team,according to code ownership principles was a characterizing factor of the project:
We always helped each other when difficulties arose taken the different viewpointsof colleagues very seriously. It was great to know that you could always rely on yourteam and talk in person, knowing that you are not alone. [D3]
Dealing with high expectations was not always an easy task for developers. However, teamswere, most of the time, able to collaborate effectively, addressing one problem at the time. This waspossible since there was a working environment where every developer relied on their fellow’swork:
You must find teammates who are willing to team up, which is not so common amongdevelopers. Different from my past working experience, here, the whole team is ac-countable for each member. Otherwise, the project would fail. [D1]
ACM Trans. Softw. Eng. Methodol., Vol. 37, No. 4, Article 111. Publication date: August 2021.
The Agile Success Model: A Mixed Methods Study of a Large-Scale Agile Transformation 111:15
Generally speaking, the interaction between team members is crucial to organize the differenttasks of the Sprint. Since there was a shared responsibility for the delivered software, clear anddirect communication and collaboration was essential for the project’s success:
Indeed, without collaboration, we would not have solved the project’s shortcuts. [D6]In order to team up, also environmental conditions should be supported. Having the developers
all together in a governmental compound fostered their sense of belonging, which is essential toreach the goal. Our informants made the point that social and technical skills are two separatedentities, and both were important for the project’s management:
Along with the project, we had developers who were technically very skilled but werevery poor in collaboration. As a consequence, we had delays, and team cohesion washarmed. Therefore, we had to fire those professionals due to their toxic attitude, evenif they were very skilled developers. [I1]
4.4.7 Developers technical skills (F5). The technical knowledge of the team members was crucialfor regular tasks but, more importantly, to solve unexpected problems. In particular, in the startingSprints, where most difficulties arose, and also when the expectations of the POs were veryhigh, teams were able to provide adequate solutions thanks to in-depth technical knowledge andexperience. Having a good team composition with different software engineering skills, like design,security, and testing, was a critical factor in deploying the required features in the FAS. While inplan-driven development, it is easier for under-average developers to hide and blame someone elsefor their failures, this was not possible here:
With complex process structures, it wasmuch harder to spotwhowas under-performingsince the responsibility was typically shared with the antecedent or subsequent devel-opers in the process chain. Now, with Agile teams focus on the code and the customer,eliminating all unnecessary overheads. [I2]
According to our informants, Agile needs highly skilled developers since they are absorbedin a context where time pressure is very tight, and all developers need to be aligned. Takingcare of poorly skilled team members would mean slowing down the development dramatically,double-checking, and also refactoring their code. To work effectively in an Agile setting, one shouldthink and act differently than in the Waterfall-like project. Boundaries are very much blurred,and developers have to “feel” both the customer’s wishes and the way colleagues would like toimplement them:
In the project, we had some slightly negative shortcuts linked to the novelty of intro-ducing Agile in a very hierarchical organization. However, we were always able tosolve them effectively through our programming skills. [D5]
It was the team’s task to implement the User Stories the PO asked for in the best technical way:When you develop a system that will be used under considerable stress situations, itshould be as familiar and intuitive as possible. The team should have enough skills tobe open to a whole scenario of possible technical changes. [PO]
Eventually, we should also mention that to keep the project going, managers had also to makeradical decisions. For example, it happened to fire developers since they were not able to pursuetheir tasks adequately.
4.4.8 Project success (F6). The new C2 development experience leads to an evident success of theapplied methodology, recognized at all levels of the top management. Agile was a critical enablerfactor, mainly because stakeholders were able to tailor Scrum to our Agency setting, involving the
ACM Trans. Softw. Eng. Methodol., Vol. 37, No. 4, Article 111. Publication date: August 2021.
111:16 D. Russo
relevant stakeholder of the project. Moreover, what is also important to stress is the fact that thenew system fulfilled all interoperability requirements with the Agency’s legacy systems:
The FAS I led had a great success within my department, much more compared to theother non-Agile developed systems. [PO]
There are multiple reasons why it happened. Using Agile was a critical factor for project success.Since developers are accustomed daily to PO’s wishes, development teams were able to delivera product that attained precisely to the expectations. Developers felt genuinely gratified withtheir work since they received a warm acknowledgment for the effort, which was not the caseof a Waterfall project. In such projects, developers had no ideas about the customers and theirsatisfaction. Software engineers felt like people, not machines; thus, their commitment to theproject increased consequently:
This was a very positive experience, the possibility to have continuous feedback fromcustomers and develop incrementally contributed to the project’s success. Moreover,also during the project, developed functionalities were deployed on the field withvery high customer satisfaction. Also, to my previous experience, this Agile trans-formation is a success story. Although there have been some critical issues, we werestill able to address our mission: velocity with cost control and multinational securitystandards. [D4]
Seeing, just after one month that the needed requirements worked, and the development wenton speedily was perceived as very positive for the Agency since the project was able to addresscontingent needs. POs and officers deployed on the field referred that the new C2 system wasconsiderably better compared to pre-existing systems. Notably, this Agile transformation has beenconsidered as a strategic organizational asset. Indeed, the new C2 changed organizational routines,minimizing users’ technology adaptation time:
If users on the field know how to use the system even before they are deployed inoperations, it enable the Agency to save precious time, assuring a fast deployment ofthe combat force in an NCW fashion. [PO]
4.5 Induction of an Agile Success ModelThe outcome of this research phase is the research model, represented in Figure 4, which explainsthe most critical relations among the identified success factors through six hypotheses to validateempirically. ED1 and ED2 are driving, or external, factors, while Fn are the success factors. Theidentification of the success factors is addressed by the RQ1. The relations (represented withsingle-headed arrows) are the result of our observations, addressing RQ2. Generally speaking, allobservations have been corroborated and double-checked (wherever possible) through the useof support materials (e.g., project documentation, regulations, budget law, source code, technicaldocuments).
Although external drivers are not part of the model, they contribute to explain the transformationprocess and are consequently part of the model. These drivers can explain why a hierarchicalorganization committed to a Waterfall-like approach, embraced Agile eventually. Indeed, we maynot understand the success of the new C2 system without a deep context comprehension.
The starting point of our model is the top managerial commitment. It is widely recognized thatstakeholders’ commitment to a project determines its failure or success [77]. From an organiza-tional perspective, we identified three project stakeholders’ levels on different function layers: topmanagerial, mid-management, and implementation. Different stakeholder levels help the under-standing of the success model. Typically, an Agile transformation involves different stakeholderswith different roles and competencies. This is amplified with Agile, where the development is
ACM Trans. Softw. Eng. Methodol., Vol. 37, No. 4, Article 111. Publication date: August 2021.

The Agile Success Model: A Mixed Methods Study of a Large-Scale Agile Transformation 111:17
Top Management commitment
Mission critical requirements
implementation velocity
Time, Budget & Security constraints
Product Owner involvement
Scrum Master leadership
Developers social skills
Developers technical skills
Project success
External Drivers 1-level StakeholdersTop Management layer
2-level StakeholdersMid Management layer
3-level StakeholdersImplantation layer
H1
H2
H3a
H3b
H4a
H4b
H5a
H5b
H6
Fig. 4. Agile Success Model: dotted lines represent the influence of external drivers to the success factor,while the arrows display the relations among success factors.
close to the customer. As represented in our Data Structure, constructs have different technicaland non-technical facets and imply different accountability levels. This model provides a differentgranularity level of understanding, where Themes infer to Aggregate Dimensions (or constructs),which correspond to a stakeholder/decision level.
Since the organization was hierarchical, also the communication structures [17] were hierarchi-cal, although they always followed a Scrum-like approach. We realize that tracing communicationstructures in our context was relatively easy compared to a decentralized and horizontal orga-nization. Therefore, developers (3rd-level stakeholders) did not directly interact with the topmanagement regarding technical issues since they were supposed to implement Product Owners(PO) requirements, supported by the Scrum Master’s leadership. Similarly, technical and socialaspects are considered as two distinct constructs compelling characteristics towards project success.In the end, the artifact they were able to deliver determined the success of the project. Therefore,the relevant research hypotheses for the implementation layer are:
H5a : Developers social skills contributes to Project successH5b : Developers technical skills contributes to Project success
The 2nd-level stakeholders interacted between the other two function layers concerning theirrole. The PO represented the customer and asked for the best possible functionalities. Moreover,the PO advocated end-users expectations and needs, transferring this knowledge to developers.The Scrum Master (SM), as an official of the Agency, acted as a filter and facilitator between theorganization and the team. In our case, he did not act as primus inter pares, since due to the project’scomplexity, there was a need for leadership by someone knowledgeable of the organization. Assuch, he helped to frame PO’s User Stories and took decisions over them during the development.Moreover, both the ScrumMaster and the Product Owner dealt with developers’ social and technicalaspects. On the one hand, developers were supposed to deliver working software compliant withquality and security standards; on the other hand, they were supposed to communicate effectivelyto interpret users’ mental models. Accordingly, we formulate the following hypotheses for themid-management layer:
ACM Trans. Softw. Eng. Methodol., Vol. 37, No. 4, Article 111. Publication date: August 2021.
111:18 D. Russo
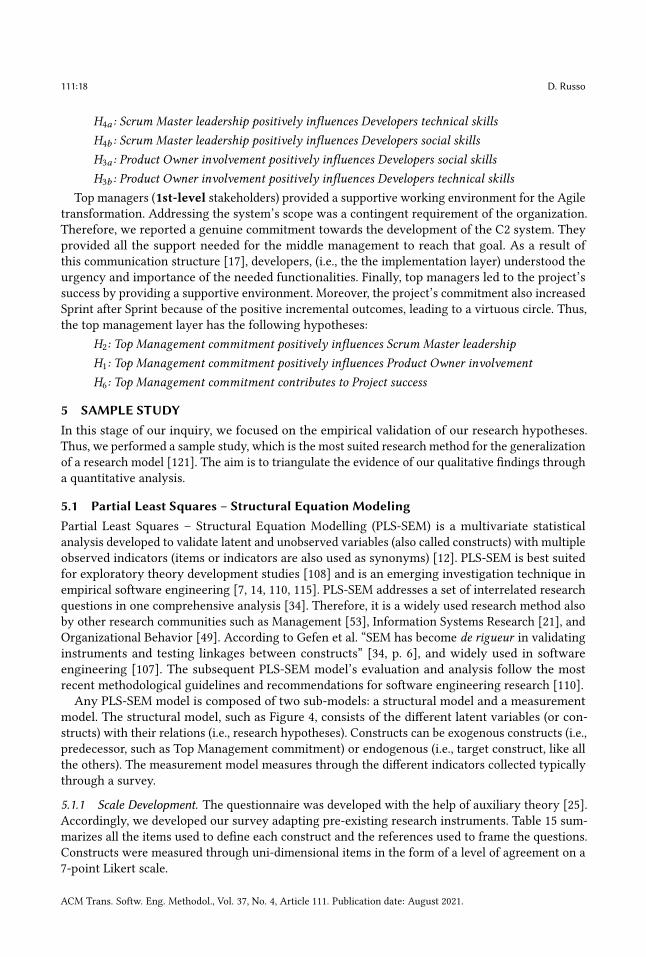
H4a : Scrum Master leadership positively influences Developers technical skillsH4b : Scrum Master leadership positively influences Developers social skillsH3a : Product Owner involvement positively influences Developers social skillsH3b : Product Owner involvement positively influences Developers technical skills
Top managers (1st-level stakeholders) provided a supportive working environment for the Agiletransformation. Addressing the system’s scope was a contingent requirement of the organization.Therefore, we reported a genuine commitment towards the development of the C2 system. Theyprovided all the support needed for the middle management to reach that goal. As a result ofthis communication structure [17], developers, (i.e., the the implementation layer) understood theurgency and importance of the needed functionalities. Finally, top managers led to the project’ssuccess by providing a supportive environment. Moreover, the project’s commitment also increasedSprint after Sprint because of the positive incremental outcomes, leading to a virtuous circle. Thus,the top management layer has the following hypotheses:
H2: Top Management commitment positively influences Scrum Master leadershipH1: Top Management commitment positively influences Product Owner involvementH6: Top Management commitment contributes to Project success
5 SAMPLE STUDYIn this stage of our inquiry, we focused on the empirical validation of our research hypotheses.Thus, we performed a sample study, which is the most suited research method for the generalizationof a research model [121]. The aim is to triangulate the evidence of our qualitative findings througha quantitative analysis.
5.1 Partial Least Squares – Structural Equation ModelingPartial Least Squares – Structural Equation Modelling (PLS-SEM) is a multivariate statisticalanalysis developed to validate latent and unobserved variables (also called constructs) with multipleobserved indicators (items or indicators are also used as synonyms) [12]. PLS-SEM is best suitedfor exploratory theory development studies [108] and is an emerging investigation technique inempirical software engineering [7, 14, 110, 115]. PLS-SEM addresses a set of interrelated researchquestions in one comprehensive analysis [34]. Therefore, it is a widely used research method alsoby other research communities such as Management [53], Information Systems Research [21], andOrganizational Behavior [49]. According to Gefen et al. “SEM has become de rigueur in validatinginstruments and testing linkages between constructs” [34, p. 6], and widely used in softwareengineering [107]. The subsequent PLS-SEM model’s evaluation and analysis follow the mostrecent methodological guidelines and recommendations for software engineering research [110].Any PLS-SEM model is composed of two sub-models: a structural model and a measurement
model. The structural model, such as Figure 4, consists of the different latent variables (or con-structs) with their relations (i.e., research hypotheses). Constructs can be exogenous constructs (i.e.,predecessor, such as Top Management commitment) or endogenous (i.e., target construct, like allthe others). The measurement model measures through the different indicators collected typicallythrough a survey.
5.1.1 Scale Development. The questionnaire was developed with the help of auxiliary theory [25].Accordingly, we developed our survey adapting pre-existing research instruments. Table 15 sum-marizes all the items used to define each construct and the references used to frame the questions.Constructs were measured through uni-dimensional items in the form of a level of agreement on a7-point Likert scale.
ACM Trans. Softw. Eng. Methodol., Vol. 37, No. 4, Article 111. Publication date: August 2021.
The Agile Success Model: A Mixed Methods Study of a Large-Scale Agile Transformation 111:19
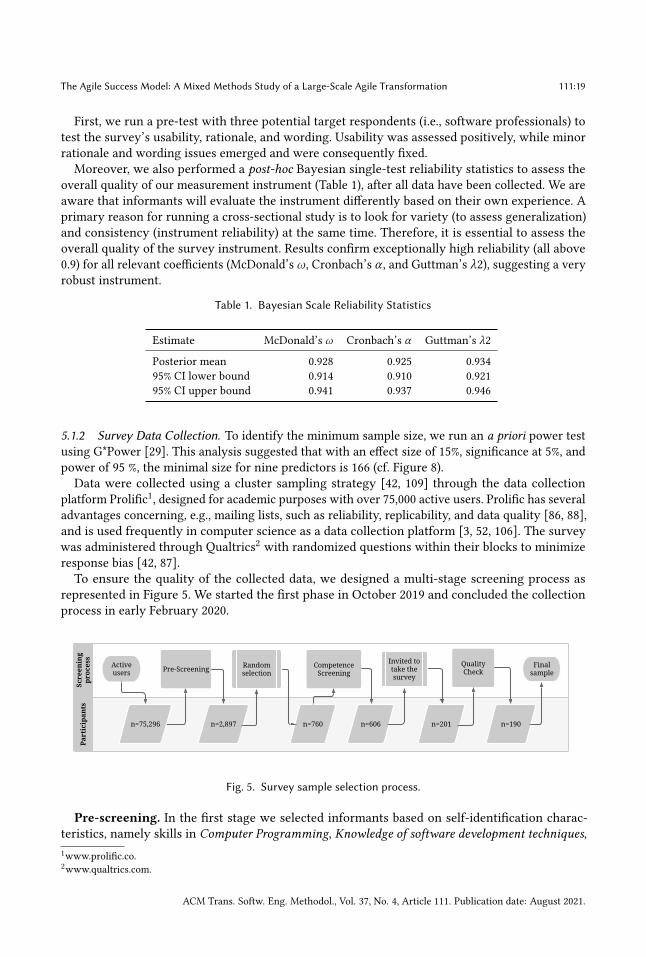
First, we run a pre-test with three potential target respondents (i.e., software professionals) totest the survey’s usability, rationale, and wording. Usability was assessed positively, while minorrationale and wording issues emerged and were consequently fixed.Moreover, we also performed a post-hoc Bayesian single-test reliability statistics to assess the
overall quality of our measurement instrument (Table 1), after all data have been collected. We areaware that informants will evaluate the instrument differently based on their own experience. Aprimary reason for running a cross-sectional study is to look for variety (to assess generalization)and consistency (instrument reliability) at the same time. Therefore, it is essential to assess theoverall quality of the survey instrument. Results confirm exceptionally high reliability (all above0.9) for all relevant coefficients (McDonald’s ω, Cronbach’s α , and Guttman’s λ2), suggesting a veryrobust instrument.
Table 1. Bayesian Scale Reliability Statistics
Estimate McDonald’s ω Cronbach’s α Guttman’s λ2
Posterior mean 0.928 0.925 0.93495% CI lower bound 0.914 0.910 0.92195% CI upper bound 0.941 0.937 0.946
5.1.2 Survey Data Collection. To identify the minimum sample size, we run an a priori power testusing G*Power [29]. This analysis suggested that with an effect size of 15%, significance at 5%, andpower of 95 %, the minimal size for nine predictors is 166 (cf. Figure 8).Data were collected using a cluster sampling strategy [42, 109] through the data collection
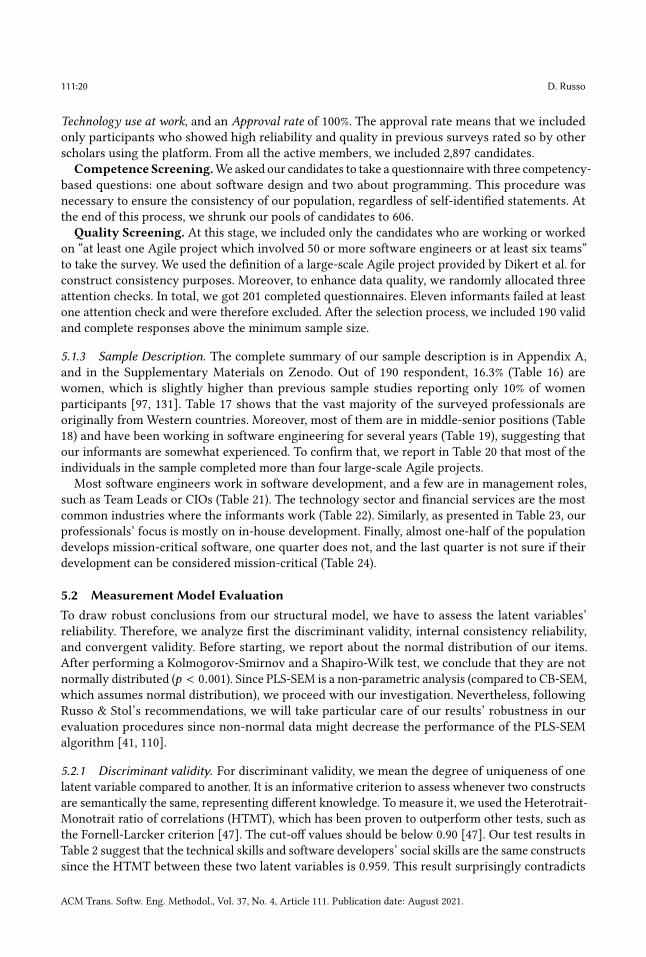
platform Prolific1, designed for academic purposes with over 75,000 active users. Prolific has severaladvantages concerning, e.g., mailing lists, such as reliability, replicability, and data quality [86, 88],and is used frequently in computer science as a data collection platform [3, 52, 106]. The surveywas administered through Qualtrics2 with randomized questions within their blocks to minimizeresponse bias [42, 87].To ensure the quality of the collected data, we designed a multi-stage screening process as
represented in Figure 5. We started the first phase in October 2019 and concluded the collectionprocess in early February 2020.
Scr
een
ing
pro
cess
Pa
rtic
ipa
nts
Active users Pre-Screening
Competence Screening
Quali ty Check
Final sample
n=75,296 n=2,897 n=760 n=606 n=190
Random selection
Invi ted to take the sur vey
n=201
Fig. 5. Survey sample selection process.
Pre-screening. In the first stage we selected informants based on self-identification charac-teristics, namely skills in Computer Programming, Knowledge of software development techniques,1www.prolific.co.2www.qualtrics.com.
ACM Trans. Softw. Eng. Methodol., Vol. 37, No. 4, Article 111. Publication date: August 2021.
111:20 D. Russo
Technology use at work, and an Approval rate of 100%. The approval rate means that we includedonly participants who showed high reliability and quality in previous surveys rated so by otherscholars using the platform. From all the active members, we included 2,897 candidates.
Competence Screening.Weasked our candidates to take a questionnairewith three competency-based questions: one about software design and two about programming. This procedure wasnecessary to ensure the consistency of our population, regardless of self-identified statements. Atthe end of this process, we shrunk our pools of candidates to 606.
Quality Screening. At this stage, we included only the candidates who are working or workedon “at least one Agile project which involved 50 or more software engineers or at least six teams”to take the survey. We used the definition of a large-scale Agile project provided by Dikert et al. forconstruct consistency purposes. Moreover, to enhance data quality, we randomly allocated threeattention checks. In total, we got 201 completed questionnaires. Eleven informants failed at leastone attention check and were therefore excluded. After the selection process, we included 190 validand complete responses above the minimum sample size.
5.1.3 Sample Description. The complete summary of our sample description is in Appendix A,and in the Supplementary Materials on Zenodo. Out of 190 respondent, 16.3% (Table 16) arewomen, which is slightly higher than previous sample studies reporting only 10% of womenparticipants [97, 131]. Table 17 shows that the vast majority of the surveyed professionals areoriginally from Western countries. Moreover, most of them are in middle-senior positions (Table18) and have been working in software engineering for several years (Table 19), suggesting thatour informants are somewhat experienced. To confirm that, we report in Table 20 that most of theindividuals in the sample completed more than four large-scale Agile projects.Most software engineers work in software development, and a few are in management roles,
such as Team Leads or CIOs (Table 21). The technology sector and financial services are the mostcommon industries where the informants work (Table 22). Similarly, as presented in Table 23, ourprofessionals’ focus is mostly on in-house development. Finally, almost one-half of the populationdevelops mission-critical software, one quarter does not, and the last quarter is not sure if theirdevelopment can be considered mission-critical (Table 24).
5.2 Measurement Model EvaluationTo draw robust conclusions from our structural model, we have to assess the latent variables’reliability. Therefore, we analyze first the discriminant validity, internal consistency reliability,and convergent validity. Before starting, we report about the normal distribution of our items.After performing a Kolmogorov-Smirnov and a Shapiro-Wilk test, we conclude that they are notnormally distributed (p < 0.001). Since PLS-SEM is a non-parametric analysis (compared to CB-SEM,which assumes normal distribution), we proceed with our investigation. Nevertheless, followingRusso & Stol’s recommendations, we will take particular care of our results’ robustness in ourevaluation procedures since non-normal data might decrease the performance of the PLS-SEMalgorithm [41, 110].
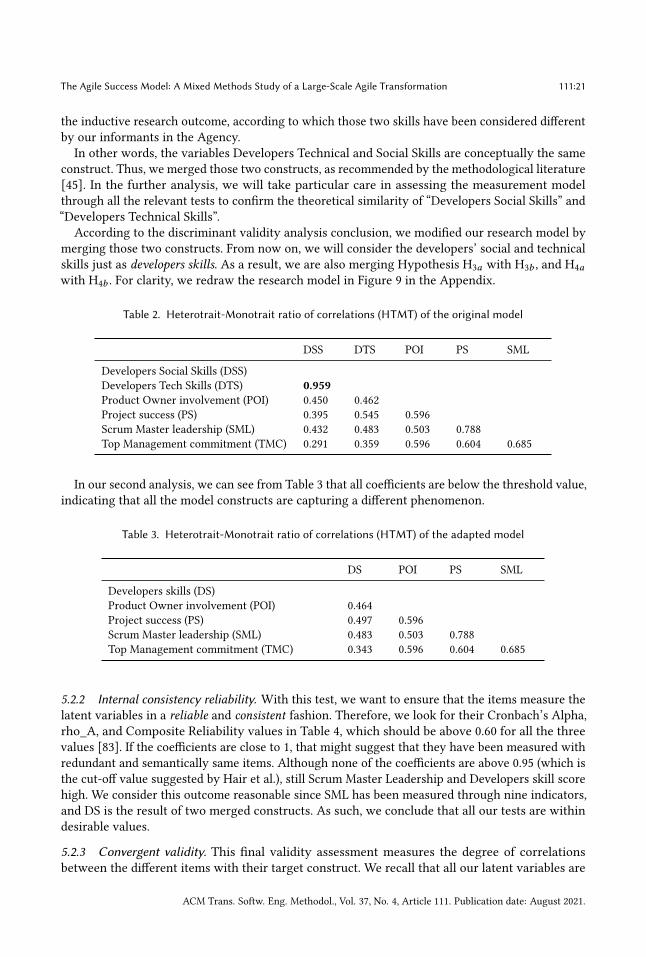
5.2.1 Discriminant validity. For discriminant validity, we mean the degree of uniqueness of onelatent variable compared to another. It is an informative criterion to assess whenever two constructsare semantically the same, representing different knowledge. To measure it, we used the Heterotrait-Monotrait ratio of correlations (HTMT), which has been proven to outperform other tests, such asthe Fornell-Larcker criterion [47]. The cut-off values should be below 0.90 [47]. Our test results inTable 2 suggest that the technical skills and software developers’ social skills are the same constructssince the HTMT between these two latent variables is 0.959. This result surprisingly contradicts
ACM Trans. Softw. Eng. Methodol., Vol. 37, No. 4, Article 111. Publication date: August 2021.
The Agile Success Model: A Mixed Methods Study of a Large-Scale Agile Transformation 111:21
the inductive research outcome, according to which those two skills have been considered differentby our informants in the Agency.In other words, the variables Developers Technical and Social Skills are conceptually the same
construct. Thus, we merged those two constructs, as recommended by the methodological literature[45]. In the further analysis, we will take particular care in assessing the measurement modelthrough all the relevant tests to confirm the theoretical similarity of “Developers Social Skills” and“Developers Technical Skills”.
According to the discriminant validity analysis conclusion, we modified our research model bymerging those two constructs. From now on, we will consider the developers’ social and technicalskills just as developers skills. As a result, we are also merging Hypothesis H3a with H3b , and H4awith H4b . For clarity, we redraw the research model in Figure 9 in the Appendix.
Table 2. Heterotrait-Monotrait ratio of correlations (HTMT) of the original model
DSS DTS POI PS SML
Developers Social Skills (DSS)Developers Tech Skills (DTS) 0.959Product Owner involvement (POI) 0.450 0.462Project success (PS) 0.395 0.545 0.596Scrum Master leadership (SML) 0.432 0.483 0.503 0.788Top Management commitment (TMC) 0.291 0.359 0.596 0.604 0.685
In our second analysis, we can see from Table 3 that all coefficients are below the threshold value,indicating that all the model constructs are capturing a different phenomenon.
Table 3. Heterotrait-Monotrait ratio of correlations (HTMT) of the adapted model
DS POI PS SML
Developers skills (DS)Product Owner involvement (POI) 0.464Project success (PS) 0.497 0.596Scrum Master leadership (SML) 0.483 0.503 0.788Top Management commitment (TMC) 0.343 0.596 0.604 0.685
5.2.2 Internal consistency reliability. With this test, we want to ensure that the items measure thelatent variables in a reliable and consistent fashion. Therefore, we look for their Cronbach’s Alpha,rho_A, and Composite Reliability values in Table 4, which should be above 0.60 for all the threevalues [83]. If the coefficients are close to 1, that might suggest that they have been measured withredundant and semantically same items. Although none of the coefficients are above 0.95 (which isthe cut-off value suggested by Hair et al.), still Scrum Master Leadership and Developers skill scorehigh. We consider this outcome reasonable since SML has been measured through nine indicators,and DS is the result of two merged constructs. As such, we conclude that all our tests are withindesirable values.
5.2.3 Convergent validity. This final validity assessment measures the degree of correlationsbetween the different items with their target construct. We recall that all our latent variables are
ACM Trans. Softw. Eng. Methodol., Vol. 37, No. 4, Article 111. Publication date: August 2021.
111:22 D. Russo
Table 4. Internal consistency reliability
Construct Cronbach’sAlpha
rho_A CompositeReliability
AVE
Developers skills 0.887 0.898 0.911 0.595Product Owner involvement 0.666 0.673 0.816 0.597Project success 0.821 0.826 0.893 0.737Scrum Master leadership 0.922 0.928 0.936 0.648Top Management commitment 0.871 0.883 0.906 0.659
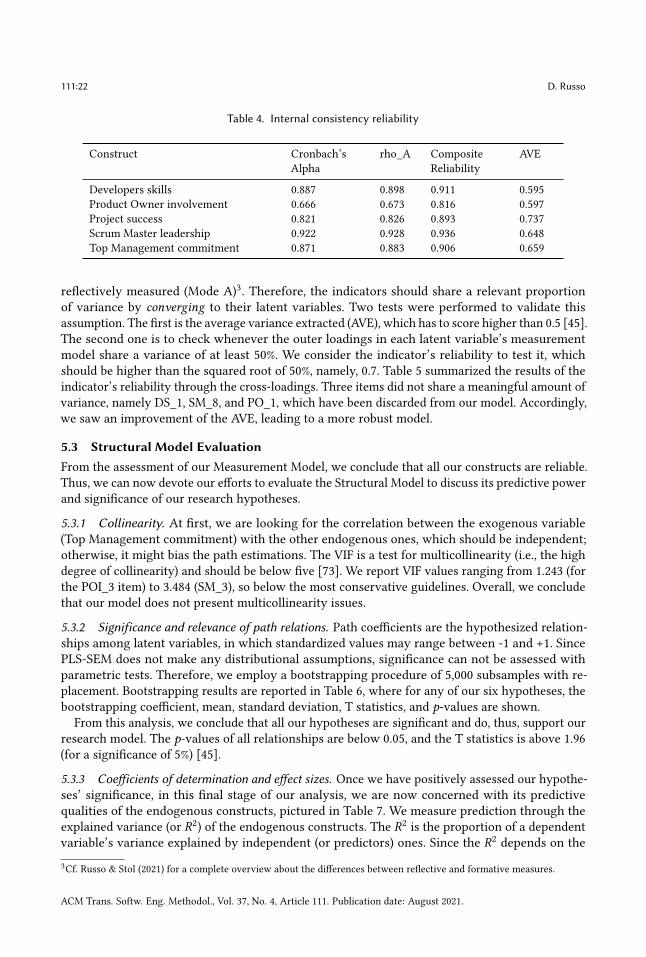
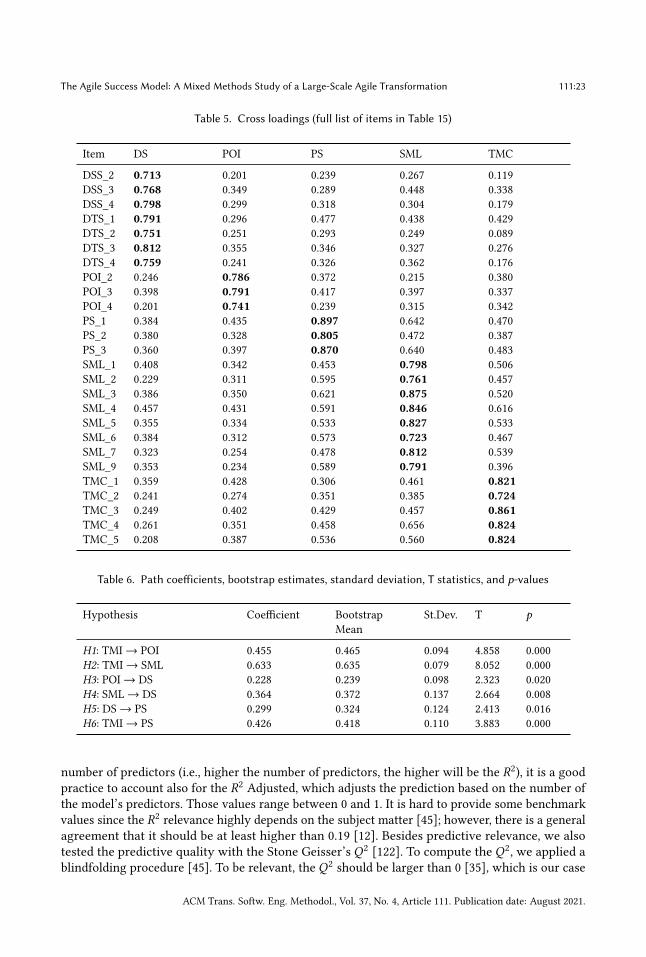
reflectively measured (Mode A)3. Therefore, the indicators should share a relevant proportionof variance by converging to their latent variables. Two tests were performed to validate thisassumption. The first is the average variance extracted (AVE), which has to score higher than 0.5 [45].The second one is to check whenever the outer loadings in each latent variable’s measurementmodel share a variance of at least 50%. We consider the indicator’s reliability to test it, whichshould be higher than the squared root of 50%, namely, 0.7. Table 5 summarized the results of theindicator’s reliability through the cross-loadings. Three items did not share a meaningful amount ofvariance, namely DS_1, SM_8, and PO_1, which have been discarded from our model. Accordingly,we saw an improvement of the AVE, leading to a more robust model.
5.3 Structural Model EvaluationFrom the assessment of our Measurement Model, we conclude that all our constructs are reliable.Thus, we can now devote our efforts to evaluate the Structural Model to discuss its predictive powerand significance of our research hypotheses.
5.3.1 Collinearity. At first, we are looking for the correlation between the exogenous variable(Top Management commitment) with the other endogenous ones, which should be independent;otherwise, it might bias the path estimations. The VIF is a test for multicollinearity (i.e., the highdegree of collinearity) and should be below five [73]. We report VIF values ranging from 1.243 (forthe POI_3 item) to 3.484 (SM_3), so below the most conservative guidelines. Overall, we concludethat our model does not present multicollinearity issues.
5.3.2 Significance and relevance of path relations. Path coefficients are the hypothesized relation-ships among latent variables, in which standardized values may range between -1 and +1. SincePLS-SEM does not make any distributional assumptions, significance can not be assessed withparametric tests. Therefore, we employ a bootstrapping procedure of 5,000 subsamples with re-placement. Bootstrapping results are reported in Table 6, where for any of our six hypotheses, thebootstrapping coefficient, mean, standard deviation, T statistics, and p-values are shown.
From this analysis, we conclude that all our hypotheses are significant and do, thus, support ourresearch model. The p-values of all relationships are below 0.05, and the T statistics is above 1.96(for a significance of 5%) [45].
5.3.3 Coefficients of determination and effect sizes. Once we have positively assessed our hypothe-ses’ significance, in this final stage of our analysis, we are now concerned with its predictivequalities of the endogenous constructs, pictured in Table 7. We measure prediction through theexplained variance (or R2) of the endogenous constructs. The R2 is the proportion of a dependentvariable’s variance explained by independent (or predictors) ones. Since the R2 depends on the
3Cf. Russo & Stol (2021) for a complete overview about the differences between reflective and formative measures.
ACM Trans. Softw. Eng. Methodol., Vol. 37, No. 4, Article 111. Publication date: August 2021.
The Agile Success Model: A Mixed Methods Study of a Large-Scale Agile Transformation 111:23
Table 5. Cross loadings (full list of items in Table 15)
Item DS POI PS SML TMC
DSS_2 0.713 0.201 0.239 0.267 0.119DSS_3 0.768 0.349 0.289 0.448 0.338DSS_4 0.798 0.299 0.318 0.304 0.179DTS_1 0.791 0.296 0.477 0.438 0.429DTS_2 0.751 0.251 0.293 0.249 0.089DTS_3 0.812 0.355 0.346 0.327 0.276DTS_4 0.759 0.241 0.326 0.362 0.176POI_2 0.246 0.786 0.372 0.215 0.380POI_3 0.398 0.791 0.417 0.397 0.337POI_4 0.201 0.741 0.239 0.315 0.342PS_1 0.384 0.435 0.897 0.642 0.470PS_2 0.380 0.328 0.805 0.472 0.387PS_3 0.360 0.397 0.870 0.640 0.483SML_1 0.408 0.342 0.453 0.798 0.506SML_2 0.229 0.311 0.595 0.761 0.457SML_3 0.386 0.350 0.621 0.875 0.520SML_4 0.457 0.431 0.591 0.846 0.616SML_5 0.355 0.334 0.533 0.827 0.533SML_6 0.384 0.312 0.573 0.723 0.467SML_7 0.323 0.254 0.478 0.812 0.539SML_9 0.353 0.234 0.589 0.791 0.396TMC_1 0.359 0.428 0.306 0.461 0.821TMC_2 0.241 0.274 0.351 0.385 0.724TMC_3 0.249 0.402 0.429 0.457 0.861TMC_4 0.261 0.351 0.458 0.656 0.824TMC_5 0.208 0.387 0.536 0.560 0.824
Table 6. Path coefficients, bootstrap estimates, standard deviation, T statistics, and p-values
Hypothesis Coefficient BootstrapMean
St.Dev. T p
H1: TMI→ POI 0.455 0.465 0.094 4.858 0.000H2: TMI→ SML 0.633 0.635 0.079 8.052 0.000H3: POI → DS 0.228 0.239 0.098 2.323 0.020H4: SML→ DS 0.364 0.372 0.137 2.664 0.008H5: DS → PS 0.299 0.324 0.124 2.413 0.016H6: TMI→ PS 0.426 0.418 0.110 3.883 0.000
number of predictors (i.e., higher the number of predictors, the higher will be the R2), it is a goodpractice to account also for the R2 Adjusted, which adjusts the prediction based on the number ofthe model’s predictors. Those values range between 0 and 1. It is hard to provide some benchmarkvalues since the R2 relevance highly depends on the subject matter [45]; however, there is a generalagreement that it should be at least higher than 0.19 [12]. Besides predictive relevance, we alsotested the predictive quality with the Stone Geisser’s Q2 [122]. To compute the Q2, we applied ablindfolding procedure [45]. To be relevant, the Q2 should be larger than 0 [35], which is our case
ACM Trans. Softw. Eng. Methodol., Vol. 37, No. 4, Article 111. Publication date: August 2021.
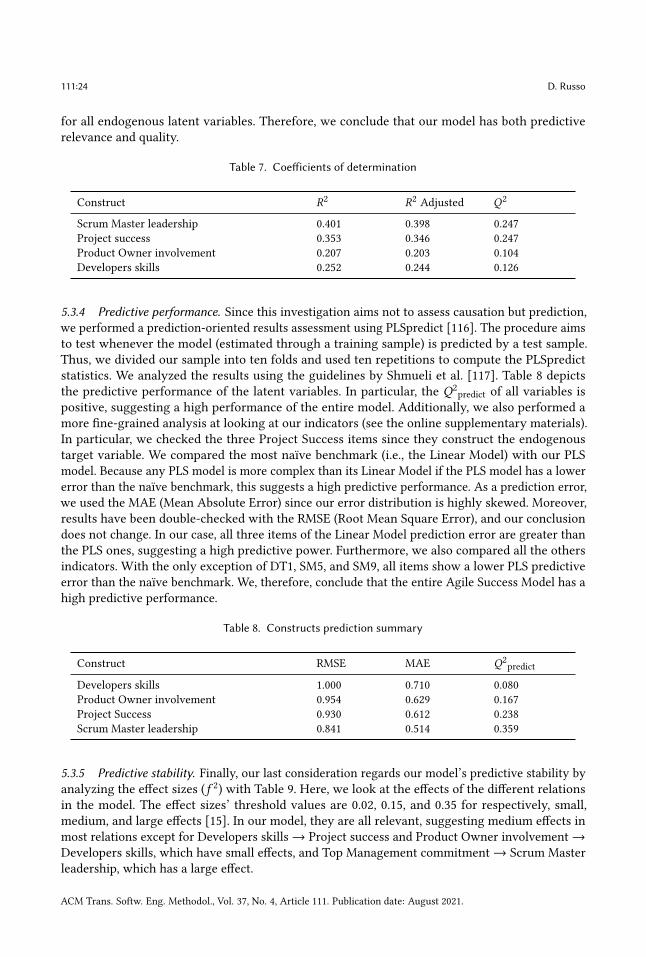
111:24 D. Russo
for all endogenous latent variables. Therefore, we conclude that our model has both predictiverelevance and quality.
Table 7. Coefficients of determination
Construct R2 R2 Adjusted Q2
Scrum Master leadership 0.401 0.398 0.247Project success 0.353 0.346 0.247Product Owner involvement 0.207 0.203 0.104Developers skills 0.252 0.244 0.126
5.3.4 Predictive performance. Since this investigation aims not to assess causation but prediction,we performed a prediction-oriented results assessment using PLSpredict [116]. The procedure aimsto test whenever the model (estimated through a training sample) is predicted by a test sample.Thus, we divided our sample into ten folds and used ten repetitions to compute the PLSpredictstatistics. We analyzed the results using the guidelines by Shmueli et al. [117]. Table 8 depictsthe predictive performance of the latent variables. In particular, the Q2
predict of all variables ispositive, suggesting a high performance of the entire model. Additionally, we also performed amore fine-grained analysis at looking at our indicators (see the online supplementary materials).In particular, we checked the three Project Success items since they construct the endogenoustarget variable. We compared the most naïve benchmark (i.e., the Linear Model) with our PLSmodel. Because any PLS model is more complex than its Linear Model if the PLS model has a lowererror than the naïve benchmark, this suggests a high predictive performance. As a prediction error,we used the MAE (Mean Absolute Error) since our error distribution is highly skewed. Moreover,results have been double-checked with the RMSE (Root Mean Square Error), and our conclusiondoes not change. In our case, all three items of the Linear Model prediction error are greater thanthe PLS ones, suggesting a high predictive power. Furthermore, we also compared all the othersindicators. With the only exception of DT1, SM5, and SM9, all items show a lower PLS predictiveerror than the naïve benchmark. We, therefore, conclude that the entire Agile Success Model has ahigh predictive performance.
Table 8. Constructs prediction summary
Construct RMSE MAE Q2predict
Developers skills 1.000 0.710 0.080Product Owner involvement 0.954 0.629 0.167Project Success 0.930 0.612 0.238Scrum Master leadership 0.841 0.514 0.359
5.3.5 Predictive stability. Finally, our last consideration regards our model’s predictive stability byanalyzing the effect sizes (f 2) with Table 9. Here, we look at the effects of the different relationsin the model. The effect sizes’ threshold values are 0.02, 0.15, and 0.35 for respectively, small,medium, and large effects [15]. In our model, they are all relevant, suggesting medium effects inmost relations except for Developers skills → Project success and Product Owner involvement →Developers skills, which have small effects, and Top Management commitment→ Scrum Masterleadership, which has a large effect.
ACM Trans. Softw. Eng. Methodol., Vol. 37, No. 4, Article 111. Publication date: August 2021.
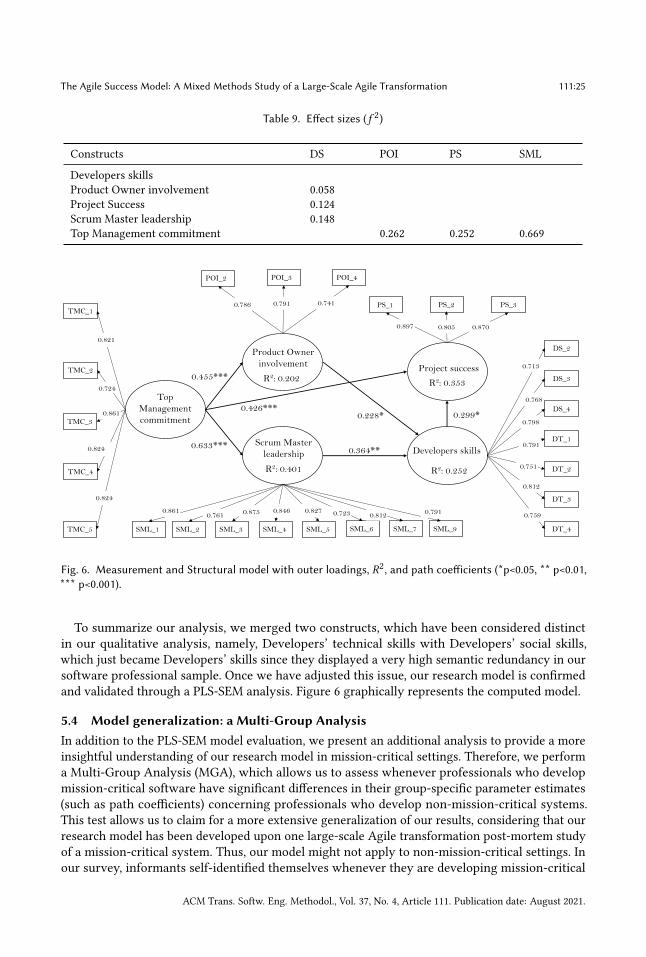
The Agile Success Model: A Mixed Methods Study of a Large-Scale Agile Transformation 111:25
Table 9. Effect sizes (f 2)
Constructs DS POI PS SML
Developers skillsProduct Owner involvement 0.058Project Success 0.124Scrum Master leadership 0.148Top Management commitment 0.262 0.252 0.669
Top Management commitment
Product Owner involvement
Scrum Master leadership Developers skills
Project successTMC_2
TMC_3
TMC_4
TMC_5
TMC_1
0.821
0.724
0.861
0.824
0.824
POI_2 POI_3 POI_4
0.786 0.791 0.741
SML_2 SML_3 SML_4 SML_5 SML_6 SML_7SML_1 SML_9
0.8610.761 0.875 0.846 0.827 0.723 0.812 0.791
DT_4
DT_3
DT_2
DT_1
DS_4
DS_3
DS_2
0.713
0.768
0.798
0.791
0.751
0.812
0.759
PS_1 PS_2 PS_3
0.897 0.805 0.870
R2: 0.202
R2: 0.401
R2: 0.353
R2: 0.252
0.455***
0.633***
0.426***
0.364**
0.299*0.228*
Fig. 6. Measurement and Structural model with outer loadings, R2, and path coefficients (*p<0.05, ** p<0.01,*** p<0.001).
To summarize our analysis, we merged two constructs, which have been considered distinctin our qualitative analysis, namely, Developers’ technical skills with Developers’ social skills,which just became Developers’ skills since they displayed a very high semantic redundancy in oursoftware professional sample. Once we have adjusted this issue, our research model is confirmedand validated through a PLS-SEM analysis. Figure 6 graphically represents the computed model.
5.4 Model generalization: a Multi-Group AnalysisIn addition to the PLS-SEM model evaluation, we present an additional analysis to provide a moreinsightful understanding of our research model in mission-critical settings. Therefore, we performa Multi-Group Analysis (MGA), which allows us to assess whenever professionals who developmission-critical software have significant differences in their group-specific parameter estimates(such as path coefficients) concerning professionals who develop non-mission-critical systems.This test allows us to claim for a more extensive generalization of our results, considering that ourresearch model has been developed upon one large-scale Agile transformation post-mortem studyof a mission-critical system. Thus, our model might not apply to non-mission-critical settings. Inour survey, informants self-identified themselves whenever they are developing mission-critical
ACM Trans. Softw. Eng. Methodol., Vol. 37, No. 4, Article 111. Publication date: August 2021.
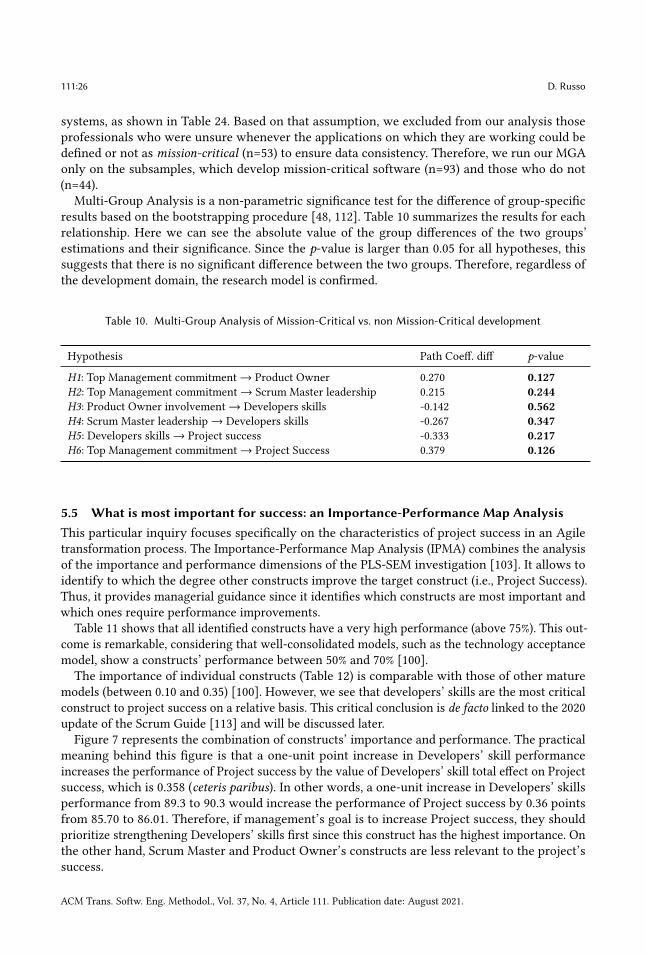
111:26 D. Russo
systems, as shown in Table 24. Based on that assumption, we excluded from our analysis thoseprofessionals who were unsure whenever the applications on which they are working could bedefined or not as mission-critical (n=53) to ensure data consistency. Therefore, we run our MGAonly on the subsamples, which develop mission-critical software (n=93) and those who do not(n=44).
Multi-Group Analysis is a non-parametric significance test for the difference of group-specificresults based on the bootstrapping procedure [48, 112]. Table 10 summarizes the results for eachrelationship. Here we can see the absolute value of the group differences of the two groups’estimations and their significance. Since the p-value is larger than 0.05 for all hypotheses, thissuggests that there is no significant difference between the two groups. Therefore, regardless ofthe development domain, the research model is confirmed.
Table 10. Multi-Group Analysis of Mission-Critical vs. non Mission-Critical development
Hypothesis Path Coeff. diff p-value
H1: Top Management commitment→ Product Owner 0.270 0.127H2: Top Management commitment→ Scrum Master leadership 0.215 0.244H3: Product Owner involvement→ Developers skills -0.142 0.562H4: Scrum Master leadership → Developers skills -0.267 0.347H5: Developers skills→ Project success -0.333 0.217H6: Top Management commitment→ Project Success 0.379 0.126
5.5 What is most important for success: an Importance-Performance Map AnalysisThis particular inquiry focuses specifically on the characteristics of project success in an Agiletransformation process. The Importance-Performance Map Analysis (IPMA) combines the analysisof the importance and performance dimensions of the PLS-SEM investigation [103]. It allows toidentify to which the degree other constructs improve the target construct (i.e., Project Success).Thus, it provides managerial guidance since it identifies which constructs are most important andwhich ones require performance improvements.
Table 11 shows that all identified constructs have a very high performance (above 75%). This out-come is remarkable, considering that well-consolidated models, such as the technology acceptancemodel, show a constructs’ performance between 50% and 70% [100].The importance of individual constructs (Table 12) is comparable with those of other mature
models (between 0.10 and 0.35) [100]. However, we see that developers’ skills are the most criticalconstruct to project success on a relative basis. This critical conclusion is de facto linked to the 2020update of the Scrum Guide [113] and will be discussed later.Figure 7 represents the combination of constructs’ importance and performance. The practical
meaning behind this figure is that a one-unit point increase in Developers’ skill performanceincreases the performance of Project success by the value of Developers’ skill total effect on Projectsuccess, which is 0.358 (ceteris paribus). In other words, a one-unit increase in Developers’ skillsperformance from 89.3 to 90.3 would increase the performance of Project success by 0.36 pointsfrom 85.70 to 86.01. Therefore, if management’s goal is to increase Project success, they shouldprioritize strengthening Developers’ skills first since this construct has the highest importance. Onthe other hand, Scrum Master and Product Owner’s constructs are less relevant to the project’ssuccess.
ACM Trans. Softw. Eng. Methodol., Vol. 37, No. 4, Article 111. Publication date: August 2021.
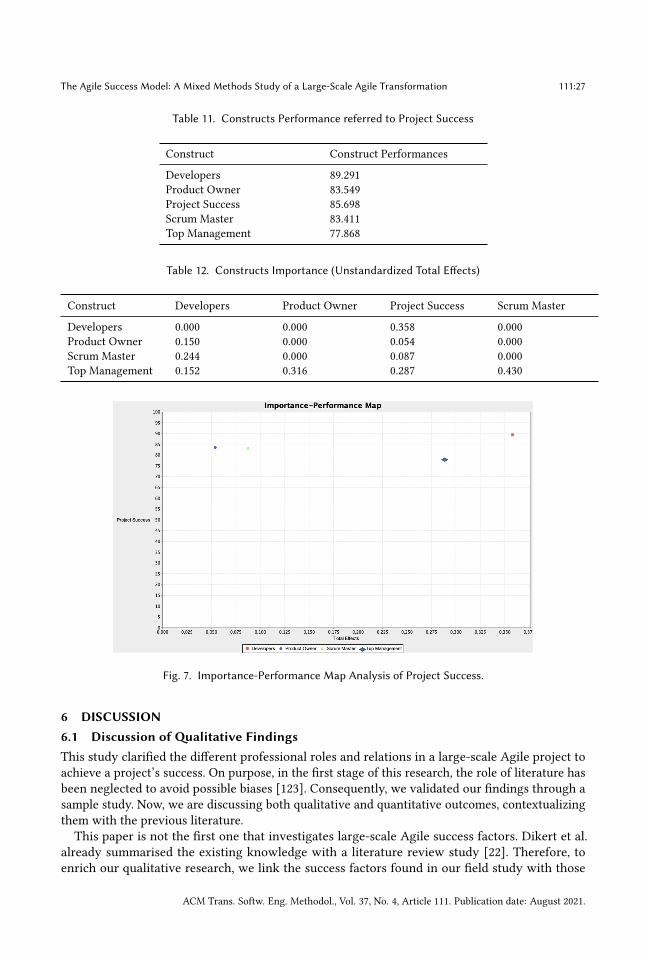
The Agile Success Model: A Mixed Methods Study of a Large-Scale Agile Transformation 111:27
Table 11. Constructs Performance referred to Project Success
Construct Construct Performances
Developers 89.291Product Owner 83.549Project Success 85.698Scrum Master 83.411Top Management 77.868
Table 12. Constructs Importance (Unstandardized Total Effects)
Construct Developers Product Owner Project Success Scrum Master
Developers 0.000 0.000 0.358 0.000Product Owner 0.150 0.000 0.054 0.000Scrum Master 0.244 0.000 0.087 0.000Top Management 0.152 0.316 0.287 0.430
Fig. 7. Importance-Performance Map Analysis of Project Success.
6 DISCUSSION6.1 Discussion ofQualitative FindingsThis study clarified the different professional roles and relations in a large-scale Agile project toachieve a project’s success. On purpose, in the first stage of this research, the role of literature hasbeen neglected to avoid possible biases [123]. Consequently, we validated our findings through asample study. Now, we are discussing both qualitative and quantitative outcomes, contextualizingthem with the previous literature.This paper is not the first one that investigates large-scale Agile success factors. Dikert et al.
already summarised the existing knowledge with a literature review study [22]. Therefore, toenrich our qualitative research, we link the success factors found in our field study with those
ACM Trans. Softw. Eng. Methodol., Vol. 37, No. 4, Article 111. Publication date: August 2021.
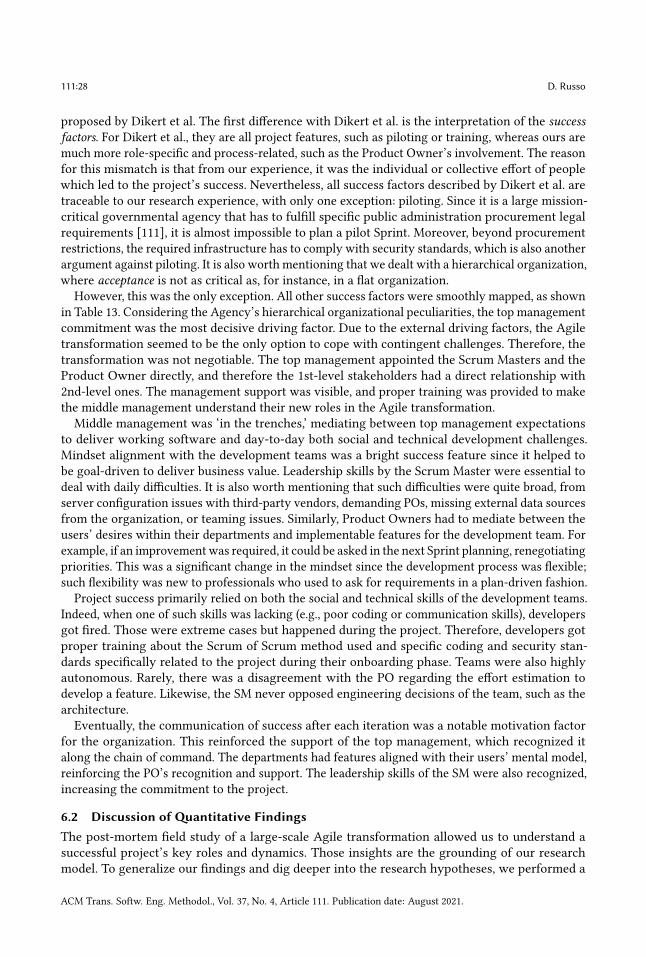
111:28 D. Russo
proposed by Dikert et al. The first difference with Dikert et al. is the interpretation of the successfactors. For Dikert et al., they are all project features, such as piloting or training, whereas ours aremuch more role-specific and process-related, such as the Product Owner’s involvement. The reasonfor this mismatch is that from our experience, it was the individual or collective effort of peoplewhich led to the project’s success. Nevertheless, all success factors described by Dikert et al. aretraceable to our research experience, with only one exception: piloting. Since it is a large mission-critical governmental agency that has to fulfill specific public administration procurement legalrequirements [111], it is almost impossible to plan a pilot Sprint. Moreover, beyond procurementrestrictions, the required infrastructure has to comply with security standards, which is also anotherargument against piloting. It is also worth mentioning that we dealt with a hierarchical organization,where acceptance is not as critical as, for instance, in a flat organization.
However, this was the only exception. All other success factors were smoothly mapped, as shownin Table 13. Considering the Agency’s hierarchical organizational peculiarities, the top managementcommitment was the most decisive driving factor. Due to the external driving factors, the Agiletransformation seemed to be the only option to cope with contingent challenges. Therefore, thetransformation was not negotiable. The top management appointed the Scrum Masters and theProduct Owner directly, and therefore the 1st-level stakeholders had a direct relationship with2nd-level ones. The management support was visible, and proper training was provided to makethe middle management understand their new roles in the Agile transformation.Middle management was ‘in the trenches,’ mediating between top management expectations
to deliver working software and day-to-day both social and technical development challenges.Mindset alignment with the development teams was a bright success feature since it helped tobe goal-driven to deliver business value. Leadership skills by the Scrum Master were essential todeal with daily difficulties. It is also worth mentioning that such difficulties were quite broad, fromserver configuration issues with third-party vendors, demanding POs, missing external data sourcesfrom the organization, or teaming issues. Similarly, Product Owners had to mediate between theusers’ desires within their departments and implementable features for the development team. Forexample, if an improvementwas required, it could be asked in the next Sprint planning, renegotiatingpriorities. This was a significant change in the mindset since the development process was flexible;such flexibility was new to professionals who used to ask for requirements in a plan-driven fashion.
Project success primarily relied on both the social and technical skills of the development teams.Indeed, when one of such skills was lacking (e.g., poor coding or communication skills), developersgot fired. Those were extreme cases but happened during the project. Therefore, developers gotproper training about the Scrum of Scrum method used and specific coding and security stan-dards specifically related to the project during their onboarding phase. Teams were also highlyautonomous. Rarely, there was a disagreement with the PO regarding the effort estimation todevelop a feature. Likewise, the SM never opposed engineering decisions of the team, such as thearchitecture.Eventually, the communication of success after each iteration was a notable motivation factor
for the organization. This reinforced the support of the top management, which recognized italong the chain of command. The departments had features aligned with their users’ mental model,reinforcing the PO’s recognition and support. The leadership skills of the SM were also recognized,increasing the commitment to the project.
6.2 Discussion ofQuantitative FindingsThe post-mortem field study of a large-scale Agile transformation allowed us to understand asuccessful project’s key roles and dynamics. Those insights are the grounding of our researchmodel. To generalize our findings and dig deeper into the research hypotheses, we performed a
ACM Trans. Softw. Eng. Methodol., Vol. 37, No. 4, Article 111. Publication date: August 2021.
The Agile Success Model: A Mixed Methods Study of a Large-Scale Agile Transformation 111:29
Table 13. Contextualisation of qualitative findings
Success Factor (roles) Success Factors(features [22])
Context
Top Managementcommitment
Management support,Commitment toChange, Choosing andcustomizing the Agileapproach
The Agile transformation was non-negotiable. At thelower management levels, it was made clear that Agilewas the new way to go. Specialized training wasorganized to make professionals realize their new rolesand goals. An up-front analysis decided how tocustomize the Scrum of Scrum method for theorganization. The method has been refined throughretrospectives.
Scrum Masterleadership
Leadership, Mindset,and Alignment
Scrum Masters have been empowered in their new roleby the top management, which appointed them toconsider their domain knowledge and flexibilitytowards change. They acted as gatekeepers, focusingon Agile values.
Product Ownerinvolvement
Engaging people,Mindset andAlignment,Requirementsmanagement
The Product Owner had the responsibility to work onthe requirements and get back to their departments tohave them approved or refined them more accurately.Accustom the department to Agile requirementselicitation.
Developers’ socialskills
Choosing andcustomizing the agileapproach, Mindset, andAlignment, Teamautonomy
Teams experienced a relatively high degree of freedomto self-organize themselves compared to pastexperiences. Communication and collaboration weretwo pivotal activities in the teams and were quitedisruptive when compared to Waterfall.
Developers technicalskills
Training and coaching At the end of each Sprint, working deployable codehad to be shipped. If skills were not satisfactory,developers got fired. Thus, training and coaching werecrucial, especially during onboarding, to getacquainted with the project’s characteristics.
Project Success Communication andtransparency
Working and delivering features which aligned withusers’ mental models Sprint after Sprint wasgroundbreaking. The developed system has beentailored for the users and not vice versa. Thisacknowledgment throughout the organization made acommitment to the project even stronger.
sample study. Collected data were analyzed through a Partial Least Squares analysis since it is awell-suited technique to assess the predictive qualities of a model [108]. The PLS-SEM model wasevaluated using the most recent guidelines for software engineering research by Russo & Stol [110].Our model passed all relevant statistic tests, showing the significance and relevance of the results,as also its high predictive power. Table 14 provides a summary.
The first notable result is that there is no semantic difference between software developers’ tech-nical and social skills. From the Heterotrait-Monotrait ratio of correlations analysis, we concluded
ACM Trans. Softw. Eng. Methodol., Vol. 37, No. 4, Article 111. Publication date: August 2021.
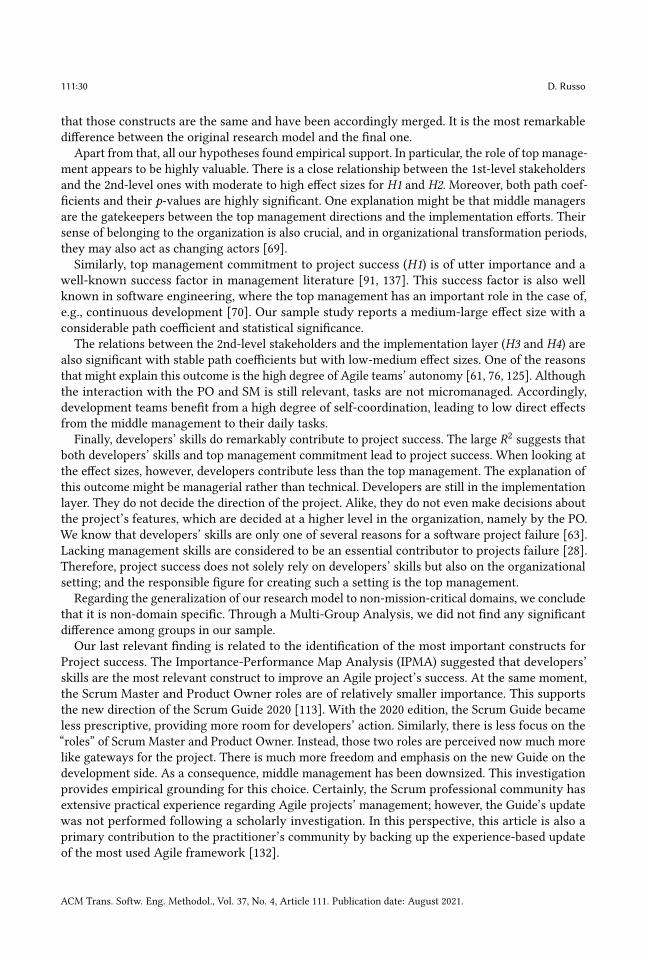
111:30 D. Russo
that those constructs are the same and have been accordingly merged. It is the most remarkabledifference between the original research model and the final one.
Apart from that, all our hypotheses found empirical support. In particular, the role of top manage-ment appears to be highly valuable. There is a close relationship between the 1st-level stakeholdersand the 2nd-level ones with moderate to high effect sizes for H1 and H2. Moreover, both path coef-ficients and their p-values are highly significant. One explanation might be that middle managersare the gatekeepers between the top management directions and the implementation efforts. Theirsense of belonging to the organization is also crucial, and in organizational transformation periods,they may also act as changing actors [69].Similarly, top management commitment to project success (H1) is of utter importance and a
well-known success factor in management literature [91, 137]. This success factor is also wellknown in software engineering, where the top management has an important role in the case of,e.g., continuous development [70]. Our sample study reports a medium-large effect size with aconsiderable path coefficient and statistical significance.
The relations between the 2nd-level stakeholders and the implementation layer (H3 and H4) arealso significant with stable path coefficients but with low-medium effect sizes. One of the reasonsthat might explain this outcome is the high degree of Agile teams’ autonomy [61, 76, 125]. Althoughthe interaction with the PO and SM is still relevant, tasks are not micromanaged. Accordingly,development teams benefit from a high degree of self-coordination, leading to low direct effectsfrom the middle management to their daily tasks.
Finally, developers’ skills do remarkably contribute to project success. The large R2 suggests thatboth developers’ skills and top management commitment lead to project success. When looking atthe effect sizes, however, developers contribute less than the top management. The explanation ofthis outcome might be managerial rather than technical. Developers are still in the implementationlayer. They do not decide the direction of the project. Alike, they do not even make decisions aboutthe project’s features, which are decided at a higher level in the organization, namely by the PO.We know that developers’ skills are only one of several reasons for a software project failure [63].Lacking management skills are considered to be an essential contributor to projects failure [28].Therefore, project success does not solely rely on developers’ skills but also on the organizationalsetting; and the responsible figure for creating such a setting is the top management.
Regarding the generalization of our research model to non-mission-critical domains, we concludethat it is non-domain specific. Through a Multi-Group Analysis, we did not find any significantdifference among groups in our sample.Our last relevant finding is related to the identification of the most important constructs for
Project success. The Importance-Performance Map Analysis (IPMA) suggested that developers’skills are the most relevant construct to improve an Agile project’s success. At the same moment,the Scrum Master and Product Owner roles are of relatively smaller importance. This supportsthe new direction of the Scrum Guide 2020 [113]. With the 2020 edition, the Scrum Guide becameless prescriptive, providing more room for developers’ action. Similarly, there is less focus on the“roles” of Scrum Master and Product Owner. Instead, those two roles are perceived now much morelike gateways for the project. There is much more freedom and emphasis on the new Guide on thedevelopment side. As a consequence, middle management has been downsized. This investigationprovides empirical grounding for this choice. Certainly, the Scrum professional community hasextensive practical experience regarding Agile projects’ management; however, the Guide’s updatewas not performed following a scholarly investigation. In this perspective, this article is also aprimary contribution to the practitioner’s community by backing up the experience-based updateof the most used Agile framework [132].
ACM Trans. Softw. Eng. Methodol., Vol. 37, No. 4, Article 111. Publication date: August 2021.
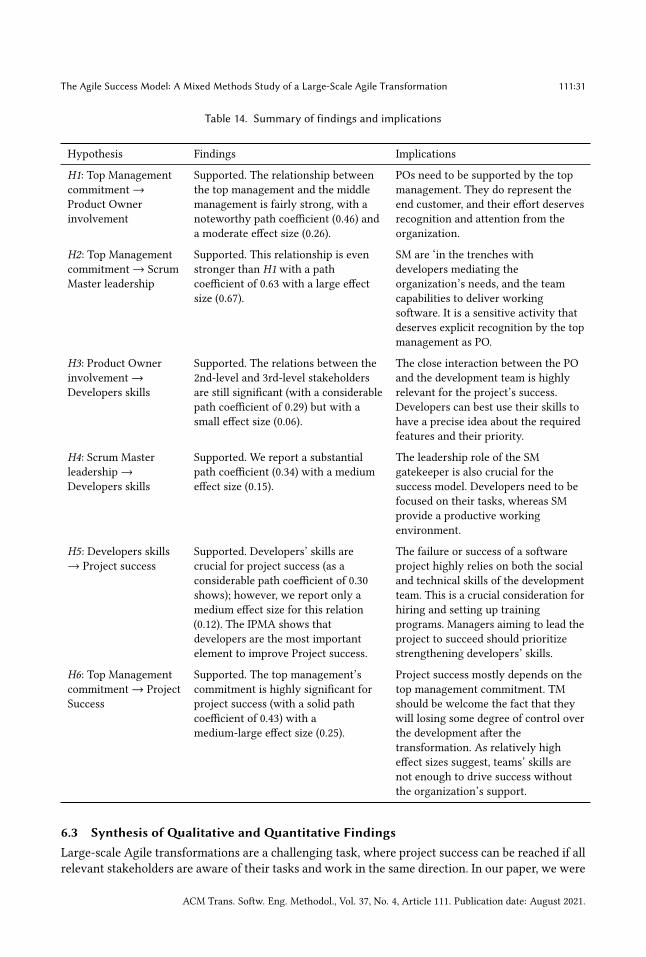
The Agile Success Model: A Mixed Methods Study of a Large-Scale Agile Transformation 111:31
Table 14. Summary of findings and implications
Hypothesis Findings Implications
H1: Top Managementcommitment→Product Ownerinvolvement
Supported. The relationship betweenthe top management and the middlemanagement is fairly strong, with anoteworthy path coefficient (0.46) anda moderate effect size (0.26).
POs need to be supported by the topmanagement. They do represent theend customer, and their effort deservesrecognition and attention from theorganization.
H2: Top Managementcommitment→ ScrumMaster leadership
Supported. This relationship is evenstronger than H1 with a pathcoefficient of 0.63 with a large effectsize (0.67).
SM are ‘in the trenches withdevelopers mediating theorganization’s needs, and the teamcapabilities to deliver workingsoftware. It is a sensitive activity thatdeserves explicit recognition by the topmanagement as PO.
H3: Product Ownerinvolvement→Developers skills
Supported. The relations between the2nd-level and 3rd-level stakeholdersare still significant (with a considerablepath coefficient of 0.29) but with asmall effect size (0.06).
The close interaction between the POand the development team is highlyrelevant for the project’s success.Developers can best use their skills tohave a precise idea about the requiredfeatures and their priority.
H4: Scrum Masterleadership→
Developers skills
Supported. We report a substantialpath coefficient (0.34) with a mediumeffect size (0.15).
The leadership role of the SMgatekeeper is also crucial for thesuccess model. Developers need to befocused on their tasks, whereas SMprovide a productive workingenvironment.
H5: Developers skills→ Project success
Supported. Developers’ skills arecrucial for project success (as aconsiderable path coefficient of 0.30shows); however, we report only amedium effect size for this relation(0.12). The IPMA shows thatdevelopers are the most importantelement to improve Project success.
The failure or success of a softwareproject highly relies on both the socialand technical skills of the developmentteam. This is a crucial consideration forhiring and setting up trainingprograms. Managers aiming to lead theproject to succeed should prioritizestrengthening developers’ skills.
H6: Top Managementcommitment → ProjectSuccess
Supported. The top management’scommitment is highly significant forproject success (with a solid pathcoefficient of 0.43) with amedium-large effect size (0.25).
Project success mostly depends on thetop management commitment. TMshould be welcome the fact that theywill losing some degree of control overthe development after thetransformation. As relatively higheffect sizes suggest, teams’ skills arenot enough to drive success withoutthe organization’s support.
6.3 Synthesis ofQualitative andQuantitative FindingsLarge-scale Agile transformations are a challenging task, where project success can be reached if allrelevant stakeholders are aware of their tasks and work in the same direction. In our paper, we were
ACM Trans. Softw. Eng. Methodol., Vol. 37, No. 4, Article 111. Publication date: August 2021.
111:32 D. Russo
primarily concerned with explaining stakeholders’ roles in a large-scale Agile transformation andlinking them to project success. We were interested to understand the dynamics between differentprofessionals’ roles and their contribution to a project’s success.The result is an Agile Success Model in which the roles of the stakeholders are clarified. Fur-
thermore, the Agile Success Model explains the dynamics and weights between stakeholders andproject success in detail. As a result, practitioners planning an Agile transformation may planusing this model, which provides a deep understating into such a process. Examples of actionableknowledge might be the characteristics of software developers. Superior technical and team skillsare needed for Agile projects; making hiring decisions relying only on technical interviews mightmiss important social dynamics, causing future problems. Likewise, it will not be sufficient to settlefor an extraordinary development team and committed middle managers if the top managementsupport is lacking. Our analysis clearly shows that providing an adequate organizational setting iseven more critical for project success than just hiring socio-technically skilled developers. Moreover,over-killing an Agile project with excessive emphasis on middle management might be troublesomefor project success. We showed how the role of the developers is the most critical element forsuccess. Similar conclusions have been reached by the updated Scrum Guide [113].
Although we primarily focused on the success factors, we can also identify relevant limitationsto such a transformation process. In particular, any intentional (or unintentional) action against oneof the six identified hypnoses would be problematic for a successful Agile project. In other words,the PLS-SEM model provides us not only the significant patterns but also the anti-patterns of asuccessful Agile transformation. However, our field study suggests that the sense of empowermentprovided by the topmanagement to the mid-management layer was a crucial success enabler. Middlemanagers had moral and material support to carry out their tasks. In a more traditional and lesssupportive environment, middle managers would have adopted a more self-conservatory approachwith job security as a primary goal. As one Scrum Master reported, after the Agile transformationwe no more believe in the way of thinking that “nobody gets fired for buying IBM". This insightabout top management’s supporting role triangulates well also with our statistical analyses of thesample study. Notably, the effect size of H6 (Top Management commitment→ Project Success) ismedium-large (0.25). Similarly, the IPMA suggests that Top Management commitment performancerelated to Project Success is above 75% and its importance is just after Developers’ skills (0.29).As a final remark, we would like to add that no conclusions have been made regarding the
precision of measurements, which is a typical research goal of a contrived setting, such as alaboratory experiment [121]. The SEM model reported only the significance and the effect sizesof the different hypothesized relations. It was not our research’s goal to provide a mechanisticmodel (such as COCOMO), where starting from some input data, a quantitative assessment canbe determined [108]. Instead, we were looking to develop and validate a research model of theinvestigated phenomenon.
6.4 Threats to ValidityThe limitations are discussed in consideration of the use of both qualitative and quantitative validityparadigms, as recommended by previous studies [105]. Therefore, we start to discuss credibility,transferability, dependability, and confirmability for the qualitative inquiry [44].
Credibility. We identified success factors and relations through a rigorous research design in asignificant post-mortem field study within an Italian governmental agency. The project lasted from2014 to 2016, with over 40 practitioners and six teams, and deployed mission-critical software thatis in use today.
Transferability. We analyzed our field study through a Grounded Theory approach followingthe GioiaMethodology until theoretical saturationwas reached.Moreover, we triangulate qualitative
ACM Trans. Softw. Eng. Methodol., Vol. 37, No. 4, Article 111. Publication date: August 2021.
The Agile Success Model: A Mixed Methods Study of a Large-Scale Agile Transformation 111:33
data with available documentation and follow-up interviews and questions. The use of differentresearch methods to answer one research question is considered a valuable practice to improvetransferability [20]. However, this study focuses on an Agile Success Model, so we can not makeany assumptions for non-Agile projects. Moreover, the external drivers played a pivotal role andshaped our Agile Success Model. Whereas ED1 and ED2 may be familiar to most recent large-scaleAgile transformation projects, we have to say that the depicted model may not work in contextswhere time, velocity, security, and cost constraints are not a concern. Although we explicitly referto mission-critical systems, non-critical ones could also benefit from the proposed model since theyface fewer constraints. Thus, we can consider the mission-critical domain as a specific case. Finally,although the reported experience is highly relevant, it is a single-industry and single-organizationstudy.
Dependability. The research process is consistent and reasonably stable over time. Althoughonly one scholar has performed this investigation, this research lasts several years, where continuousfeedback with the project stakeholders and peers helped to understand the work environment,limiting interpretation biases. After the project was finished, we spent about two years reflectingon the qualitative findings, improving our detached interpretation of the subject matter, and gettingfeedback from the key informants whenever needed.
Confirmability. We used an iterative investigation approach, which led to a continuous checkof our coding and observations. The Gioia methodology helped us develop a credible data structure,while data triangulation and observations provided the studied phenomena’ explication. Mixingconcurrent inductive methods provided a more productive and more accurate understanding ofthe subject matter [20]. Our findings’ triangulation reinforced the rigorous interpretation of ourfindings by the newest Grounded Theory recommendations [36].Besides, we discuss statistical conclusion, internal, construct, and external validity to evaluate
the quantitative investigation [135].Internal. To validate our research model, we used a cluster-randomized probability sampling
strategy [42]. So, we did not select the whole world population due to feasibility concerns but onlya cluster of it (i.e., the Prolific community). We acknowledge that compared to random sampling,cluster-sampling is less precise, but it is much more cost-effective compared to other samplingtechniques. Following Baltes and Ralph’s call, which reported that less than 10% of the studiesin software engineering published in top venues use probability sampling [6], we designed ourstudy accordingly. Moreover, data quality was enhanced by a multi-stage process where, fromthe initial 2,897 potential candidates we identified throughout the multi-stage process, only 190carefully selected professionals for this research (about 6.6% of the initial candidates). However, weacknowledge that our sample is not representative of the software engineering population usingAgile methods since almost all of our informants are from the US or Europe.
External. Our findings’ generalization has been the primary concern of the PLS-SEM analysissince sample studies are best tailored for theory generalization [121]. We collected 190 responses,which were a more than adequate size, considering the a priori power study we performed beforeour data collection. Moreover, we performed a Multi-Group Analysis between professionals whodevelopmission-critical and non-mission-critical systems to assess whenever there is any significantdifference between the two populations. Since no significance has been reported, we concludedthat the Agile Success Model is not domain-specific and, thus, generalizable.
Construct. Constructs have been measured through a single-informant approach, representinga software engineer’s perspective. Besides, we only used self-reported measures, asking our infor-mants to state their level of agreement on literature-derived indicators. Also, questions might nothave answered accurately. Thus, to address those limitations, we added three random attentionchecks, in which eleven candidates failed. Moreover, we adapted our measurement instrument
ACM Trans. Softw. Eng. Methodol., Vol. 37, No. 4, Article 111. Publication date: August 2021.

111:34 D. Russo
from pre-existing ones. As a result, only three indicators out of 28 have been discarded from themodel due to their poor loadings. Finally, the questionnaire was randomized and tested for clarityand consistency to deal with potential accuracy biases.
Statistical conclusion. The survey results have been computed through Partial Least Squares –Structural Equation Modelling using a well-known statistical application SmartPLS (3.2.9), whichhas been used in over 1,000 peer-reviewed articles [104]. All statistical procedures and tests usedfor the PLS-SEM analysis follow the most updated guidelines in our field [110].
7 CONCLUSIONSLeading a large-scale Agile transformation to success enables large-scale productivity gains, de-creases time-to-market, and increases product quality. The literature already focused on identifyingsuccess factors; hence, the dynamics among key stakeholders, which leads to project success, wasstill unclear. Although there are some case studies contributions, the generalization of such findingshave never been performed so far. Our investigation had a twofold scope, better understand theinfluence of individual actors of large-scale Agile projects by proposing a theory and generalize thetheoretical research model.Thus, this study used a Mixed-Methods research approach, where we first performed a post-
mortem field study of a large-scale Agile transformation process at a notable Italian mission-critical organization. Through the inductive approach, success factors and their relations havebeen identified. The Gioia methodology, an evolution of Strauss & Corbin’s Grounded Theoryto enhance qualitative rigor, was a valuable tool to identify categories, while field observationsprovided a deep understanding of the organization’s dynamics. Afterward, we run a sample studyof 200 software engineers who worked on a large-scale Agile process. To ensure data quality,we performed a rigorous multi-stage screening process, wherefrom almost 3,000 candidates, wewere able to identify our informants. Data were afterward analyzed using Partial Least Squares -Structural Equation Modeling. Moreover, we also performed a Multi-Group Analysis to broadenthe generalization claims of our research model. Additionally, an Importance-Performance MapAnalysis (IPMA) highlighted the crucial role of developers’ skills for an Agile project’s success.The main result is an Agile Success Model, useful for software managers to set up and effectivelymanage the large-scale Agile transformation of their organization.The Agile Success Model provides a general theory that explains the relations between the
main stakeholders involved in an Agile project. However, more fine-grained theories are neededto understand the internal dynamics of the different stakeholders. Thus, we suggest potentialfuture directions. Since the role of developers is one the most crucial aspects to lead to a softwareproject’s success, more research into Agile teams dynamics is needed. Similarly, identifying thebest strategies to have top management constantly committed is another future challenge. Also,both our field study and sample study focused on large-scale Agile projects. A similar sample studyselecting professionals who work on smaller-sized projects might provide new insights into theAgile Success Model. It would also be insightful to compare our sample with similar ones. Thus, werelease all our quantitative research data openly for future replications.
ONLINE SUPPLEMENTARY MATERIALSThe sample study’s replication package is openly available under a CC-BY 4.0 license at the followingDOI: 10.5281/zenodo.4739364.
ACKNOWLEDGMENTSThis work was partially supported by the Institute of Cognitive Sciences and Technologies ofthe Italian National Research Council (ISTC-CNR); the Italian Inter-University Consortium for
ACM Trans. Softw. Eng. Methodol., Vol. 37, No. 4, Article 111. Publication date: August 2021.

The Agile Success Model: A Mixed Methods Study of a Large-Scale Agile Transformation 111:35
Informatics (CINI); and the Science Foundation Ireland grant 13/RC/2094 & 15/SIRG/3293 and co-funded under the European Regional Development Fund through the Southern & Eastern RegionalOperational Programme to Lero - the Irish Software Research Centre (www.lero.ie). My mostprofound acknowledgment goes to Paolo Ciancarini for his constant support and for providing methe opportunity to pursue this research. The author would like to thank all the informants of theAgency for their time and effort spent in this research. Furthermore, I express my gratitude forthe valuable comments on an earlier version of this paper received from the participants of twoworkshops at NUI Galway and Aalborg University. Also, I would like to thank Klaas-Jan Stol andNiels van Berkel for their feedback on a previous draft.
REFERENCES[1] A. Ahmed, S. Ahmad, N. Ehsan, E. Mirza, and S.Z. Sarwar. 2010. Agile software development: Impact on productivity
and quality. In International Conference on Management of Innovation & Technology. IEEE, 287–291.[2] D. S. Alberts, J. J. Garstka, and F. P. Stein. 2000. Network Centric Warfare: Developing and Leveraging Information
Superiority. Technical Report. DTIC Document.[3] A. Alorwu, N. van Berkel, J. Goncalves, J. Oppenlaender, M. B. Lopez, M. Seetharaman, and S. Hosio. 2020. Crowd-
sourcing Sensitive Data using Public Displays: Opportunities, Challenges, and Considerations. Personal and UbiquitousComputing (2020).
[4] S. W. Ambler and M. Lines. 2012. Disciplined agile delivery: A practitioner’s guide to agile software delivery in theenterprise. IBM Press.
[5] T. Anning-Dorson. 2018. Customer involvement capability and service firm performance: The mediating role ofinnovation. Journal of Business Research 86 (2018), 269–280.
[6] S. Baltes and P. Ralph. 2020. Sampling in Software Engineering Research: A Critical Review and Guidelines.arXiv:2002.07764 (2020).
[7] A. Barcomb, K.-J. Stol, D. Riehle, and B. Fitzgerald. 2019. Why do episodic volunteers stay in FLOSS communities?. InInternational Conference on Software Engineering. IEEE, 948–959.
[8] L. Benedicenti, A. Messina, and A. Sillitti. 2017. iAgile: mission critical military software development. In InternationalConference on High Performance Computing & Simulation. IEEE, 545–552.
[9] B. Boehm. 2002. Get ready for agile methods, with care. Computer 35, 1 (2002), 64–69.[10] B. Boehm and R. Turner. 2005. Management challenges to implementing agile processes in traditional development
organizations. IEEE Software 22, 5 (2005), 30–39.[11] A. Campanelli and F. Parreiras. 2015. Agile methods tailoring–A systematic literature review. Journal of Systems and
Software 110 (2015), 85–100.[12] W. W. Chin. 1998. The partial least squares approach to structural equation modeling. Modern Methods for Business
Research 295, 2 (1998), 295–336.[13] M.-W. Chung and B. Drummond. 2009. Agile at Yahoo! from the trenches. In AGILE Conference. IEEE, 113–118.[14] P. Ciancarini, M. Missiroli, and D. Russo. 2019. Cooperative Thinking: Analyzing a new framework for software
engineering education. Journal of Systems and Software 157 (2019), 110401.[15] J. Cohen. 1988. Statistical Power Analysis for the Behavioral Sciences. Routledge.[16] M. Cohn and D. Ford. 2003. Introducing an agile process to an organization [software development]. Computer 36, 6
(2003), 74–78.[17] M. Conway. 1968. How do committees invent. Datamation 14, 4 (1968), 28–31.[18] J. Corbin and A. Strauss. 1990. Grounded theory research: Procedures, canons, and evaluative criteria. Qualitative
Sociology 13, 1 (1990), 3–21.[19] F. R. Cotugno. 2016. Managing increasing user needs complexity within the ITA Army Agile Framework. In
International Conference in Software Engineering for Defence Applications. Springer, 1–11.[20] J. Creswell. 2013. Research design: Qualitative, quantitative, and mixed methods approaches. Sage.[21] J. Dibbern, T. Goles, R. Hirschheim, and B. Jayatilaka. 2004. Information systems outsourcing: a survey and analysis
of the literature. ACM Sigmis Database 35, 4 (2004), 6–102.[22] K. Dikert, M. Paasivaara, and C. Lassenius. 2016. Challenges and success factors for large-scale agile transformations:
A systematic literature review. Journal of Systems and Software 119 (2016), 87–108.[23] T. Dybå and T. Dingsøyr. 2008. Empirical studies of agile software development: A systematic review. Information
and Software Technology 50, 9-10 (2008), 833–859.[24] A. C. Edmondson and S. E. McManus. 2007. Methodological fit in management field research. Academy of Management
Review 32, 4 (2007), 1246–1264.
ACM Trans. Softw. Eng. Methodol., Vol. 37, No. 4, Article 111. Publication date: August 2021.
111:36 D. Russo
[25] J. R. Edwards and R. P. Bagozzi. 2000. On the nature and direction of relationships between constructs and measures.Psychological Methods 5, 2 (2000), 155.
[26] K. Eisenhardt. 1989. Building theories from case study research. Academy of Management Review 14, 4 (1989), 532–550.[27] K. Eisenhardt and M. Graebner. 2007. Theory building from cases: Opportunities and challenges. The Academy of
Management Journal 50, 1 (2007), 25–32.[28] K. El Emam and A. G. Koru. 2008. A replicated survey of IT software project failures. IEEE Software 25, 5 (2008),
84–90.[29] F. Faul, E. Erdfelder, A. Buchner, and A.G. Lang. 2009. Statistical power analyses using G* Power 3.1: Tests for
correlation and regression analyses. Behavior Research Methods 41, 4 (2009), 1149–1160.[30] D. J. Fernandez and J. D. Fernandez. 2008. Agile project management agilism versus traditional approaches. Journal
of Computer Information Systems 49, 2 (2008), 10–17.[31] D. M. Fetterman. 1998. Ethnography. Sage.[32] B. Fitzgerald and D. Howcroft. 1998. Towards dissolution of the IS research debate: from polarization to polarity.
Journal of Information Technology 13, 4 (1998), 313–326.[33] I. Gat. 2006. How BMC is scaling agile development. In AGILE Conference. IEEE, 6–16.[34] D. Gefen, D. Straub, and M.-C. Boudreau. 2000. Structural equation modeling and regression: Guidelines for research
practice. Communications of the Association for Information Systems 4, 1 (2000), 7.[35] S. Geisser. 1974. A predictive approach to the random effect model. Biometrika 61, 1 (1974), 101–107.[36] D. Gioia, K. Corley, and A. Hamilton. 2013. Seeking qualitative rigor in inductive research: Notes on the Gioia
methodology. Organizational Research Methods 16, 1 (2013), 15–31.[37] D. Gioia, J. Thomas, S. Clark, and K. Chittipeddi. 1994. Symbolism and strategic change in academia: The dynamics of
sensemaking and influence. Organization Science 5, 3 (1994), 363–383.[38] B. Glaser and A. Strauss. 2017. Discovery of grounded theory: Strategies for qualitative research. Routledge.[39] B. G Glaser. 1992. Basics of grounded theory analysis. Vol. 386. Sociology Press.[40] J. H. Goldthorpe. 2000. On sociology: Numbers, narratives, and the integration of research and theory. Oxford University
Press.[41] D. L. Goodhue, W. Lewis, and R. Thompson. 2012. Does PLS have advantages for small sample size or non-normal
data? MIS Quarterly 36, 3 (2012), 981–1001.[42] F. J. Gravetter and L.-A. B. Forzano. 2018. Research methods for the behavioral sciences. Cengage Learning.[43] D. Greening. 2013. Release duration and enterprise agility. In Hawaii International Conference on System Sciences.
IEEE, 4835–4841.[44] E. Guba. 1981. Criteria for assessing the trustworthiness of naturalistic inquiries. Educational Communication and
Technology Journal 29, 2 (1981), 75–91.[45] J. F. Hair Jr, G T. M Hult, C. Ringle, and M. Sarstedt. 2016. A primer on partial least squares structural equation modeling
(PLS-SEM). Sage.[46] J. Hannay, D. Sjoberg, and T. Dyba. 2007. A systematic review of theory use in software engineering experiments.
IEEE Transactions on Software Engineering 33, 2 (2007), 87–107.[47] J. Henseler, C. M. Ringle, and M. Sarstedt. 2015. A new criterion for assessing discriminant validity in variance-based
structural equation modeling. Journal of the Academy of Marketing Science 43, 1 (2015), 115–135.[48] J. Henseler, C. M. Ringle, and R. R. Sinkovics. 2009. The use of partial least squares path modeling in international
marketing. In New challenges to international marketing. Emerald, 277–319.[49] C. A. Higgins, L. E. Duxbury, and R. H. Irving. 1992. Work-family conflict in the dual-career family. Organizational
Behavior and Human Decision Processes 51, 1 (1992), 51–75.[50] J. Highsmith and M. Fowler. 2001. The Agile manifesto. Software Development Magazine 9, 8 (2001), 29–30.[51] R. Hoda, N. Salleh, J. Grundy, and H. Tee. 2017. Systematic literature reviews in agile software development: A tertiary
study. Information and Software Technology 85 (2017), 60–70.[52] S. Hosio, N. van Berkel, J. Oppenlaender, and J. Goncalves. 2020. Crowdsourcing Personalized Weight Loss Diets.
Computer 53, 1 (2020), 63–71.[53] J. Hulland. 1999. Use of partial least squares (PLS) in strategic management research: A review of four recent studies.
Strategic Management Journal (1999), 195–204.[54] L. Isabella. 1990. Evolving interpretations as a change unfolds: How managers construe key organizational events.
Academy of Management Journal 33, 1 (1990), 7–41.[55] M. Jovanović, A. Mas, A.-L. Mesquida, and B. Lalić. 2017. Transition of organizational roles in Agile transformation
process: A grounded theory approach. Journal of Systems and Software 133 (2017), 174–194.[56] D. Karlstrom and P. Runeson. 2005. Combining agile methods with stage-gate project management. IEEE Software 22,
3 (2005), 43–49.
ACM Trans. Softw. Eng. Methodol., Vol. 37, No. 4, Article 111. Publication date: August 2021.
The Agile Success Model: A Mixed Methods Study of a Large-Scale Agile Transformation 111:37
[57] T. R Kayworth and D. E Leidner. 2002. Leadership effectiveness in global virtual teams. Journal of ManagementInformation Systems 18, 3 (2002), 7–40.
[58] M. Khalifa and J. M Verner. 2000. Drivers for software development method usage. IEEE Transactions on EngineeringManagement 47, 3 (2000), 360–369.
[59] U. Kulkarni, S. Ravindran, and R. Freeze. 2006. A knowledge management success model: Theoretical developmentand empirical validation. Journal of Management Information Systems 23, 3 (2006), 309–347.
[60] C. Larman and B. Vodde. 2015. LeSS Framework.[61] G. Lee and W. Xia. 2010. Toward agile: an integrated analysis of quantitative and qualitative field data on software
development agility. MIS Quarterly 34, 1 (2010), 87–114.[62] D. Leffingwell et al. 2015. SAFe–Scaled Agile Framework.[63] T. O. Lehtinen, M. V Mäntylä, J. Vanhanen, J. Itkonen, and C. Lassenius. 2014. Perceived causes of software project
failures–An analysis of their relationships. Information and Software Technology 56, 6 (2014), 623–643.[64] W. Lewis, R. Agarwal, and V. Sambamurthy. 2003. Sources of influence on beliefs about information technology use:
An empirical study of knowledge workers. MIS Quarterly (2003), 657–678.[65] Y. Lincoln and E. Guba. 1985. Naturalistic inquiry. Sage.[66] M. Lindvall et al. 2004. Agile software development in large organizations. Computer 37, 12 (2004), 26–34.[67] J. A. Livermore. 2008. Factors that Significantly Impact the Implementation of an Agile Software Development
Methodology. Journal of Software 3, 4 (2008), 31–36.[68] K. Locke. 1996. Rewriting the discovery of grounded theory after 25 years? Journal of Management Inquiry 5, 3 (1996),
239–245.[69] L. S. Lüscher and M. W. Lewis. 2008. Organizational change and managerial sensemaking: Working through paradox.
Academy of Management Journal 51, 2 (2008), 221–240.[70] R. P. Marble. 2003. A system implementation study: management commitment to project management. Information
& Management 41, 1 (2003), 111–123.[71] S. McDowell and N. Dourambeis. 2007. British Telecom experience report: agile intervention–BT’s joining the dots
events for organizational change. In International Conference on Extreme Programming and Agile Processes in SoftwareEngineering. Springer, 17–23.
[72] A. Messina, F. Fiore, M. Ruggiero, P. Ciancarini, and D. Russo. 2016. A New Agile Paradigm for Mission-CriticalSoftware Development. The Journal of Defense Software Engineering 6 (2016), 25–30.
[73] J. Miles. 2014. Tolerance and Variance Inflation Factor. American Cancer Society.[74] H. Mintzberg. 1978. Patterns in strategy formation. Management Science 24, 9 (1978), 934–948.[75] S. C. Misra, V. Kumar, and U. Kumar. 2010. Identifying some critical changes required in adopting agile practices in
traditional software development projects. International Journal of Quality & Reliability Management 27, 4 (2010).[76] N. B. Moe, T. Dingsøyr, and T. Dybå. 2008. Understanding self-organizing teams in agile software development. In
Australian Conference on Software Engineering. IEEE, 76–85.[77] A. Munns and B. Bjeirmi. 1996. The role of project management in achieving project success. International Journal of
Project Management 14, 2 (1996), 81–87.[78] T. Nagel. 1986. The view from nowhere. Oxford University Press.[79] NATO-RTA. 2004. NATO Code of Best Practice for Command and Control Assessment. Technical Report RTO
TECHNICAL REPORT TR-081. NATO.[80] R. R. Nelson and S. G. Winter. 2009. An evolutionary theory of economic change. Harvard University Press.[81] S. Nerur, R. Mahapatra, and G. Mangalaraj. 2005. Challenges of migrating to agile methodologies. Commun. ACM 48,
5 (2005), 72–78.[82] I. Nonaka. 1994. A dynamic theory of organizational knowledge creation. Organization Science 5, 1 (1994), 14–37.[83] J. Nunnally. 1978. Psychometric methods. McGraw-Hill.[84] M. Paasivaara, B. Behm, C. Lassenius, and M. Hallikainen. 2018. Large-scale agile transformation at Ericsson: a case
study. Empirical Software Engineering 23, 5 (2018), 2550–2596.[85] M. Paasivaara, C. Lassenius, and V. Heikkilä. 2012. Inter-team coordination in large-scale globally distributed scrum:
Do scrum-of-scrums really work?. In International Symposium on Empirical Software Engineering and Measurement.ACM/IEEE, 235–238.
[86] S. Palan and C. Schitter. 2018. Prolific. A subject pool for online experiments. Journal of Behavioral and ExperimentalFinance 17 (2018), 22–27.
[87] D. Paulhus. 1991. Measurement and Control of Response Bias. In Measures of Personality and Social PsychologicalAttitudes. Academic Press.
[88] E. Peer, L. Brandimarte, S. Samat, and A. Acquisti. 2017. Beyond the Turk: Alternative platforms for crowdsourcingbehavioral research. Journal of Experimental Social Psychology 70 (2017), 153–163.
ACM Trans. Softw. Eng. Methodol., Vol. 37, No. 4, Article 111. Publication date: August 2021.
111:38 D. Russo
[89] K. Petersen and C. Wohlin. 2010. The effect of moving from a plan-driven to an incremental software developmentapproach with agile practices. Empirical Software Engineering 15, 6 (2010), 654–693.
[90] J. Piaget. 1967. Logique et connaissance scientifique. Encyclopédie de la Pléiade (1967).[91] J. K. Pinto and J. E. Prescott. 1990. Planning and tactical factors in the project implementation process. Journal of
Management Studies 27, 3 (1990), 305–327.[92] K. Popper. 2005. The logic of scientific discovery. Routledge.[93] D. Port and M. Korte. 2008. Comparative studies of the model evaluation criterions mmre and pred in software cost
estimation research. In International Symposium on Empirical Software Engineering and Measurement. 51–60.[94] M. E Porter. 1997. Competitive strategy. Measuring Business Excellence 1, 2 (1997).[95] C. Prause and Z. Durdik. 2012. Architectural design and documentation: Waste in agile development?. In International
Conference on Software and System Process. IEEE, 130–134.[96] A. Putta, M. Paasivaara, and C. Lassenius. 2019. How Are Agile Release Trains Formed in Practice? A Case Study in a
Large Financial Corporation. In International Conference on Agile Software Development. Springer, 154–170.[97] H. S. Qiu, A. Nolte, A. Brown, A. Serebrenik, and B. Vasilescu. 2019. Going farther together: The impact of social
capital on sustained participation in open source. In International Conference on Software Engineering. IEEE, 688–699.[98] Ragioneria Generale dello Stato. 2013–2018. Bilancio della Difesa. https://www.difesa.it/Amministrazionetrasparente/
bilandife/Pagine/Bilanciopreventivoeconsuntivo.aspx accessed on 07.06.2018.[99] P. Ralph et al. 2020. ACM SIGSOFT Empirical Standards. arXiv preprint arXiv:2010.03525 (2020).[100] M. Ramkumar, T. Schoenherr, S. Wagner, and M. Jenamani. 2019. Q-TAM: A quality technology acceptance model
for predicting organizational buyers’ continuance intentions for e-procurement services. International Journal ofProduction Economics 216 (2019), 333–348.
[101] T. Ravichandran, C. Lertwongsatien, and C. Lertwongsatien. 2005. Effect of information systems resources andcapabilities on firm performance: A resource-based perspective. Journal of Management Information Systems 21, 4(2005), 237–276.
[102] D. Reifer. 2004. Industry software cost, quality and productivity benchmarks. The DoD SoftwareTech News 7, 2 (2004),3–19.
[103] C. M. Ringle and M. Sarstedt. 2016. Gain more insight from your PLS-SEM results: The importance-performance mapanalysis. Industrial Management & Data Systems 116, 9 (2016), 1865–1886.
[104] C. M. Ringle, S. Wende, and J.-M. Becker. 2015. SmartPLS 3.[105] D. Russo, P. Ciancarini, T. Falasconi, and M. Tomasi. 2018. A Meta Model for Information Systems Quality: a
Mixed-Study of the Financial Sector. ACM Transactions on Management Information Systems 9, 3 (2018).[106] D. Russo, P.H.P. Hanel, S. Altnickel, and N. van Berkel. 2021. The Daily Life of Software Engineers during the
COVID-19 Pandemic. In International Conference on Software Engineering.[107] D. Russo, P.H.P. Hanel, S. Altnickel, and N. van Berkel. 2021. Predictors of Well-being and Productivity of Software
Professionals during the COVID-19 Pandemic–A Longitudinal Study. Empirical Software Engineering (2021).[108] D. Russo and K.-J. Stol. 2019. Soft Theory: A Pragmatic Alternative to Conduct Quantitative Empirical Studies. In
Joint International Workshop on Conducting Empirical Studies in Industry and International Workshop on SoftwareEngineering Research and Industrial Practice. IEEE, 1–4.
[109] D. Russo and K.-J. Stol. 2020. Gender Differences in Personality Traits of Software Engineers. IEEE Transactions onSoftware Engineering In Press (2020), 16.
[110] D. Russo and K.-J. Stol. 2021. PLS-SEM for Software Engineering Research: An Introduction and Survey. Comput.Surveys 54, 4 (2021).
[111] D. Russo, G. Taccogna, P. Ciancarini, A. Messina, and G. Succi. 2018. Contracting Agile Developments for MissionCritical Systems in the Public Sector. In International Conference on Software Engineering. ACM.
[112] M. Sarstedt, J. Henseler, and C. Ringle. 2011. Multigroup analysis in partial least squares (PLS) path modeling:Alternative methods and empirical results. In Measurement and Research Methods in International Marketing. Emerald,195–218.
[113] K. Schwaber and J. Sutherland. 2020. The Scrum Guide. Scrum Alliance (2020), 17.[114] B. Selic. 2009. Agile documentation, anyone? IEEE Software 26, 6 (2009), 11–12.[115] G. G. Sharma and K.-J. Stol. 2020. Exploring onboarding success, organizational fit, and turnover intention of software
professionals. Journal of Systems and Software 159 (2020), 110442.[116] Galit Shmueli, Soumya Ray, Juan Manuel Velasquez Estrada, and Suneel Babu Chatla. 2016. The elephant in the room:
Predictive performance of PLS models. Journal of Business Research 69, 10 (2016), 4552–4564.[117] G. Shmueli, M. Sarstedt, J. F. Hair, J Cheah, H. Ting, S. Vaithilingam, and C. M. Ringle. 2019. Predictive model
assessment in PLS-SEM: guidelines for using PLSpredict. European Journal of Marketing 53, 11 (2019).[118] A. Sillitti and G. Succi. 2005. Requirements engineering for agile methods. In Engineering and Managing Software
Requirements. Springer, 309–326.
ACM Trans. Softw. Eng. Methodol., Vol. 37, No. 4, Article 111. Publication date: August 2021.
The Agile Success Model: A Mixed Methods Study of a Large-Scale Agile Transformation 111:39
[119] B. Slife and R. Williams. 1995. What’s Behind the Research?: Discovering Hidden Assumptions in the Behavioral Sciences.Sage.
[120] B. Snyder and B. Curtis. 2017. Using analytics to guide improvement during an Agile–DevOps transformation. IEEESoftware 35, 1 (2017), 78–83.
[121] K.-J. Stol and B. Fitzgerald. 2018. The ABC of software engineering research. ACM Transactions on Software Engineeringand Methodology 27, 3 (2018), 11.
[122] M. Stone. 1974. Cross-validatory choice and assessment of statistical predictions. Journal of the Royal StatisticalSociety. Series B (Methodological) (1974), 111–147.
[123] A. Strauss and J. Corbin. 1990. Basics of qualitative research: Grounded theory procedures and techniques. Sage.[124] A. Strauss and J. Corbin. 1997. Grounded theory in practice. Sage.[125] V. Stray, N. B. Moe, and R. Hoda. 2018. Autonomous agile teams: challenges and future directions for research. In
International Conference on Agile Software Development. 1–5.[126] J. Sutherland. 2001. Agile can scale: Inventing and reinventing Scrum in five companies. Cutter IT Journal 14, 12
(2001), 5–11.[127] D. Talby, A. Keren, O. Hazzan, and Y. Dubinsky. 2006. Agile software testing in a large-scale project. IEEE Software 23,
4 (2006), 30–37.[128] P. E. Tesluk and J. E. Mathieu. 1999. Overcoming roadblocks to effectiveness: Incorporating management of perfor-
mance barriers into models of work group effectiveness. Journal of Applied Psychology 84, 2 (1999), 200.[129] A. Tiwana and E. Mclean. 2005. Expertise integration and creativity in information systems development. Journal of
Management Information Systems 22, 1 (2005), 13–43.[130] J. Van Maanen. 1979. The fact of fiction in organizational ethnography. Administrative Science Quarterly 24, 4 (1979),
539–550.[131] B. Vasilescu, A. Capiluppi, and A. Serebrenik. 2014. Gender, representation and online participation: A quantitative
study. Interacting with Computers 26, 5 (2014), 488–511.[132] VersionOne. 2019. 13th Annual State of Agile Survey. http://stateofagile.versionone.com/.[133] L. M. Wagner, E. Capezuti, and J. C. Rice. 2009. Nurses’ perceptions of safety culture in long-term care settings.
Journal of Nursing Scholarship 41, 2 (2009), 184–192.[134] B. C. Wheeler. 2002. NEBIC: A dynamic capabilities theory for assessing net-enablement. Information Systems
Research 13, 2 (2002), 125–146.[135] C. Wohlin, P. Runeson, M. Höst, M. Ohlsson, B. Regnell, and A. Wesslén. 2012. Experimentation in Software Engineering.
Springer Science & Business Media.[136] R. K. Yin. 1994. Case study research: Design and methods, applied social research. Methods Series 5 (1994).[137] R. Young and E. Jordan. 2008. Top management support: Mantra or necessity? International Journal of Project
Management 26, 7 (2008), 713–725.
ACM Trans. Softw. Eng. Methodol., Vol. 37, No. 4, Article 111. Publication date: August 2021.
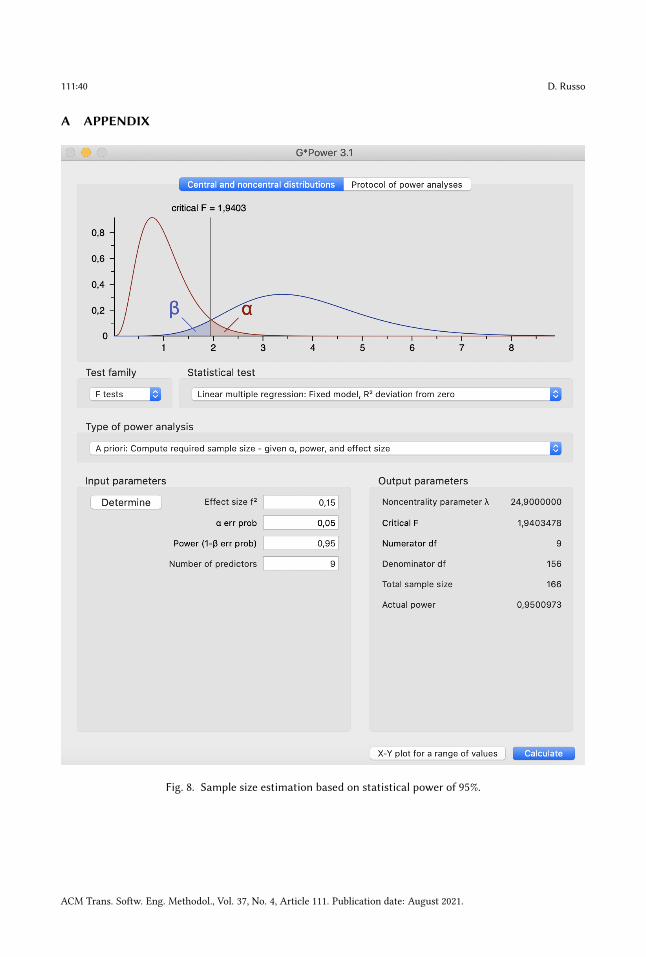
111:40 D. Russo
A APPENDIX
Fig. 8. Sample size estimation based on statistical power of 95%.
ACM Trans. Softw. Eng. Methodol., Vol. 37, No. 4, Article 111. Publication date: August 2021.
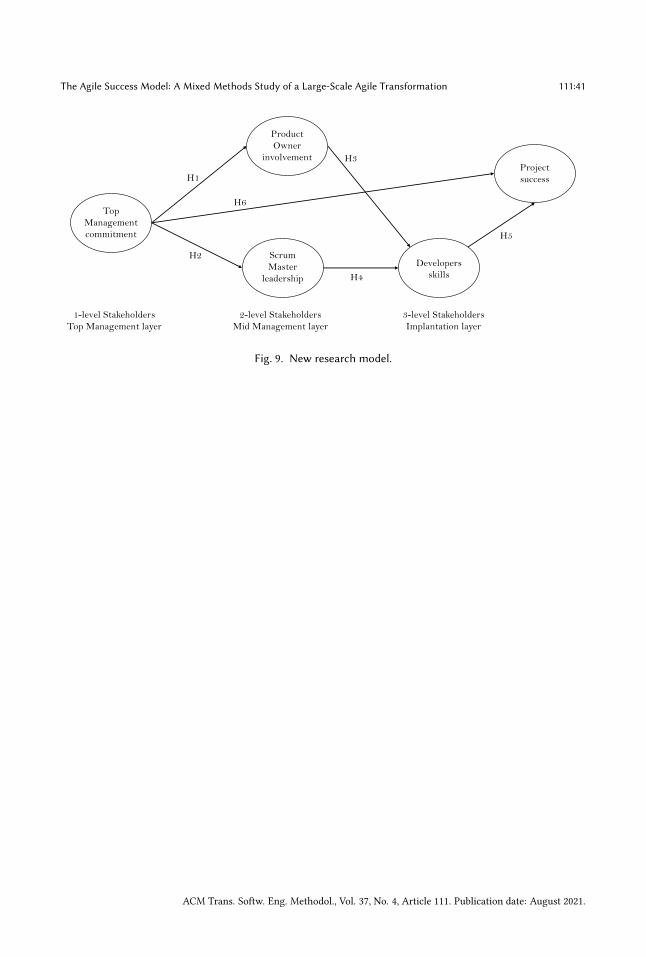
The Agile Success Model: A Mixed Methods Study of a Large-Scale Agile Transformation 111:41
Top Management commitment
Product Owner
involvement
Scrum Master
leadership
Developers skills
Project successH1
H2
H3
H5
H6
H4
1-level StakeholdersTop Management layer
2-level StakeholdersMid Management layer
3-level StakeholdersImplantation layer
Fig. 9. New research model.
ACM Trans. Softw. Eng. Methodol., Vol. 37, No. 4, Article 111. Publication date: August 2021.
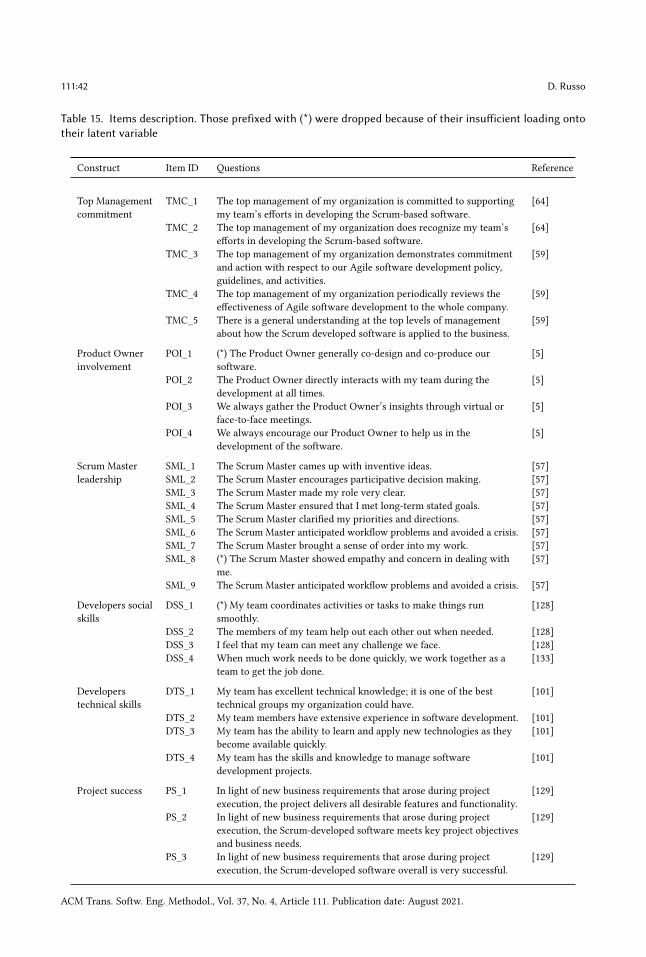
111:42 D. Russo
Table 15. Items description. Those prefixed with (*) were dropped because of their insufficient loading ontotheir latent variable
Construct Item ID Questions Reference
Top Managementcommitment
TMC_1 The top management of my organization is committed to supportingmy team’s efforts in developing the Scrum-based software.
[64]
TMC_2 The top management of my organization does recognize my team’sefforts in developing the Scrum-based software.
[64]
TMC_3 The top management of my organization demonstrates commitmentand action with respect to our Agile software development policy,guidelines, and activities.
[59]
TMC_4 The top management of my organization periodically reviews theeffectiveness of Agile software development to the whole company.
[59]
TMC_5 There is a general understanding at the top levels of managementabout how the Scrum developed software is applied to the business.
[59]
Product Ownerinvolvement
POI_1 (*) The Product Owner generally co-design and co-produce oursoftware.
[5]
POI_2 The Product Owner directly interacts with my team during thedevelopment at all times.
[5]
POI_3 We always gather the Product Owner’s insights through virtual orface-to-face meetings.
[5]
POI_4 We always encourage our Product Owner to help us in thedevelopment of the software.
[5]
Scrum Master SML_1 The Scrum Master cames up with inventive ideas. [57]leadership SML_2 The Scrum Master encourages participative decision making. [57]
SML_3 The Scrum Master made my role very clear. [57]SML_4 The Scrum Master ensured that I met long-term stated goals. [57]SML_5 The Scrum Master clarified my priorities and directions. [57]SML_6 The Scrum Master anticipated workflow problems and avoided a crisis. [57]SML_7 The Scrum Master brought a sense of order into my work. [57]SML_8 (*) The Scrum Master showed empathy and concern in dealing with
me.[57]
SML_9 The Scrum Master anticipated workflow problems and avoided a crisis. [57]
Developers socialskills
DSS_1 (*) My team coordinates activities or tasks to make things runsmoothly.
[128]
DSS_2 The members of my team help out each other out when needed. [128]DSS_3 I feel that my team can meet any challenge we face. [128]DSS_4 When much work needs to be done quickly, we work together as a
team to get the job done.[133]
Developerstechnical skills
DTS_1 My team has excellent technical knowledge; it is one of the besttechnical groups my organization could have.
[101]
DTS_2 My team members have extensive experience in software development. [101]DTS_3 My team has the ability to learn and apply new technologies as they
become available quickly.[101]
DTS_4 My team has the skills and knowledge to manage softwaredevelopment projects.
[101]
Project success PS_1 In light of new business requirements that arose during projectexecution, the project delivers all desirable features and functionality.
[129]
PS_2 In light of new business requirements that arose during projectexecution, the Scrum-developed software meets key project objectivesand business needs.
[129]
PS_3 In light of new business requirements that arose during projectexecution, the Scrum-developed software overall is very successful.
[129]
ACM Trans. Softw. Eng. Methodol., Vol. 37, No. 4, Article 111. Publication date: August 2021.
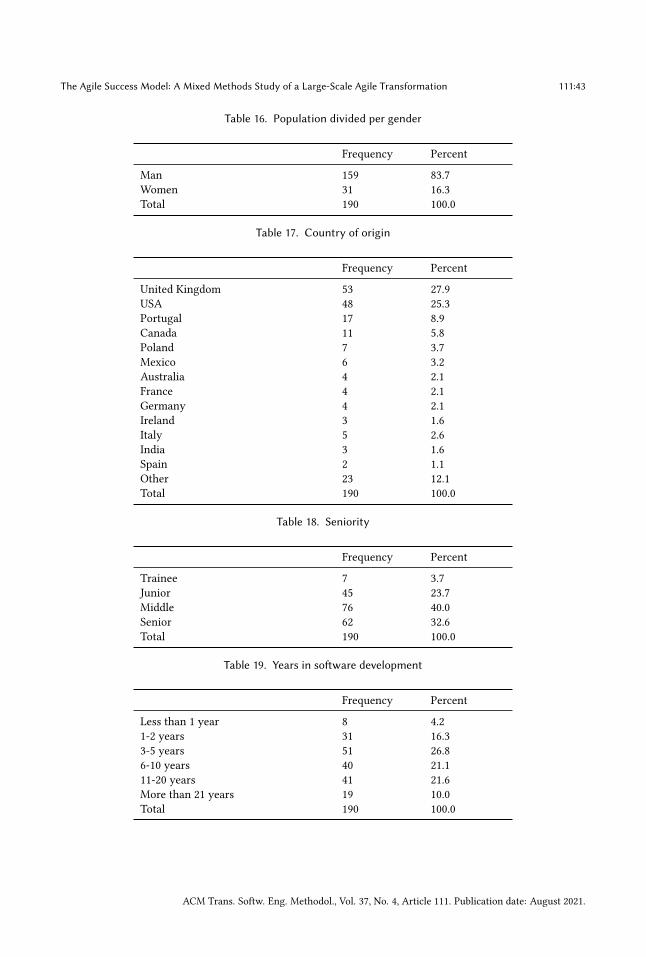
The Agile Success Model: A Mixed Methods Study of a Large-Scale Agile Transformation 111:43
Table 16. Population divided per gender
Frequency Percent
Man 159 83.7Women 31 16.3Total 190 100.0
Table 17. Country of origin
Frequency Percent
United Kingdom 53 27.9USA 48 25.3Portugal 17 8.9Canada 11 5.8Poland 7 3.7Mexico 6 3.2Australia 4 2.1France 4 2.1Germany 4 2.1Ireland 3 1.6Italy 5 2.6India 3 1.6Spain 2 1.1Other 23 12.1Total 190 100.0
Table 18. Seniority
Frequency Percent
Trainee 7 3.7Junior 45 23.7Middle 76 40.0Senior 62 32.6Total 190 100.0
Table 19. Years in software development
Frequency Percent
Less than 1 year 8 4.21-2 years 31 16.33-5 years 51 26.86-10 years 40 21.111-20 years 41 21.6More than 21 years 19 10.0Total 190 100.0
ACM Trans. Softw. Eng. Methodol., Vol. 37, No. 4, Article 111. Publication date: August 2021.
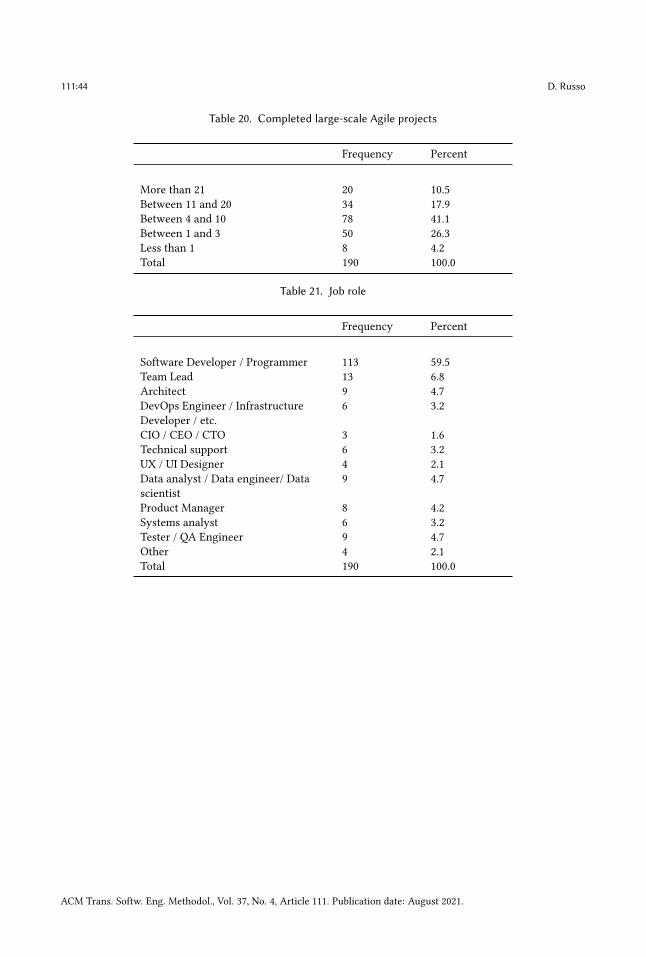
111:44 D. Russo
Table 20. Completed large-scale Agile projects
Frequency Percent
More than 21 20 10.5Between 11 and 20 34 17.9Between 4 and 10 78 41.1Between 1 and 3 50 26.3Less than 1 8 4.2Total 190 100.0
Table 21. Job role
Frequency Percent
Software Developer / Programmer 113 59.5Team Lead 13 6.8Architect 9 4.7DevOps Engineer / InfrastructureDeveloper / etc.
6 3.2
CIO / CEO / CTO 3 1.6Technical support 6 3.2UX / UI Designer 4 2.1Data analyst / Data engineer/ Datascientist
9 4.7
Product Manager 8 4.2Systems analyst 6 3.2Tester / QA Engineer 9 4.7Other 4 2.1Total 190 100.0
ACM Trans. Softw. Eng. Methodol., Vol. 37, No. 4, Article 111. Publication date: August 2021.
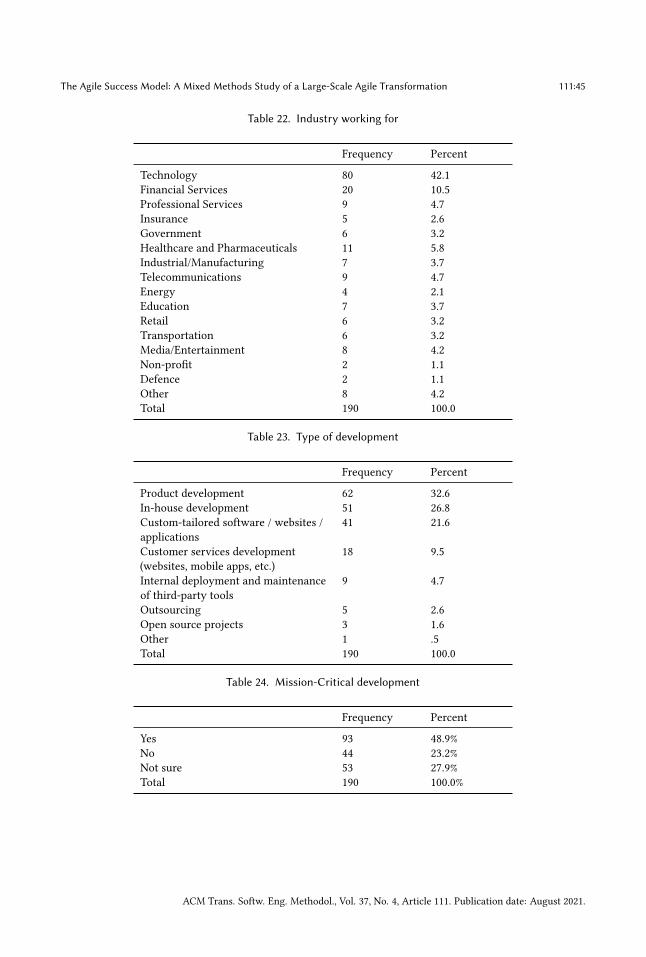
The Agile Success Model: A Mixed Methods Study of a Large-Scale Agile Transformation 111:45
Table 22. Industry working for
Frequency Percent
Technology 80 42.1Financial Services 20 10.5Professional Services 9 4.7Insurance 5 2.6Government 6 3.2Healthcare and Pharmaceuticals 11 5.8Industrial/Manufacturing 7 3.7Telecommunications 9 4.7Energy 4 2.1Education 7 3.7Retail 6 3.2Transportation 6 3.2Media/Entertainment 8 4.2Non-profit 2 1.1Defence 2 1.1Other 8 4.2Total 190 100.0
Table 23. Type of development
Frequency Percent
Product development 62 32.6In-house development 51 26.8Custom-tailored software / websites /applications
41 21.6
Customer services development(websites, mobile apps, etc.)
18 9.5
Internal deployment and maintenanceof third-party tools
9 4.7
Outsourcing 5 2.6Open source projects 3 1.6Other 1 .5Total 190 100.0
Table 24. Mission-Critical development
Frequency Percent
Yes 93 48.9%No 44 23.2%Not sure 53 27.9%Total 190 100.0%
ACM Trans. Softw. Eng. Methodol., Vol. 37, No. 4, Article 111. Publication date: August 2021.