the agglomeration of us ethnic inventors files/09-003_16344029-8293-41d8... · the agglomeration of...
TRANSCRIPT

09-003
Copyright © 2008 by William R. Kerr
Working papers are in draft form. This working paper is distributed for purposes of comment and discussion only. It may not be reproduced without permission of the copyright holder. Copies of working papers are available from the author.
The Agglomeration of US Ethnic Inventors William R. Kerr

The Agglomeration of US Ethnic Inventors
William R. Kerr�Harvard Business School
Boston MA
16 July 2008HBS Working Paper 09-003
Abstract
The ethnic composition of US inventors is undergoing a signi�cant transformation �with deep impacts for the overall agglomeration of US innovation. This study applies anethnic-name database to individual US patent records to explore these trends with greaterdetail. The contributions of Chinese and Indian scientists and engineers to US technologyformation increase dramatically in the 1990s. At the same time, these ethnic inventorsbecame more spatially concentrated across US cities. The combination of these two factorshelps stop and reverse long-term declines in overall inventor agglomeration evident in the1970s and 1980s. The heightened ethnic agglomeration is particularly evident in industrypatents for high-tech sectors, and similar trends are not found in institutions constrainedfrom agglomerating (e.g., universities, government).
JEL Classi�cation: F15, F22, J44, J61, O31.
Key Words: Agglomeration, Innovation, Research and Development, Patents, Scien-tists, Engineers, Inventors, Ethnicity, Immigration.
�Comments are appreciated and can be sent to [email protected]. This paper is a forthcoming book chapter inthe Economics of Agglomeration edited by Ed Glaeser. I am grateful to William Lincoln and Debbie Strumskyfor data assistance. I thank Ed Glaeser, Je¤ Furman, and participants in the Economics of Agglomerationconferences for helpful comments and research ideas. This research is supported by Harvard Business School,the National Science Foundation, the Innovation Policy and the Economy Group, and the MIT George SchultzFund.
1

1 Introduction
Economists have long been interested in agglomeration and innovation. In his seminal outline ofthe core rationales for industrial clusters, Marshall (1920) emphasized the theory of intellectualspillovers by arguing that in agglomerations, "the mysteries of the trade become no mystery,but are, as it were, in the air." Workers can learn skills quickly from each other in an industrialcluster, and this proximity can speed the adoption of new technologies or best practices. Glaeserand Kahn (2001) argue that the urbanization of high human-capital industries, like �nance, isevidence for the role that density plays in the transfer of ideas, and studies of patent citationshighlight the importance of local proximity for scienti�c exchanges (e.g., Ja¤e et al. 1992,Thompson and Fox-Kean 2006). Moreover, evidence suggests that agglomeration increases therate of innovation itself. Saxenian (1994) describes how entrepreneurial �rms locate near oneanother in Silicon Valley to foster new technology development. Carlino et al. (2006) show thathigher urban employment density is correlated with greater patenting per capita within cities.
Strong quantitative assessments of the magnitudes and characteristics of intellectual spilloversand agglomeration are essential. Such studies inform business managers of the advantages andcosts for locating in areas that are rich in ideas but most likely come with higher rents andwages as well. Moreover, these studies are important for understanding short-run and long-runurban growth and development. They help inform whether industrial specialization or diversitybetter foster regional development (e.g., Jacobs 1970, Glaeser et al. 1992, Henderson et al.1995, Duranton and Puga 2001, Duranton 2007) and the role of local knowledge developmentand externalities in generating sustained growth (e.g., Romer 1986, 1990, Furman et al. 2002).Rosenthal and Strange (2003) note that intellectual spillovers are strongest at the very locallevels of proximity.1
This study contributes to our empirical understanding of agglomeration and innovation bydocumenting patterns in the city-level agglomeration of ethnic inventors (e.g., Chinese, Indian)within the US from 1975 through 2007. The contributions of these immigrant groups to UStechnology formation are staggering: while foreign-born account for just over 10% of the USworking population, they represent 25% of the US science and engineering (SE) workforce andnearly 50% of those with doctorates. Even looking within the Ph.D. level, ethnic researchersmake exceptional contributions to science as measured by Nobel Prizes, elections to the NationalAcademy of Sciences, patent citation counts, and so on.2 Recent work relates immigration andgrowth in US invention (e.g., Peri 2007, Hunt 2008, Kerr and Lincoln 2008). Moreover, ethnic
1Several studies assess the relative importance of intellectual spillovers versus other rationales for industrialagglomeration (e.g., lower transportation costs, labor market pooling). Representative papers include Audretschand Feldman (1996), Rosenthal and Strange (2001), Henderson (2003), and Ellison et al. (2007). Porter (1990)emphasizes how vertically related industries may co-locate for knowledge sharing.
2For example, Stephan and Levin (2001), Burton and Wang (1999), Johnson (1998, 2001), and Streeter (1997).
1

entrepreneurs are very active in commercializing new technologies, especially in high-tech sectors(e.g., Saxenian 2002a, Wadhwa et al. 2007).
The spatial distribution of ethnic inventors across US cities, however, is far from random.Immigrants tend to concentrate in certain US cities, often the largest ones that o¤er the greatestopportunities for assimilation. Geographical distances of cities to home countries and past im-migration networks are also important for location decisions.3 The study of US ethnic inventorsis thus very important given 1) the disproportionate contributions of immigrant researchers and2) their non-random spatial distribution across the US. Such a characterization is necessaryfor understanding the geography of US innovation and economic growth. Moreover, the spatialvariation of immigrant researchers across cities allows for stronger quantitative assessments ofthe role of innovation in city growth. This paper is a �rst step in this direction.
Econometric studies quantifying the role of ethnic scientists and engineers for technologyformation and di¤usion are often hampered, however, by data constraints. It is very di¢ cultto assemble su¢ cient cross-sectional and longitudinal variation for large-scale panel exercises.4
This paper describes a new approach for quantifying the ethnic composition of US inventorswith previously unavailable detail. The technique exploits the inventor names contained onthe micro-records for all patents granted by the United States Patent and Trademark O¢ ce(USPTO) from January 1975 to April 2007.5 Each patent record lists one or more inventors,with 7.5 million inventor names associated with the 4.3 million patents. The USPTO grantspatents to inventors living within and outside of the US, with each group accounting for abouthalf of patents over the 1975-2007 period.
This study maps into these inventor names an ethnic-name database typically used for com-mercial applications. This approach exploits the idea that inventors with the surnames Changor Wang are likely of Chinese ethnicity, those with surnames Rodriguez or Martinez of Hispanicethnicity, and so on. The match rates are 92%-98% for US domestic inventor records, depend-ing upon the procedure employed, and the process a¤ords the distinction of nine ethnicities:Chinese, English, European, Hispanic/Filipino, Indian/Hindi, Japanese, Korean, Russian, andVietnamese. Moreover, because the matching is done at the micro-level, greater detail on theethnic composition of inventors is available annually on multiple dimensions: technologies, cities,companies, and so on. Section 2 describes this data development in greater detail.
3For example, Borjas (1994), Friedberg and Hunt (1995), Freeman (2006), and Kerr and Kerr (2008).4While the decennial Census provides detailed cross-sectional descriptions, its longitudinal variation is neces-
sarily limited. The annual Current Population Survey, however, provides poor cross-sectional detail and does notask immigrant status until 1994. The SESTAT database o¤ers a better trade-o¤ between the two dimensions,but su¤ers important sampling biases with respect to immigrants (Kannankutty and Wilkinson 1999).
5The project initially employed the NBER Patent Data File, compiled by Hall et al. (2001), that includespatents granted by the USPTO from January 1975 to December 1999. The current version now employs anextended version developed by HBS Research that includes patents granted through early 2007.
2

Section 3 then documents the growing contribution of ethnic inventors to US technologyformation. The rapid increase during the 1990s in the share of high-tech patents granted toChinese and Indian inventors is particularly striking. This section also uses the patenting data tocalculate concentration indices for US innovation. Ethnic inventors have higher levels of spatialconcentration than English inventors throughout the thirty-year period studied. Moreover, thespatial concentration of ethnic inventors increases signi�cantly from 1995 to 2004, especially inhigh-tech sectors like computer-related patenting. The combination of greater ethnic sharesand increasing agglomeration of ethnic inventors helps stop and reverse the 1975-1994 declinesin the overall concentration of US invention. These trends are con�ned to industrial patents;universities and government bodies � that are constrained from agglomerating � do not showrecent increases in spatial clustering.
The �nal section concludes. The higher agglomeration of immigrants in cities and occu-pations has long been noted. For example, Mandor¤ (2007) highlights how immigrant en-trepreneurs tend to agglomerate in selected industries, a process that increases their businessimpact for speci�c sectors. Examples within the US are Korean entrepreneurs in dry cleaning,Vietnamese in nail salons, Gujarati Indians in traveler accommodations, Punjabi Indians in gasstations, Greeks in restaurants, and so on. The higher natural social interactions among theseethnic groups aid in the acquisition and transfer of sector-speci�c skills; scale economies lead tooccupational clustering by minority ethnic groups.
To date, there has been very little work, theoretically or empirically, on the agglomerationof US ethnic scientists and engineers with the notable exception of Agrawal et al. (2007).6
This scarcity of research is disappointing given the scale of these ethnic contributions and theimportance of innovation to regional economic growth. Moreover, the large shifts in ethnicinventor populations, often driven in part by US immigration restrictions, may provide empiricalfootholds for testing agglomeration theories in a natural experiment framework. It is hoped thatthe empirical platform developed in this study provides a foothold for furthering such analyses.
2 Ethnic-Name Matching Technique
This section describes the ethnic-name matching strategy, outlines the strengths and weaknessesof the name database selected, and o¤ers some validation exercises using patent records �led byforeign inventors with the USPTO. Kerr (2007) further describes the name-matching process,
6Agrawal et al. (2007) jointly examine knowledge di¤usion through co-location and co-ethnicity using domesticpatent citations made by Indian inventors living in the US. While being in the same city or the same ethnicityboth encourage knowledge di¤usion, their estimations suggest that the marginal bene�t of co-location is fourtimes larger for inventors of di¤erent ethnicities. This substitutability between social and geographic proximitycan create di¤erences between a social planner�s optimal distribution of ethnic members and what the inventorsthemselves would choose.
3
the international name distribution technique, and the apportionment of non-unique matchesthat are highlighted below.
2.1 Melissa Ethnic-Name Database and Name-Matching Technique
The ethnic-name database employed in this study was originally developed by the Melissa DataCorporation for use in direct-mail advertisements. Ethnic-name databases su¤er from two inher-ent limitations � not all ethnicities are covered and included ethnicities usually receive unequaltreatment. The strength of the Melissa database is in the identi�cation of Asian ethnicities,especially Chinese, Indian/Hindi, Japanese, Korean, Russian, and Vietnamese names. Thedatabase is comparatively weaker for looking within continental Europe. For example, Dutchsurnames are collected without �rst names, while the opposite is true for French names. TheAsian comparative advantage and overall cost e¤ectiveness led to the selection of the Melissadatabase, as well as the European amalgamation employed in the matching technique. In total,nine ethnicities are distinguished: Chinese, English, European, Hispanic/Filipino, Indian/Hindi,Japanese, Korean, Russian, and Vietnamese.7
The second limitation is that commercial databases vary in the number of names they containfor each ethnicity. These di¤erences re�ect both uneven coverage and that some ethnicities aremore homogeneous in their naming conventions. For example, the 1975 to 1999 Her�ndahlindices of foreign inventor surnames for Korean (0.047) and Vietnamese (0.112) are signi�cantlyhigher than Japanese (0.013) and English (0.016) due to frequent Korean surnames like Kim(16%) and Park (12%) and Vietnamese surnames like Nguyen (29%) and Tran (12%).
Two polar matching strategies are employed to ensure coverage di¤erences do not overlyin�uence ethnicity assignments.
Full Matching: This procedure utilizes all of the name assignments in the Melissadatabase and manually codes any unmatched surname or �rst name associated with100 or more inventor records. This technique further exploits the internationaldistribution of inventor names within the patent database to provide superior results.The match rate for this restricted procedure is 97% (98% US, 97% foreign). Thisrate should be less than 100% with the Melissa database as not all ethnicities areincluded.
Restricted Matching: A second strategy employs a uniform name database usingonly the 3000 and 200 most common surnames and �rst names, respectively, for each
7The largest ethnicity in the US SE workforce absent from the ethnic-name database is Iranian, which ac-counted for 0.7% of bachelor-level SEs in the 1990 Census.
4

ethnicity. These numerical bars are the lowest common denominators across themajor ethnicities studied. The match rate for this restricted procedure is 88% (92%US, 86% foreign).
For matching, names in both the patent and ethnic-name databases are capitalized and truncatedto ten characters. Approximately 88% of the patent name records have a unique surname, �rstname, or middle name match in the Full Matching procedure (77% in the Restricted Matching),a¤ording a single ethnicity determination with priority given to surname matches. For inventorsresiding in the US, representative probabilities are assigned to non-unique matches using themasters-level SE communities in Metropolitan Statistical Areas (MSAs). Ethnic probabilitiesfor the remaining 3% of records (mostly foreign) are calculated as equal shares.
2.2 Inventors Residing in Foreign Countries and Regions
Visual con�rmation of the top 1000 surnames and �rst names in the USPTO records con�rms thename-matching technique works well. The appendix documents the �fty most common surnamesof US-based inventors for each ethnicity, along with their relative contributions. While someinventors are certainly misclassi�ed, the measurement error in aggregate trends building fromthe micro-data is minor. The Full Matching procedure is the preferred technique and underliesthe trends presented in the next section, but most applications �nd negligible di¤erences whenthe Restricted Matching dataset is employed instead.
The application of the ethnic-name database to the inventors residing outside of the USprovides a natural quality-assurance exercise for the technique. Inventions originating outsidethe US account for just under half of USPTO patents, with applications from Japan comprisingabout 48% of this foreign total. The appendix documents the results of applying the ethnic-matching procedures for countries and regions grouped to the ethnicities identi�able with thedatabase. The results are very encouraging. First, the Full Matching procedure assignsethnicities to a large percentage of foreign records, with the match rates greater than 93% forall countries but India (84%). In the Restricted Matching procedure, a matching rate of greaterthan 73% holds for all regions.
Second, the estimated inventor compositions are reasonable. The weighted average is 86%in the Full Matching procedure, and own-ethnicity contributions are greater than 80% in theUK, China, India, Japan, Korea, and Russia regardless of the matching procedure employed.Like the US, own-ethnicity contributions should be less than 100% due to foreign researchers.The high success rate using the Restricted Matching procedure indicates that the ethnic-namedatabase performs well without exploiting the international distribution of names, although
5

power is lost with Europe. Likewise, uneven coverage in the Melissa database is not driving theethnic composition trends.
2.3 Advantages and Disadvantages of Name-Matching Technique
The matched records describe the ethnic composition of US scientists and engineers with previ-ously unavailable detail: incorporating the major ethnicities working in the US SE community;separating out detailed technologies and manufacturing industries; providing metropolitan andstate statistics; and providing annual metrics. Moreover, the assignment of patents to cor-porations and institutions a¤ords �rm-level and university-level characterizations that are nototherwise possible (e.g., the ethnic composition of IBM�s inventors �ling computer patents fromSan Francisco in 1985). The next section studies the agglomeration of invention along thesevarious dimensions.8
The ethnic-name procedure does, however, have two potential limitations for empirical workon agglomeration that should be highlighted. First, the approach does not distinguish foreign-born ethnic researchers in the US from later generations working as SEs. The procedure canonly estimate total ethnic SE populations, and concentration levels are to some extent measuredwith time-invariant error due to the name-matching approach. The resulting data are verypowerful, however, for panel econometrics that employ changes in these ethnic SE populationsfor identi�cation. Moreover, Census and INS records con�rm Asian changes are primarily dueto new SE immigration for this period, substantially weakening this concern when examiningthese groups.
The name-matching technique also does not distinguish �ner divisions within the nine majorethnic groupings. For some analyses (e.g., network ties), it would be advantageous to separateMexican from Chilean scientists within the Hispanic ethnicity, to distinguish Chinese engineerswith ethnic ties to Taipei versus Beijing versus Shanghai, and so on. These distinctions are notpossible with the Melissa database, and researchers should understand that measurement errorfrom the broader ethnic divisions may bias their estimated coe¢ cients downward dependingupon the application. Nevertheless, the upcoming sections demonstrate how the deep variationavailable with the ethnic patenting data provides a rich description of US ethnic invention.
3 The Agglomeration of US Ethnic Invention
This section starts by describing the broad trends in ethnic contributions to US technologyformation. The spatial concentration of ethnic invention is then closely analyzed, including
8Sample applications are Kerr (2008a,b), Kerr and Lincoln (2008), and Foley and Kerr (2008).
6
variations by technology categories and institutions.
3.1 Ethnic Composition of US Inventors
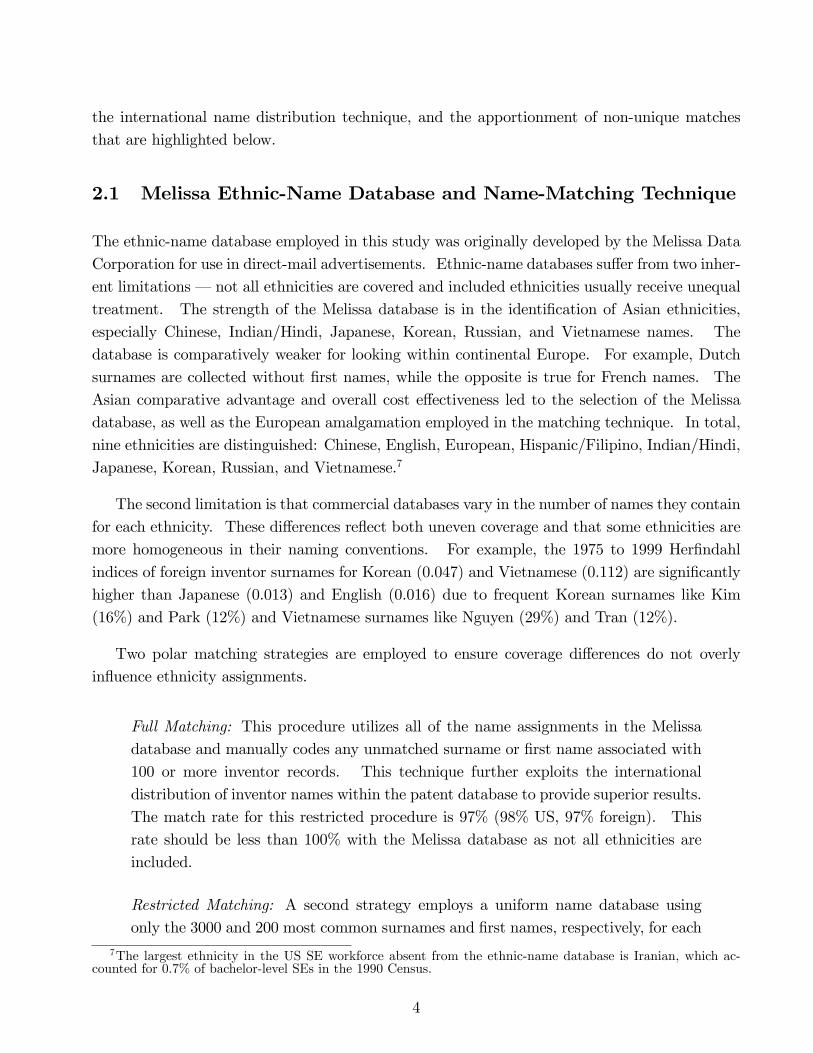
Table 1 describes the ethnic composition of US inventors for 1975-2004, with granted patentsgrouped by application years. The trends demonstrate a growing ethnic contribution to UStechnology development, especially among Chinese and Indian scientists. Ethnic inventors aremore concentrated in high-tech industries like computers and pharmaceuticals and in gatewaycities relatively closer to their home countries (e.g., Chinese in San Francisco, European in NewYork, and Hispanic in Miami). The �nal three rows demonstrate a close correspondence of theestimated ethnic composition to the country-of-birth composition of the US SE workforce in the1990 Census. The estimated European contribution in Table 1 is naturally higher than theimmigrant contribution measured by foreign born.
Figure 1 illustrates the evolving ethnic composition of US inventors from 1975-2004. Theomitted English share declines from 83% to 72% during this period. Looking across all technol-ogy categories, the European ethnicity is initially the largest foreign contributor to US technologydevelopment. Like the English ethnicity, however, the European share of US domestic inventorsdeclines steadily from 8% in 1975 to 6% in 2004. This declining share is partly due to theexceptional growth over the thirty years of the Chinese and Indian ethnicities, which increasefrom under 2% to 8% and 4%, respectively. As shown below, this Chinese and Indian growth isconcentrated in high-tech sectors, where Chinese inventors supplant European researchers as thelargest ethnic contributor to US technology formation. The Indian ethnic contribution declinessomewhat after 2000.9
Among the other ethnicities, the Hispanic contribution grows from 3% to 5% from 1975 to2004. The level of this series is likely mismeasured due to the extensive overlap of Hispanic andEuropean names, but the positive growth is consistent with stronger Latino and Filipino scienti�ccontributions in Florida, Texas, and California. The Korean share increases dramatically from0.3% to 1.3% over the thirty years, while the Russian climbs from 1.3% to 2.2%. Althoughdi¢ cult to see with Figure 1�s scaling, much of the Russian increase occurs in the 1990s followingthe dissolution of the Soviet Union. The Japanese share steadily increases from 0.5% to 1.2%.Finally, while the Vietnamese contribution is the lowest throughout the sample, it does exhibitthe strongest relative growth from 0.1% to 0.7%.
The 1975-2004 statistics employ patents granted by the USPTO through March 2007. Dueto the long and uneven USPTO review process, statistics are grouped by application year to
9This decline is mostly due to changes within the computer technology sector as seen below. Recent applica-tions to the USPTO suggest the Indian trend may not have declined as much as the granted patents through early2007 portray. Kerr and Lincoln (2008) investigate the role of H-1B visa reforms for explaining these patterns.
7

construct the most accurate indicators of when inventive activity occurs. The unfortunateconsequence of using application years, however, is substantial attrition in years immediatelybefore 2007. As many patents are in the review process but have yet to be granted, the grantedpatent series is truncated at the 2004 application year. The USPTO began publishing patentapplications in 2001. These applications data also show comparable ethnic contributions.
3.2 Spatial Locations of US Ethnic Inventors
Table 2 examines the 1975-2004 ethnic inventor contributions by major MSAs. A total of283 MSAs are identi�ed from inventors�city names using city lists collected from the O¢ ce ofSocial and Economic Data Analysis at the University of Missouri, with a matching rate of 99%.Manual coding further ensures all patents with more than 100 citations and all city names withmore than 100 patents are identi�ed. The �rst four columns document each MSA�s share of USpatenting. Not surprisingly, these shares are highly correlated with MSA size, with the threelargest patenting centers for 1995-2004 found in San Francisco (12%), New York (7%), and LosAngeles (6%), where the percentages indicate US domestic patent shares.
Comparing these total patenting percentages with the ethnic patenting shares, listed in thesecond set of four columns, reveals the more interesting fact that ethnic patenting is moreconcentrated than general innovation. The 1995-2004 ethnic patent shares of San Francisco,New York, and Los Angeles are 19%, 10%, and 8%, respectively. Similarly, 80% of ethnicresearch occurs in the major MSAs listed in Table 2, compared to 72% of total patenting. The�nal three columns list the Chinese patenting share by MSA, highlighting the exceptional growthof San Francisco from 10% of 1975-1984 patenting to 28% in 1995-2004. These concentrationlevels and trends are further examined below.10
Table 3 presents simple least squares estimations of ethnic inventor locations and MSA char-acteristics. The variables of interest are MSA shares of US ethnic inventors during 1985-2004,with column headers indicating ethnicities. These shares are calculated over the 244 MSAs forwhich full covariate information are assembled. The dropped observations are small cities notseparately identi�ed in 1990 Census of Population. For ease of interpretation, variables aretransformed to have unit standard deviation in these cross-sectional estimations. Estimationsare weighted by MSA populations.
To establish a baseline, the �rst two columns consider MSA inventor shares of the Englishethnicity. In Column 1, MSA size and urban density strongly predict higher English inventor
10Each of these trends appears to have strengthened in the recent applications data (i.e., the columns markedwith A in Table 2). While suggestive, these statistics should be treated with caution. Some technology �eldsand �rm types are more likely to publish their patent applications than others. Likewise, probabilities of patentgrants conditional on application vary by �eld. Lemley and Sampat (2007) discuss these limitations further.
8

shares. A one standard-deviation increase in the population share of the MSA correlates witha 0.57 standard-deviation increase in the share of English ethnic invention. Coastal access doesnot predict greater inventor concentration in multi-variate frameworks, although a univariatecorrelation exists. On the other hand, MSA demographics have a statistically and economicallysigni�cant relationship with inventor concentrations. The MSA traits are calculated from the1990 Census of Population. MSAs with more-educated workforces are associated with greaterinventor concentrations. Higher shares of English invention are also found in MSAs with rela-tively more people between the ages of 30 and 60 (the omitted group) and more men. All told,this parsimonious set of covariates explains 84% of the variation in English invention shares.
Table 2 suggests that inventor shares are relatively persistent over time for MSAs. Column 2of Table 3 con�rms this observation for English inventors. The estimation incorporates the shareof English ethnic patenting in the MSA for 1975-1984. This ten-year period pre-dates the majorgrowth in ethnic inventors highlighted in Figure 1. The spatial distribution of English inventionover 1975-1984 is a very strong predictor for 1985-2004 concentration with an elasticity of 0.84.MSA populations and density levels do not exhibit a well-measured relationship with 1985-2004 English inventor concentrations after controlling for these past levels. Partial correlationswith MSA demographics, however, are more robust. Incorporating the past concentration lagexplains 88% of the MSA-level variation in inventor shares (83% by itself).11
The subsequent eight columns of Table 3 consider major non-English inventor shares. Theestimation framework remains the same excepting the 1975-1984 MSA inventor shares in theeven-numbered columns that are adjusted to match the dependent variable. Most explana-tory variables (e.g., MSA demographics) demonstrate similar elasticities across ethnic groups.Coastal access tends to be more important, although of borderline statistical signi�cance. Thisre�ects the well-known tendency for immigrants to locate in port cities closer to their homecountries.
Several interesting di¤erences, however, emerge. First, the overall explanatory power of theseregressors varies across ethnic groups. The R2 values for the Chinese and Indian ethnicities aresubstantially lower than those for the European and Hispanic ethnicities. These Asian ethnicitiesthus have more idiosyncratic spatial patterns than this limited set of covariates modelled. This iscon�rmed when the even-numbered columns incorporate the lagged ethnic inventor shares. Thegain in the variation explained through past MSA-speci�c placements is strongest for Chineseand Indian inventors. This strength suggests that lagged spatial patterns for Asian inventorsmay o¤er an empirical foothold for predicting future MSA-level innovation even conditional onother MSA-level traits.11Unreported speci�cations further incorporate mean wages in manufacturing, mean family income levels,
and mean housing prices by MSA. Positive correlations between inventor shares and manufacturing wages aregenerally found; family income levels and housing prices do not exhibit robust relationships in multi-variatesettings. The inclusion of these three covariates has very limited in�uence on the reported outcomes.
9

These even-numbered columns also show that lagged ethnic inventor shares tend to haveweaker predictive power for subsequent MSA-level concentration compared to the English eth-nicity in Column 2. The elasticities range from 0.87 for Chinese patents to 0.53 for Hispanicpatents (which is lowest among the nine ethnic inventor groups). This lower explanatory powerhas at least two explanations. First, spatial distributions for ethnic inventors over 1975-1984may have greater measurement error than English inventor distributions due to smaller countsof relevant patents. Such measurement error would downward bias estimated elasticities.
Nonetheless, it is also true that ethnic inventors facilitate shifts in invention locations acrossUS MSAs. For example, immigrant SE students graduating from elite US universities enter anational labor market. Hispanic inventors have supported broader growth in Florida and thesouthwestern states. While past immigration cities are favored, ethnic inventors also have aninherent capacity to facilitate regional adjustments. Unreported estimations further test thisconclusion by controlling simultaneously for each MSA�s 1975-1984 English inventor share andethnic-speci�c inventor share. With the exception of the European and Russian ethnicities,lagged ethnic spatial distributions have stronger predictive power for subsequent agglomerationthan lagged English spatial distributions.
Table 4 repeats the estimations without the MSA population weights. The measured partialcorrelations decline in magnitude somewhat, re�ective of the greater attention paid to smallerMSA shares, but the patterns of coe¢ cients and explanatory power are comparable to theweighted outcomes. Several additional speci�cation checks are also undertaken. Incorporatingregional �xed e¤ects �nds anticipated spatial patterns � Midwestern US MSAs tend to havehigher invention rates conditional on the covariates modelled, while southern MSAs have lowerrates. The east and west coasts are often not statistically distinguishable from each otherconditionally. Performing the share estimations on an annual basis, which circumvents growth inrecent patent application rates, yields similar outcomes to the cross-sectional results. Likewise,log speci�cations produce outcomes similar to the share speci�cation framework.
Of course, these estimations must be interpreted as partial correlations rather than causalassessments. Clearly, ethnic inventors directly in�uence many of the determinants modelled(e.g., education shares) and may also have local spillover e¤ects through their work (e.g., localtechnology gains that generate city population growth). Future work hopes to further re�nethese determinants in a causal assessment.
Ongoing research is further evaluating how shifts in the geographic concentration of ethnicinventors facilitate changes in the geographic composition of US innovation. Not only are ethnicscientists disproportionately concentrated in major MSAs, but growth in a MSA�s share of ethnicpatenting is highly correlated with growth in its share of total US patenting. Annual regressionsacross the full 1975-2004 MSA sample �nd that an increase of 1% in an MSA�s ethnic patenting
10

share correlates with a 0.6% increase in the MSA�s total invention share. This coe¢ cient isremarkably high, as the mean ethnic share of total invention during this period is around 20%.Of course, additional study is required before causal assessments are possible. The ethnic-nameapproach will also need to be complemented with external data to distinguish ethnic inventorshifts due to new immigration, domestic migration, or occupational changes.
3.3 Spatial Concentration of US Ethnic Inventors
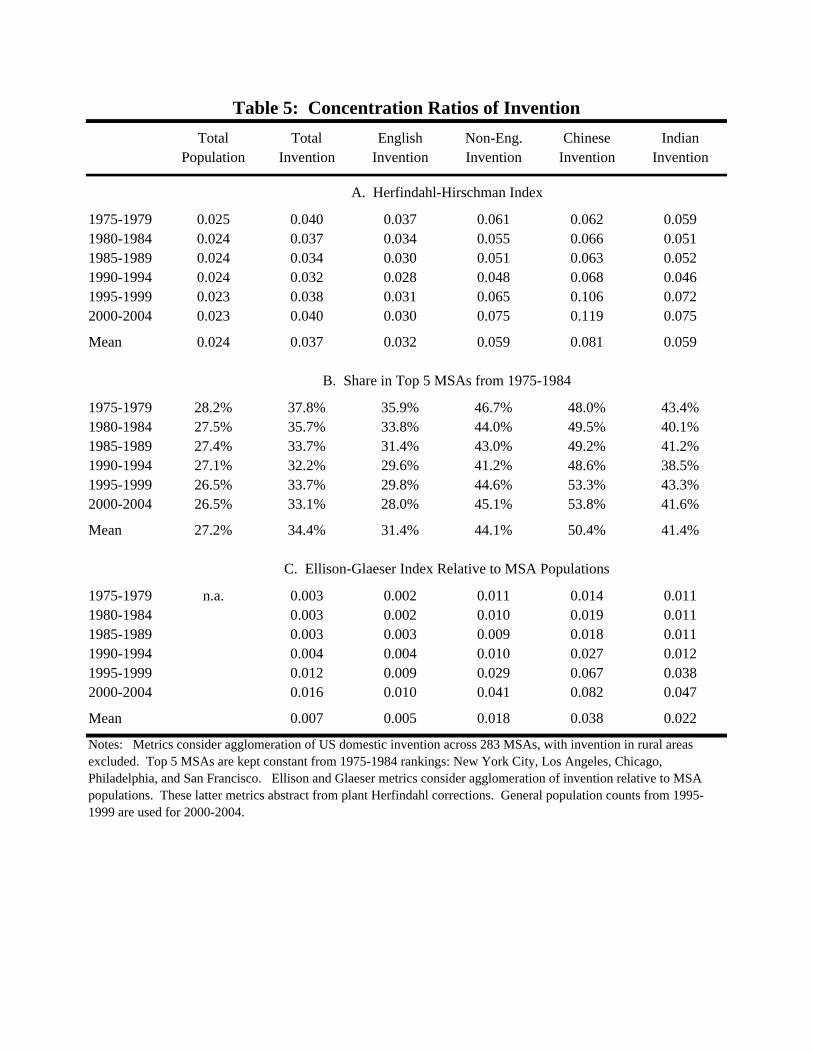
To re�ne the earlier visual observations made regarding agglomeration levels in Table 2, Table5 presents three concentration indices for US domestic patenting. The �rst concentrationmetric studied is the Her�ndahl-Hirschman Index de�ned by HHIt =
PMm=1 Share
2mt, where M
indexes 283 MSAs and Sharemt is the share of patenting in MSA m in period t. Of course,patenting is undertaken outside of MSAs, too. The share of patenting outside of these 283MSAs declines from 9% in 1975-1984 to 7% in 1995-2004. In 2001-2006 applications, this sharefurther declines to 5%. This portion of US invention is excluded from the remainder of thispaper, with concentration metrics being calculated over MSA patenting only.
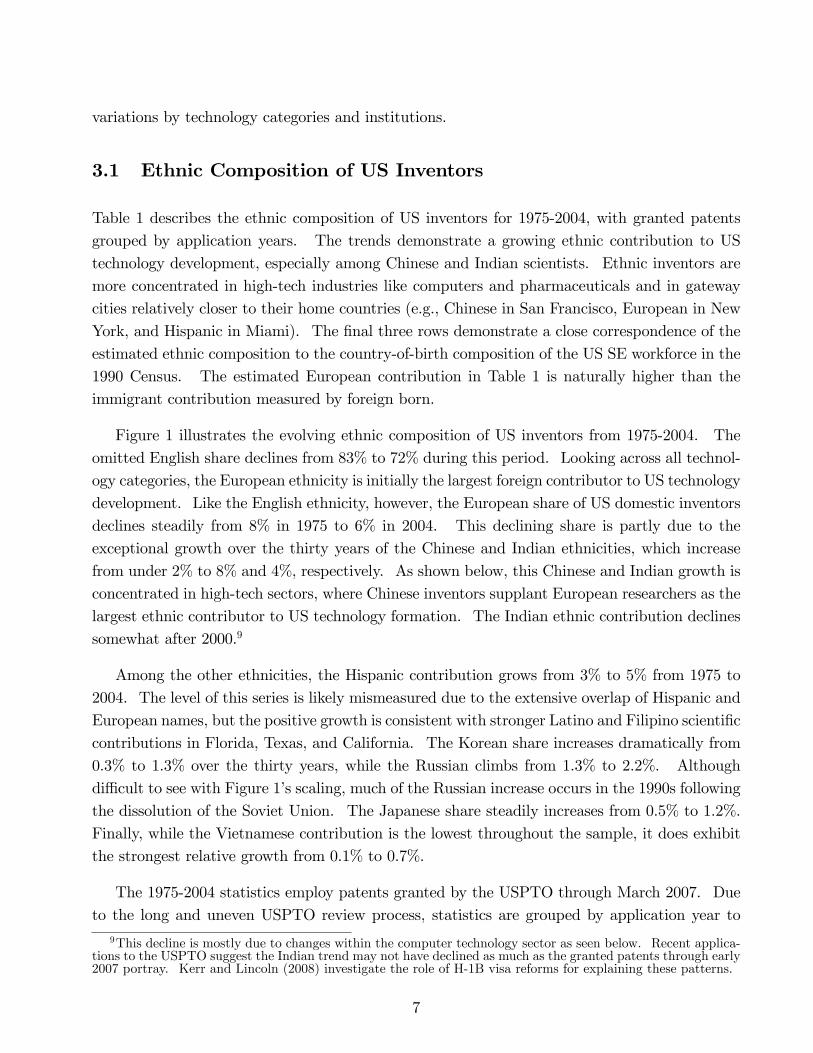
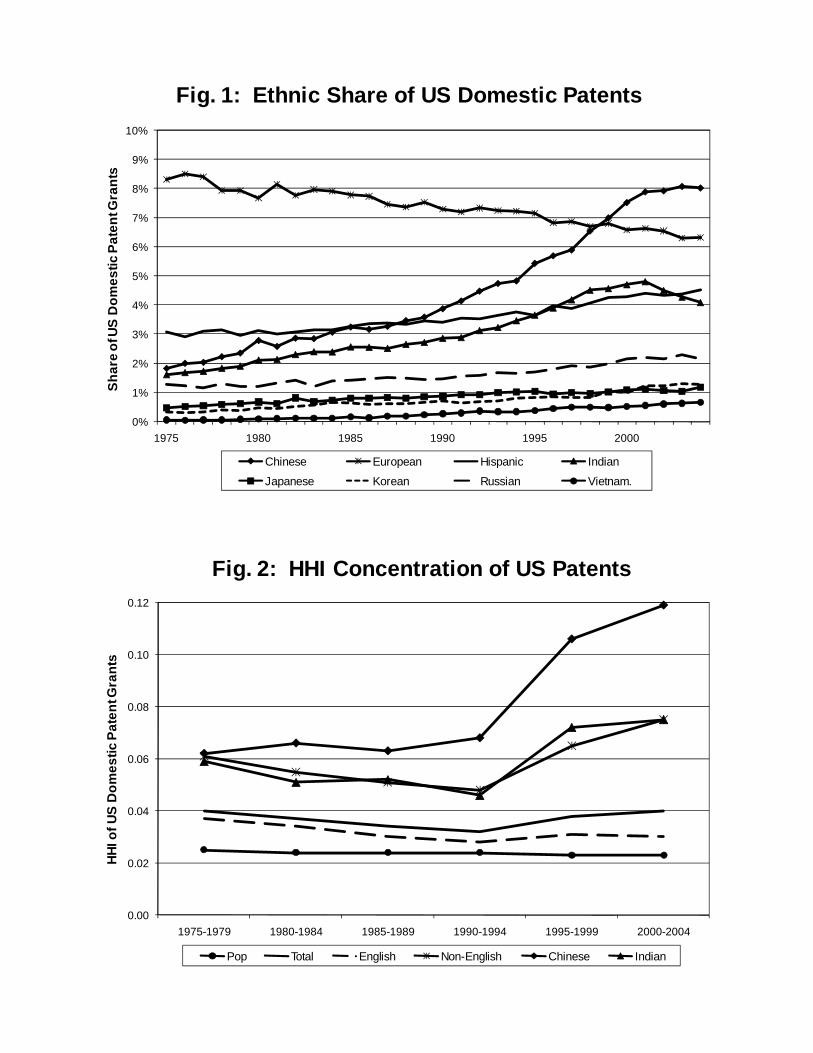
The top panel of Table 5 and Figure 2 highlight several important levels di¤erences. First,US invention is more concentrated than the general population across these MSAs.12 Moreover,ethnic inventors are substantially more agglomerated than English-ethnicity inventors through-out the thirty years considered. The mean population HHI is 0.024 over the period, comparedwith 0.037 for invention and 0.059 for all non-English inventors. The agglomeration of Chineseinventors further stands out at 0.081. This higher ethnic concentration certainly re�ects thewell-known concentration of immigrant groups, but is not due to simply the smaller sizes ofsome ethnicities. Chinese, Japanese, and Vietnamese are consistently the most agglomeratedof ethnic inventor groups. European and Hispanic inventors are the least concentrated, but allethnic groups are more agglomerated than the English ethnicity.13
Moving from the levels to the trends evident in Table 5 and Figure 2, the HHI for all USinventors consistently declines from 1975-1979 to 1990-1994. This trend is reversed, however,with greater levels of invention agglomeration in 1995-1999 and 2000-2004. This reversal to-wards greater patenting concentration is not re�ected in the overall population shares. Ethnicinventors, however, show a sharp increase in these latter ten years. This upturn is strongestamong Asian ethnic groups, with European and Hispanic inventors showing limited change inagglomeration.12MSA populations are calculated through county populations collected in 1977, 1982, 1987, 1992, and 1997.
These are mid-points of the �ve-year increments studied. The 2000-2004 period uses the 1997 MSA population.13Calculations from the 1990 and 2000 Census of Populations �nd that the aggregate concentration of immigrant
SEs is slightly less than the agglomeration of all immigrants. Substantial di¤erences in immigrant shares areevident in larger cities. New York City, Los Angeles, and Miami have larger overall immigration pools relativeto SE, while San Francisco, Washington, Boston, and Seattle have greater SE shares.
11
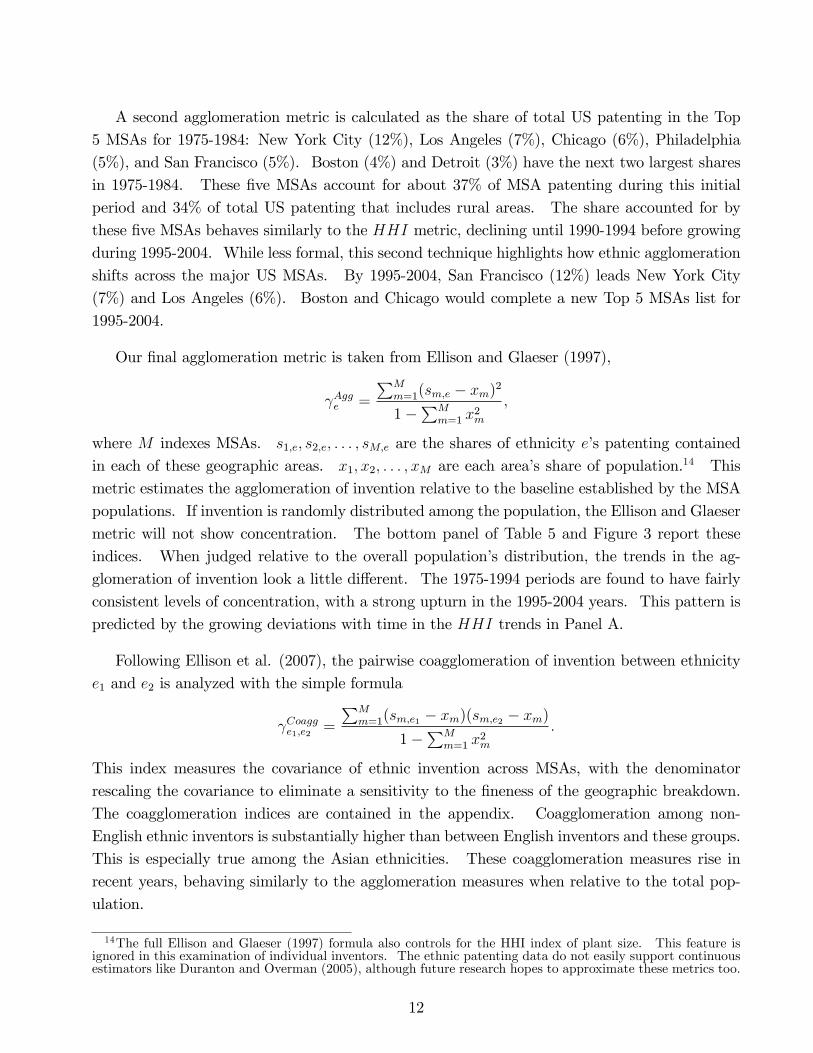
A second agglomeration metric is calculated as the share of total US patenting in the Top5 MSAs for 1975-1984: New York City (12%), Los Angeles (7%), Chicago (6%), Philadelphia(5%), and San Francisco (5%). Boston (4%) and Detroit (3%) have the next two largest sharesin 1975-1984. These �ve MSAs account for about 37% of MSA patenting during this initialperiod and 34% of total US patenting that includes rural areas. The share accounted for bythese �ve MSAs behaves similarly to the HHI metric, declining until 1990-1994 before growingduring 1995-2004. While less formal, this second technique highlights how ethnic agglomerationshifts across the major US MSAs. By 1995-2004, San Francisco (12%) leads New York City(7%) and Los Angeles (6%). Boston and Chicago would complete a new Top 5 MSAs list for1995-2004.
Our �nal agglomeration metric is taken from Ellison and Glaeser (1997),
Agge =
PMm=1(sm;e � xm)2
1�PM
m=1 x2m
;
where M indexes MSAs. s1;e; s2;e; : : : ; sM;e are the shares of ethnicity e�s patenting containedin each of these geographic areas. x1; x2; : : : ; xM are each area�s share of population.14 Thismetric estimates the agglomeration of invention relative to the baseline established by the MSApopulations. If invention is randomly distributed among the population, the Ellison and Glaesermetric will not show concentration. The bottom panel of Table 5 and Figure 3 report theseindices. When judged relative to the overall population�s distribution, the trends in the ag-glomeration of invention look a little di¤erent. The 1975-1994 periods are found to have fairlyconsistent levels of concentration, with a strong upturn in the 1995-2004 years. This pattern ispredicted by the growing deviations with time in the HHI trends in Panel A.
Following Ellison et al. (2007), the pairwise coagglomeration of invention between ethnicitye1 and e2 is analyzed with the simple formula
Coagge1;e2=
PMm=1(sm;e1 � xm)(sm;e2 � xm)
1�PM
m=1 x2m
:
This index measures the covariance of ethnic invention across MSAs, with the denominatorrescaling the covariance to eliminate a sensitivity to the �neness of the geographic breakdown.The coagglomeration indices are contained in the appendix. Coagglomeration among non-English ethnic inventors is substantially higher than between English inventors and these groups.This is especially true among the Asian ethnicities. These coagglomeration measures rise inrecent years, behaving similarly to the agglomeration measures when relative to the total pop-ulation.
14The full Ellison and Glaeser (1997) formula also controls for the HHI index of plant size. This feature isignored in this examination of individual inventors. The ethnic patenting data do not easily support continuousestimators like Duranton and Overman (2005), although future research hopes to approximate these metrics too.
12

3.4 Technology Concentration of US Ethnic Inventors
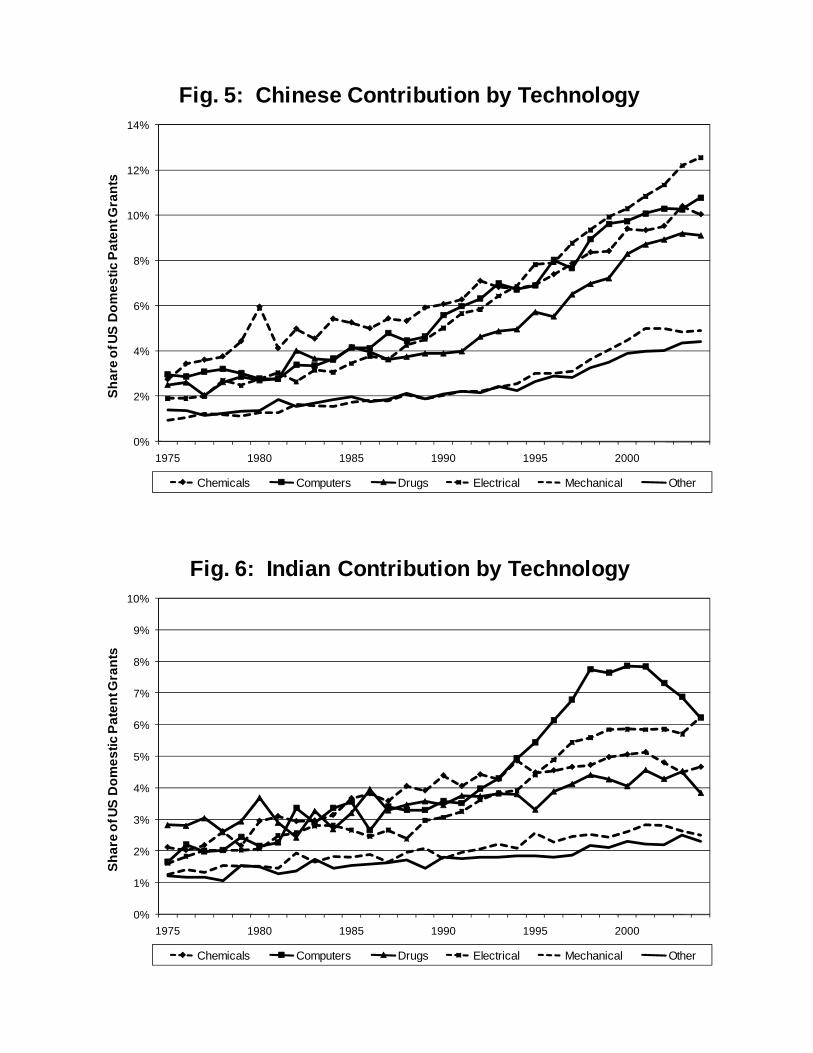
Figure 4 documents the total ethnic contribution by the six broad technology groups into whichpatents are often classi�ed: Chemicals, Computers and Communications, Drugs and Medical,Electrical and Electronic, Mechanical, and Miscellaneous/Others. The Miscellaneous groupincludes patents for agriculture, textiles, furniture, and the like. Growth in ethnic patenting isnoticeably stronger in high-tech sectors than in more traditional industries. Figures 5 and 6provide more detailed glimpses within the Chinese and Indian ethnicities, respectively. Thesetwo ethnic groups are clearly important contributors to the stronger growth in ethnic contribu-tions among high-tech sectors, where Chinese inventors supplant European researchers as thelargest ethnic contributor to US technology formation.15
One possible explanation for Table 5�s aggregate gains in concentration is compositional shiftsin the volume and nature of granted patents, rather than a shift in underlying innovation perse. There has been a substantial increase in the number of patents granted by the USPTOover the last two decades. While this increase is partly due to population growth and higherlevels of US innovation, institutional factors also play an important role.16 The heightenedagglomeration may be driven by greater patenting rates by certain technology groups, re�ectingeither true changes in the underlying innovation rates or simply a greater propensity to seekpatent protection. The latter is especially relevant for the recent rise of software patents (e.g.,Graham and Mowery 2004). Microsoft and other software companies are among the US�s largest�rms today in terms of patent applications, but historically this industry did not seek patentprotection.
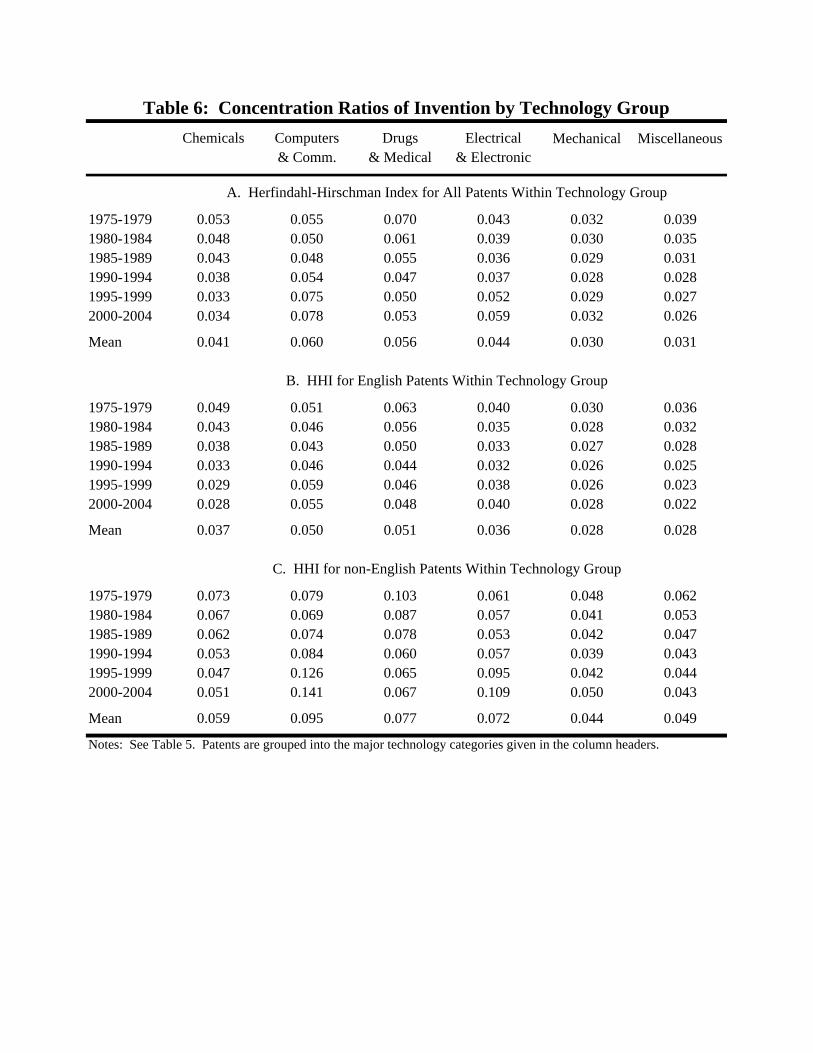
Table 6 considers the geographic concentration of invention that exists within each of thesix broad technology groupings. Panel A presents HHI measures calculated over all patentswithin each technology. The exceptional rebounds for 1995-2004 are strongest within the Com-puters and Communications and Electrical and Electronic groupings. Drugs and Medical andMechanical categories also demonstrate weaker gains, while Chemicals and Miscellaneous showsteady trends for less spatial agglomeration throughout the 1975-2004 period.
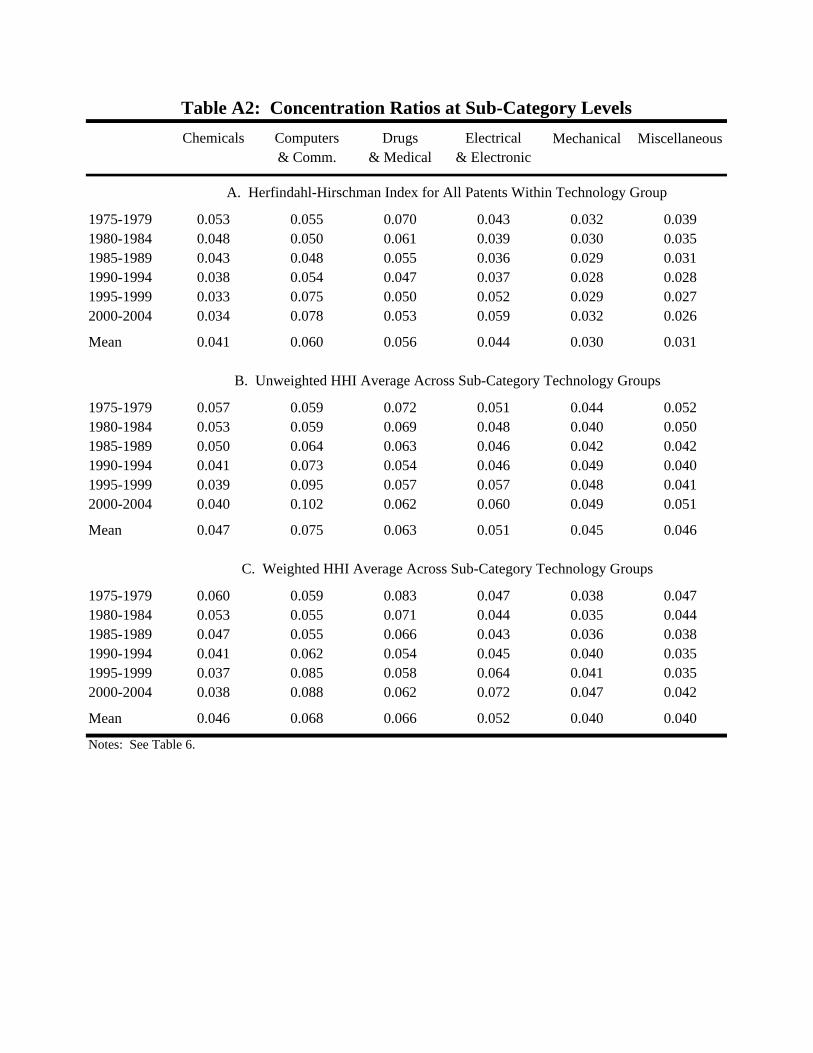
The dual responses within the Computers and Communications and Electrical and Electronicgroupings suggest that the greater agglomeration is more of a high-tech phenomena than softwarein particular. This conclusion is further con�rmed in the appendix. In these estimations,agglomeration is calculated for each sub-category within the six broad technology divisions;
15The USPTO issues patents by technology categories rather than by industries. Combining the work ofJohnson (1999), Silverman (1999), and Kerr (2008), concordances can be developed to map the USPTO classi-�cation scheme to the three-digit industries in which new inventions are manufactured or used. Scherer (1984)and Keller (2002) further discuss the importance of inter-industry R&D �ows.16For example, Griliches (1990), Kortum and Lerner (2000), Kim and Marschke (2004), Hall (2005), Ja¤e and
Lerner (2005).
13

there are four to nine sub-categories within each division. In both weighted and unweightedestimations, the concentration metrics at the sub-category level behave similarly to Table 6. Thisrobustness highlights that a few isolated technology categories, either pre-existing or enteringwith recent USPTO additions, are not solely responsible for the patterns evident.
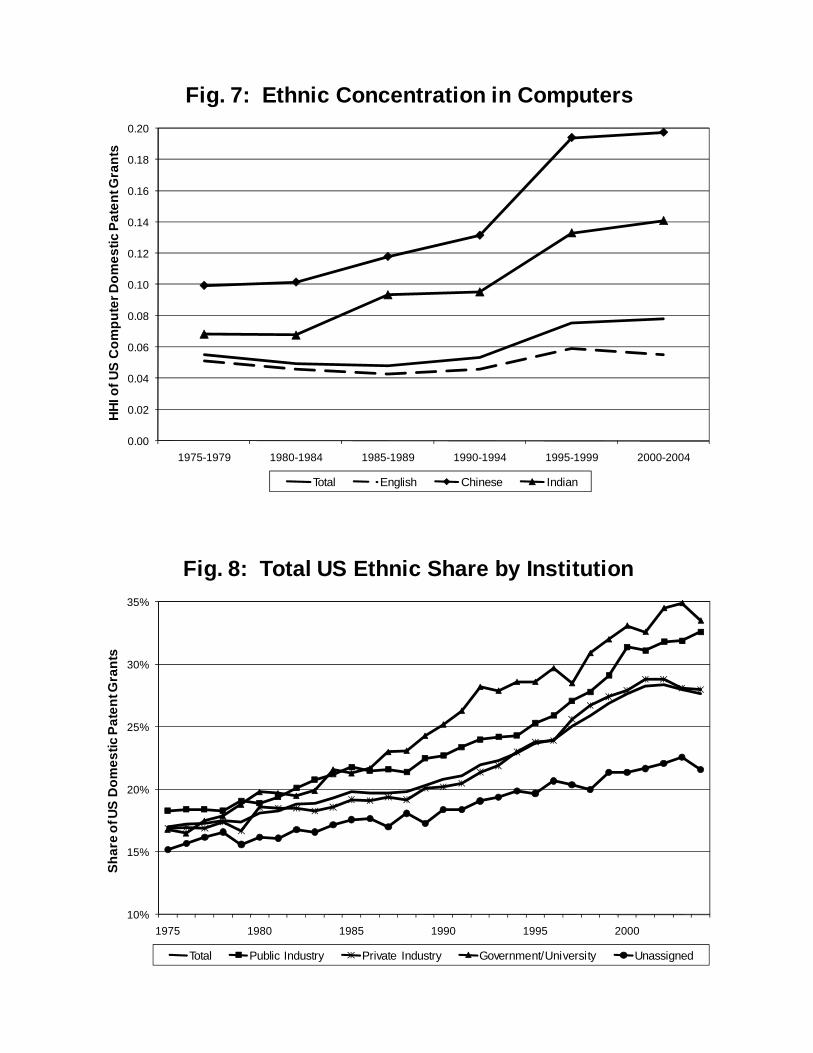
Panels B and C report similar indices for English and non-English ethnicity inventors. Someof the sharp concentration gains within the Computers and Communications and Electrical andElectronic groupings can be traced to higher agglomeration of the English inventors. Theexceptional growth in concentration among non-English ethnic inventors, however, is even morestriking. Figure 7 presents the HHI of Computers and Communications patents for selectedethnic groups. The Chinese HHI reaches just less than 0.200 by 2000-2004, while the Indianconcentration also grows to 0.141. Note that this concentration growth occurs during a periodof growing patent counts.
Ethnic inventors thus pull up the overall patenting concentration in at least two ways. First,ethnic inventors have higher levels of existing concentration and are becoming a larger shareof US patenting (Figure 4). Even if their own concentration holds constant, this should leadto an increase in the agglomeration of US patenting. Second, ethnic inventors are themselvesbecoming more spatially concentrated in high-tech �elds. This force also leads to an increasein overall agglomeration levels. (Ethnic inventors are also more concentrated in �elds that haveexperienced greater rates of recent patenting, yielding a mechanical link as well.)17
3.5 Institutional Concentration of US Ethnic Inventors
Patents are granted to several types of institutions. Industrial �rms account for about 70%of patents granted from 1980-1997, while government and university institutions are assignedabout 4% of patents. Unassigned patents (e.g., individual inventors) represent about 26% ofUS invention. Public companies account for 59% of the industry patents during this period.With the exception of unassigned patents, institutions are primarily identi�ed through assigneenames on patents.
Figure 8 demonstrates that intriguing di¤erences in ethnic scienti�c contributions also existby institution type. Over the 1975-2004 period, ethnic inventors are more concentrated in gov-ernment and university research labs and in publicly-listed companies than in private companiesor as una¢ liated inventors. Part of this levels di¤erence is certainly due to immigration visa
17These e¤ects appear to continue in the 2001-2006 applications data catalogued in Table 2, where San Fran-cisco�s patenting share further climbs to 15% from its 12% share in 1995-2004 granted patents. Seattle (6%)and Boston (5%) also demonstrate exceptional increases. Ongoing work seeks to separate the factors leading togeographic di¤erences between the granted patents data and the newer applications data.
14

sponsorships by larger institutions. Growth in ethnic shares are initially stronger in the govern-ment and university labs, but publicly-listed companies appear to close the gap by 2004. Theother interesting trend in Figure 8 is for private companies, where the ethnic contribution sharplyincreases in the 1990s. This rise coincides with the strong growth in ethnic entrepreneurship inhigh-tech sectors.18
Panels A and B of Table 7 document the evolution of the HHI concentration for industryand university/government patenting, respectively. The column headers again indicate di¤erenttechnology groups. Despite having fairly similar levels of spatial concentration, the di¤erencesbetween institutions in the agglomeration trends for patenting are striking. The concentrationof invention within universities and governments has either weakened or remained constant inevery technology group. The recent gains in industry concentration, on the other hand, arestronger than the aggregate statistics from Table 6. Whereas the recent growth in industryconcentration is strongest for Computers and Communications and Electrical and Electronic,the two technology groups show above-average declines for universities and government bodies.
The bottom two panels of Table 7 show the deeper impact of these institutional di¤erencesfor non-English invention. Ethnic inventors are again very strong drivers for the recent agglom-eration increases in industry patenting within high-tech sectors. On the other hand, ethnicinventors are not becoming more geographically agglomerated within universities and govern-ment institutions. This even holds true for Chinese and Indian groups within the Computersand Communications and Electrical and Electronic technology sectors. Figures 9 and 10 sum-marize these di¤erences. As universities and government bodies are more constrained fromagglomerating than industrial �rms, these di¤erences provide a nice falsi�cation check on theearlier trends and the role of ethnic inventors.19
4 Conclusions
Ethnic scientists and engineers are an important and growing contributor to US technologydevelopment. The Chinese and Indian ethnicities, in particular, are now an integral part of USinvention in high-tech sectors. The magnitude of these ethnic contributions raises many researchand policy questions: debates regarding the appropriate quota for H-1B temporary visas, thepossible crowding out of native students from SE �elds, the brain drain or brain circulation
18Publicly-listed companies are identi�ed from a 1989 mapping developed by Hall et al. (2001). This companylist is not updated for delistings or new public o¤erings. This approach maintains a constant public grouping forreference, but it also weakens the representativeness of the public and private company groupings at the sampleextremes for current companies.19Trends in concentration ratios of unassigned inventors fall in between industry and university/government,
behaving more closely like the latter. While there is some recent growth in ethnic inventor concentration withinthis class, the upturn is much weaker than in industrial �rms. Figure 8 also highlights that ethnic inventors area smaller fraction of unassigned patents, leading to much less impact on aggregate statistics.
15

e¤ect on sending countries, and the future prospects for US technology leadership are just fourexamples.20 While the answers to these questions must draw frommany �elds within and outsideof economics, valuable insights can be developed through agglomeration theory and empiricalstudies.
This paper builds a new empirical platform for these research questions by assigning probableethnicities for US inventors through the inventor names available with USPTO patent records.The resulting data document with greater detail than previously available the powerful growthin US Chinese and Indian inventors during the 1990s. At the same time, these ethnic inventorsbecame more spatially concentrated across US cities. The combination of these two factorshelps stop and reverse long-term declines in overall inventor agglomeration evident in the 1970sand 1980s. The heightened ethnic agglomeration is particularly evident in industry patents forhigh-tech sectors, and similar trends are not found in institutions constrained from agglomerating(e.g., universities, government).
References[1] Agrawal, Ajay, Devesh Kapur, and John McHale, "Birds of a Feather �Better Together?
Exploring the Optimal Spatial Distribution of Ethnic Inventors", NBER Working Paper12823 (2007).
[2] Audretsch, David, and Maryann Feldman, "R&D Spillovers and the Geography of Innova-tion and Production", American Economic Review 86:3 (1996), 630-640.
[3] Borjas, George, "Do Foreign Students Crowd Out Native Students from Graduate Pro-grams?", NBER Working Paper 10349 (2004).
[4] Borjas, George, "Economics of Immigration", Journal of Economic Literature 32 (1994),1667-1717.
[5] Burton, Lawrence, and Jack Wang, "How Much Does the U.S. Rely on Immigrant Engi-neers?", NSF SRS Issue Brief (1999).
[6] Duranton, Gilles, "Urban Evolutions: The Fast, the Slow, and the Still", American Eco-nomic Review 97:1 (2007), 197-221.
[7] Duranton, Gilles, and Henry Overman, "Testing for Localization Using Micro-GeographicData", Review of Economic Studies 72 (2005), 1077-1106.
[8] Duranton, Gilles, and Diego Puga, "Nursery Cities: Urban Diversity, Process Innovation,and the Life Cycle of Products", American Economic Review 91:5 (2001), 1454-1477.
[9] Ellison, Glenn, and Edward Glaeser, "Geographic Concentration in U.S. ManufacturingIndustries: A Dartboard Approach", Journal of Political Economy 105:5 (1997), 889-927.
[10] Ellison, Glenn, Edward Glaeser, and William Kerr, "What Causes Industry Agglomeration?Evidence from Coagglomeration Patterns", NBER Working Paper 13068 (2007).
20Representative papers are Lowell (2000), Borjas (2005), Saxenian (2002b), and Freeman (2005), respectively.
16

[11] Foley, C. Fritz, and William Kerr, "US Ethnic Scientists and Foreign Direct InvestmentPlacement", HBS Working Paper (2008).
[12] Freeman, Richard, "Does Globalization of the Scienti�c/Engineering Workforce ThreatenU.S. Economic Leadership?", NBER Working Paper 11457 (2005).
[13] Freeman, Richard, "People Flows in Globalization", Journal of Economic Perspectives 20:2(2006), 145-170.
[14] Friedberg, Rachel, and Jennifer Hunt, "The Impact of Immigrants on Host Country Wages,Employment and Growth", Journal of Economic Perspectives 9:2 (1995), 23-44.
[15] Furman, Je¤rey, Michael Porter, and Scott Stern, "The Determinants of National InnovativeCapacity", Research Policy 31 (2002), 899-933.
[16] Glaeser, Edward, Hedi Kallal, Jose Scheinkman, and Andrei Shleifer, "Growth in Cities",Journal of Political Economy 100:6 (1992), 1126-1152.
[17] Glaeser, Edward, and Matthew Kahn, "Decentralized Employment and the Transformationof the American City", NBER Working Paper 8117 (2001).
[18] Graham, Stuart, and David Mowery, "Software Patents: Good News or Bad News?", Work-ing Paper (2004).
[19] Griliches, Zvi, "Patent Statistics as Economic Indicators: A Survey", Journal of EconomicLiterature 28:4 (1990), 1661-1707.
[20] Hall, Bronwyn, "Exploring the Patent Explosion", Journal of Technology Transfer 30(2005), 35-48.
[21] Hall, Bronwyn, Adam Ja¤e, and Manuel Trajtenberg, "The NBER Patent Citation DataFile: Lessons, Insights and Methodological Tools", NBER Working Paper 8498 (2001).
[22] Henderson, J. Vernon, "Marshall�s Scale Economies", Journal of Urban Economics 53(2003), 1�28.
[23] Hunt, Jennifer, "How Much Does Immigration Boost Innovation?", Working Paper (2008).
[24] Jacobs, Jane, The Economy of Cities (New York, NY: Vintage Books, 1970).
[25] Ja¤e, Adam, and Joshua Lerner, Innovation and Its Discontents (Boston, MA: HarvardBusiness School Press, 2005).
[26] Ja¤e, Adam, Manuel Trajtenberg, and Rebecca Henderson, "Geographic Localization ofKnowledge Spillovers as Evidenced by Patent Citations", Quarterly Journal of Economics,108:3 (1993), 577-598.
[27] Johnson, Daniel, "150 Years of American Invention: Methodology and a First GeographicApplication", Wellesley College Economics Working Paper 99-01 (1999).
[28] Johnson, Jean, "Statistical Pro�les of Foreign Doctoral Recipients in Science and Engineer-ing: Plans to Stay in the United States", NSF SRS Report (1998).
[29] Johnson, Jean, "Human Resource Contribution to U.S. Science and Engineering FromChina", NSF SRS Issue Brief (2001).
17

[30] Kannankutty, Nirmala, and R. Keith Wilkinson, "SESTAT: A Tool for Studying Scientistsand Engineers in the United States", NSF SRS Report (1999).
[31] Keller, Wolfgang, "Trade and the Transmission of Technology", Journal of EconomicGrowth 7 (2002), 5-24.
[32] Kerr, Sari Pekkala, and William Kerr, "Economic Impacts of Immigration: A Survey", HBSWorking Paper (2008).
[33] Kerr, William, "The Ethnic Composition of US Inventors", HBS Working Paper 08-006(2007).
[34] Kerr, William, "Ethnic Scienti�c Communities and International Technology Di¤usion",Review of Economics and Statistics 90:3 (2008a), 518-537.
[35] Kerr, William, "Heterogeneous Technology Di¤usion and Ricardian Trade Patterns", HBSWorking Paper (2008b).
[36] Kerr, William, and William Lincoln, "The Supply Side of Innovation: H-1B Visa Reformsand US Ethnic Invention", HBS Working Paper (2008).
[37] Kim, Jinyoung, and Gerald Marschke, "Accounting for the Recent Surge in U.S. Patenting:Changes in R&D Expenditures, Patent Yields, and the High Tech Sector", Economics ofInnovation and New Technologies 13:6 (2004), 543-558.
[38] Kortum, Samuel, and Joshua Lerner, "Assessing the Contribution of Venture Capital toInnovation", RAND Journal of Economics 31:4 (2000), 674-692.
[39] Lemley, Mark, and Bhaven Sampat, "Is the Patent O¢ ce a Rubber Stamp?", Stanford LawSchool Working Paper 999098 (2007).
[40] Lowell, B. Lindsay, "H1-B Temporary Workers: Estimating the Population", The Centerfor Comparative Immigration Studies Working Paper 12 (2000).
[41] Mandor¤, Martin, "Social Networks, Ethnicity, and Occupation", Working Paper (2007).
[42] Marshall, Alfred, Principles of Economics (London, U.K.: MacMillan and Co., 1920).
[43] Peri, Giovanni, "Higher Education, Innovation and Growth", in Giorgio Brunello, PietroGaribaldi and Etienne Wasmer (eds.) Education and Training in Europe (Oxford: OxfordUniversity Press, 2007).
[44] Porter, Michael, The Competitive Advantage of Nations (New York, NY: The Free Press,1990).
[45] Romer, Paul, "Increasing Returns and Long-Run Growth", Journal of Political Economy94:5 (1986), 1002-1037.
[46] Romer, Paul, "Endogenous Technological Change", Journal of Political Economy 98:5(1990), S71-S102.
[47] Rosenthal, Stuart, andWilliam Strange, "Geography, Industrial Organization, and Agglom-eration", Review of Economics and Statistics 85:2 (2003), 377-393.
18

[48] Rosenthal, Stuart and William Strange, "The Determinants of Agglomeration", Journal ofUrban Economics 50 (2001), 191-229.
[49] Saxenian, AnnaLee, Regional Advantage: Culture and Competition in Silicon Valley andRoute 128 (Cambridge, MA: Harvard University Press, 1994).
[50] Saxenian, AnnaLee, with Yasuyuki Motoyama and Xiaohong Quan, Local and Global Net-works of Immigrant Professionals in Silicon Valley (San Francisco, CA: Public Policy In-stitute of California, 2002a).
[51] Saxenian, AnnaLee, "Silicon Valley�s New Immigrant High-Growth Entrepreneurs", Eco-nomic Development Quarterly 16:1 (2002b), 20-31.
[52] Scherer, Frederic, "Using Linked Patent Data and R&D Data to Measure TechnologyFlows", in Griliches, Zvi (ed.) R & D, Patents and Productivity (Chicago, IL: University ofChicago Press, 1984).
[53] Silverman, Brian, "Technological Resources and the Direction of Corporate Diversi�cation:Toward an Integration of the Resource-Based View and Transaction Cost Economics",Man-agement Science 45:8 (1999), 1109-1124.
[54] Stephan, Paula, and Sharon Levin, "Exceptional Contributions to US Science by theForeign-Born and Foreign-Educated", Population Research and Policy Review 20:1 (2001),59-79.
[55] Streeter, Joanne, "Major Declines in Admissions of Immigrant Scientists and Engineers inFiscal Year 1994", NSF SRS Issue Brief (1997).
[56] Thompson, Peter, and Melanie Fox-Kean, "Patent Citations and the Geography of Knowl-edge Spillovers: A Reassessment", American Economic Review 95:1 (2005), 450-460.
[57] Wadhwa, Vivek, AnnaLee Saxenian, Ben Rissing, and Gary Gere¢ , "America�s New Immi-grant Entrepreneurs I", Working Paper (2007).
19
0%
1%
2%
3%
4%
5%
6%
7%
8%
9%
10%
1975 1980 1985 1990 1995 2000
Shar
e of
US
Dom
estic
Pat
ent G
rant
sFig. 1: Ethnic Share of US Domestic Patents
Chinese European Hispanic Indian
Japanese Korean Russian Vietnam.
0.00
0.02
0.04
0.06
0.08
0.10
0.12
1975-1979 1980-1984 1985-1989 1990-1994 1995-1999 2000-2004
HHI o
f US
Dom
estic
Pat
ent G
rant
s
Fig. 2: HHI Concentration of US Patents
Pop Total English Non-English Chinese Indian

0.00
0.01
0.02
0.03
0.04
0.05
0.06
0.07
0.08
0.09
1975-1979 1980-1984 1985-1989 1990-1994 1995-1999 2000-2004
Ellis
on-G
laes
er In
dex
of U
S D
omes
tic P
aten
t Gra
nts
Fig. 3: EG Concentration of US Patents
Total English Non-English Chinese Indian
14%
19%
24%
29%
34%
39%
1975 1980 1985 1990 1995 2000
Shar
e of
US
Dom
estic
Pat
ent G
rant
s
Fig. 4: Total US Ethnic Share by Technology
Chemicals Computers Drugs Electrical Mechanical Other
0%
2%
4%
6%
8%
10%
12%
14%
1975 1980 1985 1990 1995 2000
Shar
e of
US
Dom
estic
Pat
ent G
rant
sFig. 5: Chinese Contribution by Technology
Chemicals Computers Drugs Electrical Mechanical Other
0%
1%
2%
3%
4%
5%
6%
7%
8%
9%
10%
1975 1980 1985 1990 1995 2000
Shar
e of
US
Dom
estic
Pat
ent G
rant
s
Fig. 6: Indian Contribution by Technology
Chemicals Computers Drugs Electrical Mechanical Other
0.00
0.02
0.04
0.06
0.08
0.10
0.12
0.14
0.16
0.18
0.20
1975-1979 1980-1984 1985-1989 1990-1994 1995-1999 2000-2004
HHI o
f US
Com
pute
r Dom
estic
Pat
ent G
rant
sFig. 7: Ethnic Concentration in Computers
Total English Chinese Indian
10%
15%
20%
25%
30%
35%
1975 1980 1985 1990 1995 2000
Shar
e of
US
Dom
estic
Pat
ent G
rant
s
Fig. 8: Total US Ethnic Share by Institution
Total Public Industry Private Industry Government/University Unassigned

0.00
0.02
0.04
0.06
0.08
0.10
0.12
0.14
0.16
1975-1979 1980-1984 1985-1989 1990-1994 1995-1999 2000-2004
HHI o
f US
Dom
estic
Pat
ent G
rant
sFig. 9: Ethnic HHI, All Inventors
Chemicals Computers Drugs Electrical Mechanical Other
0.00
0.02
0.04
0.06
0.08
0.10
0.12
0.14
1975-1979 1980-1984 1985-1989 1990-1994 1995-1999 2000-2004
HHI o
f US
Dom
estic
Pat
ent G
rant
s
Fig. 10: Ethnic HHI, University & Government
Chemicals Computers Drugs Electrical Mechanical Other

English Chinese European Hispanic Indian Japanese Korean Russian Vietnam.
1975-1979 82.5% 2.2% 8.2% 3.0% 1.9% 0.6% 0.4% 1.2% 0.1%1980-1984 81.1% 2.9% 7.9% 3.1% 2.4% 0.7% 0.6% 1.3% 0.1%1985-1989 79.8% 3.6% 7.5% 3.3% 2.8% 0.8% 0.7% 1.4% 0.2%1990-1994 77.6% 4.7% 7.2% 3.5% 3.4% 0.9% 0.8% 1.5% 0.4%1995-1999 74.0% 6.6% 6.8% 3.9% 4.5% 0.9% 0.9% 1.8% 0.5%2000-2004 71.0% 8.5% 6.4% 4.2% 4.8% 1.0% 1.2% 2.2% 0.6%
Chemicals 73.7% 7.1% 7.6% 3.6% 4.2% 0.9% 0.9% 1.7% 0.3%Computers 71.3% 7.9% 6.3% 3.7% 6.1% 1.1% 1.0% 2.0% 0.7%Pharmaceuticals 73.3% 6.9% 7.4% 4.3% 3.9% 1.1% 1.0% 1.8% 0.3%Electrical 72.0% 8.0% 6.8% 3.7% 4.6% 1.1% 1.2% 2.0% 0.7%Mechanical 80.6% 3.2% 7.2% 3.4% 2.4% 0.7% 0.6% 1.6% 0.2%Miscellaneous 81.5% 2.9% 7.0% 3.8% 2.1% 0.6% 0.6% 1.4% 0.2%
Top MSAs as a KC (89) SF (14) NOR (12) MIA (16) AUS (6) SF (2) BAL (2) BOS (3) AUS (2)Percentage of WS (88) LA (8) STL (11) SA (9) SF (6) SD (2) LA (2) NYC (3) SF (1)MSA’s Patents NAS (88) AUS (6) NYC (11) WPB (7) BUF (5) LA (2) SF (2) SF (3) PRT (1)
Bachelors Share 87.6% 2.7% 2.3% 2.4% 2.3% 0.6% 0.5% 0.4% 1.2%Masters Share 78.9% 6.7% 3.4% 2.2% 5.4% 0.9% 0.7% 0.8% 1.0%Doctorate Share 71.2% 13.2% 4.0% 1.7% 6.5% 0.9% 1.5% 0.5% 0.4%
Ethnicity of Inventor
Table 1: Descriptive Statistics for Inventors Residing in US
Notes: MSAs - AUS (Austin), BAL (Baltimore), BOS (Boston), BUF (Buffalo), KC (Kansas City), LA (Los Angeles), MIA (Miami), NAS (Nashville), NOR (New Orleans), NYC (New York City), PRT (Portland), SA (San Antonio), SD (San Diego), SF (San Francisco), STL (St. Louis), WPB (West Palm Beach), and WS (Winston-Salem). MSAs are identified from inventors' city names using city lists collected from the Office of Social and Economic Data Analysis at the University of Missouri, with a matching rate of 99%. Manual recoding further ensures all patents with more than 100 citations and all city names with more than 100 patents are identified. 1990 Census statistics are calculated by country-of-birth using the groupings listed in the appendix; English provides a residual in the Census statistics.
A. Ethnic Inventor Shares Estimated from US Inventor Records
B. Ethnic Scientist and Engineer Shares Estimated from 1990 US Census Records

1975- 1985- 1995- 2001- 1975- 1985- 1995- 2001- 1975- 1985- 1995- 2001-1984 1994 2004 2006 (A) 1984 1994 2004 2006 (A) 1984 1994 2004 2006 (A)
Atlanta, GA 0.6% 1.0% 1.3% 1.3% 0.3% 0.7% 1.0% 1.0% 0.3% 0.6% 0.8% 0.8%Austin, TX 0.4% 0.9% 1.8% 2.8% 0.5% 1.2% 1.9% 2.8% 0.5% 1.6% 1.7% 2.2%Baltimore, MD 0.8% 0.8% 0.7% 0.6% 0.7% 0.7% 0.7% 0.5% 0.4% 0.5% 0.6% 0.5%Boston, MA 3.6% 3.8% 3.9% 5.1% 3.9% 4.2% 4.1% 5.1% 3.5% 4.1% 3.5% 4.6%Buffalo, NY 0.6% 0.5% 0.4% 0.2% 0.8% 0.6% 0.4% 0.2% 0.9% 0.5% 0.3% 0.1%Charlotte, NC 0.3% 0.3% 0.3% 0.3% 0.2% 0.2% 0.2% 0.2% 0.1% 0.1% 0.1% 0.2%Chicago, IL 6.0% 4.6% 3.5% 2.7% 6.9% 5.1% 3.5% 2.4% 5.0% 3.9% 2.9% 2.0%Cincinnati, OH 1.0% 1.1% 1.0% 1.2% 0.9% 0.9% 0.7% 0.9% 0.8% 0.8% 0.6% 0.7%Cleveland, OH 2.3% 1.7% 1.4% 1.1% 2.5% 1.5% 1.0% 0.8% 2.0% 1.2% 0.8% 0.6%Columbus, OH 0.7% 0.5% 0.5% 0.3% 0.6% 0.6% 0.4% 0.2% 0.6% 0.4% 0.3% 0.2%Dallas-Fort Worth, TX 1.6% 2.0% 2.2% 2.1% 1.1% 1.9% 2.3% 2.4% 1.4% 2.4% 2.5% 2.5%Denver, CO 1.1% 1.2% 1.3% 1.4% 0.8% 1.0% 0.9% 0.8% 0.9% 1.2% 0.5% 0.4%Detroit, MI 3.1% 3.3% 3.0% 2.5% 3.1% 3.1% 2.7% 2.3% 2.4% 1.9% 2.4% 2.0%Greensboro-W.S., NC 0.2% 0.3% 0.3% 0.2% 0.1% 0.2% 0.2% 0.1% 0.2% 0.2% 0.1% 0.1%Hartford, CT 0.9% 0.9% 0.6% 0.5% 0.9% 0.8% 0.5% 0.4% 0.5% 0.5% 0.3% 0.2%Houston, TX 2.3% 2.5% 1.9% 1.8% 1.8% 2.3% 1.8% 1.8% 2.0% 3.2% 1.7% 1.7%Indianapolis, IN 0.8% 0.7% 0.7% 0.3% 0.6% 0.5% 0.4% 0.2% 0.6% 0.4% 0.4% 0.2%Jacksonville, NC 0.1% 0.1% 0.1% 0.1% 0.1% 0.1% 0.1% 0.0% 0.1% 0.1% 0.1% 0.0%Kansas City, MO 0.4% 0.3% 0.4% 0.3% 0.2% 0.2% 0.2% 0.1% 0.2% 0.1% 0.1% 0.1%Las Vegas, NV 0.1% 0.1% 0.2% 0.2% 0.1% 0.1% 0.2% 0.1% 0.0% 0.0% 0.1% 0.0%Los Angeles, CA 6.6% 6.1% 6.1% 4.6% 7.1% 7.2% 8.2% 6.0% 7.4% 8.7% 10.0% 7.4%Memphis, TN 0.1% 0.2% 0.2% 0.3% 0.1% 0.1% 0.1% 0.2% 0.1% 0.1% 0.1% 0.1%Miami, FL 0.8% 0.9% 0.7% 0.5% 1.0% 1.3% 1.0% 0.6% 0.4% 0.5% 0.3% 0.3%Milwaukee, WI 1.0% 0.9% 0.8% 0.6% 0.8% 0.8% 0.6% 0.4% 0.4% 0.4% 0.5% 0.3%Minneap.-St. Paul, MN 1.9% 2.4% 2.6% 3.8% 1.6% 2.0% 1.9% 2.5% 1.5% 1.6% 1.8% 2.5%
Table 2: Ethnic Inventor Contributions by MSATotal Patenting Share Ethnic Patenting Share Chinese Patenting Share

1975- 1985- 1995- 2001- 1975- 1985- 1995- 2001- 1975- 1985- 1995- 2001-1984 1994 2004 2006 (A) 1984 1994 2004 2006 (A) 1984 1994 2004 2006 (A)
Nashville, TN 0.1% 0.2% 0.2% 0.2% 0.0% 0.1% 0.1% 0.1% 0.0% 0.1% 0.1% 0.1%New Orleans, LA 0.3% 0.2% 0.2% 0.1% 0.3% 0.3% 0.1% 0.0% 0.2% 0.2% 0.0% 0.0%New York, NY 11.5% 8.9% 7.2% 6.5% 16.6% 13.1% 9.9% 8.7% 16.6% 12.5% 8.8% 8.4%Norfolk-VA Beach, VA 0.2% 0.2% 0.2% 0.1% 0.1% 0.1% 0.1% 0.1% 0.1% 0.1% 0.1% 0.0%Orlando, FL 0.2% 0.3% 0.3% 0.3% 0.1% 0.2% 0.3% 0.3% 0.1% 0.1% 0.3% 0.2%Philadelphia, PA 4.6% 3.9% 2.7% 2.1% 5.7% 4.9% 2.8% 1.9% 7.2% 6.1% 2.9% 2.0%Phoenix, AZ 1.0% 1.2% 1.4% 1.1% 0.6% 1.1% 1.3% 1.0% 0.4% 0.9% 1.3% 0.7%Pittsburgh, PA 2.0% 1.3% 0.8% 0.6% 2.2% 1.4% 0.6% 0.5% 2.1% 1.0% 0.5% 0.4%Portland, OR 0.5% 0.8% 1.4% 1.2% 0.3% 0.6% 1.3% 1.2% 0.1% 0.6% 1.4% 1.2%Providence, RI 0.3% 0.3% 0.3% 0.2% 0.3% 0.4% 0.3% 0.3% 0.1% 0.3% 0.2% 0.3%Raleigh-Durham, NC 0.3% 0.6% 1.1% 1.8% 0.3% 0.6% 1.0% 1.4% 0.3% 0.6% 0.8% 1.1%Richmond, VA 0.3% 0.3% 0.2% 0.2% 0.3% 0.3% 0.2% 0.2% 0.5% 0.4% 0.2% 0.2%Sacramento, CA 0.2% 0.4% 0.5% 0.3% 0.2% 0.4% 0.5% 0.3% 0.2% 0.3% 0.4% 0.3%Salt Lake City, UT 0.4% 0.5% 0.6% 0.4% 0.2% 0.4% 0.3% 0.3% 0.2% 0.3% 0.3% 0.2%San Antonio, TX 0.1% 0.2% 0.2% 0.3% 0.1% 0.2% 0.2% 0.2% 0.1% 0.1% 0.1% 0.1%San Diego, CA 1.1% 1.6% 2.1% 2.4% 1.1% 1.6% 2.5% 2.9% 1.1% 1.5% 2.4% 3.1%San Francisco, CA 4.8% 6.6% 11.8% 15.2% 6.2% 9.4% 19.1% 22.3% 10.1% 15.9% 28.1% 29.0%Seattle, WA 0.9% 1.3% 1.8% 5.7% 0.8% 1.1% 1.7% 6.1% 0.6% 1.0% 1.6% 5.2%St. Louis, MO 1.0% 0.9% 0.8% 0.7% 0.9% 0.8% 0.7% 0.5% 1.2% 0.9% 0.4% 0.4%Tallahassee, FL 0.4% 0.5% 0.4% 0.3% 0.3% 0.4% 0.3% 0.3% 0.1% 0.2% 0.1% 0.1%Washington, DC 1.5% 1.5% 1.4% 1.6% 1.6% 1.6% 1.4% 1.7% 1.5% 1.6% 1.5% 1.9%West Palm Beach, FL 0.3% 0.5% 0.4% 0.4% 0.3% 0.5% 0.4% 0.3% 0.3% 0.3% 0.2% 0.1%
Other MSAs 21.8% 22.2% 20.9% 18.5% 18.2% 18.1% 15.8% 13.8% 19.5% 16.6% 13.3% 12.6%Not in a MSA 9.1% 8.2% 6.9% 5.0% 6.3% 5.4% 4.0% 3.5% 5.0% 3.6% 2.7% 2.4%
Table 2: Ethnic Inventor Contributions by MSA, continuedTotal Patenting Share Ethnic Patenting Share Chinese Patenting Share

(1) (2) (3) (4) (5) (6) (7) (8) (9) (10)
1975-1984 Share of 0.842 0.865 0.796 0.646 0.526Ethnic Patents in MSA (0.284) (0.501) (0.186) (0.053) (0.185)
Population Share 0.573 -0.132 0.475 -0.273 0.457 -0.176 0.650 0.117 0.812 0.268of MSA (0.076) (0.260) (0.099) (0.495) (0.199) (0.186) (0.191) (0.066) (0.071) (0.200)
Log Population 0.251 -0.063 -0.140 -0.253 0.143 -0.223 0.329 -0.004 -0.080 -0.100Density of MSA (0.105) (0.134) (0.129) (0.166) (0.238) (0.146) (0.211) (0.084) (0.106) (0.078)
Coastal Access 0.029 0.177 0.378 0.294 0.240 0.327 0.063 0.190 0.331 0.269of MSA (0.137) (0.161) (0.266) (0.160) (0.237) (0.221) (0.146) (0.132) (0.135) (0.106)
Share of Population 0.429 0.268 0.505 0.184 0.602 0.353 0.498 0.301 0.303 0.220with Bachelors Ed. (0.257) (0.163) (0.399) (0.163) (0.378) (0.253) (0.270) (0.201) (0.216) (0.174)
Share of Population -0.779 -0.711 -1.320 -1.031 -1.291 -1.161 -0.641 -0.667 -0.558 -0.581under 30 in Age (0.566) (0.456) (1.150) (0.684) (0.980) (0.824) (0.569) (0.519) (0.535) (0.493)
Share of Population -0.452 -0.567 -0.757 -0.804 -0.703 -0.844 -0.175 -0.432 -0.275 -0.400over 60 in Age (0.347) (0.325) (0.704) (0.535) (0.598) (0.549) (0.362) (0.326) (0.334) (0.327)
Share of Population -0.313 -0.451 -0.576 -0.968 -0.090 -0.632 0.155 -0.295 -0.128 -0.375Female (0.256) (0.268) (0.516) (0.592) (0.485) (0.489) (0.340) (0.251) (0.247) (0.285)
R-Squared 0.84 0.88 0.54 0.69 0.61 0.74 0.82 0.91 0.90 0.92
Dependent Variable is Share of 1985-2004 Ethnic Patenting in the MSA
Notes: Estimations provide partial correlations for ethnic patenting undertaken in 244 MSAs over the 1985-2004 period. The dependent variable is the MSA's share of indicated ethnic invention relative to the MSA sample. Explanatory regressors are from the 1990 Census of Populations, excepting coastal access and the lagged ethnic patenting share. The latter is ethnic specific and is calculated for the 1975-1984 pre-period from the ethnic patenting database. Estimations are weighted by MSA populations. Variables are transformed to unit standard deviation for interpretation. Robust standard errors are reported in parenthesis.
Table 3: Ethnic Inventors and MSA Characteristics, Weighted EstimationsEnglish Chinese Indian European Hispanic

(1) (2) (3) (4) (5) (6) (7) (8) (9) (10)
1975-1984 Share of 0.884 0.968 0.726 0.643 0.655Ethnic Patents in MSA (0.255) (0.586) (0.262) (0.107) (0.271)
Population Share 0.810 -0.029 0.647 -0.230 0.684 0.037 0.845 0.261 0.901 0.250of MSA (0.106) (0.171) (0.145) (0.431) (0.185) (0.134) (0.166) (0.102) (0.075) (0.189)
Log Population 0.053 0.026 -0.047 -0.019 -0.002 -0.018 0.020 0.016 -0.043 -0.003Density of MSA (0.034) (0.026) (0.029) (0.039) (0.051) (0.030) (0.050) (0.020) (0.023) (0.015)
Coastal Access -0.027 0.022 0.052 0.067 0.012 0.046 -0.009 0.020 0.054 0.043of MSA (0.035) (0.039) (0.057) (0.047) (0.050) (0.055) (0.033) (0.030) (0.033) (0.026)
Share of Population 0.123 0.091 0.084 0.041 0.113 0.087 0.094 0.080 0.070 0.067with Bachelors Ed. (0.034) (0.023) (0.050) (0.025) (0.048) (0.035) (0.034) (0.026) (0.029) (0.025)
Share of Population -0.151 -0.145 -0.115 -0.152 -0.139 -0.150 -0.078 -0.110 -0.045 -0.090under 30 in Age (0.064) (0.056) (0.111) (0.104) (0.100) (0.091) (0.065) (0.055) (0.056) (0.061)
Share of Population -0.102 -0.135 -0.078 -0.151 -0.086 -0.140 -0.015 -0.081 -0.012 -0.076over 60 in Age (0.051) (0.053) (0.086) (0.103) (0.078) (0.084) (0.053) (0.045) (0.047) (0.056)
Share of Population -0.056 -0.050 -0.055 -0.058 -0.055 -0.057 -0.032 -0.039 -0.033 -0.042Female (0.023) (0.021) (0.037) (0.033) (0.033) (0.033) (0.021) (0.019) (0.021) (0.021)
R-Squared 0.79 0.85 0.45 0.65 0.54 0.64 0.78 0.86 0.83 0.87
Table 4: Ethnic Inventors and MSA Characteristics, Unweighted Estimations
Dependent Variable is Share of 1985-2004 Ethnic Patenting in the MSA
Notes: See Table 3. Estimations are unweighted.
English Chinese Indian HispanicEuropean
Total Total English Non-Eng. Chinese IndianPopulation Invention Invention Invention Invention Invention
1975-1979 0.025 0.040 0.037 0.061 0.062 0.0591980-1984 0.024 0.037 0.034 0.055 0.066 0.0511985-1989 0.024 0.034 0.030 0.051 0.063 0.0521990-1994 0.024 0.032 0.028 0.048 0.068 0.0461995-1999 0.023 0.038 0.031 0.065 0.106 0.0722000-2004 0.023 0.040 0.030 0.075 0.119 0.075
Mean 0.024 0.037 0.032 0.059 0.081 0.059
1975-1979 28.2% 37.8% 35.9% 46.7% 48.0% 43.4%1980-1984 27.5% 35.7% 33.8% 44.0% 49.5% 40.1%1985-1989 27.4% 33.7% 31.4% 43.0% 49.2% 41.2%1990-1994 27.1% 32.2% 29.6% 41.2% 48.6% 38.5%1995-1999 26.5% 33.7% 29.8% 44.6% 53.3% 43.3%2000-2004 26.5% 33.1% 28.0% 45.1% 53.8% 41.6%
Mean 27.2% 34.4% 31.4% 44.1% 50.4% 41.4%
1975-1979 n.a. 0.003 0.002 0.011 0.014 0.0111980-1984 0.003 0.002 0.010 0.019 0.0111985-1989 0.003 0.003 0.009 0.018 0.0111990-1994 0.004 0.004 0.010 0.027 0.0121995-1999 0.012 0.009 0.029 0.067 0.0382000-2004 0.016 0.010 0.041 0.082 0.047
Mean 0.007 0.005 0.018 0.038 0.022
Table 5: Concentration Ratios of Invention
Notes: Metrics consider agglomeration of US domestic invention across 283 MSAs, with invention in rural areas excluded. Top 5 MSAs are kept constant from 1975-1984 rankings: New York City, Los Angeles, Chicago, Philadelphia, and San Francisco. Ellison and Glaeser metrics consider agglomeration of invention relative to MSA populations. These latter metrics abstract from plant Herfindahl corrections. General population counts from 1995-1999 are used for 2000-2004.
A. Herfindahl-Hirschman Index
C. Ellison-Glaeser Index Relative to MSA Populations
B. Share in Top 5 MSAs from 1975-1984
Chemicals Computers Drugs Electrical Mechanical Miscellaneous& Comm. & Medical & Electronic
1975-1979 0.053 0.055 0.070 0.043 0.032 0.0391980-1984 0.048 0.050 0.061 0.039 0.030 0.0351985-1989 0.043 0.048 0.055 0.036 0.029 0.0311990-1994 0.038 0.054 0.047 0.037 0.028 0.0281995-1999 0.033 0.075 0.050 0.052 0.029 0.0272000-2004 0.034 0.078 0.053 0.059 0.032 0.026
Mean 0.041 0.060 0.056 0.044 0.030 0.031
1975-1979 0.049 0.051 0.063 0.040 0.030 0.0361980-1984 0.043 0.046 0.056 0.035 0.028 0.0321985-1989 0.038 0.043 0.050 0.033 0.027 0.0281990-1994 0.033 0.046 0.044 0.032 0.026 0.0251995-1999 0.029 0.059 0.046 0.038 0.026 0.0232000-2004 0.028 0.055 0.048 0.040 0.028 0.022
Mean 0.037 0.050 0.051 0.036 0.028 0.028
1975-1979 0.073 0.079 0.103 0.061 0.048 0.0621980-1984 0.067 0.069 0.087 0.057 0.041 0.0531985-1989 0.062 0.074 0.078 0.053 0.042 0.0471990-1994 0.053 0.084 0.060 0.057 0.039 0.0431995-1999 0.047 0.126 0.065 0.095 0.042 0.0442000-2004 0.051 0.141 0.067 0.109 0.050 0.043
Mean 0.059 0.095 0.077 0.072 0.044 0.049
Table 6: Concentration Ratios of Invention by Technology Group
Notes: See Table 5. Patents are grouped into the major technology categories given in the column headers.
A. Herfindahl-Hirschman Index for All Patents Within Technology Group
C. HHI for non-English Patents Within Technology Group
B. HHI for English Patents Within Technology Group

Chemicals Computers Drugs Electrical Mechanical Miscellaneous& Comm. & Medical & Electronic
\1975-1979 0.058 0.056 0.086 0.044 0.033 0.0401980-1984 0.053 0.050 0.076 0.040 0.031 0.0371985-1989 0.047 0.050 0.064 0.036 0.030 0.0301990-1994 0.042 0.056 0.054 0.038 0.031 0.0271995-1999 0.035 0.080 0.058 0.055 0.031 0.0252000-2004 0.037 0.082 0.061 0.064 0.037 0.025
Mean 0.045 0.062 0.066 0.046 0.032 0.031
1975-1979 0.043 0.088 0.043 0.054 0.041 0.0401980-1984 0.039 0.068 0.046 0.050 0.039 0.0401985-1989 0.036 0.059 0.044 0.046 0.041 0.0291990-1994 0.033 0.049 0.047 0.052 0.040 0.0311995-1999 0.035 0.048 0.041 0.045 0.040 0.0272000-2004 0.033 0.044 0.038 0.042 0.039 0.029
Mean 0.036 0.059 0.043 0.048 0.040 0.033
1975-1979 0.078 0.079 0.118 0.061 0.046 0.0611980-1984 0.072 0.068 0.110 0.057 0.042 0.0521985-1989 0.067 0.078 0.091 0.053 0.042 0.0451990-1994 0.058 0.089 0.071 0.060 0.041 0.0381995-1999 0.050 0.133 0.076 0.103 0.044 0.0382000-2004 0.056 0.148 0.077 0.118 0.055 0.038
Mean 0.064 0.099 0.091 0.075 0.045 0.045
1975-1979 0.052 0.123 0.055 0.075 0.048 0.0631980-1984 0.046 0.108 0.057 0.067 0.041 0.0601985-1989 0.047 0.066 0.049 0.060 0.048 0.0401990-1994 0.039 0.058 0.055 0.059 0.055 0.0371995-1999 0.039 0.057 0.051 0.048 0.050 0.0332000-2004 0.031 0.049 0.043 0.049 0.046 0.034
Mean 0.042 0.077 0.052 0.060 0.048 0.044
Table 7: Concentration Ratios of Invention by Institution
Notes: See Table 5. Patents are grouped into the major technology categories given in the column headers.
A. Herfindahl-Hirschman Index for All Industry Patents
D. HHI for non-English University and Government Patents
B. HHI for All University and Government Patents
C. HHI for non-English Industry Patents

Chinese English European Hispanic Indian Japanese Korean Russian Vietnam.
Chinese 0.014English 0.004 0.002European 0.011 0.004 0.014Hispanic 0.010 0.003 0.009 0.011Indian 0.011 0.004 0.012 0.009 0.011Japanese 0.010 0.005 0.005 0.011 0.005 0.034Korean 0.009 0.004 0.009 0.008 0.008 0.012 0.012Russian 0.011 0.005 0.012 0.011 0.011 0.012 0.010 0.015Vietnam. 0.011 0.004 0.009 0.012 0.008 0.020 0.010 0.013 0.024
Chinese 0.082English 0.024 0.010European 0.033 0.011 0.016Hispanic 0.034 0.010 0.014 0.016Indian 0.059 0.019 0.025 0.025 0.047Japanese 0.082 0.024 0.032 0.034 0.058 0.084Korean 0.075 0.020 0.030 0.031 0.053 0.075 0.071Russian 0.051 0.015 0.022 0.022 0.037 0.051 0.048 0.034Vietnam. 0.086 0.026 0.033 0.035 0.062 0.087 0.078 0.051 0.097
Table A1: Coagglomeration of US Ethnic Invention
Notes: Metrics consider coagglomeration of ethnic invention relative to MSA populations.
A. 1975-1979 Coagglomeration of Ethnic Invention
B. 2000-2004 Coagglomeration of Ethnic Invention
Chemicals Computers Drugs Electrical Mechanical Miscellaneous& Comm. & Medical & Electronic
1975-1979 0.053 0.055 0.070 0.043 0.032 0.0391980-1984 0.048 0.050 0.061 0.039 0.030 0.0351985-1989 0.043 0.048 0.055 0.036 0.029 0.0311990-1994 0.038 0.054 0.047 0.037 0.028 0.0281995-1999 0.033 0.075 0.050 0.052 0.029 0.0272000-2004 0.034 0.078 0.053 0.059 0.032 0.026
Mean 0.041 0.060 0.056 0.044 0.030 0.031
1975-1979 0.057 0.059 0.072 0.051 0.044 0.0521980-1984 0.053 0.059 0.069 0.048 0.040 0.0501985-1989 0.050 0.064 0.063 0.046 0.042 0.0421990-1994 0.041 0.073 0.054 0.046 0.049 0.0401995-1999 0.039 0.095 0.057 0.057 0.048 0.0412000-2004 0.040 0.102 0.062 0.060 0.049 0.051
Mean 0.047 0.075 0.063 0.051 0.045 0.046
1975-1979 0.060 0.059 0.083 0.047 0.038 0.0471980-1984 0.053 0.055 0.071 0.044 0.035 0.0441985-1989 0.047 0.055 0.066 0.043 0.036 0.0381990-1994 0.041 0.062 0.054 0.045 0.040 0.0351995-1999 0.037 0.085 0.058 0.064 0.041 0.0352000-2004 0.038 0.088 0.062 0.072 0.047 0.042
Mean 0.046 0.068 0.066 0.052 0.040 0.040
Table A2: Concentration Ratios at Sub-Category Levels
Notes: See Table 6.
A. Herfindahl-Hirschman Index for All Patents Within Technology Group
C. Weighted HHI Average Across Sub-Category Technology Groups
B. Unweighted HHI Average Across Sub-Category Technology Groups

Obs. Full Restrict. Full Restrict. Full Restrict.
United Kingdom 175,077 99% 95% 85% 83% 92% 91%
China, Singapore 136,818 100% 98% 89% 89% 91% 91%
Western Europe 1,137,751 97% 80% 66% 46% 73% 58%
Hispanic Nations 24,793 98% 73% 74% 68% 93% 93%
India 11,056 84% 77% 83% 88% 85% 89%
Japan 1,691,337 98% 89% 100% 96% 100% 96%
South Korea 100,140 100% 100% 83% 83% 87% 88%
Russia 32,128 93% 80% 80% 84% 93% 94%
Vietnam 34 100% 97% 42% 52% 50% 52%
English Chinese European Hispanic Indian Japanese Korean Russian Vietnam.
United Kingdom 85% 2% 5% 3% 2% 0% 0% 2% 0%
China, Singapore 2% 89% 1% 1% 1% 1% 5% 0% 1%
Western Europe 21% 1% 66% 8% 1% 0% 0% 3% 0%
Hispanic Nations 12% 1% 10% 74% 0% 1% 0% 2% 0%
India 5% 1% 2% 7% 83% 0% 0% 2% 0%
Japan 0% 0% 0% 0% 0% 100% 0% 0% 0%
South Korea 2% 12% 0% 0% 0% 1% 83% 1% 0%
Russia 5% 1% 3% 10% 0% 0% 0% 80% 0%
Vietnam 17% 24% 14% 0% 0% 3% 0% 0% 42%
Table A3: Descriptive Statistics for Inventors Residing in Foreign Countries and Regions
Complete Ethnic Composition of Region's Inventors (Full Matching)
Greater China includes Mainland China, Hong Kong, Macao, and Taiwan. Western Europe includes Austria, Belgium, Denmark, Finland, France, Germany, Italy, Luxembourg, Netherlands, Norway, Poland, Sweden, and Switzerland. Hispanic Nations includes Argentina, Belize, Brazil, Chile, Columbia, Costa Rica, Cuba, Dominican Republic, Ecuador, El Salvador, Guatemala, Honduras, Mexico, Nicaragua, Panama, Paraguay, Peru, Philippines, Portugal, Spain, Uruguay, and Venezuela. Russia includes former Soviet Union countries.
Ethnic Database of Region (Partial)of Their Region
Summary Statistics for Full and Restricted Matching Procedures
Matched with Assigned Ethnicity
Notes: Matching is undertaken at inventor level using the Full and Restricted Matching procedures outlined in the text. The middle columns of the top panel summarize the share of each region's inventors assigned the ethnicity of that region; the complete composition for the Full Matching procedure is detailed in the bottom panel. The right-hand columns in the top panel document the percentage of the region's inventors assigned at least partially to their region's ethnicity.
Assigned Ethnicity
Percentage of Percentage of Percentage ofRegion's Inventors Region's InventorsRegion's Inventors

Chinese English European Hispanic / Filipino Indian / Hindi
Chan 1335 Adams 2545 Abel 180 Acosta 65 Adler 319Chang 3214 Allen 3019 Albrecht 327 Acquaviva 58 Agarwal 184Chao 427 Anderson 6271 Antos 220 Adell 86 Aggarwal 94Chau 163 Bailey 1559 Auerbach 138 Alvarez 235 Agrawal 375Chen 4306 Baker 2883 Baer 286 Arroyo 68 Ahmad 148Cheng 1057 Bell 1677 Bauer 931 Ayer 134 Ahmed 337Cheung 351 Bennett 1522 Beck 1094 Ayres 151 Akram 98Chiang 584 Brown 6818 Bender 332 Bales 173 Ali 193Chien 164 Burns 1145 Berg 933 Bartos 58 Arora 95Chiu 427 Butler 1131 Berger 784 Blanco 71 Ash 183Chou 513 Campbell 2339 Bodor 135 Bolanos 116 Aslam 90Chow 468 Carlson 1542 Budzich 112 Boles 60 Badesha 90Chu 1184 Carter 1522 Caron 188 Cabrera 62 Baliga 111Chuang 160 Clark 3273 Cerami 117 Calderon 77 Banerjee 137Fan 363 Cohen 1513 Chandraratna 126 Camacho 59 Basu 101Fang 256 Cole 1228 Collette 116 Cardenas 58 Bhat 94Feng 184 Collins 1681 Crivello 119 Carnes 69 Bhatia 172Fong 298 Cook 1994 D'Amico 126 Castillo 61 Bhatt 105Fu 220 Cooper 1788 Dietrich 200 Chavez 76 Bhattacharya 105Fung 248 Cox 1370 Dietz 298 Contreras 61 Bhattacharyya 90Guo 182 Davis 5229 Eberhardt 136 Cruz 118 Bose 159Han 379 Edwards 1962 Eckenhoff 118 D'Alelio 69 Brunelle 116He 194 Erickson 1191 Effland 133 D'Silva 87 Chandra 91Ho 817 Evans 2494 Ehrlich 187 Das 409 Chatterjee 293Hou 161 Fischer 1126 Ferrari 124 Delgado 102 Chattha 90Hsieh 517 Fisher 1585 Fischell 161 Dias 101 Cherukuri 134Hsu 1153 Foster 1650 Fuchs 219 Diaz 303 Chubb 90Hu 494 Fox 1230 Gelardi 127 Dominguez 111 Datta 202Huang 1545 Gardner 1257 Grabbe 136 Duran 87 Desai 442Hung 317 Gordon 1500 Grasselli 135 Elias 163 Dixit 132Jiang 281 Graham 1284 Gunther 173 Fernandes 81 Dutta 103Kao 350 Gray 1521 Guttag 127 Fernandez 285 Fazan 107Kung 225 Green 2051 Haas 514 Francisco 64 Gaffar 150Kuo 600 Hall 2928 Hansen 1730 Freitas 78 Gandhi 105Lai 466 Hanson 1289 Hartman 757 Gagnon 157 Ganguly 110Lam 491 Harris 2838 Hartmann 220 Garcia 612 Garg 138Lau 578 Hayes 1200 Hause 134 Garza 76 Ghosh 237Lee 1325 Hill 2061 Hecht 142 Gomes 89 Goel 208Leung 500 Hoffman 1433 Heinz 116 Gomez 179 Goli 100Lew 403 Howard 1158 Henrick 123 Gonsalves 60 Gupta 851Li 1652 Hughes 1340 Horodysky 232 Gonzales 131 Harandi 159Liang 418 Jackson 2319 Horvath 221 Gonzalez 441 Hassan 110Liao 194 Jensen 1227 Jacobs 1122 Gutierrez 387 Hussain 98Lien 202 Johnson 10718 Kanner 118 Halasa 147 Imran 118Lim 178 Johnston 1167 Kasper 155 Hernandez 324 Iyer 219Lin 2348 Jones 6068 Kempf 144 Herrera 71 Jain 397Ling 211 Keller 1132 Knapp 529 Herron 220 Joshi 319Liu 1981 Kelly 1685 Knifton 201 Jimenez 90 Kamath 111Lo 503 Kennedy 1303 Koenig 307 Konopka 62 Kapoor 145Lu 650 King 2591 Kresge 125 Kulprathipanja 76 Khanna 210Ma 437 Klein 1372 Kukes 123 Lee 126 Krishnakumar 97Mao 178 Larson 1561 Lange 443 Lieb 62 Krishnamurthy 119
Table A4: Most Common Ethnic Surnames for Inventors Residing in the US
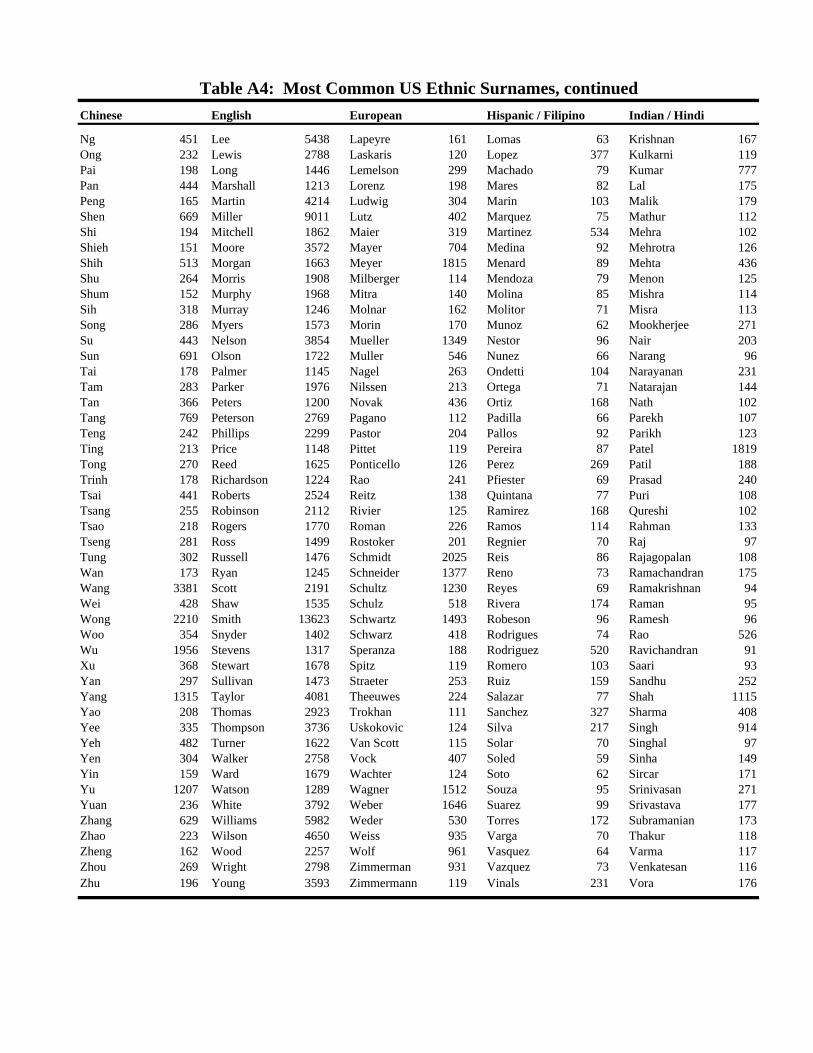
Chinese English European Hispanic / Filipino Indian / Hindi
Ng 451 Lee 5438 Lapeyre 161 Lomas 63 Krishnan 167Ong 232 Lewis 2788 Laskaris 120 Lopez 377 Kulkarni 119Pai 198 Long 1446 Lemelson 299 Machado 79 Kumar 777Pan 444 Marshall 1213 Lorenz 198 Mares 82 Lal 175Peng 165 Martin 4214 Ludwig 304 Marin 103 Malik 179Shen 669 Miller 9011 Lutz 402 Marquez 75 Mathur 112Shi 194 Mitchell 1862 Maier 319 Martinez 534 Mehra 102Shieh 151 Moore 3572 Mayer 704 Medina 92 Mehrotra 126Shih 513 Morgan 1663 Meyer 1815 Menard 89 Mehta 436Shu 264 Morris 1908 Milberger 114 Mendoza 79 Menon 125Shum 152 Murphy 1968 Mitra 140 Molina 85 Mishra 114Sih 318 Murray 1246 Molnar 162 Molitor 71 Misra 113Song 286 Myers 1573 Morin 170 Munoz 62 Mookherjee 271Su 443 Nelson 3854 Mueller 1349 Nestor 96 Nair 203Sun 691 Olson 1722 Muller 546 Nunez 66 Narang 96Tai 178 Palmer 1145 Nagel 263 Ondetti 104 Narayanan 231Tam 283 Parker 1976 Nilssen 213 Ortega 71 Natarajan 144Tan 366 Peters 1200 Novak 436 Ortiz 168 Nath 102Tang 769 Peterson 2769 Pagano 112 Padilla 66 Parekh 107Teng 242 Phillips 2299 Pastor 204 Pallos 92 Parikh 123Ting 213 Price 1148 Pittet 119 Pereira 87 Patel 1819Tong 270 Reed 1625 Ponticello 126 Perez 269 Patil 188Trinh 178 Richardson 1224 Rao 241 Pfiester 69 Prasad 240Tsai 441 Roberts 2524 Reitz 138 Quintana 77 Puri 108Tsang 255 Robinson 2112 Rivier 125 Ramirez 168 Qureshi 102Tsao 218 Rogers 1770 Roman 226 Ramos 114 Rahman 133Tseng 281 Ross 1499 Rostoker 201 Regnier 70 Raj 97Tung 302 Russell 1476 Schmidt 2025 Reis 86 Rajagopalan 108Wan 173 Ryan 1245 Schneider 1377 Reno 73 Ramachandran 175Wang 3381 Scott 2191 Schultz 1230 Reyes 69 Ramakrishnan 94Wei 428 Shaw 1535 Schulz 518 Rivera 174 Raman 95Wong 2210 Smith 13623 Schwartz 1493 Robeson 96 Ramesh 96Woo 354 Snyder 1402 Schwarz 418 Rodrigues 74 Rao 526Wu 1956 Stevens 1317 Speranza 188 Rodriguez 520 Ravichandran 91Xu 368 Stewart 1678 Spitz 119 Romero 103 Saari 93Yan 297 Sullivan 1473 Straeter 253 Ruiz 159 Sandhu 252Yang 1315 Taylor 4081 Theeuwes 224 Salazar 77 Shah 1115Yao 208 Thomas 2923 Trokhan 111 Sanchez 327 Sharma 408Yee 335 Thompson 3736 Uskokovic 124 Silva 217 Singh 914Yeh 482 Turner 1622 Van Scott 115 Solar 70 Singhal 97Yen 304 Walker 2758 Vock 407 Soled 59 Sinha 149Yin 159 Ward 1679 Wachter 124 Soto 62 Sircar 171Yu 1207 Watson 1289 Wagner 1512 Souza 95 Srinivasan 271Yuan 236 White 3792 Weber 1646 Suarez 99 Srivastava 177Zhang 629 Williams 5982 Weder 530 Torres 172 Subramanian 173Zhao 223 Wilson 4650 Weiss 935 Varga 70 Thakur 118Zheng 162 Wood 2257 Wolf 961 Vasquez 64 Varma 117Zhou 269 Wright 2798 Zimmerman 931 Vazquez 73 Venkatesan 116Zhu 196 Young 3593 Zimmermann 119 Vinals 231 Vora 176
Table A4: Most Common US Ethnic Surnames, continued

Japanese Korean Russian Vietnamese
Arakawa 46 Ahn 94 Aghajanian 64 Bahn 7Asato 73 Bae 65 Anscher 44 Banh 6Chen 36 Baek 25 Askin 39 Be 5Doi 51 Bak 34 Avakian 35 Bearce 7Fujii 40 Bang 34 Babler 58 Bi 35Fujimoto 55 Bark 23 Banko 34 Bich 15Fujioka 54 Cha 20 Barna 46 Bien 59Fukuda 64 Chai 77 Benko 33 Bihn 7Furukawa 35 Chin 541 Blonder 66 Bui 109Hasegawa 96 Cho 448 Borsuk 42 Can 6Hashimoto 72 Choe 100 Danko 52 Chich 5Hayashi 103 Choi 322 Dombroski 37 Diem 17Hey 33 Chon 16 Duvdevani 42 Dien 6Higham 35 Chong 99 Elko 36 Diep 26Higuchi 76 Choo 37 Favstritsky 44 Dinh 60Honda 40 Chun 155 Frenkel 50 DoMinh 16Hori 33 Chung 688 Garabedian 60 Doan 204Hornak 53 Drozd 22 Gelfand 81 Dominh 5Ide 111 Ewbank 21 Georgiev 41 Donlan 17Imai 92 Eyuboglu 27 Ginzburg 62 Dotrong 8Inoue 33 Gang 20 Gitlin 50 Dovan 26Irick 84 Gu 118 Godlewski 38 Duan 33Ishida 34 Hahm 18 Goralski 57 Due 6Ishii 37 Hahn 620 Gordin 42 Duong 52Ishikawa 59 Hansell 29 Gorin 58 Eskew 7Ito 140 Hogle 17 Gregorian 34 Gran 11Iwamoto 32 Hohn 19 Grinberg 64 Hoang 103Iwasaki 48 Hone 16 Grushkin 37 Hopping 8Izu 45 Hong 319 Grzybowski 36 Huynh 101Kaneko 72 Hosking 24 Gurevich 45 Huynh-Ba 8Kato 59 Hwang 517 Guzik 48 Khau 5Kaun 32 Hyun 32 Hrib 37 Khaw 9Kautz 64 Ih 16 Hynecek 58 Khieu 13Kawakami 33 Im 37 Ibrahim 103 Khu 5Kawasaki 56 Jang 94 Iranmanesh 44 Kiem 5Kaya 44 Jeong 34 Ivanov 37 Lahue 10Kimura 63 Ji 42 Janko 34 Laursen 19Kino 37 Jin 175 Jastrzebski 37 Lavan 11Kirihata 34 Joo 19 Juhasz 39 Le 415Kiwala 132 Ju 100 Kahle 89 Le Duc 6Kobayashi 125 Jung 205 Kaminski 254 Le Van 7Maki 81 Kahng 17 Kaminsky 62 Leen 10Maruyama 32 Kang 275 Kaplinsky 49 Loan 5Matsuda 36 Kim 1987 Keritsis 35 Luong 30Matsumoto 78 Ko 217 Khan 62 Ly 31Matsunaga 32 Koh 40 Khandros 55 Minh 17Miyano 54 Koo 90 Kneller 41 Nellums 12Mizuhara 83 Kun 54 Korsunsky 80 Nghiem 5Mori 39 Kwak 46 Kowal 57 Ngo 196Morita 40 Kwon 156 Kozel 33 Nguyen 1514Moslehi 103 Lee 325 Kulka 35 Nguyen-Dinh 7Motoyama 49 Lim 82 Kurkov 35 Nguyenphu 7
Table A4: Most Common US Ethnic Surnames, continued

Japanese Korean Russian Vietnamese
Najjar 76 Mennie 33 Lapidus 34 Nho 7Nakagawa 74 Min 71 Lee 48 Nhu 6Nakajima 32 Minshall 18 Lisak 36 Nieh 53Nakamura 74 Nam 18 Lopata 50 Nim 12Nakanishi 46 Nevins 24 Lukacs 37 Ninh 8Nakano 53 Nyce 18 Lysenko 39 Pham 286Nakao 41 Oh 151 Magnotta 35 Phy 19Nemoto 50 Paek 25 Mankovitz 34 Postman 8Nishimura 32 Paik 82 Messing 47 Quach 24Nishioka 43 Pak 64 Metlitsky 81 Quy 6Noda 48 Park 912 Mikhail 70 Roch 26Ogawa 39 Quay 58 Milkovic 46 Sien 6Ogura 57 Rhee 120 Minaskanian 39 Sinh 7Ohkawa 48 Rhim 17 Mooradian 50 Ta 39Okada 37 Rim 30 Nadelson 92 Takach 11Okamoto 62 Ronen 19 Nappholz 38 Tau 7Okumura 45 Ryang 24 Narayan 203 Thach 11Ono 34 Ryu 46 Neuwirth 42 Thai 16Ovshinsky 194 Sahm 24 Onopchenko 59 Thiem 10Saito 49 Sahoo 22 Orloff 36 Thut 16Sasaki 70 Sellstrom 23 Papadopoulos 47 Tiedt 6Sato 134 Seo 18 Pinchuk 62 Tiep 11Seto 37 Sheem 21 Pinsky 34 Tietjen 32Shibata 52 Shim 101 Raber 45 To 7Shida 45 Shin 149 Rabii 34 Ton-That 6Shimizu 32 Shinn 64 Rabinovich 52 Tran 631Shinkai 48 Sim 43 Rubsamen 47 Trandai 7Shoji 45 Sjostrom 18 Sahatjian 40 Trang 12Sigmund 35 So 149 Sarkisian 35 Trank 7Suto 33 Sohn 42 Sarraf 38 Tri 7Suzuki 152 Son 72 Schwan 77 Trieu 8Takahashi 81 Sue 36 Simko 70 Trong 7Takekoshi 50 Suh 188 Sipos 38 Truc 8Takeuchi 61 Suk 23 Skowronski 44 Tu 190Tamura 50 Sung 255 Smetana 42 Tuten 19Tanaka 191 Uhm 16 Sofranko 61 Tuy 14Ueda 34 Um 22 Sorkin 52 Ty 21Wada 47 Whang 40 Stanko 37 Van 18Watanabe 140 Won 48 Tabak 85 Van Cleve 30Yamada 62 Yi 56 Tepman 41 Van Dam 8Yamaguchi 42 Yim 55 Terzian 75 Van Le 18Yamamoto 178 Yohn 16 Tsinberg 38 Van Nguyen 11Yamasaki 42 Yoo 133 Tults 34 Van Pham 8Yamashita 32 Yoon 405 Uram 43 Van Phan 27Yasuda 50 You 58 Vartanian 42 Van Tran 13Yasui 51 Yuh 40 Veltman 39 Vo 95Yokoyama 52 Yum 69 Warchol 34 Vo-Dinh 19Yoshida 127 Yun 68 Wasilewski 34 Vu 141Yuan 40 Zhu 24 Welsch 44 Vuong 33
Table A4: Most Common US Ethnic Surnames, continued