the adoption and design of enterprise risk management practices: an empirical study
TRANSCRIPT

This article was downloaded by: [University of Toledo]On: 08 November 2014, At: 13:31Publisher: RoutledgeInforma Ltd Registered in England and Wales Registered Number: 1072954Registered office: Mortimer House, 37-41 Mortimer Street, London W1T 3JH,UK
European Accounting ReviewPublication details, including instructions for authorsand subscription information:http://www.tandfonline.com/loi/rear20
The Adoption and Design ofEnterprise Risk ManagementPractices: An Empirical StudyLeen Paape a & Roland F. Speklé aa Nyenrode Business University , Breukelen , theNetherlandsPublished online: 28 Feb 2012.
To cite this article: Leen Paape & Roland F. Speklé (2012) The Adoption and Design ofEnterprise Risk Management Practices: An Empirical Study, European Accounting Review,21:3, 533-564, DOI: 10.1080/09638180.2012.661937
To link to this article: http://dx.doi.org/10.1080/09638180.2012.661937
PLEASE SCROLL DOWN FOR ARTICLE
Taylor & Francis makes every effort to ensure the accuracy of all theinformation (the “Content”) contained in the publications on our platform.However, Taylor & Francis, our agents, and our licensors make norepresentations or warranties whatsoever as to the accuracy, completeness, orsuitability for any purpose of the Content. Any opinions and views expressedin this publication are the opinions and views of the authors, and are not theviews of or endorsed by Taylor & Francis. The accuracy of the Content shouldnot be relied upon and should be independently verified with primary sourcesof information. Taylor and Francis shall not be liable for any losses, actions,claims, proceedings, demands, costs, expenses, damages, and other liabilitieswhatsoever or howsoever caused arising directly or indirectly in connectionwith, in relation to or arising out of the use of the Content.
This article may be used for research, teaching, and private study purposes.Any substantial or systematic reproduction, redistribution, reselling, loan, sub-licensing, systematic supply, or distribution in any form to anyone is expressly

forbidden. Terms & Conditions of access and use can be found at http://www.tandfonline.com/page/terms-and-conditions
Dow
nloa
ded
by [
Uni
vers
ity o
f T
oled
o] a
t 13:
31 0
8 N
ovem
ber
2014

The Adoption and Design ofEnterprise Risk ManagementPractices: An Empirical Study
LEEN PAAPE and ROLAND F. SPEKLE
Nyenrode Business University, Breukelen, the Netherlands
(Received: November 2010; accepted: January 2012)
ABSTRACT We examine (1) the extent of enterprise risk management (ERM)implementation and the factors that are associated with cross-sectional differences inthe level of ERM adoption, and (2) specific risk management design choices and theireffect on perceived risk management effectiveness. Broadly consistent with previouswork in this area, we find that the extent of ERM implementation is influenced by theregulatory environment, internal factors, ownership structure, and firm and industry-related characteristics. In addition, we find that perceived risk managementeffectiveness is associated with the frequency of risk assessment and reporting, andwith the use of quantitative risk assessment techniques. However, our results raise someconcerns as to the COSO (Committee of Sponsoring Organizations) framework.Particularly, we find no evidence that application of the COSO framework improvesrisk management effectiveness. Neither do we find support for the mechanistic view onrisk management that is implied by COSO’s recommendations on risk appetite andtolerance.
1. Introduction
Over the last decade, there has been a growing interest in risk management. Sta-
keholders’ expectations regarding risk management have been rising rapidly,
especially since the recent financial crisis. In that crisis, weaknesses in risk man-
agement practices became painfully visible, and companies are currently under
significant pressure to strengthen their risk management systems and to take
appropriate actions to improve stakeholder value protection. This pressure is
European Accounting Review
Vol. 21, No. 3, 533–564, September 2012
Correspondence Address: Roland F. Spekle, Nyenrode Business University, PO Box 130, 3620 AC,
Breukelen, the Netherlands. Tel.:+31346291225; Email: [email protected]
Paper accepted by Salvador Carmona.
European Accounting Review
Vol. 21, No. 3, 533–564, September 2012
0963-8180 Print/1468-4497 Online/12/030533–32 # 2012 European Accounting Associationhttp://dx.doi.org/10.1080/09638180.2012.661937Published by Routledge Journals, Taylor & Francis Ltd on behalf of the EAA.
Dow
nloa
ded
by [
Uni
vers
ity o
f T
oled
o] a
t 13:
31 0
8 N
ovem
ber
2014

intensified by regulators and standard setters promulgating new risk management
rules and requirements. In addition, credit rating agencies like Standard & Poor’s
have begun to evaluate firms’ risk management systems as part of their credit
rating analysis.
In the wake of these increasing expectations, the idea of enterprise risk man-
agement (ERM) has gained substantial momentum as a potentially effective
response to risk management challenges. ERM differs from traditional con-
ceptions of risk management in its enterprise-spanning aspirations and in the
adoption of a holistic approach in which strategic, operational, reporting and
compliance risks are addressed simultaneously rather than separately. Such an
integrated approach should help companies to deal with risks and opportunities
more effectively, enhancing the entity’s capacity to create and preserve value
for its stakeholders (COSO, 2004a).
The emergence and evolution of ERM in practice has begun to attract research
attention, and an academic risk management literature is starting to develop. One
set of papers in this body of work examines the factors that influence ERM adop-
tion (e.g. Beasley et al., 2005; Kleffner et al., 2003; Liebenberg and Hoyt, 2003).
Other studies address the effects of ERM adoption on performance (Beasley
et al., 2008; Gordon et al., 2009). Yet another cluster of papers explores the
details of risk management practices in specific organisational settings (e.g.
Mikes, 2009; Wahlstrom, 2009; Woods, 2009). With this paper, we seek to
add to this incipient literature.
Our study aims to make three main contributions. One, based on survey data
from 825 organisations headquartered in the Netherlands, we provide new evi-
dence on the factors that are associated with the extent of ERM implementation.
This part of our study connects to previous work of Kleffner et al. (2003), Lieben-
berg and Hoyt (2003) and especially Beasley et al. (2005), and significantly
expands the empirical foundations of this research stream. Prior contributions
were based largely on US (Beasley et al., 2005; Liebenberg and Hoyt, 2003)
and Canadian (Kleffner et al., 2003) data.1 Our observations add a European per-
spective, allowing some new insights into the generalisability of the earlier find-
ings across different institutional contexts. This is important, because at least
some evidence suggests that ERM adoption might be conditional on the legal
and regulatory environment, and perhaps also on cultural factors (Beasley
et al., 2005; Liebenberg and Hoyt, 2003). In addition, our sample includes
small and medium-sized enterprises, as well as public sector and not-for-profit
organisations. Both of these groups were absent in earlier studies.
Two, we provide a relatively detailed description of current ERM practices,
shedding light on the specific design choices organisations make when configur-
ing and implementing their ERM systems. The existing literature has tended to
study ERM at a high level of aggregation. For instance, Liebenberg and Hoyt
(2003) and Beasley et al. (2008) rely on data on Chief Risk Officer appointments
as their sole indicator for ERM adoption. Beasley et al. (2005) use an ordinal
scale ranging from ‘no plans exist to implement ERM’ to ‘complete ERM is in
534 L. Paape and R.F. Spekle
Dow
nloa
ded
by [
Uni
vers
ity o
f T
oled
o] a
t 13:
31 0
8 N
ovem
ber
2014
place’ to capture the extent of ERM implementation.2 And Gordon et al. (2009)
measure ERM indirectly through the extent to which the organisation has been
successful in realising a number of generic strategic, operational, reporting and
compliance objectives. These studies, however, do not address the particulars
of ERM practices, nor the differences in ERM design between firms. Yet, there
is considerable variety in ERM across organisations. For instance, Arena et al.
(2010) provide case study evidence from three Italian firms that demonstrates
that ERM can be very different things to different organisations. In her study
of two large banks, Mikes (2009) concludes that systematic variations in ERM
practices exist, even within a single industry setting (see also Mikes, 2008). In
addition, Woods (2009) reports significant variety at the operational level of
the ERM system within a single large public sector organisation. As we still
know fairly little about the specific ERM design choices organisations make,
the attempt to document these choices in a large sample study is instructive in
its own right.
Three, we explore the relationship between ERM design choices and perceived
risk management effectiveness. A whole industry has emerged to assist firms in
improving their risk management systems and practices. In addition, several
semi-regulatory bodies have published frameworks to guide these efforts. The
most prominent of these is the COSO ERM framework (COSO, 2004a; cf.
Power, 2009). These normative frameworks implicitly or explicitly suggest
that their standards and recommendations represent so-called ‘best practices’.
This suggestion, however, does not have a clear theoretical or empirical foun-
dation. Even though some research papers present evidence to indicate that
ERM improves firm performance (Beasley et al., 2008; Gordon et al., 2009),
we found no studies that examine the effects of the specific recommendations
of COSO-type frameworks on risk management effectiveness. Therefore, the
question as to whether these frameworks actually help to advance sound risk
management is still largely unanswered, and it might well be the case that the
effort to standardise and codify risk management practices is premature
(Kaplan, 2011). Given the influence of these frameworks, empirical work addres-
sing the effects of the standards and recommendations on risk management effec-
tiveness seems long overdue. We take a step in that direction by analysing the
influence of various ERM design alternatives on the perceived quality of the
risk management system.
Our results regarding the extent of ERM implementation appear to replicate
most of the findings of earlier work in this line of research. Broadly consistent
with previous studies, we find that the extent of ERM implementation is influ-
enced by the regulatory environment, internal factors, ownership structure, and
firm and industry-related characteristics. These findings indicate that the
factors that are associated with ERM adoption are similar across different
national contexts. As to risk management effectiveness, we find that the fre-
quency of both risk assessment and risk reporting contribute to the perceived
quality of the ERM system. In addition, the use of quantitative methods to
The Adoption and Design of Enterprise Risk Management Practices 535
Dow
nloa
ded
by [
Uni
vers
ity o
f T
oled
o] a
t 13:
31 0
8 N
ovem
ber
2014

assess risk appears to improve ERM effectiveness. However, our results also raise
some concern as to the COSO ERM framework. Particularly, we find no evidence
that application of the COSO framework improves risk management effective-
ness. Neither do we find support for the mechanistic view on risk management
that is implicit in COSO’s recommendations on risk appetite and tolerance.
These findings might be taken to suggest that this framework does not fully
live up to its purpose, which is to help organisations establish sound risk
management.
The remainder of this paper is structured as follows. In Section 2, we provide
information on the data-set. Section 3 reports on the examination of the extent of
ERM implementation. Section 4 explores ERM design choices and their impact
on risk management effectiveness. Finally, Section 5 discusses the findings and
limitations of this study.
2. Data Collection and Sample
The survey data we rely on in this paper have been made available to us by a
research team involving representatives from PwC, Royal NIVRA (the Dutch
Institute of Chartered Public Accountants), the University of Groningen and
Nyenrode Business University.3 The composition of this team was quite
diverse, bringing together individuals from different professional backgrounds,
including two academics specialising in risk management (one of which also
has extensive practical experience in internal auditing), a researcher employed
by the professional association of auditors and an experienced risk management
consultant. To capitalise on these various backgrounds, the design of the ques-
tionnaire was set up as a joint team effort. A pre-test among four risk managers
and internal auditors confirmed the relevance, composition and clarity of wording
of the survey questions.
The aim of the research team was to provide a broad, factual picture of current
ERM practices and issues in the Netherlands for an audience of practitioners in
the field. Although the research team was familiar with the academic literature
in the field and used this literature in the construction of the survey, it had no
ex ante intention to connect to this literature, and it paid no explicit attention
to scholarly scale construction, validation and measurement considerations. As
a consequence, some of the variables on which we rely in this paper are somewhat
naive. In addition, because the questionnaire has not been designed with the
specific purposes of the current study in mind, the match between the available
information and the concepts on which we rely in our analyses is not always
perfect. Nevertheless, we believe that the data remain valuable because they
provide an informative glimpse into ERM adoption, design choices and
effectiveness.
Using information from company.info, the research team identified organis-
ations located in the Netherlands with annual revenues of more than EUR 10
million and more than 30 employees. A total of 9579 organisations appeared
536 L. Paape and R.F. Spekle
Dow
nloa
ded
by [
Uni
vers
ity o
f T
oled
o] a
t 13:
31 0
8 N
ovem
ber
2014
to fit these cumulative criteria. The survey was mailed to the board of these
organisations in May 2009, asking them to respond within four weeks. To
increase the response rate, the team ran a series of ads in several professional
journals, announcing the project and emphasising the importance of respondent
cooperation. Two hundred and forty questionnaires were undeliverable. Of the
remaining 9339 surveys, 928 were returned, resulting in an overall response
rate of 9.9%. Upon closer inspection, 103 responses were found not to match
the initial selection criteria after all, leaving a final sample of 825 observations.
Respondents were board members or CFOs (56%), controllers (20%) or (risk)
managers (24%).4
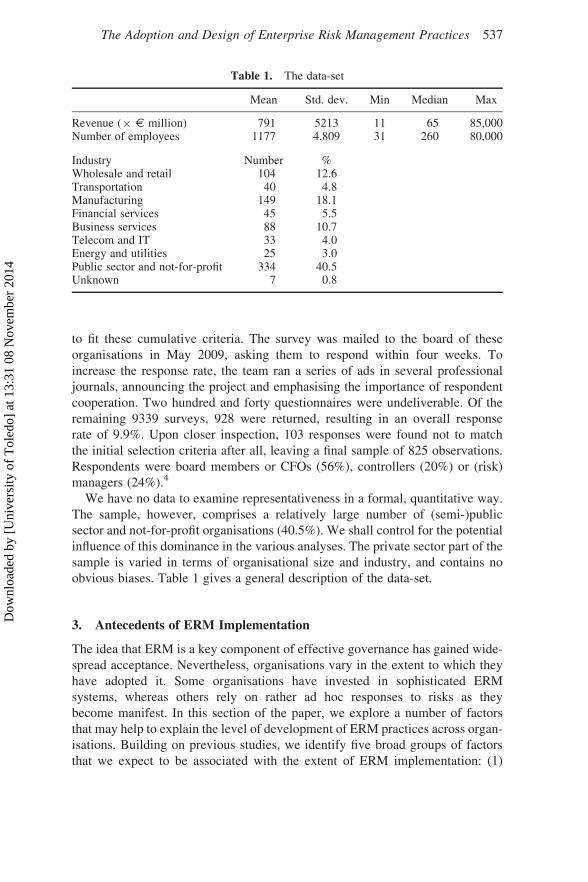
We have no data to examine representativeness in a formal, quantitative way.
The sample, however, comprises a relatively large number of (semi-)public
sector and not-for-profit organisations (40.5%). We shall control for the potential
influence of this dominance in the various analyses. The private sector part of the
sample is varied in terms of organisational size and industry, and contains no
obvious biases. Table 1 gives a general description of the data-set.
3. Antecedents of ERM Implementation
The idea that ERM is a key component of effective governance has gained wide-
spread acceptance. Nevertheless, organisations vary in the extent to which they
have adopted it. Some organisations have invested in sophisticated ERM
systems, whereas others rely on rather ad hoc responses to risks as they
become manifest. In this section of the paper, we explore a number of factors
that may help to explain the level of development of ERM practices across organ-
isations. Building on previous studies, we identify five broad groups of factors
that we expect to be associated with the extent of ERM implementation: (1)
Table 1. The data-set
Mean Std. dev. Min Median Max
Revenue (× E million) 791 5213 11 65 85,000Number of employees 1177 4.809 31 260 80,000
Industry Number %Wholesale and retail 104 12.6Transportation 40 4.8Manufacturing 149 18.1Financial services 45 5.5Business services 88 10.7Telecom and IT 33 4.0Energy and utilities 25 3.0Public sector and not-for-profit 334 40.5Unknown 7 0.8
The Adoption and Design of Enterprise Risk Management Practices 537
Dow
nloa
ded
by [
Uni
vers
ity o
f T
oled
o] a
t 13:
31 0
8 N
ovem
ber
2014

regulatory influences; (2) internal influences; (3) ownership; (4) auditor influ-
ence; and (5) firm and industry-related characteristics.
3.1. Factors Affecting Implementation: Expectations
Regulatory influences
In many countries, regulators are pressing firms to improve risk management and
risk reporting (Collier et al., 2006; Kleffner et al., 2003). Examples of such regu-
latory pressure include the NYSE Corporate Governance Rules and the Sarbanes–
Oxley Act in the USA, the Combined Code on Corporate Governance in the UK
and the Dutch Corporate Governance Code, also known as the Tabaksblat Code.
These codes apply to publicly listed firms, and require firms to maintain a sound
risk management system. Corporate governance regulation, however, has not
been confined to publicly traded companies. Governance rules are also common
in parts of the (semi-) public and not-for-profit sector. In addition, some trade
associations demand compliance with a governance code as a membership require-
ment. Like the formal rules that apply to listed companies, these codes typically
call for some form of systematic risk management, and we expect that many
ERM initiatives arose because of this regulatory pressure (cf. Collier et al.,
2006). Accordingly:
H1: Corporate governance regulation is positively associated with the
degree of ERM implementation.
Regulatory pressure differs in intensity. Some governance codes are mandatory
(e.g. the stock exchange rules and the Dutch public sector codes), whereas
others are being presented as optional ‘best practices’. Moreover, to the extent
that the codes are in fact mandatory, the intensity of enforcement varies. In the
Netherlands, the enforcement of corporate governance regulation seems to be
rather weak, except for firms listed on the Amsterdam Stock Exchange. In the dis-
cussion leading to H1, we argued that regulatory pressure is a driver of ERM
implementation. However, when corporate governance codes are non-binding
or when enforcement is weak, this pressure might be easy to ignore. Listed
firms are subjected to a special class of regulation, and for these firms, non-com-
pliance is a less viable option. Therefore:
H2: Listed firms have more fully developed ERM systems than non-
listed organisations.
Internal influences
The decision to implement ERM is rather consequential, affecting the entire
organisation and implying major organisational change. Such far-reaching
decisions require strong support from senior management. To emphasise
538 L. Paape and R.F. Spekle
Dow
nloa
ded
by [
Uni
vers
ity o
f T
oled
o] a
t 13:
31 0
8 N
ovem
ber
2014

their commitment to ERM, many organisations choose to locate ultimate
responsibility for risk management explicitly at the senior executive level
by appointing a Chief Risk Officer (CRO). Presumably, senior executive
leadership is a powerful catalyst for organisational change, and could signifi-
cantly speed up the process of ERM implementation (Beasley et al., 2005,
2008):
H3: The presence of a CRO is positively associated with the degree of
ERM implementation.
Another internal factor to affect ERM development is the presence of an audit
committee. Audit committees play an important role in the oversight of risk man-
agement practices. In this monitoring role, they can influence the board to ensure
that ERM gets adequate management attention, and that sufficient resources are
allocated to further ERM development:
H4: The presence of an audit committee is positively associated with the
degree of ERM implementation.
Ownership
Liebenberg and Hoyt (2003) argue that pressure from shareholders is an impor-
tant driving force behind ERM adoption (cf. also Mikes, 2009). Proponents of
ERM claim that shareholders benefit from integrated risk management because
ERM enables companies to improve risk-adjusted decision-making and increase
firm value. If that is true, shareholders are likely to be keen ERM supporters. The
effectiveness of shareholder pressure, however, differs across firms. If ownership
is dispersed, management might find it relatively easy to ignore shareholders’
preferences – at least temporarily. However, institutional investors are more
likely to be heard. This additional influence of institutional investors arises
from two related sources (Kane and Velury, 2004): (1) as institutional owners
hold large shares in the firm, they control a substantial part of the voting rights
that can be employed directly to influence management, and (2) the control of
large institutional block holders over the supply of capital is such that they can
affect the cost of capital of the firm, which ensures a greater receptiveness on
the side of management to their preferences – perhaps even to the extent that
they no longer need to voice their wishes explicitly, but can expect management
to anticipate these preferences. Consistent with this reasoning, Liebenberg and
Hoyt (2003) suggest that a higher degree of institutional ownership increases
the effectiveness of shareholder pressure, which in turn is positively associated
with the extent of ERM adoption:
H5: Institutional ownership is positively associated with the degree of
ERM implementation.
The Adoption and Design of Enterprise Risk Management Practices 539
Dow
nloa
ded
by [
Uni
vers
ity o
f T
oled
o] a
t 13:
31 0
8 N
ovem
ber
2014

Arguably, insider owners have even more influence over management than insti-
tutional owners, especially if they hold a controlling share in the firm. This is the
case in owner-managed firms in which ownership and control coincide. However,
owner-managers have less incentive to press for ERM. Because agency problems
between owners and management are absent in owner-managed firms, the value
of ERM is lower in such firms, ceteris paribus. Further, owner-managers tend to
rely less on formal control systems (Lovata and Costigan, 2002), which makes
them unlikely sponsors of ERM. Therefore:
H6: Owner-managed firms have less developed ERM systems.
Auditor influence
In the auditing literature, it is often proposed that larger auditing firms (i.e. the
Big 4) provide higher audit quality (see DeAngelo, 1981 for a classic reference
and Francis, 2004 for a recent overview). Such high-quality audit firms may be
more persuasive in encouraging clients to improve their ERM systems and prac-
tices. In addition, it might be the case that organisations that select high-quality
auditors are also more committed to risk management (Beasley et al., 2005), and
perhaps to good governance in general. Both lines of reasoning seem to imply
that firms that engage a Big 4 audit firm are likely to have more elaborate
ERM systems:
H7: Engagement of a Big 4 audit firm is positively associated with the
degree of ERM implementation.
Firm and industry-related characteristics
For some firms, the value of ERM is larger than for others. Liebenberg and Hoyt
(2003) hypothesise that ERM is especially important for firms that experience
significant growth (cf. also Beasley et al., 2008; Gordon et al., 2009). Such
firms face more uncertainties and require better risk management to control the
risks that emerge, but also to include the risk profile of various growth opportu-
nities in organisational decision-making (Collier et al., 2007; Liebenberg and
Hoyt, 2003). Thus:
H8: Organisational growth is positively associated with the degree of
ERM implementation.
The size of the organisation is also likely to affect the extent of ERM adoption
(Beasley et al., 2005; Kleffner et al., 2003). Presumably, there are considerable
economies of scale involved in operating an ERM system, and it may well be the
case that only larger organisations can afford a fully functional ERM system. In
addition, larger firms tend to be more formalised, which may be conducive to
ERM adoption:
540 L. Paape and R.F. Spekle
Dow
nloa
ded
by [
Uni
vers
ity o
f T
oled
o] a
t 13:
31 0
8 N
ovem
ber
2014

H9: Organisational size is positively associated with the extent of ERM
implementation.
Several studies in the ERM literature have proposed the existence of industry
effects. It is commonly assumed that firms in the financial services industry are
especially likely to embrace ERM (Beasley et al., 2005; Kleffner et al., 2003;
Liebenberg and Hoyt, 2003). Since the release of Basel II, banks have strong
incentives to adopt ERM as that may help to reduce capital requirements (Lieben-
berg and Hoyt, 2003; Mikes, 2009; Wahlstrom, 2009). In addition, ERM facili-
tates better disclosure of the firm’s risk exposure. This is especially important
in the banking industry, in which it is relatively easy for firms to opportunistically
change their risk profiles. Improved disclosure provides a means to make a cred-
ible commitment against this behaviour, thus lowering the cost of capital
(Liebenberg and Hoyt, 2003).
Another sector that seems more prone to ERM adoption is the energy industry.
Kleffner et al. (2003) report that energy firms are relatively heavy ERM users,
which they ascribe to the volatile markets in which these firms operate.
Because ERM may reduce earnings volatility (Liebenberg and Hoyt, 2003),
firms in such markets may value ERM more than firms that face stable market
conditions. Accordingly:
H10: Firms in the financial services industry (H10a) and energy sector
(H10b) have more fully developed ERM systems than firms in
other sectors of the economy.
Unlike previous studies in this line of research, our sample includes public sector
and not-for-profit organisations. The surge of risk management has not been con-
fined to the private sector, but has affected the public sector too. Mirroring the
private sector, the public sector now commonly sees risk management as an
important dimension of good governance and as an aid in the achievement of
organisational objectives (Woods, 2009). The various governance codes that
have been implemented in parts of the public sector are an expression of this.
There is nevertheless reason to believe that the diffusion of ERM has been
slower in the public sector relative to the private sector. Operating in a
complex and political environment, public sector organisations may find it par-
ticularly hard to operationalise their risk management agenda. In addition, avail-
able risk management tools and techniques tend to be highly analytical and data
driven (Mikes, 2009), which may not accord very well with the dominant culture
and management style in the public sector (cf. Bhimani, 2003; Mikes, 2009).
These considerations suggest that public sector organisations can be expected
to have less developed ERM systems:
H11: Relative to private sector firms, public sector organisations have
less developed ERM systems.
The Adoption and Design of Enterprise Risk Management Practices 541
Dow
nloa
ded
by [
Uni
vers
ity o
f T
oled
o] a
t 13:
31 0
8 N
ovem
ber
2014

3.2. Summary of Expectations and Measurement of Variables
Table 2 summarises the expectations and describes the measurement of the rel-
evant variables.
Almost all variables are factual and are based on straightforward survey ques-
tions that do not pose special measurement issues. The exception is the dependent
Table 2. Summary of expectations and measurement of variables
Dependent variable:Extent of ERM implementation (STAGE). Ordinal scale, adapted from Beasley et al.
(2005):1 ¼ risk management is mainly incident-driven; no plans exist to implement ERM2 ¼ we actively control risk in specific areas (e.g. health & safety, financial risk); we are
considering to implement a complete ERM3 ¼ we identify, assess and control risk in specific areas; we are planning to implement a
complete ERM4 ¼ we identify, assess and control strategic, financial, operational and compliance risks;
we are in the process of implementing a complete ERM5 ¼ we identify, assess and control strategic, financial, operational and compliance risks;
ERM is an integral part of the (strategic) planning & control cycle
Expectation MeasurementRegulatory influences: GOVERNCODE and STOCKEX are dummy
variables that take on a value of 1 if theorganisation is listed (STOCKEX) or whengovernance rules apply (GOVERNCODE).
† Governance code (+)† Stock exchange listing (+)
Internal influences: CRO and AUDITCOM are dummy variables thattake on a value of 1 if a Chief Risk Officer(CRO) or an audit committee (AUDITCOM) ispresent.
† Chief Risk Officer (+)† Audit Committee (+)
Ownership: INSTOWNER and OWNERMAN are dummyvariables that take on a value of 1 if themajority of shares are owned by institutionalinvestors (INSTOWNER), or if the firm ismanaged by an owner holding a controllingshare (OWNERMAN).
† Institutional ownership (+)† Owner-managed firm (2)
Auditor influence: BIG4 is a dummy variable that takes on a value of1 if the auditor is a Big 4 audit firm.† Big 4 audit firm (+)
Firm/industry characteristics: GROWTH is an ordinal variable expressing theaverage yearly growth of revenues over the lastthree years (1 ¼ less than 10%, 2 ¼ between10 and 25%, 3 ¼ more than 25%).
lnREVENUE is indicative of size and is calculatedas the natural log of revenue (or the size of thebudget in case of public sector organisations).
FINSERV, ENERGY and PUBSEC are industrydummies that take on a value of 1 if theorganisation belongs to the financial servicesindustry, the energy sector or the public sector.
† Growth opportunities (+)† Size (+)† Industry effects:
o Financial services (+)o Energy (+)o Public sector (2)
542 L. Paape and R.F. Spekle
Dow
nloa
ded
by [
Uni
vers
ity o
f T
oled
o] a
t 13:
31 0
8 N
ovem
ber
2014

variable, that is, the extent of ERM implementation (STAGE). STAGE is
measured using an ordinal scale, based on Beasley et al. (2005), but adapted to
suit the research interests of the team that constructed the survey (see Section
2). Specifically, whereas the original scale of Beasley et al. was based on
broad statements regarding (intentional) ERM implementation,5 the survey
items on which we rely contain additional descriptive detail regarding manifest
ERM practices. From the perspective of the current study, these adaptations
are potentially problematic because the added description of actual practices in
a particular answer category need not coincide with the ERM intentions described
in that same category. For instance, it is possible that an organisation actively
controls risk in specific areas (which should lead to a score of 2 or 3 on
STAGE; see Table 2), yet has no intentions to implement full-scale ERM
(which should lead to a score of 1). However, although this problem is quite
serious in principle, it does not appear to be so in fact. As none of the respondents
checked more than one of the relevant categories (which they could have done
given the technical design of the questionnaire), respondents apparently had no
major difficulty in scoring their organisations on the scale. This suggests that
in the real world as perceived by the respondents, the answer categories are
descriptively accurate after all.
The questionnaire contains additional information to support the implemen-
tation metric on which we rely. Respondents were asked to provide information
on the scope of their periodic risk identification and assessment efforts by indi-
cating whether or not they include each of the categories strategic, financial, oper-
ational, reporting and compliance risks in the exercise. Because ERM is
characterised by its broadness and comprehensive ambitions, the scope of risk
assessment is a highly relevant indicator of the extent of ERM implementation,6
and we expect a significant correlation between the scope of risk assessment
(measured by the number of risk categories included in periodic risk assessment)
and STAGE. In support of our implementation proxy, the data corroborate this
expectation (r ¼ 0.397; p ¼ 0.000). In addition, a factor analysis confirms that
both variables load on a single factor.
3.3. Analysis and Results
Table 3 provides an overview of the descriptive statistics. These statistics show
that approximately 11% of the organisations in the sample report having a
fully functional ERM system in place. Another 12.5% is currently in the
process of implementing such a system. Fourteen per cent do not seem to have
a systematic and proactive approach to risk management.
Table 4 presents the correlation matrix. The bivariate correlations indicate that
the extent of ERM implementation is associated with most of the independent
variables discussed in Section 3.1, providing some initial evidence in support
of the hypotheses. The matrix also indicates that the correlations between the
independent variables are low, and prompt no multicollinearity concerns.
The Adoption and Design of Enterprise Risk Management Practices 543
Dow
nloa
ded
by [
Uni
vers
ity o
f T
oled
o] a
t 13:
31 0
8 N
ovem
ber
2014

Because the dependent variable (extent of ERM implementation; STAGE) is
measured on an ordinal scale, and because most of the independent variables
are categorical, we test the hypotheses using ordinal logistic regression.
Table 5, panel A reports the results of this analysis. The model appears to fit
the data quite well (x2 ¼ 152.767, p ¼ 0.000; Cox and Snell pseudo R2 ¼
0.193). Further, the test of parallel lines (not reported) indicates that the slope
coefficients are the same across the various levels of the dependent variable
and that, consequently, ordinal logistic estimation is appropriate. Due to
missing values on some variables for various cases, we lose a number of obser-
vations in the regression, and the sample size drops from 825 to 714.
The results offer support for several of our expectations. We find that publicly
traded firms do in fact have more mature ERM systems (H2), whereas owner-
managed firms appear less inclined to invest in ERM development (H6). In
addition, we find the presence of both a CRO (H3) and an audit committee
(H4) to contribute to the degree of ERM implementation. Finally, we observe
that larger organisations (H9) and firms in the financial sector (H10a) tend to
have more sophisticated ERM systems. These results are generally consistent
with the findings of previous studies.
Contrary to hypothesis H5, we do not find an effect for institutional ownership.
A potential explanation could be that in the Netherlands, institutional block
holders are traditionally rather reluctant to interfere with management.
Table 3. Descriptive statistics extent of implementation
Ordinal and ratio variables
Mean Std. dev. Min Median Max
STAGE 2.68 1.190 1 2 5GROWTH 1.34 0.557 1 1 3lnREVENUE 4.43 1.447 2.35 4.17 11.35
Distribution of ordinal variables over response categories1 2 3 4 5
STAGE 114 (14.0%) 318 (38.9%) 192 (23.5%) 102 (12.5%) 91 (11.1%)
GROWTH 571 (70.6%) 203 (25.1%) 35 (4.3%) – –Nominal variables
Yes (¼ 1) No (¼ 0)GOVERNCODE 492 (60.8%) 317 (39.2%)STOCKEX 75 (9.1%) 747 (90.9%)CRO 154 (18.8%) 666 (81.2%)AUDITCOM 399 (51.3%) 420 (48.7%)INSTOWNER 82 (10.6%) 688 (89.4%)OWNERMAN 123 (16.0%) 647 (84.0%)BIG4 625 (77.2%) 185 (22.8%)FINSERV 45 (5.5%) 773 (94.5%)ENERGY 25 (3.1%) 793 (96.9%)PUBSEC 334 (40.8%) 484 (59.2%)
544 L. Paape and R.F. Spekle
Dow
nloa
ded
by [
Uni
vers
ity o
f T
oled
o] a
t 13:
31 0
8 N
ovem
ber
2014

Table 4. Spearman correlation matrix (extent of implementation)
1 2 3 4 5 6 7 8 9 10 11 12
1: STAGE 12: GOVERNCODE 0.198∗∗∗ 13: STOCKEX 0.216∗∗∗ 0.194∗∗∗ 14: CRO 0.245∗∗∗ 0.108∗∗∗ 0.105∗∗∗ 15: AUDITCOM 0.283∗∗∗ 0.183∗∗∗ 0.409∗∗∗ 0.208∗∗∗ 16: INSTOWNER 0.143∗∗∗ 0.286∗∗∗ 20.005 0.078∗∗ 0.100∗∗∗ 17: OWNERMAN 20.167∗∗∗ 20.088∗∗ 20.291∗∗∗ 20.051 20.304∗∗∗ 20.151∗∗∗ 18: BIG4 0.117∗∗∗ 0.101∗∗∗ 0.214∗∗∗ 0.016 0.236∗∗∗ 0.094∗ 20.252∗∗∗ 19: GROWTH 0.010 0.104∗∗∗ 20.063∗ 0.028 20.106∗∗∗ 0.162∗∗∗ 0.149∗∗∗ 20.106∗∗∗ 110: lnREVENUE 0.261∗∗∗ 0.192∗∗∗ 0.163∗∗∗ 0.021 0.222∗∗∗ 0.115∗∗∗ 20.175∗∗∗ 0.230∗∗∗ 20.042 111: FINSERV 0.150∗∗∗ 20.019 0.030 0.077∗∗ 0.115∗∗∗ 0.222∗∗∗ 0.004 0.080∗∗ 0.024 0.119∗∗∗ 112: ENERGY 0.064∗ 20.006 20.032 0.024 0.054 0.038 20.014 20.006 0.074∗ 0.023 20.043 113: PUBSEC 20.045 20.226∗∗∗ 0.289∗∗∗ 20.057 0.254∗∗∗ 20.239∗∗∗ 20.336∗∗∗ 0.189∗∗∗ 20.282∗∗∗ 20.032 20.200∗∗∗ 20.147∗∗∗
∗p , 0.10; ∗∗p , 0.05; ∗∗∗p , 0.01 (2-tailed).
Th
eA
do
ptio
na
nd
Desig
no
fE
nterp
riseR
iskM
an
ag
emen
tP
ractices
54
5
Dow
nloa
ded
by [
Uni
vers
ity o
f T
oled
o] a
t 13:
31 0
8 N
ovem
ber
2014

However, Liebenberg and Hoyt (2003) did not find an effect in their US-based
sample either. This could mean that investors do not value ERM adoption after
all. However, it can also mean that if ERM contributes to shareholder value
Table 5. Ordinal logistic regression results
Estimatea Std. error Wald p (2-tailed)
Panel A: full sample resultsDependent variable: STAGESample: 825; included observations: 714GOVERNCODE 0.180 0.166 1.184 0.276STOCKEX 0.674 0.273 6.072 0.014CRO 0.882 0.180 23.890 0.000AUDITCOM 0.577 0.166 12.048 0.001INSTOWNER 0.142 0.249 0.326 0.568OWNERMAN 20.419 0.221 3.596 0.058BIG4 0.168 0.178 0.884 0.347GROWTH (¼ 2) 0.017 0.364 0.002 0.963GROWTH (¼ 3) 0.065 0.354 0.034 0.854lnREVENUE 0.226 0.054 17.495 0.000FINSERV 0.857 0.343 6.247 0.012ENERGY 0.275 0.397 0.481 0.488PUBSEC 20.202 0.185 1.196 0.274
x2 ¼ 152.767; p ¼ 0.000Cox and Snell pseudo R2 ¼ 0.193
Panel B: sample excluding (semi-) public sector and not-for-profit organisationsDependent variable: STAGESample: 484; included observations: 424
GOVERNCODE 0.119 0.214 0.309 0.578STOCKEX 0.787 0.289 7.394 0.007CRO 0.876 0.229 14.614 0.000AUDITCOM 0.593 0.237 6.242 0.012INSTOWNER 0.142 0.262 0.293 0.588OWNERMAN 20.409 0.226 3.287 0.070BIG4 0.153 0.210 0.526 0.486GROWTH (¼ 2) 0.188 0.389 0.232 0.630GROWTH (¼ 3) 0.265 0.379 0.489 0.484lnREVENUE 0.194 0.063 9.359 0.002FINSERV 0.854 0.347 6.049 0.014ENERGY 0.274 0.398 0.475 0.491
x2 ¼ 119.035; p ¼ 0.000Cox and Snell pseudo R2 ¼ 0.245
aTo facilitate interpretation, the estimates we report for dummy variables express the effect when thevariable of interest takes on a value of 1. For example, the positive estimate we report for the variableCRO in panel A (0.882, p ¼ 0.000) indicates that firms that have a CRO also have more fullydeveloped ERM systems (i.e. higher scores on STAGE), ceteris paribus. This is different from theoutput generated by most statistical software packages (including SPSS) that typically return estimatesexpressing the effect when the variable of interest is zero.
546 L. Paape and R.F. Spekle
Dow
nloa
ded
by [
Uni
vers
ity o
f T
oled
o] a
t 13:
31 0
8 N
ovem
ber
2014

creation, companies will invest in ERM regardless of explicit shareholder
pressure. Our data do not allow us to differentiate between these rival
explanations.
The analysis does not lend support for the supposed influence of governance
codes (H1), suggesting that governance regulation and the associated pressure
to invest in risk management do not affect ERM development. However, we
do find that listed firms have more fully developed ERM systems (as per
H2). In conjunction, these findings might be taken as evidence that strong
code enforcement (which is typically absent, except for stock exchange regu-
lation) is required to affect the risk management behaviour of organisations.
However, these findings are also consistent with an alternative explanation
that holds that the absence of significant differences between organisations
that are subject to governance regulation and those to which no governance
codes apply is caused by widespread voluntary adoption of corporate govern-
ance regulation by the latter group (cf. Deumes and Knechel, 2008), and that
sustains that the effect of stock exchange listing has nothing to do with stricter
enforcement, but merely indicates that listed firms are more sophisticated in
general. The data do not allow a further examination of these alternative
explanations.
Prior studies provide mixed evidence on the effect of growth (H8). Gordon
et al. (2009) report a positive effect of growth opportunities on the extent of
ERM implementation. The results of Beasley et al. (2008) and Liebenberg and
Hoyt (2003), however, do not support this finding. The results of our study are
also negative in this respect. However, it should be emphasised that our
sample includes only 35 firms reporting high growth. Additional analysis
(details not reported here) shows that many of these high-growth firms are
owner-managed (42%), and that almost all of them are small. Given these
numbers, our null finding may not be very instructive.
It is interesting to note that in our analysis, auditor quality (H7) has no effect on
ERM development. This is at odds with Beasley et al. (2005), who did find a sig-
nificant and positive auditor effect. An explanation of this difference can perhaps
be found in the high quality of the Dutch audit profession. At least the Dutch pro-
fessional association of certified accountants believes that the quality of the
Dutch CPA is truly world class, even in smaller firms. If this is actually true,
there is no reason to expect that auditor identity matters in this Dutch sample
after all.
Finally, the industry effects (H10 and H11) seem to be limited to the
financial services sector. We observe no effects for the energy sector.
However, the number of energy firms in our sample is very small (25, or
only about 3% of the total sample size). Neither do we observe a public
sector effect, suggesting that ERM implementation is not hindered by the
inherently larger complexity of the political environment in which public
sector organisations operate.
The Adoption and Design of Enterprise Risk Management Practices 547
Dow
nloa
ded
by [
Uni
vers
ity o
f T
oled
o] a
t 13:
31 0
8 N
ovem
ber
2014

3.4. Additional Analysis
Despite the fact that we do not observe a public sector effect in the previous
analysis, we cannot rule out the possibility that the results of this analysis are
affected by the dominance of (semi-) public sector and not-for-profit organis-
ations in our sample (as reported in Table 1, 40.5% of the observations come
from such organisations). For this reason – and also to facilitate comparison
with previous studies in this line of research (e.g. Beasley et al., 2005; Kleffner
et al., 2003) – we rerun the analysis with a sample that excludes these organis-
ations. The results of this additional analysis are in Table 5, panel B. The findings
are qualitatively similar to the full sample results, and reinforce our original
inferences.
4. ERM Design and Perceived Effectiveness
In configuring their ERM systems, organisations need to face numerous design
choices. Over the years, a large industry has emerged to assist firms in making
these choices. In addition, several semi-regulatory bodies have published frame-
works to guide organisations in their ERM design and implementation efforts.
The best-known example is the COSO ERM framework (COSO, 2004a). This
framework, however, only provides very broad guidance, suggesting key prin-
ciples and concepts but leaving the details to the adopting organisations them-
selves. That is to say, COSO does actually attend to the everyday details of
risk management practice, but only in an annex to the framework (COSO,
2004b). This annex is explicitly not part of the framework itself, but intends to
provide practical illustrations that might be useful to those seeking to apply
ERM techniques. COSO emphasises that these illustrations should not be inter-
preted as preferred methods or best practices.
COSO’s cautious and unassuming position as to the practical side of ERM is
quite sensible, given the paucity of evidence-based knowledge of effective
ERM system design. Comprehensive ERM theories do not exist, and as far as
we know, there are no empirical studies that systematically document specific
ERM practices and their contribution to ERM effectiveness.7 Therefore, we
must assume that the application techniques described in the annex are based
on anecdotal evidence at best, and COSO is right not to present these illustrations
as actual prescriptions. However, as a consequence, ERM-adopting organisations
face very open-ended design problems, with little concrete guidance at the oper-
ational and instrumental level.
The data-set that has been made available to us includes information on
specific ERM design choices, particularly in the areas of risk identification and
assessment, and risk reporting and monitoring. We also have information on
risk tolerance definition. These data allow us to describe current practices,
tools and techniques in these areas, providing a broad overview of their incidence
and prevalence. In addition, the data-set contains information on perceived risk
548 L. Paape and R.F. Spekle
Dow
nloa
ded
by [
Uni
vers
ity o
f T
oled
o] a
t 13:
31 0
8 N
ovem
ber
2014

management effectiveness, providing the opportunity empirically to examine
possible relationships between ERM practices and effectiveness. This analysis
will be distinctly exploratory in nature. We have no clear theory to build on.
Neither is there any prior empirical research to inform a systematic development
of hypotheses. Therefore, we shall structure the analysis around a number of
research questions, and instead of trying to test theory, we shall focus the analysis
on finding answers to these questions. We organise the research questions in three
broad themes, corresponding with the areas identified above, that is, risk toler-
ance, risk identification and assessment, and risk reporting and monitoring.
However, we begin with a preliminary question: does application of the COSO
framework help organisations to implement an effective ERM system?
4.1. ERM Design Choices
The 2004 COSO report is generally viewed as the most authoritative ERM frame-
work. Given this reputation, one would expect to observe widespread application
of the framework in practice. Furthermore, if this framework deserves its repu-
tation, one would expect that its application improves risk management effective-
ness. Whether this is empirically true, however, is still an open question. Hence:
Q1: Does application of the COSO ERM framework contribute to risk
management effectiveness?
Risk tolerance
The entity’s risk appetite is a key concept in the COSO ERM framework. Risk
appetite refers to ‘the amount of risk, on a broad level, an entity is willing to
accept in pursuit of value’ (COSO, 2004a, p. 19). Risk appetite, thus, expresses
the organisation’s risk attitude at the level of the organisation as a whole. Risk
appetite is the starting point of COSO-type ERM, and according to COSO, organ-
isations need to consider and define their risk appetite, essentially as a precondi-
tion for successful risk management. Risk appetite may be expressed in
qualitative or quantitative terms, and COSO declares to be indifferent between
these two options. However, the COSO framework also proposes that in addition
to the expression of the entity’s high-level risk attitude, organisations need to
define their risk attitudes at a lower level of aggregation, that is, at the level of
specific objectives. At this lower level, COSO refers to the notion of risk toler-
ance, which is ‘the acceptable level of variation relative to achievement of a
specific objective’ (COSO, 2004a, p. 20). These risk tolerances are a further spe-
cification of the entity’s high-level risk appetite, and they should help the organ-
isation to remain within the boundaries of its stated risk appetite. At this lower
level, COSO conveys a clear preference for quantification: ‘risk tolerances can
be measured, and often are best measured in the same units as the related objec-
tives’ (COSO, 2004a, p. 40).
The Adoption and Design of Enterprise Risk Management Practices 549
Dow
nloa
ded
by [
Uni
vers
ity o
f T
oled
o] a
t 13:
31 0
8 N
ovem
ber
2014

In these recommendations on risk appetite and tolerance, COSO espouses a
highly mechanistic view on risk management. It is, however, uncertain
whether such a view is realistic and practicable. For instance, Collier et al.
(2007) find that subjective, heuristic methods of risk management are much
more common than the systems-based approaches advocated in much pro-
fessional training and in the professional literature. Power (2009) argues that
the idea of organisation-wide risk appetite and risk tolerance assumes that organ-
isations are unitary and intentional actors, which he regards as reductive, simplis-
tic and potentially misleading. In addition, COSO works from a very traditional
perspective on human decision-making in which agents are fully rational and risk
attitudes are explicable and stable. Such a perspective is hard to maintain in the
face of years of behavioural studies documenting systematic biases and situa-
tional and path dependencies in risky choice problems (e.g. Thaler and
Johnson, 1990; Tversky and Kahneman, 1992; see also Power, 2009).8 These
divergent positions feed into the second research question:
Q2: Does explication and quantification of risk tolerance improve risk
management effectiveness?
Risk identification and assessment
Organisations need to address the question as to the frequency of risk identifi-
cation and analysis. How often should the organisation go over the risks to ascer-
tain the availability of sufficient up-to-date information to act upon? Risk
exposure is not static, and it is plausible to assume that the frequency of risk
assessment should keep pace with changes in the environment. Additionally,
some minimum level of frequency may be required to ensure that risk manage-
ment becomes ingrained sufficiently deeply in the functioning of the organis-
ation, and to prevent it from becoming a merely ceremonial compliance
exercise (cf. Arena et al., 2010). The COSO framework is silent on these
issues, but they seem important nonetheless:
Q3: Is the frequency of risk assessment associated with risk management
effectiveness?
Another choice variable in the area of risk identification and assessment is the
number of management levels to include in the risk appraisal exercise. Is it suffi-
cient to localise risk assessment at the senior management level? Alternatively, is
it better to involve middle management as well? And if so, how far down does
one need to go? Although COSO does not provide a clear answer to these ques-
tions, it does indicate that even though the CEO has ultimate responsibility for
ERM, ERM is ‘the responsibility of everyone in an entity and therefore should
be an explicit or implicit part of everyone’s job description’ (COSO, 2004a,
p. 88). This seems altogether reasonable, not just from a shared responsibility
550 L. Paape and R.F. Spekle
Dow
nloa
ded
by [
Uni
vers
ity o
f T
oled
o] a
t 13:
31 0
8 N
ovem
ber
2014

perspective, but also from an information asymmetry point of view: if middle
managers enjoy an information advantage as to the specifics of their business
units or departments, it makes sense to engage them in risk identification and
assessment:
Q4: Does engagement of lower levels of management in risk assessment
contribute to risk management effectiveness?
Formally, COSO requires organisations to apply a combination of qualitative and
quantitative risk assessment techniques. However, a closer reading of the discus-
sion in the COSO report (2004a, p. 52) strongly suggests that this requirement is
merely a diplomatic way to express COSO’s preference for quantification, and
that the provision actually means that organisations should not rely on qualitative
methods alone, but should apply quantitative techniques if at all possible.
Accordingly:
Q5: Is the use of quantitative risk assessment techniques positively
associated with risk management effectiveness?
Risk reporting and monitoring
The process of risk management – from initial risk identification via risk
response selection to monitoring and evaluation – requires relevant, timely
and reliable information, and organisations that implement ERM need to invest
in information systems to support the risk management function. The COSO
ERM framework acknowledges this need, but its guidance as to the actual set-
up of these information systems is highly generic. COSO does, however, argue
that monitoring should ideally proceed on an ongoing basis, as continuous moni-
toring is more effective than separate evaluations (cf. COSO, 2004a, pp. 75–76):
separate evaluations take place after the fact and, consequently, are less able to
assure a timely response to problems as and when they occur. This suggests
that high-frequency risk reporting is valuable, and may enhance the quality of
risk management:
Q6: Does the frequency of risk reporting positively affect risk manage-
ment effectiveness?
In discussing the contents of risk reporting, COSO emphasises the need to report
all indentified ERM deficiencies (COSO, 2004a, p. 80). Internal risk reporting,
however, will typically be broader. The process of risk management can mean-
ingfully be conceptualised in terms of Demski’s decision-performance control
framework. This framework emphasises both the need for feedforward infor-
mation to calibrate and feed the decision model to arrive at an ‘optimal’ decision
(e.g. the organisation’s risk response), as well as feedback information to monitor
The Adoption and Design of Enterprise Risk Management Practices 551
Dow
nloa
ded
by [
Uni
vers
ity o
f T
oled
o] a
t 13:
31 0
8 N
ovem
ber
2014

the implementation of the risk response policy and to adapt the model and its
implementation to environmental disturbances (cf. Demksi, 1969). To support
monitoring and model calibration, internal risk reporting should include retro-
spective diagnostic data on current risk profiles and ongoing risk management
processes. For feedforward purposes, organisations might also demand prospec-
tive information as part of their regular risk reporting practices, for example,
information on important internal or external changes that may affect their risk
exposure and that should be included in future decision-making. It seems plaus-
ible to assume that risk management effectiveness is affected by the richness of
both this retrospective and prospective information:
Q7: Does the richness of retrospective (Q7a) and prospective (Q7b) risk
reporting enhance risk management effectiveness?
Control variables
Our sample contains data from organisations in varying stages of ERM
implementation. Some have fully fledged ERM systems in place, whereas
others have adopted ERM, but are still in the process of implementation. Stage
of implementation is likely to have an effect on perceived risk management effec-
tiveness. In addition, it may be the case that the extent of implementation is cor-
related with various specific design choices. For these reasons, we control for
differences in ERM implementation in the analysis. We also control for size
and potential industry effects. Consistent with previous research, we found that
firms in the financial services industry tend to have more fully developed ERM
systems in place (see Section 3). However, because the value of these systems
is typically higher in the financial services industry than in other sectors, it
might well be that the aspiration level as to the quality of the risk management
system is higher here as well. This would imply that perceived effectiveness is
lower, ceteris paribus. We also argued in Section 3 that the extent of ERM
implementation is likely to be lower in the public sector, because the standard
ERM approach does not seem to fit very well with the political environment in
which public sector organisations operate, nor with the dominant culture and
management style of these organisations. The data, however, did not support
these contentions, and we observed no differences in ERM implementation
between the public and the private sector. However, it is still possible that
there is a public sector effect in the analysis of risk management effectiveness,
and we explore this possibility by including a public sector dummy in the model.
4.2. Summary of Research Questions and Measurement of Variables
In Table 6, we summarise the research questions and describe the operationalisa-
tion of the variables. Most variables are rather factual in nature, and are based on
relatively uncomplicated survey questions that do not require much interpretation
552 L. Paape and R.F. Spekle
Dow
nloa
ded
by [
Uni
vers
ity o
f T
oled
o] a
t 13:
31 0
8 N
ovem
ber
2014

Table 6. Research questions and measurement of variables
Dependent variable:Effectiveness (EFFECTIVENESS) is measured by asking respondents to score the quality
of their risk management on a 10-point scale (1 ¼ deeply insufficient, 6 ¼ adequate, 10¼ excellent)
Research question MeasurementApplication of COSO COSO is a dummy variable that takes on a
value of 1 if the organisation reportsapplication of COSO.
Risk tolerance:† Explication/quantification of risk
tolerance (TOLERANCE)
TOLERANCE is measured using an ordinalscale:
1 ¼ no explication of risk tolerance2 ¼ risk tolerance is explicated in
qualitative terms3 ¼ risk tolerance is quantified
Risk identification and assessment: ASSESSFREQ expresses the frequency ofthe entity-wide risk identification/assessment exercise (1 ¼ never, 2 ¼yearly, 3 ¼ quarterly, 4 ¼ monthly, 5 ¼weekly).
LEVEL counts the number of managementlevels involved in risk identification/assessment. A score of 1 means that onlythe board is involved, 2 means that theexercise includes the board and themanagement level just below the board, etc.
QUANTMETHODS is a dummy that takes ona value of 1 if the organisations use one ormore of the following four techniques:scenario analysis, sensitivity analysis,simulation and stress testing.
† Frequency of risk assessment(ASSESSFREQ)
† Engagement of lower managementlevels (LEVEL)
† Quantitative risk assessment(QUANTMETHODS)
Risk reporting and monitoring: REPORTFREQ indicates how often theorganisation reports on risk to internalconstituencies (1 ¼ never, 2 ¼ ad hoc,3 ¼ yearly, 4 ¼ quarterly, 5 ¼ monthly,6 ¼ weekly).
Both RETROSPECT and PROSPECT countthe number of items from a 4-item list thatthe organisation includes in its standard riskreporting format. The list forRETROSPECT includes generalinformation on risks, the status of riskcontrol activities, critical risk indicators andincidents. The PROSPECT list comprisesdevelopments in risk profile, significantinternal changes, significant externalchanges and risk control improvements.
† Reporting frequency (REPORTFREQ)† Richness of reporting: retrospective
(RETROSPECT) and prospective(PROSPECT) information
Control variables: See Table 2.
The Adoption and Design of Enterprise Risk Management Practices 553
Dow
nloa
ded
by [
Uni
vers
ity o
f T
oled
o] a
t 13:
31 0
8 N
ovem
ber
2014

or judgement on the side of the respondent. This is, however, different for the
dependent variable, that is, risk management effectiveness. The scores on this
variable are based on the following survey question: ‘how would you rate your
organisation’s risk management system on a scale of 1 to 10?’ This question is
broad and open, and appears to be designed to capture respondents’ subjective
assessment of the contribution of the risk management system to the attainment
of the organisation’s (implicit or explicit) risk management objectives. The ques-
tion does not specify what is meant by a risk management system,9 nor the dimen-
sions that should be included in the quality assessment. For our purposes, this is
unfortunate, because it forces us to measure an inherently complex and multi-
faceted construct with a single survey item. However, the survey contains
additional information to support this metric. In another part of the questionnaire,
respondents were asked to indicate whether they believe that their risk manage-
ment system has helped them to cope with the effects of the financial crisis. The
scores on this question (measured on a 5-point Likert scale) seem a somewhat
narrow but relevant additional indicator of the quality of the risk management
system. This alternative proxy correlates significantly with the risk management
effectiveness measure on which we rely (r ¼ 0.197; p ¼ 0.000), suggesting that
our measure is at least reasonable.
4.3. Sample Selection and Descriptive Statistics on Current ERM Practices
Consistent with the aims of this study, we base the analysis of ERM practices and
effectiveness on the questionnaire responses from the organisations that have
actually adopted ERM. We define ERM adopters as organisations that report to
be in stage 4 or 5 on the scale we use to measure the extent of ERM implemen-
tation (STAGE; see Section 3.2 and Table 2). These organisations have
implemented broad and inclusive risk management systems that encompass stra-
tegic, financial, operational and compliance objectives, and have integrated ERM
in their (strategic) planning and control cycle – or are in the process of doing so.
The other organisations in the sample (i.e. those that are in stages 1–3) apply
more traditional, silo-based approaches to risk management, and although they
may consider ERM as an interesting alternative, they have not (yet) adopted
ERM. The number of ERM adopters in the sample is 193. This number includes
55 (semi-) public sector organisations (28.5%) and 25 firms from the financial
services sector (13.0%). All the following analyses are based on this subsample
of ERM adopters.
Table 7 presents descriptive statistics on perceived risk management effective-
ness and the various design choices. The data indicate that the average organis-
ation believes that the effectiveness of its risk management system is quite good
(7.33 on a 10-point scale). Only about 4% of the respondents report their system
to be less than satisfactory (score ≤ 5; details not tabulated), whereas approxi-
mately 16% consider their system to be outstanding (score ≥ 9).10 Despite its
acclaimed authority, application of the COSO ERM framework is not
554 L. Paape and R.F. Spekle
Dow
nloa
ded
by [
Uni
vers
ity o
f T
oled
o] a
t 13:
31 0
8 N
ovem
ber
2014

widespread. Only 43% of the organisations in the sample of ERM adopters apply
the COSO framework.11 However, this figure might underestimate COSO’s true
influence. Casual observation suggests that many organisations have hired con-
sulting firms to help design and implement the ERM system, and it seems plaus-
ible that the solution packages offered by these consultants are in fact heavily
influenced by COSO. If this is actually the case, the (indirect) impact of COSO
on current ERM practices is much larger than the reported application rate
suggests. Another interesting fact is that the mean score on TOLERANCE is
1.84, which seems to imply that a quantification of risk tolerance is not very
common. This is indeed the case. A further analysis of this variable (not tabu-
lated) reveals that only 31% of the respondents express risk tolerance in quanti-
tative terms. Almost half of the organisations convey that they do not explicate
risk tolerance; not even in qualitative terms.
4.4. The Relationship between ERM Design and Effectiveness: Analysis and
Results
Table 8 displays the correlation matrix. This matrix provides initial evidence that
perceived risk management effectiveness is in fact dependent on most of the
design choices identified in Section 4.1, at least in a bivariate analysis. This
table also shows that the design choices are to some extent interrelated, as
many correlations between the independent variables are significant. The corre-
lations are, however, low enough not to signal multicollinearity issues.12
We explore the impact of the various design choices on risk management
effectiveness by estimating a multivariate OLS model that includes all design
variables on which we have information, and a number of control variables to
Table 7. Descriptive statistics design and effectiveness variables
Ordinal and ratio variables
Mean Std. dev. Scale Min Median Max
EFFECTIVENESS 7.33 1.083 1–10 3 7 10TOLERANCE 1.84 0.906 1–3 1 1.5 3ASSESSFREQ 2.41 0.801 1–5 1 2 5LEVEL 2.67 1.154 1–5 1 3 5REPORTFREQ 4.15 1.035 1–6 1 4 6RETROSPECT 2.20 1.044 0–4 0 2 4PROSPECT 1.79 1.282 0–4 0 2 4STAGE 4.47 0.500 4–5 4 4 5lnREVENUE 5.09 1.964 – 2.40 4.55 11.35
Nominal variablesYes (¼ 1) No (¼ 0)
COSO 83 (43%) 110 (57%)QUANTMETHODS 114 (60.6%) 74 (39.4%)
The Adoption and Design of Enterprise Risk Management Practices 555
Dow
nloa
ded
by [
Uni
vers
ity o
f T
oled
o] a
t 13:
31 0
8 N
ovem
ber
2014

Table 8. Spearman correlation matrix (design and effectiveness)
1 2 3 4 5 6 7 8 9 10 11 12
1: EFFECTIVENESS 12: COSO 0.032 13: TOLERANCE 0.134∗ 0.019 14: ASSESSFREQ 0.221∗∗∗ 20.131∗ 0.130∗ 15: LEVEL 0.143∗ 0.193∗∗∗ 0.019 20.041 16: QUANTMETHODS 0.240∗∗∗ 20.016 0.290∗∗∗ 0.212∗∗∗ 20.087 17: REPORTFREQ 0.189∗∗∗ 20.119 0.103 0.340∗∗∗ 0.047 0.050 18: RETROSPECT 0.011 0.062 0.026 0.046 0.139∗ 0.028 0.169∗∗ 19: PROSPECT 0.051 20.092 20.129∗ 0.124∗ 0.048 0.147∗∗ 20.061 0.255∗∗∗ 110: STAGE 0.318∗∗∗ 20.045 0.165∗∗ 0.177∗∗ 0.206∗∗∗ 0.066 0.001 0.130∗ 0.065 111: lnREVENUE 0.055 0.346∗∗∗ 0.098 20.055 0.170∗∗ 20.009 20.041 0.216∗∗∗ 20.033 20.008 112: FINSERV 0.017 0.098 0.075 0.042 0.056 0.119 0.244∗∗∗ 0.324∗∗∗ 0.147∗∗ 20.055 0.044 113: PUBSEC 20.173∗∗ 20.091 20.078 20.039 20.035 20.197∗∗∗ 20.267∗∗∗ 0.023 0.049 0.095 20.098 20.247∗∗∗
∗p , 0.10; ∗∗p , 0.05; ∗∗∗p , 0.01 (2-tailed).
55
6L
.P
aa
pe
an
dR
.F.
Sp
ekle
Dow
nloa
ded
by [
Uni
vers
ity o
f T
oled
o] a
t 13:
31 0
8 N
ovem
ber
2014

capture possible size and industry effects. Due to missing values, we lose 37
observations in this analysis, and we run the model using data from 156 organis-
ations. Table 9 reports the results.
The model explains 22.9% of the variance in the dependent variable (adjusted
R2 ¼ 0.164). The regression results show that perceived risk management effec-
tiveness is affected by the extent of implementation: unsurprisingly, organis-
ations that have adopted ERM but are still in the process of implementation
are less positive about the effectiveness of their systems than those that have
already finalised implementation. Furthermore, the results suggest that appli-
cation of the COSO ERM framework as such does not help to improve risk man-
agement quality (Q1), and that quantification of risk tolerances does not
contribute to perceived risk management effectiveness (Q2). These results
raise some rather profound questions as to the generally acclaimed authority of
COSO as the leading framework in ERM. We defer the discussion of these ques-
tions to Section 5.
Several research questions in the areas of risk identification/assessment and
risk reporting/monitoring can be answered affirmatively. Thus, we find that
the frequency of risk assessment (Q3), the use of quantitative risk assessment
techniques (Q5) and the frequency of risk reporting (Q6) contribute to perceived
risk management effectiveness. However, we do not find a significant effect for
the engagement of lower levels of management (Q4): apparently, devolvement of
risk assessment does not generally improve risk management effectiveness.
Neither do we find that the richness of retrospective and prospective risk report-
ing (Q7a and Q7b) helps to advance the quality of risk management.
Table 9. OLS regression results
Dependent variable: EFFECTIVENESSSample: 193; included observations: 156
Coefficient Std. error t p (2-tailed)
Intercept 4.191 0.690 6.072 0.000COSO 0.129 0.142 0.909 0.365TOLERANCE 20.010 0.079 20.121 0.904ASSESSFREQ 0.196 0.090 2.185 0.031LEVEL 20.009 0.061 20.138 0.890QUANTMETHODS 0.321 0.150 2.137 0.034REPORTFREQ 0.133 0.075 1.778 0.078RETROSPECT 0.021 0.073 0.292 0.771PROSPECT 0.018 0.055 0.327 0.744STAGE 0.431 0.141 3.064 0.003lnREVENUE 0.007 0.035 0.201 0.841FINSERV 20.248 0.208 21.195 0.234PUBSEC 20.284 0.158 21.796 0.075
F ¼ 3.534; p ¼ 0.000R2 ¼ 0.229; adjusted R2 ¼ 0.164
The Adoption and Design of Enterprise Risk Management Practices 557
Dow
nloa
ded
by [
Uni
vers
ity o
f T
oled
o] a
t 13:
31 0
8 N
ovem
ber
2014

Organisational size does not seem to matter. There are, however, industry effects.
Although firms in the financial services industry do not appear to differ from the
average firm in the sample, we do observe a significant negative effect for organ-
isations in the (semi-) public sector. This finding will also be discussed more fully
in Section 5.
4.5. Additional Analysis
The sample of ERM adopters contains a relatively large number of (semi-) public
sector and not-for-profit organisations (55 organisations, or 28.5% of the sample).
Although we included a dummy variable in the analysis to control for sector
effects, this does not fully exclude the possibility that the results reported in
Table 9 are affected by the relatively large proportion of (semi-) public sector
and not-for-profit organisations in the sample. Therefore, we run an additional
analysis with a sample that only includes observations from private sector
firms. This (untabulated) analysis returns similar results, confirming the original
findings.
The questionnaire asked respondents to score the quality of their risk manage-
ment system on a 10-point scale. This being a rather fine-grained scale, respon-
dents might have had some difficulties in scoring their systems. Although we do
expect respondents generally to know whether their risk management is poor, suf-
ficient or excellent, they may have trouble judging whether their system is worth
a 7 or a 6. To mitigate this potential problem, we transform the original effective-
ness scores into three broader levels of effectiveness,13 that is, poor (≤ 5), suffi-
cient (6–7) and excellent (≥ 8), and rerun the analysis, now using logistic
regression. The results of this analysis (not tabulated for sake of brevity) are
very similar to the original findings, except for the effect of the use of quantitative
risk assessment methods (QUANTMETHODS), which is no longer significant.
All other findings remain unaffected, reinforcing our earlier inferences.
5. Discussion
In this paper, we examined two main themes relating to ERM. First, we studied
the extent of ERM implementation and the factors that may help to explain cross-
sectional differences in the level of adoption. In the second part of the study, we
explored specific ERM design choices and their association with perceived risk
management effectiveness. The first part of the paper builds on the findings of
previous research into the extent of implementation (e.g. Beasley et al., 2005;
Kleffner et al., 2003; Liebenberg and Hoyt, 2003). Using data from 825 organis-
ations, our study considerably broadens the empirical basis underlying this
stream of research. Specifically, whereas prior studies were based mainly on
US and Canadian data, we work with data from organisations headquartered in
the Netherlands, allowing some insights into the generalisability of the earlier
findings in a different institutional context. In addition, unlike earlier studies,
558 L. Paape and R.F. Spekle
Dow
nloa
ded
by [
Uni
vers
ity o
f T
oled
o] a
t 13:
31 0
8 N
ovem
ber
2014

we include small and medium-sized enterprises, as well as public sector organis-
ations. The findings largely corroborate the results of prior work, suggesting that
the factors that are associated with ERM implementation are similar across differ-
ent national contexts. Particularly, we found that publicly traded firms and organ-
isations with a CRO and audit committee have more mature ERM systems,
whereas the applicability of corporate governance regulation does not appear
to influence ERM adoption. In addition, we found that larger organisations and
firms in the financial sector tend to have more sophisticated ERM systems.
These results are all consistent with prior empirical work. There is no evidence
of an effect of institutional ownership, which is also consistent with previous
findings. We do, however, observe that owner-managed firms are less prone to
invest in ERM. Earlier studies did not include this factor. Finally, we found no
auditor-related influences, suggesting that in the Netherlands, Big 4 and non-
Big 4 audit firms are equally effective in promoting high-quality ERM among
their clients.
The second part of the paper addresses specific ERM design choices and their
relation with risk management effectiveness. As far as we know, our paper is the
first larger scale empirical study to examine this relation. In the analysis, we
found that the frequency of risk assessment, the use of quantitative risk assess-
ment techniques and the frequency of risk reporting contribute to perceived
risk management effectiveness. In addition, we observe that on average, public
sector organisations report lower risk management effectiveness than private
sector organisations. In the part of the paper focusing on ERM adoption, we
argued that public sector organisations may experience unique problems in
ERM implementation due to the complex political environment in which they
operate and their dominant culture and management style. The data did not cor-
roborate this expectation. However, in conjunction with the negative public
sector effect in the analysis of risk management effectiveness, the analysis
suggests the following interpretation: it may be the case that in the public
sector, organisations seek to conform to general expectations by implementing
ERM systems that are relatively sophisticated from a technical point of view,
even though the generic ERM concepts, tools and techniques are less effective
in a public sector context. This suggests that there may be considerable value
in developing an ERM approach that is more tailored to the specific needs and
circumstances of the public sector. This seems an important challenge for regu-
lators and standard-setting agencies, and also an interesting research opportunity.
Research in this area is remarkably scarce, and further theoretical and empirical
work would certainly help to gain a deeper understanding of the functioning of
risk management in a public sector context.
Several factors included in the analysis do not appear to affect risk manage-
ment effectiveness. Some of these null results are perhaps even more interesting
than the positive findings. For instance, even though the data might underestimate
the true influence of COSO ERM, we found that only 43% of ERM adopters actu-
ally use that framework. In addition, we found that application of the COSO ERM
The Adoption and Design of Enterprise Risk Management Practices 559
Dow
nloa
ded
by [
Uni
vers
ity o
f T
oled
o] a
t 13:
31 0
8 N
ovem
ber
2014

framework does not contribute to risk management effectiveness. These findings
raise concern as to the assumed authoritative status of this framework. If the fra-
mework is actually good, why do so many firms choose not to use it? Moreover,
why are firms that do use it not more successful than those that don’t? Another
interesting observation is that the majority (66%) of organisations do not quantify
risk tolerances. In fact, approximately half of them do not explicate risk toler-
ances at all. This practice is contrary to COSO, which claims that explication
of risk appetite and, subsequently, quantification of risk tolerances is essentially
a conditio sine qua non for reliable risk management. The regression results,
however, indicate that explication and quantification of risk tolerances do not
contribute to perceived risk management effectiveness. Taken together, these
negative findings challenge the validity of some of COSO’s key assumptions.
The COSO framework is predicated on the idea that sound risk management
should be highly structured, starting with an explicit definition of the organis-
ation’s overall risk appetite, followed by a deductive process to decompose the
risk appetite into quantified risk tolerances at the level of specific objectives,
which subsequently need to be matched with appropriate risk responses and
control activities to ensure that the organisation remains within the pre-set bound-
aries. This mechanistic and technocratic perspective has been criticised for being
built on a reductionist notion of organisations as unitary and intentional actors,
and for assuming hyperrational human agency (Power, 2009). Our empirical evi-
dence also suggests that this perspective might be misguided. That is to say, the
majority of organisations do not seem to embrace COSO’s systematic, ‘calcula-
tive’ (Mikes, 2009) approach, and apparently without loss of effectiveness. This
may be taken to imply that a less structured, more heuristic approach to risk man-
agement is feasible (cf. also Collier et al., 2007; Mikes, 2009). A practical impli-
cation of this inference would be that standard setters may wish to reconsider
their frameworks to accommodate more subjective and exploratory risk manage-
ment styles.
Overall, the findings of our study reflect that ERM is still in a developing stage,
and that important knowledge gaps remain – both in practice and in academe.
Seeking to conform to rapidly increasing expectations from stakeholders and reg-
ulators, organisations struggle with the (re-)design of their risk management
systems, looking for effective approaches that suit their needs. Although standard
setters present ERM as an effective response to risk management challenges, only
a minority of respondents (11%) report to have fully functional ERM systems in
place, while another 13% is in the process of implementing such a system. A sig-
nificantly larger group is still considering ERM implementation (39%). These
observations indicate that the practice of risk management has not yet matured,
and that new and innovative approaches might emerge over time. Remarkably,
standard setters appear quite eager to codify ‘best practices’, apparently ignoring
that such practices may be hard to identify at a point in time at which risk man-
agement practices are still being tried and tested by organisations. In the mean-
time, academic research offers precious little guidance to inform the design of
560 L. Paape and R.F. Spekle
Dow
nloa
ded
by [
Uni
vers
ity o
f T
oled
o] a
t 13:
31 0
8 N
ovem
ber
2014

effective risk management systems, and many questions remain unanswered –
including some very basic ones. For instance, we have only got a rudimentary
understanding of how decision-makers respond to information on risk, and
how these responses can be influenced to ensure a proper weighting of risk in
the decision. In addition, we know virtually nothing about how organisations
integrate risk management in their management control structures to guide the
behaviour of lower level managers in decentralised organisations. This list
could easily be expanded. Given the relevance of risk management in contempor-
ary organisations, questions such as these should be high on the agenda of the
accounting research community (cf. Kaplan, 2011).
This study has several limitations that should be recognised when interpreting
the evidence. Although we cherish the permission to use the data, the fact that we
rely on secondary data forced us to focus the analysis on the factors on which we
have information, rather than on the factors that are most interesting from the
point of view of this paper. Fortunately, the two largely coincide. Nevertheless,
it would have been interesting to include, for instance, the way in which organ-
isations have integrated risk management in a strategy setting, or to study the
impact of the internal environment on risk management effectiveness – to
name but a few of the central themes of the COSO ERM framework. For now,
we must leave the exploration of these factors to future research.
Another consequence of our reliance on this particular data-set is that some of
our measures are rather naive. Most variables are single item metrics. Although
this is adequate for the more factual variables (actually, most of the independent
variables qualify as such), several other constructs are so complex that measur-
ing them with only one indicator is clearly not ideal. Especially, the measure-
ment of perceived risk management effectiveness could be improved, and we
expect future studies to make significant progress in that area. It should also
be emphasised that the effectiveness measure is based on perceptions rather
than on ‘hard’ data. Therefore, the scores on this measure may be biased, and
they may be an inaccurate reflection of the actual contribution of ERM to the
functioning of the organisation (cf. Ittner and Larcker, 2001). On the other
hand, the organisational position of the respondents seems to ensure that they
are knowledgeable about the functioning of the risk management systems and
able to make meaningful evaluative statements about these systems. Therefore,
we believe that the analysis is at least informative of current risk management
practices and of the contribution of elementary design choices to overall risk
management quality. As a first step towards a more rigorous, evidence-based
understanding of successful risk management practices, this seems well
worth the effort.
Acknowledgements
The data on which this paper relies have been collected by a research team invol-
ving PwC, Royal NIVRA, the University of Groningen and Nyenrode Business
The Adoption and Design of Enterprise Risk Management Practices 561
Dow
nloa
ded
by [
Uni
vers
ity o
f T
oled
o] a
t 13:
31 0
8 N
ovem
ber
2014
University. We thank the research team for generously sharing its data with us.
This paper has benefited from insightful comments and suggestions from two
anonymous reviewers and the (past) editor Salvador Carmona. We also acknowl-
edge valuable feedback on earlier versions from Max Brecher, Ivo De Loo,
Jacques de Swart, Anne-Marie Kruis, Hans Strikwerda, Frank Verbeeten, Sally
Widener, and conference participants at the 2010 Conference of the Management
Control Association, the 2011 European Conference on Corporate Governance &
Internal Auditing and the Annual Congress 2011 of the European Accounting
Association.
Notes
1In addition to these US-based and Canadian studies, Collier et al. (2007) surveyed risk manage-
ment practices in the UK. However, because their examination of the drivers of ERM
implementation is limited to an analysis of bivariate correlations, it is difficult to relate their
findings to the other studies in this line of research.2In our analysis of the factors associated with the extent of ERM implementation, we adopt a
similar metric.3One of the authors of the current paper was involved in this team.4The fact that the respondents come from different functional groups and hierarchical levels does
not affect our analyses. We included dummy variables in all regressions to control for possible
effects related to the organisational position of the respondents, but found none. The dummies
were insignificant in the regressions, and their inclusion did not alter the substantive findings of
the analyses. The regression results we report in Sections 3 and 4 exclude the respondent
dummies.5The Beasley scale is as follows: (1) no plans exist to implement ERM; (2) investigating ERM,
but no decision made yet; (3) planning to implement ERM; (4) partial ERM is in place; and (5)
complete ERM is in place (Beasley et al., 2005).6We considered using this information as an alternative to STAGE in the analyses. This,
however, is not an attractive option for two reasons. First, using the alternative metric would
complicate comparison with the results from previous studies (particularly Beasley et al.,
2005). Second, using the alternative metric would cost us well over 200 observations due to
missing values (the survey instrument instructed respondents only to complete the relevant
questions in specific circumstances).7To the best of our knowledge, the only study that explores the relationship between ERM design
and effectiveness is Collier et al. (2007). This study, however, examines risk management prac-
tices at a high level of aggregation, using broad categories of practices as independent variables,
rather than specific instruments and techniques.8Remarkably, COSO appears to be well aware of this behavioural literature (see, for instance,
COSO, 2004a, pp. 51–52). It is unclear why COSO has chosen to ignore the implications of
this work.9We mitigate this specific problem by restricting the empirical analysis of ERM effectiveness to
organisations that have adopted ERM (see Section 4.3). This restriction ensures that all included
respondents subscribe to the notion of ERM, and we can be reasonably assured that their point
of reference in scoring their risk management system is sufficiently similar to allow a meaning-
ful comparison. We thank an anonymous reviewer for suggesting this approach.10In the total sample (i.e. including organisations in stages 1–3), the average grade is 6.44, with
approximately 20% of respondents indicating that their system is not sufficient.11In the total sample (including firms that have not (yet) adopted ERM), 21.5% of the respondents
report to apply (elements of) COSO.
562 L. Paape and R.F. Spekle
Dow
nloa
ded
by [
Uni
vers
ity o
f T
oled
o] a
t 13:
31 0
8 N
ovem
ber
2014
12A diagnosis of the variance inflation factors (VIF) confirms this; the highest VIF in the analysis
is only 1.382.13We thank an anonymous reviewer for this suggestion.
References
Arena, M., Arnaboldi, M. and Azzone, G. (2010) The organizational dynamics of enterprise risk man-
agement, Accounting, Organizations and Society, 35(7), pp. 659–675.
Beasley, M. S., Clune, R. and Hermanson, D. R. (2005) Enterprise risk management: an empirical
analysis of factors associated with the extent of implementation, Journal of Accounting and
Public Policy, 24, pp. 521–531.
Beasley, M., Pagach, D. and Warr, R. (2008) Information conveyed in hiring announcements of senior
executives overseeing enterprise-wide risk management processes, Journal of Accounting,
Auditing & Finance, 23, pp. 311–332.
Bhimani, A. (2003) A study of the emergence of management accounting system ethos and
its influence on perceived system success, Accounting, Organizations and Society, 28, pp.
523–548.
Collier, P. M., Berry, A. J. and Burke, G. T. (2006) Risk and management accounting: best practice
guidelines for enterprise-wide internal control procedures, CIMA Research Executive Summary
Series, 2(11).
Collier, P. M., Berry, A. J. and Burke, G. T. (2007) Risk and Management Accounting: Best Practice
Guidelines for Enterprise-Wide Internal Control Procedures (Oxford: CIMA/Elsevier).
COSO (2004a) Enterprise Risk Management – Integrated Framework. Executive Summary & Frame-
work (Committee of Sponsoring Organizations of the Treadway Commission).
COSO (2004b) Enterprise Risk Management – Integrated Framework: Application Techniques.
Executive Summary & Framework (Committee of Sponsoring Organizations of the Treadway
Commission).
DeAngelo, L. E. (1981) Auditor size and audit quality, Journal of Accounting and Economics, 3,
pp. 183–199.
Demski, J. S. (1969) Decision-performance control, The Accounting Review, XLIV, pp. 669–679.
Deumes, R. and Knechel, W. R. (2008) Economic incentives for voluntary reporting on internal risk
management and control systems, Auditing: A Journal of Practice & Theory, 27, pp. 35–66.
Francis, J. R. (2004) What do we know about audit quality?, British Accounting Review, 36,
pp. 345–368.
Gordon, L. A., Loeb, M. P. and Tseng, C. (2009) Enterprise risk management and firm performance: a
contingency perspective, Journal of Accounting and Public Policy, 28, pp. 301–327.
Ittner, C. D. and Larcker, D. F. (2001) Assessing empirical research in management accounting: a
value-based perspective, Journal of Accounting and Economics, 32, pp. 349–410.
Kane, G. D. and Velury, U. (2004) The role of institutional ownership in the market for auditing
services: an empirical investigation, Journal of Business Research, 57, pp. 976–983.
Kaplan, R. S. (2011) Accounting scholarship that advances professional knowledge and practice, The
Accounting Review, 86, pp. 367–383.
Kleffner, A. E., Lee, R. B. and McGannon, B. (2003) The effect of corporate governance on the use of
enterprise risk management: evidence from Canada, Risk Management and Insurance Review, 6,
pp. 53–73.
Liebenberg, A. P. and Hoyt, R. E. (2003) The determinants of enterprise risk management: evi-
dence from the appointment of chief risk officers, Risk Management and Insurance Review,
6, pp. 37–52.
Lovata, L. M. and Costigan, M. L. (2002) Empirical analysis of adopters of economic value added,
Management Accounting Research, 13, pp. 215–228.
Mikes, A. (2008) Chief risk officers at crunch time: compliance champions of business partners?,
Journal of Risk Management in Financial Institutions, 2, pp. 7–25.
The Adoption and Design of Enterprise Risk Management Practices 563
Dow
nloa
ded
by [
Uni
vers
ity o
f T
oled
o] a
t 13:
31 0
8 N
ovem
ber
2014

Mikes, A. (2009) Risk management and calculative cultures, Management Accounting Research, 20,
pp. 18–40.
Power, M. (2009) The risk management of nothing, Accounting, Organizations and Society, 34,
pp. 849–855.
Thaler, R. H. and Johnson, E. J. (1990) Gambling with the house money and trying to break even: the
effects of prior outcomes on risky choice, Management Science, 36, pp. 643–660.
Tversky, A. and Kahneman, D. (1992) Advances in prospect theory: cumulative representation of
uncertainty, Journal of Risk and Uncertainty, 5, pp. 297–323.
Wahlstrom, G. (2009) Risk management versus operational action: Basel II in a Swedish context,
Management Accounting Research, 20, pp. 53–68.
Woods, M. (2009) A contingency perspective on the risk management control system within Birming-
ham City Council, Management Accounting Research, 20, pp. 69–81.
564 L. Paape and R.F. Spekle
Dow
nloa
ded
by [
Uni
vers
ity o
f T
oled
o] a
t 13:
31 0
8 N
ovem
ber
2014