the adjustment of the colombian economy and the dynamics ... · and coffee, which grew 20% and 28%,...
TRANSCRIPT

The Adjustment of the Colombian Economy and the Dynamics of the External Sector
2 n d E D I T I O N - J U LY 2 0 1 7
B A N C O D E L A R E P Ú B L I C A - C O LO M B I A
I S S N Pe n d i n g .
EXPORTS OF GOODSNatural resources, gold, and ferronickel play a central role in Colombian exports; therefore, it is still essential to take
advantage of the country's mining potential. p. 5
EXPORTS OF SERVICESThe performance of exports of services in recent years underscores the country’s potential in this
sector. p. 9
Photography by: Emilio Aparicio
InformeGerente-02-ENG_021117.indd 1 02/11/2017 09:38:37 a.m.

G O V E R N O R ’ S R E P O RT - J U LY 2 0 1 72
T he fall in the price of oil since the middle of 2014 generated significant macroeconomic imbalances and reduced the long-term growth of the Colombian
economy. The scope and duration of these effects can be explained by the multiple links of the oil activity with the other economic sectors of the country, and by the nature of the shock, i.e., not anticipated, of considerable magnitude, and persistent in time. The oil shock resulted in a sharp deterioration in the terms of trade that contracted the country’s external revenues and those of neighboring economies, and generated a widening of the current account deficit. Similarly, it reduced government resources, inducing an increase in the fiscal deficit. With these imbalances, the shock shifted economic production to a lower level, given its negative impact on aggregate demand and on the production system. This, together with the lower accumulation of capital that took place since mid-2015, affected the potential growth of the economy, which is estimated to have fallen from 4.5% on a yearly basis to a current range between 3.0% and 3.5%.
A growth rate lower than 4.5% is insufficient to meet the great needs of the Colombian economy. A successful adjustment will allow the country to correct the macroeconomic imbalances generated by external shocks, as well as to eradicate all vulnerabilities that may affect our ability to deal with new unfavorable episodes in the external and internal fronts. This is the only way to create the conditions for greater growth, and to increase our growth potential once more.
The process of adjustment and correction to vulnerabilities has been progressively taking place over the three years following the oil shock, and the most recent information suggests that it is currently in its final stage. The macroeconomic imbalances induced by the shock have been mostly corrected; risk premia have decreased, and there are favorable conditions for the economy to reach a turning point, with higher growth during
S U M M A R Y
2 n d E D I T I O N - J U LY 2 0 1 7
EDITOR
Juan José Echavarría Governor
EDITORIAL COUNCIL María del Pilar Esguerra Yanneth Rocío BetancourtJorge Toro Córdoba
ENGLISH VERSION Germán Eduardo Páez Ch.
WEB SITE AND GENERAL DESIGN Michelle Sáenz Duarte Sonia Liliana Parra Mateus Communication and Financial and Economics Education Department
PRINTING COORDINATION Publishing Section Administrative Services Department
PRE-PRESS AND PRINTING La Imprenta Editores S.A.
The author is fully responsible for the opinions expressed in this document. The ideas herein contained do not compromise the Board of Directors of Banco de la República.
The Governor´s Report can be found online at: www.banrep.gov.co/publications/ report-by-the-governor
ISSN Pending
Bogotá, Colombia.
Executive Summary
InformeGerente-02-ENG_021117.indd 2 02/11/2017 09:38:37 a.m.
T H E A D J U S T M E N T O F T H E C O LO M B I A N E C O N O M Y A N D T H E D Y N A M I C S O F T H E E X T E R N A L S E C T O R 3
the second half of 2017, and even more during 2018.
Other events subsequent to the fall in the price of oil imposed additional challenges to the adjustment process, particularly to monetary policy. The strong depreciation of the Colombian peso between August 2014 and August 2016 (close to 90%) contributed to the external adjustment by inducing a shift in spending towards domestic goods and providing a stimulus to the generation of non-oil external revenue, as detailed below. However, the depreciation also produced a significant upward pressure on the level of consumer prices as a result of the increases in the domestic prices of final goods and imported inputs. Additionally, there were other transitory shocks such as El Niño, the trucking strike, and more recently the VAT increase, which also generated significant inflationary pressures on food and other basic household goods. Although the direct effects of these shocks on inflation have already vanished for the most part, indirect effects associated with the indexation of prices and wages and with variations in expectations still remain, as evidenced in the annual inflation figure for non-tradable goods at the end of August (5.23%), and in the average of core inflation indicators (4.74%). These pressures will disappear as inflation expectations continue to converge toward the 3.0% target.
Between August 2015 and July 2016, the monetary policy rate increased from 4.5% to 7.75%, and the variations were transmitted to the financial system´s interest rates for both deposits and loans, and with greater intensity to the interest rates on commercial loans. The monetary policy and the aforementioned dissolution of the transitory supply shocks created the conditions that led to the reduction in
Recent figures show that between
January and July of this year a
rebound in the different revenues
related to the external sector began
to take place, and this will reduce our
current account deficit.
the annual inflation rate from a peak of 8.97% in July 2016 to 3.87% at the end of last August.
The decline in headline inflation, the reduction of the current account deficit, and the weakening of domestic demand led the Board of Directors of the Central Bank to begin a cycle of reductions to the policy rate since December 2016, without compromising the convergence of inflation to the target, nor the macroeconomic adjustment in course. Between December and August, the Board reduced the rate 250 basis points to a level of 5.25% last month. The commercial interest rates reacted with falls even larger than those of the policy rate, except those for the building sector. In contrast, household credit rates have exhibited a limited response, particularly those for credit cards and consumer loans. Monetary policy shifted from a strongly contractionary position in early 2017 towards a neutral position at present. An expansionary policy could follow ahead, but inflation is still far from the 3.0% target, and the adjustment of the current account has not been completed yet.
The Colombian economy should not complete this process of adjustment with a greater level of debt because it would affect its capacity to deal with future external shocks, which are likely to happen in a highly uncertain international environment. For the adjustment of the economy to be successful, it is also necessary to continue with the fiscal adjustment in order to ensure the reduction of public debt, as envisaged in the current fiscal rule.
S U M M A R Y
InformeGerente-02-ENG_021117.indd 3 02/11/2017 09:38:37 a.m.

G O V E R N O R ’ S R E P O RT - J U LY 2 0 1 74
Given the uncertainty about the international financial conditions, it is also important to avoid falling back into an excessive level of external indebtedness. For this reason, in order to achieve a sustainable recovery, the economy needs to strengthen external income and find products and alternative markets for exports to replace the lower income from oil and mining exports. Should this improvement not be achieved, the vulnerability of the economy would increase, and the recovery of economic activity may not be sustainable in the mid-term. Fortunately, as suggested in the remainder of this report, recent figures show that between January and July of this year a rebound in the different revenues related to the external sector began to take place, and this will reduce our current account deficit.
Indeed, during the last seven months total exports grew at an annual 22.7% rate, with increases in external sales of mining products (34.8%), agriculture (12.9%), and other exports (7.8%), after having remained negative for more than three years. The increase in the value exported was due
to an improvement in external prices (particularly for minerals), but it also reflects an increase in quantities, mainly in services and agricultural products. Should this trend continue and deepen, the Colombian economy could ensure a sustainable recovery, without incurring the risk of widening external imbalances and levels of indebtedness.
The country's current revenues are composed mostly by exports of goods, followed by external sales of services, current transfers (particularly workers' remittances), and revenues from foreign investment. This report examines the recent behavior of each of these components.
This is the annual growth rate of total exports during the first seven months of the year.
S U M M A R Y
InformeGerente-02-ENG_021117.indd 4 02/11/2017 09:38:37 a.m.

5
T otal exports of goods decreased 47% (USD -27,429 million) between 2013 and 2016, from
USD $58,824 to USD $31,394 million (Graph 1), mainly due to the fall in international prices of oil and of other mineral products. Indeed, lower external sales of oil and its derivatives explained close to 80% of the decline in total exports in this period. The decline in sales of coal, gold, and ferronickel, as well as of some industrial products, also stands out.
The reduction in the international price of oil was caused by a combination of factors, including an increase in oil supply associated with the exploitation of non-conventional crudes (particularly in the United States), the low demand of hydrocarbons due to the stagnation of the global economy, and the increased use of alternative energy sources, among others. The decline in exports of mining
1. Exports of Goods
E X P O R T S O F G O O D S
goods in Colombia caused a fall of their participation in the total value exported, which became visible starting in 2013 and which was heightened since mid-2014 due to the collapse of the international price of oil and other minerals (Graph 2). This situation reduced investment in the sector, which in turn was reflected in smaller quantities produced and exported (Graph 3). The country's exports registered a change in their composition in favor of agricultural and industrial goods, which also exhibited a poor performance.
Natural resources, gold, and ferronickel play a central role in Colombian exports; therefore, it is still essential to take advantage of the country's mining potential, and to exploit strategic resources that can be inserted in the global value chains of goods with high technological content. In the first half of 2017, external
sales of oil and its derivatives increased at an annual rate of 24.2% (Graph 1), due to the recovery of their international prices (Graph 2), as a response to a rebalancing of the global oil market that managed to offset the reduction in the quantities released. Additionally, the export value of coal increased 55% due to better international prices and greater quantities sold. As a result, during the first half of 2017, total exports exhibited a significant recovery, increasing at an annual rate of 20% (USD $2,963 m).
Between 2013 and 2016, exports of the main agricultural products performed well in prices and volumes (Graph 3), with outstanding results for banana and coffee, which grew 20% and 28%, respectively. It is worth noting that the Colombian banana entered five new markets in Asia in 2016, and is currently exported to 15 European countries.
T H E A D J U S T M E N T O F T H E C O LO M B I A N E C O N O M Y A N D T H E D Y N A M I C S O F T H E E X T E R N A L S E C T O R 5
InformeGerente-02-ENG_021117.indd 5 02/11/2017 09:38:37 a.m.

G O V E R N O R ’ S R E P O RT - J U LY 2 0 1 766
E X P O R T S O F G O O D S
Coffee dispatches maintained their positive trend, increasing 13% in 2017. Something similar happened with flowers (8.0% growth).
External sales of other agricultural products have maintained a mixed performance after the oil shock. From the second half of 2015 and up to the first half of 2016, they had positive annual growth rates, higher than 10%. However, since the end of 2016 and so far in 2017, their value has fallen. Nevertheless, the number of destinations has increased, particularly towards Caribbean countries.
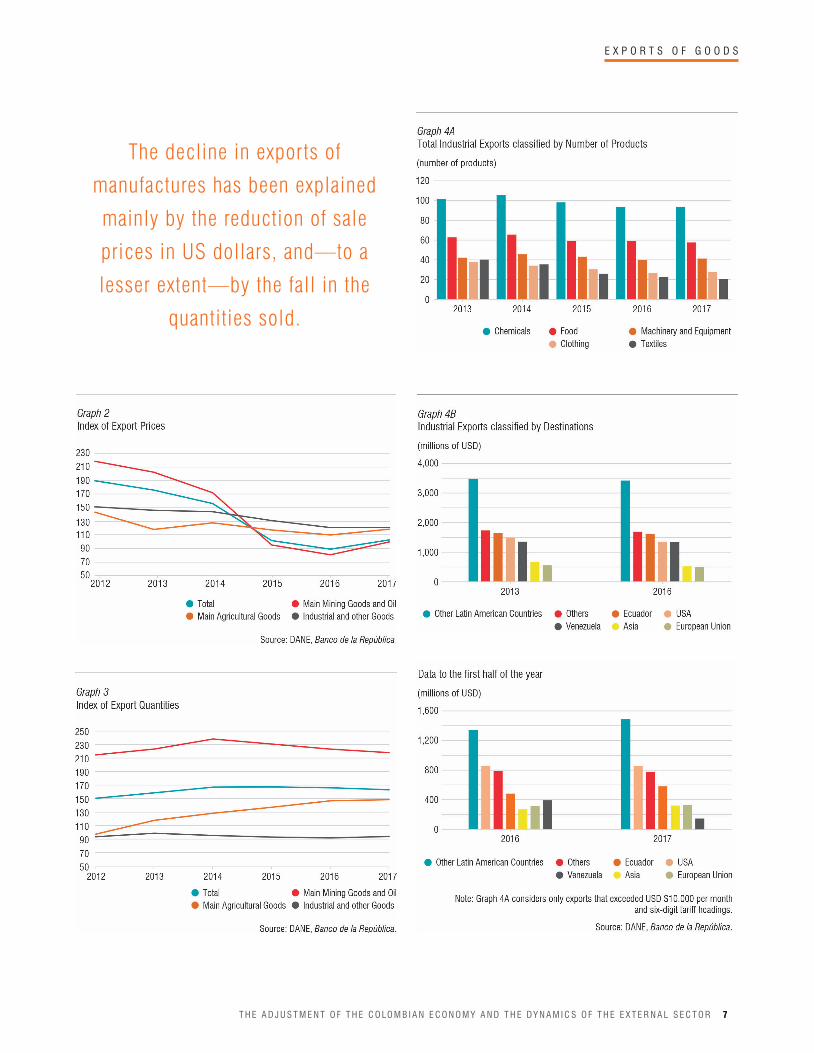
Exports of industrial goods fell by about 22% during 2013-2016, and for the first six months of 2017 their growth continued to be low. The decline in exports of manufactures has been explained mainly by the reduction of sale prices in US dollars (Graph 2), and—to a lesser extent—by the fall in the quantities sold (Graph 3). Similarly, the number of exported products fell in all sectors (Graph 4A), particularly in manufactured exports to Latin America (Graph 4B).
The downward trend in exports of industrial goods stopped since mid-2016, and some sectors began to show signs of recovery (Graph 1). For example, rubber and plastic exports registered an average 2.1% annual growth since August 2016, mainly explained by the behavior of the quantities exported. Exports of food and beverages have also been regaining their level from before the oil shock, and are reacting positively since the first months of 2017, with an average annual 2.3% growth (mainly explained by the behavior of quantities). Chemical products, the main component of our manufactured exports, also show a recent increase in value and in the number of products exported (Graph 4).
Several factors are associated with the poor export performance of manufactured goods in recent years. On the one hand, the weakening of external
InformeGerente-02-ENG_021117.indd 6 02/11/2017 09:38:37 a.m.
7T H E A D J U S T M E N T O F T H E C O LO M B I A N E C O N O M Y A N D T H E D Y N A M I C S O F T H E E X T E R N A L S E C T O R 7
E X P O R T S O F G O O D S
The decline in exports of
manufactures has been explained
mainly by the reduction of sale
prices in US dollars, and—to a
lesser extent—by the fall in the
quantities sold.
InformeGerente-02-ENG_021117.indd 7 02/11/2017 09:38:38 a.m.
G O V E R N O R ’ S R E P O RT - J U LY 2 0 1 78
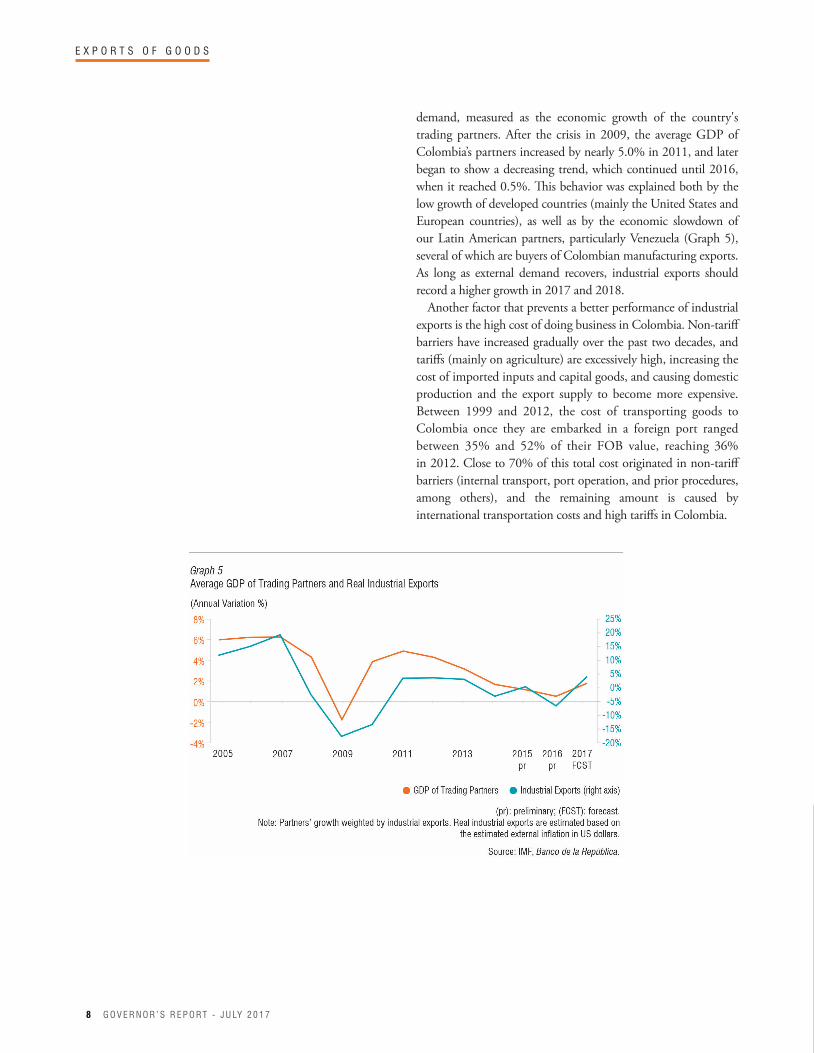
demand, measured as the economic growth of the country's trading partners. After the crisis in 2009, the average GDP of Colombia’s partners increased by nearly 5.0% in 2011, and later began to show a decreasing trend, which continued until 2016, when it reached 0.5%. This behavior was explained both by the low growth of developed countries (mainly the United States and European countries), as well as by the economic slowdown of our Latin American partners, particularly Venezuela (Graph 5), several of which are buyers of Colombian manufacturing exports. As long as external demand recovers, industrial exports should record a higher growth in 2017 and 2018.
Another factor that prevents a better performance of industrial exports is the high cost of doing business in Colombia. Non-tariff barriers have increased gradually over the past two decades, and tariffs (mainly on agriculture) are excessively high, increasing the cost of imported inputs and capital goods, and causing domestic production and the export supply to become more expensive. Between 1999 and 2012, the cost of transporting goods to Colombia once they are embarked in a foreign port ranged between 35% and 52% of their FOB value, reaching 36% in 2012. Close to 70% of this total cost originated in non-tariff barriers (internal transport, port operation, and prior procedures, among others), and the remaining amount is caused by international transportation costs and high tariffs in Colombia.
8
E X P O R T S O F G O O D S
InformeGerente-02-ENG_021117.indd 8 02/11/2017 09:38:38 a.m.
T H E A D J U S T M E N T O F T H E C O LO M B I A N E C O N O M Y A N D T H E D Y N A M I C S O F T H E E X T E R N A L S E C T O R 9
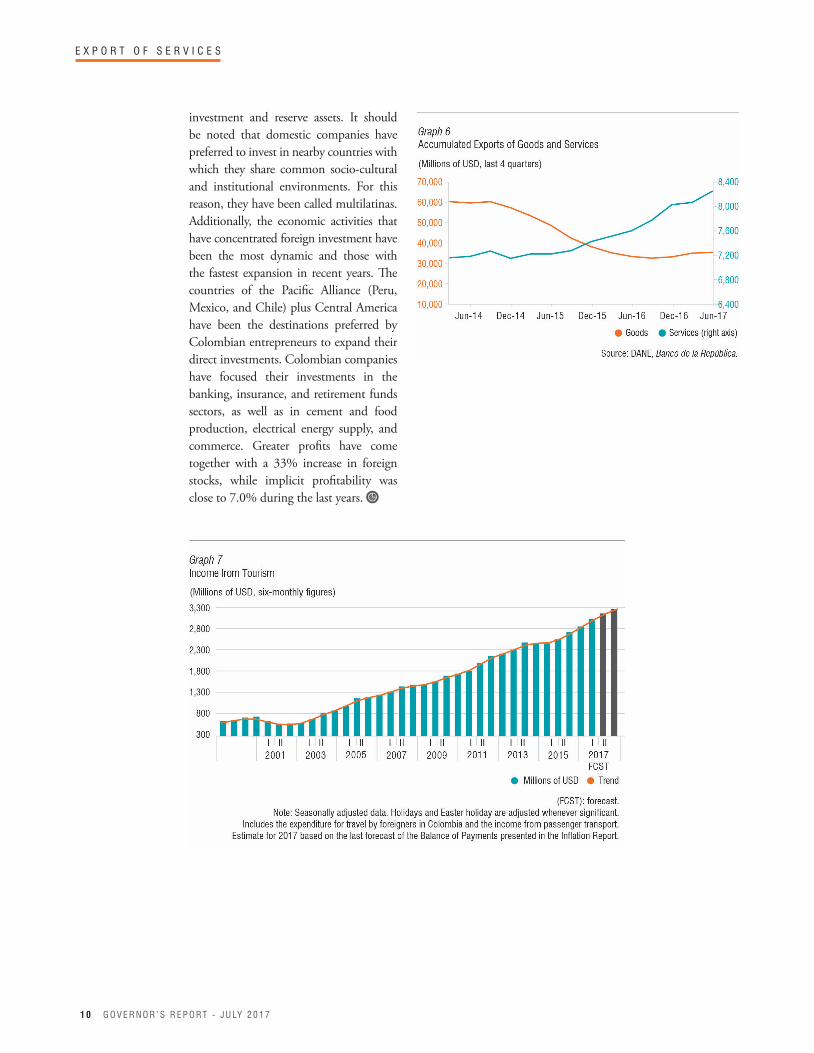
E xports of services have registered a positive variation in recent years (Graph 6), driven mainly
by the recovery of the activities linked to tourism and business services. Indeed, between 2013 and 2016, total exports of services increased 14%, moving from USD $7,022 m to USD $8,007 m. These dynamics are largely explained by tourism revenues, which increased 23% in that period and was equivalent to 73% of total services exported in 2016 (vis-à-vis 68% in 2013), exceeding the value of exports of traditional goods such as coal, gold, coffee, and flowers (Graph 7). All of them have benefited from the accumulated depreciation
2. Exports of Services and other Current Income
of the peso and a better perception of security conditions in the country.
These dynamics are expected to continue in 2017 and in the following years. As a matter of fact, in the first half of 2017, revenues from travel increased 4.0% annually, and those from business services 17%. These figures underscore the country's potential as a supplier of services, as well as the need to develop the required infrastructure and logistics, and to improve our human capital (for example, encouraging bilingualism) in the sector.
Current transfers have also exhibited a good behavior in the last two years. After falling between 2013 and 2014, they
E X P O R T O F S E R V I C E S
9
have shown sustained growth, reaching USD $5,845 million in 2016, i.e., USD $1,224 m higher than in 2014. Transfers have been driven by workers' remittances from countries that are at last beginning to grow, such as the United States and Spain. Workers' remittances increased by 13% in January - July compared to the same period last year.
Revenues from Colombian investment abroad also increased, from USD $3,624 million in 2013 to $4,990 million in 2016. Two thirds of this variation is explained by the higher profits of Colombian enterprises with direct investment abroad; the rest is associated to the increase in revenues from portfolio
T H E A D J U S T M E N T O F T H E C O LO M B I A N E C O N O M Y A N D T H E D Y N A M I C S O F T H E E X T E R N A L S E C T O R
InformeGerente-02-ENG_021117.indd 9 02/11/2017 09:38:38 a.m.
G O V E R N O R ’ S R E P O RT - J U LY 2 0 1 71 0
E X P O R T O F S E R V I C E S
investment and reserve assets. It should be noted that domestic companies have preferred to invest in nearby countries with which they share common socio-cultural and institutional environments. For this reason, they have been called multilatinas. Additionally, the economic activities that have concentrated foreign investment have been the most dynamic and those with the fastest expansion in recent years. The countries of the Pacific Alliance (Peru, Mexico, and Chile) plus Central America have been the destinations preferred by Colombian entrepreneurs to expand their direct investments. Colombian companies have focused their investments in the banking, insurance, and retirement funds sectors, as well as in cement and food production, electrical energy supply, and commerce. Greater profits have come together with a 33% increase in foreign stocks, while implicit profitability was close to 7.0% during the last years.
InformeGerente-02-ENG_021117.indd 10 02/11/2017 09:38:38 a.m.

T H E A D J U S T M E N T O F T H E C O LO M B I A N E C O N O M Y A N D T H E D Y N A M I C S O F T H E E X T E R N A L S E C T O R 1 1
A N N E X
Statistical AnnexAnnual growth rate (%)
2015 2016 Q1 2016 Q2 2016 Q1 2017 Q2 2017
GDP 3.1 2.0 2.7 2.5 1.2 1.3Total Consumption 3.6 2.0 3.1 2.3 1.7 2.1Gross Investment 1.2 -4.5 -3.8 -4.7 0.0 1.3Manufacturing 1.7 3.0 4.3 5.5 0.3 -3.3Total goods exports (FOB) -34.5 -12.6 -31.3 -19.1 32.4 10.6Total goods imports (FOB) -15.5 -17.0 -25.1 -16.2 7.0 5.1
% of GDP
Trade Balance (FOB) -4.7 -3.5 -5.0 -2.8 -2.8 -2.6Current Account -6.4 -4.4 -5.6 -3.8 -4.7 -3.5
Billions of pesos Annual Variation (%)
MONETARY ANDFINANCIAL SECTOR
May 2017 June 2017 July 2017 May 2017 / May 2016
June 2017 / June 2016
July 2017 / July 2016
Monetary Base 76,472 78,098 78,052 -2.58 3.87 1.79M1 91,224 93,055 94,467 0.16 0.98 1.72M2 410,755 415,076 418,156 5.73 5.40 5.63 M3 446,002 452,547 455,912 5.73 6.06 6.03
Billions of pesos Annual Variation (%)
CREDIT
ADJUSTED NETDEBT PORTFOLIO May 2017 June 2017 July 2017
May 2017 / May 2016
June 2017 / June 2016
July 2017 / July 2016
Legal Currency 370,587 373,986 374,269 6.60 6.46 5.90Foreign Currency 21,253 22,307 21,885 -9.16 1.86 -5.48Total 391,840 396,293 396,154 5.61 6.19 5.20
MACROECONOMIC VARIABLES
MONETARY AND FINANCIAL SECTOR
Percentage
INTEREST RATES
February 2017 March 2017 April 2017 May 2017 June 2017 July 2017Intervention Rate 1/ 7.25 7.00 6.50 6.25 5.75 5.50Overnight Banking Reference Indicator(IBR in Spanish) 7.47 7.19 6.99 6.48 6.25 5.49Interbank Rate (TIB) 7.48 7.19 6.99 6.48 6.26 5.49DEPOSIT RATESDTF 6.78 6.65 6.53 6.17 5.96 5.65Fixed-term Deposit Certificate to 90 days 6.75 6.22 6.28 5.77 5.84 5.35ACTIVE RATES Banco de la República’s Active Rate 2/ 14.87 15.13 14.47 14.02 13.50 13.58Total placements 14.82 15.07 14.41 13.94 13.43 13.52Consumption Credit 20.03 19.78 19.87 19.78 19.47 19.39Ordinary Credit 13.79 13.84 13.71 13.37 12.89 12.64Preferential Credit 11.37 11.22 10.65 10.09 9.75 9.47Treasury Credit 12.03 11.96 11.26 10.68 10.57 10.26Micro-credit (without Leasing) 37.72 36.77 36.84 36.76 36.59 36.94Construction 3/ 11.43 11.64 11.27 10.86 10.85 10.83Housing Acquisition 3/ 12.56 12.42 12.38 12.36 12.02 11.57
Source: DANE. Banco de la República.
Source: Banco de la República.
InformeGerente-02-ENG_021117.indd 11 02/11/2017 09:38:39 a.m.

G O V E R N O R ’ S R E P O RT - J U LY 2 0 1 71 2
A N N E X
Percentage
CPI INFLATION
February 2017 March 2017 April 2017 May 2017 June 2017 July 2017Total 5.18 4.69 4.66 4.37 3.99 3.40Food 5.21 3.65 2.49 2.09 1.37 0.20Tradables 5.75 5.59 5.35 4.88 4.41 4.09Non tradables(excluding food and regulated items) 5.06 5.33 5.22 5.25 5.21 5.20Regulated 4.55 4.05 6.75 6.24 6.01 5.03
Percentage
INFLATION EXPECTATIONS
MONTHLY SURVEYOF EXPECTATIONS TO ANALYSTS February 2017 March 2017 April 2017 May 2017 June 2017 July 2017To December 2017 4.61 4.49 4.39 4.45 4.37 4.28To December 2018 3.68 3.60 3.50 3.57 3.54 3.52FORWARD BREAK-EVEN INFLATION (FBEI) For 2017 5.27 5.24 5.01 5.25 5.03 4.88For 2018 3.32 3.28 3.13 3.38 3.25 3.27
CORE INFLATIONINDICATORS
February 2017 March 2017 April 2017 May 2017 June 2017 July 2017Excluding food 5.17 5.13 5.60 5.35 5.12 4.79Excluding food and regulated items 5.35 5.44 5.28 5.09 4.87 4.72Excluding primary food. public utilities. and fuel
5.74 5.61 5.37 5.29 5.07 4.88
CPI - Core 20 6.03 6.01 5.84 5.59 5.31 5.22
1/ This is Banco de la República’s benchmark intervention rate according to the decision reached by the Board of Directors in said month. enforceable since the first working day after that session.2/ Calculated as the weighted average value per amount for consumption, credit, preferential, ordinary, and treasury rates. Due to the high rotation of treasury credit, its weight was determined as the fifth part of its weekly disbursement.3/ This corresponds to non-VIS weighted housing rates in UVR and pesos.4/ According to the information from the balance of payments.5/ The indicators at the closing of each quarter are calculated based on the data from the last four quarters.6/ This includes long-term amortizations and the balance of the short-term debt from a year before.
Pesos per US dollar
NOMINALEXCHANGERATE
February 2017 March 2017 April 2017 May 2017 June 2017 July 2017Average 2,882 2,943 2,874 2,924 2,958 3,037End of: 2,896 2,880 2,948 2,920 3,038 2,995
NET DIRECT INVESTMENT 4/
Millions of US dollars2015 2016 Q1 2016 Q2 2016 Q1 2017 Q2 2017
Foreign Direct Investment in Colombia 11,732 13,687 4,703 3,715 2,515 2,625Colombian Investment Abroad 4,218 4,516 969 897 716 1,275
NET INTERNATIONAL RESERVES (NIR)
Millions of US dollarsFebruary 2017 March 2017 April 2017 May 2017 June 2017 July 2017
46,986 46,932 46,936 47,153 47,234 47,531
REAL EXCHANGE RATE INDEX Non-Traditional RER index (CPI) 121.44 124.42 122.00 124.42 125.56 130.18
Non-Traditional RER index (PPI) 119.98 122.28 120.62 122.65 124.09 127.60
EXTERNAL SECTOR
Source: Banco de la República.
INTERNATIONALRESERVES INDICATORS 5/
February 2017 March 2017 April 2017 May 2017 June 2017 July 2017NIR/M3 30,52 30,33 30,73 30,88 31,71 31,23
2015 2016 Q1 2016 Q2 2016 Q1 2017 Q2 2017
NIR/GDP 16,04 16,51 16,90 17,27 15,89 15,66NIR/(Current account deficit + current year debt amortization) 6/ 1,10 1,36 1,20 1,24 1,25 1,14
InformeGerente-02-ENG_021117.indd 12 02/11/2017 09:38:39 a.m.