the addiction severity index (asi) across cultures tri science addiction 2005 nida international...
TRANSCRIPT

The Addiction Severity Index (ASI) Across Cultures
TRIscience
addiction
2005 NIDA International ForumJune 17th, 2005
Workshop II - The Ireland Room B
Thanks to NIDA:Steve Gust & Erin Winstanley

The Addiction Severity Index (ASI) Across Cultures
TRIscience
addiction
Today’s Presenters:

Selection, Modification and Inter-rater Reliability on the use of the ASI in Egypt
Sample: Adult Inpatient Hospital Program in Cairo
Nasser Loza, Egypt
TRIscience
addiction

Elaborating and using the ASI across different national realities and treatment conditions – The EuropASI in Greek Treatment Programmes
Sample: Adults in 6 Drug-Free Therapeutic Communities in Greece
Gerasimos Papanastasatos, Greece
TRIscience
addiction

Understanding the Israeli addict population – ASI profiles of former Soviet Union and native Israeli opiate abusers
Sample – Adults in detoxification, day treatment and methadone maintenance programs
Richard Isralowitz, Israel
TRIscience
addiction

Incorporating the ASI: Exploring assessment and outcomes in a residential treatment facility in Northern Ireland
Sample: Adult Residential Treatment Facility in Northern Ireland
Debra Wilson & Pauline Murnin, Ireland
TRIscience
addiction

The Brazilian experience on the implementation of the ASI – where are we right now?
Sample: Adult Cocaine Abusers @ HIV clinics in Brazil and a Validity Study of the ASI 6
Flavio Pechansky, Brazil
TRIscience
addiction

Experiences using the ASI in different
countries.
and…
Richard Rawson, USA
TRIscience
addiction

ASI International Use and Data
from 10 Countries
Deni Carise, USA
TRIscience
addiction

IntroductionIntroduction
TRIscience
addiction
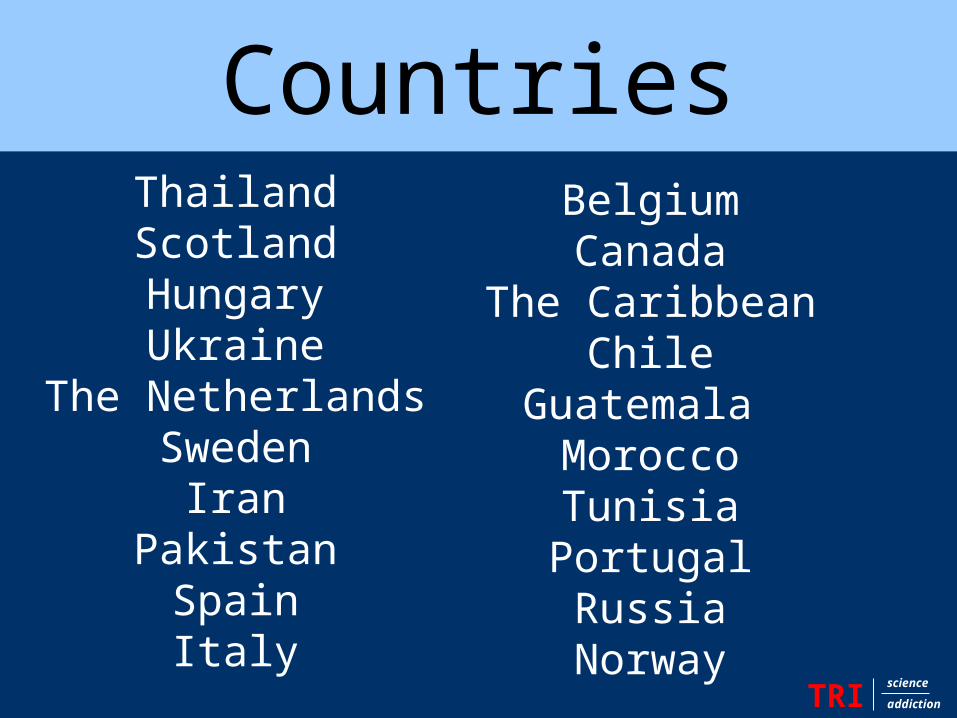
In addition to those presenting here,
researchers and clinicians in the following countries have
used the ASI:
The ASI has been translated and modified for use in many countries.
IntroductionCountries
TRIscience
addiction
ThailandScotlandHungaryUkraine
The NetherlandsSweden
IranPakistan
SpainItaly
BelgiumCanada
The CaribbeanChile
Guatemala MoroccoTunisiaPortugalRussiaNorway

IntroductionDeni’s Presentation
TRIscience
addiction
Today, data are presented from the US Drug Evaluation Network System
and various samples in:Belgium BrazilGreece IrelandItaly NorwayRussia Scotland
Sweden

Data Sets
TRIscience
addiction

Introduction
TRIscience
addiction
Data Sets
USA Deni Carise & A. Thomas McLellan8,479 patients from 14 inpatient/ residential, 4 methadonemaintenance and 18 out-patient treatment programs
Brazil Flavio Pechansky & Felix Kessler193 cocaine-dependent clients from 3 HIV Clinics

Introduction
TRIscience
addiction
Data Sets
Greece Gerasimos Papanastasatos & Erianna Daliani
500 clients from 4 residential and 2 OP programs
Ireland Debra Wilson & Pauline Murnin162 clients from 1 inpatient program

IntroductionData Sets
Belgium1 Joke De Wilde117 Clients from 4 adult residential drug-free TC’s
Belgium2 Veerle Raes3,712 clients from a large
drug addiction treatmentprogram

Italy Joke De Wilde101 clients from 5 adult residential drug-free TC’s
Norway Edle Ravndal482 clients from 10 IP, 4 MM, 3 OP youth and 4 youth “collectives”.
Russia Evgeny Krupitsky332 clients from 1 adult hospital detox & treatment program.
Data Sets
TRIscience
addiction
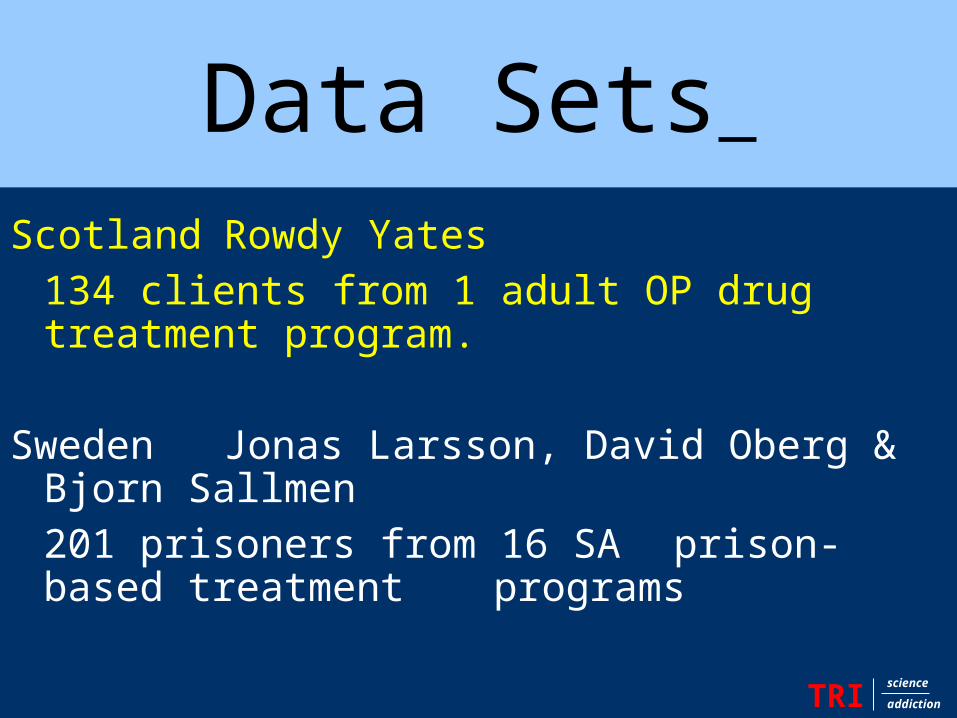
Scotland Rowdy Yates134 clients from 1 adult OP
drug treatment program.
Sweden Jonas Larsson, David Oberg & Bjorn Sallmen201 prisoners from 16 SA prison-based treatment programs
Data Sets
TRIscience
addiction

Data Sets
TRIscience
addiction

• AgeAge• GenderGender• Alcohol & Drug Composite Alcohol & Drug Composite
scoresscores• Days heavy drinking Days heavy drinking • Days used marijuana Days used marijuana • Days used cocaineDays used cocaine
TRIscience
addiction
Data Presented:
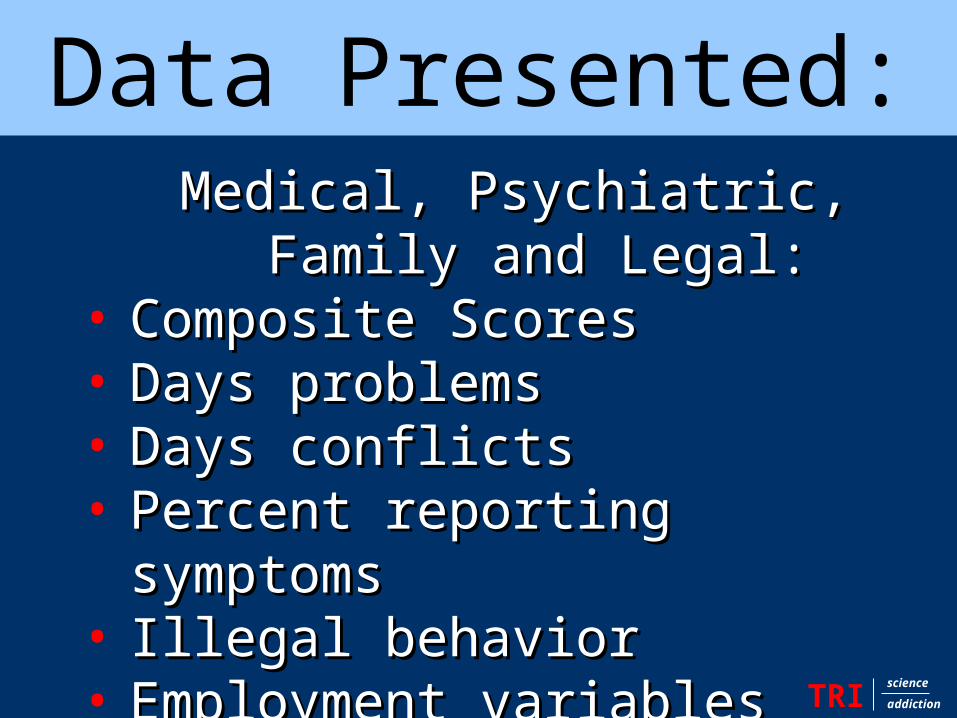
Medical, Psychiatric, Family and Medical, Psychiatric, Family and Legal:Legal:
• Composite ScoresComposite Scores• Days problems Days problems • Days conflictsDays conflicts• Percent reporting symptomsPercent reporting symptoms• Illegal behaviorIllegal behavior• Employment variablesEmployment variables
TRIscience
addiction
Data Presented:

International DataSample N Age (SD) % Male
Belgium1 117 24 (6) 84
Brazil 193 - 89
Greece 500 26 (5) 84
Ireland 162 41 (10) 69
Italy 101 28 (4) 88
Norway 482 31 (8) 67
Russia 332 23 (0) 74
Scotland 134 27 (6) 68
Sweden 201 36 (11) 95
U.S.A. 8429 35 (11) 66

International Data – Drug & Alcohol
Alc. CS Drink 5+
Drg. CS Cocaine Cannabis
Belgium1 .11 (.19) 2 (5) .17 (.13) 1 (5) 5 (8)
Brazil .25 (.20) 10 (9) .19 (.10) 13 (10) 21 (11)
Greece - 0 (2) .21 (.11) 0 (2) 2 (6)
Ireland .67 (.26) 16 (10) .07 (.14) 0 (1) 3 (8)
Italy .20 (.27) 6 (11) .26 (.17) 2 (6) 8 (12)
Norway .08 (.14) 2 (6) .31 (.13) 0 (3) 10 (12)
Russia .28 (.00) - .08 (.01) - -
Scotland .07 (.18) 4 (9) .43 (.09) 1 (4) 16 (13)
Sweden .52 (.28) 13 (12) .05 (.09) 1 (4) 2 (7)
U.S.A. .21 (.26) 3 (7) .12 (.13) 3 (7) 2 (6)

International Data – Medical & Psychiatric
Med. CS Med. Prob. Psy. CS % Dep. Psy. Prob.
Belgium1 .35 (.32) 10 (12) .49 (.24) 38 13 (12)
Brazil .24 (.28) 12 (9) .23 (.22) 21 15 (11)
Greece .21 (.29) 4 (8) .21 (.18) 21 9 (11)
Ireland .40 (.41) 11 (13) .48 (.26) 59 18 (13)
Italy .17 (.23) 2 (6) .38 (.26) 27 9 (12)
Norway .25 (.32) 8 (12) .27 (.23) 33 11 (13)
Russia .23 (.01) - .25 (.01) - -
Scotland .34 (.39) 8 (5) .32 (.26) 64 11 (12)
Sweden .34 (.37) 10 (14) .24 (.21) 28 9 (13)
U.S.A. .17 (.30) 5 (10) .19 (.23) 30 8 (11)

International Data – Family & LegalFam. CS Conflicts Leg. CS Illegal Act Work Emp. Prob.
Belgium1 .20 (.22)
2 (6) .34 (.23) 2 (7) 2 (5) 4 (8)
Brazil .24 (.21)
10 (10) .12 (.17) 8 (9) 22 (9) 9 (10)
Greece .34 (.20)
5 (9) - 1 (5) 3 (8) 5 (13)
Ireland .29 (.26)
7 (11) .09 (.19) 0 (3) 4 (8) 6 (11)
Italy .36 (.26)
7 (11) .30 (.29) 6 (10) 4 (9) 1 (1)
Norway .16 (.19)
4 (9) .31 (.28) 10 (13) 5 (10) 3 (9)
Russia .41 (.01)
- .17 (.02) - - -
Scotland .38 (.23)
6 (8) .40 (.25) 17 (13) 1 (5) 9 (11)
Sweden .18 (.20)
3 (8) .28 (.13) 4 (10) 5 (10) 8 (13)
U.S.A. .16 (.21)
3 (7) .18 (.21) 1 (4) 8 (10) 8 (12)
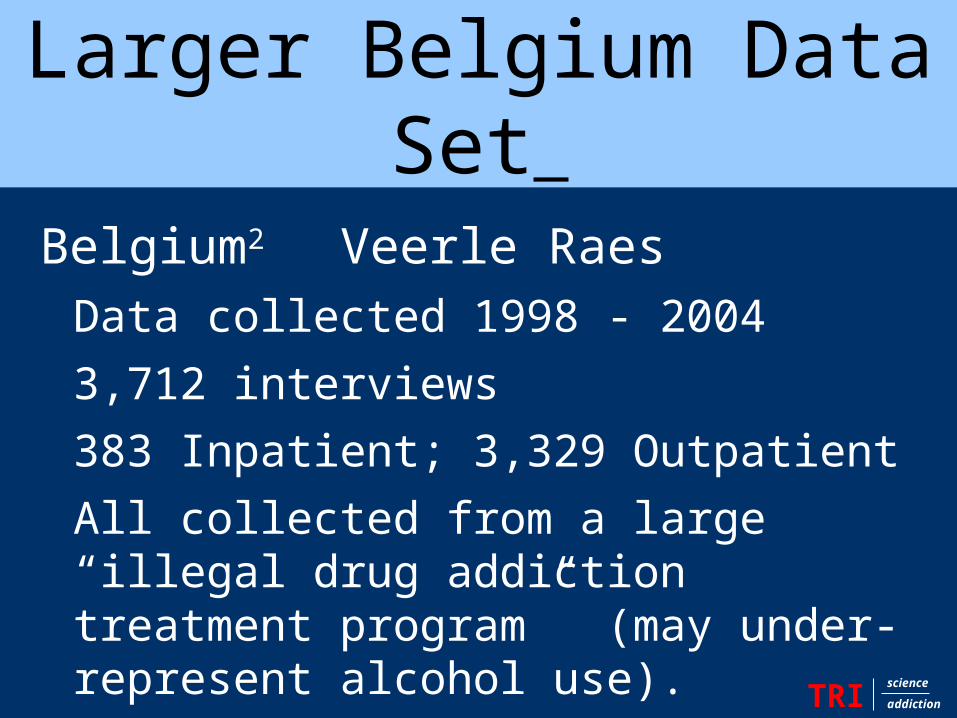
Belgium2 Veerle RaesData collected 1998 - 2004
3,712 interviews
383 Inpatient; 3,329 Outpatient
All collected from a large “illegal drug addiction treatment program” (may under-represent alcohol use).
Larger Belgium Data Set
TRIscience
addiction

USA vs. Belgium Data by Modality
U.S.A. (IP) Belgium2 (IP) U.S.A. (OP) Belgium2 (OP)
Sample N 3,133 383 3,885 3,329
Age (SD) 36 (11) 25 (6) 33 (10) 27 (7)
% Male 71 86 77 82
Alc. CS .33 (.27) .1 (.2) .16 (.23) .1 (.1)
Drink 5+ 5 (9) 2 (5) 2 (6) 3 (6)
Drg. CS .11 (.14) .2 (.1) .09 (.11) .2 (.1)
Cocaine 3 (8) 2 (5) 2 (6) 2 (5)
Cannabis 2 (6) 4 (8) 2 (6) 11 (12)

USA vs. Belgium Data by Modality
U.S.A. (IP) Belgium2 (IP) U.S.A. (OP) Belgium2 (OP)
Med. CS .16 (.29) .3 (.3) .15 (.28) .2 (.3)
Med. Prob. 4 (9) 8 (11) 5 (10) 7 (11)
Psy. CS .20 (.24) .3 (.2) .16 (.22) .2 (.2)
% Dep. 31 34 25 30
Psy. Prob. 8 (12) 14 (12) 6 (11) 10 (11)
Fam. CS .15 (.21) .3 (.2) .13 (.20) .1 (.2)
Conflicts 3 (8) 3 (8) 2 (7) 2 (6)
Leg. CS .20 (.22) .3 (.2) .18 (.20) .2 (.2)
Illegal Act 1 (5) 3 (7) 1 (4) 1 (5)
Work 8 (10) 1 (5) 9 (11) 8 (11)
Emp. Prob. 8 (12) 3 (8) 9 (12) 5 (10)

Conclusions
TRIscience
addiction

Conclusions
TRIscience
addiction
Data presented just for discussion - No conclusions please!
Data were collected from too many different locations (prisons, HIV clinics, in patient,
outpatient treatment programs) and from too many different samples (opiate only users,
primary alcohol users, an all inpatient sample, an outpatient only sample, etc.) for valid
comparisons to be made.

Limitations
TRIscience
addiction

The End
TRIscience
addiction