the across-shelf distribution of larval, postlarval and
TRANSCRIPT
Louisiana State UniversityLSU Digital Commons
LSU Historical Dissertations and Theses Graduate School
2001
The Across-Shelf Distribution of Larval, Postlarvaland Juvenile Fishes Collected at Oil and GasPlatforms and a Coastal Jetty Off Louisiana West ofthe Mississippi River Delta.Frank Joseph Hernandez JrLouisiana State University and Agricultural & Mechanical College
Follow this and additional works at: https://digitalcommons.lsu.edu/gradschool_disstheses
This Dissertation is brought to you for free and open access by the Graduate School at LSU Digital Commons. It has been accepted for inclusion inLSU Historical Dissertations and Theses by an authorized administrator of LSU Digital Commons. For more information, please [email protected].
Recommended CitationHernandez, Frank Joseph Jr, "The Across-Shelf Distribution of Larval, Postlarval and Juvenile Fishes Collected at Oil and GasPlatforms and a Coastal Jetty Off Louisiana West of the Mississippi River Delta." (2001). LSU Historical Dissertations and Theses. 407.https://digitalcommons.lsu.edu/gradschool_disstheses/407

INFORMATION TO USERS
This manuscript has been reproduced from the microfilm master. UMI films the text directly from the original or copy submitted. Thus, some thesis and
dissertation copies are in typewriter face, while others may be from any type of computer printer.
The quality of this reproduction is dependent upon the quality of the copy submitted. Broken or indistinct print, colored or poor quality illustrations and photographs, print bleedthrough, substandard margins, and improper alignment can adversely affect reproduction.
In the unlikely event that the author did not send UMI a complete manuscript and there are missing pages, these will be noted. Also, if unauthorized copyright material had to be removed, a note will indicate the deletion.
Oversize materials (e.g., maps, drawings, charts) are reproduced by
sectioning the original, beginning at the upper left-hand comer and continuing from left to right in equal sections with small overlaps.
Photographs included in the original manuscript have been reproduced xerographicaliy in this copy. Higher quality 6* x 9" black and white photographic prints are available for any photographs or illustrations appearing in this copy for an additional charge. Contact UMI directly to order.
ProQuest Information and Learning 300 North Zeeb Road. Ann Arbor. Ml 48106-1346 USA
800-521-0600
Reproduced with permission of the copyright owner. Further reproduction prohibited without permission.

Reproduced with permission of the copyright owner. Further reproduction prohibited without permission.

THE ACROSS-SHELF DISTRIBUTION OF LARVAL, POSTLARVAL AND JUVENILE FISHES COLLECTED AT OIL AND GAS PLATFORMS AND A COASTAL JETTY OFF LOUISIANA
WEST OF THE MISSISSIPPI RIVER DELTA
A Dissertation
Submitted to the Graduate Faculty o f the Louisiana State University and
Agricultural and Mechanical College in partial fulfillment o f the
requirements for the degree of Doctor o f Philosophy
in
The Department of Oceanography and Coastal Sciences
byFrank Joseph Hernandez, Jr.
B.S., Louisiana State University, 1993 M.S.. University o f North Carolina at Wilmington, 1996
December 2001
Reproduced with permission of the copyright owner. Further reproduction prohibited without permission.

UMI Number. 3042623
UMI*UMI Microform 3042623
Copyright 2002 by ProQuest Information and Learning Company. All rights reserved. This microform edition is protected against
unauthorized copying under Title 17, United States Code.
ProQuest Information and Learning Company 300 North Zeeb Road
P.O. Box 1346 Ann Arbor, Ml 48106-1346
Reproduced with permission of the copyright owner. Further reproduction prohibited without permission.

For my dad, Frank J. Hernandez, Sr., my sisters. Peep and Meek, nieces, Dabber and Winky,
and great-nieces. Mac and Aubrey. Thanks for the love and support
In memory o f my mother, Mary A. Hernandez, Sr. (1940-1993), who's love and support 1 still feel today.
Also, in memory o f my MS degree mentor, Dr. David G. Lindquist for his guidance, encouragement and
friendship.
i i
Reproduced with permission of the copyright owner. Further reproduction prohibited without permission.

ACKNOWLEDGMENTS
I would like to thank my major professor, Dr. Richard Shaw, for his assistance and guidance
throughout the course o f this project. I am also grateful for the assistance and encouragement I have
received from my committee members, Drs. Chuck Wilson, Larry Rouse and Jay Geaghan. This has
been a rewarding experience and it was a pleasure to work with such a knowledgeable and helpful
committee.
This was a very large research effort and there are many others to thank. I would like to thank
Joe Cope, Jim Ditty, James Tolan and Dr. Mark Benfield for all o f their efforts, advice and guidance. I
would especially like to thank Joe for his experimental design and SAS help when needed, as well as all
the fun times at the jetties down in Fourchon. I would like to thank Talat Farooqi for helping me identify
the most troublesome o f larval fishes. I am also indebted to Dr. Joanne Lyczkowski-Shultz. Denice Drass
and David Hanisko (NMFS, Pascagoula lab) for assistance with SEAMAP data acquisition and analyses,
as well as advice and encouragement throughout.
This project could not have been accomplished without field and laboratory assistance from our
trusted student workers: David Bunch, Nathan Craig, Robin Hargroder, Gregory Lavergne, Bradley
McDonald, Cory New, Nick Ortega, Paul Rogers and Christopher Whatley. Other students, RAs and lab
siblings were there to lend a hand or an ear when needed, including Heather Haas, Ross Horton, Dave
Lindquist, Brian Milan and John Plunkett.
I also want to thank my many Red Stick and LSU friends, all o f which have encouraged me
along the way. or at least bought me a beer when I was tapped for cash. I owe you. The list is long, but
I'll be brief, and just mention a special thanks to Scott Baker, Kelly Blessinger, Tim Coker, Costa
Dimitriades, Andy Fischer, Will Patterson, Elena and Myrto Prakoura, Jimmy Tam and all the Greeks
(Efharisto).
Finally, I gratefully acknowledge funding by the Minerals Management Service-Louisiana State
University-Coastal Marine Institute (Contract Number 14-75-0001-30660, Task Order Number 19926)
and by the Louisiana Sea Grant Program, part o f the National Sea Grant College Program maintained by
the National Oceanic and Atmospheric Administration. I would also like to thank the Louisiana Board o f
Regents fellowship program for their support. Logistically, I owe a great deal o f thanks to John Mackler,
i i i
Reproduced with permission of the copyright owner. Further reproduction prohibited without permission.

Mark Miller and Wilton Delaune. I am further indebted to Exxon USA, Inc. and Mobil USA Exploration
and Production, Inc. for access to their offshore oil and gas platforms and logistical support, and to the
crews o f Mobil's West Cameron 352, West Cameron 7 ID, Green Canyon 18, and Grand Isle 94 and
Exxon's South Timbalier 54 platforms for their hospitality.
iv
Reproduced with permission of the copyright owner. Further reproduction prohibited without permission.

TABLE OF CONTENTS
DEDICATION.................................................................................................................................... ii
ACKNOWLEDGEMENTS................................................................................................................. iii
LIST OF TABLES............................................................................................................................... vii
LIST OF FIGURES.............................................................................................................................. x
ABSTRACT........................................................................................................................................ xiv
CHAPTER 1. THE ACROSS-SHELF DISTRIBUTION OF REEF FISHES AND THE POTENTIAL IMPORTANCE OF OIL AND GAS PLATFORMS ASARTIFICIAL HABITAT FOR FISHES IN THE NORTHERN GULF OF MEXICO............................ 1
INTRODUCTION......................................................................................................................... 2Across-Shelf Ichthyofaunal Zonation................................................................................... 3Ichthyoplankton Collected at Oil and Gas Platforms........................................................... 3Study Objectives.................................................................................................................. 4
REFERENCES.............................................................................................................................. 6
CHAPTER 2. EARLY LIFE HISTORY STAGES OF FISHES COLLECTED ACROSS THE SHELF AT OFFSHORE OIL AND GAS PLATFORMS AND AROCK JETTY WEST OF THE MISSISSIPPI RIVER DELTA............................................................. 8
INTRODUCTION......................................................................................................................... 9MATERIALS AND METHODS............................................................................................... 11
Study Sites....................................................................................................................... 11Sampling Procedure............................................................................................................. 14Analyses o f Data.................................................................................................................. 17
RESULTS..................................................................................................................................... 20Environmental Characterization o f Sampling Sites............................................. 20Larval and Juvenile Fish Collected at the Outer Shelf Platform (GC 18)........................ 24Larval and Juvenile Fish Collected at the Mid-Shelf Platform (Gl 94)........................... 35Larval and Juvenile Fish Collected at the Inner Shelf Platform (ST 54)........................ 47Larval and Juvenile Fish Collected at the Belle Pass Jetties............................................ 57Overall Taxonomic Richness and Seasonality.................................................................... 63Similarity and Diversity o f Larval and Juvenile Fish AssemblagesBetween Sites...................................................................................................................... 70Environmental Variables and Larval and Juvenile Fish Abundances.................................. 71
DISCUSSION............................................................................................................................... 81Reef Fishes Collected at the Offshore Oil and Gas Platforms and theBelle Pass Jetties.............................................................................................................. 81Taxonomic Similarity Among Sites.................................................................................... 85Taxonomic Diversity Among Sites..................................................................................... 86Environmental Variables and Larval and Juvenile Fish Abundances.................................. 87
REFERENCES.............................................................................................................................. 89
CHAPTER 3. COMPARISON OF PLANKTON NET AND LIGHT-TRAP METHODOLOGIES FOR SAMPLING LARVAL AND JUVENILE FISHES ASSOCIATED WITH OFFSHORE PETROLEUM PLATFORMS AND ACOASTAL JETTY OFF LOUISIANA................................................................................................... 94
INTRODUCTION........................................................................................................................ 95MATERIALS AND METHODS.................................................................................................. 96
Study Sites........................................................................................................................... 96Sampling Procedure............................................................................................................. 97Analyses o f Data.................................................................................................................. 99
v
Reproduced with permission of the copyright owner. Further reproduction prohibited without permission.
RESULTS.................................................................................................................................. 100Overall Abundances......................................................................................................... 100Within Site Comparisons o f Sampling Gears................................................................... 106Length-Frequency Analyses............................................................................................. 110Lunar Periodicity.............................................................................................................. 118Similarity and Diversity o f Ichthyoplankton Assemblages Within Sites......................... 124
DISCUSSION............................................................................................................................ 126Gear Selectivity................................................................................................................ 126Lunar Periodicity.............................................................................................................. 130
REFERENCES........................................................................................................................... 132
CHAPTER 4. THE VERTICAL AND WITHIN-PLATFORM SPATIAL DISTRIBUTION OF LARVAL AND JUVENILE FISHES COLLECTED ATOFFSHORE OIL AND GAS PLATFORMS OFF LOUISIANA........................................................ 136
INTRODUCTION..................................................................................................................... 137MATERIALS AND METHODS............................................................................................... 138RESULTS.................................................................................................................................. 139DISCUSSION............................................................................................................................ 155REFERENCES........................................................................................................................... 161
CHAPTER 5. THE EARLY LIFE HISTORY STAGES OF REEF-DEPENDENT AND REEF-ASSOCIATED FISHES COLLECTED AT THREE OIL AND GASPLATFORMS...................................................................................................................................... 163
INTRODUCTION..................................................................................................................... 164MATERIALS AN D METHODS............................................................................................... 165RESULTS.................................................................................................................................. 169
Reef-Dependent Fishes Collected and Size-at-Stage Literature...................................... 170Pomacentridae (damselfishes)..................................................................................... 170Scaridae (parrotfishes)................................................................................................ 172Labridae (wrasses)....................................................................................................... 175Chaetodontidae (butterflyfishes)................................................................................. 176Pomacanthidae (angelfishes)....................................................................................... 177Acanthuridae (surgeonfishes)...................................................................................... 177
Reef-Associated Fishes Collected and Size-at-Stage Literature...................................... 178Blenniidae (combtooth biennies)................................................................................. 178Serranidae (sea perches, groupers, sea basses and soapfishes)................................... 180Lutjanidae (snappers).................................................................................................. 185Holocentridae (squirrelfishes)..................................................................................... 192
SEAMAP Comparisons: 60-cm Oblique Bongo Tows vs. 60-cm, PassivePlankton Net Collections.................................................................................................. 194SEAMAP Comparisons: I x 2 m Neuston Tows vs. Light-trap Collections................... 197
DISCUSSION............................................................................................................................ 197REFERENCES........................................................................................................................... 204
CHAPTER 6. POTENTIAL IMPACTS OF OIL AND GAS PLATFORMS ONLARVAL AND JUVENILE ASSEMBLAGES IN THE NORTHERN GULF OF MEXICO 212
SUMMARY............................................................................................................................... 213Mid-Shelf Peak in Taxonomic Richness and Diversity................................................... 213Rarity o f Reef-Associated and Reef-Dependent Larvae and Juveniles............................ 214Full Range o f Life History Stages o f Reef-Dependent and Reef-AssociatedFishes............................................................................................................................... 216
MANAGEMENT IMPLICATIONS.......................................................................................... 2 17FUTURE CONSIDERATIONS................................................................................................. 218REFERENCES........................................................................................................................... 219
VITA.................................................................................................................................................... 223
vi
Reproduced with permission of the copyright owner. Further reproduction prohibited without permission.

LIST OF TABLES
Table 2 .1. Summary o f the commonly observed adult fish assemblage associated with reefs or platforms by depth as reported in Gallaway et al. (1980) and subsequently modifiedby Gallaway (1981). Taxa were reported from these depth zones as being affiliated withnatural reefs (N) or artificial reefs (A)................................................................................................. 13
Table 22. Number o f samples collected at each site by date, gear type, and depth/location.(Lunar phases: N, new moon; F, full moon; 1, first quarter, 3, last quarter)....................................... 18
Table 2.3. Total plankton net density (fish/100 m3) and light-trap CPUE (fish/10 min) forfish collected at Green Canyon 18 with standard error (SE), rank, percent o f total catch (%), and months collected for each taxa. (N) indicates taxa collected only with plankton nets.(L) indicates taxa collected only with light-traps. For ranks, tied values received the meano f the corresponding ranks. % indicates a value <1.00%.................................................................... 26
Table 2.4. Total plankton net density (fish/100 m3) and light-trap CPUE (fish/10 min) for fish collected at Grand Isle 94 with standard error (SE), rank, percent o f total catch (%),and months collected for each taxa. (N) indicates taxa collected only with plankton nets.(L) indicates taxa collected only with light-traps. For ranks, tied values received the meano f the corresponding ranks. % indicates a value < 1.00%......... 36
Table 2.5. Total plankton net density (fish/100 mJ) and light-trap CPUE (fish/10 min) for fish collected at South Timbalier 54 with standard error (SE), rank, percent o f total catch (%),and months collected for each taxa. (N) indicates taxa collected only with plankton nets.(L) indicates taxa collected only with light-traps. For ranks, tied values received the meano f the corresponding ranks. { indicates a value <1.00%..................................................................... 48
Table 2.6. Total mean light-trap CPUE (fish/10 min) and pushnet density (fish/100 m3) for fish collected at Belle Pass with standard error (SE), rank, percent o f total catch (%), and months collected for each taxa. For ranks, tied values received the mean o f thecorresponding ranks. { indicates a value < 1.00%............................................................................... 58
Table 2.7. Total plankton net density (fish/lOOm3), pushnet density (fish/lOOm3), andlight-trap CPUE (fish/10 min) for reef-dependent (RD) and reef-associated (RA) familieso f fish collected at each site with standard error (SE). Densities calculated for the platformsinclude both surface and subsurface samples. CPUEs calculated for the platforms includesurface, subsurface, and o ff platform samples, t indicates a value <0.01.......................................... 64
Table 2.8. Schoenefs similarity indices for all sampling sites. Values range from 0-1 (no similarity-identical) and include taxa (at least to the level o f genus) from all gears used at each site. Values represent indices calculated with the most dominant taxa from each site removed. (BP) Belle Pass. (ST) South Timbalier, (GI) Grand Isle, (GC) Green Canyon................... 70
Table 2.9. Results o f a canonical correlation analysis on log-transformed plankton net densities (15 most dominant taxa) and environmental variables for Green Canyon 18.Loadings in bold under statistically significant canonical variates V I and V2 explain atleast 15% o f the variation for that taxon. Loadings in bold under the environmentalcanonical variates W1 and W2 indicate the most influential environmental variables....................... 73
Table 2.10. Results o f a canonical correlation analysis on log-transformed light-trap CPUEs (18 most dominant taxa) and environmental variables for Green Canyon 18.Loadings in bold under statistically significant canonical variates V I and V2 explain atleast 15% o f the variation for that taxon. Loadinp in bold under the environmentalcanonical variates W1 and W2 indicate the most influential environmental variables........................ 74
v ii
Reproduced with permission of the copyright owner. Further reproduction prohibited without permission.

Table 2.11. Results o f a canonical correlation analysis on log-transformed plankton net densities (15 most dominant taxa) and environmental variables for Grand Isle 94.Loadings in bold under statistically significant canonical variates V I and V2 explain atleast 15% o f the variation for that taxon. Loadings in bold under the environmental variatesW1 and W2 indicate the most influential physical variables.............................................................. 76
Table 2.12. Results o f a canonical correlation analysis on log-transformed light-trap CPUEs (16 most dominant taxa) and environmental variables for Grand Isle 94.Loadings in bold under statistically significant canonical variates V 1, V2, and V3explain at least 15% o f the variation for that taxon. Loadings in bold under environmentalvariates W l, W2, and W3 indicate the most influential environmental variables............................... 77
Table 2.13. Results o f a canonical correlation analysis on log-transformed plankton netdensities (15 most dominant taxa) and environmental variables for South Timbalier 54.Loadings in bold under the statistically significant canonical variate V 1 explain at least15% o f the variation for that taxon. Loadings in bold under environmental variate WIindicate the most influential environmental variables.......................................................................... 78
Table 2.14. Results o f a canonical correlation analysis on log-transformed light-trap CPUEs (16 most dominant taxa) and environmental variables for South Timbalier 54.Loadings under statistically significant canonical variates V I and V2 explain at least 15%o f the variation for that taxon. Loadings in bold under environmental canonical variatesW l and W2 indicate the most influential environmental variables..................................................... 79
Table 2.15. Results o f a canonical correlation analysis on log-transformed pushnet densities (15 most dominant taxa) and environmental variables for Belle Pass. Loadings in bold under the statistically significant canonical variates V I, V2, and V3 explain at
least 15% o f the variation for that taxon. Loadings in bold under environmental variatesW 1, W2, and W3 indicate the most influential environmental variables............................................. 80
Table 2.16. Results o f a canonical correlation analysis on log-transformed light-trapCPUEs (15 most dominant taxa) and environmental variables for Belle Pass. Loadingsin bold under the statistically significant variate V I explain at least 15% o f the variationfor that taxon. Loadings in bold under environmental canonical variate W 1 indicate themost influential physical variables.......................................................................................................... 82
Table 3.1. Number o f samples, total individuals, families, and taxa (excludingclupeiforms) collected at each site with a passive plankton net. light-trap, andplankton pushnet. Mean total densities (nets) or CPUEs (light-traps) are alsoprovided for each gear at each site. For each site, values in parentheses indicatethe number o f families or taxa (at least to genus level) unique to that gear type................................. 101
Table 3.2. Size ranges (SL in mm) and percent o f the total catch by gear fordominant taxa (>t% ) collected by at least one gear type. Note the preponderanceo f recently-spawned larvae, late stage postlarvae, or juveniles collected with bothgears. Also note the overlap in sampling efforts for GC 18 and G I94, and ST 54and Belle Pass........................................................................................................................................ 103
Table 3.3. Schoener's Index o f Niche Overlap values for different surface gear andlocation comparisons. (OL) off-platform light-trap, (SL) surface light-trap, (SN)surface net, (TL) total light-traps, (TN) total nets................................................................................ 124
Table 4.1. Total plankton net density (fish/100 nr’) and light-trap CPUE (fish/10 min)for the top 10 taxonomic groups o f fish collected at the shelf break platform (GC 18)with standard error (SE) and rank by each gear type and location. For ranks, tiedvalues received the mean o f the corresponding ranks.......................................................................... 140
v i i i
Reproduced with permission of the copyright owner. Further reproduction prohibited without permission.

Table 4.2. Total plankton net density (fish/100 m3) and light-trap CPUE (fish/10 min)for the top 10 taxonomic groups o f fish collected at the mid-shelf platform (G I94) withstandard error (SE) and rank by each gear type and location. For ranks, tied valuesreceived the mean o f the corresponding ranks..................................................................................... 142
Table 4.3. Total plankton net density (fish/100 m3) and light-trap CPUE (fish/10 min)for the top 10 taxonomic groups o f fish collected at the inner shelf platform (ST 54)with standard error (SE) and rank by each gear type and location. For ranks, tied valuesreceived the mean o f the corresponding ranks.................................................................................... 144
Table 4.4. Unique taxa (identified at least to genus) collected by gear and locationfor each platform................................................................................................................................. 145
Table 4.5. Schoener’s similarity indices for different surface gear and location comparisons. (OL) off-platform light-trap, (SL) surface light-trap, (SN) surface net,(TL) total light-traps, (TN) total nets................................................................................................... 155
Table 5.1. List o f published literature used to compile size-at-stage data for selected taxa............... 167
Table 5.2. Location and maximum sampling depth range in meters (m) o f obliquebongo tows for SEAMAP sampling stations (oblique bongo and neuston collections)used for comparison with platform data............................................................................................... 168
Table 5.3. Total number o f fish and percent o f reef-dependent and reef-associated fishes collected at each platform site. Numbers and percentages in parenthesesrepresent values based on non-clupeiform data.................................................................................... 169
Table 5.4. Mean abundance (fish/m2) and standard deviation (SD) for reef fish collected at selected SEAMAP ichthyoplankton sampling stations (oblique bongo tows) and at three oil and gas platforms (passive plankton net, subsurface andsurface) across the continental shelf..................................................................................................... 196
Table 5.5. Mean number (fish/sample) and standard deviation (SD) o f reef fishcollected at selected SEAMAP ichthyoplankton sampling stations (neuston tows)and at three oil and gas platforms (light-traps. surface and off-platform) across thecontinental shelf................................................................................................................................... 198
ix
Reproduced with permission of the copyright owner. Further reproduction prohibited without permission.

LIST OF FIGURES
Figure 2.1. Location o f the approximately 4,000 oil and gas platforms in federal waters o f the northcentral Gulf. Also indicated are the three platforms and the coastal jetty site sampled during the course o f this study. Map modified from TolanlOOl............................................................................................................ 12
Figure 2.2. Mean surface temperatures (and standard errors) for each sampling site. 21
Figure 2.3. Mean surface salinities (and standard errors) for each sampling site.
Figure 2.4. Mean microzooplankton biomass (and standard errors) for each platform site. 23
Figure 2.5. Mean suspended sediments (and standard errors) for each platform site and mean surface turbidity (and standard errors) for the Belle Pass jetty site........................ 25
Figure 2.6. Mean Shannon-Weiner diversity indices (with standard error bars) for light-trap collections and plankton net (outer, mid- and inner shelf platforms) or pushnet (Belle Pass jetties) collections from each sampling site. The same letter above each bar indicates no significant difference between the sites based on Tukey’s Studentized Range tests (a=0.05). Different letters indicate significant differences...... 72
Figure 3.1. Specifications for the modified quatrefoil light-trap used in this study. 98
Figure 3.2. Mean plankton net densities (a) and light-trap CPUEs (b) with standard errors for each sampling trip at Green Canyon 18(1995-96). Arrows above bars point toward the off-scale mean for that gear. No subsurface plankton net samples were taken during June 26-29, August 25-28, September 24-25, and April 15-18. No surface net, surface light-trap, or subsurface light-trap samples were taken during April 15-18.No fish were present in subsurface light-trap samples (n= 10) during February 17-18........................ 102
Figure 3.3. Mean plankton net densities (a) and light-trap CPUEs (b) with standard errorsfor each sampling trip at Grand Isle 94 (1996). Arrows above bars point toward the off-scale mean for that gear........................................................................................................................ 105
Figure 3.4. Mean plankton net densities (a) and light-trap CPUEs (b) with standard errors for each sampling trip at South Timbalier 54 (1997). Arrows above bars point toward the off-scale mean for that gear. Subsurface net samples were only taken during April 7-8.No subsurface light-traps were taken during May 5-8. No off-platform light-trap sampleswere taken during September 3-5. No fish were present in subsurface light-trap samples(n=4) during August 17-20................................................................................................................... 107
Figure 3.5. Mean pushnet densities (a) and light-trap CPUEs (b) with standard errors foreach sampling trip at Belle Pass (1997). No fish were present in light-trap samples duringJuly 19-21............................................................................................................................................. 108
Figure 3.6. Mean plankton net densities (a) and light-trap CPUEs (b) with standard errorbars for depths/locations within each platform site. Arrows above bars point toward theoff-scale mean for that gear. For mean densities within each location, the same letterabove each bar indicates no significant difference between depths based on t-tests on log-transformed data (a=0.05). For mean CPUEs within each location, the same letter aboveeach bar indicates no significant difference between depths/locations based on Tukey'sStudentized Range test on ranked data (a=0.0S). Different letters designate significantdifferences............................................................................................................................................ 109
X
Reproduced with permission of the copyright owner. Further reproduction prohibited without permission.

Figure 3.7. Size distributions o f fish collected with light-traps (shaded bars) and planktonnets (open bars) at the Green Canyon site (1995-1996). Fish length-frequency distributionswere analyzed with Kolmogorov-Smimov tests (p-values are represented in the upper panelo f each gear pairing along with each sample size)............................................................................... 111
Figure 3.8. Size distributions o f fish collected with light-traps (shaded bars) and planktonnets (open bars) at the Grand Isle site (1996). Fish length-frequency distributions wereanalyzed with Kolmogorov-Smimov tests (p-values are represented in the upper panel o feach gear pairing along with each sample size)................................................................................... 113
Figure 3.9. Size distributions o f fish collected with light-traps (shaded bars) and planktonnets (open bars) at the South Timbalier site (1997). Fish length-frequency distributionswere analyzed with Kolmogorov-Smimov tests (p-values are represented in the upper panelo f each gear pairing along with each sample size)............................................................................... 116
Figure 3.10. Size distributions o f fish collected with light-traps (shaded bars) and apushnet (open bars) at the Belle Pass site (1997). Fish length frequency distributions wereanalyzed with Kolmogorov-Smimov tests (p-values are represented in the upper panel o feach gear pairing along with each sample size)................................................................................... 119
Figure 3.11. Mean plankton net density (a) and light-trap CPUE (b) with standard errorbars for each lunar phase sampled at Grand Isle 94 (Apr-Sep 1996). The p-values indicatestatistical significance from t-tests....................................................................................................... 120
Figure 3.12. Mean plankton net density (a) and light-trap CPUE (b) with standard error barsfor each lunar phase sampled in May 1996 at Grand Isle 94. The same letter above each barindicates no significant difference between the lunar phases based on Tukey's StudentizedRange tests on ranked data (a=0.05).................................................................................................... 121
Figure 3.13. Mean plankton net density (a) and light-trap CPUE (b) with standard error barsfor each lunar phase sampled at South Timbalier 54 ( Apr-Sep 1997). The p-values representstatistical significance from t-tests....................................................................................................... 122
Figure 3.14. Mean pushnet density (a) and light-trap CPUE (b) with standard error bars foreach lunar phase sampled at Belle Pass ( Apr-Sep 1997). The p-values represent statisticalsignificance from t-tests....................................................................................................................... 123
Figure 3.15. Mean Shannon-Weiner diversity indices (with standard error bars) for each gear type and sampling location for each site. The same letter above each bar indicates no significant difference between the gear types based on Tukey’sStudentized Range tests (a=0.05). Different letters indicate significant differences.......................... 125
Figure 4.1. Mean light-trap CPUEs (a) and plankton net densities (b) with standard error bars for data without clupeiform fishes for depths/locations within each platform site. Arrows above bars point toward the mean for that location/depth which is o ff the axis. Within each site, the same letter above each bar indicates no significant difference between the gear types based on Tukey's Studentized Range test on ranked data (ct=0.05).Different leners designate significant differences................................................................................ 147
Figure 4.2. Mean total CPUEs (with standard error bars) for dominant species collectedwith light-traps at the shelf break platform (GC 18). The same letter above each barindicates no significant difference between the gear locations based on Tukey's StudentizedRange tests on ranked data (a=0.05). Different letters indicate significant differences..................... 149
xi
Reproduced with permission of the copyright owner. Further reproduction prohibited without permission.

Figure 4.3. Mean total densities (with standard error bars) tor dominant species collectedwith plankton nets at shelf break platform (GC 18). The p-values indicate statisticalsignificance from t-tests on log-transformed data............................................................................... 150
Figure 4.4. Mean total CPUEs (with standard error bars) for dominant species collectedwith light-traps at the mid-shelf platform (GI 94). The same letter above each bar indicatesno significant difference between the gear locations based on Tukey's Studentized Range
tests on ranked data (a=0.05). Different letters indicate significant differences................................ 151
Figure 4.5. Mean total densities (with standard error bars) for dominant species collectedwith plankton nets at the mid-shelf platform (Gl 94). The p-values indicate statisticalsignificance from t-tests on log-transformed data............................................................................... 152
Figure 4.6. Mean total CPUEs (with standard error bars) for dominant species collectedwith light-traps at the inner shelf platform (ST 54). The same letter above each bar indicatesno significant difference between the gear locations based on Tukey’s Studentized Rangetests on ranked data (ct=0.05). Different tetters indicate significant differences................................ 153
Figure 4.7. Mean total densities (with standard error bars) for dominant species collectedwith plankton nets at the inner shelf platform (ST 54). The p-values indicate statisticalsignificance from t-tests on log-transformed data................................................................................ 154
Figure 4.8. Mean Shannon-Weiner diversity indices (with standard error bars) for eachgear type and sampling location for each site. The same letter above each bar indicates nosignificant difference between the gear types based on Tukey's Studentized Range tests(a=0.05). Different letters indicate significant differences................................................................ 156
Figure 5.1. Size distribution o f pomacentrids collected at the outer shelf platform(GC 18). Lines above the bars denote the size ranges for different early life historystages based on published literature. N = total number o f fish measured............................................ 171
Figure 5.2. Size distribution o f pomacentrids collected at the mid-shelf platform(Gl 94). Lines above the bars denote the size ranges for different early life historystages based on published literature. N = total number o f fish measured............................................ 173
Figure 5.3. Size distribution o f scarids collected at the outer shelf platform (GC 18).Lines above the bars denote the size ranges for different early life history stages basedon published literature. N = total number o f fish measured................................................................. 174
Figure 5.4. Size distribution o f blennies collected at the outer shelf platform (GC 18).Lines above the bars denote the size ranges for different early life history stages basedon published literature. Note break in size scale. N = total number o f fish measured......................... 179
Figure 5.5. Size distribution o f blennies collected at the mid-shelf platform (GI 94).Lines above the bars denote the size ranges for different early life history stages basedon published literature. N = total number o f fish measured................................................................. 181
Figure 5.6. Size distribution o f blennies collected at the inner shelf platform (ST 54).Lines above the bars denote the size ranges for different early life history stages basedon published literature. N = total number o f fish measured................................................................. 182
Figure 5.7. Size distribution o f serranids collected at the outer shelf platform (GC 18).Lines above the bars denote the size ranges for different early life history stages basedon published literature. N = total number o f fish measured................................................................. 184
xii
Reproduced with permission of the copyright owner. Further reproduction prohibited without permission.

Figure S.8. Size distribution o f serranids collected at the mid-shelf platform (GI 94).Lines above the bars denote the size ranges for different early life history stages basedon published literature. N = total number o f fish measured................................................................. 186
Figure 5.9. Size distribution o f serranids collected at the inner shelf platform (ST 54).Lines above the bars denote the size ranges for different early life history stages basedon published literature. N = total number o f fish measured................................................................. 187
Figure 5.10. Size distribution o f lutjanids collected at the outer shelf platform (GC 18).Lines above the bars denote the size ranges for different early life history stages basedon published literature. N = total number o f fish measured. Note break in size scale......................... 189
Figure 5.11. Size distribution o f lutjanids collected at the mid-shelf platform (GI 94).Lines above the bars denote the size ranges for different early life history stages basedon published literature. N = total number o f fish measured................................................................. 190
Figure 5.12. Size distribution o f lutjanids collected at the inner shelf platform (ST 54).Lines above the bars denote the size ranges for different early life history stages basedon published literature. N = total number o f fish measured................................................................. 191
Figure 5.13. Size distribution o f holocentrids collected at the outer shelf platform (GC 18).Lines above the bars denote the size ranges for different early life history stages based onpublished literature. N = total number o f fish measured...................................................................... 193
Figure 5.14. Size distribution o f holocentrids collected at the mid-shelf platform (Gl 94).Lines above the bars denote the size ranges for different early life history stages based onpublished literature. Note break in size scale. N = total number o f fish measured.............................. 195
x i i i
Reproduced with permission of the copyright owner. Further reproduction prohibited without permission.

ABSTRACT
A cross-shelf transect o f three petroleum platforms and a coastal rock jetty (another hard-
substrate, artificial habitat) in the northcentral Gulf were sampled to examine the role that oil and gas
platforms (hard substrate habitat) may play in the early life history stages o f reef-dependent and reef-
associated fishes. The ichthyoplankton and juvenile fish assemblages were sampled at Green Canyon 18
(GC 18; 230 m depth, shelf slope); Grand Isle 94 (Gl 94; 60 m depth, mid-shelf); and South Timbalier 54
(ST 54; 20 m depth, inner shelf) with passive plankton nets and light-traps and at a coastal rock jetty
(Belle Pass; 3-5 m depth) with a light-trap and a plankton pushnet. At all sites clupeiforms dominated
samples, comprising 59-97% o f the total catch. Results o f Kolmogorov-Smimov length-frequency
comparisons o f fish collected in plankton nets vs. light-traps (platforms) indicated light-traps generally
collected significantly larger individuals. At the jetties, greater overlap in size distributions was observed
for comparisons o f the pushnet and light-trap. Reef-dependent (e.g., pomacentrids. scarids, chaetodontids
and labrids) and reef-associated (e.g., serranids. lutjanids, blenniids and holocentrids) taxa were relatively
rare in our collections compared to coastal pelagic (scombrids and carangids) and demersal taxa
(sciaenids), which are also ofren associated with petroleum platforms. Taxonomic richness and diversity
was highest at mid-shelf platform (GI 94), possibly a result o f its proximity to a high density o f upstream
and surrounding platforms which may create generally favorable conditions for the recruitment o f reef
taxa. Preflexion and early larval stages o f reef-dependent and reef-associated fishes were collected at the
outer shelf platform (blenniids. holocentrids, serranids, lutjanids and scarids), mid-shelf platform
(pomacentrids. blenniids, holocentrids, lutjanids and serranids), and inner shelf platform (blenniids and
lutjanids), suggesting nearby spawning or local supply. Similarly, presettlement and settlement-sized
reef-dependent and reef-associated fishes were collected at the outer shelf (pomacentrids. scarids,
blenniids, serranids, lutjanids and holocentrids). mid-shelf (pomacentrids, blenniids, serranids, lutjanids
and holocentrids), and inner shelf (labrids, blenniids, serranids and lutjanids) platforms. With the limited
amount o f hard-substrate habitat available in the northern Gulf, the addition o f artificial habitats
(platforms) may increase the chances o f finding suitable spawning or settlement habitat.
xiv
Reproduced with permission of the copyright owner. Further reproduction prohibited without permission.

CHAPTER 1
THE ACROSS-SHELF DISTRIBUTION OF REEF FISHES AND THE POTENTIAL IMPORTANCE OF OIL AND GAS PLATFORMS AS ARTIFICIAL HABITAT FOR FISHES IN THE NORTHERN GULF OF MEXICO
I
Reproduced with permission of the copyright owner. Further reproduction prohibited without permission.

INTRODUCTION
The G ulf o f Mexico (Gulf) yields about 40% o f the commercial fish landings (NOAA/NMFS
1993) in the United States and supports 33% o f the country's recreational fishery (Essig et al. 1991; Van
Voorhies et al. 1992). The region also possesses the vast majority o f the nation's coastal wetlands.
Louisiana alone has over 3.8 million acres (>40% o f the nation's total wetlands), but these areas are
disappearing at an alarming rate, i.e.. Louisiana land loss represents 60-80% o f the nation's total annual
coastal wetland loss (Boesch et al. 1994). The continual loss o f Gulf estuarine and wetland habitats that
serve as the nursery grounds for a large number o f our commercially- and recreationally-important
fisheries makes knowledge o f the potential nursery function o f other habitats critical. Habitat issues have
received increased attention lately, in part due to the Essential Fish Habitat Provisions added to the
Federal Sustainable Fisheries Act o f 1996 that facilitate the long-term protection o f waters and substrate
necessary to fish for spawning, breeding, feeding and/or growth to maturity (USDOC 1996).
The introduction and proliferation o f offshore oil and gas structures in the northern Gulf has
undoubtedly affected the marine ecosystem. There are approximately S.000 oil and gas structures in the
northern Gulf, about 4.000 o f which are in federal waters (Stanley and Wilson 2000). The central and
western Gulf is dominated by a mud/silt/sand bottom with little relief or hard bottom habitat. Parker et al.
(1983) reported only 2.780 km: o f natural available reef in the central and western Gulf. Gallaway
(1998) calculated that oil and gas platforms in the northern Gulf provided 11.7 km: (or <0.4 %) o f the
total "reef' habitat. O ff the Louisiana coast, the contribution is relatively greater, as platforms account
for 10.4% o f the available hard bottom in Minerals Management Service (MMS) No Activity zones
(Stanley and Wilson 2000). That platforms represent vertical artificial substrate that extends from the
bottom to the surface (photic zone), regardless o f location and depth, increases their significance. Since
fish populations are usually limited by available energy, recruitment, or habitat, it is important to
determine i f platforms: 1) serve as new or additional spawning habitat, and 2) provide critical habitat for
early life history stages.
The adult fish communities around natural and artificial reefs are fairly well known (Seaman and
Sprague 1992: Rooker et al. 1997; Stanley and Wilson 2000) and the fish aggregation value o f oil and gas
structures is well-recognized in the Gulf(CDOP 1985). However, biologists still disagree as to whether
7
Reproduced with permission of the copyright owner. Further reproduction prohibited without permission.

these artificial reefs (i.e., platforms) contribute significantly to new fish production or simply attract and
concentrate existing fish biomass (Pickering and Whitmarsh 1997; Bortone 1998). Existing data on adult
fishes support both sides o f the debate (Stone et al. 1979; Alevizon et al. 1985). Bohnsack (1989)
theorized that reef effects fall along a continuum between attraction o f existing organisms and production,
with increased productivity occurring for reef-dependent species in areas o f limited hard substrate habitat.
Since the central G ulf has little natural reef habitat relative to the western and eastern portions, it is
possible that the contribution o f artificial reefs to existing reef habitat has enhanced reef fish populations,
but the overall or net impact o f this augmentation is not known, especially when corrected for increased
fishing mortality on aggregations associated with platforms (Stanley and Wilson 1990).
Across-Sheir Ichthyofaunal Zonation
Gallaway et al. ( 1980) and Gallaway (1981) reviewed previous descriptions o f invertebrate and
vertebrate faunal assemblages from the northcentral Gulfs continental shelf. They characterized
differences largely upon different bottom types (fluvial/terrigenous sediments west o f the Mississippi
River Delta and carbonaceous sediments to the east), circulation patterns, climate, and related
hydrographic conditions. Gallaway and his colleagues reported distinct changes in reef fish species
assemblages when analyzed across depths. Overall, the outer shelf (>60 m depth) reefs appear to be more
speciose. followed by the mid-shelf (20-60 m) and then the inner shelf (3-20 m). More tropical taxa
were present on the outer shelf reefs, such as haemulids. labrids, and scarids, and similar taxa occurred on
both natural and artificial reefs. There was some overlap between reef species on the outer shelf and mid
shelf (chaetodontids. pomacanthids, and pomacentrids), but the tropical taxa were replaced by more
temperate reef species, such as serranids, Archosargus probatocephalus. pomatomids. and rachycentrids.
Also, taxa that have been reported to be common on artificial reefs on the mid-shelf were generally
common on the inner shelf as well. In general, Caranx crysos and other jacks were noted as being
relatively common reef-associated species in each zone.
Ichthyoplankton Collected at Oil and Gas Platforms
Few baseline ecological ichthyoplankton studies within the oil field have been published
(Finucane et al. 1979a; Finucane et al., 1979b; Bedinger et al. 1980). and none have been published that
focus on the platform infrastructure. I am aware o f only one study that investigated the ichthyoplankton
*
Reproduced with permission of the copyright owner. Further reproduction prohibited without permission.

community found near oil and gas platforms. Finucane et al. (1979b), using bongo and neuston nets,
sampled within 30-90 m o f two platforms and two satellite (well) jackets all within the Buccaneer Oil
Field, approximately SO km south southeast o f Galveston, Texas. Two far-field, control sites were also
sampled for comparison. While the Buccaneer Oil Field study did attempt to address larval fish
assemblages near platforms, all o f the sites with structure were within a 5 km radius from each other, and
all sites, including the controls, were in 17 m o f water, not allowing for any comparisons o f different
community regimes across depth zones or large geographic areas. Also, sampling in the oil field study
was limited to only three, 2-day cruises. In contrast, this study intensively sampled all three o f
Gallaway's (1981) depth zones, allowing for a preliminary characterization o f ichthyoplankton
assemblages collected within these platforms (i.e., artificial habitats) across the continental shelf.
Study Objectives
This study was part o f a larger, coordinated research effort with other scientists investigating the
overall importance o f oil and gas platforms as habitat for larval and juvenile fishes (Tolan 2001), as well
as adult fishes (Stanley and Wilson 2000). This study focused on three main objectives. The first was to
provide much needed information on the role that oil and gas platforms (hard substrate habitat) may play
as recruitment grounds and/or refugia for postlarval and juvenile fish, which could contribute to fish
production. Secondly, I wished to provide more basic biological information on reef fish, e.g., larval,
postlarval, and juvenile taxonomy, seasonality, lunar periodicity, distribution (vertical and across shelf),
and relative abundance. Finally, as a long-term objective, I wished to evaluate the ecological significance
that this artificial habitat building, which has occurred on an unprecedented scale in the northcentral Gulf,
may have had on the early life history stages o f fish. Specific objectives o f the remaining chapters are
given below.
In Chapter 2 ,1 describe the larval, postlarval and juvenile fish assemblages collected at three
offshore oil and gas platforms, i.e.. Gallaway's (1981) three community zones, and a coastal rock jetty o ff
Louisiana. These descriptions include information on seasonality, relative abundance and density o f
fishes collected, as well as comparisons o f taxonomic richness, diversity and similarity between the sites
(across-shelf)- Also, abundances and densities o f dominant taxa are related to measured environmental
parameters (e.g.. temperature, salinity, turbidity, dissolved oxygen and macrozooplankton biomass).
4
Reproduced with permission of the copyright owner. Further reproduction prohibited without permission.

In Chapter 3 ,1 describe the sampling methodologies utilized in this study. In this attempt to
characterize the across-shelf ichthyoplankton assemblages collected at artificial structures in the northern
Gulf, a variety o f sampling gears were used in an effort to survey the widest range o f taxa, size classes,
and developmental stages available. This chapter reports the results o f gear comparisons between a
passive plankton net and light-trap used at the petroleum platforms, and between a bow-mounted,
plankton pushnet and light-trap (the same design) used at the coastal jetty. In these comparisons. I
examine the taxa collected by the different gears, the similarity and diversity o f the catches, as well as the
size selectivities o f the gears.
In Chapter 4 ,1 describe the spatial and vertical distributions o f larval and juvenile fishes
collected at oil and gas platforms. In order to comprehensively sample the platform environment, fish
larvae and juveniles were collected at depth and near the surface within the platform infrastructure
(plankton nets and light-traps). and near the surface immediately downstream (20 m) o f the platform
structure (light-traps). Differences in fish densities, taxonomic richness, diversity and similarity are
compared between depths and locations within and around each platform.
In Chapter 5 .1 examine the relative abundances and size distributions o f reef fish larvae and
juveniles collected at oil and gas platforms. In order to determine which life history stages were collected
and how those specimens relate to supply and recruitment, their size distributions are compared with
literature-based sizes for hatchling, preflexion, flexion, postflexion, and juvenile reef fishes. Also, in an
effort to compare the platform-collected fish abundances to continental shelf or open water "background"
abundances, comparisons are made between reef-dependent and reef-associated fishes collected at the
platforms and those collected in ichthyoplankton surveys by the Southeast Area Monitoring and
Assessment Program (SEAMAP).
In Chapter 6 .1 present a summary o f the relevant findings from Chapters 2-5. The potential
importance o f oil and gas platforms to larval and juvenile fishes is discussed in detail.
Each chapter has been prepared in manuscript form for scientific journal publication. These
chapters have been arranged such that the holistic (or across-shelf) dynamics o f the study are presented
first (Chapter 2). Smaller (though relevant) components o f the study are described in more detail in the
following chapters (Chapters 3-5). The reader is directed to these chapters for a more complete and
5
Reproduced with permission of the copyright owner. Further reproduction prohibited without permission.

in-depth discussion o f gear selectivity and biases (Chapter 3), within-site fish vertical and spatial
distributions (Chapter 4), and reef fish developmental stages (Chapter 5).
REFERENCES
Alevizon, W.C., J.C. Gorhan, R. Richardson, and A. McCarthy. 1985. Use o f man-made reefs to concentrate snapper (Lutjanidae) and grunts (Haemulidae) in Bahamian waters. Bulletin o f Marine Science 37:3-10.
Bedinger, C.A., J.W. Cooper, A. Kwok, R.E. Childers, and K.T. Kimball. 1980. Ecologicalinvestigations o f petroleum production platforms in the central Gulf o f Mexico. Volume 1: Pollutant fate and effects studies. Draft final report submitted to the Bureau o f Land Management. Contract AA551-CT8-17.
Boesch, D.F.. M.N. Josselyn. A.J. Mehta. J.T Morris, W.K. Nuttle, C.A. Simenstad and J.P Swift. 1994. Scientific assessment o f coastal wetland loss, restoration and management in Louisiana. Journal o f Coastal Research, Special Issue 20:1-102.
Bohnsack. J.A. 1989. Are high densities o f fishes at artificial reefs the result o f habitat limitations or behavioral preference? Bulletin o f Marine Science 44:632-645.
Bortone. S.A. 1998. Resolving the attraction-production dilemma in artificial reef research: Some yeas and nays. Fisheries 23:6-10.
CDOP (Committee on Disposition o f Offshore Platforms). 1985. Disposal o f offshore platforms. Marine Board. Commission on Engineering and Technical Systems. National Research Council.National Academy Press. Washington. D.C.
Essig. R.J., J.F. Witzig, and M.C. Holliday. 1991. Marine recreational fishery statistics survey, Atlantic and Gulf coasts, 1987-1989. NOAA/NMFS Current Fisheries Statistics 8904.
Finucane. J.H.. L.A. Collins. L.E. Barger, and J.D. McEachran. 1979a. Environmental Studies o f theSouth Texas Outer Continental Shelf 1976: Ichthyoplankton/mackerel eggs and larvae. NOAA Final Report to BLM, NMFS Southeast Fisheries Center. Galveston, Contract Number AA550- TA7-3.
Finucane, J.H.. L.A. Collins, and L.E. Barger. 1979b. Determine the effects o f discharges on seasonal abundance, distribution, and composition o f ichthyoplankton in the oil field. In Jackson, W.B.. editor. Environmental Assessment o f an Active Oil Field in the Northwestern Gulf o f Mexico. 1977-1978. NOAA Report to EPA. NMFS Southeast Fisheries Center. Galveston. Contract Number EPA-IAG-D5-E693-EO. 299 pp.
Gallaway. B. J. 1981. An ecosystem analysis o f oil and gas development on the Texas-Louisianacontinental shelf. U.S. Fish & Wildlife Service. Office o f Biological Services. FWS/OBS-81/27. Washington, D.C.
Gallaway, B. J. 1998. Cumulative ecological significance o f oil and gas structures in the Gulf o f Mexico: Information search, synthesis, and ecological modeling: Phase I, Final Report. U. S. Geological Survey. Biological Research Division. Washington. D.C. USGS/BRD/CR-1997-0006.
Gallaway. B.J.. L.R. Martin, R.L. Howard. G.S. Boland and G.D. Dennis. 1980. A case study o f the effects o f gas and oil production on artificial reef and demersal fish and macrocrustacean communities in the northwestern Gulf o f Mexico. Expo Chem 1980. Houston, Texas.
NOAA/NMFS. 1993. Fisheries o f the United States. 1992. Current Fisheries Statistics 9200.
6
Reproduced with permission of the copyright owner. Further reproduction prohibited without permission.

Parker, R.O., Jr., D.R. Colby T.P. Willis. 1983. Estimated amount o f reef habitat on a portion o f the U.S. South Atlantic and Gulf o f Mexico continental shelf. Bulletin o f Marine Science 33:935-940.
Pickering, H „ and D. Whitmarsh. 1997. Artificial reefs and fisheries exploitation: A review o f the 'attraction versus production' debate, the influence o f design and its significance for policy. Fisheries Research 31:39-59.
Rooker, J.R., Q.R. Dokken, C.V. Pattengill, and G.J. Holt. 1997. Fish assemblages on artificial andnatural reefs in The Flower Garden Banks National Marine Sanctuary, USA. Coral Reefs 16:83- 92.
Seaman, W „ Jr. and L.M. Sprague. 1992. Artificial habitats for marine and freshwater fisheries. Academic Press, New York.
Stanley, D.R. and C.A. Wilson. 1990. A fishery-dependent based study o f fish species composition and associated catch rates around oil and gas structures o ff Louisiana. Fishery Bulletin. U.S. 88:719- 730.
Stanley, D.R. and C. Wilson. 2000. Seasonal and spatial variation in the biomass and size frequency distribution o f the fish associated with oil and gas platforms in the northern Gulf o f Mexico.OCS Study MMS 2000-005. U.S. Department o f Interior, Minerals Management Service, Gulf o f Mexico OCS Region, New Orleans.
Stone, R.B.. H.L. Pratt, R.O. Parker, and G.E. Davis. 1979. A comparison o f fish populations on an artificial and natural reef in the Florida Keys. Marine Fisheries Review 41:1-11.
Tolan, J.M. 2001. Patterns o f reef fish larval supply to petroleum platforms in the northern Gulf o f Mexico. Doctoral dissertation. Louisiana State University, Baton Rouge.
USDOC (United States Department o f Commerce). 1996. Magnuson-Stevens Fishery Conversation and Management Act. NOAA Technical Memorandum. NMFS-F/SPO-23.
Van Voorhies, D.A.. J.F. Witzig, M.F. Osbom, M.C. Holliday, and RJ. Essig. 1992. Marine recreational fishery statistics survey, Atlantic and G u lf coasts, 1990-1991. NOAA/NMFS Current Fisheries Statistics 9204.
7
Reproduced with permission of the copyright owner. Further reproduction prohibited without permission.

CHAPTER 2
EARLY LIFE HISTORY STAGES OF FISHES COLLECTED ACROSS THE SHELF AT OFFSHORE OIL AND GAS PLATFORMS AND A ROCK JETTY WEST OF THE MISSISSIPPI RIVER DELTA
8
Reproduced with permission of the copyright owner. Further reproduction prohibited without permission.

INTRODUCTION
The Gulf o f Mexico (Gulf) yields about 40% o f the commercial fish landings (NO AA/NMFS
1993) in the United States and supports 33% o f the country's recreational fishery (Essig et al. 1991; Van
Voorhies et al. 1992). The region also possesses the vast majority o f the nation's coastal wetlands.
Louisiana alone has over 3.8 million acres (>40% o f the nation's total wetlands), but these areas are
disappearing at an alarming rate, i.e., Louisiana land loss represents 60-80% o f the nation's total annual
coastal wetland loss (Boesch et al. 1994). The continual loss o f Gulf estuarine habitats that serve as the
nursery grounds for a large number o f commercially- and recreational ly-important fisheries makes
knowledge o f the potential nursery function o f other habitats critical.
The introduction and proliferation o f offshore oil and gas structures in the northern Gulf has
undoubtedly affected the marine ecosystem. There are approximately 5,000 oil and gas structures in the
northern Gulf, about 4,000 o f which are in federal waters (Stanley and Wilson 2000). The central and
western Gulf is dominated by a mud/silt/sand bottom with little relief or hard bottom habitat. Parker et al.
( 1983) reported only 2,780 knr o f natural available reef in the central and western Gulf. While Gallaway
( 1998) calculated that oil and gas platforms in the northern Gulf provide 11.7 km2 (or <0.4 %) o f the total
"reef' habitat, that platforms represent vertical artificial substrate that extends from the bottom to the
surface (photic zone), regardless o f location and depth, increases their significance.
The adult fish communities around natural and artificial reefs are fairly well known (Seaman and
Sprague 1992; Rooker et al. 1997; Stanley and Wilson 2000) and the fish aggregation value o f oil and gas
structures is well-recognized in the Gulf (CDOP 1985). However, biologists still disagree as to whether
these artificial reefs (i.e., platforms) contribute significantly to new fish production or simply attract and
concentrate existing fish biomass (Pickering and Whitmarsh 1997; Bortone 1998). Existing data on adult
fishes support both sides o f the debate (Stone et al. 1979; Aievizon et al. 1985). Bohnsack (1989)
theorized that reef effects fall along a continuum between attraction o f existing organisms and production,
with increased productivity occurring for reef-dependent species in areas o f limited hard substrate habitat.
Few studies have attempted to compare the ichthyofaunal assemblages collected at oil and gas
platforms in the northcentral Gulf across wide depth zones, and the information that is available primarily
concerns adult fishes and not their early life history stages. Sonnier et al. (1976) surveyed oil and gas
9
Reproduced with permission of the copyright owner. Further reproduction prohibited without permission.

platforms (18-55 m depth) as well as inshore (37-59 m) and offshore (110-155 m) reefs o ff Louisiana and
described the offshore reefs as being more speciose than inshore reefs or platforms. This greater
offshore reef species richness was primarily due to the presence o f southern Gulf-Caribbean taxa (e.g.,
butterflyfishes, parrotfishes, and cleaning gobies) and taxa common to reefs in the northwestern Gulf o ff
Texas. The authors suggested that the lower temperatures that occur at the inshore reefs and platforms
are a limiting factor in the number o f species, particularly tropicals, which inhabit inshore habitats.
Gallaway et al. (1980) and Gallaway (1981) reviewed previous descriptions o f invertebrate and vertebrate
faunal assemblages from the northcentral Gulfs continental shelf. They characterized differences largely
upon different bottom types (fluvial/terrigenous sediments west o f the Mississippi River Delta and
carbonaceous sediments to the east), circulation patterns, climate, and related hydrographic conditions.
Even fewer baseline, ecological ichthyoplankton studies within the oil field have been published
(Finucane et al. 1979a; Finucane et al., 1979b; Bedinger et al. 1980). and none have been published that
focus upon platform infrastructure. To my knowledge, only one study has investigated the
ichthyoplankton community found in proximity to petroleum platforms. Finucane et al. (1979b). using
bongo and neuston nets, sampled within 30-90 m o f two oil platforms and two satellite (well) jackets, all
within a 5 km radius o f each other and in 17 m o f water south southeast o f Galveston, Texas. Three. 2-
day cruises collected primarily engraulids, sciaenids, and bothids. Species richness was found to be
greatest at the platform sites in July and October and at the satellite structures in February. Overall, o f the
68 taxa identified to genus. 38 were associated exclusively with at least one o f the structure sites, while
another 29 were found near both structure sites and control sites. Dominant taxa at the structure sites
included unidentified engraulids. Anchoa spp., Cynoscion spp., Syacium spp., Micropogonias undulatus.
and unidentified clupeids. Based on eggs and larval abundance, the petroleum field was determined to be
an active spawning area for anguilliforms, callionymids, clupeids, sciaenids, scombrids and soleids, but
reef fish eggs and larvae were not abundant.
This study was part o f a larger, coordinated research effort with other scientists investigating the
overall importance o f oil and gas platforms as habitat for larval and juvenile fishes (Tolan 2001), as well
as adult fishes (Stanley and Wilson 2000). This study focused on three main objectives. The first was to
provide much needed information on the role that oil and gas platforms (hard substrate habitat) may play
10
Reproduced with permission of the copyright owner. Further reproduction prohibited without permission.

as recruitment grounds and/or refugia for postlarval and juvenile fish, which could contribute to fish
production. Secondly, I wished to provide more basic biological information on reef fish, e.g., larval,
postlarval, and juvenile taxonomy, seasonality, lunar periodicity, distribution (vertical and across shelf),
and relative abundance. Finally, as a long-term objective, I wished to evaluate the ecological significance
that this artificial habitat building, which has occurred on an unprecedented scale in the northcentral Gulf,
may have had on the early life stages o f fish.
MATERIALS AND METHODS
Study Sites
Data collection and analyses focused on three offshore oil and gas platforms in the northcentral
Gulf west o f the Mississippi River Delta and at a low-salinity, coastal rock jetty environment, which
provided a far-field, non-platform site, end-member that was also structurally complex and represented
another artificial, hard-substrate habitat (Figure 2.1). Platform site selection was based upon the work o f
Gallaway et al. (1980), Gallaway (1981), and Continental Shelf Associates (1982) who reported that
nekton communities around platforms could be categorized by water depth in the northern Gulf (Table
2.1). Three communities were characterized: a coastal assemblage (3-20 m), an offshore assemblage (20-
60 m), and a bluewater/tropica! assemblage (>60 m). The platforms selected and the jetty site encompass
all three zones. The outer shelf site, Mobil’s Green Canyon (GC) 18, lies in about 230 m o f water on the
shelf slope (27°56,37"N, 9I°0I'45"W ). The mid-shelf site, Mobil's Grand Isle (GI) 94B, lies in
approximately 60 m o f water (28o30’57"N. 90°07'23"W). The inner shelf site, Exxon's South Timbalier
(ST) 54G, lies in approximately 20 m o f water (28°50'01 "N. 90°25'00" W). A ll platforms had very
similar structural complexity. GC 18 is a very large six pile (column or leg) production platform, while
Gl 94 and ST 54 are eight pile production platforms. Although the platforms varied in age (installation
for GC 18 in 1988, GI 94 in 1975 and ST 54 in 1956), all were at least seven years old at the beginning o f
the study, which was ample time for the development o f mature biofouling communities. The stone
rubble jetties (2-3 m depth) at the terminus o f Belle Pass (BP), a major shipping channel near Fourchon,
Louisiana (29°03'90" N, 90°13'80" W), were also sampled simultaneously with the sampling o f ST 54.
The two jetties are approximately 9 1 m apart and run in a general north-south direction. The east jetty is
approximately 335 m long and the west jetty is approximately 305 m long.
II
Reproduced with permission of the copyright owner. Further reproduction prohibited without permission.

+100 0 100 200 Kdom cfcn
■26*
96* 9< * 92* 90*
Figure 2.1. Location o f the approximately 4,000 oil and gas platforms in the federal waters o f the northcentral Gulf. Also indicated are the three platforms and the coastal jetty site sampled during the course o f this study. Map modified from Tolan 2001.
12
Reproduced with permission of the copyright owner. Further reproduction prohibited without permission.
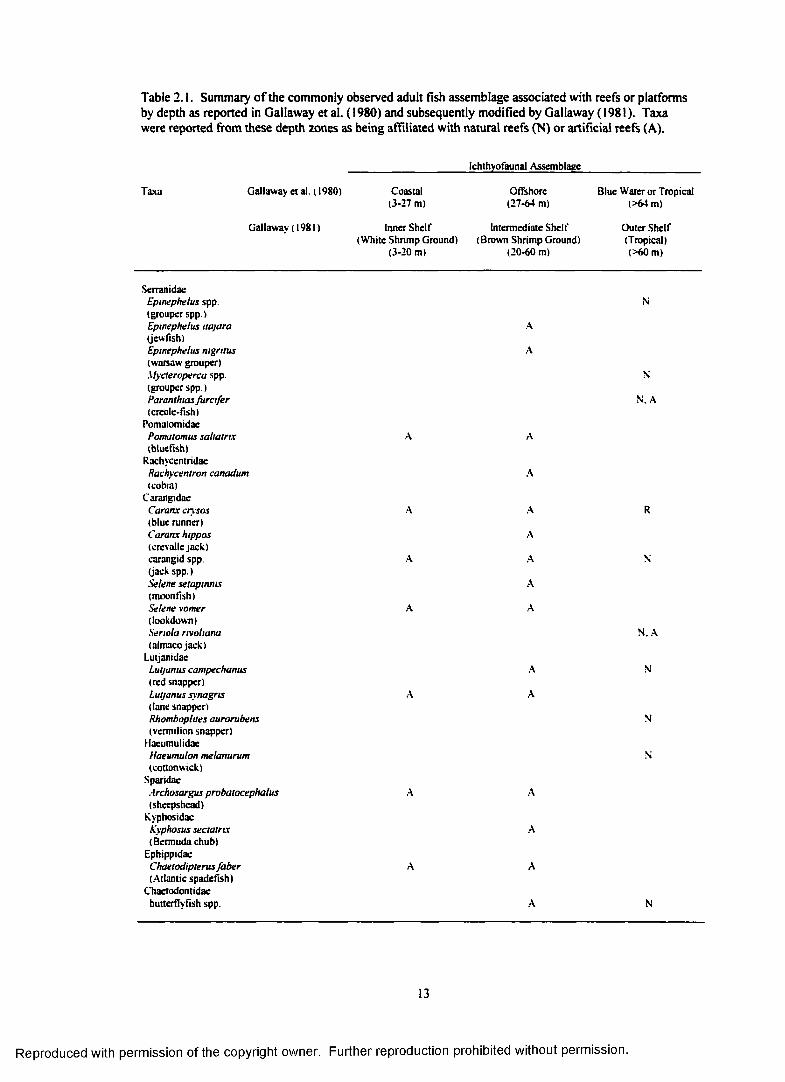
Table 2.1. Summary o f the commonly observed adult fish assemblage associated with reefs or platforms by depth as reported in Gallaway et al. (1980) and subsequently modified by Gallaway (1981). Taxa were reported from these depth zones as being affiliated with natural reefs (N) or artificial reefs (A).
_______________________ Ichthyofaunal Assemblage______________________
Taxa Gallaway etal. (1980) Coastal Offshore Blue Water or Tropical(3-27 m) (27-64 m) (>64 m)
Gallaway (1981) Inner Shelf Intermediate Shelf Outer Shelf(White Shrimp Ground) (Brown Shrimp Ground) (Tropical)
(3-20 m) (20-60 m) (>60 m)
SerranidaeEpwephelus spp. N(grouper spp.)Epwephelus najara A(jew fish)Epwephelus nigritus A(Warsaw grouper)Mycteroperca spp. N(grouper spp.)Paranthias furc ife r N. A(creole-fish)
PomaiomidaePomatomus saltatrix A A(bluefish)
RachycentridaeRachycentron canadum A(cobia)
CarangidaeCaranx crysos A A R(blue runner)Caranx hippos A(crcvallejack)carangid spp. A A N(jack spp.)Selene setapmms A(moonfish)Selene vomer A A(lookdown)Senola rrvohana N. A(aimacojack)
LutjanidacLutjanus campechanus A N(red snapper)Lutjanus synagris A A(lane snapper)Rhomboplttes aurorubens N(vermilion snapper)
HaeumulidaeHaeumulon melanurum N(cottonwick)
SparidaeArchosargus probatocephalus A A(sheepshead)
KyphosidacA'yphosus sectatrtx A(Bermuda chub)
EphippidaeChaetodipterus faber A A(Atlantic spadefish)
Chaetodontidaebutterflyfish spp. A N
13
Reproduced with permission of the copyright owner. Further reproduction prohibited without permission.

Table 2.1. (continued)
Ichlhyofaunal Assemblage
Taxa Gallaway et al. (1980) Coastal Offshore Blue Water or Tropical(3-27 m) (27-64 m) (>64 m)
Gallaway (1981) Inner Shelf Intermediate Shelf Outer Shelf( White Shrimp Ground) (Brown Shrimp Ground) (Tropical)
(3-20 m) (20-60 m) (>60 m)
PomacanthidaeHolacanihus tricolor A(rock beauty)pomacanthid spp. A N. A(angelfish spp.)
Pomaccntridaedamselfish spp. A N. A
CirrhitidaeAmblyctrrhttus pittas A(redspotted hawkfish)
SphyraenidaeSphyraena barracuda A A(great barracuda)
LabridaeBodtanus rufiis A(Spanish hogtish)
Decodon pueUans A(red hogtish)Clepltcus parrai N. A(creole wrasse)Scaridae
parrot fish spp NBlcnniidae
blenny spp. AAcanthuridae
surgeon fish/tang spp. A ABalistidaeBatistes capriscus A A(gray triggerfish)
Sampling Procedure
Sampling protocols for the outer shelf, mid-shelf and inner shelf platforms were similar. At the
outer shelf site (GC 18). eleven monthly sampling trips were taken over a 2-3 night period coinciding
with new moon phases from July 1995-June 1996. with the exception o f the month o f December (adverse
weather). New moon phases were targeted at this platform because they have been associated with the
peak recruitment periods o f many reef-dependent fishes (Johannes 1978: Robertson et al. 1988). All
sampling began one hour after sunset and was completed one hour before sunrise. The major sampling
station for each platform was located in the internal central region along a stainless steel, small diameter
guidewire (vertical monorail) tethered to the first set o f the platform’s underwater, cross-member, support
structures. At this central station, replicate trap collections (n=2) were taken three times each night at
14
Reproduced with permission of the copyright owner. Further reproduction prohibited without permission.

near-surface and at a depth between 15 and 23 m, depending upon the depths o f the other platforms' first
set o f underwater cross-member supports. Subsurface samples were collected by lowering a trap without
floatation. Light-traps were deployed for 10 minute periods. Passive, horizontal plankton net collections
were taken three times at both depths during each night at the central station using a metered (General
Oceanics flowmeter model 2030 with slow velocity rotor), 60-cm diameter, 333pm mesh net dyed dark
green. The nets had a vane (to help orient into the current) which was fixed to a gimbled attachment on
the net ring, allowing the net to be set and retrieved closed for the at depth deployment. In addition. 3
collections each night were made with a floating Iight-trap which was tethered and free drifted away (off-
platform) from the platform (approximately 20 m) on the down current side o f the platform. For light-
traps sampled at depth or off-platform, the trap was deployed with the light off, fished with the light on,
and then retrieved with the light off.
Temperature (°C), salinity (ppt), and turbidity (NTU) were determined during each set using a
Data Sonde 3 Hydrolab. During each set. a vertical plankton net (20-cm diameter. 63-pm mesh) which
was held rigidly to the guidewire by a net frame, was lowered codend first to the bottom o f the monorail,
left at depth for 5 minutes for water column restabilization, and then hauled to the surface at
approximately 1 m/s to ascertain microzooplankton biomass as a measure o f food availability. The
samples were returned to the lab where they were dried in an oven for 24 h at 60°C and then weighed to
determine the dry weight biomass (g/nT). Also, surface water samples were collected during each set in
order to determine total suspended sediments, an estimate o f turbidity. These water samples were later
filtered in the lab through a pre-weighed. microfiber filter (1.2 pm), dried in an oven for 24 h at 60°C, and
weighed to determine the suspended sediment load (g/L).
A total o f 11 sampling trips were taken at the mid-shelf site (GI 94). Samples were collected
twice monthly during new and full moons for 3 consecutive nights from April-August 1996 (the peak
recruitment period for most reef-associated species in the northern Gulf). Sampling at GC 18 and GI 94.
therefore, overlapped monthly from April-June 1996. In addition, during May extra samples during the
first quarter and third quarter moon phases were collected, but due to inclement weather, full moon
collections were cancelled. At the inner shelf site (ST 54) sampling occurred twice monthly from April-
September 1997 (8 trips total), during new and full moon periods over two consecutive nights. Sampling
15
Reproduced with permission of the copyright owner. Further reproduction prohibited without permission.

effort was modified at GI 94 and ST 54 to obtain one (rather than two) subsurface, surface, and off-
platform light-trap collection per set.
Samples were collected twice monthly (new and full moon phases) over 2-night periods at Beile
Pass from April-September 1997 (11 trips total) simultaneously with the sampling o f ST 54. For
sampling purposes, the sides o f the two, channel jetties were labeled as East Exterior (EE), East Interior
(El), West Interior (WI), and West Exterior (WE). A total o f four sampling stations, one on each side o f
each jetty, were located approximately at the jetty mid-points and were identified during sampling by
distinct rock outcroppings that were sprayed with fluorescent paint. Two sets o f samples were taken each
night. A set included a light-trap and a bow-mounted, pushnet sample at each o f the four stations. The
order of stations sampled within each set was chosen using a random number table. Light-traps were
equipped with a submersible battery that was secured to the top o f the light-trap with bungee cords. At
each station, a buoyed mooring was used to suspend the light-trap approximately I m below the surface
as close to the jetty as possible, which was usually within 2 m o f the surface-exposed rocks. Light-traps
were allowed to fish for 10 minutes. A bow-mounted pushnet (1 m x 1 m. 1000 pm mesh net dyed
green) was pushed by an 18 foot boat at approximately I m/sec just below the surface along the edge o f
the jetty for 3-5 minutes, depending upon the density o f plankton. A General Oceanics flowmeter (large
rotor) was used to determine the volume o f water filtered. Salinity (ppt), temperature (°C), dissolved
oxygen (% saturation and mg/l), and turbidity (NTU) were measured at each station during each set using
a DataSonde 3 Hydrolab and Multiprobe Logger.
Samples collected at outer and mid-shelf platforms were preserved in ethanol with a subsequent
change to ffesh ethanol within 12-18 hours. Samples collected at the inner shelf platform and the jetties
were fixed in 4% buffered formaldehyde and changed over to ethanol within 8-12 hours. Fish were
removed from all samples, enumerated, and measured under a dissecting microscope with the aid o f an
ocular micrometer, and identified to the lowest taxonomic level possible using primarily the taxonomy o f
Robins et al. ( 1991). Large samples were split using a Folsom plankton splitter (Van Guelpen et al.
1982). In the event that the number o f fish in a sample or a split was greater than 50 for any single
species, the largest, smallest and a random subsample o f 50 individuals were measured. Preflexion larvae
were measured to the end o f the notochord (NL) and all postflexion larvae, juveniles, and adults were
16
Reproduced with permission of the copyright owner. Further reproduction prohibited without permission.

measured to the posterior end o f the vertebral column (SL). Light-trap samples were standardized to a
catch-per-unit-effort (CPUE) o f fish per 10 min. Plankton net and pushnet samples were standardized to
the number o f fish per 100 m3 (density). This core sampling sequence formed the basis o f the sampling
protocols at all other platforms. Sea states, adverse weather, transportation delays, and platform safety
concerns often forced us to suspend some sample collections. Only seven subsurface plankton net
collections were taken at the inner shelf platform (April 7-8) because o f problems with the monorail
rigging and biofouling. Similar gear problems reduced the number o f subsurface net samples collected at
the outer shelf platform. The number o f samples collected by trip, gear type, and depth/location for all
platforms and the jetties is summarized in Table 2.2.
Analyses o f Data
Due to the very large numbers o f clupeiform (Clupeidae and Engraulidae) fishes collected,
particularly in light-trap samples, some analyses were run with and without these taxa. These fish are
seldom the taxa o f interest in studies o f hard substrate habitats and their abundances tend to overwhelm
the trends o f other taxa (Choat et al. 1993). A ll ANOVA. Tukey’s Studentized Range Tests, Student’s t-
tests, and canonical correlations were run with SAS version 6.12 (SAS 1989).
Studentized t-tests (a=0.05) were used to compare overall plankton net densities between
locations (subsurface and surface) within the three platform sites. Light-trap CPUEs were compared
between locations (subsurface, surface, and off-platform) within each o f the platform sites using an
ANOVA model with location as a main effect. Tukey's Studentized Range tests were used to determine
which mean light-trap CPUEs were significantly different. Before testing, plankton net densities were
log transformed (log,0(x-H)) in an effort to conform to model assumptions o f normality and homogeneity
o f variances. Analyses on light-trap CPUEs were run on ranked-transformed data. Plankton net and
light-trap analyses were run with and without clupeiform fishes. The same analyses were also run on
some o f dominant taxa (top three taxa identified at least to the level o f genus for each gear location/ depth)
collected at each o f the sites.
Schoener’s index o f niche overlap was calculated for all sites by combining fish collected by all
gears within each site as an indication o f the fish assemblage similarity among sites (Schoener 1970).
Only fish identified to at least the genus level were used in the analyses. Since this type o f analysis can
17
Reproduced with permission of the copyright owner. Further reproduction prohibited without permission.

Table 2.2. Number o f samples collected at each site by date, gear type, and depth/location.(Lunar phases: N, new moon; F, full moon; I, first quarter, 3, last quarter)
SubsurfaceNet
SurfaceNet
SubsurfaceLight-trap
SurfaceLight-trap
Off-platformLight-trap
Pushnet
Outer Shelf (GCI8) 1995-1996
Jul 26-29 (N) 0 9 18 18 5Aug 25-28 (N) 0 12 18 18 9Sep 24-25 (N) 0 12 12 12 6Oct 23-25 (N) 9 9 18 18 9Nov 21-23 (N) 9 9 18 17 9Jan 19 (N) 3 3 6 6 3Feb 17-18 (N) 5 5 10 6 4Apr 15-18 (N) 0 0 0 0 15May 17-20 (N) 2 9 5 5 18Jun 18-21 (N) 13 16 14 13 9Totals 41 84 119 113 87
Mid-Shelf (GI 94) 1996
Apr 16-18 (N) 6 6 4 8 8Apr 26-29 (1) 18 18 18 18 18May 10-12(3) 10 12 12 12 12May 17-20 (N) 18 18 18 18 18Mav 24-26(1) 12 13 12 13 11Jun 14-17 (N) 18 18 18 18 18Jun 28-Jul 1 (F) 17 17 13 12 13Jul 12-15 (N) 17 17 15 13 16Jul 29-Aug 1 (F) I I 13 I I 12 12Aug 12-15 (N) 16 17 15 17 17Aug 26-29 (F) 18 19 18 18 18Totals 161 168 154 159 161
Inner Shelf (ST 54) 1997
Apr 7-8 (N) 7 7 5 6 8May 5-8 (N) 0 15 0 16 12May 20-23 (F) 0 18 12 18 10Jun 4-5 (N) 0 6 6 6 5Jun 20-21 (F) 0 8 6 9 9Jul 3-5 (N) 0 5 7 7 3Aug 17-20 (F) 0 13 4 12 14Sep 3-5 (N) 0 10 9 10 0Totals 7 82 49 84 61
Jetties (Belle Pass) 1997
Apr 4-7 (N)Apr 21-23 (F) May 5-7 (N)May 20-22 (F) Jun 3-5 (N)Jun 20-21 (F)Jul 3-5 (N)Jul 19-21 (F)Aug 1-3 (N)Aug 18-20 (F)Aug3I-Scp2(N)Totals
98161616816121516 16
148
9816161681515 1416 16
(49
18
Reproduced with permission of the copyright owner. Further reproduction prohibited without permission.

be heavily influenced by large abundances o f a single species, these analyses were conducted without the
most dominant taxa included at each site. At times, sampling effort differed temporally among sites
(Table 2.2), so the samples used for comparisons were limited to only those months where samples were
collected for both sites in a pairing. For example, only April-August samples were used to compare the
outer shelf platform assemblage (GC 18) to the mid-shelf (GI 94), inner shelf (ST 54), and jetty (Belle
Pass) assemblages. Full data sets were used in comparisons between the mid-shelf and inner shelf
platforms and the jetty site. Shannon-Weiner diversity indices (Magurran 1988) were calculated for each
sample collected at all sampling sites. Only fish identified to at least the genus level were used in the
analyses. Differences in diversity among sites were analyzed with ANOVA models using site as a main
effect. Post-ANOVA tests (Tukey's Studentized Range, a=0.05) were used to determine which sites
where significantly different in mean taxonomic diversity. Since the intent o f the similarity and diversity
indices was to characterize the taxonomic assemblages sampled by each gear type, clupeiform fishes were
included in these analyses. Taxonomic richness (either at the family or genus/species level) is used in
reference to the number o f taxa collected.
Canonical correlations were used to determine relationships at each site between plankton net or
pushnet densities or light-trap CPUEs for dominant taxa and environmental variables. For the outer shelf
(GC 18) and mid-shelf (GI 94) platforms, log-transformed densities o f the top 15 taxa (excluding
clupeiforms) collected in subsurface and surface plankton nets combined were analyzed along with
temperature, salinity, microzooplankton biomass, and total suspended sediments (turbidity). The same
analyses were performed for log-transformed CPUEs o f the top 15 taxa collected in subsurface and
surface light-traps. Occasionally more than 15 taxa were analyzed for light-trap data due to ties in the
ranking o f CPUEs. For the inner shelf platform (ST 54), the same analyses were performed, but only
surface plankton net data were used because there were very few subsurface plankton net samples
collected at this site (Table 1.2). The same analyses were performed for the jetty site (Belle Pass), but
included Hydrolab measurements o f turbidity and dissolved oxygen, and did not include total suspended
sediments and zooplankton biomass estimates since these data were not collected at this site. The
importance o f an environmental variable was based on the magnitude o f its correlation with the
environmental variate, with the sign o f the correlation indicating i f the variable was directly (positively)
19
Reproduced with permission of the copyright owner. Further reproduction prohibited without permission.

or inversely (negative) related with the variate. A species was considered to be related to the variate i f
the absolute value o f the inter-set correlation was greater than 0.387 (i.e., the variate predicted 15% or
more o f the species variation within the model).
RESULTS
Environmental Characterization of Sampling Sites
Mean temperatures varied seasonally at all platforms and at the jetty site and were similar
between sites for the late spring and summer months (Figure 22). At the outer shelf platform (GC 18),
the only platform sampled during all seasons, mean temperatures peaked at 31.8 'C in July 1995 and
steadily decreased to a mean o f 19.2 ’C in January 1996. Mean temperatures rose throughout the spring
to 29.1 'C by the end o f the sampling effort in June 1996. Mean temperatures for the late spring and
summer months (April-September), the same months sampled at the other sites, ranged from 21.5-31.8
'C. At the mid-shelf platform (GI 94), temperatures ranged from a mean low o f 20.8 ’C in April to a
mean high o f 30.7 'C in July. At the inner shelf platform (ST 54), mean temperatures ranged from 22.3
’C in May to 31.6 'C in August. Similarly at the Belle Pass jetties temperatures ranged from a mean low
of 20.2 'C in April to a mean high o f 32.8 *C in August.
Mean surface salinities at GC 18 (outer shelf) were relatively stable ranging from 34.8-36.6 ppt
for most o f the sampling trips (Figure 2.3). However, surface salinity means during June and August
1995 were relatively low (24.3-28.4 ppt) for shelf break waters. These low salinity values were
associated with a visibly "green" water mass that pulsed through the area. This water mass was further
characterized by high abundances o f cnidarians. ctenophores, and patches o f Sargassum. Similarly, mean
salinity values for GI 94 (mid-shelf) ranged from 35.2-36.0 ppt for much o f the sampling season, but also
experienced pulses o f relatively low salinity water. Lower mean surface salinities were recorded for ST
54 (inner shelf) and Belle Pass (jetties) and ranged from 22.7-28.5 ppt and 18.0-26.2 ppt, respectively.
Mean microzooplankton biomass estimates were generally low. with little variation within each
platform site (Figure 2.4). At GC 18 (outer shelf), estimates ranged between 0.03-0.29 g/m3, with a peak
in July 1995. Even less variation was observed at GI 94 (mid-shelf), where microzooplankton biomass
estimates ranged from 0.03-0.10 g/m3. The greatest variation in microzooplankton biomass was observed
at ST 54 (inner shelf) where estimates ranged from 0.11 -0.17 g/m3, with the exception o f two peaks o f
20
Reproduced with permission of the copyright owner. Further reproduction prohibited without permission.

Reproduced
with perm
ission of the
copyright ow
ner. Further
reproduction prohibited
without
permission.
Outer Shelf (GC 18) Mid-shelf (GI 94)
35
O30
ffjs 25
2LE 20 £
15
& ,rvN
15
Vs"
Inner Shelf (ST 54) Jetties (Belle Pass)
l-'igure 2.2, Mean surface temperatures (and standard errors) for each sampling site.

Reproduced
with perm
ission of the
copyright ow
ner. Further
reproduction prohibited
without
permission.
40
aa2?cmW
35
30
25
20
15
n v rfO &^ ^ ^
Ouler Shelf (GC 18)
40
^ 35Q.& 30 2r-I 25 m (/>
20
15
*f <V **> •$> «VNt A'y &
& J 3 aN <0 \*v J 3
Inner Shelf (ST 54)
Figure 2.3. Mean surface salinities (and standard errors) for each sampling site.
Mid-shelf (GI 94)
40
35Q.
30
C 2516(9 20
15
< > - *
3̂ OV ^ OV *3 A cp
Jetties (Belle Pass)

Reproduced
with perm
ission of the
copyright ow
ner. Further
reproduction prohibited
without
permission.
■AvtnEoin
0.5
2 Ea.oo
04
0.3
0.2
0.1
0
& J * J ?
Outer Shelf (GC 18)
Li
Mid-shelf (GI 94)
<0Eom
l i|
5
0.5
0.4
0.3
02
0.1
<3
Inner Shelf (ST 54)
Figure 2.4. Mean microzooplankton biomass (and standard errors) for each platform site.

0.38 g/mJ in April and August. Microzooplankton biomass samples were not collected for the Belle Pass
jetty site.
Mean suspended sediment values (turbidity estimates) did not vary greatly either within sites or
between sites (Figure 2.5). At GC 18 (outer shelf), mean suspended sediments concentrations ranged
from approximately 0.01-0.02 g/L, with the exception o f a peak o f approximately 0.05 g/L in February.
At GI 94 (mid-shelf) and ST 54 (inner shelf), mean suspended sediment concentrations fluctuated slightly
throughout the sampling season but only ranged from approximately 0.01-0.03 g/L. At the Belle Pass
jetties, mean turbidity measurements (NTU) ranged from 10.4-19.0 NTU. with the exception o f a large
turbidity peak in April (40.0 NTU) and two smaller peaks in June (26.2 NTU) and July (30.8 NTU).
Larval and Juvenile Fish Collected at the Outer Shelf Platform (GC 18)
A total o f 5,057 fish were collected at the outer shelf platform (GC 18) over the course o f the
year (Table 2.3). Light-traps and plankton nets collected 1,114 and 3.943 fish, respectively. Plankton
nets collected fish from 45 different families, 15 o f which were not collected with light-traps. Light-traps
collected fish from 37 different families, 7 o f which were only collected with light-traps. Plankton nets
collected fish from 64 taxa (identified at least to genus), 25 o f which were not collected with light-traps.
while light-traps collected fish from 59 taxa with 18 being unique to light-trap collections.
The ichthyoplankton community at GC 18 (located in 230 m water depth on the shelf slope) was
dominated by coastal pelagic species, particularly engraulids and clupeids which accounted for 33% and
25% o f the total catch by both gear types, respectively. Opisthonema oglinum was the dominant species
in the mid-to-late summer months, while unidentified engraulids peaked in November. Engraulis
eurystole was also relatively common throughout the summer and early fall. Gobies and Mugil cephalus
were among the most common non-clupeiform fishes in the plankton net collections. Mugil cephalus
was relatively common in the fall-winter months and peaked in November. The carangids Caranx crysos
and C. hippos/latus were relatively common, and though they are usually considered pelagic species, they
congregate around platform structures (Table I . I ).
Some o f the more abundant demersal taxa included the flatfish Citharichthys spilopterus,
Symphurus spp.. and Syacium spp.. as well as the sciaenid Sciaenops ocellatus and bregmacerotid
Bregmaceros cantori. While not unique to this site, the mesopelagic species. Cyclothone braueri, was
24
Reproduced with permission of the copyright owner. Further reproduction prohibited without permission.

Reproduced
with perm
ission of the
copyright ow
ner. Further
reproduction prohibited
without
permission.
0.05 0045
0.04 0.035
J U 0 03■g 0.025
c0)E
&in3OT
0.020.015
0.010005
0
J * <tf> >$> <&
CP.N*
V9'
ate
0050.0450.04
0.035| ~ 0 03E t 0 025 ? 0 02&m310
0015001
0.0050
Outer Shelf (GC 18)
IOly>
0.045
0.035_ 0.03
S 1 0 025
0.005
Mid-shelf (GI 94)
7060
e. 40 5 30I 20
Inner Shelf (ST 54) Jetties (Belle Pass)
Figure 2.5. Mean suspended sediments (and standard errors) for each platform site and mean surface turbidity (and standard errors) for the Belle Pass jetty site.

Reproduced
with perm
ission of the
copyright ow
ner. Further
reproduction prohibited
without
permission.
Table 2.3. Total plankton net density (fish/100 nv’ ) and light-trap CPUF. (fish/10 min) for tfsh collected at Green Canyon 18 with standard error (SE), rank, percent o f total catch (%), and months collected for each taxa. (N) indicates taxa collected only with plankton nets. (L) indicates taxa collected only with light-traps. For ranks, lied values received the mean o f the corresponding ranks. % indicates a value <1.00%._______________________
Taxa Months Collected SurfaceNet
BottomNet
Dollomlight-trap
Surfacel.ight-trap
Off-platforml.ight-trap
Density (SI:) Rank (%)
Density (SI:) Rank (%)
c ih j i: (Sli) Rank (%)
CT’Ul: (SI:) Rank (%)
CT’Ul-: (SI-) Rank (%)
OstcichthycsUnidentified I'cb, Apr. Jun, Jul. Aug. Sep, 0.85 <0 39) -4.93 (2.73) 0 08 (0 04) 0.02(0 01) 0.26 (0.16)
filopilhrmcslilopidac
Oct. Nov 23 J 6(1.54) 7(3.27) 4 i .5 : 4 (8.36)
Elops sourus (N) (ladylish)
Anguilliformes
Oct 0 (0 ) 0 35(0 35) 3 5 :
0 (0) 0 (0 ) 0 (0)
Unidentified Jul, Oct. Nov 1.57 (0 72) 4 32(2 46) <0 01 (0 01) 0 02(0.01) 0 01 (0.01)(eel)Moringmdae
i 3 j o : 28.5 : 41 s : 40 .5 :
Neoconger mueronmus (ridged eel)
Muracnidoc
Oct 021 (021) 5 2 :
0(0) 0 (0 ) <0 01 (0.01) 5 5 :
0(0)
Unidentified (moray cel)
Ophichlhiduc
Jun. Jul, Aug. Sep. Oct 002 (002) 8 5 :
0 (0) <0 01 (0 01) 28.5 :
0.03 (0.02) 3 3 :
0 02 (0 02) 25 :
Unidentified (snake cel)
Jul, Oct, Nov 1 09(0 71) 19:
2 87(1 27)u :
0 (0 ) 0 05 (0.02) 22(1 06)
0(0)
Myrophis punctalus (1.) (speckled worm cel)
leb 0(0) 0 (0 ) 0 (0 ) <0 01 (0 01) 55 :
0 (0 )
Ophwhthus gomesi (1.) (shrimp cel)
C'ongridae
Jul 0(0 ) 0(0 ) <0 01 (0 01) 28 5 :
0 03(0 03)33 :
0(0 )
Unidentified (1.) (conger eel)
t'lupcirnrmcs
Jul 0 (0 ) 0(0) 0(0 ) 0 03 (0 02)33 :
0(0)
Unidentified(herring/anchovy)Clupeidac
Jul, Sep 1.08(0 92) 20(1 08)
0(0 ) 0 (0) 0 (0) 0 01 (0.01) 40.5 :
Hrevoorlia /xilromis (gulf menhaden)
Jan, leh, Nov 1 12(0 55) 18:
2 44(1 21)12:
0(0 ) 0 03 (0 02)33 :
0 02 (0 02) 25 :
Etrumeus teres (N) (round herring)
Jan, l eh 1 16(1 05) 16:
0 19(0.19) 42 5 :
0 (0 ) 0 (0) 0 (0)

Reproduced
with perm
ission of the
copyright ow
ner. Further
reproduction prohibited
without
permission.
Table 2.3. (continued)
Til'll! Months Collected SurfaceNet
IJoltnmNet
IJotiontl.ight-trap
Surfacel.ight-trap
OfT-plattbnnl.ight-trap
Density (SIT Rank (%)
Density (SI:) Rank (%)
CT’Ul: (Sli) Rank (%)
CPUK (SIT Rank (%)
CT’Ul: (SI:) Rank (%)
Ilarengula jaguana Jul, Aug 0.06 (0.04) 0(0 ) <0.01 (0 01) 0.15(0.06) 0 (0 )(scaled sardine) 71 J 28.5 t I I 5(3.01)OpiMhanema oglmum Jul, Aug, Sep 3941 (1626) 0(0 ) O i l (0 06) 0 42 (O i l ) 0.28 (0.11)(Atlantic thread herring) 1 (38 40) 4(4.73) 3 (8 51) 2.5(8 73)
lingraulidaeUnidentified l eh, Jun, Jul, Aug, Sep Oct, 39 21 (12 21) 57.18(26 10) 0 46 (0.11) 0 51 (0 15) 0 28 (0.13)(anchovy) Nov 2 (24.32) 1 (53 90) 2 <20 00) 1 (10 28) 2 5 (8 73)Anchoa spp. (1.) Jul 0 (0 ) 0 (0 ) 0 07 (0 07) 0(0 ) 0 (0 )(anchovy spp ) 8 (2 91)Anchoa m ilch illi Jul 0 03 (0 03) 0 (0 ) 0 (0 ) 0 15(0.12) 0(0)(boy anchovy) 79 J I I 5(3.01)Anchoa nasutafhcpselus (1.) Jul, Aug, Sep, Nov 0(0 ) 0 (0) 0 80(0 31) 0 22(0.12) 0 16(0 10)(longnosc/slripcd anchovy) 1 (34.91) 8(4.43) 8 (5.09)Kngrauhs eurystole Jun, Jul, Aug, Sep, Oct 0 34 (0 30) 8 63(8 63) 0.15(0.04) 0 2 5 (0 I I ) 0.02 (0.02)(silver anchovy) 42 f 5 (9 45) 3 (6 55) 5(5.14) 25 J
Sloniiifonties(ionostoinatidac
( 'yclolhone brauen Jan, May, Jun, Jul, ( )cl, Nov 1 01 (0 65) 3 05(1.55) 0(0 ) 0 23 (0 21) 0(0 )21 ♦ I0 J 7(4.61)
Diplophox taenia (N) Nov 0 29(0 29) 0 41 (0 41) 0 (0 ) 0(0 ) 0(0)44 5 t 31 t
Aulopi formesChlorophthalmidae
Chlorophthalmus agassm (N) Jun, Nov 0(0) 0 70(0 61) 0 (0 ) 0(0) 0 (0)(short nose grccncye) 24 t
ScopclarchidacScopelarchoules spp. (N) Jan 0 03 (0 03) 0(0 ) 0 (0 ) 0 (0) 0 (0)(pearleyc spp ) 8 0 *
SynodontidacUnidentified Jan, May. Jul, Oct 0 27(0 16) 0 61 (0 61) <0 01 (0 01) <0 01 (0 01) 0(0)(li/ardfish) 46 J 26 i 28.5 f 55 ♦SauriUa brasiliensis <0 01 (<0.01) 0 (0) 0 03 (0 02) 0 20 (0 14) 0(0)(largescalc li/ardfish) 92 J 12 5(1 09) 9 (4 08)Synodas synthins Jun 0 29(0 29) 0(0 ) 0 (0 ) 0 03 (0 02) 0(0)(red li/urdllsh) 44 5 t 33 f

Reproduced
with perm
ission of the
copyright ow
ner. Further
reproduction prohibited
without
permission.
Table 2.3. (continued)
laxu Months Collected SurfaceNel
BottomNet
Holtoml.ight-trap
Surfacel.igtit-trap
OlV-plalforml.ighl-lrap
IXnsily (Sli) Kank (%)
IX’nsily (Sli) Kunk (%)
ciHJi; (Sli) Rank (%)
Cl’Uli (Sli) Kunk (%)
m i l - (Sli)Kank (%)
Trachtnoeephalus my ops (snukcfisli)
I’aralepidac
Sep, Oel 0 10(0 10) 63 J
0(0) 0(0 ) 0.04 (0.02) 25 }
0.03 (0.02) 19(1 09)
IJnidcntitlcii (N) (barracudina)
Nov 0.26 (0 26) 47 }
0 41 (0 41)31 }
0(0 ) 0 (0 ) 0(0 )
Paralepts allanlica (1.) (duckbill barracudina)
Jul 0 (0) 0(0 ) 0 02(0 01) I8 J
0(0) 0 (0 )
U’strolepts intermedia (1.)
MyctophiformcsMyctophidac
Jul 0 (0) 0 (0 ) 0 02 (0 02) 18}
0 (0 ) 0(0 )
Unideniilicd Jan, I cb, Apr, May, Jun, Jul, 0 83(0 4$) 0 31 (0 22) 0 03 (0 02) 0 04 (0.02) 0 17(0 06)(luntcrnfish)
(iadifomicsSep, Nov 24 t 36 J 12 5(1 09) 27.5 } 7 (5 45)
Unideniilicd (N)
lircgniaccrntiduc
Sep, Oct 0.19(0 1$) 55 J
0 (0 ) 0(0 ) 0 (0) 0 (0)
ttregmaceros canton Jun, May, Aug, Sep, Ocl 1 80 (088) 242(1 21) 0 03 (0 02) <0 01 (0 01) 0 05 (0.02)(codiet)
MerluccidacI I (1 08) 13 } I I (1 45) 5 5 } 15 5(1 45)
Unideniilicd (1.) (whiling)
Ophidiidac
Nov 0 (0) 0 (0) 0 (0 ) <0 01 (0 01) 55 }
0 (0 )
Unidenlilied (N) (cuskeel)
May <0 01 (<0.01) 89 5 }
0 (0 ) 0 (0) 0 (0 ) 0(0 )
l.epophidnim spp. (cusk-ccl spp.)
IJythiiidac
Aug, Sep, Ocl 0 43 (0 27) 37 J
1 30(0 94)17}
0 02 (0 01) 18}
0 (0) 0 01 (0 01) 40.5}
Unideniilicd Ocl, Nov 0 33(0 23) 041 (041) <0 01 (0 01) <0 01 (0 01) 0.01 (0.01)(brolula)
lophii formes43 J 31 J 28.5 } 5 5 } 40 5 }
Unideniilicd
Ciobicsocifomics(iobicsocidac
May, Aug <0 01 (<0 0 l) 92 J
0(0) 0(0 ) <0 01 (0 01) 5 5 }
0(0)

Tabl
e 2.
3.
(con
tinue
d)§3 j.
s' » r- a£
= § r- al
= 3
= 3M *
3C ^ © 2 o '°-o 'd ‘
o ++ ^© *n o
s ? °
3bv
3 «T ^3
3 3 3 33 3 3 0
3 " 3 3 3
3
™ 5- *5 r
h i l ls?* •* 5 3b = < c
o = - = = * :
3
3
3ZZ ■¥■¥3 * *X. >C —- ■3C * '“• in i
3 44 ~ X•r
S c | .2 —1 1 ss = '~
— 5 = M. e S r r S s v s L f c ^»& ^ ^ 3 SO_Zt .2 ^ i“
J? SO :‘ 5 :■=? © r*̂ s • i ! '
S | 1 4 ! S f Ii •? I .3i a **»r-5 i
U.
y . '
M& ic 2 y . "
_ c. Z . C- S’ e .
£.—3 * • b»? S 3 e■ H I 1 1
= s i ? g
3 44■—■ ir, n <*s 3
>— ♦♦3 *r,
©.uy;<3
3
3
— ♦+— W“.3 —
3 44
<N 55
U £. - ac 8 • - ^
1 4 43 - i M s
29
Reproduced with permission of the copyright owner. Further reproduction prohibited without permission.
5461
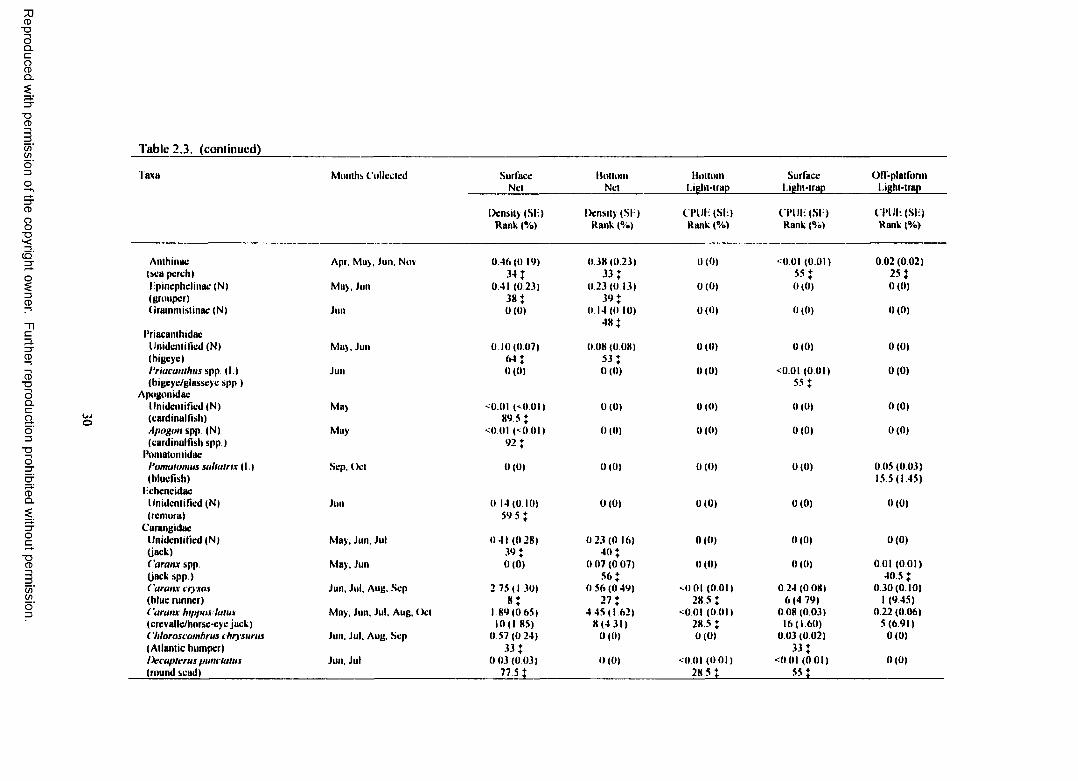
Reproduced
with perm
ission of the
copyright ow
ner. Further
reproduction prohibited
without
permission.
Table 2.3. (continued)
Taxa Months Collected SurfaceNet
HnttnmNet
DolininLight-trap
Surfacel.ight-trap
Off-platforml.ight-trap
IXnsily (Sli) Hank (%)
IX’nsily (Sli) Rank (%)
CIHJIi (Sli) Kank (%)
CTUli (Sli) Rank (%)
Cl’U li(S li) Rank (%)
Amhinac Apr, May, Jun, Nov 0 46 (0 19) 0 38(0 23) 0 (0) <0 01 (0 01) 0 02 (0.02)(sea perch) 34 \ 33 J 55 J 251lipincphclinac (N) May, Jun 0 41 (0 23) 0.23(0 13) 0 (0 ) 0(0) 0(0)(grouper) 38 J 3 9 *(irantmistinac (N) Jun 0(0 ) 0 14(0 10) 0 (0 ) 0 (0) 0(0 )
48 JI’riacamhidac
Unidentified (N) Muy, Jun 0 10(007) 0 08 (0 08) 0 (0 ) 0 (0) 0(0)(higcyc) 641 5 3 *1‘riacanlhus spp. (1.) Jun 0(0) 0 (0 ) 0 (0 ) <0 01 (0 01) 0(0 )(bigcyc/glasscyc spp.) 55 1
ApogonidaeUnidcnlificd (N) May -0 01 ( -0 01) 0 (0 ) 0(0 ) 0 (0 ) 0 (0 )(eardinallish) 89 5 JApogon spp (N) May <0 01 (-0 01) 0 (0) 0 (0 ) 0(0) 0(0)(cardinaltish spp) 92 J
I’omatoniidaef'omulomus sahalnx (1.) Sep, ( )cl 0 (0 ) 0 (0 ) 0 (0) 0(0) 0 05 (0.03)(bluefish) 15.5(1 45)
lichcncidacUnidentified (N) Jun 0 14(0 10) 0 (0 ) 0 (0 ) 0(0 ) 0(0 )(remora) 59 5 J
CarangidacUnidentified (N) Muy, Jun. Jul 0 41 (0 28) 0 23(0 16) 0 (0 ) 0(0) 0(0)(jack) 3 9 * 40JCaranx spp Muy, Jun 0(0 ) 0 07 (0 07) 0 (0) 0(0 ) 0 01 (0 01)(jack spp.) 5 6 * 40 5 1Caranx crysos Jun. Jul, Aug, Sep 2 75(1 30) 0 56(0 49) -0 01 (0 01) 0 24 (0 08) 0 30 (0.10)(blue runner) 8 1 27 { 28 5 : 6 (4 79) 1 (9.45)Caranx hippos laius May, Jun, Jul, Aug, Oct 1 89(0 65) 4 45(1 62) <0 01 (0 01) 0 08 (0.03) 0 22 (0 06)(crcvallc/horsc-cyc juek) 10(1 85) 8 (4 3 1 ) 28 5 + 16(1.60) 5 (6 91)Chloroscomhrus i hrysurus Jun, Jul, Aug. Sep 0 57(0 24) 0 (0) 0 (0 ) 0 03 (0 02) 0(0 )(Atlantic bumper) 3 3 * 331/Jecaplerus pundatus Jun, Jul 0.03 (0 03) 0 (0) <0 01 (0 01) <0 01 (0 01) 0(0)(round scad) 77 5 1 28 5 J S3?

Reproduced
with perm
ission of the
copyright ow
ner. Further
reproduction prohibited
without
permission.
Table 2.3. (continued)
Taxa Months Collected SurfaceNet
UnlloinNet
Rolloutl.ight-trap
Surfacel.ight-trap
OIT-platfornil.ight-trap
Density (SI:) Kank (%)
Density (SI ) Rank (%)
CI+IJI-: (Si:> Kank (%)
CI'IJI: (SI!) Kank (%)
Cl’lll: (SI:) Rank (%)
Elagalts btpumuLua May (I 19(0 12) 0 (0 ) 0 (0 ) 0(0) 0 01 (0.01)(rainbow runner) 54 % 40 5 :Selar irumenopthalmus (N) May, Jun 0 02(0 02) 0 19(0 19) 0 (0 ) 0(0) 0 (0)(bigcyc scad) 86 + 42 5 :Selene vomer (N) Sep 0.24(0 24) 0(0 ) 0(0 ) 0(0) 0(0)(Inokdovvn) 49 +Seriola spp. May, Jun, Aug, Oct 0.11 (0 06) 0 44 (0 36) 0(0 ) <0 01 (0.01) 0(0)(jack spp) 62 J 2 8 : 5 5 :Trachurus luihomi Jan, l eh, Apr, May 0 12(0 07) 0 19(0 19) 0(0 ) <0 01 (0.01) 0 02 (0.02)(rough scad) 61 t 42 5 : 5 5 : 25 :
CoryphacnidacCoryphaena equtselis (N) May 0 01 (0 01) 0(0 ) 0 (0 ) 0(0) 0 (0 )(ponipano dolphin) 87.5 JCoryphaena htppurus (N) Jun, Sep 0 09(0 07) 0 09 (0 09) 0 (0) 0 (0) 0(0)(dolphin) 65 J s i :
l.utjanidacUnidentified l-'eb. May 0 04(0 04) 0 03 (0 03) 0 (0) 0(0) 001 (0.01)(snapper) 76 t 5 8 : 40.5 :l.utjanus spp. Jun 0 14(0 10) 0.19(0 19) 0(0 ) <0 01 (0.01) 0(0)(snapper spp.) 59 5 i 42 5 t 55 :iu fjanus apodus vtvanus (1.) Jul 0 (0 ) 0(0 ) 0 (0 ) 0 02 (0 01) 0(0)(schoolmaster/silk snapper) 41 .5 :Lutjanus cam/iechanus (1.) Sep 0 (0) 0(0 ) 0(0 ) 0 02 (0 02) 0(0 )(red snapper) 4 i .s :I'rtslipomoides atpalonans (N) Jun. Ocl 0 9 | (0 71) 1 95 (0 88) 0 (0) 0(0 ) 0 (0 )(wcnchman) 22 J 14(2 16)Rliombophtes aurorubens (N) Jul 0 05(0.05) 0 (0 ) 0 (0 ) 0 (0 ) 0(0 )(Vermillion snapper) 72J
(icrreidacEuctnostomus spp (1.) Jun, Jul. Sep 0(0 ) 0 (0 ) 0(0 ) 0 05 (0 02) 0.10(0.07)(jenny/mojarra spp.) 22(1 06) 12(3 27)
SparidacUnidentified (N) May 0 (0) 0 07 (007) 0(0 ) 0(0) 0(0)(porgy) 5 6 :Lagodtm rhombotdes (N) Jun 0 17(0 14) 0 38(0 38) 0(0 ) 0(0) 0(0)(pinfish) S’ ? 3* 1

Reproduced
with perm
ission of the
copyright ow
ner. Further
reproduction prohibited
without
permission.
Table 2.3. (continued)
Tuxa Months Collected SurfaceNet
IfotuimNet
Ifnttoml.ight-trap
Surfuccl.ight-trap
OIT-plalfomil.ight-trap
Density (SI:) Kank (%)
Density (SI:) Kank (%)
C l’Ui: (SI-:) Kank (%)
Cl’UI: (Sli) Kunk (%)
Cl’Ui: (Sli) Kank (%)
Sciacnidac( 'ynoscion areuarius Jul. Aug 151 (0 66) 0(0 ) 0 (0 ) 0 04 (0 02) 0(0)(sand scalroul) 14(2 00) 2 5 }Leioslomus xanlhurus Jun 0(0) 0(0 ) 0(0 ) 0(0 ) 0 01 (0.01)(spol) 40 5 }3 hcropogomas iimlultims Oct 0 45(0 23) 0 30 (0 30) 0 02(0.01) <0.01 (0 01) 0.02 (0.02)(Atlantic croaker) 35 J 3 7 } 18} 5 5 } 2 5 }Scmenops ocellalus Sep 4 I I (1 02) 0(0) 0(0) <0 01 (0.01) 0(0)(red drum) 5(3.70) 5 5 }
MullidaeUnidentilied (1.) Jun 0(0 ) 0(0 ) 0 (0 ) 0(0 ) 0.0! <0.01)(goatlish) 40 .5}Upeneus parvus (1.) Apr 0(0) 0 (0 ) 0(0) 0 (0 ) 0 01 (0.01)(dwarf goalfish) 40 .5}
HphippidaeChaelodipierusfaher (N) Muy, Jul 0 05 (0 04) 0 (0) 0 (0 ) 0 (0 ) 0(0)(Atlantic spadcfish) 74 }
ChaclodonlidacUnideniilicd (N) Jun 0 03(0 03) 0(0 ) 0(0) 0 (0) 0(0)(butterfly flslt) 77.5}
I'omaccntridae1‘amacenlrus spp. (1.) Jun, Jul 0 (0 ) 0(0) 0 02(0 01) 0 14(0.08) 0 03 (0.03)(damselfish spp.) 18} 13(2.84) 19(1.09)
MugilidacMugil cephalus Jail, I'eb, Oct, Nov 8 27(4 58) 32 05(15 62) 0 (0) 0 04 (0 02) 0.14(0 06)(striped mullet) 3 } 2 (5 54) 2 5 } 9 5 (4.36)
SphyraenidocSphyraena guachanclw Jun, Jul 0 44 (0 30) 0 08 (0 08) 0(0) 0 03 (0.03) 001 (001)(guaguanche) 3 6 } 5 3 } 3 3 } 40.5}
ScaridaeUnidentilied Aug, Oct, Nov 3 01 (1 35) 16 31 (5 64) <0 01 (0 01) 0 06(0 03) 0(0)(parrolfish) 7 } 3 (3 08) 28 5 } 19.5(1 24)
BlenniidacUnidentified May, Jun, Jul, Sep, Ocl 0.34(0 10) 0 08(0 08) 0 06(0 06) 0 17(0 15) 0 01 (0 01)(blenny) 41 J ..........m 0.5 12.55) 10(3.37) 40.5}

Reproduced
with perm
ission of the
copyright ow
ner. Further
reproduction prohibited
without
permission.
Table 2.3. (continued)
Taxa Months Collected SurfaceNet
liottomNet
liottoml.ight-trap
Surfacel.ight-trap
OfiT-platfurml.ight-trap
IX-nsity (Sli) Kank (%)
IX-nstly (SI.) Kank (%)
CI'UI- (Sli) Kank (%)
Cl'Uli (Sli) Kank (%)
Cl'Uli (Sli) Rank (%)
llypsoblenmus inwmar Jun, Oct 0 (0 ) 0 08(0 08) 0(0) 0(0) 0 01 (0 01)(tessellated blcnny) 53 : 40 .5 :Ophiohlennius allanlwus Jun, Oct 0 65(0 47) 0 (0) 0 (0 ) ‘ 0 01 (0.01) 0 01 (0 01)(rcdlip blcnny) 29 * 55 : 4 0 5 :
CallionyntidacFoetorepus agassizi (N) Aug 005 (003) 0 (0) 0 (0 ) 0(0) 0 (0 )(spotfln dragonct) 75JParadiplogramus bairdi (N) Aug 003 (0 02) 0(0 ) 0 (0) 0 (0) 0 (0 )(lancer dragonct) 8 4 :
GobiidacUnidentilied Jan, l eh, Apr, Jun, Jul, Aug. 4.63(1.78) I I 08(3 87) 0 09 (0 04) 0 44 (0.40) 0.05 (0.02)(goby) Oct Nov 4 (2.02) 4(4.41) 5.5 (4.00) 2(8 87) 15.5(1.45)
MicrodesmidacMwrodesmus spp. (N) Jun, Aug 0 03 (0 03) 0 75(0 52) 0(0 ) 0(0 ) 0 (0 )(worm fish spp.) 8 3 : 2 3 :Mwrodesmus lanceolalus (N) Jun, Jul, Aug 0 65(0 41) 0 15(0 I I ) 0(0 ) 0(0) 0 (0)(lancetail womtfish) 2 8 : 4 7 :Microdesmus longipnmis Jul 004 (0 06) 0 (0) 0 (0 ) 0 05 (0 03) 0.02 (0.02)(pink womtfish) 70 : 22(1.06) 2 5 :
ScombridaeUnidentified May, Jun, Jul, Aug, Sep 1 75(1 01) 0 75(0 75) 0 (0 ) 0 01 (0 01) 0 02 (0 01)(mackerel) 12(2 73) 22 : 41 5 : 40.5 }Acanlhocybium solandn Jun 0(0) 0 09(0 09) 0(0) 0 (0) 0 (0 )(wahoo) 49 5 :Auxis spp. May, Jun, Aug, Sep, Oct 1 41 (042) 0 94(0 50) 0 02(0 01) 0.40(0 13) 0 14(0 04)(mackerel spp.) 15(1.99) 20 : 18 : 4 (8 16) 9 5 (4.36)Eulhynnus allelleralus May, Jun, Jul, Aug, Sop, Ocl 0 65 (0 25) 0 09 (0 09) 0(0 ) 0 06(0.02) 0 18(008)(little tunny) 30 : 4 9 5 : 19 5(1 24) 6 (5 82)Scomberomorus cavtdla Aug 0 09(0 07) 0(0) (‘ 0 01) (0 01) 0.02 (0.02) 003 (0 03)(king mackerel) 6 6 : 28 5 : 41 .5 : 19(1 09)Scomberomorus maculalus Jul. Aug 0 75(0 42) 0 (0) 0 (0 ) 0 02(0 01) 0(0 )(Spanish mackerel) 2 6 : 41.5}Thunnus spp. May, Jun 001 (0 02) 0 17(0 12) 0(0) 0 02 (0 01) 0 03 (0.01)(tuna spp.) 8 2 : 4 6 : 41 s : 4 0 .5 :Thunnus ihynnus (N) Jun 0 06 (0 07) 0 18(0 18) 0(0) 0(0) 0 (0 )(bluefin tuna) 6 9 : • is :
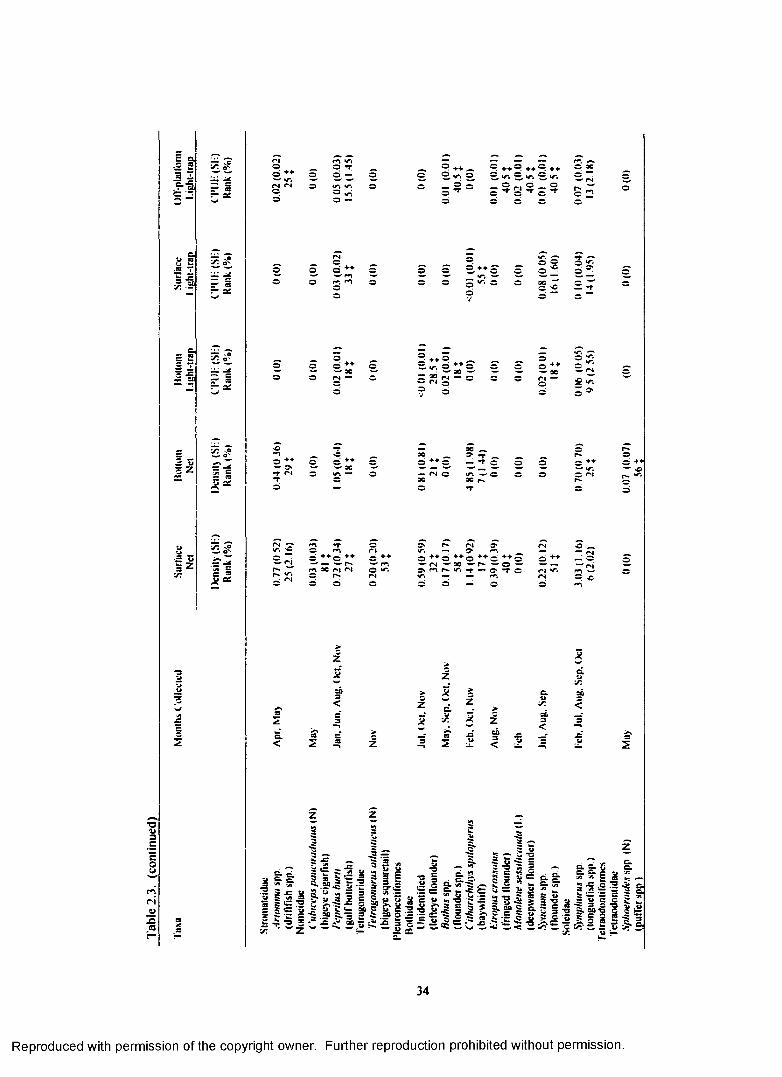
Table
2.
3.
(con
tinue
d)
BO — .**5 = .2£ .2
34
Reproduced with permission of the copyright owner. Further reproduction prohibited without permission.
^
9904
common in subsurface net collections, and myctophids were present in subsurface light-trap collections.
Though not abundant, other outer shelf species o f note include Diplophos taenia, Chlorophthalamus
agassti, Scopelarchoides spp., Paralepis atlantica, and Lestrolepis intermedia. While the adults are
seldom observed, the planktonic nature o f the early life stages o f these mesopelagic taxa made them a
significant component o f the outer shelf ichthyoplankton assemblage at GC 18.
The dominant reef-associated fishes at GC 18 were unidentified gobiids. Second in abundance
were serranids. most o f which were from the poorly known subfamily Anthiinae. Anthiine adults are
residents o f rocky reefs on the outer shelf and are not usually found on shallow, inshore reefs (Thresher
1984). Other serranids included Epinephelus spp. and Mycteroperca spp. Lutjanids were also fairly
common among the reef fish taxa, primarily Pristipomoides aquilonaris, one o f the most common
residents o f mid- and outer shelf reefs (Hoese and Moore 1977). Other noteworthy taxa included
unidentified blennies, Holocentrus spp.(reef-associated), and Pomacentrus spp. (reef-dependent).
Larval and Juvenile Fish Collected at the Mid-Shelf Platform (Gl 94)
A total o f45,754 fish were collected at the mid-shelf platform (Gl 94). Light-traps collected
31,353 fish and plankton nets collected 14,401 fish (Table 2.4). Plankton nets collected fish from 40
different families, six o f which were not collected by light-traps. Light-traps sampled fish from 37
families, only three o f which were not sampled by plankton nets. Plankton nets collected fish from 83
taxa (identified at least to genus), 26 o f which were not collected in light-traps, while light-traps collected
fish from 90 taxa 31 o f which were not sampled with plankton nets.
At Gl 94 (located in 60 m water depth), pelagic species dominated the catches as well, but there
appeared to be a taxonomic shift in dominance. Clupeiforms again dominated the collections, but
engraulids became more prominent in abundance (57%) than clupeids (9%). Unidentified engraulids
were the most abundant pelagic taxa in the plankton nets, and Engraulis eurystole were very common in
light-trap collections. Opisthonema oglinum, which was the most dominant clupeid at the outer shelf
platform (GC 18), ranked third in overall abundance. Caranx crysos and C. hippos/latus were not as
dominant at this site as they were at GC 18. but as a family, the carangids had more species richness at Gl
94. Oligoplites soums, Seriola dumeriWrivoliana, S. fasciata, Trachinotus carolinus, and T.
falcatus/goodei were all present at Gl 94. but absent at the outer shelf platform (GC 18). Similarly,
35
Reproduced with permission of the copyright owner. Further reproduction prohibited without permission.

Reproduced
with perm
ission of the
copyright ow
ner. Further
reproduction prohibited
without
permission.
Table 2.4. Total plankton net density (fish/100 nt3) and light-trap CPUE (fish/10 min) for fish collected at Grand Isle 94 with standard error (SB), rank, percent o f total catch (%), and months collected for each taxa. (N) indicates taxa collected only with plankton nets. (L) indicates taxa collected only with light-traps. For ranks, tied values received the mean o f the corresponding ranks, j indicates a value < 1.00%.________________________
Taxii Months Collected SurfaceNet
linttomNet
Ituitumlight-lrap
Surface 1 .ight-trap
OIT-plalfomtlight-trap
Density (SI:) Rank (%)
Density (SI ) Rank (%)
CIUII: (SI-!) Rank (%)
ciHJi-; (Si-:> Rank (%)
Cl’UI: (SB) Rank (%)
OstcichthycsUnidentified Apr, May, Jun, July, Aug 0 92 (0 60) 0 78(0.41) 0 28(0.26) 0.13(0.10) 1 12(0.94)
■«* 23(1.31) 10(1.13) 2 2 * 9(4.55)Anguilliformcs
Unidentified (N) Jun 0 07 (0 07) 0 (0 ) 0 (0 ) 0(0) 0(0 )(cel) 6 9 *Muracniduc
Unidentified May, Jun, Jul 0 07(0 05) 0 44 (0 23) <0 01 (< ()0 I) 0 (0 ) 0 (0 )(moruy cel) 71 * 3 3 * 49 +
OphichlhidacUnidentified Jun, Jul. Aug 0 10(005) 0 69(0 35) 0 0 4 (0 02) 0 02(0 01) 0 (0 )(snake eel) 5 5 * 2 6 * 26 5 * 51 *Ophwhthus spp. Aug 0(0 ) 0(0 ) 0 (0 ) 0 03(0 02) 0 (0 )(snake eel) 46 5 *Ophiclitlius gomesi (N ) Jun 0 01 (0.01) 0 (0 ) 0 (0 ) 0(0 ) 0(0 )(shrimp eel) 9 8 *
Ncltastoniatidac1/opinions macrurus (1.) May 0(0) 0(0 ) 0 (0 ) 0.0! (<0.01) 0(0 )(freckled-pike conger) 61.5 *
ClupcifomtcsUnidentified Apr, May, Jun, Jul, Aug 23 8 (2 14) 0 05 (0 04) <0 01 (<0 01) <0 01 (<0.01) 0(0 )(herring/anchovy) 12* 6 9 * 5 8 * 81 5 *Clupeidac
Unidentified Apr, May, Aug 0(0 ) 0 52 (0 37) 0(0 ) 0 01 (<0.01) 0 (0)(herring) 3 0 * 61 5 *ttrevoartia palronus (1.) Apr 0(0 ) 0(0) <0 01 (<0.01) 0(0) 0(0 )(gulf menhaden) 4 9 *Klrumeus teres Apr 0 08 (0 06) 0 23 (0 16) 0 02 (0 01) 0 03 (0.02) 0 01 (<0.01)(round herring) 66 J 4 4 * 3 2 * 46 5 * 51 5 *llurengula jaguanu Apr, Jun, Jul, Aug 0 61 (0 27 ) 0 31 (0 31) 0 06 (0 02) 0 69 (0 18) 0 68 (0.15)(scaled sardine) 2 5 * 38 5 * 2 1 * 18* I I (2.76)Opisthonema og/mum Apr, Jun, Jul, Aug 70 99(35 34) 4 81 (1 97) 1 26(0 85) 6 04(1 23) 4 I I ( I I I )(Atlantic thread herring) 2(15.81) 5 <2 20) 6 (4 99) 8 (4 07) 1 (16.66)Sardmella aurilu Apr, Jul, Aug 0 08(0 06) 0 16(0 16) 0(0 ) 0 04(0 02) 0(0 )(Spanish sardine) (>7* . . . . « * 4 1 5 *

Reproduced
with perm
ission of the
copyright ow
ner. Further
reproduction prohibited
without
permission.
Table 2.4. (continued)
I’uxa Months Collected Surface lioltont Motion) Surface OlY-platfonnNet Net light-trap l.ighl-lrap l.ighl-trap
Density (SI ) Density (SI!) C'l’lll: (SI:) CPUI:(SI:) C'PUI:(SI:)Rank (%) Rank (%) Rank (%) Rank (%) Rank (%)
lingraulidacUnidentified Apr, May, Jun, Jul, Aug 232 66(44 32) 66 92(17 27) 0 41 (0 09) 0 55 (0 12) 0 96(0.17)(anchovy) 1 (62 01) 1 (24 74) 7(1 64) 20 : 10(3 92)Anchoa spp. Apr. May. Jun, Jul, Aug 14 23(8 25) 1 21 (0 73) 0 18 (0.17) 0.02(0 01) <0 01 (<0.01)(anchovy spp) 3 (3 55) 2 1 : i s : s i : 6 4 :Anchoa hepsetus Aug 0(0) 0(0 ) 0 10(0 08) 0 70 (0 49) 0.50 (0.47)(striped anchovy) 16 5 : 16 : 12(2.04)Aiichoa m ilchilh Jun, Jul, Aug 6 24(2.37) 2 70(1 03) 0.37(0 18) 1 89(0 83) 0.47 (0.23)(bay anchovy) 6(1.89) n : 8(1 46) 10(1 27) 14(1 91)Anchoa nasuta Aug 0(0 ) 0 (0 ) 7.80(6 15) I I 10(5.93) 131 (0.70)(longnose anchovy) 1 (30 96) 4 (7 47) 6 (5.30)Anchoa nasuialiep.seliis Apr, May. Jun, Jul, Aug 5.64 (2 80) 4 59(1 69) 2.73 (0 52) 30 I I (12.33) 1 45 (0 53)(longnosc/stripcd anchovy) 8(1 87) 7(3 14) 3(10 88) 2(20 27) 5(5.86)Anchoviella i>er/asciala Aug 0(0) 0(0 ) 0 (0 ) 0.07 (0.07) 0 09 (0 09)(flat anchovy) 33 5 : 2 4 :Engrauhs euryslole Apr, May, Jun, Jul, Aug 1 93(1 90) 243(1 12) 5 72(1 41) 38 79(13.81) 1.25(0.48)(silver anchovy) 13 J 12(1 15) 2 <22 79) 1(26 12) 7(5.08)
Stomiiformcs(ionoslomaiidac
Cycloihone hrauen (N) Apr, Jul 0 02 (0 02) 9 4 :
0 11 (0 08) 60 :
0 (0 ) 0(0) 0 (0 )
i'inciguerria nimharia (1.) Apr 0(0 ) 0 (0 ) 0 (0 ) <0 01 (<0.01) 81 5 :
0(0)
AulopilbrmesSynodontidae
Unidentified Apr, May, Jun, Jul, Aug 0 22 (0 08) 2 11 (056) 0 10(0 03) 0 90 (0 39) 0 12 (0 06)40 + 15(1 05) i6 5 : i 4 : 2 i :
Saurida hrasdieitsis Apr, May, Jun, Jul, Aug 0 81 (0 22) 4 77(1 26) 1 97 (0 42) 3 35(0 51) 0 50(0 14)(largescalc li/ardftsh) 21 5 6 (4 86) 5(7 84) 9(2 27) 13(201)Saurida nor mam (1.) Apr, May 0(0 ) 0 (0 ) 0 (0) 0 01 (<0.(>l) 0 (0)(shortjaw lizardfish) 6i 5 :Saurida normam hrasiliensts (1.) May 0(0 ) 0(0 ) 0 (0 ) <0 01 (<0.01) 0(0)(shortjaw/largcscalc li/ardlish) si 5 :Saurida suspicio (1.) Muy 0 (0) 0 (0) 0 (0 ) <0 01 (<0 01)
81 s :0(0 )

Reproduced
with perm
ission of the
copyright ow
ner. Further
reproduction prohibited
without
permission.
Table 2.4. (continued)
Taxa Months Collected SurfaceNet
liottumNet
Hottonil.ight-lrap
Surfacel.ight-lrap
OIT-platfonnl.ight-lrap
Density (SI:) Kank (%)
Density (SI:) Kank (%)
CPUKtSI:) Kank (%)
CPUI:(SI:) Kank (%)
CPU!- (SI:) Kank (%)
Synodus spp. (lizardfish spp )
May, Jun 0(0 ) 0 03 (0.03) 72.5 ;
<0 01 (<0.01) 4 9 ;
0 06 (0.06) 37 5 ;
0.04 (0.03) 35 5 ;
Synodus foetens Apr, May, Jun, Jul, Aug 0.64 (0 26) 2 12(0 77) 0 20 (0.06) 22 I I (5 24) 0.20 (0.05)(inshore lizardfish) 24 J 14(1.20) 12 ; 3(14 92) 19;Synodus poeyi Apr, May, Jun, Jul, Aug 0.17(0 13) 1 35(0 44) 0.34 (0.09) 9.98(1.78) 0.13(0.28)(offshore lizardfish) 47 J 17; 9(1 36) 5 (6.74) 8 (4.57)Synmlus synodus (1.) (red lizardfish)
Muy 0(0 ) 0(0) 0 (0 ) 0 01 (<0.01) 61 5 ;
0(0 )
Trachinocephalus my ops (1.) (snakefish)
Apr, May, Jun, Aug 0(0 ) 0(0 ) 0 (0 ) 0 08 (0 03) 30 5 ;
<0.01 (<0.01) 6 4 ;
I’aralepidacUnidentified (N) (barracudina)
May 0 03 (0 03) 88^
0(0 ) 0 (0 ) 0(0 ) 0 (0 )
l.estrolepis intermedia May, Jun, Aug 0(0 ) 0 15(0 I I ) 5 6 ;
0 02 (0 01) 3 2 ;
<0 01 (<0.01) 81 5 ;
0 (0 )
leslrole/ns spp. (1.)(barracudina spp.)
Aug 0 (0) 0 (0 ) <0 01 (<0.01) 4 0 ;
0(0 ) 0(0 )
MyciophiformcsUnidentified (N)
Myctophidae
Jun 0(0 ) 021 (021) 4 8 ;
0(0 ) 0(0) 0 (0 )
Unidentified Apr, May, Jun, Jul, Aug 0 00(0 05) 0 75(0 41) 003 (0.02) 0 05(0 02) 0 06(0 02)(lantemfish) 6 0 ; 25 ; 2 8 ; 4 0 ; 29.5 ;
CiadifomtesIfregmaccrotidac
ttregmaceros canton Apr, May, Jun, Jul, Aug 1 59(0 42) 16;
16 67(3 00) 3(15 06)
2 18(1 02) 4 (8 68)
0 06(0 02) 35.5 ;
0 03(0.02) 38 5 ;
OphidiiforniesOphidiidae
Unidentified(cusk-eel)
May, Jun, Jul 0 31 (0 13) 3 5 ;
0 21 (0 21) 4 8 ;
0 (0 ) <0 01 (<0.01) 81 5 ;
0 (0 )
U'pophidium spp. (N) (cusk-eel spp.)
Jul 0(0) 0 13(0 13) 58 5 ;
0 (0 ) 0(0 ) 0(0)
Istpophldiumprojundorum (N) (fawn cusk-eel)
Jun 0 03(0 02) 8 4 ;
0 23(0 21) 4 5 ;
0 (0) 0 (0 ) 0(0 )
l.epophulnnn slaurophor (N) May, Jun, Aug 0 09(0 06) 5 9 ;
0(0 ) 0 (0 ) 0 (0) 0 (0 )

Reproduced
with perm
ission of the
copyright ow
ner. Further
reproduction prohibited
without
permission.
Table 2.4. (continued)
Taxa Months Collected SurfaceNet
lUittomNet
liotioml.ight-lrap
Surfacel.ighl-lrap
OfT-platformLight-trap
Density (SI!) Kank (%)
Density (SL) Kank (%)
m u - (Si-:>Rank (%)
c'ihji-: (SiE)Kank (%)
c iu j i-: (Si-:>Rank (%)
Ophidiinac Type A (N) (cusk-cci spp.)
Jun 0(0 ) 0 02 (0 02) 8 0 }
0 (0 ) 0(0) 0(0)
Ophuium nocomis May, Jun 0(0 ) 0 05(0 05) 6 8 }
0 01 (<0.01) 3 7 }
0(0) 0(0)
Ophuium nocomis selenops (cusk-cci spp.)
May 0 09(0 06) 6 3 }
0 31 (0 23) 38 5 }
0 (0 ) <0 01 (<0.01) 81 5 }
0(0 )
Ophuium selenops (N) (mooneye cusk-cci)
l.ophilformcs Caulophrynidac
May, Jun 0(0 ) 0 19(0 14) 5 0 }
0 (0 ) 0(0) 0(0)
Rohm legula (N)
Alhcrinifornicslixococlidac
Jul 0 (0 ) 0 09 (0 08) 61 }
0(0 ) 0(0) 0 (0 )
llnidcniilied(flyingfisli)
Jun 0 14(0 07) 0 07 (0.07) 64 5 }
0 (0) 0 (0 ) 0(0 )
Cypseiurus spp. (flyingfish spp)
Muy, Jun 0(0 ) 0 07 (0.07) 64 5 }
0 (0 ) <0 01 (<0.01) 81.5 }
<0.01 (<0.01) 6 4 }
Cypseiurus cyanopierus (1.) (margined flyingfish)
Hcrycifomics 1 loloccnlridac
Jul 0(0) 0 (0 ) 0 (0 ) <0 01 (<0.01) 8 1 5 }
0(0)
Holocenlrus spp. (squirrdftsh spp.)
Scorpaeni lormcs Scorpacnidac
May, Jun, Jul 0 18(0 08) 44 }
0 (0) 0 01 (<0.01) 4 0 }
0 (0) <0.01 (<0.01) 6 4 }
dnidcntincd (N) (scorpionfish)
Muy, Jun 0 01 (0 01) 95 J
0 16(0 16) 5 4 }
0 (0 ) 0(0) 0 (0)
Scorpaena spp. (scorpionlish spp.)
Triglidac
Muy, Jul, Aug 0(0 ) 0 45 (0 34) 3 2 }
0 (0 ) 0 01 (<0.01) 61.5}
0(0)
Unidentified (N) (scarobin)
Jul 0 01 (0 01) 9 9 }
0 (0) 0 (0) 0 (0 ) 0(0)
1‘rionolus spp. (scarobin spp.)
I’crcifnnncs
Apr 0 21 (O il ) 4 2 }
0 09 (0.09) 6 2 }
0(0 ) <0 01 (<0.01) 81 5 }
0(0)

Reproduced
with perm
ission of the
copyright ow
ner. Further
reproduction prohibited
without
permission.
Table 2.4. (continued)
Taxa Months Collected SurfaceNet
bottomNet
Bottoml.ight-lrap
Surfacel.ight-lrap
Off-platforml.ight-lrap
Density (Sli) Kank <%)
Density (Sli) Kank (%)
Cl’llli (Sli) Kank (%)
Cl’ lJli (Sli) Kank (%)
Cl'Uii (Sli) Kank (%)
Unidentified Apr, May. Jun, Jul. Aug 1 74(0 m 2 22 (0.76) 0 05 (0 02) 0.09 (0 05) 0.04(0.02)15 } 13(1 41) 24.5 } 2 7 } 3 4 }
SerrunidaeUnidentified (N) Apr, Muy. Jun 0 08(0 05) 0 16(0 13) 0 (0 ) 0 (0 ) 0(0 )(seabas s/grouper) 68 } 5 2 }Anlhinac Muy 0 17(0 09) 0 35(0 24) 0 (0 ) 0 01 (<0.01) 0(0)(sea perch) 46 } 3 6 } 61 .5}lipinephclinae Muy, Jun 0 07(0 04) 0(0 ) 0(0 ) 0 03 (0.01) 0(0)(grouper) 7 2 } 4 3 }Grammislinae (N) Jun, Jul 0 04(0 03) 0 01 (0 01) 0(0 ) 0(0 ) 0 (0 )
80 } 81 }Serraninac Apr, May, Jun, Aug 0.36 (0.14) 0.95(0 33) <0 01 (<0.01) 0 08 (0.03) 0(0)(sea bass) 3 1 } 2 2 } 4 9 } 30 5 }
Priacanlhidact'nucamhus spp. (N) May 0(0 ) 0 03 (0 03) 0(0) 0(0) 0(0)(bigcyc/glasseye spp.) 74 5 }
I'oniaiomidaeI'amalomus salla lrix Apr, Muy 0.08 (0 06) 0 (0 ) 0(0 ) 0 01 (<0.01) 0(0)(hluelish) 65 J 615 }
KachycentridacRachycenlron canailum (N) May, Jun, Jul 0 14(0 07) 0 02 (0 02) 0(0 ) 0 (0 ) 0(0)(cohia) 5 2 * 7 8 }
CarangiducUnidentified Jun, Jul 0 17(0 I I ) 0 03 (0 03) 0 (0 ) 0 (0 ) <0.01 (<0.01)(jack) 45 J 72 5 } 6 4 }Caranx spp. (N) Jun 0 16(0 09) 0 (0 ) 0(0) 0 (0 ) 0(0 )(jack spp) 4 9 }( 'aranx crysas Jun. Jul, Aug 1 14(041) 0 62 (0 43) 0 04(0 03) 0 08 (0 03) 0.08 (0.02)(blue runner) 17} 2 8 } 26 5 } 30.5} 2 5 }Caranx hippos talus May, Jun, Jul, Aug 0 50(0 31) 0 (0 ) <0.01 (<0.01) 0 I I (0 03) 0 09 (0.03)(crevalle/horsc-eyc jack) 2 7 } 4 9 } 2 4 } 2 3 }Chioroscomhrus chrysurus Ju). Aug 1 00(0 34) 0 29 (0 18) <0 01 (<0.01) 0 01 (<0.01) 0.02 (0 01)(Atlantic bumper) 18} 4 0 } 4 9 } 61.5 } 44 5 }l)ecapierus piitu-talus (1.) Apr, Muy, Jul, Aug 0(0 ) 0 (0 ) 0(0) 0 06 (0 02) <0 01 (<0.01)(round scad) 35 5 } 6 4 }Uhgoptues saurus (N) Jul 0 16(0 12) 0(0 ) 0 (0 ) 0 (0 ) 0(0)(Icathcrjack) 4 8 }

Reproduced
with perm
ission of the
copyright ow
ner. Further
reproduction prohibited
without
permission.
Table 2.4. (continued)
'laxa Months Collected SurfaceNet
liottnmNet
liottoml.ight-lrap
Surfacel.ight-trap
OIT-platforml.ight-lrap
Density (SI ) Kank (%)
Density (Sli) Kank (%)
C'lHJli (Sli) Kank <%)
c ih j i; (Sli) Kank (%)
C'lHJli (Sli) Rank (%)
Selar cruinenopllialmus (N) Jun, Jul 0 34(0 15) 0 13(0 13) 0(0 ) 0(0) 0(0)(bigeyc scad) 34 J 58 5 }Selene vomer (N) Jun, Jul 0 01 (0 01) 0 05(0 03) 0(0) 0 (0 ) 0(0 )(lookdown) 96 J 7 0 }Sennlti spp. (N) May 0 03 (0 03) 0(0 ) 0(0 ) 0(0) 0 (0 )(jack spp.) 85 JSeriola ilumerilprivohana (I.) May, Jun 0(0 ) 0 (0 ) <0 01 (<0.01) 0 (0 ) 0 02 (0.01)(greater amberjack/almuco jack) 4 9 } 44 5 }Seriola fasciala (1.) May 0(0) 0(0 ) 0(0) <0.01 (<0.01) 0(0 )(lesser umbcrjack) 9 3 }Trachinoius carol inns (1.) Jun 0(0 ) 0 (0 ) 0(0) 0 (0 ) 0.01 (<0.01)(Florida pompano) 51.5}Trachmoms falcalus'goodei (1.) May 0(0 ) 0(0) 0 (0) 0 03 (0 02) 0(0)(permit/palomcta) 46 .5}Trachurus lalhami Apr, May 0 04(0 04) 0 15(0 10) 0 02(0.01) 0.06 (0.03) 0.01 (<0.0I)(rough scad) 82 ? 57 J 3 2 } 37.5} 51.5}
CoryphacnidaeCoryphaena etpnselis (1.) Muy 0(0 ) 0(0 ) 0 (0) 0(0) <0.01 (<().0I)(pompano dolphin) 6 4 }Coryphaena hippuru.% May, Jul 0 03(0 03) 0 (0 ) 0(0) 0(0) <0 01 <<0.01)(dolphin) 86.5 J 6 4 }
l.uljanidaeUnidentified May, Jun, Jul 0.09(0 05) 0 06 (0 06) <0 01 <<0.01) <0.01 (<0.01) 0(0)(snupper) 61 J 6 7 * 4 9 } 81 5 }l.uljanus spp. Muy, Jun, Jul 0 67 (0 24) 0.02 (0 02) 0(0 ) 0 01 (<0.01) 0 01 (0.01)(snapper spp.) 22 J 78 + 61 5 } 51.5}I.uyanus cam/Kchanus Muy, Jun, Jul 0 02 (0 02) 0(0 ) 0 (0 ) 0 02 (0 02) 0(0)(red snapper) 03 i 4 9 }Hhombopliles auroruhens May. Jun, Jul 0.40(0 25) 0 37(0 21) 0 20(0 06) 0.07 (0 03) <0 01 (<0.01)(vermilion snapper) 30 J 35 } 13} 33 5 } 6 4 }
(icrreidacEucmostomus spp May, Jun, Jul, Aug 0(0 ) 0(0 ) <0 01 (<0.01) <0.01 (<0.01) 0.02(0.01)(jenny/mojarra spp.) 4 9 } 81 5 } 4 1 }
SpariducUnidentified Apr, May 0 04(0 04) 0 (0 ) 0 (0) 0 01 (<0.01) 0.02 (0 01)(porgy) 83 J 61.5} 44 5 }

Reproduced
with perm
ission of the
copyright ow
ner. Further
reproduction prohibited
without
permission.
Table 2.4. (continued)
Taxa Months ('olleclcd SurfuceNet
bottomNet
Bnttuml.ight-lrap
Surfacel.ight-lrap
OfT-platforml.ight-lrap
IX'itsiiy (Sli) Kank (%)
Density (SI ) Rank (%)
C'lHJli (Slf) Kank (%)
C'lHJli (Sli) Kank (%)
CPUI-i (Sli) Kank (%)
Calamus spp. (1.) May 0(0) 0 (0 ) 0 (0 ) <0 01 <<0.01) 0(0)(porgy spp.)) s i s :Sciacnidae
Unidentified (N) Aug <0 01 (<0.01) 0(0) 0(0) 0(0) 0(0)(drum spp) 100 J('ynoscion arenanus Apr, May, Jul, Aug 3 12(1 I I ) 1 25(0 88) <0 01 (<0.01) 0(0) 0 01 (<0.01)(sand scairoul) l i t 49J 5 1 5 :Menttarrhus spp. (N) Aug 0 15(0 | | ) 0 63 (0 63) 0(0) 0(0) 0(0 )(kingfish spp.) 50 J 27 XSlt'llifer laiweolalus (N) Aug 0.09 (0.09) 0(0 ) 0(0 ) 0(0) 0(0 )(star drum) 64 +
MullidacUnidentified Apr, May, Jul 0 25(0 14) 0(0 ) <0 01 <<0.01) <0 01 (<0.01) 0 05 (0.02)(goal fish) 38 J 4 9 * 81 .5: 32 :Mullus auralus (1.) Apr, May 0(0 ) 0(0 ) 0 (0 ) 0(0 ) 0 06 (0.02)(red goatfish) 2 7 :1‘seudupeneus maailalus (1.) Apr, May 0(0) 0(0 ) 0 (0 ) 0(0) 0 06 (0.03)(spotted goaltlsh) 2 8 fll/wneus parvus (1.) May, Jun 0(0) 0(0) 0(0 ) 0 01 (<0.01) 0.38 (0 09)(dwarf goaltlsh) 6 i .5 : 15(1.58)
ChaciodontidaeUnidentified (N) May 0 02(0 02) 0(0) 0(0 ) 0 (0) 0(0)(bultcrllyfish) 91 ♦
PomacentridaeUnidentified (1.) May, Jun 0 (0) 0(0 ) <0 01 (<0.01) 0 01 (<0 0 !) 0.01 (0.01)(damselfish) 4 9 : 6 i 5 : s i s :A hutlefduf saxalilis (1.) May, Jun, Aug 0(0 ) 0(0 ) 0 (0) 0 (0) 0.03 (0 02)(sergeant major) 38.5 :A budejdpf laurus (1.) May 0(0 ) 0 (0 ) 0(0) 0 01 (<0.01) 0(0)(night sergeant) 61 .5 :Chromis spp Muy, Jun 0 29(0 29) 0(0 ) 0 01 (<0.01) 0.37(0.13) 0.06 (0 02)(chromis spp) 37 f 37 : 2 i : 3 i :1‘omacemrus spp Muy, Jun. Jul, Aug 0 09 (005) 0 03(0 03) 0 07(0 02) 0 12(0 03) 0.30(0.14)(damselfish spp) 62 J 74 5 t 2 o : 2 3 : 16(1.28)
MugilidaeMugllcurenui (\.) May. Jun 0(0) 0(0 ) 0 (0 ) 0 01 (<0.01) 0 02 (0 01)(while mullet) 61 .5 : 41 :

Reproduced
with perm
ission of the
copyright ow
ner. Further
reproduction prohibited
without
permission.
Table 2.4. (continued)
lu\a Months Collected SurfaceNet
DuttuniNet
Butloml.ight-trap
Surfacel.ight-trap
Off-platforml.ight-trap
Density (Sli) Kank (%)
Density (Sli) Rank (%)
Cl'UI-i (Sli) Kank (%)
CPUI: (Sli) Kank (%)
CPUI: (Sli) Kank (%)
SphyracniducSphyraena borealis (1.) Muy 0(0) 0(0 ) 0(0 ) 0 01 (<0.01) 0(0 )(nonhem sennet) 61 .5}Sphyraena guachaniho Jun, July, Aug 1 83(0 60) 0(0) 0(0 ) 0 01 (<0 01) 0 01 (<0.01)(guaguunchc) 14 t 61 .5} 57 }
l.ubridacUnidentified May, Aug 0 05 (0 05) 0 16(0 16) 0(0 ) <0 01 (<0.01) 0 (0 )(wrasse) 78 J 54 J 81.5}
OpislhognathidaeUnidcniificd Apr, May, Jun 046 (0 14) 048 (0 33) 0 (0 ) 0 63 (0 20) 0 06(0.02)(jawfish) 28 } 31 } 19} 29.5 }Opislhognalhus spp (N) Muy 0 05 (0 05) 0(0 ) 0(0 ) 0(0 ) 0(0)(jawfish spp.) 77 JOpislhognalhus uurtfrons May 0 06 (0.06) 0(0 ) 0 (0 ) 0 03 (0.02) 0(0)(ycllowhcad jawlish) 7 6 } 4 4 }Opislhognalhus huwhurus (N) Muy 0 10(0 10) 0(0) 0(0) 0 (0 ) 0 (0)(moustache jawfish) 58 +
HlenniiducUnidentified Apr, May, Jun, Jul, Aug 4 73(3 05) 1 22 (0.60) 0 05 (0 04) 0 69(0.21) 0.04 (0.03)(blcnny) 0(1 53) 20 + 24.5 } 17} 3 3 }llypsohlenmus heniz ionlhas (1.) May, Jun, Jul 0(0) 0(0) 0 02(0 01) 1 76(0.57) 0.04 (0.01)(fealher/lreekled hlenny) 2 9 } I I (1.21) 3 7 }llypsohlenmus inveomr Apr, May, Jun, Jul 0 04 (0 04) 0(0) 0 08 (0 03) 6 33(1.77) 3.58(0.67)(tessellated hlenny) 81 } 18 } 7 (4.32) 2(14.55)Ophioblenmus allanluus (N) Aug 0 42(0 42) 0(0) 0 (0 ) 0(0 ) 0(0 )(redlip hlenny) 20 +Parahlennius marmoreus Apr, May, Jun 0.02 (0 02) 0(0) 0 10(0 04) 7.20(1 06) 1.62(0.35)(seaweed hlenny) 02 J 14 t 6(4.87) 4(6.61)Scartella llypleurochilus Apr, May, Jun, Jul 0.06(0 04) 0 21 (0 15) <0 01 (-=0.01) 1 14(0.24) 0 I I (0 03)(blcnny spp.) 74 5 ♦ 46 + 49 J 12} 2 2 }
CallionymidacUnidentified |N) Jul 0 03(0 03) 0(0 ) 0(0 ) 0 (0 ) 0(0)(dragonct) 86 5 }
GobiidacUnidentified Apr, May, Jun, Jul, Aug 5 75(0 80) 10 73(1 76) 0 21 (006) 0 05 (0 02) 0 01 (<0.01)
7(1 77) 4(8 53) 3 9 } .....................5 L 5 1 . . . .
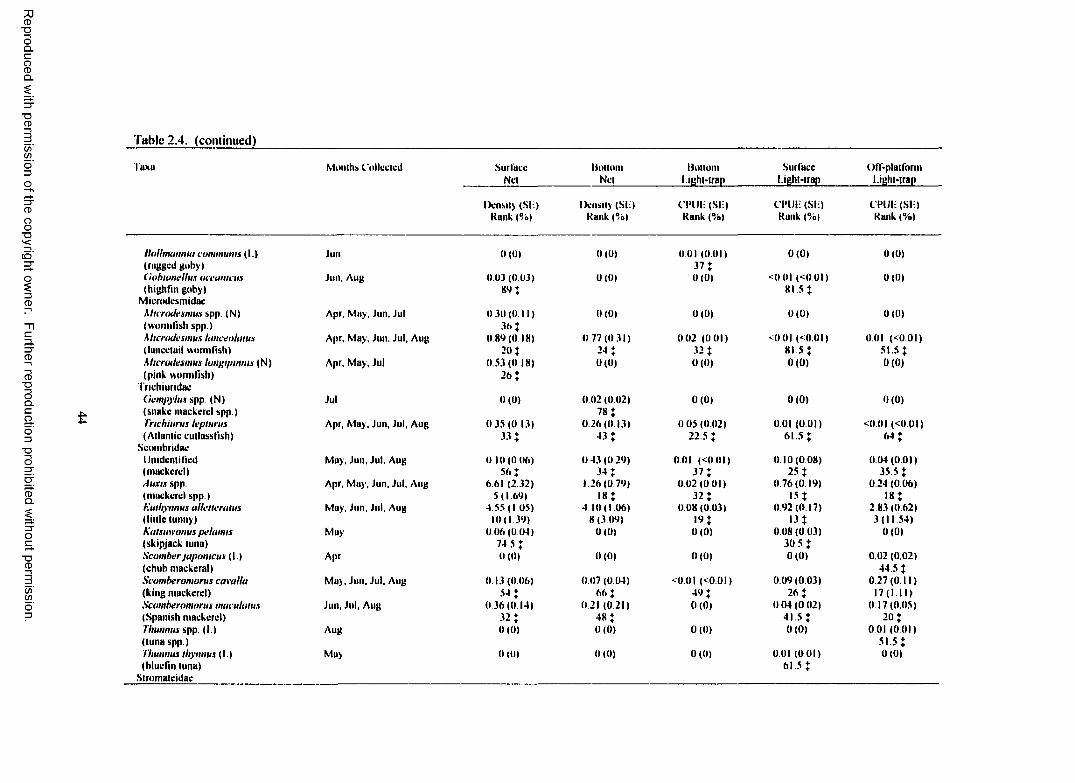
Reproduced
with perm
ission of the
copyright ow
ner. Further
reproduction prohibited
without
permission.
Table 2.4. (continued)
Taxa Mouths Collected SurfaceNd
IJnltomNd
linlloml.ight-trap
Surfacel.ight-trap
OIT-plaifonnl.ight-trap
Density (SI:) Kank (%)
Density (Si:) Kank (%)
m u e s l i ) Kank (%)
Cl’lll: (SI:) Kank (%)
CPUI: (SI:) Kank (%)
llollmannia communis (1.) Jun 0(0 ) 0(0 ) 0 01 (0.01) 0(0 ) 0(0)(rugged goby) 37 :f iobionellus oceamcus Jun, Aug 0 03 (0 03) 0(0 ) 0(0) <0 01 (<0 01) 0(0)(highCm goby) HO* k i .s :
MicrodcsmidaeAhcrodesmus spp. (N) Apr, Muy, Jun, Jul 0 30 (0 11) 0(0) 0 (0 ) 0(0 ) 0(0)(worm fish spp.) 36 JA licrodesmus lancealalus Apr, May, Jun. Jul, Aug 0 89(0 18) 0 77(0 31) 0 02 (0 01) <0 01 <<0.01) 0 01 (<0.01)(luncctuil wormftsh) 20 i 24 : 32 : 81 .5 : s i s :A hcrodesmus longipuuns (N) Apr, May, Jul 0.53(0 18) 0(0) 0 (0 ) 0 (0 ) 0(0)(pink wormfish) 2 6 f
Trichiuridacdempylus spp (N) Jul 0(0 ) 0 02 (0 02) 0 (0 ) 0 (0 ) 0(0 )(snake mackerel spp.) 7 8 :Trichturus leplurus Apr, May, Jun, Jul, Aug 0 35(0 13) 0 26(0 13) 0 05 (0 02) 0.01 (0 01) <0.01 <<0.01)(Atlantic cullassllsh) 3 3 : 43 : 22 .5 : 61.5 : 6 4 :
ScombridacUnidentified May, Jun, Jul, Aug O 10(0 06) 0 43 (0 29) 0 01 (<0.01) 0 10(0 08) 0 04(0.01)(mackerel) 5 6 : 34 : 37 : 2 5 : 35.5 :duxis spp. Apr, May, Jun. Jul, Aug 6 61 (2 32) I 26(0 79) 0 02 (0 01) 0 76 (0.19) 0 24 (0.06)(mackerel spp.) 5(1 69) i s : 3 2 : i s : i s :Kuthynnus alleneralus May, Jun, Jul, Aug 4 55(1 05) 4 10(1 06) 0 08 (0 03) 0 92(0.17) 2 83 (0.62)(little lunny) 10(1.39) 8(3 09) 19: 13 : 3(11 54)Kaisuwonus fielamis May 0 06(004) 0(0 ) 0 (0 ) 0 08 (0.03) 0(0)(skipjack luna) 74 5 : 30 5 :Scomber japomcus (1.) Apr 0 (0) 0(0) 0(0 ) 0(0 ) 0.02 (0.02)(chub mackeral) 44 5 :Scomberomorus covalla May, Jun, Jul, Aug 0 13(0 06) 0.07 (004) <0 01 (<0 01) 0.09(0 03) 0.27(0.11)(king mackerel) 54 : 6 6 : 4 9 : 2 6 : 17(1.11)Scomberomorus maculaius Jun, Jul, Aug 0.36(0 14) 0 21 (0 21) 0 (0 ) 0 04 (0 02) 0 17(0.05)(Spanish mackerel) 32 : 4 8 : 41.5 : 20 :Thunnus spp. (1.) Aug 0(0 ) 0(0 ) 0 (0 ) 0(0 ) 0 01 (0 01)(luna spp.) s i s :Thunnus thynnus (1.) May 0(0) 0 (0 ) 0 (0 ) 0 01 (0 01) 0(0)(blucfin luna) 6 1 5 :
Slromaicidae

Reproduced
with perm
ission of the
copyright ow
ner. Further
reproduction prohibited
without
permission.
Table 2.4. (continued)
Tuxa Months Collected SurfaceNet
BottomNet
Button)l.ighl-lrup
Surfacel.ight-lrap
Off-platforml.ight-trap
Density (ST) Kank (%)
Density (SI ) Kank (%)
CPUI: (SI:) Kank (%)
CPUI: (SI:) Kank (%)
CPUI: (SI:) Kank (%)
Armmma regulus{\.) Aug 0(0 ) 0 (0 ) 0 (0) <0 01 (<0.01) 0(0 )(spotted drintlsh) 81.5 ;( 'eniratophus medusophugus Apr 0(0) 032 (0 26) 0 (0 ) <0 01 (<0.01) <0 01 (<0.01)(brown rull) 3 7 ; 81 5 ; 6 4 ;I ’eprdus burn Apr, May 0.07(005) 004 (004) <001 (<001) 0.03(0 02) 0 02(0.01)(gulf buiicrfish) 70 : 7 i ; 4 9 ; 46 5 ; 4 1 ;I ’eprilus alepiduius (N) May, Jul, Aug 0 21 (O il) 2 79(1 72) 0(0 ) 0(0 ) 0 (0 )(harvcstfish) • » : I 0 ;
PleuronccliformcsUnidentified (N) Aug 0 01 (001) 0 08 (008) 0 (0 ) 0(0 ) 0 (0)(lloundcr) 9 7 ; 6 3 ;Bothidae
Unidentified Apr, May, Jul 0 06 (0 05) 0 1 7 (0 1 3 ) <001 (<001) 0(0 ) 0(0 )(Icfteye llounder) 73 ; 5 1 ; 4 9 ;Boihus spp. (1.) May 0(0) 0 (0) 0 (0) <0 01 (<0.01) 0(0)(flounder spp.) 81 5 ;( ’nharichihys spilopierus Apr, May, Jul 0 05 (0 04) 0 2 8 (0 20) 0(0) 0(0 ) <0 01 (<0.01)(bay whilf) 79 ; ■<1; 6 4 ;Cyclopsetta spp (N) Jun, Jul 0 1 0 (0 08) 0 5 3 (0 47) 0(0 ) 0(0) 0(0 )(flounder spp.) 57 ; 2 9 ;Engyophrys senla (N) Jul 0 (0) 0 02(0 02) 0 (0 ) 0(0) 0(0 )(spiny llounder) 7 6 ;Elropus crossotus Apr, May, Jun, Jul, Aug 065 (0 19) 1 79(0 54) 0 01 <<0.01) <001 (< 0 0 l) 0 01 <<0.01)(fringed llounder) 2 3 ; 16(1 57) 37 ; 81 5 ; 51.5 tSyacium spp. Apr, Jun, Jul, Aug 0 2 5 (0 1 2 ) 3 78(1 14) 0 (0 ) 0 02(0.01) <0 01 (<0.01)(flounder spp ) 3 9 ; 9 (2 82) 51 ; 6 4 ;
SolcidacAchirus hnealus (N) Jun, Jul 021 (0 08) 0 (0) 0 (0) 0 (0 ) 0(0 )(lined sole) 4 1 ;Symphurus spp. Apr, May, Jun, Jul. Aug 679(1 18) 17 00(3 82) 0 05(0 02) 0 08(0 02) 0 07 (0 03)(longuefish spp) 4(1 69) 2(14 49) 22 5 ; 2 8 ; 26 t
TetraodonlifonnesDalistidac
Unidentified (N) Jul 00.1(00.1) 0 (0 ) 0 (0 ) 0(0 ) 0 (0)(leaihcrjBckct) 90 ;
TetraodonlifonnesTetraodontidac
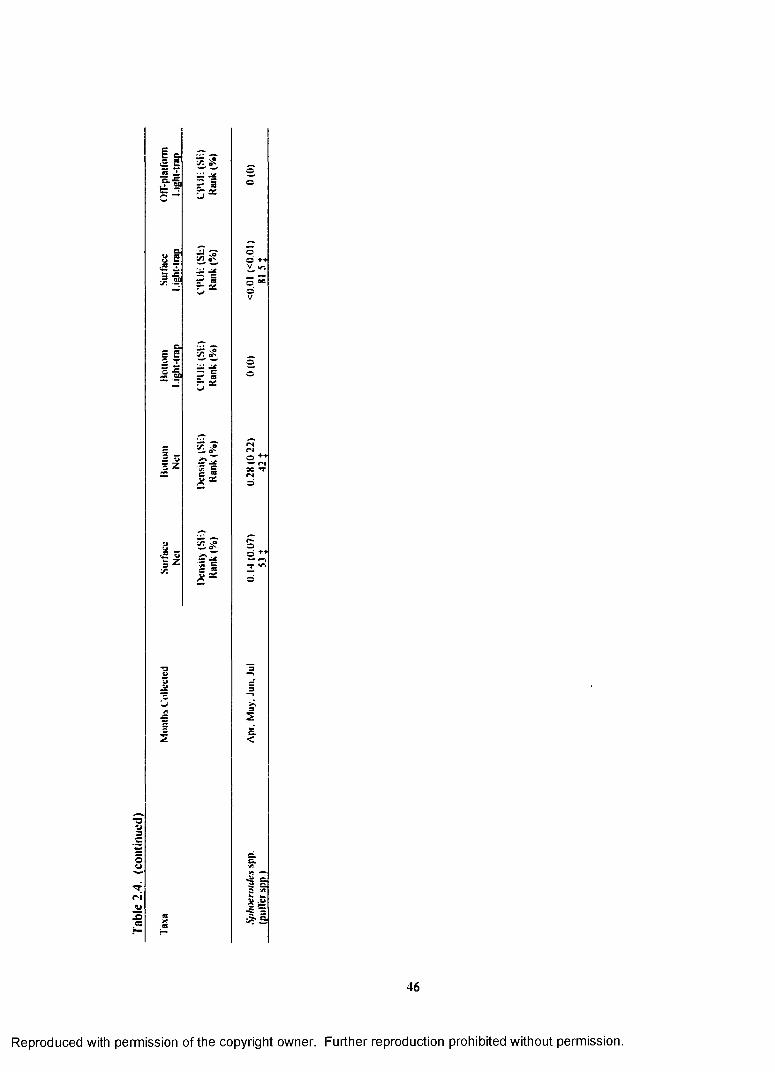
Table
2.
4.
(con
tinue
d)
46
Reproduced with permission of the copyright owner. Further reproduction prohibited without permission.

Rachycentron canadum, although not very common, were also collected at GI 94 and not at GC 18. As
with the carangids, R. canadum is also considered to be a reef-associated species.
Second in abundance to the pelagic forms at the mid-shelf platform (Gl 94) were demersal taxa,
particularly synodontids which comprised 14.7% o f the total catch and were approximately equal to the
total catch o f all perciform fishes combined (15.1%). Unidentified synodontids, Saurida brasiliensis,
Synodus foetens, and Synodus poeyi were very common in the late spring and summer months. Like the
carangids, this group was more species rich at Gl 94, with seven taxa identified to species as compared to
three at the outer shelf platform (GC 18). Other common demersal taxa included Symphurus spp.,
Syacium spp., and Bregmaceros cantori. Mesopelagic species were not as speciose and abundant as those
at GC 18, but some were collected, including Cycloihone braueri, Vinciguerria nimbaria, and Lestrolepis
intermedia.
Overall, there was greater taxonomic richness among reef fishes at the mid-shelf platform than
the outer shelf or inner shelf sites. Blenniids and gobiids were relatively common, as well as taxa that
were not collected at the other sites, such as Chromis spp. and opistognathids. Also noteworthy was the
relatively high abundance o f mullids collected at Gl 94 (only one individual was collected at GC 18),
particularly Upeneusparvus, a common species on the mid-to-inner shelf (Hoese and Moore 1977).
Lutjanids were also relatively common at this site, with Rhomboplites aurorubens the dominant species,
followed by Lutjanus spp. While Pristipomoides aquilonaris was the primary lutjanid collected at the
outer shelf site, none were collected at the mid-shelf site. With regards to serranids. the dominant group
was serraniines (e.g.. Diplectrum spp., Centropristis spp., and Serranus spp.), while relatively few
anthiines were collected.
Larval and Juvenile Fish Collected at the Inner Shelf Platform (ST 54)
A total o f97.697 fish were collected at the inner shelf platform (ST 54). Light-traps collected
6.116 fish and plankton nets collected 91,583 fish (Table 2.5). Due to problems with the deploying the
subsurface net at this site (Table 2.2). the plankton net catch is almost exclusively from the surface. The
plankton nets collected fish from 34 families, eight o f which were not present in light-trap collections.
Light-traps also collected fish from a total o f 34 families, eight o f which were not collected with plankton
nets. The plankton nets caught fish from 59 taxa (identified at least to genus), 19 o f which were not in
47
Reproduced with permission of the copyright owner. Further reproduction prohibited without permission.

Reproduced
with perm
ission of the
copyright ow
ner. Further
reproduction prohibited
without
permission.
Table 2.5. Total plankton net density (fish/100 mJ) and light-trap CIMJE (fish/10 min) for fish collected at South Timbalier 54 with standard error (SE), rank, percent o f total catch (%), and months collected for each taxa. (N) indicates taxa collected only with plankton nets. (L) indicates taxa collected only with light-traps. Eor ranks, tied values received the mean o f the corresponding ranks, j indicates a value <1.00%._____________
Taxa Months Collected SurfaceNet
VVIIVdpUIIUIII^ 1 UltrXJ.
BottomNet
Bottoml.ight-trap
Surfacel.ight-trap
O(f-platfomtl.ight-trap
Density (SI!) Kank (%)
Density (SI!) Kank (%)
CPUI! (SI!) Kank (%)
CT’Uli (SI!) Kank (%)
CPUI! (SI!) Kank (%)
OsleichlhycsUnidentified Apr, May 3.93 (3 66) 0 (0 ) 0 (0 ) 0 50(0.50) 0 (0 )
12; 6(1 20)Albulifomtcs
AlbulidacA1 hula vuI/h-s (1.) Apr 0(0 ) 0 (0 ) 0 (0 ) 0 01 (0.01) 0(0)(bonefish) 4 2 ;
AnguilliformcsUnidentified Jun 0(0 ) 0 (0 ) 0 (0 ) 0(0 ) 0.02 (0.02)(eel) 50 ;Muracnidac
Unidentified (1.) Jun 0 43(0 41) 0 (0 ) 0 (0 ) 0(0) 0 02 (0 02)(moray cel) 40 ; 5 0 ;
OphichthidacUnidentified Apr, May, Jun 0.20(0 18) 0(0 ) 0 (0 ) <0.01 (0 01) 0.02 (0.02)(snake cel) 52 ; 5 0 ; 5 0 ;
ClupeiformesUnidentified (N) May 1 92(1 92) 0 (0 ) 0 (0 ) 0 (0) 0(0 )(herring/anchovy) n ;Clupcidac
Hrevoorlia palramis ( 1.) Apr 0(0 ) 0 (0 ) 0 (0) 0 (0) 0 02 (0 02)(gulf menhaden) 5 0 ;Etrumeus teres (N) Apr 0 0 4 (0 03) 0 (0) 0 (0 ) 0(0) 0(0 )(round herring) 6 8 ;llarengula jaguana Apr. May. Jun, Jul 1 27(0 50) 0 (0 ) 0 (0 ) 0 56(0 17) 0 55 (0 22)(sealed sardine) 2 4 ; 5(1 29) 8(1.43)Optslhonema oglmum Apr, May, Jun, Jul 3689 84(1964 23) 0(0 ) 0 35(0 14) 23 26 (9 41) 25.53 (7.93)(Atlantic thread herring) 1 (96 56) 3(7 05) 1 (54 60) 1 (66 71)Sard me Ha aurila Apr 0 03 (0 03) 0 (0 ) 0 (0 ) 0(0 ) 0 02 (0.02)(Spanish sardine) 74 ; so;
tingraulidacUnidentified Apr, May, Jun, Jul 146 75(39 541 10 73(7 58) 0 13(0 06) 1 13(0 53) 0 90 (0 20)(anchovy) 2(1 49) 2(46 38) 5 (2.90) 4 (2 71) 4 (2 36)Anchoa spp May 0 61 (0 61) 0 (0 ) 0 (0 ) 0(0) 0(0)(anchovy spp.) 31 ;

Reproduced
with perm
ission of the
copyright ow
ner. Further
reproduction prohibited
without
permission.
Table 2.5. (continued)
Taxa Months Collected Surface Ifoltoni liottom Surface Off-piaifomtNet Net l.ight-trap l.ight-trap l.ight-trap
IX'nsity (Sli) Density (Sli) CPUI: (Sli) C’Plti; (Sli) CPUli (Sli)Kank (%) Kank (%) Kank (%) Kank (%) Kank (%)
Anchoa hepsctus (1.) Jun 0(0 ) 0 (0 ) 0(0) 0 01 (0.01) 0(0 )(striped anchovy) 42 iAnchoa milchilh Apr, Muy, Jun, Jul 423(1 61) 0(0 ) 0 04(0 03) 0 38(0 13) 0 31 (0 17)(bay anchovy) I l f I3 J » : H iAnchoa nasuta (1.) May, Jun 0 (0) 0 (0) 0(0) 0 06 (0.04) 0 02 (0.03)(Inngnosc anchovy) 21 : 3 3 fAnchoa nasuta hepsctus Apr, May, Jun, Jul 2 27(0 77) 0(0) 0 57 (0 20) 9 89(3.63) 3.66(1.49)(longnose/striped anchovy) 16* 2(11 62) 2(23 74) 2 (9 57)Anchovwlla /mr/asctaia (N ) Apr 0 02 (0 02) 0 (0 ) 0(0) 0 (0 ) 0(0)(Hat anchovy) 77 5 JEngraulis euryslole Apr, May, Jun, Jul 0 22(0 15) 0 (0 ) 0(0) 0 26(0.07) 003 (0 02)(silver anchovy) 4 9 * I I J 33 :
Stnmiiformcs(ionostomalidae
Cyclolhone hrauert (N) Apr 0 10(0 06) 6 0 *
0 (0 ) 0 (0) 0 (0 ) 0(0 )
AulopiformcsSynodontidac
Unidentified (1.) Apr, May 0 (0) 0 (0 ) 0(0 ) 0 01 (0 01) 0.02 (0.02)(lizardfish) •12 * s o :Saurida hrasdtensis (1.) May, Jun 0(0 ) 0 (0 ) 0.04 (003) 0.06 (0 03) 0 08(0.03)(largcscale lizardfish) 9 5(1 24) 21 : 26 5 :Saurida suspicio (1.) May 0(0 ) 0(0) 0(0) 0 (0 ) 002 (0.02)
50 :Synodus foetens Apr, May, Jun 0 21 (0 14) 0 26(0 26) 2 88(1 55) 3 16(1 25) 0 27(0 10)(inshore lizardfish) 5 0 * I I ( I 45) 1 (58 51) 3 (7 60) 12:Synodus poeyi Apr, May 0 23 (0 19) 0(0 ) 0(0) 0 (0 ) 0 02 (0.02)(offshore lizardfish) 48 J s o :
MyctophiformesMyclophidae
Unidentified Apr, Jul 0.24 (0 13) 4 09(3 52) 0(0) 0 (0) 003 (0.2)(lanlcrnfish) 4 7 * 4(4 35) 33 :
(iadifomicsIfrcgmacerolidac
Hregmaccros canton Apr, May 1 85 (0 66) 0 26 (0 26) 0 06(0 03) 0 01 (0 01) 0 10(0 05)(codlcl) 20 J I I (1 45) 9 5(1 24) 4 2 * 24 :

Reproduced
with perm
ission of the
copyright ow
ner. Further
reproduction prohibited
without
permission.
Table 2.5. (continued)
Taxa Months Collected Surface liottom liottom Surface ( XT-platformNet Net l.ight-trap l.ight-trap l.ight-trap
Density (SI-) Density (S f) ciHJt-: (Si-:i a>ui:<si:> CI’IJI-: (SI!)Kank (%) Kank (%) Rank (%) Kank (%) Kank (%)
Ophidiidacl.cpophidium spp. Apr, May 041 (0 41) 0(0 ) 0 (0 ) 0(0) 0.02 (0.02)(cusk-cci spp.) 42 5 } 50 }l.epophidmm staurophor (1.) Apr 0(0) 0 (0 ) 0 (0) 0(0) 0.02 (0.02)
5 0 }Ophidian spp. (N) Apr 0 03 (0 03) 0 (0) 0 (0 ) 0 (0) 0(0)(cusk-cci spp.) 72 JOphidion nocomis se/enops May 3.09(1.77) 0 (0 ) 0 02 (0 02) 0(0) 0 (0)(cusk-cci spp.) 13 J 18.5}Ophidion rohinsi (1.) May 0(0) 0 (0 ) 0 02 (0 02) 0 (0 ) 0(0 )(cusk-cci spp.) 18 5 }Ophidion selenops (1.) May 0(0 ) 0(0 ) 0 02 (0 02) 0.01 (0 01) 0(0 )(mooneye cusk-cci) 18 5 } 4 2 }
liythilidaeUnidentified (N) May 041 (041) 0(0 ) 0 (0 ) 0 (0) 0(0)(brolula) 42.5 }
GobicsociformesGobicsocidac
Gohiesox strumosus Apr, May 0 03 (0 03) 0(0) 0 (0) 0 06(0 04) 0 03 (0.02)(skillctfish) 69.5 } 2 1 } 36 }
AlhcriniformeslixococlidacUnidentified (N) Apr 0 03 (0 03) 0(0) 0 (0) 0 (0) 0(0)(flyingfish) 71 iCypseiurus spp. (N) Apr 0 03 (0 03) 0 (0 ) 0 (0 ) 0(0) 0(0 )(flyingfish spp.) 69.5 J( 'ypselurus cyanopterus (1.) Jun 0(0) 0(0 ) 0 (0) 0 (0) 0.02 (0.02)(margined flyingfish) 50 }( 'ypselurus fitrcatus (1.) May 0(0) 0 (0) 0 (0 ) 0 (0) 0 02(0 02)(spotfin flyingfish) 50}
AtherinidacUnidentified (N) Apr 0 29 (0 20) 0 (0) 0 (0 ) 0 (0 ) 0(0)(silversidc) 45 JMemhras morlinica (1.) Jun 0(0 ) 0(0) 0 (0 ) 0 02 (0 02) 0(0)(rough silversidc) 32 }
Gastcrosteifonncs

Reproduced
with perm
ission of the
copyright ow
ner. Further
reproduction prohibited
without
permission.
Table 2.5. (continued)
Taxa Months Collected SurfaceNet
bottomNet
bottoml.ight-lrap
Surfacel.ight-lrap
OIT-plalfurml.ight-trap
Density (SI ) Rank (%)
Density (SC) Kank (%)
CIHII: (SC) Kank (%)
CPUI: (SC) Kank (%)
CPUC (SC) Kank (%)
SyngnathidacSyngnalhus spp. (N) Apr 0 03 (0 03) 0(0) 0 (0) 0 (0) 0 (0)(pipefish spp.) 74 *Syngnalhus Immiana (N) Apr 0 02 (0 02) 0 (0) 0 (0) 0 (0 ) 0(0 )(chain pipefish) 80 5 t
ScorpaenifnrmcsScorpacnidaeScorpaena spp. Apr, Jun 0(0 ) 0 26(0 26) 0 (0 ) 0 02(0.02) 0 02 (0 02)(scorpionfish spp.) I I (1 45) 3 2 : so :
TriglidacI'rionoius spp. Apr 0 58(0 26) 0 (0) 0 (0) 0 01 (0 01) 0 02 (0 02)(scarobin spp.) 3 6 : 4 2 : so :
PcrcifurmcsIJnidcnlificd Apr, May, Jun, Jul 10 47(3.57) 14 29(14 29) 0(0 ) 0 02(0.02) 0 16(0 07)
<•: 1 (10 14) 32 : 17 5 :Scrranidae
Unidentified (N) Apr 0 06 (0 06) 0 (0 ) 0(0 ) 0 (0) 0(0)(seabass/grouper) 6 5 :Cpinephelinae (N) Apr 0 03 (0 03) 0(0) 0(0 ) 0(0 ) 0 (0)(grouper) 7 4 :Serraninae Apr, May 0 34(0 24) 0 (0 ) 0 (0 ) 0 01 (0.01) 0(0 )(scabass) 4 4 : 4 2 :
PriacanthidacI'riacanlhus spp (1.) May 0(0) 0(0) 0(0) 0(0) 0 02 (0.02)(bigcye spp ) 50 :
CarangidaeUnidentified (N) Apr, Jun 0 43 (0.28) 0(0) 0(0) 0(0) 0(0)(jack) 41 :Caranx crysos (1.) May. Jun, Jul 0(0) 0(0) 002 (0 02) 0 05 (0 03) 0 24 (0 08)(blue runner) 23 5 : 19 : 14 :Caranx hippos'talus May, Jun, Jul 2.70(2 44) 0(0) 0(0) 0 04(0 02) 0.61 (0.25)(crevallc/horsc-cyc jack) m : 26 5 : 6(1 60)Chloroscombrus chrysurus May. Jun, Jul 3000(11 03) 0(0) 0 02 (0 02) 0 09(0 04) 0 I I (0.06)(Atlantic bumper) •«: 18 5 : n : 22 :Decapterus puncialus Apr, May, Jun 0 02(0 02) 0(0) 0(0) 0 02 (0.02) 0.02 (0 02)(round scad) . . . . 77 5 : . . . . 3 2 f 501
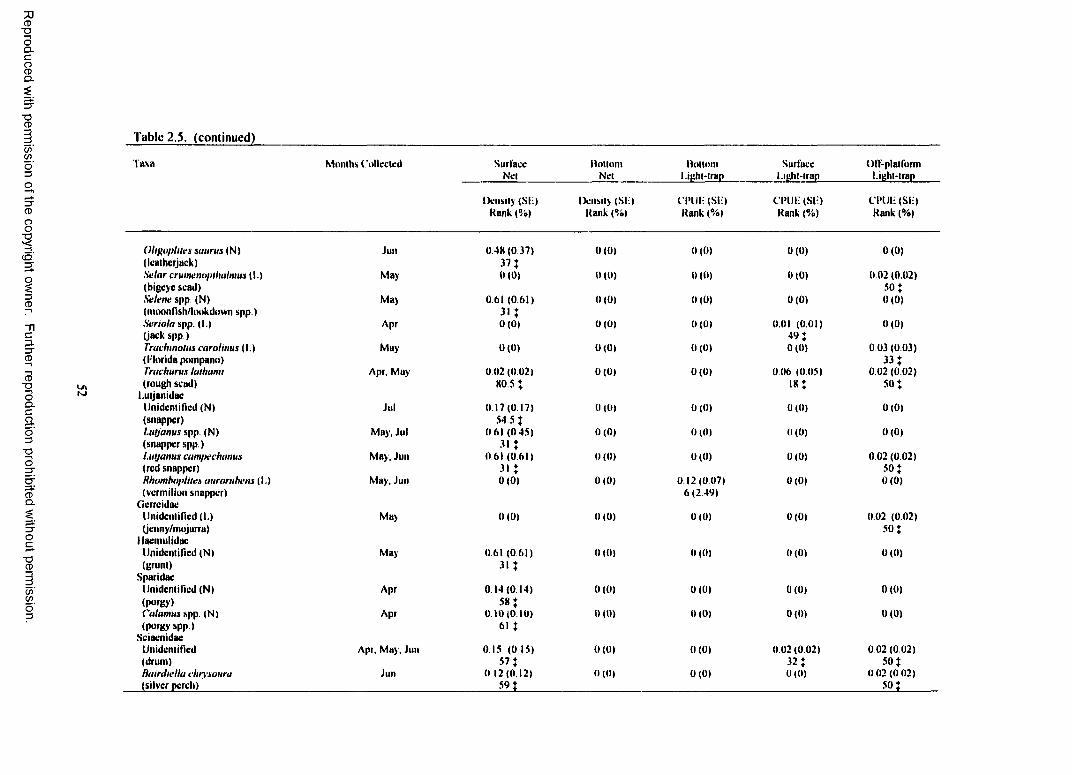
Reproduced
with perm
ission of the
copyright ow
ner. Further
reproduction prohibited
without
permission.
Table 2.5. (continued)
Taxa Months Collected SurfaceNet
DnllnmNet
Uolloml.ight-trap
Surfacel.ight-lrap
OIT-plalforml.ight-lrap
Density (Sli) Kank (%)
Density (Sli) Kank (%)
CPUI; (Sli) Kank (%)
CT'lJi; (Sli) Kank (%)
CPUli (Sli) Kank (%)
OUgophles saurus (N) Jun 0 48(0 37) 0 (0 ) 0 (0 ) 0 (0) 0 (0 )(Icuthcrjack) 37 JSutar crumenoplliulmus (1.) May 0 (0 ) 0 (0 ) 0 (0 ) 0 (0) 0 02 (0.02)(bigeyc scad) 50 :Selene spp. (N) May 0 61 (0 61) 0 (0 ) 0 (0) 0 (0 ) 0(0 )(moonftsh/hrokdmvn spp.) 31 5Seriola spp. (1.) Apr 0 (0 ) 0 (0 ) 0(0 ) 0.01 (0.01) 0(0)(jack spp.) 4 9 :Trachmotus carol lints (1.) May 0 (0 ) 0 (0 ) 0 (0 ) 0(0) 0 03(0.03)( l;lorida pompano) 33 :Trachurus lalhami Apr, May 0 02 (0 02) 0 (0 ) 0 (0 ) 006 (005) 0.02(0.02)(rough scad) 80 5 i i « : 50 :
l.uljanidacUnidentified (N) Jul 0 17(0 17) 0 (0) 0 (0) 0(0 ) 0(0 )(snapper) 54.5 Jl.u(/anus spp. (N) May, Jul 0 61 (0 45) 0 (0 ) 0 (0) 0(0) 0(0 )(snapper spp.) 3 1 *l.uijanus campechamts May, Jun 0 61 (0 61) 0 (0 ) 0 (0) 0(0) 0 02(0.02)(red snapper) 31 t 50 :Rhombophtes anroruhens (1.) May, Jun 0 (0 ) 0 (0 ) 0 12(0 07) 0(0) 0 (0 )(vermilion snapper) 6 (2 49)
GerrcidaeUnidentified (1.) May 0(0) 0 (0 ) 0(0 ) 0(0) 0.02 (0.02)(jenny/mojarra) 50 :
llacmulidacUnidentified (N) May 0 61 (0 61) 0 (0 ) 0 (0 ) 0(0) 0(0 )(grunt) 31 *
SparidacUnidentified (N) Apr 0.14(0.14) 0 (0 ) 0 (0) 0(0) 0 (0)(porgy) 58 fCalamus spp. (N) Apr 0 10(0 10) 0 (0) 0(0 ) 0(0) 0 (0)(porgy spp) 61 f
SciacnidacUnidentified Apr, May, Jun 0.15 (0 15) 0 (0 ) 0 (0 ) 0.02 (0.02) 0 02 (0.02)(drum) 5 7 f 32 : so :Bairdiella chrysoura Jun 0 12(0 12) 0 (0) 0 (0 ) 0(0) 0 02 (0 02)(silver perch) 5 9 : 5 0 *

Table
2.
5.
(con
tinue
d)
5* C .§
~ ~ f -s j: Q u?► s« ri l l i .
a '3*
3 S U ^ft *2 5 m
3 ft 2 •n y .C y» I I8
a i” a- 2
a w
J-i -s.es
« s B a *52 ft c -ft P "*
8-S*3 S & *J .& a *5" r5 <
5 « ft ft = 5 « a ft ;C c»o *" S‘5* 3 **E i - §.§ s | U S’5
ftvS— « U *3 u
^ "ft X *-? 3 ft* “ v •s' | 1 * s f i i *-i5 ^ 5 5 5 5 * -5 ,
Si| s i -5>>-B'
E = I E
* s
-1 -t : 2 2i -e c“C C. C. e»c*r S- « —
a l li 5 =
_ e > s f t u eill ~ s g : M
53
Reproduced with permission of the copyright owner. Further reproduction prohibited without permission.

Table
2.
5.
(con
tinue
d)5 C.
* Z
~ c s' a r - as
sr̂ «* r - as
s -a —« c S T * « r - as
sI *
r» £■ ©* £* r j 30
® — © — ® © «r.* « * £ g ® o 01 = » = =
o o s—' fN —'rs —
o — -r r-
o o ©o o s £ ,
S 'S »r.“ * O
o o o S O S
©o
r-
d £ , © k VC
©r i s; *r. © —
ae
5e.<
>% >v
te- - 2
, -e 5: >» bK n» «» : ? *33
e § i 'o ** * ■
• I Ij= "§ »
3 «■s 5 -c1 1 1 S S V w ^ i** ? mt? ■* 9© y J3 a
©
o
— S O rs♦♦ <© r* rs ow-. © ++S ♦♦ ci
c.<
«* w
r-rs
nC ' ©
- ae '-*■ rs —
© ^ O' **. © ^
a « bfi.8 M
5 & 3 3I r S *
©
o
o d 1
© ♦ + © ♦ + o— m —•» n * n ©
2£.<
I I 8 §
r** r-» _L «/-. ae_ — -TrsO — — ^s © ■ * " * ■ © « © ♦ ♦ © — o— -- rn '—' rs w' *T —" rs '—'S © — ae — © r4 — - S
rs © m — « irt
r-© rn © f***. ac — "T *T O
rs r~i_ _ S * * 0© © d ^ d
® = 2 ^ 3
rs S ^ © - S r i ©
C.<
VI «* ,ZiS tfl
S.J8
♦ ♦ o <■**, —
s s •r*. - r o
O fn ̂ rs ♦♦— ae — s — ~r- O — s•f; fn «rvS «/% d
c.<
5 3! »a
a -S = S « C<=-S£ 5o .a * 5 '
s a s 3 a s1 ? i-Mll
' £ < * —
t & a i § 3 a »■ s ? - -I £
"5 a U .p U a 00 5 3 5 ^ = 5 = S O 5 •"? :*s. d < “ >i o-
•55
I si e
aj . >a. :; h
K “> — 00
3 — + +
£.<
v o» « a ^e c | 5I i i g
v.
54
Reproduced with permission of the copyright owner. Further reproduction prohibited without permission.

Reproduced
with perm
ission of the
copyright ow
ner. Further
reproduction prohibited
without
permission.
Tabic 2.5. (continued)
Taxa Months Collected SurfaceNet
llottontNet
Dutlonil.ight-trap
Surfacel.ight-trap
OIT-platfomtl.ight-trap
Density (Sli) Rank <%)
Density (Sli) Rank (%)
C'lHJli (Sli) Rank (%)
C'lHJli (Sli) Rank <%)
C'lHJli (Sli) Rank (%)
1‘eprilus burn Apr, May 1 65 (1 23) 0 (0 ) 0.02 (0.02) 0.14(0.05) 0.13(0.05)(gulf huttcrfish) 2 1 } 18.5 J ■4* 20.5 JPeprilus alepulotus Apr, May, Jul 1 92(0 77) 0 (0 ) 0 04(0 03) 0 04 (0 02) 0 1 5 (0 06)(harvcstfish) 18 J 13 t 26.5 J 19}
I’lcuroneciiformesDothidae
Unidentified (N) May OKI (OKI) 0 (0 ) 0 (0 ) 0 (0 ) 0 (0 )(leltcyc llounder) 2 6 }( 'nhanchthys sptlopierus Apr, May, Jun 0 21 (0 13) 0 (0 ) 0 (0 ) 0(0 ) 0.05 (0.04)(bay whilT) 51 } 29.5}( 'yclopsella fim bruua (1.) May 0(0 ) 0 (0 ) 0 (0 ) 0(0 ) 0.02 (0.02)(spotlm llounder) 5 0 }Etropus crosso/us Apr, May, Jun 7 59(2.94) 0 89(0 89) 0(0 ) 0 05 (0 02) 0.13(0 06)(fringed llounder) 8 } 7(1.45) 24 J 20.5 }Syucium spp (1.) May 0.6! (0 61) 0 (0 ) 0 (0 ) 0 (0 ) 0 (0)(llounder spp.) 31 J
Solcidacllnidenlified Jun. Jul 0 06(0 06) 0 (0 ) 0 02(0 02) 0(0 ) 0 (0 )(sole) 63 5 } 18.5 JAchirus lineaius Apr, May, Jul 0 16(0 10) 0(0 ) 0(0) 0 02(0 02) 0 (0 )(lined sole) 56 } 32 J(iymnaihirus spp. (N) May 0.09(0 09) 0 (0 ) 0 (0 ) 0(0 ) 0 (0)(sole spp.) 6 2 }Tnnectes ntaculalus (N) Apr, May 0 70(0 42) 0(0 ) 0(0) 0(0) 0 (0 )(liogchokcr) 27 JSymphums spp. Apr, May, Jun, Jul 8 84(3 84) 0(0 ) 0 (0 ) 0 01 (0 01) 0.06(0.04)(tongucfish spp.) 7 } 42 i
90
rH
TctraodontiformesTetraodontidacSphoeroitles spp. Apr, Muy, Jun 0 06 (0 06) 0 (0) 0 (0) 0.05 (0 03) 021 (0 12)(puller spp.) 63 5 J 24 * 16}Sphoerouies porviu (1.) Apr 0(0) 0 (0 ) 0 (0) 0 01 (0 01) 0(0 )(least puller) 42 J

light-trap samples. Light-traps caught fish from 65 taxa, 27 o f which were not in plankton net
collections.
At the inner shelf platform, clupeiform fishes (mostly clupeids) overwhelmed the plankton net
and light-trap collections, and comprised 97% o f the total catch (all gears combined). The dominant
clupeid was Opisthonema oglinum, which alone comprised 94% o f the total catch. Harengula jaguana,
though present at the mid-shelf site (Gl 94), were more prominent at the inner shelf platform. This trend
o f increasing dominance o f clupeiform fishes continued as sampling efforts moved inshore. In general, it
is difficult to discuss the abundances o f the other taxa except in very relative terms, since no families o f
fishes (with the exception o f clupeids and engraulids) comprised over 1% o f the total catch. Among
pelagic fishes, the reef-associated carangids and scombrids were relatively abundant, particularly Caranx
hippos/latus, Euthynnvs allelteratus, and Scomberomorus maculatus.
Similar to the mid-shelf platform (Gl 94), the second most abundant group o f fishes at the inner
shelf site was composed o f demersal species. However, unlike Gl 94 where synodontids dominated,
sciaenids were the most dominant family, primarily Cynoscion arenarius. which was collected
throughout the sampling season. Not only did the number o f sciaenids increase, but the number o f their
taxa increased as well, from three at the mid-shelf site to five at the inner shelf site. Cynoscion arenarius
dominated the plankton net catches, but synodontids, primarily Synodus foetens, dominated the light-trap
collections. Synodontids were not as prominent at the inner shelf site as they were at the mid-shelf
platform, and the number o f taxa decreased from seven to four. Other demersal taxa collected included
unidentified myctophiforms. Trichiurus lepturus, Symphurus spp., and Etropus crossotus.
The most abundant reef/structure-associated fishes were blenniids and gobiids. Unlike Gl 94.
Parablennius marmoreus was relatively uncommon. The dominant species at ST 54 were
Scartella/Hypleurochilus spp.. Hypsoblennius hentz/ionthas. and H. invemar. Difficulties in
identification prevent us from confidently separating H. hent: from H. ionthas and Scartella spp. from
Hypleurochilus spp. but all o f these taxa are common in nearshore areas and hard-bottomed habitats, such
as oyster reefs and pilings (Hoese and Moore 1977). In general at the inner shelf platform, reef fish,
although not abundant were relatively well represented in terms o f number o f taxa rivaling that o f the
mid-shelf site. However, other than blenniids and gobiids. abundances o f other reef fish were very low
56
Reproduced with permission of the copyright owner. Further reproduction prohibited without permission.

(less than a total o f 10 individuals collected per taxa) but included Rhomboplites aurorubens and
unidentified pomacentrids, serranids, and ephippids.
Larval and Juvenile Fish Collected at the Belle Pass Jetties
At the jetties (Belle Pass), the light-trap and pushnet collected 17,949 fish and 111,854 fish,
respectively. Catches by both gear types were dominated by clupeiform fishes that comprised 95.3% o f
the light-trap total catch and 68.3% o f the total pushnet catch (Table 2.6). The pushnet collected fish
from 41 families with 85 taxa identifiable to at least genus. The jetties, though different in its structural
complexity, vertical height, and hydrodynamics shared at least one similarity with the platforms in that it
was also dominated by clupeiform fishes (74% o f total catch). The taxonomic composition o f this group
was different, however, in that engraulids, particularly Anchoa mitchilli, dominated catches. The trend
o f increasing numbers o f Harengula jaguana and Brevoortia patronus as the sampling sites moved
progressively inshore continued as well. Overall, the light-trap collected fish from 21 families with 42
taxa identifiable to at least the genus level. Only one non-clupeiform species, Membras martinica.
comprised over 1% of the total light-trap catch. The pushnet collected fish from 20 families and 44 taxa
unique to this gear type. A ll families and all but three taxa that were sampled with the light-trap were
also collected by the pushnet.
By far the most dominant demersal species was Cynoscion arenarius. and in general, the
number o f sciaenid taxa increased from the platform sites. Bairdiella chrysoura was also relatively
common. Micropogonias undulatus. Sciaenops ocellatus. Pogonias chromis. and C. nebuiosus were all
collected as well, none o f which were collected at the inner and mid-shelf platforms, although some M.
undulatus and S. ocellatus were collected at the outer shelf. The jetty site also commonly had the
predominantly estuarine species, Gobiesox stromosus. The ophichthid eels were most abundant at Belle
Pass where they were also the most speciose taxonomic group, with Myrophis punctatus being the
dominant species. The flatfish Citharichthys spp. and Symphurus spp. were also very common.
The reef/structure-associated fish group was dominated by small, estuarine/coastal species,
primarily Gobiosoma bosc. which comprised 75% o f the gobiids collected. The second most abundant
gobiid was Gobionellus oceanicus (formerly Gobionellus hastatus) which comprised 14% o f the total
catch. Other common gobiid taxa were Microgobius spp. and Gobiosoma spp. Based on the dominance
57
Reproduced with permission of the copyright owner. Further reproduction prohibited without permission.

Table 2.6. Total mean light-trap CPUE (fish/10 min) and pushnet density (fish/100 m3) for fish collected at Belle Pass with standard error (SE), rank, percent o f total catch (%), and months collected for each taxa. For ranks, tied values received the mean o f the corresponding ranks, j indicates a value <1.00%.
Taxa Months Collected Light-trap CPUE (SE) Rank (%)
Pushnet Density (SE)
Rank (%)
OsteichthycsUnidentified Apr. May. Jun. Jul. Aug 0.14(0.06) 1.23 (0.65)
17: 20 :ElopiformesElopidae
Elops saurus Apr, May. Jun. Jul. Aug <0.01 (<0.01) 0.2210.06)(lady fish) 4 8 : 3 6 :Megalops atlanttcus Aug 0(0) 0.03(0.01)(tarpon) 60 :
AnguillifonnesUnidentified Apr. May. Jun. Jul. Aug <0.0l(<0.0l) 0.17(0 08)(eel) 48: 41:
OphichthidaeUnidentified Apr. May. Jun 0.03(002) 0.03(0.03)(snake eel) 31: 57:Bascanichihys spp. Jun. Jul. Aug 0(0) 0.13(0 03)(sooty/whip eel spp.) 44:Myrophis punctatus Apr. May. Jun. Jul 004(002) 0 64(0.31)(speckled worm eel) 28: 27:Ophichlhus gomest Jul 0(0) 0.15(0.07)(shrimp eel) 42:Ophichlhus metanoporus Aug 0(0) <0.01 (<0.01)(blackpored eel) 82:
CongridaeParaconger caudihmbatus Jun 0(0) <0.01(<0 01)(margintail conger) 82:
ClupeiformcsUnidentified May. Jun. Jul. Aug 0.0l(<0.0l) 10.85(3.88)(herring/anchovy) ■»: 5(2.05)Clupcidae
Unidentified Apr. May. Aug 0.07(0.04) 2.48(1.42)(herring) 22* 13:Brevoortia spp. Apr. Aug 0.15(0*08) 2.77(2.09)(menhaden spp.) 16: n :Brevoortia pa ir onus Apr. May. Jun. Jul. Aug 0.04(0.03) 0.60(0.37)(gulf menhaden) 27: 29:Harengula jaguana May. Jun. July. Aug 1 12(0.36) 0.53(0.10)(scaled sardine) 4: 30:Opisthonema oghnum May. Jun. July. Aug 0.28(0.12) 0 40(0.10)(Atlantic thread herring) n : 32:
EngraulidaeUnidentified Apr. May. Jun. Jul. Aug 16.33(7 07) 138.43(21 12)(anchovy) 2(13.47) 2(27 74)Anchoa hepsetus Apr. May. Jun. Jul. Aug 0.73(0.24) 1.30(0 50)(striped anchovy) K is :Anchoa mitchilh Apr. May. Jun. Jul. Aug 95.80(37.97) 153 25(33.48)(bay anchovy) 1(79.07) 1(38.23)Anchoa nasuta May. Jun. Jul. Aug 0.24(0.08) 0 18(0.06)(longnose anchovy) u : 382Anchoa nasuta hepsetus Apr. May. Jun. Jul. Aug 0.64(0.22) 1.90(0.45)(longnose/striped anchovy) 7: is :
SiluriformesAriidaeAnus felts May. Jul 0(0) 0.09(0.06)(hardhead catfish) 48:Bagre mannus Jul. Aug 0(0) 0.10(0.08)(gafRopsail catfish) 46:
58
Reproduced with permission of the copyright owner. Further reproduction prohibited without permission.

Table 2.6. (continued)
Taxa Months Collected Light-trap CPUE (SE) Rank (%)
Pushnet Density (SE)
Rank (%)
AulopitbrmesSynodontidac
Unideniifled May 0(0) 0 .0 1 (0 .0 1 )(lizardfishl 88:Synodus spp. Apr. May 0(0) 0.02(0.02)(lizardfish spp.) 6 i :Synodus faetens Apr. May. Jun. Jul. Aug 0.15(0.04) 0.93(0.14)(inshore lizardfishl 15t 23:
ParalcpidaeParalepts atlanlica Apr 0(0 ) <0.01 (<0.01)(duckbill barracudina) 90:
Cadi formesOphidiidae
Unidentified Apr 0(0) <0.01(<0.0l)(cuskeel) 89:Lepophtdium spp. Jun 0(0 ) <0.01(0.01)(cusk-eel spp.) 108:
GobiesociformesGobiesocidae
Gobiesox strumosus Apr. May. Jun. Jul. Aug 0.47(0.13) 1.55(0.25)(skillet fish) io: 16:
AthcrinifonnesExocoetidae
Unidentified May. Jun 0(0 ) 0.01(0.01)(flyingftsh) so:Cypsetunu spp. Jun <0.01 (<0.01) 0(0)(living fish spp.) 48:Hyporhamphus untfasctatus May. Jun. Jul. Aug <0.01(0.01) 0.04(0.01)(silverstriped halfbeak) 48: 55:
AtherinidaeUnidentified Apr. May. Jun. Jul. Aug 0(0) 0 18(0.08)(silverside) 40:Membras marttmca Apr. May. Jun, Jul. Aug 1.30(0.56) 098(0.22)(rough silverside) 3(1.09) 21:Memdta berylhna May 0(0) 002(0.02)(inland silverside) 66:
GasierosteiformesSyngnathidae
Hippocampus erectus Jun 0(0) 0 0 1 (0 01)(lined seahorse) 99:Svngnalhus spp. Apr. May. Jun. Jul. Aug <0.01 (<0.01) 0 09(0.03)(pipefish spp.) 48: 49:Syngnathus louisianae Jul 0 (0) <0.01(0 .01)(chain pipefish) m :
Scorpaenif'ormesTriglidae
Pnonotus spp. Jun 0 (0) <0.01(0 0 1 )(searobin spp.) n o :Pnonotus roseus Jul 0 (0) <0.01(0 .01)(bluespotted searobin) io i:Pnonotus trtbulus Jul 0 (0) <0.01(0 .01)(bighead searobin) 94:
PerciformesSerranidac
Epmephehnae Apr 0 (0) <0.01(0 .01)(grouper spp.) 97:
RachycentridaeRachycentron canadum May 0 (0) <0.01(0 .01)(cobia) 86:
59
Reproduced with permission of the copyright owner. Further reproduction prohibited without permission.

Table 2.6. (continued)
Taxa Months Collected Light-trap CPUE (SE) Rank (%)
Pushnet Density (SE)
Rank (%)
CarangidaeUnidentified 0(0 ) 0.02(0.02)(jack) 62;Caranx spp. Aug 0(0 ) 0.64(0.26)(jack spp.) 28;Caranx hippos'latus Jun. Jul, Aug <0.0t(<0.0l) 0.09(0.04)(crevalle/horse-ey e jack) 48? 47;Chloroscombrus chrysurus Jun. Jul, Aug 0.05(0.02) 0.28(0.15)(Atlantic bumper) 23; 35;Ohgoplttes sauna Aug <0.01 (<0.01) 0.02(0.01)(leathetjack) 48; 7 i ;Selene vomer Jul 0 (0 ) <0.01(0.01)(lookdown) 98;Selene setapmms Jul 0(0) <0.01(0.01)(Atlantic moonfish) 104;
LutjanidaeLuljanus griseus Jun. Jul. Aug 0(0) 0.03(0.01)(gray snapper) 59;Luljanus synagns Jul. Aug 0.01(<0.0l) 0.07(0.02)(lane snapper) 38; s i :Luljanus spp. Aug <0.0l(<0.0!) 0(0)(snapper spp.) 48;
GerreidaeUnidentified May. Jun. Aug 0.02(0.01) 0 19(0.07)(jennv/mojarra) 34; 37;Eucmostomus spp. Jun. Aug <001(0 .01) 0.02(0 01)(mojarra/jenny spp.) 48; 70;
HacmulidacUnidentified Jul 0(0 ) <0.01(0.01)(grunt) 102;
Sparidac Apr. MayUnidentified 0(0 ) 0.02(0.01)(porgy) 63;Sparulae Type B May 0(0 ) 0.02(0.01)(porgy spp.) 68;
SciaenidaeUnidentified May. Jun. Jul. Aug 0.02(0.01) 2.54(0.96)(drum) 34; 12;Bairdiella chrysoura Apr. May. Jun. Jul. Aug 0.12(0.08) 3.07(0.73)(silver perch) 19; 10;Cvnoscion arenarius Apr. May. Jun. Jul. Aug 0.59(0.28) 4074(8.02)(sand seatrout) 9 ; 4(7.85)Cynoscton nebulosus Apr. May. Jun. Aug 0.01(0.01) 0.85(0.21)(spotted seatrout) 38; 24;Cynoscton nebulosus arenarius Jul 0(0 ) 0.01(0.01)(spottcd/sand seatrout) 74;Menticirrhus spp. Apr. May. Jul. Aug 0.03(0.01) 0.51(0.09)(kingfish spp.) 29; 3 i ;Menticirrhus americanus. Intoralis Jun. Aug 0(0 ) 0.02(0.01)(gull/northern kingfish) 64;Micropogomas undulatus Apr. Jul 0 (0) 0.04(0.02)(Atlantic croaker) 56;Pogomas cromis May 0.01(0.01) 0.74(0.21)(black drum) 38; 26;Sciaenops ocellatus Aug <0.01(0.01) 1.29(0.59)(red drum) 48; 19;Slelhfer lanceolatus Apr. Jun. Jul 0(0 ) 0.05(0.02)(star drum) 54;
MullidaeUnidentified May 0(0 ) <0.0l(<0.0l)(goatfish) 87;
60
Reproduced with permission of the copyright owner. Further reproduction prohibited without permission.

Table 2.6. (continued)
Taxa Months Collected Light-trap CPUE(SE) Rank (%)
Pushnet Density (SE)
Rank (%)
EphippidaeChaelodipierus faber Jun. Aug 0(0) 0.05(0.02)(Atlantic spadefish) 52:
MugilidaeM ugil cephalus Apr 0(0) <0.01(0.01)(striped mullet) 97:Mugil curerna Apr. May. Jun 0(0) 0.02(<0.0t)(white mullet) 69:
PolyncmidaePolydactylus octonemus Aug 0(0) <0.01 (<0.01)(Atlantic threadfin) 93:
LabridaeUnidentified Apr 0(0) 0.01 (<0.01)(wrasse) 77:
ScaridaeSparaoma spp. Apr 0(0) 0 01(0 .01)(parrotfish spp.) 72:
UranoscopidaeUnidentified Jun 0(0) <0.01(0.01)(stargazer) 92:
BlenniidaeUnidentified May. Jun. Jul. Aug 0.02(0.01) 0.03(0.02)(blenny) 35* 58:Chasmodes spp. Apr 0(0) <0 01(0.01)(striped/Florida blenny) ioo:Hypleurochdus bermudensis Aug 0(0) <0 01(0.01)(barred blenny) 95:Hypsoblenmus spp. Jul 0(0) <0.01(0.01)(blenny spp.) I04 (< l 00)Hypsoblenmus hentz lonihas Apr. May. Jun. Jul. Aug 1.04(0.27) 1.95(10.45)(feather/tessellated blenny) 5: 14:Scanella enstata Apr. May. Jun. Jul. Aug 0.03(0.02) 0.34(008)(molly miller) 31* 33:
EleotridacUnidentified Jun. Jul. Aug 0.01 (<0.01) 0.02(0.01)(sleeper) 38* 67:Eleomdae Type A Jun. Aug <0.01 (<0.01) 0.18(0.06)(sleeper spp.) 48J 39:Dormitator maculatus Apr. May. Jun. Jul. Aug 0.12(0.06) 0.96(0.34)(fat sleeper) 18* 22:
GobiidaeUnidentified Apr. May. Jun. Jul. Aug 0.03(0.01) 0.81(0.23)(goby) 31* 25:Balhygobius soporator Jun. Jul 0(0) 0.01(0.01)(frillfin goby) 76:Evorthodus lyrtcus Cobionellus boleosoma Jun. Jul. Aug 0(0) 0.01(0.01)( lyre goby/darter goby) 78:Gobionellus oceamcus Apr. May. Jun. Jul. Aug 0.11(0.06) 8.82(2.13)(highfin goby) 20: 6(1.97)Gobtosoma spp. Apr. May. Jun. Jul. Aug 0.26(0 18) 1.48(0.43)(goby spp.) 12: 17:Gobtosoma base Apr. May. Jun. Jul. Aug 0 59(0.16) 46.88(7.88)(naked goby) s: 3(10.64)Microgobius spp. May. Jun. Jul. Aug 0.04(0.03) 4.17(1.30)(goby spp.) 26: 9(1.05)
MicrodesmidaeMicrodesmus longipmms Jun. Jul. Aug 0.05(0.02) 0.14(0.04)(pink wormfish) 24: 43:
61
Reproduced with permission of the copyright owner. Further reproduction prohibited without permission.

Table 2.6. (continued)
Txxa Months Collected Light-trap CPUE (SE) Rank (%)
Pushnet Density (SE)
Rank (%)
TrichiuridaeUnidentified May 0(0 ) <0.01 (<0.01)(snake mackerel) 9 i :Trichiurus lepturus Apr. Jul 0(0) 0.01 (<0.01)(Atlantic cutlass fish) 79:
ScombridaeUnidentified May. Jun 0(0) 0.01(0.01)(mackerel) 73:Scomberomorus spp. Aug <0.01 (<0.01) 0(0)(mackera! spp.) 48:Scomberomorus maculatus May. Aug 0(0) <0.01(0.01)(Spanish mackeral)
+ *■00
StromateidaePepritus alepidotus Jun. Jul. Aug 0(0) 0 01(0.01)(harvest fish) 75:Peprtlus burn Apr 0(0) <0.01(0.01)(gulfbutterfish)
•/-)00
PleuronectiformesBothidae
Unidentified Apr. Jun 0(0) 0.02(0 01)(lefteye flounder) 65:Citharichthys spp Apr. May. Jun. Jul. Aug 0.08(0.03) 6.53(1.02)(whiff/sanddab spp.) 21: 7(1.49)Cilharichthys spilopterus Jul 0(0 ) <0.01(0.01)(bay whiff) s i :Etropus crossotus Jul 0(0 ) <0.01(0.01)( fringed flounder) 104:
SoleidaeAchirta 1 meatus Jun 0(0) <0.01(0.01)(lined sole) 84:Trmectes maculatus May. Jun. Jul. Aug 0(0) 0.07(002)(hogchoker) so:
CynoglossidaeSymphurus spp Apr. May. Jun. Jul. Aug 0.05(0.02) 5 66(0 89)(tonguefish spp.) 25: 8(1.27)Symphurus plagiusa Jul 0(0 ) <0.01(0.01)(blackcheek tonguefish) 106:
TetraodontiformesBalistidae
Monacanthus hapidus Jun 0(0) <0.01(0.01)(planehead filefish) no:
TettaodontidaeUnidentified May. Jun 0(0 ) 0.05(0.02)(puffer) 53:Sphoeroides spp. Apr. May. Jun. Aug 0.01(0.01) 0.12(0.04)(puffer spp.) 38: 45:Sphoeroides parvus Apr. May. Jun. Jul. Aug 0.17(0.06) 0.34(0.08)(least puffer) 14: 34:
62
Reproduced with permission of the copyright owner. Further reproduction prohibited without permission.

o f estuarine species collected at Belle Pass within this family, it is likely that the individuals in these two
genera are also estuarine forms, even though these genera contain tropical forms as well. Taxa from a
related group, the eleotrids, were also relatively common in jetty samples. Blenniids were also a very
common group, particularly Hypsoblenmus hentzJionthas and Scartella spp. Other reef or structure-
associated fish taxa collected at Belle Pass include labrids, ephippids, scarids. and sparids.
Lutjanus griseus and L. synagris juveniles, though not abundant, were also collected at Belle
Pass. Lutjanus griseus juveniles are more common along the western Gulf and Florida coasts where they
are collected in their preferred habitat, relatively high salinity seagrass beds (Patillo et al. 1997) or
mangroves. However, they have been reported (although less frequently) in association with other
structures, such as pilings, jetties and rocks (Starck 1971). Young L. synagris are also present in coastal
areas (Hoese and Moore 1977).
Overall Taxonomic Richness and Seasonality
A total o f 67 families were represented in the plankton net and light-trap collections from the
three platform sites. The number o f families represented in passive plankton net collections was 45 at GC
18 (outer shelf). 40 at Gl 94 (mid-shelf) and 34 at ST 54 (inner shelf). At the Belle Pass jetties, the
pushnet collected fish from 41 families. The number o f families represented in light-trap collections at
platforms was fairly consistent: 37 at both GC 18 and Gl 94 and 34 at ST 54. At the jenies, the light-trap
collected fish from only 21 families.
In general, trends in seasonality were consistent for taxa collected at the different sites across the
shelf (Ditty et al. 1988). Many groups (e.g., clupeiforms, carangids, and scombrids) were present
throughout the sampling periods for the mid- and inner shelf platforms and the Belle Pass jetties, and
throughout the spring-summer at the outer shelf platform (GC 18). At GC 18, the only site that included
fall and winter sampling, only a few taxa were represented solely during these months, and included
Etremeus teres (January-February), Diplophos taenia (November) and Mugil cephalus (October-
November and January-February), among others.
Reef-dependent and reef-associated fish (Choat and Bellwood. 1991) made up a relatively small
percentage o f the total plankton net and light-trap collections (even with clupeiforms removed from the
total catch) at the three platforms (Table 2.7). A t the outer shelf platform (GC 18). these groups o f fishes
63
Reproduced with permission of the copyright owner. Further reproduction prohibited without permission.

Reproduced
with perm
ission of the
copyright ow
ner. Further
reproduction prohibited
without
permission.
Table 2.7. Total plankton net density (fish/IOOm1), pushnet density (fish/IOOm1), and light-trap CPUE (fish/IO min) for reef-dependent (RD) and reef- associated (RA) families offish collected at each site with standard error (SE). Densities calculated for the platforms include both surface and subsurface samples. CPUEs calculated for the platforms include surface, subsurface, and offplatfonn samples, t indicates a value <0.01.______________________
(ireen Canyon Grand Isle South Timbalicr Belle Pass
Taxa fcology Plankton net l.ight-trap Plankton net l.iglu-trap Plankton net Light-trap Pushnet l.ight-trapdensity (T U I: density CPUE density CPUE density CPUE
(SI-) (SI:) (SE) (SE) (SI:) (SI:) (SI:) (SE)
AnguillifomtcsMuracnidac RA
Unidentified 0 01 0.02 0.25 + 040 0.01(nioray cel) 0 01 0 01 0 12 + 0.38 001
Bcryci formes RA1 lolocentridacflolocenlrus spp. 0.12 006 009 001(squirrelfish spp ) 007 002 004 t
PcrcifurmesScrranidac RA
Unidentified 0.75 0 12 0 05(seabass/groupcr) 0.43 0.07 005Anthinac 043 001 025 +(sea perch) 0.15 0 01 0 12 tfpincphclinac 0.35 + 003 0.01 0.03 t(grouper) 0 16 t 002 t 0.03 tGrammistinac 005
003003002
Serraninac 065 003 0 31 001(sea bass) 0 18 0 01 022 0 01
Priacanlhidac RAUnidentified 0.09 +(bigcyc) 0.06 tI'riacamhm spp. 002 0.01(higcyc/glasscye spp.) 002 0 01
Apogonidac RA 001Unidentified 0 01(cardinalfish)Apogon spp. 0 01(cardinalfish spp.) 001
Kachyccnlridac RARachycemron canadum 008 t(eobia) 0.04 +
Carannidac RA
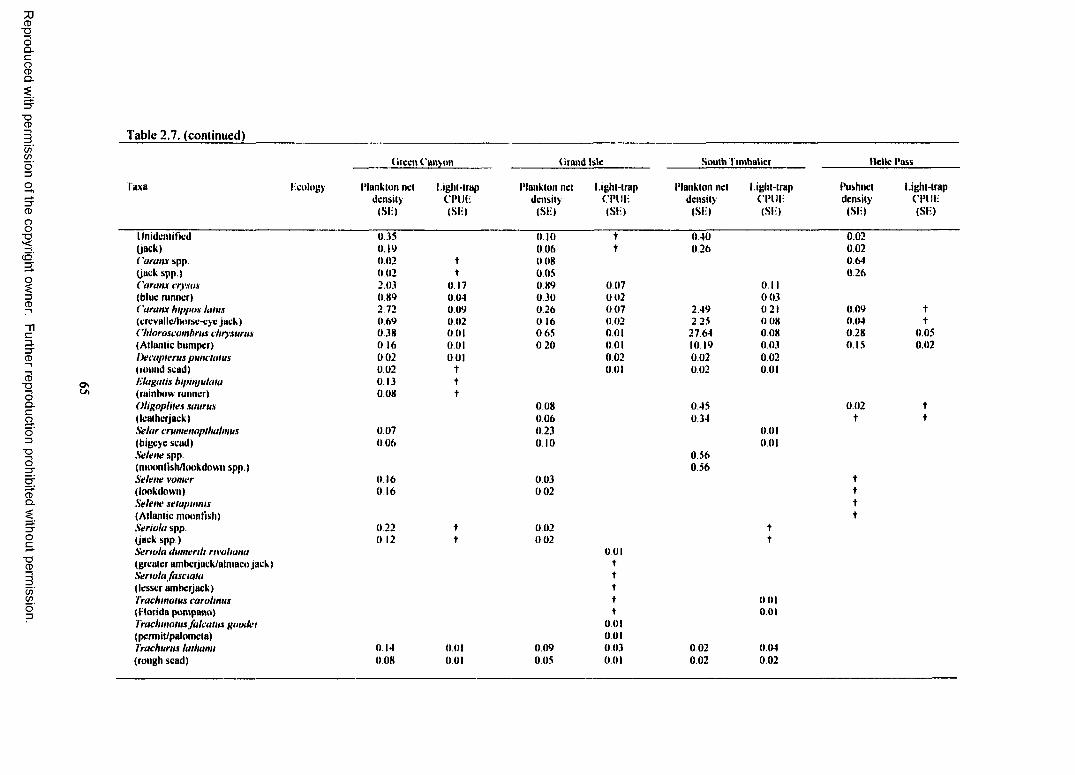
Reproduced
with perm
ission of the
copyright ow
ner. Further
reproduction prohibited
without
permission.
Table 2.1. (continued)
I'uxa Ecology
Circcn Canyon (irond Isle South Timhalicr Hcllc Pass
Plankton net density
(SI-)
l.iglil-lrapc p u i:(SI:)
Plankton net density
(SH)
l.ight-trap CPI 11: (SI i)
Plankton net density
(Si:>
l.ight-trapCPlli:(SI:)
Pushnetdensity
(SI:)
l.ight-trapCPUI:<SH)
Unidentified 035 0.10 + 040 0.02(jack) 0.19 006 t 026 0.02Caranx spp 0 02 + 008 0.64(jack spp.) 002 t 0 05 026Caranx crysos 203 0.17 0 89 007 0.11(blue runner) 089 004 030 002 003Caranx hippo* lalux 2 72 009 026 007 2.49 021 009 +(crcvallc/horsc-cyc jack) 0.69 0.02 0 16 0.02 2 25 008 0.04 tChloroseombriu clnysurus 0.38 0 01 065 001 27 64 008 0.28 0.05(Atlantic bumper) 0 16 001 020 0 01 10 19 003 0.15 0.02l)ecapteriis puntiaius 002 001 002 0.02 0.02(round scad) 0.02 t 001 002 0.01Klagalis b ipw jitlaia 0 13 +(rainbow runner) 008 tOligopliles xaurus 008 045 0.02 t(Icalhcrjack) 006 0.34 + tSe/ar crumenopihalmiis 0 07 0 23 0 01(bigeyc scad) 006 0 10 001Selene spp. 0 56(ntoonlish/lookdown spp.) 0 56Selene vomer 0.16 0.03 +(lookdown) 0 16 002 +Selene seiapmnis +(Atlantic moontish) +Seriola spp. 022 + 002 t(jack spp ) 0 12 t 002 tSeriola dumerih nvoliana 0 01(greater amberjaek/almacojaek) tSeriola fasciaia +(lesser amhcrjack) tTrachmolus carohnus t 0 01(liorida pompano) + 001Traclunolus falcalus goodei 001(pcrmit/palomcia) 0011'rachurtis lalhami 0 14 0 01 009 0 03 002 004(rough scad) 008 001 005 0.01 0.02 0.02
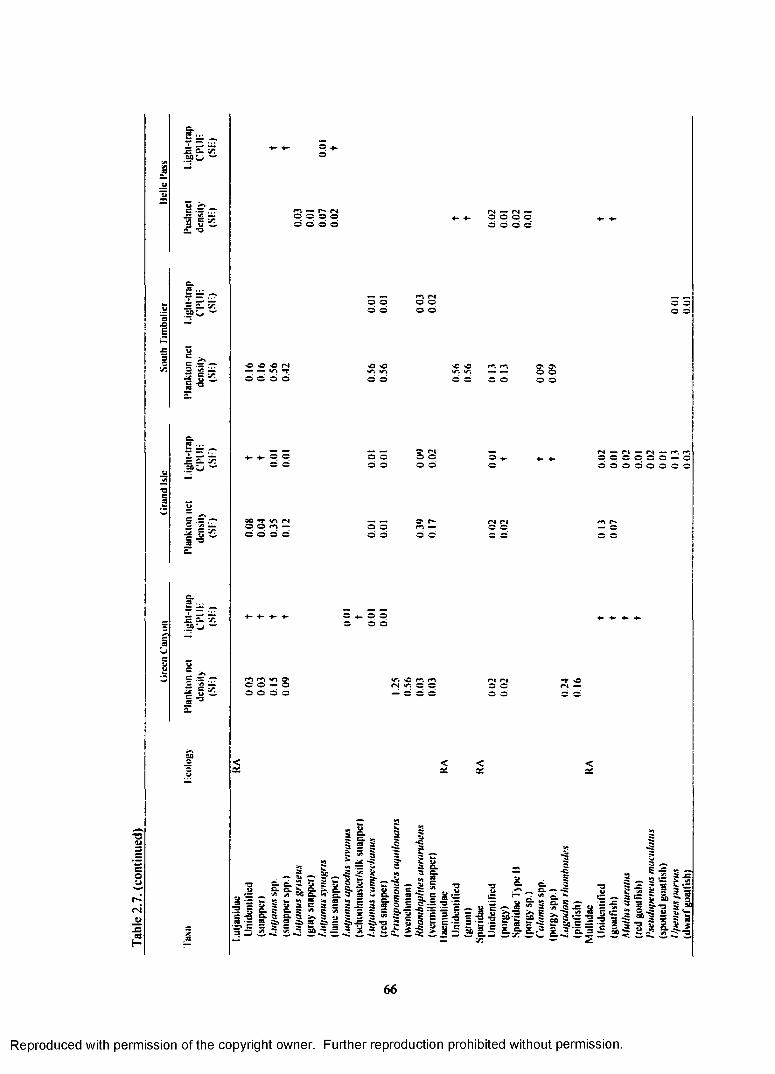
Table
2.
7. (
cont
inue
d)t = ^4 6 -
2 — —*J5 "35 lii tS c v t3 tj ^
5
5 £ i/; 800 —'
= tS -"*•O Ji| 5 i
js a. y; 800 ~
o . o
9 O 9 9
f+\ fS 9 9 O 9
C «C «C (N— — *o *r9 9 9 9
>e •/** •/*, 9 9
S S9 9
+-♦-9 0 9 9
9 9 9 9
9 r- r-> —9 9
9 . 9 9 9 9 9 9 9 9 9
9 9 9 9
<X
< <X
3 £5 & 5 3 § 5? * 3
§ -I
c. <fc,(A OQ
c ?a. w l i
S 3 £
2 5 5 5 = 5x. s& ^ 9»
* 5g*ab
CS
M §■ I8 : 5 !3 g £ c 5 « f 5** 9 2 ~ ____ _____ _ _'2E s = S » 3 ) = = 5 i ! 3 a J ‘
5s £3 9.<* «
«*• ^ f i j *e c f. 9 9
3 — C -■S s -&
■= $>■= a 1 | I I
■ = = — a = — aj ^ a 5: 3 5; gc. S * • —» S’ S I- m ••.3 9 1#
— ft-C 3£ S
* a>£
5 2 2t !u <S> sa S - * 3 a -f s i*9 § 2 2H .■?* S»-5*
66
Reproduced with permission of the copyright owner. Further reproduction prohibited without permission.
94
7
17
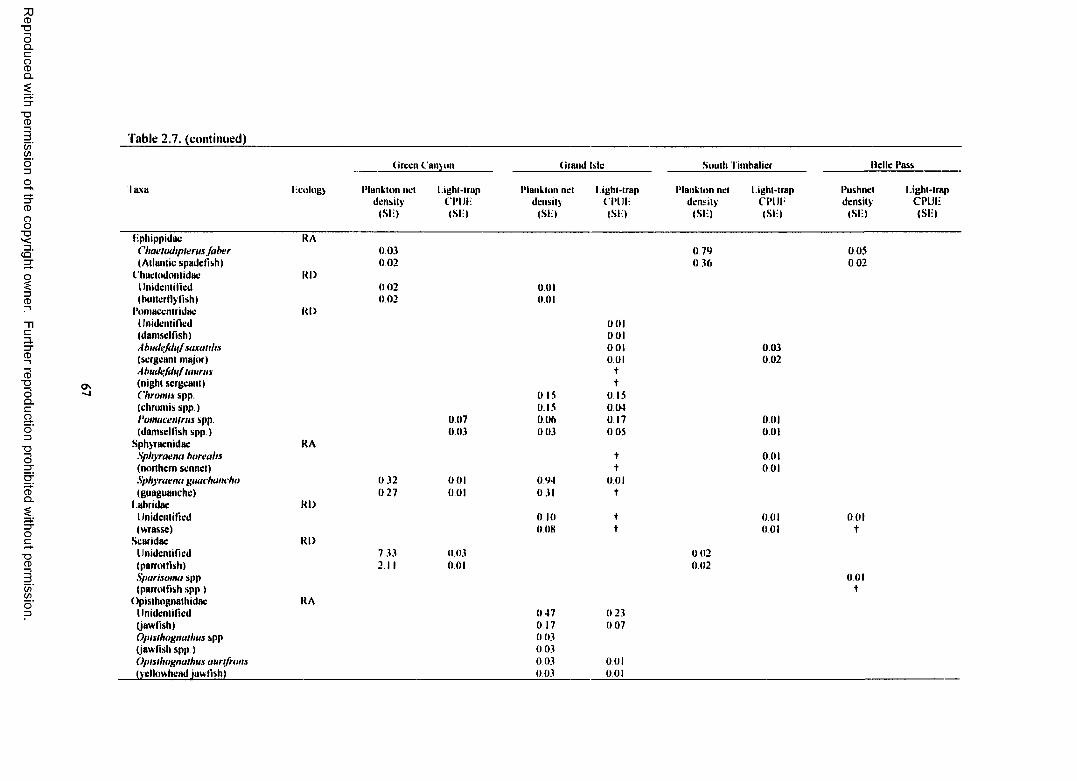
Reproduced
with perm
ission of the
copyright ow
ner. Further
reproduction prohibited
without
permission.
Table 2.1. (continued)
(irccn Canyon (irand Isle South l imhalicr Belle Pass
luxa Icology Plankton net l.ight-trap Plankton net 1 ighl-trap Plankton net l.ight-trap Pushnet l.ight-trapdensity CPUli density C’Plll: density C'PUI- density CPUI:
(SI:) (SI:) (SI:) (SI ) <SH) (Si-:) (SI:) <S1£)
l-'phippitlac RAChaeiodipierus Jaber 003 079 005(Atlantic spadelish) 002 036 002
Chactndontidue Kl)Unidentified 0 02 0 01(buttcrllyfish) 002 0 01
Pomaccnlridue Rl)Unidentified 0 01(damselfish) 001Abudefdnf saxalihs 001 0.03(sergeant major) 0.01 0.02Abudejdpf Iannis t(night sergeant) +C hro im spp. 0 IS 0 15(chromis spp.) 0 15 004I'omaceiitrus spp. 0.07 006 0 17 0.01(damselfish spp) 003 003 005 0 01
Sphyracnidae RASphyraena borealis + 0.01(northern sennet) t 0 01Sphyraena guachancho 032 0 01 0 ‘)d 0 01(guaguanchc) 0 27 0 01 031 +
l.ahridac Rl)Unidentified 0 10 t 0.01 0 01(wrasse) 008 t 0 01 t
Scaridac Rl)Unidentified 7 33 003 002(parrotfish) 2 11 001 002Sparisoina spp 001(parrotfish spp) t
Opisthognathidoc RAUnidentified 047 0 23(jawfish) 0 17 007Oplslhognalhus spp 003(jawlish spp ) 003Opislhognalhus aurf/rons 0 03 0 01(yellowhcad jawfish) 003 001

Reproduced
with perm
ission of the
copyright ow
ner. Further
reproduction prohibited
without
permission.
Table 2.7. (continued)
Taxa licology
tirecn Canyon Grand Isle South Timbalicr Belle I’ass
I'lankton net density
(SI!)
l.ight-trapt'l*lJI:(Si-:)
I’lankton net density
(SI:)
l.ight-trapCl’lli:(SI:)
I’lankton net density
<SH)
l.ight-trapCl’Ui:(SII)
I’ushncldensity
(SID
l.ight-trapCI’IJI:(SID
Opislhognadius lonciiurus 005(moustache jawfish) 005
Ulcnniidae KAUnidentified 1)55 0-0H 302 026 236 0.07 0.03 002(blenny) 034 0 05 205 007 083 002 0.02 0.01( 'hasmodes spp. t(striped/Florida blenny) t1 lypleuorchilus hermudensis t(barred blenny) +Hypsoblenmus spp. t(blenny spp.) tHypsoblenmus henlnionlhas 061 0.16 0.25 1 95 1.04(feather/freckled blenny) 0 19 0 16 008 045 0.27Hypsoblenmus mvemar 003 + 002 3 35 0 56 020(tessellated blenny) 003 t 002 0.64 0 56 0.07Ophioblenmus adnnfwus 044 tltil 022(redlip blenny) 032 + 0 221‘arahlemuus marmoreus 001 301 0.10 001(seaweed blenny) 0 01 040 0 19 0 01Scarlclla cristata 0.34 0.03(molly miller) 008 002SairleUa'Ilyplfurochilus 0 14 042 1 74 028(blenny spp.) 008 008 1 18 0 12
Gobiidac RAUnidentified 6 73 t) 20 8 18 0 00 27 7 0.10 0 81 0.03(goby) 1 75 0 14 006 002 117 003 023 0 01llalhygobius soporulor 0 01(frillfm goby) thvorlhodus lyricus ( iobionellus 0.01boleosomu t
(lyre goby/darter goby)Hollmanma communis t(ragged goby) tGobionellus oceamcus 0 01 +(highfm goby) 0 01 t(iobiosoma spp. 1.48 026(goby spp.) 043 0 18

Reproduced
with perm
ission of the
copyright ow
ner. Further
reproduction prohibited
without
permission.
Table 2.1. (continued)
(ircen Canyon Grand Isle South Timbalicr Belle I'ass
Taxa Icology Plankton nel l.ighl-trap I'lanklon nel l.ight-lrap I'lanklon nel l.ight-trap I'uslincl l.ight-lrapdensity c i’Ui: density ci'Ui: density c i’Ui: density C'PUI:
(Sli) (SI:) (SI:) (S I) (S I) (SI:) (SI:) (Sli)
Gohiosoma hose 4688 059(naked goby) 788 0.16Microgobius spp. 4.17 0.04(gobyspp) 1 30 0.03
Scombridac RAUnidentified 1 -12 001 0.26 005 023 0 01(mackerel) 0 72 001 0 15 003 0 17 tAcanlhocyhium soUmdri 003(wahoo) 0.03Auxis spp. 1 26 0 19 4 00 034 0 09(mackerel spp) 033 005 1 25 0.07 005Huthynnus alletieraius 047 007 4 33 1 29 043 0 51(lililc lunny) 0 17 0 02 0.74 023 025 0 18Katsuwonus pelamis 003 0.03(skipjack luna) 002 0 01Scomber japonicus 0 01(chub mackerel) 0 01Scomberomorus spp. 0 01(mackerel spp.) tScomberomorus cavalla 006 0 02 0 10 0 13 4 97 006(king mackerel) 0.05 001 0.04 004 2 91 002Scomberomorus maculatus 0 51 001 028 0.07 6 05 0.33 t(Spanish mackerel) 0 28 t 0 12 002 1 94 007 tTliunnus spp. 007 001 t(luna spp.) 007 001 tThunnusthynnus O il t(bluefin luna) 007 t
TelraodontiformcsBalistidac RA
Unidentified 0 01 t(Icalhcrjackcl) 001 tMonacanthus luspidus t(planchcad filefish) t

comprised 18% and 32% o f the plankton net and light-trap collections, respectively. Dominant groups
included gobiids, scombrids, and carangids. At the mid-shelf platform (Gl 94), reef-dependent and reef-
associated fishes comprised 10% o f the plankton net catch and 17% o f the light-trap catch. Blenniids
were prominent in both plankton net and light-trap collections, as well as gobiids (plankton nets) and
scombrids ( light-traps). At inner shelf platform (ST54), these fishes comprised less than 1% of the
plankton net collections and only 8% o f the light-trap collections. Carangids (particularly
Chloroscombrus chrysurus), gobiids, and scombrids dominated plankton net collections, while scombrids
and blenniids dominated light-trap collections. At the Belle Pass jetties, reef-dependent and reef-
associated fishes comprised approximately 15% and 2% o f pushnet and light-trap collections. Samples
by both gears were dominated by gobiids and blenniids, particularly Gobiosoma bosc and Hypsoblenmus
hentz/ionthas.
Similarity and Diversity of Larval and Juvenile Fish Assemblages Between Sites
Schoener’s Index o f Similarity values range from 0 (no similarity) to 1 (identical taxonomic
compositions). Similarity values among the sites were relatively low (Table 2.8), with the highest
similarity (0.45) occurring between the mid-shelf site (Gl 94) and the inner shelf site (ST 54). The next
highest value (0.35) was between outer shelf (GC 18) and inner shelf site (ST 54). followed by then mid
shelf site and outer shelf site (0.29). The jetty assemblage was most similar (0.25) to the inner shelf
platform (ST 54) assemblage.
Table 2.8. Schoener’s similarity indices for all sampling sites. Values range from 0-1 (no similarity-identical) and include taxa (at least to the level o f genus) from all gears used at each site. Values represent indices calculated with the most dominant taxa from each site removed. (BP) Belle Pass. (ST)South Timbalier. (Gl) Grand Isle, (GC) Green Canyon._________________
GC 18 Gl 94 ST 54 BP
GC 18 1Gl 94 0.29+ I .ST 54 0.35+ 0.45 1 .BP 0.15+ 0.09 025 1
X indices computed with April-August samples only
70
Reproduced with permission of the copyright owner. Further reproduction prohibited without permission.

Shannon-Weiner diversity results were similar along the transect o f the three platforms and the
jetty. There was no significant difference in the diversity o f the net samples (passive plankton net or
pushnet) among the sites (platforms or jetties; a=0.05; Figure 2.6). The light-trap samples at the outer
shelf (GC 18) had significantly lower mean Shannon-Weiner diversity index values, while the mid-shelf
platform (Gl 94) had significantly higher mean diversity values than the other locations (Tukey's
Studentized Range test, a=0.05; Figure 2.6). The diversity o f light-trap collections at the two more
coastal sites, inner shelf (ST 54) and jetties (Belle Pass), were intermediate and not significantly different
from one another.
Environmental Variables and Larval and Juvenile Fish Abundances
At the outer shelf platform (GC 18), salinity and temperature were the most useful
environmental parameters measured in describing trends in larval and juvenile fish abundances. For
plankton net collections, densities o f Cynoscion arenarius, Scomberomorus maculatus, and Symphurus
spp. were negatively associated with the first environmental canonical variate. which was primarily
influenced by salinity (Table 2.9). Densities o f Auxis spp.. Caranx crysos. C. hippos/latus.
Pristipomoides aquilonaris. and Sciaenops ocellatus were positively associated with the second
environmental canonical variate, which was marginally significant (p=0.068) and primarily influenced by
temperature. Densities o f Citharichthys spilopterus and Mugil cephalus were negatively associated with
the second environmental variate. For the dominant taxa collected with light-traps. six taxa primarily
benthic species such as Saurida brasiliensis, Microdesmus longipinnis, Syacium spp., and Symphurus
spp.. were positively associated with the first environmental variate, which was negatively correlated
with salinity and positively correlated with microzooplankton biomass (Table 2.10). Five taxa
comprised mostly o f pelagic taxa (i.e.. Auxis spp., C. crysos. C. hippos/latus. and Eucinostomus spp.)
were positively associated with the second environmental variate, which was primarily explained by
temperature.
At the mid-shelf platform (Gl 94), temperature contributed substantially to the model in
describing trends in larval and juvenile fish abundances. For plankton net collections, densities o f
Euthynnus alletteratus and Symphurus spp. were positively associated with the first environmental
variate, which was positively correlated with temperature and negatively correlated with salinity, while
71
Reproduced with permission of the copyright owner. Further reproduction prohibited without permission.

0Outer Shelf Mid-Shelf Inner Shelf
Site
Jetties
Light-traps
1.2
1
Outer Shelf Mid-Shelf Inner Shelf Jetties
Site
Plankton nets
Figure 2.6. Mean Shannon-Weiner diversity indices (with standard error bars) for light-trap collections and plankton net (outer, mid- and inner shelf platforms) or pushnet (Belle Pass jetties) collections from each sampling site. The same letter above each bar indicates no significant difference between the sites based on Tukey’s Studentized Range tests (a=0.05). Different letters indicate significant differences.
72
Reproduced with permission of the copyright owner. Further reproduction prohibited without permission.

Table 2.9. Results o f a canonical correlation analysis on log-transformed plankton net densities ( I5 most dominant taxa) and environmental variables for Green Canyon 18. Loadings in bold under statistically significant canonical variates V I and V2 explain at least 13% o f the variation for that taxon. Loadings in bold under the environmental canonical variates W l and W2indicate the most influential environmental variables.
Canonical Correlation Likelihood Ratio Approximate F Pr> F
I 0.750369 0.26739839 2.8134 0.00012 0.502430 0.61197053 1.3766 0.0680
Taxa Correlations between plankton netdensities and their canonical variates
VI V2
Ariomma spp. 0.14 -0.01Auxis spp. 0.09 0.52Bregmaceros cantori 0.17 -0.12Caranx crysos 0.23 0.62Caranx hippos/latus 0.10 0.62Citharichthys spilopterus 0.17 -0.41Cyclothone braueri 0.18 -0.13Cynoscion arenarius -0.70 0.17Lepophidium spp. 0.09 0.03Mugil cephalus 0.21 -0.44Peprilus burti 0.11 -0.20Pristipomoides aquilonaris 0.19 0.48Sciaenops ocellatus 0.06 0.42Scomberomorus maculatus -0.74 0.05Symphurus spp. -0.71 -0.06
Environmental Variables Correlations between environmentalvariables and their canonical variates
Wl W2
Zooplankton Biomass -0.37 0.16Suspended Solids 0.06 -0.28Salinity 0.98 -0.17Temperature -0.51 0.85
Reproduced with permission of the copyright owner. Further reproduction prohibited without permission.

Table 2.10. Results o f a canonical correlation analysis on log-transformed light-trap CPUEs ( 18 most dominant taxa) and environmental variables for Green Canyon 18. Loadings in bold under statistically significant canonical variates V I and V2 explain atleast 15% o f the variation for that taxon. Loadings in bold under the environmental canonical variates W l and W2 indicate the most influential environmental variables.
Canonical Correlation Likelihood Ratio Approximate F Pr > F
1 0.566445 0.50304207 3.1136 0.00012 0.413382 0.74070398 1.8532 0.0004
Taxa Correlations between light-trapCPUEs and their canonical variates
VI V2
Auxis spp. -0.36 0.57Bregmaceros cantori -0.06 -0.02Caranx crysos -0.17 0.65Caranx hippos/latus -0.13 0.40Cyclothone braueri 0.22 0.11Cynoscion arenarius 0.27 0.20Eucinostomus spp. -0.15 0.40Euthynnus alletteratus 0.46 0.34Gobiesox strumosus 0.16 0.05Holocentrus spp. -0.35 0.50Microdesmus longipinnis 0.39 0.19Mugil cephalus -0.12 -0.31Peprilus burti -0.12 -0.04Pomacentrus spp. 0.50 0.24Saurida brasiliensis 0.46 0.22Syacium spp. 0.41 0.25Symphurus spp. 0.53 0.28Trachinocephalus myops -0.21 0.24
Environmental Variables Correlations between environmentalvariables and their canonical variates
Wl W2
Zooplankton Biomass 0.60 0.37Suspended Solids -0.10 -0.29Salinity -0.87 -0.42Temperature 0J7 0.91
74
Reproduced with permission of the copyright owner. Further reproduction prohibited without permission.

Synodus foetens was inversely correlated with this variate (Table 2.11). The second environmental
variate was explained primarily by salinity, and was positively associated with the scombrids Auxis spp.
and E. alletteratus. For dominant taxa collected with light-traps, abundances o f the blenny Parablennius
marmoreus and the lizardfishes S. foetens and S. poeyi were positively associated with the first
environmental variate, which was positively correlated with salinity and negatively correlated with
temperature (Table 2.12). A third lizardfish species, Saurida brasiliensis, and E. alletteratus were
negatively associated with the first environmental variate. Synodus foetens was also negatively
associated with the second environmental variate, which was correlated with low microzooplankton
biomass. The third environmental canonical variate was only marginally significant (p=0.067) and was
positively correlated with microzooplankton biomass. Abundances o f Caranx crysos, Pomacentrus spp.,
S. foetens, and S. poeyi were positively associated with this environmental variate.
At then inner shelf platform (ST 54) the seasonal variables, temperature and salinity, defined the
single significant environmental variate. For plankton net collections, densities o f the pelagic species
Chloroscombrus chrysurus and Scomberomorus maculatus were positively associated with the first
environmental variate. which was marginally significant (p=0.0552) and positively influenced by salinity
and temperature (Table 2.13). Bregmaceros cantori and Etropus crossotus were negatively associated
with the first environmental variate. For light-trap collections, abundances o f the carangids Caranx
crysos and Chloroscombrus chrysurus were positively associated with the first environmental variate.
which was positively correlated with temperature and salinity (Table 2.14). Cynoscion arenarius and S.
maculatus were negatively associated with the first environmental variate. A second environmental
canonical variate was marginally significant (p=0.0708) and was also influenced by salinity. Abundances
o f Cynoscion arenarius were positively associated with the second environmental variate and Saurida
brasiliensis was negatively associated with the second environmental variate.
At the Belle Pass jetties, temperature, and to some extent salinity, were still influential
environmental variables, but turbidity and dissolved oxygen were also important in the models. For
pushnet collections, three common coastal taxa (Dormitator maculatus, Gobiesox strumosus, and
Hypsoblenmus hentdionthas) were negatively associated with the first canonical variate, which was
explained primarily by temperature (Table 2.15). A second environmental variate was positively
75
Reproduced with permission of the copyright owner. Further reproduction prohibited without permission.
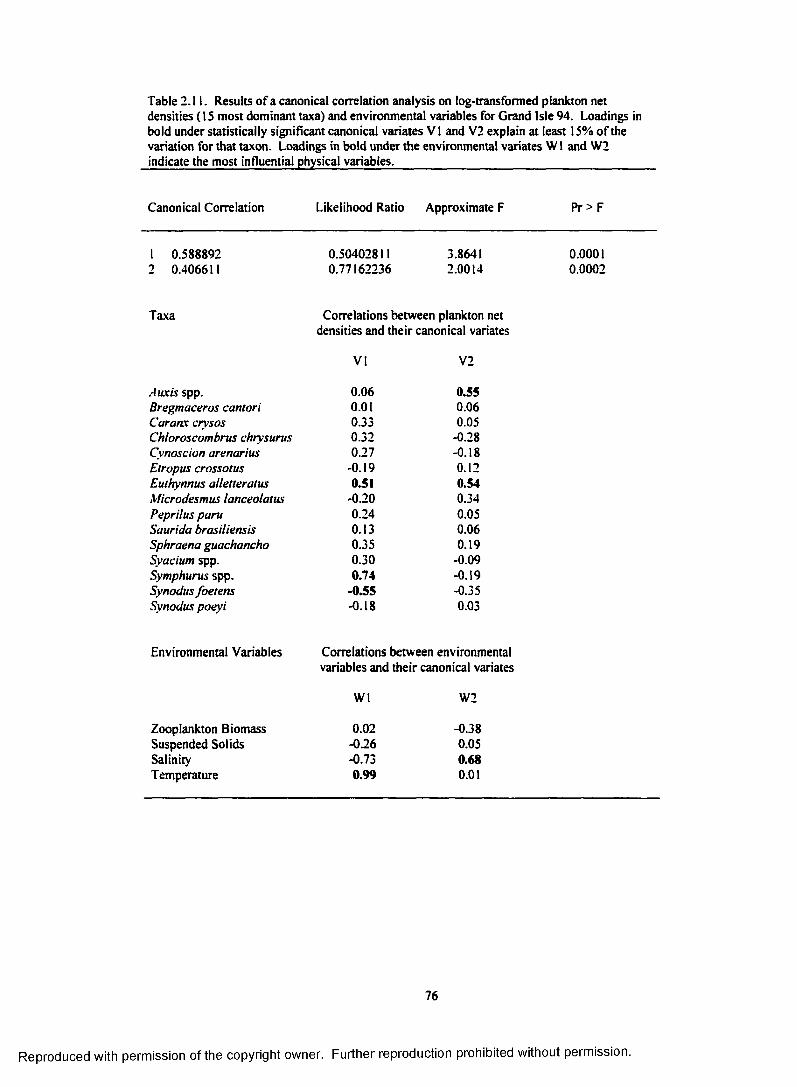
Table 2.11. Results o f a canonical correlation analysis on log-transformed plankton net densities (IS most dominant taxa) and environmental variables for Grand Isle 94. Loadings in bold under statistically significant canonical variates V I and V2 explain at least 15% o f the variation for that taxon. Loadings in bold under the environmental variates W 1 and W2 indicate the most influential physical variables._____________________________________
Canonical Correlation Likelihood Ratio Approximate F Pr > F
1 0.588892 0.50402811 3.8641 0.00012 0.406611 0.77162236 2.0014 0.0002
Taxa Correlations between plankton netdensities and their canonical variates
VI V2
Auxis spp. 0.06 0.55Bregmaceros caruori 0.01 0.06Caranx crysos 0.33 0.05Chloroscombrus chrysurus 0.32 -0.28Cynoscion arenarius 027 -0.18Etropus crossotus -0.19 0.12Euthynnus alletteratus 0.51 0.54Microdesmus lanceolatus -0.20 0.34Peprilus paru 0.24 0.05Saurida brasiliensis 0.13 0.06Sphraena guachancho 0.35 0.19Svacium spp. 0.30 -0.09Symphurus spp. 0.74 -0.19Synodus foetens -0.55 -0.35Synodus poeyi -0.18 0.03
Environmental Variables Correlations between environmentalvariables and their canonical variates
W l W2
Zooplankton Biomass 0.02 -0.38Suspended Solids •026 0.05Salinity -0.73 0.68Temperature 0.99 0.01
76
Reproduced with permission of the copyright owner. Further reproduction prohibited without permission.

Table 2.12. Results o f a canonical correlation analysis on log-transformed light-trap CPUEs (16 most dominant taxa) and environmental variables for Grand Isle 94. Loadings in bold under statistically significant canonical variates V I, V2, and V3 explain at least 15% o f the variation for that taxon. Loadings in bold under environmental variates W I, W2. and W3 indicate the most influential environmental variables.
Canonical Correlation Likelihood Ratio Approximate F Pr > F
1 0.727366 0.36024110 8.2854 0.00012 0.407126 0.76494371 2.8369 0.00013 0.250076 0.91692543 1.4435 0.0647
Taxa Correlations between light-trap CPUEs and their canonical variates
VI V2 V3
Auxis spp. 0.34 0.36 0.02Bregmaceros cantori -0.20 -0.08 -0.05Caranx crysos -0.26 -0.09 0.42Caranx hippos/latus 0.30 -0.21 -0.18Chromis spp. 0.16 0.36 0.22Euthynnus alletteratus -0.46 -0.09 0.30Hypsoblenmus hentz/ionthas 0.22 0.30 0.35Hypsoblenmus invemar 0.26 0.23 0.27Parablennius marmoreus 0.73 0.04 0.16Pomacentrus spp. -0.02 0.37 0.46Rhomboplites aurorubens -0.18 0.04 0.11Saurida brasiliensis -0.43 -0.35 0.09Scartella/Hypleurochilus 0.30 0.25 0.18Symphurus spp. -0.26 0.04 0.19Synodus foetens 0.47 -0.59 0.43Synodus poeyi 0.43 0.02 0.55
Environmental Variables Correlations between environmental variables and their canonical variates
W l W2 W3
Zooplankton Biomass -0.20 -0.59 0.75Suspended Solids 0.30 0.03 0.17Salinity 0.90 0.35 025Temperature -0.94 0.33 -0.08
77
Reproduced with permission of the copyright owner. Further reproduction prohibited without permission.
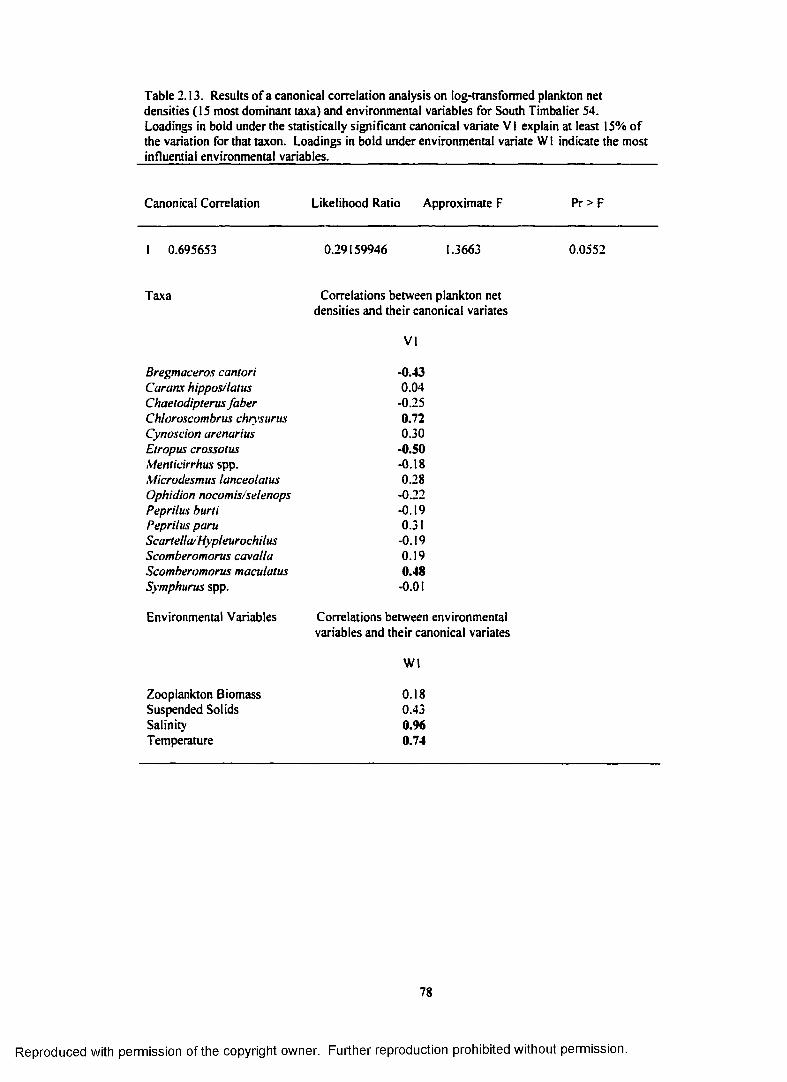
Table 2.13. Results o f a canonical correlation analysis on log-transformed plankton net densities (15 most dominant taxa) and environmental variables for South Timbalier 54.Loadings in bold under the statistically significant canonical variate V I explain at least 15% o f the variation for that taxon. Loadings in bold under environmental variate WI indicate the most influential environmental variables.
Canonical Correlation Likelihood Ratio Approximate F Pr> F
1 0.695653 0.29159946 1.3663 0.0552
Taxa Correlations between plankton net densities and their canonical variates
VI
Bregmaceros cantori -0.43Caranx hippos/latus 0.04Chaetodipterus faber -0.25Chloroscombrus chrysurus 0.72Cynoscion arenarius 0.30Etropus crossolus -0.50Menticirrhus spp. -0.18Microdesmus lanceolatus 0.28Ophidian nocomis/selenops -0.22Peprilus burti -0.19Peprilus paru 0.31Scartella/Hypleurochilus -0.19Scomberomorus cavalla 0.19Scomberomorus maculatus 0.48Symphurus spp. -0.01
Environmental Variables Correlations between environmental variables and their canonical variates
W l
Zooplankton Biomass 0.18Suspended Solids 0.43Salinity 0.96Temperature 0.74
78
Reproduced with permission of the copyright owner. Further reproduction prohibited without permission.

Table 2.14. Results o f a canonical correlation analysis on log-transformed light-trap CPUEs (16 most dominant taxa) and environmental variables for South Timbalier 54. Loadings under statistically significant canonical variates V I and V2 explain at least 15% of the variation for that taxon. Loadings in bold under environmental canonical variates W 1 and W2 indicate the most influential environmental variables.
Canonical Correlation Likelihood Ratio Approximate F Pr> F
I 0.667016 0.38618143 2.6350 0.00012 0.472763 0.69571078 1.3486 0.0708
Taxa Correlations between light-trapCPUEs and their canonical variates
VI V2
Caranx crysos 0.48 0.19Chloroscombrus chrysurus 0J9 0.30Cynoscion arenarius -0.47 0.45Etropus crossotus -0.12 -0.22Euthynnus alletteratus 0.18 0.01Gobiesox strumosus -0.32 0.36Hypsoblenmus hentz/ionthas -0.27 0.01Hypsoblenmus invemar -0.14 -0.26Peprilus burti -0.36 0.19Saurida brasiliensis -0.16 -0.41Scartella/Hypleurochilus -0.12 -0.17Scomberomorus cavalla 0.21 -0.09Scomberomorus maculatus •0.40 -0.17Sphoeroides parvus -0.08 -0.13Synodus foetens -0.37 -0.23Trachinocephalus myops -0.12 -0.15
Environmental Variables Correlations between environmentalvariables and their canonical variates
Wl W2
Zooplankton Biomass 0.32 0.14Suspended Solids 0.23 -OJ28Salinity 0.72 0.64Temperature 0.99 -0.10
79
Reproduced with permission of the copyright owner. Further reproduction prohibited without permission.

Table 2.1 5. Results o f a canonical correlation analysis on log-transformed pushnet densities (15 most dominant taxa) and environmental variables for Belle Pass. Loadings in bold under the statistically significant canonical variates V I , V2, and V3 explain at least 15% o f the variation for that taxon. Loadings in bold under environmental variates W l, W2, and W3 indicate the most influential environmental variables. ___ ___ ___
Canonical Correlation Likelihood Ratio Approximate F Pr > F
1 0.746141 0.12473748 3.3677 0.00012 0.709788 0.28140077 2.6115 0.00013 0.553340 0.56711076 1.5750 0.0201
Taxa Correlations between
VI
pushnet densities and their canonical variates
V2 V3
Bairdiella chrysoura -0.13 0.31 -0.14Citharichthys spp. -0.01 0.68 0.07Cynoscion arenarius 0.23 0.75 0.31Cynoscion nebulosus 0.14 0.46 0.11Dormitator maculatus -0.61 0.23 -0.21Gobiesox strumosus -0.75 0.21 -0.18Gobionellus oceanicus 0.25 0.29 0.01Gobiosoma bosc -0.31 0.58 0.05Gobiosoma spp. -0.29 -0.20 •0.43Hypsoblennius hentdionthas -0.39 -0.15 0.01Membras martinica -0.26 -0.32 0.70Microgobius spp. 0.25 -0.34 -0.23Sciaenops ocellalus 0.30 0.35 0.20Symphurus spp. -0.20 0.22 0.26Synodus foetens -0.18 0.36 -0.28
Environmental Variables Correlations between environmental variables and their canonical variates
W l W2 W3
Temperature 0.91 0.20 -0.13Salinity 0.06 -0.06 0.98Dissolved Oxygen -0.04 0.84 -0.53Turbidity 0.31 -0.59 -0.49
80
Reproduced with permission of the copyright owner. Further reproduction prohibited without permission.

correlated with dissolved oxygen and negatively correlated with turbidity. Abundances o f Citharichthys
spp., Cynoscion arenarius, C. nebulosus, and Gobiosoma bosc were positively associated with the second
canonical variate. Abundances o f Gobiosoma spp. were negatively associated with the third
environmental variate, which was positively correlated with salinity, while Membras martinica was
positively associated with this variate. For light-trap collections, three taxa (i. e„ G. strumosus, H.
hentz/ionthas, and Sphoeroides parvus) were negatively associated with the first canonical variate. which
was positively correlated with temperature, and to a lesser extent, turbidity (Table 2.16).
DISCUSSION
Reef Fishes Collected at the OfTshore Oil and Gas Platforms and the Belle Pass Jetties
Overall, reef-dependent taxa (e.g., chaetodontids, pomacentrids. labrids, and scarids) were
relatively rare (Table 2.7). Pomacentrids and chaetodontids were collected only at the shelf slope and
mid-shelf sites, while labrids and scarids were also collected at the inshore sites. The total o f 67 families
collected at oil and gas platforms throughout the course o f this study is comparable with previously
published surveys from the Gulf (61 families. Ditty et al. 1988; 74 families, Richards et al. 1984), but is
generally less than surveys that included more tropical waters (85 families. McGowan 1985; 91 families.
Limouzy-Paris et al. 1994; 96 families, Richards 1984; 100 families, Richards et al. 1993). While reef-
dependent fish were uncommon, reef-associated fish (e.g., carangids, scombrids, blenniids) were more
common and often times represented a significant component o f the community assemblage at each site.
The relatively low abundance o f reef fish larvae and juveniles compared to pelagic species at the
outer shelf platform (GC 18) is in contrast to the adult community described by Gallaway (1981).
However, the studies cited in Gallaway's ( 1981) synthesis were primarily visual (SCUBA diver) surveys
interested in adult fishes associated with the natural and artificial structures, and not necessarily taxa in
the surrounding water column. Pelagic species, therefore, may have been underestimated in those
previous studies. Also, reef fish communities are limited, in part by the supply o f pelagic larvae, usually
from upstream sources rather than the resident populations (Sponaugle and Cowen 1996; Victor 1986).
Reefs and platforms located on the shelf slope would theoretically have significantly fewer upstream
sources o f potential recruits than those on the mid-shelf, where other natural hard-bottom or reef habitats
may be more abundant, or where the density o f platforms is orders o f magnitude greater.
81
Reproduced with permission of the copyright owner. Further reproduction prohibited without permission.

Table 2.16. Results o f a canonical correlation analysis on log-transformed light-trap CPUEs ( I 5 most dominant taxa) and environmental variables for Belle Pass. Loadings in bold under the statistically significant variate V I explain at least 15% o f the variation for that taxon. Loadings in bold under environmental canonical variate W l indicate the most influential physical variables._______________________________________________
Canonical Correlation Likelihood Ratio Approximate F Pr > F
I 0.679900 0.33598275 1.56599 0.0032
Taxa Correlations between light-trap CPUEs and their canonical variates
V I
Bairdiella chrysoura 0.22Chloroscombrus chrysurus 0.13Citharichlhys spp. -0.14Cynoscion arenarius -0.20Dormitator maculatus -0.19Gobiesox strumosus •0.83Gobionellus oceanicus 0.16Gobiosoma bosc -0.14Gobiosoma spp. -0.19Hypsoblenmus hentyionthas -0.68Membras martinica 0.22Microdesmus iongipinnis 0.08Sphoeroides parvus -0.61Symphurus spp. 0.08Synodus foetens -0.07
Environmental Variables Correlations between environmental variables and their canonical variates
W l
Temperature 0.76Salinity 0.18Dissolved Oxygen -0.24Turbidity 0.42
82
Reproduced with permission of the copyright owner. Further reproduction prohibited without permission.

While not a reef fish, the presence o f preflexion Sciaenops ocellatus at outer platform site in
September is noteworthy, since they are commonly found on the inner shelf and near coastal inlets (Ditty
et al. 1988). Early larval stages have been collected as far as 17-34 km offshore (Lyczkowski-Shultz et
al. 1988), suggesting either some offshore spawning may occur or that periodic offshore transport events
may occur. Green Canyon 18 is located approximately 179 km offshore in 230 m o f water and it is
unlikely that local spawning is occurring at these depths. More likely, the presence o f these larvae was
related to hydrographic features in the area at the time o f sampling. The July and August sampling trips
which preceded the collection o f S. ocellatus were characterized by intrusions o f low salinity water.
While the mean surface salinity was more typical o f offshore waters by September (35 ppt). it is possible
that the area was seeded with these larvae (or eggs) when inshore waters were advected offshore.
Overall, there was greater taxonomic richness among reef fish collected at the mid-shelf
platform (Gl 94) than the outer shelf platform (GC 18). By far the most dominant reef-associated fish
taxa at Gl 94 were blenniids, particularly Parablennius marmoreus and Hypsoblenmus invemar. These
fishes are perhaps one o f the most common taxa affiliated with oil and gas platforms, but are probably
underestimated in visual surveys due to there small size, cryptic coloration, and tendency to hide in
attached barnacle shells. Some blenniids have been found to be rather unusual compared to other
common reef-associated taxa in that they have demersal eggs and pelagic, yet fairly competent larvae that
appear to be able to feed immediately and are attracted to light (Thresher 1984). I f the same early life
history attributes are true for the blennies collected at the platform sites, then these traits may combine to
form a mechanism by which these taxa are retained and concentrated around platform structures. Other
reef taxa that hatch from demersal eggs and have demonstrated photopositive behavior include gobies and
pomacentrids, although these larvae are not as competent upon hatching (Thresher 1984). At the mid
shelf platform, unidentified gobiids and pomacentrids. primarily Chromis spp. and Pomacentrus spp.,
ranked next in abundance. Unique to this site was the collection o f opisthognathids in surface waters
(plankton nets as well as surface and off-platform light-traps) during the spring-early summer. Adult
Opisthognathus aurifrons are reported to be tropical (south Florida, Bahamas, northern South America)
and rarely collected on the mid-to-outer shelf (Hoese and Moore 1977: Robins et al. 1986). Adult O.
lonchurus are also reported to inhabit the northeast G ulf as well as tropical waters (Robins et al. 1986).
83
Reproduced with permission of the copyright owner. Further reproduction prohibited without permission.

The presence o f these larvae reinforces the notion that oil and gas platforms may play a role in extending
the ranges o f more tropical forms that would otherwise be habitat limited in the northcentrai Gulf.
Few reef fish larvae and juveniles were collected at the inner shelf platform (ST 54). The low
reef fish abundances are not surprising, particularly for the more tropical taxa such as haemulids, labrids,
and scarids. The adults o f many o f these taxa are more typical o f the outer shelf assemblages. Similarly
with regards to reef fish larvae and juveniles, this trend o f decreasing taxonomic richness towards the
more inshore environments is supported somewhat by this study, particularly with regards to scarids.
Even though an inner shelf platform would be downstream from potentially more offshore and along-
shelf sources o f larvae and recruits (greater density o f platforms), perhaps the potentially less favorable
inshore environmental conditions result in increased mortality (Leis 1991).
At the Belle Pass jetties, the presence o f lutjanid juveniles (Lutjanus griseus and L. synagris) is
noteworthy because it indicates that coastal, artificial structures even in relatively low salinity
environments may play a role as nursery areas in the absence o f other structurally-complex habitats, such
as seagrass beds in more high-salinity. oligotrophic estuaries. Many species o f reef-associated or reef-
dependent fish do not settle directly onto reefs but utilize other coastal habitats as nursery grounds prior
to moving to offshore reefs. While habitats such as high-salinity seagrass beds are important to many
reef related species (Connolly 1994), other structurally-complex habitats have been identified as nurseries
(Ferrell and Bell 1991; Bennett 1989; Ross and Moser 1995). Seagrass beds are often the most common
form o f shelter available in certain settlement areas, but experimental evidence suggests that
presettlement larvae o f a number o f different species select any structurally-complex habitat at the time o f
settlement (Bell et al. 1987). Due to the overwhelming influence o f the Mississippi River and its
distributaries. Louisiana estuarine and coastal areas are generally low salinity (18-25 ppt at Belle Pass
from April to September), turbid, and lacking in seagrass beds and naturally-occurring hard substrate
habitats (except for oyster reefs). Therefore, the role o f the artificial habitats such as jetties and
breakwaters may be more important as islands o f refuge for individuals that would otherwise be lost to
unsuitable habitat and. therefore, elevated mortalities.
84
Reproduced with permission of the copyright owner. Further reproduction prohibited without permission.

Taxonomic Similarity Among Sites
Since all sites sampled during this study were heavily dominated by a single taxon, only the
similarity values calculated after the dominant taxa were removed are discussed. In general, the index
values indicate that the sites were not very similar, with the highest similarity value between any two sites
being 0.45 for mid-shelf platform (GI 94) and inner shelf platform (ST 54). This is not unexpected since
sampling sites were purposely chosen to be in different depth zones across the shelf where adult faunal
transitions had been documented (Gallaway et al. 1980; Gallaway 1981), and indeed similar
larval/juvenile transitions occurred. The Belle Pass jetties, which were heavily influenced by the
presence o f estuarine and coastal pelagic taxa, was very different from the mid-shelf (GI 94) and outer
shelf (GC 18) platforms, where mesopelagic and tropical taxa were influential. Similarity indices for the
mid-shelf platform (GI 94) displayed the expected cross-shelf transitional pattern, with the highest
similarity values being for the adjacent sites, the inner shelf (ST 54) and outer shelf site (GC 18).
followed by the Belle Pass jetties. The highest similarity index for the outer shelf platform (GC 18),
however, was with the inner shelf platform (ST 54), whereas one might have expected GC 18 to be most
similar to GI 94 (mid-shelf platform). This somewhat unexpected result is probably due to the large
number o f reef taxa collected at the mid-shelf site (GI 94) that were unique to that site (Table 2.7). Reef
fish taxa such as Chromis spp., Abudefduf taurus, Mullus auratus. Ophioblennius atlantica.
Pseudopeneus maculatus, Opisthognathus aurifrons. and Opisthognathus lonchurus were collected only
at the mid-shelf platform (GI 94). Other taxa (ephippids and scarids) were collected at the outer shelf and
inner shelf platforms (GC 18 and ST 54), but not at the mid-shelf platform (GI 94).
While using a similarity index to characterize assemblages helps to synthesize large amounts o f
information, the analyses are confounded by several problems which can make the results difficult to
interpret. First o f all. the index is highly influenced by large numbers o f individuals o f a single taxon and
confidence intervals can be quite large (Ricklefs and Lau, 1980). This is why I ran analyses without the
most dominant taxa from each site, which helped to identify trends that may have otherwise been
overwhelmed in the complete data set. Secondly, in any comparison between two sites, samples were
only used when seasonality overlapped in sampling efforts. In this way, the same species pool would
theoretically be available for collection. However, at times this led to large disparities in sampling effort
85
Reproduced with permission of the copyright owner. Further reproduction prohibited without permission.

between sites within a comparison. Finally, taxa utilized in the analyses were limited by the inability to
identify many o f the larval fishes collected over the course o f the study. Since an attempt was made to
analyze the taxonomic assemblage at the lowest level possible, large numbers o f fish which could not be
identified to genus were eliminated from the analyses. Overall, however, the index provides some idea o f
the similarity in community assemblages across the shelf.
Taxonomic Diversity Among Sites
The mean diversity indices based on plankton net collections taken at the platform sites and the
pushnet collections taken at Belle Pass were not significantly different from each other, ranging from
0.73-0.83. They were, however, slightly higher than those for the light-trap collections, with the
exception o f GI 94. In general, observed statistical differences in Shannon-Weiner diversity indices
between sites were limited to light-trap collections. The similarity between the light-trap diversity indices
for the inner shelf platform (ST 34) and the Belle Pass jetties is not surprising, since both sites were
dominated by large numbers o f photopositive clupeiform fishes, which also lowered their diversity
indices. Light-trap collections were significantly more diverse at the mid-shelf platform (GI 94), a result
o f being less dominated by clupeiform fishes than the inner shelf platform (ST 54) and the Belle Pass
jetties, and o f collecting more taxa, particularly reef fish species, than the outer shelf platform (GC 18).
In general, taxonomic richness in light-traps was highest at the mid-shelf platform (GI 94). with 90 taxa
identified to genus as compared to 65 taxa at the inner shelf (ST 54), the platform with the second highest
number o f light-trap taxa. Inshore (particularly estuarine) areas are generally characterized as having
lower diversity than adjacent shelf waters and are dominated by a few highly abundant taxa (Nybakken
1988). This pattern is generally attributed to the fluctuating nature o f the nearshore environment
particularly with regards to salinity and temperature, and the lack o f physiological specializations needed
to deal with this estuarine environmental variability (Nybakken 1988). This, in pan, may explain the
relatively low diversity indices for the inner shelf platform (ST 54) and the jetties, the two inshore sites.
In contrast, species richness and abundance is generally relatively low on the outer shelf, due to the
homogeneity o f the bottom substrate (Bond 1996). Topographical relief is disjunct throughout the
northcentral Gulf (especially west o f the Delta) and the sea floor is basically dominated by expanses o f
mud and silt. This homogeneity and the lack o f a large amount o f upstream supply o f larvae may in part
86
Reproduced with permission of the copyright owner. Further reproduction prohibited without permission.

explain the low taxonomic diversity observed in the light-trap collections at the outer shelf platform (GC
18).
Environmental Variables and Larval and Juvenile Fish Abundances
Canonical correlation analyses were used to determine the relationship between dominant taxa
collected at the sampling sites and environmental/biological parameters, i.e.. temperature, salinity,
turbidity, dissolved oxygen, and microzooplankton biomass. At all o f the sampling sites, temperature and
salinity appeared to explain most o f the variation in larval abundances in the models. This is not
surprising as these physical variables change seasonally, and to some extent spatially across the shelf.
Occasionally, both temperature and salinity were important factors within a single environmental
canonical variate, which is probably a reflection o f seasonality, i.e., in the northern G ulf as temperatures
increase during the late spring through the summer and early fall, salinities tend to increase as well, due
to decreased Mississippi/Atchafalaya River runoff and increased evaporation/precipitation ratios.
Many o f these relationships (based primarily on the seasonal variables temperature and salinity)
were consistent with known information on the seasonal occurrences o f the different species. For
example at the outer shelf platform (GC 18), where samples were collected nearly year-round. Mugil
cephalus was found to be negatively associated with temperature in plankton net samples, which is
consistent with their peak periods o f abundance (December-February) in the northern G ulf (Ditty et al.
1988). Larvae o f M cephalus are most commonly found over the outer to mid-shelf (Ditty and Shaw
1996), so their presence at the outer shelf sampling station is not surprising. Though the adults are
common in shelf and coastal waters (Hoese and Moore 1977), \f. cephalus was not collected at the mid-
or inner shelf platforms. This is primarily a result o f the limited sampling effort (April-August or
September) at the other platforms, that did not encompass the spawning season (October through March:
Leard et al. 1995), so the relative abundance o f M. cephalus larvae at these platforms is unknown. Other
species collected in plankton nets at the outer shelf platform were positively associated with temperature
and represent taxa with peak larval abundances in the spring and summer months, such as Auxis spp.
(May-September), Caranx crysos (June-August), and C. hipposJlatus (April-August; Ditty et al. 1988).
Relationships between seasonal variables (temperature and salinity) and larval peaks in abundance were
observed at all sites. For example, positive relationships between abundances and temperature and
87
Reproduced with permission of the copyright owner. Further reproduction prohibited without permission.

salinity were found for species with summer peaks in larval abundance, such as Auxis spp. (May-
September) at the mid-shelf platform )GI 94) and Chloroscombrus chrysurus (June-September) and
Scomberomorus maculatus (August-September) at the inner shelf platform (ST 54). Negative
relationships for species with spring or winter peaks were found as well, such as previously mentioned
Mugil cephalus at the outer shelf platform (GC 18) and Gobiesox strumosus (March-May) at the Belle
Pass jetties.
While seasonality seems to be an important factor, trends in larval abundances could also reflect
the environmental optima and preferences o f some species. Membras martinica, for example, is found
primarily in more saline areas along the coast, as well as offshore areas (Hoese and Moore 1977). At the
Belle Pass jetties, pushnet densities for this species were positively associated with salinity. Larval and
juvenile Caranx crysos prefer warmer, more saline waters (Patillo et al. 1997). and this species was often
positively associated with temperature and salinity at the platforms.
Differences in the relationship between plankton net and light-trap collections may be a
reflection o f biases towards different life history stages, since plankton nets typically collect younger,
less competent larvae, while light-traps collect larger larvae and juveniles. At the inner shelf platform
(ST 54). for example, net collections o f Scomberomorus maculatus were positively associated with
temperature and salinity, while light-trap collections were negatively associated with these variables.
This is consistent with the known early life history preferences for this species, as larval S. maculatus
require relatively higher temperatures and salinities than juveniles, which are generally more eurythermal
and euryhaline (Patillo et al. 1997).
Dissolved oxygen and turbidity were also important variables at the Belle Pass jetties for some
species, but little is known about these requirements or preferences for the early life stages o f many
fishes. Some species which were very photopositive (i.e.. Gobiesox strumosus and Hypsoblennius
hentdionthas) were also negatively associated with turbidity in the light-trap samples, possibly because
of decreased light-trap efficiency in highly turbid waters. Microzoopiankton biomass was influential in
the models at the outer and mid-shelf platforms (GC 18 and GI 94). but only in light-trap collections.
Some o f these light-trap taxa that were positively associated with zooplankton biomass included larval
88
Reproduced with permission of the copyright owner. Further reproduction prohibited without permission.

forms such as Euthynnus alletteratus, Saurida brasiliensis, and Synodus foetens, which have well
developed mouths and teeth at small sizes and are able to quickly feed on zooplankton.
While canonical correlation analyses were useful in characterizing the environmental correlates
for most species, results for others were confounding. At the inner shelf platform (ST 54), for example,
Cynoscion arenarius was negatively associated with the first environmental variate which related
temperature and salinity, but positively associated with the second environmental variate which was
positively correlated with salinity alone. In many instances, the models did not explain a large amount o f
the variation ( 15%) for many species. One possible reason for some o f these discrepancies is that
spawning seasons and periods o f larval abundances for many species occurred throughout the entire
sampling season (late spring-summer) for many species, particularly at the mid- and inner shelf platforms
(GI 94 and ST 54) and the Belle Pass jetties. This is the case for species such as Citharichthys spp.,
Citharichthys spilopterus, Cynoscion nebuiosns and others (Ditty et al. 1988). For other species,
particularly small fishes with little economic value such as many o f the lizardfishes (Synodus foetens, S.
poeyi. Saurida brasiliensis) and biennies (Hypsobiennius hentyionthas, H. invemar, and
Scartella/Hypleurochilus). little information is available on peak occurrences o f these taxa across the
shelf. In this respect, this study provides an important contribution to the life history information on these
taxa across the shelf.
A major problem for managing reef resources is the incomplete understanding o f the interactions
between recruitment and habitat structure. Although habitat space may ultimately be limiting, many reef
fish populations are not at the carrying capacity o f their environment and changes in abundance may be
controlled by settlement from the plankton or by early postsettlement mortality. Nothing has been
published on the relationship between offshore petroleum platforms and the early life history stages o f
fishes anywhere in the world. These findings, along with those o f the larger LSU program as a whole
(Chapter I), represent an important first contribution towards this aspect o f artificial reef research.
REFERENCES
Alevizon, W.C., J.C. Gorhan, R. Richardson and A. McCarthy. 1985. Use o f man-made reefs toconcentrate snapper (Lutjanidae) and grunts (Haemulidae) in Bahamian waters. Bulletin o f Marine Science 37:3-10.
89
Reproduced with permission of the copyright owner. Further reproduction prohibited without permission.

Bedinger, C.A., J.W. Cooper, A. Kwok, R.E. Childers and K.T. Kimball. 1980. Ecological investigations o f petroleum production platforms in the central Gulf o f Mexico. Volume 1: Pollutant fate and effects studies. Draft final report submitted to the Bureau o f Land Management, Contract AA55I-CT8-I7.
Bell, J.D., M. Westoby and A.S. Steffe. 1987. Fish larvae settling in seagrass: do they discriminatebetween beds o f different leaf density? Journal o f Experimental Marine Biology and Ecology 111:133-144.
Bennett, B.A. 1989. The fish community o f a moderately exposed beach on the Southwestern Cape coast o f South Africa and an assessment o f this habitat as a nursery for juvenile fish. Estuarine, Coastal, and Shelf Science 28:293-305.
Boesch, D.F., M.N. Josselyn, A.J. Mehta, J.T Morris, W.K. Nuttle. C.A. Simenstad and J.P Swift. 1994. Scientific assessment o f coastal wetland loss, restoration and management in Louisiana. Journal o f Coastal Research, Special Issue 20:1-102.
Bohnsack, J.A. 1989. Are high densities o f fishes at artificial reefs the result o f habitat limitations or behavioral preference? Bulletin o f Marine Science 44:632-645.
Bond. C.E. 1996. Biology o f Fishes. Saunders College Publishing, Orlando, Florida.
Bortone, S. A. 1998. Resolving the attraction-production dilemma in artificial reef research: Some yeas and nays. Fisheries 23:6-10.
CDOP (Committee on Disposition o f Offshore Platforms). 1985. Disposal o f offshore platforms. Marine Board. Commission on Engineering and Technical Systems, National Research Council.National Academy Press, Washington, D.C.
ChoaL J.H. and D.R. Bellwood. 1991. Reef fishes: their history and evolution. In Sale. P.F.. editor.The Ecology o f Fishes on Coral Reefs. Academic Press, San Diego.
ChoaL J.H, P.J. Doherty, B.A. Kerrigan and J.M. Leis. 1993. A comparison o f towed nets, purse seine, and light-aggregation devices for sampling larvae and pelagic juveniles o f coral reef fishes. Fishery Bulletin 91:195-209.
Connolly, R.M. 1994. A comparison o f fish assemblages from seagrass and unvegetated areas o f asouthern Australian estuary. Australian Journal o f Marine and Freshwater Research 45:1033- 1044.
Continental Shelf Associates. 1982. Study o f the effect o f oil and gas activities on reef fish populations in the Gulf o f Mexico OCS area. OCS Report/MMS82-OIO. U.S. Dept, o f the Interior, Minerals Management Service. Gulf o f Mexico OCS Region, New Orleans.
Ditty, J.G. and R.F. Shaw. 1996. Spatial and temporal distribution o f larval striped mullet (Mugilcephalus) and white mullet (M curema. Family: Mugilidae) in the northern Gulf o f Mexico, with notes on mountain mulleL Agonostomus monticola. Bulletin o f Marine Science 59:271-288.
Ditty, J.G.. G.G. Zieske, and R.F. Shaw. 1988. Seasonality and depth distribution o f larval fishes in the northern Gulf o f Mexico above latitude 26°00'N. Fishery Bulletin 86:811-823.
Essig, R. J.. J.F. Witzig and M.C. Holliday. 1991. Marine recreational fishery statistics survey, Atlantic and Gulf coasts. 1987-1989. NOAA/NMFS Current Fisheries Statistics 8904.
Ferrell, D.J. and J.D. Bell. 1991. Differences among assemblages o f fish associated with Zosteracapricorni and bare sand over a large spatial scale. Marine Ecological Progress Series 72:15-24.
90
Reproduced with permission of the copyright owner. Further reproduction prohibited without permission.
Finucane, J.H., L.A. Collins, L.E. Barger and J.D. McEachran. 1979a. Environmental Studies o f theSouth Texas Outer Continental Shelf 1976: Ichthyoplankton/mackerel eggs and larvae. NOAA Final Report to BLM, NMFS Southeast Fisheries Center, Galveston, Contract Number AA550- TA7-3.
Finucane, J. H., L.A. Collins and L.E. Barger. 1979b. Determine the effects o f discharges on seasonal abundance, distribution, and composition o f ichthyoplankton in the oil field. In Jackson, W.B., editor. Environmental Assessment o f an Active Oil Field in the Northwestern Gulf o f Mexico, 1977-1978. NOAA Report to EPA, NMFS Southeast Fisheries Center, Galveston, Contract Number EPA-IAG-D5-E693-EO, 299 pp.
Gallaway, B. J. 1981. An ecosystem analysis o f oil and gas development on the Texas-Louisianacontinental shelf. U.S. Fish & Wildlife Service, Office o f Biological Services, FWS/OBS-81/27, Washington, D.C.
Gallaway, B. J. 1998. Cumulative ecological significance o f oil and gas structures in the Gulf o f Mexico: Information search, synthesis, and ecological modeling: Phase I, Final Report. U. S. Geological Survey, Biological Research Division, Washington, D.C. USGS/BRD/CR-1997-0006.
Gallaway, B.J.. L.R. Martin. R.L. Howard, G.S. Boland and G.D. Dennis. 1980. A case study o f the effects o f gas and oil production on artificial reef and demersal fish and macrocrustacean communities in the northwestern Gulf o f Mexico. Expo Chem 1980, Houston. Texas.
Hoese, H.D. and R.H. Moore. 1977. Fishes o f the Gulf o f Mexico: Texas, Louisiana, and Adjacent Waters. Texas A&M University Press, College Station.
Johannes, R.E. 1978. Reproductive strategies o f coastal marine fishes in the tropics. Environmental Biology o f Fishes 3:65-84.
Leard, R., B. Mahmoudi, H. Blanchet, H. Lazauski, K. Spiller. M. Buchanan, C. Dyer and W. Keithly. 1995. The striped mullet fishery o f the Gulf o f Mexico, United States: a regional management plan. Gulf States Marine Fisheries Commission Report No. 33. Gulf States Marine Fisheries Commission. Ocean Springs.
Leis, J.M. 1991. The pelagic stage o f reef fishes: the larval biology o f coral reef fishes. In Sale. P.F.. editor. The Ecology o f Fishes on Coral Reefs. Academic Press, San Diego.
Limouzy-Paris, C., M.F. McGowan. W.J. Richards, J.P. Umaran and S.S. Cha. 1994. Diversity o f fish larvae in the Florida Keys: results from SEFCAR. Bulletin o f Marine Science 54(3):857-870.
Lyczkowski-Shultz, J., J.P. Steen, Jr., B.H. Comyns. 1988. Early life history o f red drum (Sciaenops ocellatus) in the northcentrai Gulf o f Mexico. Technical Report MASGP-88-013. Mississippi- Alabama Sea Grant Program.
Magurran, A.E. 1988. Ecological Diversity and Its Measurement. Princeton University Press, Princeton.
McGowan. M.F. 1985. Ichthyoplankton o f the Flower Garden Banks, northwest Gulf o f Mexico. Doctoral Dissertation. University o f Miami, Miami.
NOAA/NMFS. 1993. Fisheries o f the United States. 1992. Current Fisheries Statistics 9200.
Nybakken, J.W. 1988. Marine Biology: An Ecological Approach. Harper and Row, New York.
Parker, R.O., Jr., D.R. Colby T.P. Willis. 1983. Estimated amount o f reef habitat on a portion o f the U.S. South Atlantic and Gulf o f Mexico continental shelf. Bulletin o f Marine Science 33:935-940.
91
Reproduced with permission of the copyright owner. Further reproduction prohibited without permission.

Patillo, M.E., T.E. Czapla, D.M. Nelson and M.E. Monaco. 1997. Distribution and abundance o f fishes and invertebrates in G u lf o f Mexico estuaries. Volume II: Species life history summaries. ELMR Report Number I I . NOAA/NOS Strategic Environmental Assessments Division, Silver Spring.
Pickering, H., and D. Whitmarsh. 1997. Artificial reefs and fisheries exploitation: A review o f the 'attraction versus production' debate, the influence o f design and its significance for policy. Fisheries Research 3 1:39- 59.
Richards, W. J. 1984. Rinds and abundances o f fish larvae in the Caribbean Sea and adjacent areas. NOAA Technical Report NMFS-SSRF-776.
Richards, W. J., T. Potthoff, S. Kelley, M. F. McGowan, L. Ejsymont, J. H. Power and R. M. Olvera. 1984. SEAMAP 1982-lchthyoplankton. NOAA Technical Memorandum NMFS-SEFC-144.
Richards, W. J., M. F. McGowan, T. Leming, J. T. Lampkin and S. Kelley. 1993. Larval assemblages at the Loop Current boundary in the G ulf o f Mexico. Bulletin o f Marine Science 53(2):475-537.
Ricklefs, R.E.. and M. Lau. 1980. Bias and dispersion o f overlap indices: results o f some Monte Carlo simulations. Ecology 61:1019-1024.
Robins, C. R„ G.C. Ray and J. Douglass. 1986. A Field Guide to the Atlantic Coast Fishes o f North America. Houghton M ifflin Company, Boston.
Robins, C. R.. R.M. Bailey, C.E. Bond. J.R. Brooker, E.A. Lachner, R.N. Lea and W.B. Scott. 1991.Common and scientific names o f fishes from the United States and Canada. American Fisheries Society Special Publication 20. American Fisheries Society, Bethesda.
Robertson, D. R.. D.G. Green and B.C. Victor. 1988. Temporal coupling o f production and recruitment o f larvaeof a Caribbean reef fish. Ecology 69:370-381.
Rooker, J.R.. Q.R. Dokken, C.V. Pattengill and GJ. Holt. 1997. Fish assemblages on artificial andnatural reefs in The Flower Garden Banks National Marine Sanctuary, USA. Coral Reefs 16:83- 92.
Ross. S. W. and M.L. Moser. 1995. Life history ofjuvenile gag, Mycteroperca microlepis, in North Carolina estuaries. Bulletin o f Marine Science 56:222-237.
Sale. P.F. 1980. The ecology o f fishes on coral reefs. Oceanography and Marine Biology 18:367-421.
SAS Institute, Inc. 1989. SAS/STAT Users Guide, Version 6. SAS Institute, Cary.
Schoener, T.W. 1970. Non-synchronous spatial overlap o f lizards in patchy habitats. Ecology 51:408- 418.
Seaman. W.. Jr. and L.M. Sprague. 1992. Artificial habitats for marine and freshwater fisheries. Academic Press, New York.
Sonnier, F., J. Teerling and H.D. Hoese. 1976. Observations on the offshore reef and platform fish fauna o f Louisiana. Copeia 1976:15-111.
Sponaugle, S. and R.K. Cowen. 1996. Nearshore patterns o f coral reef fish larval supply to Barbados. West Indies. Marine Ecology Progress Series 133:13-28.
Reproduced with permission of the copyright owner. Further reproduction prohibited without permission.

Stanley, D.R. and C. Wilson. 2000. Seasonal and spatial variation in the biomass and size frequency distribution o f the fish associated with oil and gas platforms in the northern Gulf o f Mexico. OCS Study MMS 2000-005. U.S. Department o f Interior, Minerals Management Service, Gulf o f Mexico OCS Region, New Orleans.
Starck, W.A. 1971. Biology o f the gray snapper, Lutjanus griseus (Linnaeus), in the Florida Keys. In W. A. Starck and R. E. Schroeder, editors. Investigations on the gray snapper, Lutjanus griseus). Studies in Tropical Oceanography 10.
Stone, R.B., H.L. Pratt, R.O. Parker and G.E. Davis. 1979. A comparison o f fish populations on an artificial and natural reef in the Florida Keys. Marine Fisheries Review 41:1-11.
Thresher, R.E. 1984. Reproduction in Reef Fishes. T.F.H. Publications, Inc.
Tolan, J.M. 2001. Patterns o f reef fish larval supply to petroleum platforms in the northern Gulf o f Mexico. Doctoral dissertation. Louisiana State University, Baton Rouge.
Van Guelpen, L., D.F. Markle, and D.J. Duggan. 1982. An evaluation o f accuracy, precision, and speed o f several zooplankton sampling techniques. Journal du Conseil. Conseil Permanent International pour I'Exploration de la Mer 40:226-236.
Van Voorhies, D.A., J.F. Witzig, M.F. Osborn. M.C. Holliday and R.J. Essig. 1992. Marine recreational fishery statistics surrey, Atlantic and Gulf coasts, 1990-1991. NOAA/NMFS Current Fisheries Statistics 9204.
Victor, B.C. 1986. Larval settlement and juvenile mortality in a recruitment-limited coral reef fish population. Ecological Monographs 56:145-160.
93
Reproduced with permission of the copyright owner. Further reproduction prohibited without permission.

CHAPTER 3
COMPARISON OF PLANKTON NET AND LIGHT-TRAP METHODOLOGIES FOR SAMPLING LARVAL AND JUVENILE FISHES ASSOCIATED WITH OFFSHORE PETROLEUM PLATFORMS AND A COASTAL JETTY OFF LOUISIANA
94
Reproduced with permission of the copyright owner. Further reproduction prohibited without permission.

INTRODUCTION
Most marine fishes, particularly structure-associated or reef-dependent fishes, have a pelagic
early life history stage (Moser et al. 1984; Leis 1991). Previous studies have indicated that larval source,
supply, recruitment, and settlement patterns can greatly influence the adult population dynamics o f reef
fish on both natural (Victor 1983, 1986; Sponaugle and Cowen 1996) and artificial reefs (Lukens 1981;
Stephens et al. 1994). In response to the need for crucial information on reef fish early life history stages,
several methods have been developed to collect larval and juvenile fishes in a variety o f environments.
Many reef fish juveniles at one time or another are associated with structurally-complex habitats, either
while they reside in a nursery area (mangroves, seagrass meadows, oyster reefs) or once they settle onto
the reef environment itself. While towed sampling gears are effective in open waters, these methods are
usually not suitable for shallow or structurally complex habitats (Brogan 1994).
Different methodologies have been developed to collect fish early life stages in complex
environments, including plankton pumps (Taggert and Legget 1984: Brander and Thompson 1989),
visual censuses (Kingsford and Choat 1989), moored channel nets (Keener et al. 1988: Shenker et al.
1993), larval purse seines (Murphy and Clutter 1972; Choat et al. 1993), and diver-steered plankton tows
(Marliave 1986; Brogan 1994). Other methods have used light sources to aggregate fish for collection
and include lighted purse seines (Choat et al. 1993), light lift-nets (Dennis et al. 1991; Rookeret al. 1996)
and 1 ight-traps o f various designs (Doherty 1987; Thorrold 1992; Choat et al. 1993; Brogan 1994;
Sponaugle and Cowen 1996; Hernandez and Lindquist 1999; Hickford and Schiel 1999; Reyns and
Sponaugle 1999). A ll o f these methods have different biases, advantages, and disadvantages, and should
be chosen to best suit the environment being sampled and the questions being addressed.
To date, very few studies have investigated the ichthyoplankton assemblages associated with
offshore oil and gas platforms in the northern Gulf o f Mexico (Gulf) or any where else in the world, in
part due to the difficulties in sampling within the complex, mostly vertical infrastructure o f the platforms.
Gallaway (1998) calculated that oil and gas platforms in the northern Gulf provided 11.7 knr (or <0.4%)
o f the total "reef' habitat. However, platforms represent vertical artificial substrate that extends from the
bottom to the surface (photic zone), regardless o f location and depth, which increases their significance
(Parker et al.. 1983). These and other artificial structures (e.g., jenies, breakwaters) could represent
95
Reproduced with permission of the copyright owner. Further reproduction prohibited without permission.

significant habitats for reef fish, since the northern Gulf is dominated by a mud/silt/sand bottom with little
vertical relief or hard-bottom habitat. In an attempt to characterize the across-shelf ichthyoplankton
assemblages along a transect o f artificial structures (three offshore oil and gas platforms and a coastal
jetty) in the northern Gulf, a variety o f gear types was used in an effort to sample the widest range o f taxa,
size classes, and developmental stages available. This paper reports the results o f gear comparisons
between a passive plankton net and light-trap used at the petroleum platforms. It also includes
comparisons between a bow-mounted, plankton pushnet and light-trap (the same design) used at a coastal
jetty. Previous studies have demonstrated that pushnets are effective in sampling larger juveniles and
small fishes, particularly in coastal areas (Herke, 1969; Kriete and Loesch, 1980; Raynie and Shaw,
1994). In these comparisons, the taxa collected by the different gears, their similarity and diversity, as
well as the size selectivities o f the gears are examined. These findings w ill be useful to those designing
similar sampling efforts for larval and juvenile fishes in the vicinity o f complex structures or for those
interested in collecting the full spectrum o f sizes or developmental stages in their habitat surveys.
MATERIALS AND METHODS
Study Sites
Data collection and analyses focused on three oil and gas platforms in the northern G ulf and at a
coastal rock jetty environment. The jetties provided a far-field. shallow, and low salinity non-platform
site end-member that was also structurally complex and represented another artificial reef-type, hard-
substrate habitat. Site selection for the three study platforms (west o f the Mississippi River Delta) was
based upon previous work (Gallaway et al. 198; Gallaway 1981; Continental Shelf Associates 1982)
which reported that continental shelf nekton communities associated with natural and artificial reefs could
be categorized by water depth in the northern Gulf. Three communities were characterized: a coastal
assemblage (3-20 m depth), an offshore assemblage (20-60 m), and a biuewater/tropical assemblage
(water depths >60 m). The platforms selected and the jetty site encompass all three zones. Mobil’s Green
Canyon (GC) 18. which lies in about 230 m o f water on the shelf slope (27°56'37"N. 91°0r45"W), was
sampled monthly during new moon phases over a 2-3 night period during July 1995-June 1996. Mobil's
Grand Isle (GI) 94B, which lies in approximately 60 m o f water at mid-shelf (28°30'57"N, 90°07'23"W).
was sampled twice monthly during new and full moon phases over a three night period during
96
Reproduced with permission of the copyright owner. Further reproduction prohibited without permission.

April-August 1996. In addition, extra samples during the first quarter and third quarter moon phases
were collected during May, but due to inclement weather, full moon collections were cancelled. Exxon's
South Timbalier (ST) 54G, which lies in approximately 20 m o f water on the inner shelf (28°50'01 "N,
90°25'00"W), was sampled twice monthly during new and full moon periods over a 2-3 night period in
during April-September, 1997. The stone rubble jetties (2-3 m depth) at the terminus o f Belle Pass, a
major shipping channel near Fourchon, Louisiana (29°03'90"N, 90° 13’80" W). were also sampled over a
two night period in 1997 simultaneously with the sampling o f ST 54.
Sampling Procedure
Sampling protocols are described in detail in Chapter 2. In general, passive plankton nets (60-
cm diameter; 333pm mesh dyed green) were used to collect ichthyoplankton at the three platform sites,
both at depth (15-23 m for 10-20 min, set and retrieved closed) and near surface (1 -2 m for 10-15 min)
within the platform structure with the intent o f sampling roughly equivalent amounts o f water at both
depths.. Quatrefoil light-traps were deployed for 10 minutes at depth and near surface within the
platform structure. An additional light-trap was floated downstream (approximately 20 m) from the
platform for off-platform collections. Both the subsurface and off-platform light-traps were deployed
with the light o ff until the sampling depth/location was reached, fished, and then retrieved with the light
off. Light-trap samples were standardized to a catch-per-unit-effort (CPUE) o f fish per 10 minutes. At
Belle Pass, light-traps and a bow-mounted plankton pushnet (1 m x 1 m; 1000 pm mesh net dyed green:
3-5 min samples) were fished along the jetty walls. Plankton net and pushnet samples were standardized
to the number o f fish collected per 100 mJ (density).
The quatrefoil light-trap (Figure 3.1) was modified from Floyd et al. (1984) and Secoret al.
( 1993). The main modifications are described as follows. The acrylic tubes in the main body o f the trap
were enlarged to 15.24 cm (6") outer diameter. The collection assembly at the bottom o f the trap was
replaced with short conical plankton-net (202 pm) and cod-end assembly. Four, vertical stainless steel
threaded bars were added to the comers o f the trap for additional support. The light source was a
Brinkman Starfire II 12-volt halogen fishing light (250,000 candlepower). For surface samples, power
was supplied through an umbilical cord by a 12-volt marine battery located on the lower deck o f the
97
Reproduced with permission of the copyright owner. Further reproduction prohibited without permission.

Monotai Attachment Bar
45.72 cm
i
3.81-cm Diameter Acrylic Tube (Light aource houeing)40.64 cm Square Acrylic Plata
Eye Nut (Attachment point tor floatation)
Stainless Steel Support Bar
15.24-cm Diameter Acrylic Tube
1.0cm Gap
40.64-cm Square Acrylic Hate
60.96 cm
38.10 cm
40.64-cm Collar
202-nm Mesh
10.16-cm Diameter PVCCod End Assembly
Figure 3.1. Specifications for the modified quatrefoil light-trap used in this study.
98
Reproduced with permission of the copyright owner. Further reproduction prohibited without permission.

platform. For subsurface collections, either an umbilical cord connected to a 12-volt battery or a
submersible battery pack was used. The battery pack was made by placing a 7.0 amp/h rechargeable
sealed lead battery in a 1/4" thick PVC tube with a watertight connector on one end and a complimentary
pig-tail on the end o f the cable supplying power to the light.
Analyses of Data
Due to the very large numbers o f clupeiform (Clupeidae and Engraulidae) fishes collected,
particularly in light-trap samples, statistical analyses were run without these taxa, unless otherwise noted.
Clupeiform fishes are seldom the taxa o f interest in studies o f hard substrate habitats (e.g., artificial
reefs), and their abundances tend to overwhelm the trends o f other taxa (Choat et al., 1993). All
ANOVA. Tukey’s Studentized Range Tests, and Student's t-tests were run with SAS version 6.12 (SAS,
1989).
Studentized t-tests (a=0.05) were used to compare overall plankton net densities between
locations (subsurface and surface) within the outer (GC 18), mid- (GI 94), and inner (ST 54) shelf
platforms. Light-trap CPUEs were compared between locations (subsurface, surface, and off-platform)
within each o f the platform sites using an ANOVA model with gear as a main effect. Tukey’s
Studentized Range tests were used to determine which light-trap collections were significantly different.
Before testing, plankton net densities were log transformed (logi0(x+I)) in an effort to conform to
normality and homogeneity o f variances. Analyses on light-trap CPUEs were run on ranked-transformed
data.
Kolmogorov-Smimov (K-S) length-frequency analyses (a=0.05) were performed for selected
species from GC 18, GI 94. ST 54, and Belle Pass to determine i f there were any significant differences
between size distributions o f fish collected with light-traps vs. plankton nets (Sokal and Rohlf, 1981).
Taxa from each platform site and the Belle Pass jetties were chosen for these analyses i f at least 10
individuals were collected by each gear type. A ll K-S analyses were performed using SYSTAT version 4
(SPSS. 1999).
Lunar periodicity (full vs. new moon) was examined for plankton net and light-trap samples
collected at the mid- and inner shelf platforms, as well as the Belle Pass jetties, using Student's t-tests
(a=0.05). An ANOVA model and Tukey's Studentized Range tests were used to analyze the densities
99
Reproduced with permission of the copyright owner. Further reproduction prohibited without permission.

and CPUEs o f samples collected in May o f 1996 at the mid-shelf platform ( third quarter, new, and full
moon periods).
Schoener's Index o f Niche Overlap (Schoener, 1970) was calculated for comparisons o f
ichthyoplankton collections within each platform structure (surface net and surface light-trap) and far-
fleld collections (off-platform light-trap) in addition to total net vs. total light-trap collections. This same
analysis (total net vs. total light-trap) was performed to compare the similarity o f collections at the Belle
Pass jetties. Only fish identified to at least the genus level were used in the analyses. Shannon-Weiner
diversity indices (Magurran, 1988) were calculated for each sample collected at GC 18, GI 94. ST 54, and
Belle Pass. Differences in diversity between gear types at each site were analyzed with ANOVA models
using gear as a main effect. Post-ANOVA tests (Tukey’s Studentized Range, a=0.05) were used to
determine which gear types were significantly different. Only fish identified at least to the level o f genus
were included in these analyses. Because the intent o f the similarity and diversity indices was to
characterize the taxonomic assemblages sampled by each gear type, clupeiform fishes were included for
these analyses. Taxonomic richness (either at the family or genus/species level) is used in reference to
the number o f taxa collected.
RESULTS
Overall Abundances
At the outer shelf platform (GC 18), plankton nets and light-traps collected 1.404 and 659 fish,
respectively (excluding clupeiforms). with a mean total density o f 74.6 fish/IOOm3 and a mean total
CPUE o f 2.1 fish/10 min (Table 3.1). Plankton nets collected fish from more families than light-traps, 15
o f which were exclusively from plankton nets. Light-traps collected seven families which were not
collected in plankton nets. Plankton nets collected fish from 56 taxa (identified at least to genus level).
25 o f which were not collected with light-traps; whereas light-traps collected fish from 47 taxa, with 14
being unique to light-trap collections. Mean plankton net densities ranged from 3.3-318.0 fish/100 m \
while light-trap CPUEs ranged from 0-12.2 fish /10 min (Figure 3.2). Sciaenops ocellatus. Caranx
hippos/latus, and Mugil cephalus were among the most common non-clupeiform fishes in the plankton
net collections (Table 3.2). Coastal pelagic taxa such as Auxis spp., Caranx crysos, and C. hippos/latus
were common in the surface and off-platform light-trap collections.
100
Reproduced with permission of the copyright owner. Further reproduction prohibited without permission.

Table 3.1. Number o f samples, total individuals, families, and taxa (excluding clupeiforms) collected at each site with a passive plankton net, light-trap, and plankton pushnet Mean total densities (nets) or CPUEs (light-traps) are also provided for each gear at each site. For each site, values in parentheses indicate the number o f families or taxa (at least to genus level) unique to that gear type._________________________________________________________________
Gear Type Number o f samples
Number o f fish
Mean Total Density and CPUE
Numberof
families
Number o f taxa
Green Canyon 18Passive Plankton Net Light-trap
125319
1,404659
74.6 fish/100m32.06 fish/10 min
43(15)35(7)
56 (25) 47(14)
Grand Isle 94Passive Plankton Net Light-trap
329474
3,07612,474
69.6 fish/100m3 26.2 fish/10 min
38(6)35(3)
75 (26) 78 (27)
South Timbalier 54Passive Plankton Net Light-trap
89194
1.6891,193
166.0 fish/100m3 0.6 fish/' 10 min
32 (8) 32(8)
50(16) 56 (24)
Belle Pass JettiesPlankton Pushnet Light-trap
149148
33,147849
136.7 fish/100m3 4.6 fish/10 min
39 (20) 19(0)
77(44) 34 (3)
At the mid-shelf platform (GI 94), plankton nets collected 3,076 fish while light-traps collected
12,474 fish, with a mean total density o f 69.6 fish/100 m3 and a mean total CPUE o f 26.2 fish/10 min
(Table 3.1). Plankton nets collected individuals from more families than light-traps. However, light-
traps collected more taxa (genus level) than plankton nets. Twice as many unique families were collected
by plankton nets, while the number o f unique taxa collected by each gear type was nearly identical.
Mean plankton net densities ranged from 16.6-201.0 fish/100 m3, while light-trap mean CPUEs ranged
from 1.2-197.1 fish/10 min (Figure 3.3). Benthic taxa such as Symphurus spp. and Bregmaceros cantari
were common in plankton net collections, as well as coastal pelagic species such as Auxis spp. and
Euthynmis alletteratus (Table 3.2). Among the most common fishes collected in light-traps were
synodontids (primarily Synodus foetens and S. poeyi) and blenniids (primarily Hypsoblennius invemar
and Parablennius marmoreus).
At the inner shelf platform (ST 34), plankton nets and light-traps collected 1.689 and 1,193 fish,
respectively, with a mean total density o f 166.0 fish/100 m3 and a mean total CPUE o f 0.6 fish/10 min
(Table 3.1). Due to problems with the deploying the subsurface net at this site (Table 2.1), the plankton
101
Reproduced with permission of the copyright owner. Further reproduction prohibited without permission.

■ Subsurface Net ■ Surface Net318.0
200 180
160
o 140 ° 120 w 100
} 80 </» 60
| 4020
a.
HI
O
J ?
12.17
E 5
io'* A '
Sampling Oates
I Subsurface LT ■ Surface LT Q Off-platform LT
i
i ) Jh
VK'*
o f c? ^A '
Sampling Oates
b.
Figure 3.2. Mean plankton net densities (a) and light-trap CPUEs (b) with standard errors for each sampling trip at Green Canyon 18 (1995-96). Arrows above bars point toward the off-scale mean for that gear. No subsurface plankton net samples were taken during June 26-29, August 25-28, September 24- 25, and April 15-18. No surface net, surface light-trap, or subsurface light-trap samples were taken during April 15-18. No fish were present in subsurface light-trap samples (n=10) during February 17-18.
102
Reproduced with permission of the copyright owner. Further reproduction prohibited without permission.

Table 3.2. Size ranges (SL in mm) and percent o f the total catch by gear for dominant taxa (> 1%) collected by at least one gear type. Note the preponderance o f recently-spawned larvae, late stage postlarvae, or juveniles collected with both gears. Also note the overlap in sampling efforts for GC 18 and GI 94, and ST 54 and Belle Pass._______________________________
Light-trap Plankton net
Taxon Size Range % Size Range %
Green Canyon 18 (July 1995-June 1996)
Cyclothone braueri s.2-12 5.8 4.0-13.0 1.8Saurida brasiliensis 3.2-9.8 5.8Trachinocephalus myops 16.2-35.0i 1.8Bregmaceros cantori 1.5-6.7 2.0 1.3-6.8 4.5Gobiesox stromosus 2.6-3.2 2.0Holocentrus spp. 6.0-37.5 4.0Caranx crysos 5.0-65.0 12.0 2.5-16.5 3.3Caranx hippos/latus 3.0-54.0 6.4 2.0-32.0 10.9Chloroscombrus chrysurus 1.9-7.0 1.6Elagatis bipinnulata 2.0-3.5 1.3Pristipomoides aquilonaris 2.3-40.0 3.9Eucinostomus spp. 6.5-112 i . iCynoscion arenarius 2.5-4.5 1.1 2.0-4.4 6.9Micropogonias undulatus 32-4.5 1.1Sciaenops ocellatus 1.8-3.9 12.3Pomacentrus spp. 9.0-19.3 4.7Mugil cephalus 2.4-21.5 3.8 22-5.0 9.0Microdesmus lanceolatus 2.0-11.0 1.5Microdesmus longipinnis 2.4-4.9 1.8Auxis spp. 3.3-59.0 13.3 2.2-10.5 7.6Euthynnus alletteratus 6.2-87.0 5.1 3.0-12.0 2.5Scomberomorus cavalla 3.0-4.5 1.3Scomberomorus maculatus 2.0-10.1 2.1Ariomma spp. 2.1-2.5 7.8Peprilus burti 1.7-42 2.0 1.4-3.3 12Citharichthys spilopterus 3.0-8.0 2.1Syacium spp. 3.5-6.5 2.7Symphurus spp. 22-8.0 5.3 2.8-9.0 6.9
Grand Isle 94 (April-August 1996)
Saurida brasiliensis 4.5-55.0 7.9 2.7-22.5 62Synodus foetens 6.0-43.0 30.6 4.2-22.5 1.8Synodus poeyi 5.3-45.0 15.6 2.0-16.5 12Bregmaceros cantori 2.0-29.0 3.0 2.0-15.5 16.6Caranx crysos 2.5-15.0 2.1Chloroscombrus chrysurus 2.1-16.5 1.5Lutjanus spp. 3.0-5.5 1.0Cynoscion arenarius 1.9-52 22Sphyraena guachancho 2.6-13 2.7Hypsoblennius hentz/ionthas 4.3-12.0 2.5Hypsoblennius invemar 3.5-14.5 13.8Parablennius marmoreus 4.4-23.7 12.3
103
Reproduced with permission of the copyright owner. Further reproduction prohibited without permission.

Table 3.2. (continued)
Light-trap Net
Taxon Size Range % Size Range %
Scartella/Hypleurochilus 3.6-12.5 1.7Microdesmus lanceolatus 2.4-25.0 2.2A uxis spp. 4.0-36.0 1.4 2.5-10.3 10.3Euthynnus alletteralus 3.1-60.0 5.3 2.7-8.7 10.7Etropus crossotus 2.5-9.0 2.6Syacium spp. 2.1-8.5 3.0Symphurus spp. 2.0-12.8 22.5
South Timbalier 54 (April-September 1997)
Saurida brasiliensis 26.4-43.0 1.2Synodus foetens 9.0-44.5 38.9Bregmaceros cantori 2.2-11.7 2.1Caranx crysos 6.5-24.5 2.0Caranx hippos/latus 5.5-35.0 3.8Chloroscombrus chrysurus 2.5-25.0 1.5 2.0-18.4 17.4Cynoscion arenarius 2.0-7.0 7.0 1.9-7.8 53.3Menticirrhus spp. 2.4-5.0 1.9Hypsoblennius heniz/ionthas 3.4-12.5 4.4Hypsoblennius invemar 5.7-13.8 3.6Scartella/Hypleurochilus 2.0-14.3 5.0Microdesmus lanceolatus 3.2-20.8 1.3Microdesmus spp. 2.0-3.3 1.3Auxis spp. 4.9-25.0 1.7Euthynnus alletteratus 7.0-22.5 9.1Scomberomorus cavalla 3.5-20.0 1.1 2.4-4.2 2.9Scomberomorus maculatus 2.5-40.5 6.0 1.9-10.2 4.4Peprilus burti 3.5-22.0 1.9 2.1-12.0 1.0Peprilus alepidotus 2.5-24.7 1.3 1.8-5.0 1.6Etropus crossotus 2.8-12.7 1.1 3.0-13.1 2.1Symphurus spp. 2.0-14.5 2.3Sphoeroides spp. 6.7-16.0 1.6
Belle Pass (April-September 1997)
Synodus foetens 20.0-36.0 2.7Gobiesox strumosus 7.5-10.1 8.7 4.1-10.6 1.1Membras martinica 6.1-87.0 24.1Chloroscombrus chrysurus 9.7-38.0 1.0Bairdiella chrysoura 2.9-5.1 22 2.4-125.0 2.1Cynoscion arenarius 32-82 10.8 2.5-41.0 27.5Hypsoblennius hentz/ionthas 8.3-12.0 19.1 5.1-13.5 1.7Dormitator maculatus 72-10.7 2.2Gobionellus oceanicus 11.0-13.5 2.0 7.5-35.0 6.9Gobiosoma bosc 7.7-9.6 10.9 6.5-17.0 37.3Gobiosoma spp. 42-7.6 5.0 4.7-8.1 12Microgobius spp. 4.7-10.1 3.7Citharichthys spp. 7.9-11.6 1.5 52-13.0 5.2Symphurus spp. 7.3-42.0 4.5Sphoeroides parvus 9.1-12.5 3.1
104
Reproduced with permission of the copyright owner. Further reproduction prohibited without permission.

■ Subsurface Net ■ Surface Net
<§
250
200
150
100
50
Sampling Oates
a.b.
169.2 197.1I Subsurface LT ■ Surface LT □ Off-platform LT
10090
S 80 E 70° 60
1 501ST40Ui
3 30O 20
10
i *
Sampling Dates
Figure 3.3. Mean plankton net densities (a) and light-trap CPUEs (b) with standard errors for each sampling trip at Grand Isle 94 ( 1996). Arrows above bars point toward the off-scale mean for that gear.
105
Reproduced with permission of the copyright owner. Further reproduction prohibited without permission.

net catch is almost exclusively from the surface. Plankton nets and light-traps collected fish from an
equal number o f families, but light-traps collected fish from more taxa, including unique taxa, than
plankton nets (Table 3.2). Mean plankton net densities ranged from 15.7-809.7 fish/100 m \ while mean
CPUEs ranged from 0-18 fish/10 min (Figure 3.4). Cynoscion arenarius and Chloroscombrus chrysurus
were the most dominant taxa in plankton net samples (Table 3.2). Light-trap collections were dominated
by Synodus foetens and scombrids, particularly Euthynnus alletteratus and Scomberomorus maculatus.
At the Belle Pass jetties, the pushnet and light-trap collected 33,147 and 849 fish, respectively,
with a mean total density o f 136.7 fish/100m3 and a mean total CPUE o f 4.6 fish/10 min (Table 3.1). The
pushnet collected fish from approximately twice as many families as the light-trap. including 20 unique
families. The same trend was evident in the number o f taxa collected by each gear type. No families
were unique to light-traps and only three unique taxa were collected with light-traps. Mean pushnet
densities ranged from 18.7-288.7 fish/100 m \ while mean CPUEs ranged from 0-9.7 fish/10 min (Figure
3.5). Pushnet samples were dominated by gobiids (primarily Gobiosoma bosc), and the sciaenid,
Cynoscion arenarius (Table 3.2). Dominant taxa in light-trap collections included Membras martinica,
Hypsoblennius hentz/ionthas. Gobiosoma bosc. and Cynoscion arenarius.
Within Site Comparisons of Sampling Gears
No significant differences were detected in mean total plankton net densities between surface
and subsurface collections at the outer shelf (GC 18) and mid-shelf (GI 94) platforms (Tukey's
Studentized Range Test, a=0.05). although subsurface densities were generally higher (Figure 3.6). At
the inner shelf platform (ST 54). surface nets had significantly higher mean total densities than subsurface
nets, though the sampling effort was unbalanced (Table 2.1). In contrast, light-trap collections from
surface waters (surface and off-platform light-traps) had significantly greater total CPUEs than
subsurface light-traps at all three platforms (Figure 3.6). At the outer shelf site (GC 18). overall means by
depth and location ranged from 0.7-3.2 fish/10 min, with means from surface and off-platform locations
being significantly greater than the subsurface mean (Tukey’s Studentized Range Test, a=0.05). A t the
mid-shelf platform (GI 94) overall light-trap CPUEs were the greatest o f the three platform sites and
ranged from 6.5-582 fish/10 min with significant differences detected between all light-trap
depths/locations. A t the inner shelf platform (ST 54), overall mean CPUEs ranged from 3.8-7.2
106
Reproduced with permission of the copyright owner. Further reproduction prohibited without permission.

400^ 350
"S 300 o° 250
% 200
150'(O| 100
50
a.
20 18
? 16
E 14
2 12<0 10
m 8I 6a 4
| Subsurface Net ■ Surface Net809.7
i ■ i
n?&
J*
. /j?
Sampling Dates
I Subsurface LT ■ Surface LT □ Off-platform LT
37.8
A I J i J J i
y y<V
Sampling Dates
b.
Figure 3.4. Mean plankton net densities (a) and light-trap CPUEs (b) with standard errors for each sampling trip at South Timbalier 54 (1997). Arrows above bars point toward the off-scale mean for that gear. Subsurface net samples were only taken during A pril 7-8. No subsurface light-traps were taken during May 5-8. No off-platform light-trap samples were taken during September 3-5. No fish were present in subsurface light-trap samples (n=4) during August 17-20.
107
Reproduced with permission of the copyright owner. Further reproduction prohibited without permission.

a.
Sampling Dates
i
b.
Sampling Dates
Figure 3.5. Mean pushnet densities (a) and light-trap CPUEs (b) with standard errors for each sampling trip at Belle Pass (1997). No fish were present in light-trap samples during July 19-21.
108
Reproduced with permission of the copyright owner. Further reproduction prohibited without permission.

■ Subsurface Net ■ Surface Net177.4
140
_ 120 n
o ^0001 80 (0iSZJ 60(A
i 4020
0South Tintalier Grand Isle
Locations Within Sites
Green Canyon
a.
c'EoT-—. c. m cUJ30.o
20
18
16
14
12
10
8
6
4
2
0
I Subsurface LT ■ Surface LT □ Off-platform LT
58.16
South Tirrtjatier Grand isle
Locations Within Sites
BB
Green Canyon
Figure 3.6. Mean plankton net densities (a) and light-trap CPUEs (b) with standard error bars for depths/locations within each platform site. Arrows above bars point toward the off-scale mean for that gear. For mean densities within each location, the same letter above each bar indicates no significant difference between depths based on t-tests on log-transformed data (a=0.05). For mean CPUEs within each location, the same letter above each bar indicates no significant difference between depths/locations based on Tukey’s Studentized Range test on ranked data (a=0.05). Different letters designate significant differences.
109
Reproduced with permission of the copyright owner. Further reproduction prohibited without permission.

fish/10 min with the off-platform collections being the greatest followed by the mid-piatform surface then
by subsurface collections.
Length-Frequency Analyses
Six taxa from the outer shelf site (GC 18) met the required criteria for K-S analyses involving
the differences in size frequency distributions between sampling gears (i.e., at least 10 specimens
collected by each gear), in all instances, differences in size-frequency distributions for the two gear types
were found to be statistically significant (K-S tests, p<0.05; Figure 3.7). In general, there was some size
overlap in ail gear comparisons, although the degree o f overlap and shapes o f the size distributions
differed among species. For Auxis spp., Caranx crysos. and Mugil cephalus, the plankton net samples
caught predominantly smaller individuals, while the light-trap samples generally encompassed these
smaller sizes as well as larger larvae and juveniles. For C. hippos/latus and Euthynrtus ailetieratus there
was less overlap at the smaller sizes and modal size classes for the light-trap samples were generally
larger. Only for Symphurus spp. was the modal length o f light-trap samples smaller than that for net
collections (p<0.05).
At the mid-shelf site (GI 94). 10 o f the I I taxa analyzed for differences in size distributions
(plankton net vs. light-trap) were highly significant (K-S tests. p<0.001; Figure 3.8). Size distributions
for Bregmaceros cantori, Scomberomorus cavalla, and Trichiurus lepturus appeared to substantially
overlap at the smaller sizes, but in each instance the light-trap samples encompassed a significantly
broader range o f size classes. For Auxis spp., Caranx crysos, Synodus foetens and S. poeyi there was
some overlap in size distributions, with the plankton net capturing smaller larvae, while modal sizes for
light-trap samples were always larger. Although significantly different, size distributions for
Rhombopliies aurorubens exhibited a similar bimodal distribution for each gear type. For
Scomberomorus maculatus there was no overlap at all in the sizes o f larvae captured with the two gears.
With only one taxon (Saurida brasiliensis) were plankton nets able to better catch small sizes, but also
larger size classes as well. Only one dominant taxa. Symphurus spp.. did not exhibit a significant
difference in size distribution between gears (p=0.385).
At the inner shelf site (ST 54) differences between the two gear types’ size distributions for 5 o f
the 7 taxa analyzed were highly significant (K-S tests, p<0.01; Figure 3.9). In general, light-trap size-
110
Reproduced with permission of the copyright owner. Further reproduction prohibited without permission.

03
0.25
ft 02 | 0.15
£ 0.1
0.05
n=80p<001
■ ■ ■ ■ ■13 17 21 25 29 33 37 41 45 49 53 57
Length (rim)
n>87
0.12
0.1
008
0.06
0.04
0.02
0
n=S5pOOOl
l u . b . . . i . .1 5 9 13 17 21 25 29 33 37 41 45 49 53 57 81 65
Length (imp
o diwbn1 5 9 13 17 21 25 29 33 37 41 45 49 53 57
Length (pm*
03
0.25
£ 02 f 0,5
£ 0.1 0.05
0
n«28
QQQ1 5 9 13 17 21 25 29 33 37 41 45 49 53 57 61 65
Length (mrj
Auxis spp. Caranx crysos
0.2
015
0.1
0.05
0
n*29p<0 001
III I
0.4504
0.35 5. 0.3 I 0 25 | 02 £ 0.15
0.1 0.05
0
1 4 7 10 13 16 19 22 25 28 31 34 37 40 43 46 49 52
Length (rrmj
n*97
1 4 7 10 13 16 19 22 25 28 31 34 37 40 43 46 49 52
Length (mn)
0 12 0 1
008
006
004
002 0 I
p<0 001
02
0.15
0.1
0.05
0
1 6 11 16 21 26 31 36 41 46 51 56 61 66 71 76 81 86
Length (mm)
n*22
105
. I I1 6 11 16 21 26 31 36 41 46 51 56 61 66 71 76 81 86
Length (ott)
Caranx hippos/latus Euthvnnus alleterattus
Figure 3.7. Size distributions o f fish collected with light-traps (shaded bars) and plankton nets (open bars) at the Green Canyon site ( l 995-1996). Fish length-frequency distributions were analyzed with Kolmogorov-Smimov tests (p-values are represented in the upper panel o f each gear pairing along with each sample size).
I l l
Reproduced with permission of the copyright owner. Further reproduction prohibited without permission.

Freq
uenc
y
0.35
03
025
020.15
0.10.05
09 08 07
S’ 0.8 I 0.5| 0.4 £ 0.3
0.2 0.1
0 tZL
Mugil cephalus
n*17p<0.001
9 11 13 15 17 19 21
Length (nm)
n*80
9 11 13 15 17 19 21
Length (run)
04
0.35
0.30.25
0.20.15
0.10.05
0
0.3
Length (nm)
n*24pO .05
n«S5
0.25
0.20.15
0.1005
021 3 4 5 6 7
Length (mil)
Symphurus spp.
Figure 3.7 (continued)
112
Reproduced with permission of the copyright owner. Further reproduction prohibited without permission.

0.5
0.4
0.3
0.2
0.1
n*135P<0.001
1 3 5 7 9 11 13 15 IT 19 21 23 25 27 29 31 33 35
Length (mn)
n*194
t t L .1 3 5 7 9 11 13 15 17 19 21 23 25 27 29 31 33 35
Length (mm)
n*l5p<Q.001
0.25
0.2
0.15
0 1
005
1 3 5 7 9 11 13 15 17 19 21 23 25 27 29
Length (rmQ
n*317
1 3 5 7 9 11 13 15 17 19 21 23 25 27 29
Length (rim)
Auxis spp. Bregmaceros cantori
0.18 0.16 0.14
5- 0 12 | 0.1 | 0.08 £ 006
0.04 0.02
04504
0 35 $ 03 I 0 25 % 02 £ 0.15
01 005
0
n*31 p<0 00l
i i7 10 13 IS 19 22 25 28 3t 34 37 40
length <nm)
n*45
□ □7 10 13 16 19 22 25 28 31 34 37 40
Length (mn)
02
0.15
0.1
0.05
0.25
0.2 0 15
0.1
005
0
n«42p<0 001
9 11 13 15 17
Length (rmg
L19 21 23 25
n*14
D m9 11 13 15 17
Length (mn)
19 21 23 25
Caranx crvsos Rhomboplites aurorubens
Figure 3.8. Size distributions o f fish collected with light-traps (shaded bars) and plankton nets (open bars) at the Grand Isle site (1996). Fish length-frequency distributions were analyzed with Kolmogorov-Smimov tests (p-values are represented in the upper panel o f each gear pairing along with each sample size).
113
Reproduced with permission of the copyright owner. Further reproduction prohibited without permission.

0 18 0.16 0.14
fr 0.12I 0.1 I 0 08 £ 0 06
0.04 0.02
n«812p<0.001
02
0.15
01
005
0
1 5 9 13 17 21 25 29 33 37 41 45 49 53 57 61
Ltnglh (fnrty
n*122
Ita mUa
1 5 9 13 17 21 25 29 33 37 41 45 49 53 57 61
Length (mm)
0.180.160.140.120.1
0.080.060.04002
n*63p<0.001
iiJlL1 5 9 13 17 21 25 29 33 37 41 45 49 53 57 61 65
Length (rrnt
n*100.4504
0.35 & 03 I 0 25 g 0.2 £ 0.15
0 1 0.05
01 5 9 13 17 21 25 29 33 37 41 45 49 53 57 61 65
Length (mn)
Saurida brasiliensis Scomberomorus cavalla
0 120.1
£ 0 08
5 0 06 2£ 0.04
002 0
n=35p<0 001
I I II I1 4 7 10 13 16 19 22 25 28 31 34 37 40 43 46 49 52 55
Length ((tin)
0 12 0 1
£ 0.08
I 0.06
£ 0 04
0 02 0
n«801p<0 001
1 4 7 10 13 16 19 22 25 28 31 34 37 40 43
Length (irm)
09
05
0.4
0.3
0.2 0 1
0
n*10 025
0.2 0 15
rt*40
005
01 4 7 10 13 16 19 22 25 28 31 34 37 40 43 46 49 52 55
Length (mn)
bfl1 4 7 10 13 16 19 22 25 28 31 34 37 40 43
Length (mn)
Scomberomorus maculatus Synodus foetens
Figure 3.8 (continued)
114
Reproduced with permission of the copyright owner. Further reproduction prohibited without permission.
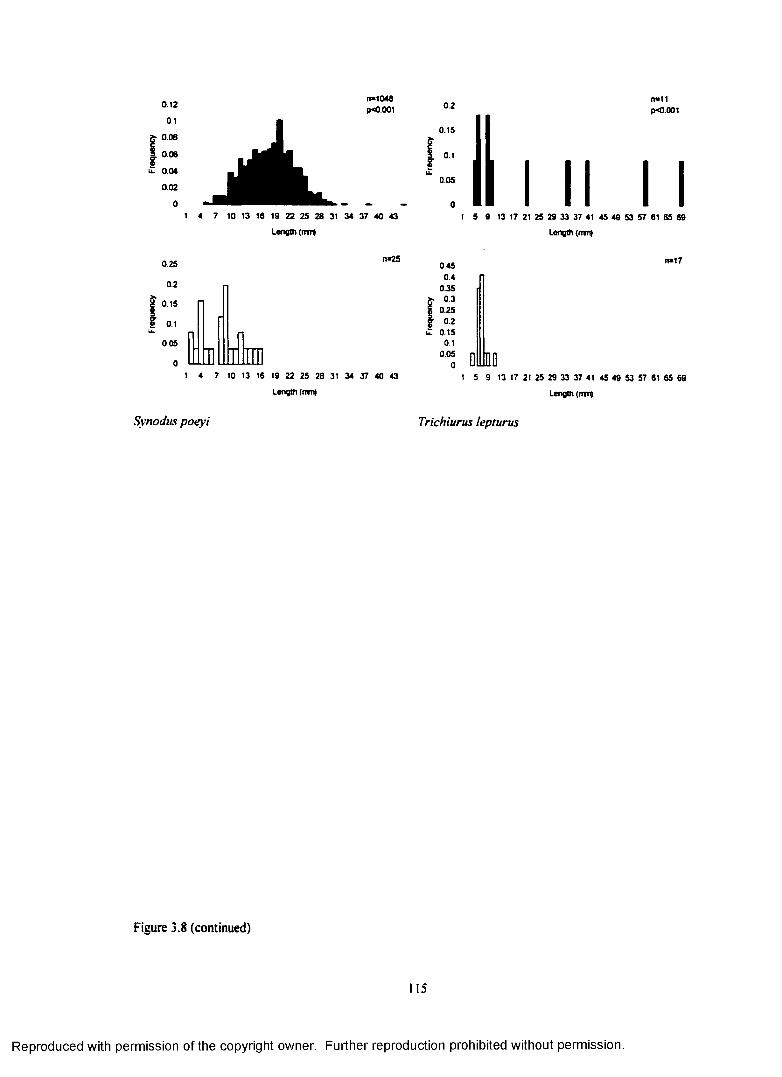
0.12
0.1 S’ 0.06
I 0.06 %it 0.04
0.02
0
025
02
| 0 15? 0.1 Ik
005
0
n*1048p<0.001
7 10 13 16 19 22 25 28 31 34 37 40 43
Length (mm)
n*25
l l t r aI 7 10 13 16 19 22 25 28 31 34 37 40 43
Length (nvn)
0.4504
0.350.3
0.250.2
0.150.1
0.050
1 5 9 13 17 21 25 29 33 37 41 45 49 53
Length (rmty
Hide1 5 9 13 17 21 25 29 33 37 41 45 49 53
Length (im)
Synodus poeyi Trichiurus lepturus
Figure 3.8 (continued)
115
Reproduced with permission of the copyright owner. Further reproduction prohibited without permission.
n*HpO.001
57 61 65 69
n«17
57 61 65 69

n«12p<0.01
8 9 10 11 12 13
Length (mm)
0.14
0.12
0.1006
0.06
0.04
0.02
n=90pO.001
Length (mmj
0.18 0.16 OH
fi* 0 -12 | 0 1 | 0-08 £ 0 06
0.04 002
0
n*30
8 9 10 11 12 13
0.450.4
0.350.3
0250.2
0.150.1
0.050
n*10
0
Length (mm)
9 11 13 15 17 19 21
Length (rnrn)
Etropus crossotus Euthynnus alletteratus
016 014
012 ST 01 1 0.08 I 0 06
0.04002
03
025
ff 02| 0 15
£ 0 1 005
0
n»21 pO 005
Length (rmu
03 11 13 15
Length (mn)
17 19 21
Peprilus burti
016 014 0.12
£ 01 I ° 08f 0.06
0.04002
05
04
03
020.1
0
n*14p<0.001
I9 11 13 15 17 19 21 23
Length (nm)
n-22
m9 11 13 15 17 19 21 23
Length (mn)
Peprilus paru
Figure 3.9. Size distributions o f fish collected with light-traps (shaded bars) and plankton nets (open bars) at the South Timbalier site ( 1997). Fish length-frequency distributions were analyzed with Kolmogorov- Smimov tests (p-values are represented in the upper panel o f each gear pairing along with each sample size).
116
Reproduced with permission of the copyright owner. Further reproduction prohibited without permission.

Freq
uenc
y Fr
eque
ncy
0.14
0.12
0.1
0.08
0.06
0.04
0.02
1 4 7 10 13 16 19 22 25 28
Length (mn)
0.403503
02502
0.1501
0050 lH ,
10 13 16 19 22 25 28
Length (rrm)
Scomberomorus maculatus
Figure 3.9 (continued)
n*641X0.001
I I . .31 34 37 40
n=63
31 34 37 40
Reproduced with permission of the copyright owner. Further reproduction prohibited without permission.

frequency distributions for Peprilus burti, P. paru, and Scomberomorus maculatus encompassed that o f
the plankton net distributions, but also included larger sizes. L ittle overlap in size distributions was
observed for Euthynnus alletteratus, with light-trap collections being much larger. Distributions o f
Etropus crossotus broadly overlapped, although plankton nets collected a wider range o f smaller and
larger size classes. Two dominant species, Bregmaceros cantori and Chloroscombrus chrysurus did not
exhibit a significant difference in size distributions between the two gear types (p=0.998 and p=0.l33,
respectively).
In contrast to the platform sites, size distributions for pushnet vs. light-trap collections at the
Belle Pass jetties were significantly different (K-S tests, p<0.05) for only 3 o f the 11 taxa analyzed
(Figure 3.10). There was a broad overlap in the size distributions for Gobiosoma spp. and Hypsoblennius
hentz/ionthas, but in each case the pushnet samples collected larger sized individuals with greater
frequency. In contrast, the light-trap size distribution for Membras martinica had an intermediate
dominant mode.
Lunar Periodicity
A t the mid-shelf platform (G I94) during new moon phases, mean total CPUEs for light-traps
were significantly higher than during full moons (Student’s t-test, p<0.000l: Figure 3.11), while mean
plankton net densities had the opposite trend (p<0.01). The special lunar study conducted at GI 94 which
compared three lunar phases (first quarter, new. and third quarter moon phases sampled in May 1996).
however, yielded no significant differences in mean total light-trap CPUEs or mean total plankton net
densities between the three phases (Tukey’s Studentized Range test, p<0.05; Figure 3.12). A t the inner
shelf platform (ST 54) there were no significant difference in total CPUEs between new and fu ll moon
phases (p=0.5635: Figure 3.13), however, mean total density during new moon phases was significantly
higher than fu ll moons (p<0.05). Both results are in contrast to the findings at GI 94. At the Belle Pass
jetties, mean total CPUEs and pushnet total densities were significantly higher during new moon periods
(Student's t-tests. p<0.0003 and p<0.0001, respectively: Figure 3.14). Therefore, when significant lunar
differences were found, four out o f five instances had greater new moon catches.
118
Reproduced with permission of the copyright owner. Further reproduction prohibited without permission.

0.6
0.5
0.4
0.3
0.20.1
0
pO.001
Length (mn)
0.7
0.60.5
0.40.3
0.20.10
n*l53pO.05
1 2 3 4 5 6 7 6 9 10 11 12 13
Length (nm)
0.5
04
| 03| 02 IL.
0.1
0
n«309
4 5
Length (rmt)
05
0.4
| 03 I 0 2u.
01
0
n-456
6 7 S 9 10 11 12
Length (nrt
Gobiosoma spp. Hypsoblennius hentz/ionthas
0 14
0 12 0.1
1 0.08 | 0.06 £ 0 04
0.02
0.2
015
0.1
0.05
0
L u ■a
n«132p<0.001
i i a n1 6 11 16 21 26 31 36 41 46 51 56 61 66 71 76 81 86
Length (run
n«204
0Qsi6b m0 ft#..ILIllftlIL.1 6 11 16 21 26 31 36 41 46 51 56 SI 66 71 76 81 86
Length (mr)
Membras martinica
Figure 5 .10. Size distributions o f fish collected with light-traps (shaded bars) and a pushnet (open bars) at the Belle Pass site (1997). Fish length frequency distributions were analyzed with Kolmogorov-Smimov tests (p-values are represented in the upper panel o f each gear pairing along with each sample size).
119
Reproduced with permission of the copyright owner. Further reproduction prohibited without permission.

140 pO.0055
g 120o° 100inWS
inc£cma>5
80
60
40
20
0Full Moon New Moon
Lunar Phase
a.
30 p<0.0001
• 25
< i : 20 . :VI
UJ3Q.OcQ0)5
15
10
Full Moon New Moon
Lunar Phase
b.
Figure 3 .11. Mean plankton net density (a) and light-trap CPUE (b) with standard error bars for each lunar phase sampled at Grand Isle 94 (Apr-Sep 1996). The p-values indicate statistical significance from t-tests.
120
Reproduced with permission of the copyright owner. Further reproduction prohibited without permission.
^

2? 30 '</>
1 20c§ 102
0Last Quarter Moon New Moon
Lunar Phase
First Quarter Moon
a.
Last Quarter Moon New Moon
Lunar Phase
First Quarter Moon
Figure 3.12. Mean plankton net density (a) and light-trap CPUE (b) with standard error bars for each lunar phase sampled in May 1996 at Grand Isle 94. The same letter above each bar indicates no significant difference between the lunar phases based on Tukey's Studentized Range tests on ranked data (a=0.05).
121
Reproduced with permission of the copyright owner. Further reproduction prohibited without permission.
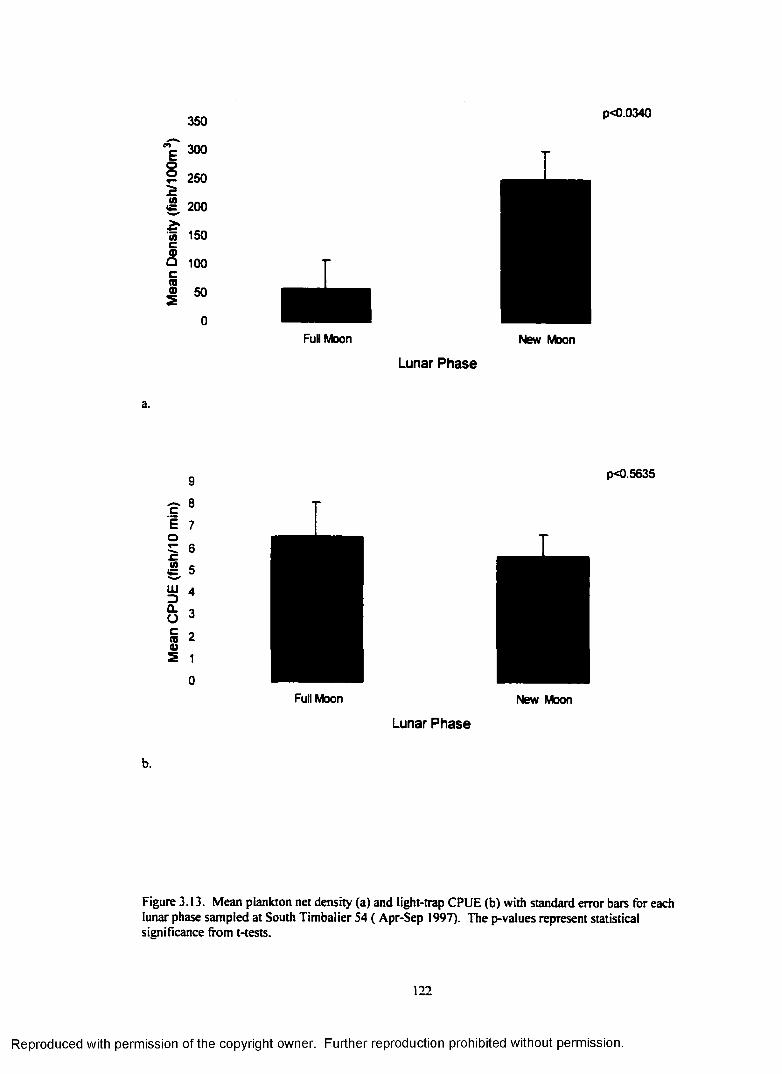
350
300
250
200
150
100 c m® 50
p<0.0340
5uig ,>.*</>
£cna>2
Full Moon New Moon
Lunar Phase
a.
cEoc.Ui
UJ3Q.Ocrau 5
p<0.5635
Full Moon New Moon
Lunar Phase
b.
Figure 3.13. Mean plankton net density (a) and light-trap CPUE (b) with standard error bars for each lunar phase sampled at South Timbalier 54 ( Apr-Sep 1997). The p-values represent statistical significance from t-tests.
122
Reproduced with permission of the copyright owner. Further reproduction prohibited without permission.

£
Full Moon New Moon
Lunar Phase
p<0.0003
FuD Moon New Moon
Lunar Phase
Figure 3.14. Mean pushnet density (a) and light-trap CPUE (b) with standard error bars for each lunar phase sampled at Belle Pass ( Apr-Sep 1997). The p-values represent statistical significance from t-tests.
123
Reproduced with permission of the copyright owner. Further reproduction prohibited without permission.

Similarity and Diversity of Ichthyoplankton Assemblages Within Sites
Within site comparisons o f gears and surface sampling locations indicated that off-platform and
surface light-trap collections were more similar to each other (Schoener's Index o f Similarity values range
from 0.4S-0.76) than each was to surface plankton net collections (0.27-0.71), although the disparity
between the index gear comparisons is smaller at ST 54 (0.59-0.71; Table 3.3). Overall, total light-trap
collections were relatively different from total plankton net samples at the outer shelf (GC 18) and mid
shelf (GI 94) platforms (0.38 and 0.32, respectively), but were much more similar at the inner shelf
platform (ST 54) and Belle Pass jetties (0.63 and 0.61, respectively).
Table 3.3. Schoener's Index o f Niche Overlap values for different surface gear and location comparisons. (OL) off-platform light-trap, (SL) surface light-trap, (SN) surface net, (TL) total light-traps, (TN) total nets______________________________________________________
OL vs SL OL vs SN SL vs SN TL vs TN
Green Canyon 18 0.53 0.32 0.31 0.38Grand Isle 94 0.45 0.37 0.27 0.32South Timbalier 54 0.76 0.71 0.59 0.63Belle Pass 0.61 0.61 J
{Calculation is the same as with SL vs. SN since only a surface pushnet and surface light-trap were used.
There was little difference in the Shannon-Weiner diversity index values from gear and
depth/location samples collected at the outer shelf (GC 18) and inner shelf (ST 54) platforms (Figure
3.15). In both instances, only subsurface light-trap samples had significantly lower diversity values than
the other gear and depth/location combinations (a=0.05). No clear pattern in diversity was discemable at
the GI 94 site other than surface net collections were significantly different from light-trap collections and
that o ff platform light-trap collections were different from net collections regardless o f depth. A t the
Belle Pass jetties, pushnet samples were significantly more diverse than the light-trap samples.
124
Reproduced with permission of the copyright owner. Further reproduction prohibited without permission.

Reproduced
with perm
ission of the
copyright ow
ner. Further
reproduction prohibited
without
permission.
I£Ioccra•CU i
22 2
IB 16 14 1 2
1 08 06 04 02
0
A
i MSurface
A A
I ■Subsurface
NetSubsurfaceLight-trap
Gear
SurfaceUght-lrap
Off-platformLight-trap
2 2
k 2 « 18 S . 16V 14'5 12
& 06 § 06r . 04U i
02
bcoe ^
7 A BCD 0006 TmilSurface
NetSubsurface
NetSubsurfaceLight-trap
Gear
SurfaceUght-trap
Off-platformLight-trap
toLA
Outer Shelf (GC 18)
22 2
18 16
| 14 S 121 1 5 06re■CU i
0402
0
A
i iSubsurface Subsurface
Net Lighl-trap
Gear
SurfaceLight-trap
Off-platformLight-trap
M id-Shelf (GI 94)
2 22
3 18
^ 14 53 1 2
siCO 04
0 20
Rishnet Ught-trap
Gear
Inner Shelf (ST 54) Belle Pass Jetties
Figure 3 .1 S. Mean Shannon-Weiner diversity indices (with standard error bars) for each gear type and sampling location for each site. The same letter above each bar indicates no significant difference between the gear types based on Tukey's Studentized Range tests (a=0.05). Different letters indicate significant differences.

DISCUSSION
Gear Selectivity
The most obvious trend observed during this study was the overwhelming presence o f engraulids
and clupeids at a ll sites, even on the shelf slope site (Chapter 2). Light-trap and plankton net collections
(total catch) were dominated by clupeiform fishes at the outer (59%), mid- (66%), and inner shelf (97%)
platforms, and the Belle Pass jetties (74%). The dominance o f these taxa is not unexpected, particularly
considering the abundances o f these fishes in the northern G ulf and the sampling gears utilized.
Clupeiform fishes are often among the most abundant in plankton surveys o f the northern G ulf and are
present year-round in shelf waters (D itty, 1986; Ditty' et al.. 1988; Finucane et al., 1979). Light-traps are
selective sampling devices and previous studies have demonstrated that often the catches are dominated
by a single taxonomic group (Brogan. 1994; Choat et al., 1993; Sponaugie and Cowen, 1996; Thorrold.
1992). Clupeiform fishes have been shown to be particularly photopositive and have dominated the total
catches in several studies utilizing light-aggregating collection techniques (Brogan. 1994; Choat et al..
1993; Dennis et al.. 1989; Rookeret al., 1996). The pushnet used in this study actively collects fish and
was relatively large ( I m x I m). It has also been shown to be an effective collector o f clupeiforms in
previous studies (Herke, 1969; Kxiete and Loesch, 1980; Raynie and Shaw. 1994). While the light-trap
collects fish based on taxon-specific. photopositive behaviors and the pushnet actively strains the water
mass it samples, the plankton nets in the platform study collected fish passively with tidal currents. Even
so, it was also very effective in sampling these fishes. This catchability was undoubtedly aided by the
nocturnal sampling design.
Even with these sampling efficiency enhancements, these three sampling techniques clearly
displayed gear selectivity as evident by differences in taxonomic richness between gear types. Passive
plankton nets collected fish from more unique families than light-traps at the outer shelf (GC 18:15 vs.
7) and mid-shelf (GI 94:6 vs. 3) platforms, but not at the inner shelf platform (ST 54, eight unique
families to each gear). At the Belle Pass jetties, the pushnet collected individuals from 20 unique
families, as well as fish from all families sampled by light-traps. Previous studies comparing light-traps
and plankton nets in marine waters have found sim ilar results (i.e.. light-traps collected fewer families
than plankton tows) with only a few instances where light-traps collected unique families. Brogan (1994)
126
Reproduced with permission of the copyright owner. Further reproduction prohibited without permission.
collected 16 unique families with a diver-steered pushnet and only 4 unique families with light-traps, and
the latter 4 families, when combined, comprised a very small proportion (<0.08%) o f his total light-trap
catch. Likewise, more unique families were collected with a neuston net (10) than with light-traps (4)
when fished simultaneously in Onslow Bay, North Carolina, and the unique light-trap families comprised
only 10% o f the total light-trap catch (Hernandez and Lindquist 1999). Their results are similar to those
in this study, where unique light-trap families usually made up less than 1% o f the total catch at each
platform site. However, whereas the previously cited studies each collected only four unique families
with light-traps, seven (GC 18) and eight (ST 54) unique families were collected with light-traps in this
study. Neither Choat et al. (1993) nor Hickford and Schiel (1999) reported any families in light-trap
samples that were not present in plankton net samples.
In addition, the large numbers o f unique taxa (identified at least to genus level) collected by
light-traps (Table 3.1) was also surprising, since this gear is usually considered to be very taxon-specific
and therefore, limited in its sampling scope. A t the genus level, light-traps collected more unique taxa
than plankton nets at the mid- (27 vs. 26) and inner shelf platforms (24 vs. 16), but not at the outer shelf
platform (14 vs. 25). At Belle Pass, however, the light-traps collected far fewer unique taxa (3) than did
the pushnet (44). Such large numbers o f unique taxa have not been previously reported for light-traps in
gear comparison studies. Two studies have reported data at the genus level and found either that all taxa
collected by light-traps were collected by nets (Hickford and Schiel. 1999), or that there were more
unique taxa in the net collections than light-trap collections (Hernandez and Lindquist, 1999). In this
study, light-traps proved very useful in sampling available taxa that were not collected by plankton nets.
Trends in taxon selectivity by gear were supported in the similarity indices between the gear
types within a given site (Table 3.3). At the outer shelf (GC 18) and mid-shelf (GI 94) platforms, there
was greater sim ilarity between the light-trap samples, regardless o f location, than there was between the
surface light-trap collections (either o ff platform or central location) and the surface net collections.
Again, this indicates the behavioral or developmental responses o f different fish taxa influence their
susceptibility to different sampling gears (Hernandez and Lindquist, 1999). The trend was not as evident
at the inner shelf platform (ST 54), but this is not surprising as 97% o f the total catch by both gears was
comprised o f clupeiform fishes, which are very susceptible to both gear types (Schoener’s Similarity
127
Reproduced with permission of the copyright owner. Further reproduction prohibited without permission.

Index for total light-trap vs. total net collections = 0.63). There was also a relatively high similarity index
value (0.61) for the pushnet vs. light-trap comparison at Belle Pass, even though the pushnet had
collected many unique taxa. Again, this site was dominated by clupeiform fishes (74% o f total catch),
and light-traps are effective in sampling these fishes, resulting in a higher than expected similarity value.
In addition, the pushnet's unique taxa were relatively rare and, therefore, had a limited influence in the
calculation o f the sim ilarity index.
The presence o f rare and unique taxa in plankton pushnet collections at the jetties did increase
the diversity o f the assemblage, however (Figure 3.15). In contrast, few differences were observed
between the passive plankton net and light-trap collections at the platforms. Several studies have
investigated differences in taxonomic richness between different gear types, although few, i f any, have
reported diversity data. Choat et al. (1993) collected individuals from more families with a bongo net (63
families), a lighted-seine net (37 families), neuston net (3 1 families). Tucker trawl (29 families), and
purse seine (25 families) than with a light-trap (20 families) in a gear comparison study within Australia's
Great Barrier Reef. In the G ulf o f California. Brogan (1994) collected more reef fish larvae and juveniles
from different families with a diver-steered plankton net (43 families) than with a light-trap (31 families).
Hernandez and Lindquist (1999) collected more fish larvae and juveniles from different families with a
neuston net (24 families) than with either o f the two light-trap designs employed (18 and 2 1 families) in a
study in Onslow Bay, North Carolina. In each o f these studies, the authors concluded that the taxonomic
assemblage collected in their respective studies was very method-dependent, and the same appears to be
true in the present study.
The results o f this study further illustrate the benefits that multiple gear types can bring to
ichthyoplankton studies by sampling a more complete range o f size classes, ages, and developmental
stages (Brogan, 1994; Choat et al., 1993: Hernandez and Lindquist. 1999). O f the 24 length-frequency
comparisons between passive plankton nets and light-traps. 21 exhibited statistically significant
differences (Figures 3,7-3.9). In the instances where no significant differences were found, the
distributions either overlapped substantially (Symphurus spp., Figure 3.8 and Bregmaceros cantori,
Figure 3.9) or suffered from too few individuals in the larger size classes for a significant statistical
difference to be found {Chloroscombrus chrysurus, Figure 3.9). In general, the light-trap was more
128
Reproduced with permission of the copyright owner. Further reproduction prohibited without permission.

effective in sampling larger size classes o f the same species at each location, depth, or site. In some
cases, the light-trap collections did not encompass a significant portion o f the plankton net's smaller sizes,
but clearly excelled at capturing the larger sizes. This was the case with Caranx crysos and
Scomberomorus maculatus (Figure 3.8) and for Euthynnus alletteratus (Figures 3.7 and 3.9). In other
instances, the light-trap collections appeared to significantly overlap the smaller sizes o f the net
collections, but also augmented the size-frequency distribution with much larger sizes, or in some cases,
even additional modes, as was the case for C. crysos (Figure 3.7) and S. cavalla (Figure 3.8).
By using multiple gears and methodologies, the presence o f a number o f taxa with a fu ll range o f
life history stages, ranging from recently-spawned larvae to juveniles, was confirmed. For example, at
the outer shelf platform (GC 18) the plankton net collected Euthynnus alletteratus within a smaller size
range (3.0-12.0 mm) than the light-trap (6.2-87.0 mm). I f plankton net collections were not
supplemented with light-trap catches, larger juveniles at this site would have been overlooked.
The advantages o f plankton pushnets (see introduction) proved useful in sampling the edges o f
the jetty environment which is structurally complex. The boat and pushnet were maneuvered very close
to the shallow slope o f the rock wall with relative ease. In general, net avoidance is reduced with
pushnets compared to towed nets, because the net fishes in advance o f the boat, its shadow and its
propeller wash (Raynie and Shaw, 1994). The large mesh size (1000 pm) and net opening ( I m x 1 m)
minimizes the pressure wave in front o f the net and minimizes net clogging, enhancing the ability to
collect larger larvae and postsettlement juveniles. As a result, many o f the size distributions sampled
with the pushnet and light-trap at Belle Pass overlapped considerably (Figure 3.10). Only 3 o f the 11
species analyzed exhibited significant size differences between the gear types. In one instance, the
pushnet collections clearly had a larger size mode than the light-trap (Figure 3.10. Gobiosoma spp.).
While the same size classes were targeted with the pushnet, its usefulness was in sampling different taxa.
The number o f families (39) and taxa identified to the genus level (77) were approximately double that o f
the light-traps (19 and 34. respectively), which generated a taxon diversity for the pushnet collections that
was significantly higher than that for the light-trap (Figure 3.15). Once again, multiple gear types
allowed for the collection o f a more complete representation o f the ichthyoplankton and juvenile fish
assemblages at the jetty site as well.
129
Reproduced with permission of the copyright owner. Further reproduction prohibited without permission.

Lunar Periodicity
Lunar periodicities were investigated because there are many hypotheses on lunar reproductive
patterns pertaining to propagule dispersal and predation rates that occur both at the beginning (spawning)
and end (settlement) o f the planktonic phase (Robertson 1991). Many reef fish appear to time their
spawning events with different lunar cycles (Thresher 1984). Higher rates o f fish settlement often occur
during darker, new moon periods than fu ll moon periods (V ictor 1986; Rooker et al. 1996). presumably a
response to mortality associated with visual predators. These patterns o f spawning, transport,
recruitment, and settlement in association with the local physical oceanographic regime, often result in
variable larval supply and settlement patterns with distinct lunar periodicities. Since the sampling
transect is downstream o f the Mississippi River plume and extends from an outer shelf platform to a
coastal jetty, baroclinic pressure gradients, wind-driven currents, and tides are important transport
considerations. It should be noted, however, that in the northern G ulf o f Mexico tides are dominantly
diurnal and their range in tidal height is not often in synchrony with the phase o f the moon (i.e., new and
full moon maximum tide ranges vs. first quarter and third quarter minimums), but rather the tidal range is
in synchrony with the tropical and equatorial phases o f the moon's elevation (i.e.. Tropic o f Cancer and/or
Capricorn crossing maximum tidal ranges vs. equatorial crossing minimums: McLellan 1965).
In addition, the effects o f ambient light on gear selectivity were investigated. Since light-traps
rely on the illumination o f the surrounding water mass to attract fish, the contrast in trap-generated
illumination should be greater (and theoretically more efficient) when there is less ambient light, such as
during a new moon phase (all larval and postlarval supply/availability issues being equal).
Few studies utilizing light-aggregating devices have addressed gear efficiency within the
framework o f lunar periodicities in fish spawning, larval supply (transport) and settlement. Gregory and
Powles (1985) observed higher catches during new moon phases in a freshwater system but didn't report
a statistical difference. Rooker et al. (1996) used a nightlight lift-net in nearshore habitats in Puerto Rico
and reported that new moon abundances o f larval fish were four times higher than the next most abundant
phase (last quarter) during the summer months, and suggested that ambient light intensities might have
played a factor in gear efficiency. The competitive interaction o f lunar vs. light-trap illumination may
have played a role in the collection o f fish at Belle Pass, where significantly higher CPUEs were observed
130
Reproduced with permission of the copyright owner. Further reproduction prohibited without permission.

during new moons (Figure 3.14). Jetty pushnet collections also had significantly more fish during new
moons, possibly due to decreased visual avoidance under lower ambient light conditions. It is d ifficult,
however, to separate the effects o f ambient illumination and gear performance from the supply and/or
settlement patterns o f the fishes, so lunar periodicity may still play a role in the occurrence o f fishes at
this site.
In addition, the situation at petroleum platforms may be equally d ifficu lt to discern, since
platforms have many bright lights throughout the structure to illuminate the work areas at night and to aid
ship navigation, which may in effect be attracting fish to the structure (i.e.. fishing a light-trap within a
giant "light-trap"). This issue was at least partially addressed by sampling away from the structure (i.e..
20 m downstream), but even these off-platform light-trap collections could still be within the "halo
influence" o f the platform’s light field. S till, when significant differences in mean total densities and
mean total CPUEs were found between new vs. fu ll moon phases, four out o f five instances had greater
new moon catches (Figure 3.11). The analysis o f the May samples at G194 taken over three lunar phases
was disappointing, however, since it showed very little difference between the lunar phases for both gears
(Figure 3.12). Although these platform results on lunar periodicity are less than conclusive, there may be
several explanations for the lack o f a consistently strong pattern. First o f all. the previously mentioned
potential competitive interference o f the platform's large ambient light-field may have partially masked
any lunar effect that would otherwise be present. Secondly, some o f the species may be responding
differently to lunar cues. For example, some peak recruitment events for tropical and coastal fishes have
also been linked to fu ll moon periods (Johannes. 1978; Robertson et al., 1988). In addition the light-traps
generally caught more larger sized (and presumably older, more competent) larvae, whereas plankton net
collections were dominated by smaller sized larvae which could have been displaying different behavioral
capabilities. Finally, it is possible that the abundances o f these fish are related to more localized factors
such as water mass supply, particularly at the mid- and inner shelf sites where the coastal current regime
can dynamically affect salinity, temperature, and food patchiness, and where the geographical
concentration o f upstream platforms, which may represent potential spawning sites, is greatest when
compared to the relative isolated shelf slope site.
131
Reproduced with permission of the copyright owner. Further reproduction prohibited without permission.

In summary, the combination o f the light-trap and the passive plankton nets were effective in
collecting fish larvae and juveniles within the complex infrastructure o f the o il and gas platforms sampled
in the northcentral G u lf o f Mexico. Surprisingly, the light-trap collected individuals from a wide range o f
taxa, including many unique taxa that were not collected with the plankton net. As in previous studies,
the light-trap generally collected larger individuals (postflexion larvae and juveniles) than the plankton
net, but also performed very well at the smaller sizes. Pushnet collections from the jetties were more
taxonomically rich and diverse than light-trap collections, and the pushnet was equally effective in
capturing large individuals as the light-trap. The use o f multiple gear types in ichthyoplankton studies
needs to become more common, since they can provide the researcher with a more complete view o f
larval and juvenile fish assemblages. For example, the combination o f sampling gears at the platforms
allowed for the collection o f a wider range o f taxa, size classes, and developmental life stages than either
gear would have provided individually. This enabled us to confirm the presence o f both recently-
spawned larvae, larger or near-settlement size postlarvae, and juveniles at the sampling sites.
REFERENCES
Brander. K. and A.B. Thompson. 1989. Diel differences in avoidance o f three vertical profile sampling gears by herring larvae. Journal o f Plankton Research 4:775-784.
Brogan. M.W. 1994. Two methods o f sampling fish larvae over reefs: a comparison from the G u lf o f California. Marine Biology 118:33-44.
Choat, J. H, P.J. Doherty, B.A. Kerrigan and J.M. Leis. 1993. A comparison o f towed nets, purse seine, and light-aggregation devices for sampling larvae and pelagic juveniles o f coral reef fishes. Fishery Bulletin 91:195-209.
Continental Shelf Associates. 1982. Study o f the effect o f o il and gas activities on reef fish populations in the G ulf o f Mexico OCS area. OCS Report/MMS82-010. U.S. Dept, o f the Interior, Minerals Management Service, G ulf o f Mexico OCS Region, New Orleans.
Dennis. G.D., D. Goulet and J.R. Rooker. 1991. Ichthyoplankton assemblages sampled by night lighting in nearshore habitats o f southwestern Puerto Rico. NOAA/NMFS Technical Report U.S., Department o f Commerce 95.
Ditty, J.G. 1986. Ichthyoplankton in neritic waters o f the northern G ulf o f Mexico o ff Louisiana: composition, relative abundance and seasonality. Fishery Bulletin 84:935-946.
Ditty, J.G.. G.G. Zieske and R.F. Shaw. 1988. Seasonality and depth distribution o f larval fishes in the northern G ulf o f Mexico above latitude 26°00'N. Fishery Bulletin 86:811-823.
Doherty, P.J. 1987. Light-traps: selective but useful devices for quantifying the distribution and abundances o f larval fishes. Bulletin o f Marine Science 41:423-431.
132
Reproduced with permission of the copyright owner. Further reproduction prohibited without permission.

Finucane, J.H., L.A. Collins, L.E. Barger and J.D. McEachran. 1979. Environmental Studies o f the South Texas Outer Continental Shelf 1976: Ichthyoplankton/mackerel eggs and larvae. NOAA Final Report to BLM, Contract Number AA550-TA7-3. NMFS Southeast Fisheries Center, Galveston.
Floyd, K.B., W.H. Courtenay and R.D. Holt. 1984. A new larval fish light trap: the quatrefoil trap. Progressive Fish-Culturist 46:216-219.
Gallaway, B.J., L.R. Martin, R.L. Howard, G.S. Boland and G.D. Dennis. 1980. A case study o f the effects o f gas and o il production on artificial reef and demersal fish and macrocrustacean communities in the northwestern G u lf o f Mexico. Expo Chem 1980, Houston, Texas.
Gallaway, B.J. 1981. An ecosystem analysis o f o il and gas development on the Texas-Louisianacontinental shelf. FWS/OBS-81/27. U.S. Fish & W ildlife Service, Office o f Biological Services, Washington, D.C.
Gallaway, B.J. 1998. Cumulative ecological significance o f o il and gas structures in the G u lf o f Mexico: Information search, synthesis, and ecological modeling: Phase I, Final Report. U. S. Geological Survey, USGS/BRD/CR-1997-0006. Biological Research Division, Washington, D .C ..
Gregory, R.S. and P.M. Powles. 1985. Chronology, distribution, and sizes o f larval fish sampled by light traps in macrophytic Chemung lake. Canadian Journal o f Zoology 63:2,569-2,577.
Herke, W.H. 1969. A boat-mounted surface push-trawl for sampling juveniles in tidal marshes. Progressive Fish- Culturist 31:177-179.
Hernandez, F.J., Jr. and D.G. Lindquist. 1999. A comparison o f two light-trap designs for samplinglarval and presettlement juvenile fish above a reef in Onslow Bay, North Carolina. Bulletin o f Marine Science 64: 173-184.
Hickford. M.J.H. and D.R. Schiel. 1999. Evaluation o f the performance o f light traps for sampling fish larvae in inshore temperate waters. Marine Ecology Progress Series 186:293-302.
Johannes, R.E. 1978. Reproductive strategies o f coastal marine fishes in the tropics. Environmental Biology o f Fishes 3:65-84.
Keener, P.. G.D. Johnson, B.W. Stander, E.B. Brothers and H.R. Beatty. 1988. Ingress o f postlarval gag Xfycteroperca microlepis (Pisces: Serranidae). through a South Carolina Barrier island inlet. Bulletin o f Marine Science 42(3):376-396.
Kingsford, M. J. and J.H. Choat. 1989. Horizontal distribution patterns o f presettlement reef fish: are they influenced by the proximity to reefs? Marine Biology 101:285-297.
Kriete, W.H., Jr. and J.G. Loesch. 1980. Design and relative efficiency o f a bow-mounted pushnet for sampling juvenile pelagic fishes. Transactions o f the American Fisheries Society 109:649-652.
Leis. J.M. 1991. The pelagic stage o f reef fishes: the larval biology o f coral reef fishes. In Sale, P.F., editor. The Ecology o f Fishes on Coral Reefs. Academic Press. San Diego.
Lukens. R.R. 1981. Ichthyofaunal colonization o f a new artificial reef in the northern G u lf o f Mexico. G ulf Research Reports 7(l):41-46.
Magurran. A.E. 1988. Ecological Diversity and Its Measurement. Princeton University Press. Princeton.
Marliave. J.B. 1986. Lack o f planktonic dispersal o f rocky intertidal fish larvae. Transactions o f the American Fisheries Society 115:149-154.
I
Reproduced with permission of the copyright owner. Further reproduction prohibited without permission.

McLellan, H.l. 1965. Elements o f Physical Oceanography. Pergamon Press, Oxford.
Moser, H.G., W.J. Richards, D.M. Cohen, M.P. Fahay, A. Kendall and S. L. Richardson, editors. 1984. Ontogeny and systematics o f fishes. Special Publication Number 1, American Society o f Ichthyologists and Herpetologists, Lawrence.
Murphy, G.I. and R.I. Clutter. 1972. Sampling anchovy larvae with a plankton purse seine. Fishery Bulletin 70(3):789-798.
Parker, R.O., Jr., D.R. Colby T.P. Willis. 1983. Estimated amount o f reef habitat on a portion o f the U.S. South Atlantic and Gulf o f Mexico continental shelf. Bulletin o f Marine Science 33:935-940.
Raynie, R.C. and R.F. Shaw. 1994. Ichthyoplankton abundance along a recruitment corridor fromoffshore spawning to estuarine nursery ground. Estuarine, Coastal and Shelf Science 39:421- 450.
Reyns, N. and S. Sponaugle. 1999. Patterns and processes o f brachyuran crab settlement to Caribbean coral reefs. Marine Ecology Progress Series 185:155-170.
Robertson, D.R., D.G. Green and B.C. Victor. 1988. Temporal coupling o f production and recruitment o f larvae o f a Caribbean reef fish. Ecology 69:370-381.
Robertson, D.R. 1991. The role o f adult biology in the timing o f spawning o f tropical reef fishes. In Sale. P.F., editor. The Ecology o f Fishes on Coral Reefs. Academic Press. San Diego.
Rooker, J.R., G.D. Dennis and D. Goulet. 1996. Sampling larval fishes with a nightlight lift-net in tropical inshore waters. Fisheries Research 26:1-15.
SAS Institute, Inc. 1989. SAS/STAT Users Guide, Version 6. SAS Institute. Cary.
Schoener. T.W. 1970. Non-synchronous spatial overlap o f lizards in patchy habitats. Ecology 51:408- 418.
Secor, D.H.. J.M. Dean and J. Hansbarger. 1993. Modification o f the quatrefoil light trap for use in hatchery ponds. Progressive Fish Culturist 54:202-205.
Shenker, J.M., E.D. Maddox, E. Wishinski, A. Pearl, S. Thorrold and N. Smith. 1993. Onshore transport o f settlement-stage Nassau grouper Epinephelus striatus and other fishes in Exuma Sound, Bahamas. Marine Ecology Progress Series 98:31-43.
Sokal, R.R. and F.J. Rohlf. 1981. Biometry': the principles and practice o f statistics in biological research. W.H. Freeman and Co.. New York.
Sponaugle, S. and R.K. Cowen. 1996. Nearshore patterns o f coral reef fish larval supply to Barbados. West Indies. Marine Ecology Progress Series 133:13-28.
SPSS. Inc. 1999. SYSTAT 9: Getting started. SPSS, Inc., Chicago.
Stephens, J.S., Jr., P. A. Morris, D.J. Pondella. T.A. Koonce and G. A. Jordan. 1994. Overview o f the dynamics o f an urban artificial reef fish assemblage at King Harbor, California, USA. 1974- 1991: a recruitment driven system. Bulletin o f Marine Science 55(2-3): 1224- i 239.
Taggart. C.T. and W.C. Leggett. 1984. Efficiency o f large-volume plankton pumps, and evaluation o f a design suitable for deployment from small boats. Canadian Journal o f Fisheries and Aquatic Sciences 41:1.428-1,435.
134
Reproduced with permission of the copyright owner. Further reproduction prohibited without permission.
Thorrold, S.R. 1992. Evaluating the performance o f light traps for sampling small fish and squid in open waters o f the central Great Barrier Reef lagoon. Marine Ecology Progress Series 89:277-285.
Thresher, R.E. 1984. Reproduction in Reef Fishes. T.F.H. Publications, Inc.
Victor, B.C. 1983. Recruitment and population dynamics o f a coral reef fish. Science 219:419-420.
Victor, B.C. 1986. Larval settlement and juvenile mortality in a recruitment-limited coral reef fish population. Ecological Monographs 56:145-160.
135
Reproduced with permission of the copyright owner. Further reproduction prohibited without permission.

CHAPTER4
THE VERTICAL AND WITH IN-PLATFORM SPATIAL DISTRIBUTION OF LARVAL AND JUVENILE FISHES COLLECTED AT OFFSHORE OIL AND GAS PLATFORMS OFF LOUISIANA
136
Reproduced with permission of the copyright owner. Further reproduction prohibited without permission.

INTRODUCTION
The introduction and proliferation o f offshore oil and gas structures in the northern Gulf o f
Mexico (Gulf) has undoubtedly affected the marine ecosystem. The fish aggregation value o f these
platforms is well-recognized (CDOP I98S) and previous studies have shown differences in the adult
assemblages with depth and distance from the platforms (Stanley and Wilson 1997; Hastings et al. 1976;
Stanley and Wilson 2000; Love et al. 1999; Shinn 1974). While the adult assemblages around petroleum
platforms (i.e., artificial reefs) are fairly well known, little is known about the early life stages o f
ecologically-, commercially- and recreationally-important fishes that may be associated with the
infrastructure o f petroleum platforms (Chapter 2).
Very few baseline ecological ichthyoplankton studies within oil fields have been published
(Finucane et al. 1979a; Finucane et al., 1979b; Bedinger et al. 1980), and none have been published that
focus upon platform infrastructure. The National Marine Fisheries Service's (NMFS) and G ulf State’s
Southeastern Area Monitoring and Assessment Program’s (SEAMAP) Gulf-wide fisheries surveys, and
Minerals Management Service sponsored oceanographic surveys have historically not sampled in the
immediate vicinity o f oil and gas platforms because o f the conservative navigation/1 safety requirements of
their ships. Thus, fisheries-independent assessment o f the abundance o f fish life stages within and
immediately around these platforms and the role they might play as essential fisheries habitat has not
been adequately addressed.
Samples were collected within and immediately downstream o f three oil and gas platforms in the
northcentral G ulf west o f the Mississippi River Delta with passive plankton nets and light-traps to address
possible relationships between offshore petroleum platforms and larval, postlarval and juvenile fishes.
Fish were collected both at depth and near the surface within the platform infrastructure (plankton nets
and light-traps). and near the surface immediately downstream o f the platform structure (light-traps) in
order to comprehensively sample the platform environment and provide spatial and vertical distribution
data. More typical, continental shelf ichthyoplankton surveys have demonstrated that for many taxa the
larval, postlarval and juvenile fishes may occupy specific depth strata (Ditty 1986. Cha et al. 1994, Ditty
et al. 1988, Powell and Robins 1998, Kelley et al. 1993).
137
Reproduced with permission of the copyright owner. Further reproduction prohibited without permission.

MATERIALS AND METHODS
Data collection and analyses focused on three oil and gas platforms in the northern Gulf, which
were chosen to represent a previous characterization o f the adult fish community zonation. Three
communities were characterized: a coastal assemblage (3-20 m depth); an offshore assemblage (20-60 m
depth); and a bluewater/tropicai assemblage (>60 m). Mobil's Green Canyon (GC) 18,which lies in about
230 m o f water on the outer shelf (27°56'37"N, 91 °01 '45" W), was sampled monthly during new moon
phases over a 2-3 night period from July 1995 to June 1996. Mobil's Grand Isle (GI) 94B, which lies in
approximately 60 m o f water at mid-shelf (28°30'57''N, 90°07’23"W), was sampled twice monthly during
new and full moon phases over a three night period from April to August 1996. In addition during May
1996, extra samples during the first quarter and third quarter moon phases were collected, but due to
inclement weather, scheduled full moon collections were cancelled. Exxon's South Timbalier (ST) 54G.
which lies in approximately 20 m o f water on the inner shelf (28°50’0 1 "N, 90°25’00" W), was sampled
twice monthly during new and full moon periods over a 2-3 night period from April to September, 1997.
Sampling protocols are described in detail elsewhere (Chapter 2). In general, passive plankton
nets (60-cm diameter; 333 pm mesh dyed green) were used to collect ichthyoplankton at the three
platform sites, both at depth (15-23 m for 10-20 min, set and retrieved closed) and near surface (1-2 m for
10-15 min) within the platform structure with the intent o f sampling roughly equivalent amounts o f water
at both depths. Plankton net samples were standardized to number o f fish per 100 m3 (density). Modified
quatrefoil light-traps (Floyd et al. 1984; Secor et al. 1993) were deployed for 10 minutes at depth and
near surface within the platform structure, and in addition were also floated downstream (approximately
20 m) from the platform for off-platform collections. Both the subsurface and off-platform light-traps
were deployed with the light ofFuntil the sampling depth/location was reached, fished, and then retrieved
with the light off. Light-trap samples were standardized to a catch-per-unit-eflfort (CPUE) o f fish per 10
min.
Due to the very large numbers o f clupeiform fishes collected, particularly in light-trap samples,
the analyses described were run without these taxa (except where noted), since these fish are seldom the
taxa o f interest in studies o f hard substrate habitats and their abundances tend to overwhelm the trends o f
138
Reproduced with permission of the copyright owner. Further reproduction prohibited without permission.
other taxa (Choat et al. 1993). A ll ANOVA, Tukey's Studentized Range Tests, and Student's t-tests were
run with SAS version 6.12 (SAS 1989).
Studentized t-tests (a=0.05) were used to compare overall plankton net densities between
locations (subsurface and surface) within the GC 18 (shelf break), G I94 (mid-shelf), and ST 54 (inner
shelf) sites. Light-trap CPUEs were compared between locations (subsurface, surface, and off-platform)
within each o f the platform sites using an ANOVA model with location as a main effect. Tukey's
Studentized Range tests were used to determine which light-trap collections were significantly different.
A similar testing approach was used with the plankton net collections whose densities were log
transformed (log|0(x + l)) in an effort to conform to normality and homogeneity o f variances. Analyses
on light-trap CPUEs were run on ranked-transformed data. The same analyses were also run on some of
dominant taxa (top three taxa identified at least to the level o f genus for each gear location/depth)
collected at each o f the platforms.
Schoener’s index o f niche overlap (Schoener 1970) was calculated for comparisons o f fish
collections within the platform structure (surface net and surface light-trap) and far-field collections (off-
platform light-trap) and total net collections vs. total light-trap collections. Shannon-Weiner diversity
indices (Magurran 1988) were calculated for each sample collected at shelf break, mid-shelf and inner
shelf platforms. Differences in diversity between gear types at each platform were analyzed with
ANOVA models using gear as a main effect. Post-ANOVA tests (Tukey's Studentized Range, o=0.05)
were used to determine which gear types where significantly different. Only fish identified to at least the
genus level were included in these analyses. Clupeiform fishes were included in the similarity and
diversity indices, since the intent was to characterize the taxonomic assemblages sampled by each gear
type. Taxonomic richness (either at the family or genus/species level) is used in reference to the number
o f taxa collected.
RESULTS
At the shelf break platform (GC 18), many o f the dominant taxa were collected by both gear
types and in different sampling locations within and downstream o f the platform (Table 4.1). For
example, Xfugil cephalus had the highest average density for both subsurface (32.1 fish/100m3) and
surface nets (8.3 fish/100m3). and was relatively dominant in off-platform light-trap samples (0.14
139
Reproduced with permission of the copyright owner. Further reproduction prohibited without permission.

Reproduced
with perm
ission of the
copyright ow
ner. Further
reproduction prohibited
without
permission.
Table 4 .1. Total plankton net density (fish/100 m3) and light-trap CPU E (fish/10 min) for the top 10 taxonomic groups offish collected at the shelf break platform (GC 18) with standard error (SE) and rank by each gear type and location. For ranks, tied values received the mean o f the corresponding ranks._________________________________________________________________________________________________
Taxa
Subsurface Net Subsurface l.ifdtl-trap Surface Net Surface l.ight-trap OIT-platform l.ight-trap
Rank Density (St.) Rank emu-: (Si-:) Rank Density (SI-) Rank CPIJI- (SI-) Rank c i'u r: (Si:.)
Mugd cephalus 1 32.1 (IS .62) 1 8 27(4 58) 5.5 0.14 (0.06)Scaridac (unidentified) 2 1631 (5.64) 5 301 (1 35)(iohiidae (unidentified) 3 11.08(3 87) 1 0 09(0 04) 2 4 63(1 78) 1 0 44 (0 40) 115 0.05 (0.02)( 'nbarichlhys spilopterus 4 4 85(1 98)Caranx hippuslatus 5 4.45(1 62) 7 1 89(0 65) 10 0 08 (0 03) 2 0 22 (0 06)I 'yclolhone brawn A 3.05(1 55) 4 0 23 (0 21)Ophichthidac (unidentified) 7 2.87 (1.27)Hregmaceros canton 8 2.42(1 21) 4 0 03 (0 02) 8 1 80(0 88) 115 0.05 (0.02)Pristipomoides atfudonaris 9 1.95(0 88)Serranidac (unidentified) 10 1 86(1 28)Hlenniidae (unidentified) 2 5 0 06 (0 03) 6 0 17(0 15)Symphurus spp 2 5 0 06(0 05) 4 3 03(1 16) 8 0.10(0 04) 9 0.07 (0.03)Saurida brasiliensis 5.5 0 03 (0 02) 5 0 20(0 14)Myclophidac (unidentified) 5.5 0 03 (0 02) 4 0.17(0.06)Ixrstidium allanticum 10 0 02 (0 01)/.eslrolepit intermedia 10 0 02 (0 02)Upopliidium spp. 10 0.02(0 01)Micropogonias undulalus 10 0 02 (0 01)Pomacenlrus spp. 10 0 02 (0 01) 7 0 14(0 08)Auxis spp. 10 0 02 (0 01) 2 040 (0.13) 5.5 0 14(0 04)Peprilus burn 10 0 02 (0 01)Sciaenops ocellatus 3 4 11 (1.92)Caranx crysos 6 2 75(1 30) 3 (124 (0 08) 1 0.30(0 10)Scombridae (unidentified) 9 1 75(1 01)Cynoscion arenarms 10 151 (0 66)(iobiesox strumosus 10 0 08 (0.08)Syacium spp. 10 0 08(0 05) 3 0 18(0 08)Euthynnus alletteralusllolocentrus spp. 7 0 I I (0 05)Eucinostomus spp. 8 0.10(0 07)Pomatomus sallatnx 115 0 05(0 03)Peprdus burn 115 0 05 (0.03)

fish/10 min). Other taxa, including Bregmaceros cantori, Caranx hippos/latus, and unidentified gobies
and scarids were also relatively dominant throughout the sampling depths/locations. However, there were
some observable vertical and spatial differences in plankton net densities and light-trap CPUEs between
the dominant, non-clupeiform taxa collected within and near the platform structure. Several deepwater
(Lestidium atlanticum, Lestrolepis intermedia, and Lepophidium spp.), demersal (Citharichthys
spilopterus, Micropogonias undulatus, and ophicthids) and reef-associated (Pristipomoides aquilonaris
and serranids) taxa were more prevalent in subsurface collections (net or light-trap) than in surface
collections. Several pelagic taxa, including Pomatomus saltatrix, Eucinostomus spp.. Caranx crysos,
Euthynnus alletteratus and unidentified scombrids were more prominent in surface collections. Other
taxa collected in surface light-traps exhibited spatial differences. For example, gobies dominated surface
light-trap collections within the platform, but were not relatively common in off-platform samples. A
similar trend was observed for Cyclothone braueri and blennies. Conversely, myctophids, Mugil
cephalus, Holocentrus spp., and Bremaceros cantori were relatively common in off-platform, surface
light-trap collections, but not very common in collections within the platform.
At the mid-shelf platform (Gl 94), some taxa were commonly found in both subsurface and
surface collections and both within and off-platform (Table 4.2). Some lizardfishes (Saurida brasiliensis
and Synodus foetens), for example, were relatively common in subsurface plankton net samples and in
subsurface, surface and off-platform light-trap samples. They were, however, not a dominant taxa in
surface plankton net collections. The lizardfish Synodus poeyi and the blennies Parablennius marmoreus
and Hypsoblennius invemar were not dominant in plankton net samples, but were relatively common in
light-trap samples both within and o ff the platform structure. There were some apparent spatial and
vertical differences in abundances between taxa. Some taxa were primarily sampled in deeper waters,
including Syacium spp.. Peprilus paru and Etropus crossotus in subsurface plankton nets and
Rhomboplites aurorubens in subsurface light-traps. Other taxa were dominant in surface collections,
such as Auxis spp. (all gears) and unidentified blennies, Sphyraena guachancho and Chloroscombrus
chrysurus (surface net). In light-trap collections, the blenny complexes Scartella/Hypleurochilus and
Hypsoblennius hentz/ionthas were dominant in surface light-trap collections within the platform, but not
in off-platform samples. Conversely, Upeneus parvus, Pomacentrus spp. and Scomberomorus cavalla
141
Reproduced with permission of the copyright owner. Further reproduction prohibited without permission.

Reproduced
with perm
ission of the
copyright ow
ner. Further
reproduction prohibited
without
permission.
Table 4.2. Total plankton net density (fish/100 m3) and light-trap CPUE (fish/10 min) for the top 10 taxonomic groups o f fish collected at the mid-shelf platform (Gl 94) with standard error (SE) and rank by each gear type and location. For ranks, tied values received the mean o f the corresponding ranks._________________________________________________________________________________________________
Taxa
Suhsurfuec Net Subsurface Light-trap Surface Net Surface l.ight-trap Olf-platfomi l.ight-trap
Rank Density (St ) Rank c f t i i ; (St;> Rank Density (SI:) Rank tT lJ i: (SI:) Rank CPUI: (SI:)
Symphurus spp. 1 17.00(3.82) 1 679(1.18)llregmaceros camori 2 16.67 (3.00) 1 2.18(1.02) 8 1 59(0 42)(iobiidac (unidentified) 3 10.73(1 76) 4 0.21 (0.06) 3 5.75(0 80)Saurida brasiliensis 4 4 8 (1 3) 2 1.97(0 42) 5 3 35(0 51) 5 0.50(0.14)Euthynnus allelleralus 5 4.10(1.06) 10 0.08 (0.03) 5 4.55(1 05) 8 0 92(0 17) 2 2.83 (0.62)Syacium spp. 6 3 78(1 14)1‘eprilus /Miru 7 2.79(1.72)Synodus foetens 8 2.12 (0.77) 5 0.20 (0 06) 1 22 I I (5 24) 10 0.20(0.05)Synodontidac (unidentified) 9 2 11 (0.56) 8 0.10(0.03) 9 0 90 <0 39)Elropus crossotus 10 1 79(0.54)Synodus poeyi 3 0.34 (0.09) 2 9 98(1 78) 4 1.13(0 28)Rhombopliles aurorubens 6 0 20 (0.06)1‘arablennius mar more us 7 0 19(0.04) 3 7 20(1 06) 3 1.62(0 35)Hypsoblennius invemar 9 0 08 (0 03) 4 6 33(1 77) 1 3 58(0 67)Caranx crysos 9 I 14(0 41)('ynoscion arenarius 6 3 12(1.11)Auxis spp. 2 6 61 (2 32) 10 0 76 (0 19) 9 0.24 (0.06)Blcnniidac (unidentified) 4 4 73(3 95)Spliyraena guachancho 7 1 83 (0 60)Chloroscombrus chrysurus 10 1 00(0.34)Hypsoblennius henlz/ionlhas 6 1 76(0 57)Scariella'Hypleuroclulus 7 1 14(0 24)llpeneus parvus 6 0.38 (0.09)1‘omacenlrus spp. 7 0.30 (0.14)Scomberomorus cavalla 8 0.27(0.11)

were relatively common in off-platform samples, but not dominant in surface samples within the platform
structure.
At the inner shelf platform (ST 54), Cynoscion arenarius were commonly collected at all
locations/depths and in all gear types (Table 4.3). Other relatively ubiquitous taxa included gobies,
blennies and Synodus foetens. Similar to the shelf break and mid-shelf platforms, vertical distribution
trends were observed, but differences between within platform and off-platform surface collections were
less pronounced. Many o f the dominant taxa collected at depth, including myctophids. Ariomma spp. and
Scorpaena spp. (in subsurface nets), Trichiurus lepturus and Bregmaceros cantori (in both within
platform gears), and Rhombopliles aurorubens, Saurida brasiliensis and Peprilus paru (in subsurface
light-traps), were not common in surface collections. Many o f the taxa commonly collected away from
the platform with light-traps were also collected within the platform, either in plankton nets or light-traps.
Exceptions include Auxis spp. and Caranx crysos, which were dominant in off-platform light-trap
samples and not within the platform structure. Scomberomorus maculatus was dominant in all surface
collections.
At all platforms, there were many instances where some taxa were collected with only one gear
type at a specific depth/location (Table 4.4). In general, subsurface gears within platforms collected the
fewest unique taxa within each site. When subsurface nets and light-traps collected unique taxa. they
were primarily deep water or demersal fishes as adults, such as Paralepis atlantica. Lestrolepis
intermedia, and Chlorophthalmus agassti at the shelf break platform (GC 18), Robia legula. Engyophrys
senta and Lestreas spp. at the mid-shelf platform (GI 94), and Ophidion robinsi and Rhombopliles
aurorubens at the inner shelf platform (ST 54). Surface plankton nets and light-traps within the platform
structure collected a wide variety o f unique taxa, including pelagic, deep water, demersal and reef-
associated types. Off-platform light-traps collected primarily taxa which are pelagic as adults, such as
flyingfishes (Cypselurus spp.. GC 18 and ST 54), jacks ( Trachinotus carolinus, GI 94; Selar
crumenopthalmus and Trachinotus carolinus, ST 54), and mackerels (Scomber japonicus and Thunnus
spp.. GI 94). among others. Interestingly, goatfishes were present as unique taxa in off-platform light-
trap samples at all sites ( Upeneus parvus, GC 18 and ST 54; Mullus auratus and Pseudopeneus
maculatus, GI 94). Also, Abudefduf saxatilis, a reef-dependent species, was collected only in off-
143
Reproduced with permission of the copyright owner. Further reproduction prohibited without permission.

Reproduced
with perm
ission of the
copyright ow
ner. Further
reproduction prohibited
without
permission.
Table 4.3. Total plankton net density (fish/100 ni}) and light-trap CPU I- (lish/10 min) for the top 10 taxonomic groups o f fish collected at the inner shelf platform (ST 54) with standard error (SE) and rank by each gear type and location. For ranks, tied values received the mean o f the corresponding ranks.________________________________________________________________________________________________
Subsurface Net Subsurface l.ight-trap Surface Net Surface l.ight-trap on-plaiform l.ight-trap
Taxa Rank Density (SI:) Rank CTUIt: (SI:) Rank Density (SI:) Rank c p u k (St-:) Rank c iu j i: (si-)
Cynosclon arenarius 1 7.99(3.21) 4 0.10(0.04) 1 42 16(8 56) 3 0.42(0 I I ) 4 0.56(0.13)Myclophidac (unidentified) 2 4.09(3.52)Gobiidac (unidentified) 3 141 (0 96) 8 0 06 (0 03) 3 29 9(12 71) 10 0.23 (0.08)Blenniidae (unidentified) 4 1 10(1 10) 10 2 47(0 90) 9 0 09 (0 03)Etropus crossolus 5 0 89 (0 89) 5 7 59(2 94)I'richiurus lepturus 6 5 0 52 (0.52) 2 0.18 (0 07)Anommu spp. 6 5 0 52 (0 52)Uregmaceros am lort 9 0.26(0.26) 6 0 06 (0.03)Synodus Joeiens 9 0 3(0.3) 1 2 88(1 55) 1 3 16(1 25) 7 0 27(0.10)Scorpaena spp. 9 0.26 (0.26)Rhombopliles aurorubens 3 0 12(0 07)Saurida brasiliensis 5 0 06(0 03)Scariella 'llypleuroclnlus 7 0 06(0 03) 2 0 49 (0.26)Scomberomorus cavalla 9 0.04 (0 03) 7 5 39(3.15)Peprilus fniru 10 0 ()4 (0 03)Symphurus spp. 4 8 84(3 84)Caranx hippos'laius 9 2 70(2 44) 3 0.61 (0 25)Eiilliynnus allelleraius 4 0 37(0 23) 1 1 08 (0 47)Chloroscombrus chrysurus 2 300(11 03) 10 0.09(0.04)Hypsoblennius invemar 8 0.11 (0 05) 6 0 48 (0.19)Hypsoblennius hentz-'ionlhas 5 0 21 (0 08) 5 0 48 (0.22)Scomberomorus maculalus 6 6 56(2 09) 6 0 18(0 06) 2 0.81 (0.18)Ophidian nocoinis 'selenops 8 3.09(1 77)Peprilus burn 7 0 14(0 05)Auxis spp. 8 0.26(0 17)Caranx crysos 9 0 24 (0.08)

Table 4.4. Unique taxa (identified at least to genus) collected by gear and location for each platform.________________________________________________________________
Gear/Location Shelf Break (GC 18) Mid-Shelf (GI 94) Inner Shelf (ST 54)
Subsurface EIops sauna Lepophidium spp.Net Sphoeroides spp.
Chlorophthalmus agassciOphidion selenops Robia legula Pnacanthus spp. Gempylus spp. Engyophrys senta
Subsurface Paralepis ailannca Lestroleas spp. Ophidion rohinstLight-trap Lestrolepis intermedia Bollmannia communis Rhombopliles aurorubens
Surface Scopelarchoides spp. Lepophidium staurgphor Cyclothone braueriNet Melamphaes spp. Caranx spp. Ophidion spp.
Chaetodipterus faber Oligoplues saurus Cypselurus spp.Pnonolus spp. Seriola spp. Syngnathus spp.Rhombopliles aurorubens Stelhfer lanceolatus Syngnathus louaianaeApogon spp. Opatognathus spp. Selene spp.Paradiplogramus bairdi Oputognathus lonchuna Oligoplues saurusSelene vomer Mtcradesmus spp. Lutjanus spp.Foetorepus agassisi Ophioblenmus atlanticus Calamus spp.Scorpaena spp. Achtrus 1 meatus Larimus fasctatusCoryphaena equisetis Uicrodesmus longipinms Stelhfer lanceolatusTetragonurus allanttcus Ophicthta gomesi Gymnachirus spp.
Chaetodipterus faber Syacium spp.Dormilator maculatus Trmectes maculatus Microdesmus lanceolatus
Surface Myrophis punctatus Hoplunnis macrurus Albula vulpesLight-trap Gobiesax strumosus Saurida normant Membras martintca
Cypselurus cyanopterus Vinciguema mmbaria Seriola spp.Parexocoetus brachypterus Saurida suspicio Sphyraena borealisPnacanthus spp. Lutjanus apodus, vivanus Lutjanus campechanus
Saurida normant-brasiliensis Calamus spp.Cypselurus cyanopterus Seriola fasciata Trachinotus falcatus goodet (Jpeneus parvus Abudefduf taurus Synodus synodus Sphyraena borealis Thunnus thynma Ariomma regulus Bothus spp.
Sphoeroides spp.
Off-platform Cypselurus Trachinotus carolinus Saurida suspicioLight-trap furcatus, heterurus Coryphaena equisetis Lepophidium staurophor
Pomatomus saltatnx Mullus auratus Cypselurus cyanopterusC’peneus parvus Pseudopeneus maculatus Cypselurus furcatusMonolene sessthcauda Abudefduf saxalths
Scomber japomcus Thunnus spp.
Pnacanthus spp.Selar crumenopthalmus Trachinotus carolinus Upeneus parvus Abudefdufsaxatihs Pomacentrus spp.\ lu g il cephalus Cyclopsetta fimbnata
145
Reproduced with permission of the copyright owner. Further reproduction prohibited without permission.

platform samples at GI 94 and ST 54. In most instances, however, these unique taxa were not among the
dominant taxa collected at each site. Exceptions include Lestrolepis intermedia (subsurface light-trap),
Gobiesox strumosus (surface light-trap) and Pomatomus saltatrix (off-platform light-trap) at the shelf
break site (GC 18; Table 4.1) and Rhombopliles aurorubens (subsurface light-trap) at the inner shelf site
(ST 54; Table 4.3).
In general within the light-trap collections, surface and off-platform light-traps had the highest
mean total CPUEs at ail three platforms (Figure 4.1). At the shelf break platform (GC 18), mean CPUEs
were lower than the other sites. Mean CPUEs for surface (3.2 fish/10 min) and off-platform (2.4 fishy 10
min) light-traps were not statistically different from each other, but both were significantly higher than
the mean CPUE for subsurface light-trap collections (0.7 fish/10 min; Tukey's Studentized Range test,
a=0.05). At the mid-shelf (GI 94) and inner shelf (ST 54) sites, significant differences were detected
between all three gear depths/locations. Overall, light-trap CPUEs were highest at the mid-shelf site (GI
94). At this platform, mean CPUE for surface light-traps (58.2 fish/min) was significantly higher than
both the off-platform (13.8 fish/10 min) and subsurface (6.5 fish/10 min) mean CPUEs. At the inner
shelf platform (ST 54), the mean CPUE for off-platform light-trap samples (7.2 fish/min) were
significantly higher than those for the surface (6.6 fish/min) and subsurface (3.8 fish/min) light-trap
collections.
No significant differences were detected in mean total plankton net densities between the two
depths at the shelf break (GC 18) and mid-shelf (GI 94) sites (t-tests, a=0.05; Figure 4.1), although
subsurface densities were generally higher. Mean densities by depth were similar at these sites and
ranged from 58.9-107.7 fish/100 nv’ atGC 18 and from 53.4-86.6 fish/100 mJ at GI 94. This general
trend was reversed at the inner shelf platform (ST 54), where surface nets had a significantly higher mean
total density (177.4 fish/100 m3) than subsurface nets (31.6 fish/100 m3). However, due to complications
in deploying subsurface plankton nets at ST 54 (Table 2.1). relatively few subsurface samples (n=7) were
available for comparison with surface samples (n=82).
Significant trends were also observed within dominant species in mean CPUEs and densities
between the different sampling depths and locations within sites. At the shelf break platform (GC 18),
three taxa met the criterion for light-trap depth/location comparisons and four taxa met the criterion for
146
Reproduced with permission of the copyright owner. Further reproduction prohibited without permission.

2018
16
f0 12
1 10 cQJ 8
a. 6 o
4
2
0
I Subsurface LT ■ Surface LT □ Off-platform LT
58.16
South Tirrbaier
B
Grand isle
Locations Within Sites
B
Green Canyon
a.
I Subsurface Net ■ Surface Net
140
^ 120 rtEo 100 o
2 80 (Oc $ 6055 c <u Q
wc<D 40
20
0
177.4
South Tirrtoalier Grand Isle
Locations Within Sites
Green Canyon
b.
Figure 4.1. Mean light-trap CPUEs (a) and plankton net densities (b) with standard error bars for data without clupeiform fishes for depths/locations within each platform site. Arrows above bars point toward the mean for that location/depth which is o ff the axis. Within each site, the same letter above each bar indicates no significant difference between the gear types based on Tukey's Studentized Range test on ranked data (a=0.05). Different letters designate significant differences.
147
Reproduced with permission of the copyright owner. Further reproduction prohibited without permission.

plankton net depth comparisons. Caranx crysos and Auxis spp. appeared to behave similarly, since they
were collected in significantly higher CPUEs from surface waters (both within the platform structure and
off-platform) than from subsurface waters (Tukey's Studentized Range tests, a=0.05; Figure 4.2). While
C. hipposJlatus displayed significantly higher CPUEs in off-platform collections than at either depth
within the platform. In general, differences in mean plankton net densities at GC 18 for some dominant
taxa were higher in subsurface collections than surface collections (Figure 4.3): Citharichthys spilopterus
(Student's t-test, p=0.006); Symphurus spp. (p=0.046); Mugil cephalus (p=0.08l); and Caranx
hipposJlatus (p=0.260).
At the mid-shelf platform (GI 94), three taxa met the criterion for light-trap depth/location
comparisons and two taxa met the criterion for plankton net depth comparisons. Two o f the dominant
species collected with light-traps appeared to be surface oriented (Figure 4.4). Mean CPUEs for
Hypsoblennius invemar and Euthynnus alletteratus were significantly higher in surface and off-platform
light-trap samples than in subsurface light-trap samples (Tukey's Studentized Range tests, a=0.05). Mean
CPUEs for Synodus foetens were significantly higher in the surface light-trap samples within the
platform. Mean plankton net densities were significantly higher in the subsurface samples for
Bregmaceros cantori and to a much lesser extent for Symphurus spp. (Figure 4.5).
At the inner shelf platform (ST 54), two taxa met the criterion for light-trap depth/location
comparisons, while four taxa met the criterion for plankton net depth comparisons. For Synodus foetens,
the mean surface light-trap CPUE was significantly higher than that for off-platform samples, but not the
subsurface samples, and there was no significant differences between subsurface and off-platform mean
CPUEs (Tukey's Studentized Range test. ct=0.05: Figure 4.6). A different pattern was observed for
Euthynnus alletteratus, where the mean off-platform light-trap CPUE was significantly higher than the
subsurface light-trap CPUE. but was not significantly different from the mean surface light-trap CPUE
(a=0.05). The mean subsurface net density was significantly higher than the surface net density for
Ariomma spp. (Figure 4.7: p<0.030). Conversely, the mean surface net densities were higher for
Cynoscion arenarius, Chloroscombrus chrysurus and Etropus crossotus, although no significant
differences were detected.
148
Reproduced with permission of the copyright owner. Further reproduction prohibited without permission.

£ 0.5 E° 0.4 2J2 0.3UJ 3 0.2 0." 0.1
Subsurf aca Surface
Light-trap
B
*Off-platform
£ 0.3E0 0.25
1 0.2
~ 0.15
2 0-1 oc 0.05
Subsurface
A
■Surface Off-platform
Light-trap
Caranx crysos Caranx hippos/laius
c 0.4 E 0.35 | 0.3| 0 25
W 02 ? 0.150 0.1 § 0.051 0
B
iSubsurface Surface Off-platform
Light-trap
Auxis spp.
Figure 4.2. Mean total CPUEs (with standard error bars) for dominant species collected with light-traps at the shelf break platform (GC 18). The same letter above each bar indicates no significant difference between the gear locations based on Tukey’s Studentized Range tests on ranked data (a=0.05). Different letters indicate significant differences.
149
Reproduced with permission of the copyright owner. Further reproduction prohibited without permission.

P=0.081 P=0260
50
40
30
20
to
Subsurface Surfacei :
Subsurface
■Surface
Plankton RanktonNet
Mugii cephalus Caranx hippos/latus
paO.006
Subsurface Surface
_ 1
08
0.6
0.4
0.2
PM3046
Subsurface Surface
Plankton Net Plankton Net
Citharichthys spilopterus Symphurus spp.
Figure 4.3. Mean total densities (with standard error bars) for dominant species collected with plankton nets at shelf break platform (GC 18). The p-values indicate statistical significance from t-tests on log- transformed data.
150
Reproduced with permission of the copyright owner. Further reproduction prohibited without permission.

Surface Off-ptoform
Light-trapSurface Off-pWform
Light-trap
B
Hypsoblennius invemar Euthynnus alletteratus
C 30 EO 25
IB
A A
Subsurface Surface
Ught-trap
Off-ptatform
Synodus foetens
Figure 4.4. Mean total CPUEs (with standard error bars) for dominant species collected with light-traps at the mid-shelf platform (GI 94). The same letter above each bar indicates no significant difference between the gear locations based on Tukey's Studentized Range tests on ranked data (cc=0.05). Different letters indicate significant differences.
151
Reproduced with permission of the copyright owner. Further reproduction prohibited without permission.

_ 25
I 20
I 15f 10Is 5 * 0
p«0.0001
Subsurface Surface
_ 20
I "i™
I .93 .
fPO.139
Subsurface Surface
Rankton Net RanWon Net
Bregmaceros cantori Symphurus spp.
Figure 4.5. Mean total densities (with standard error bars) for dominant species collected with plankton nets at the mid-shelf platform (GI 94). The p-values indicate statistical significance from t-tests on log- transformed data.
152
Reproduced with permission of the copyright owner. Further reproduction prohibited without permission.

£ 4 A § 14
01 25
35 _ T e 12
£ . 0.8
3 ,s 3 06i
T
Subsurface Surface Off-ptatform Subsurface Surface Off-ptatform
Light-trap
Synodus foetens
A
_ LSubsurface Surface
Light-trap
alletteratus
Figure 4.6. Mean total CPUEs (with standard error bars) for dominant species collected with light-traps at the inner shelf platform (ST 54). The same letter above each bar indicates no significant difference between the gear locations based on Tukey’s Studentized Range tests on ranked data (a=0.05). Different letters indicate significant differences.
153
Reproduced with permission of the copyright owner. Further reproduction prohibited without permission.

0.8070.60.5040.30.20.10
pa0.030
Subsurface Surface
I <01 30
f 20 □s 1092 „
p>0.443
Subsurface SurfaceRanktonNat Rankton Net
Ariomma spp. Cynoscion arenarius
4035302520151050
p*0.207
TSubsurface Surface
_ 12
1 10i a «t 8
Subsurface
p«0.505
SurfaceRankton Net Rankttn Net
Chloroscombrus chrysurus Etropus crossotus
Figure 4.7. Mean total densities (with standard error bars) for dominant species collected with plankton nets at the inner shelf platform (ST 54). The p-values indicate statistical significance from t-tests on log- transformed data.
154
Reproduced with permission of the copyright owner. Further reproduction prohibited without permission.

Within site comparisons o f gears and surface sampling locations indicated that off-platform and
surface light-trap collections were more similar to each other (0.4S-0.76) than each was to surface
plankton net collections (0.27-0.71), although the disparity between the index gear comparisons is
smaller at ST 54 (0.59-0.71; Table 4.5). Overall, total light-trap collections were relatively different from
total plankton net samples at GC 18 and GI 94 (0.38 and 0.32, respectively), but much more similar at ST
54 (0.63).
Table 4.5. Schoener’s similarity indices for different surface gear and location comparisons. (OL) off-platform light-trap, (SL) surface light-trap, (SN) surface net, (TL) total light-traps, (TN) total nets._____________________________________________________________
OL vs SL OL vs SN SL vs SN TL vs TN
Outer Shelf (GC 18) 0.53 0.32 0.31 0.38Mid-Shelf (GI 94) 0.45 0.37 0.27 0.32Inner Shelf (ST 54) 0.76 0.71 0.59 0.63
There was little difference in the Shannon-Weiner diversity index values for gear and
depth/location samples collected at GC 18 and ST 54 (Figure 4.8). In both instances, only subsurface
light-trap samples had significantly lower diversity values than the other gear and depth/location
combinations (a=0.05). No clear pattern in diversity was discemable at the mid-shelf site (GI 94) other
than surface net collections were significantly different from light-trap collections, and that o ff platform
light-trap collections were different from net collections regardless o f depth.
DISCUSSION
I am aware o f only one study (Finucane et al. 1979b) that investigated the ichthyoplankton
community found in proximity to oil and gas platforms. This Texas continental shelf study was limited,
however, in that fish larvae and juveniles were collected with double oblique bongo net tows (water
column) and neuston net tows (surface) at a navigationally-safe distance from the platform structures (30-
90 m). Also, all o f the sites with structure were within a 5 km radius from each other, and all sites,
including the controls, were in 17 m o f water, not allowing for any comparisons o f different community
regimes across depth zones or large geographic areas. The sampling in the oil field study was also
155
Reproduced with permission of the copyright owner. Further reproduction prohibited without permission.

Reproduced
with perm
ission of the
copyright ow
ner. Further
reproduction prohibited
without
permission.
222
18161.612
108060402
0
A
i ISurface
NetSubsurface
Net
*
I iSubsurfaceLrght-lrap
Gear
SurfaceLight-trap
Off-platformUght-trap
222
£ 16 | 14 oj 12
o 08 § 06
to 0402
? ABCO BCOE
I ■ ISurface
MatSubsurface
NetSubsurfaceLight-trap
Gear
BCDE
SurfaceLight-trap
COE
Off-platformLight-trap
t/iOsOuter Shelf (GC 18)
22 2
16 1.6
| 14 5 12
3
!o1
08
04OT02
0
A
I .Subsurface Subsurface
Mat Light-trapSurface
Light-trap
Mid-Shelf (GI 94)
Off-platformLight-trap
Gear
Inner Shelf (ST 54)
Figure 4.8. Mean Shannon-Weiner diversity indices (with standard error bars) for each gear type and sampling location for each site. The same letter above each bar indicates no significant difference between the gear types based on Tukey's Studentized Range tests (a-T).05). Different letters indicate significant differences.

limited to only three, 2-day cruises. While statistical comparisons were limited, the authors did note
some differences in the taxonomic compositions collected by the different gear types, and concluded that
the neuston net generally collected fish larvae that preferred surface/near surface waters, while the bongo
tows collected some larvae that were unique to subsurface waters.
I f one is to assume that their bongo net collections reflected a subsurface ichthyoplankton
assemblage and the neuston collection reflected a surface assemblage, then a few general comparisons
can be made between this study and that o f Finucane et al. (1979b). For example, those authors noted
that bothids, gadids and gerreids were absent in bongo (subsurface) tows, while gobiids, myctophids and
sparids were not present in neuston (surface) tows. O f the dominant bothid taxa collected in this study.
Citharichthys spilopterus and Etropus crossotus were dominant only in subsurface waters at the outer
shelf (GC 18) and mid-shelf (GI 94) platforms, respectively. However, E. crossotus were relatively
dominant in both subsurface and surface plankton nets at the inner shelf platform (ST 54) and Syacium
spp. were collected primarily in surface light-traps at the outer shelf platform (GC 18). Unlike the
previous study, gerreids (Eucinostomus spp.) were collected in surface waters (off-platform light-trap) at
GC 18. Gadids, myctophids and sparids were not dominant taxa in any o f the platform collections.
It is difficult to determine, however, i f any differences in taxonomic compositions observed in
Finucane et al. (1979b) and this study are a result o f a possible gear bias, or i f they represent real
differences in vertical preferences between taxa. The platforms represent vertical and structurally-
complex habitats (i.e.. vertical extension o f the benthos and/or an artificial reef). In addition, larval
synodontids and gobiids, for example, exhibit strong photopositive responses and are often collected in
light-aggregation devices (Choat et al. 1993; Brogan 1994; Hickford and Schiel 1999; Hernandez and
Lindquist 1999; Chapter 2). This behavioral response may result in the aggregation o f some larval fishes
in a depth stratum where they otherwise might not be found. Finacune et al. (1979b), for example, found
synodontids and gobiids to be common in subsurface waters. Synodontids were relatively common at
depth in both plankton nets and light-traps at the mid-shelf (GI 94) and inner shelf (ST 54) platforms. At
all three platforms, however, they were relatively common in surface waters in light-trap collections, but
not in plankton nets. A similar trend was observed for gobiids. It is likely, therefore, that the depth
157
Reproduced with permission of the copyright owner. Further reproduction prohibited without permission.

distributions o f some taxa may be influenced by either the platform's vertical benthos or the presence o f
light (e.g., light-traps and/or platform's light-field).
A number o f studies have addressed the vertical distribution o f larval and juvenile fishes in a
variety o f open ocean and coastal habitats (Ditty 1986; Ditty et al. 1988. Able et al. 1998; Leis 1991; Cha
et al. 1994; Thorrold et al. 1994; Katsuragawa and Matsuura 1990). In general, these studies used towed
nets (e.g., MOCHNESS, oblique bongo) and addressed larval fish vertical assemblages at a much larger
scale (surface down to 200 m depth) than sampled at the platforms (surface down to 15-23 m depth). The
observations o f vertical distribution patterns in this study differs from others in that sampling occurred: 1)
at a relatively small vertical scale (within 25 m o f surface); 2) around a structurally-complex, hard-
substrate habitat: and 3) with passive plankton nets and light-traps fished exclusively at night.
The depth o f subsurface sampling was limited, in part, by the depth o f the first cross-member
support structures within each platform which inhibited the sampling gear from going deeper and to
which the guidelines were attached (Chapter 2). In general, the entire sampling depth range is within just
the first depth interval or near surface stratum sampled by other large-scale ichthyoplankton studies.
However, even with this sampling limitation, there were statistical differences in the vertical structure o f
the larval and juvenile fishes collected within and near the platforms. Many studies have shown that
larval fishes are concentrated in the upper levels o f the water column and are generally above the
thermocline or mixed layer (Ahlstrom 1959; Cha etal. 1994; Kendall and Naplin 1981; Loeb 1979).
Ditty et al. (1988), in a review o f ichthyoplankton surveys o f the northern Gulf, found that most (>75%)
o f the dominant taxa were collected in the upper water column (<50 m depth). Studies in other marine
systems have found similar results. For example, larval fishes collected at 25 m depth intervals with
MOCHNESS in the Florida Keys were predominantly in the first (31.5%) and second (33.1 %) strata (Cha
etal. 1994).
Despite the limited vertical scale in this study, there were some similarities between this study
and previous surveys. In particular, some mesopelagic and demersal taxa were predominantly collected
in subsurface gears. Several species were collected only at depth, such as Chlorophthalmus agassti.
Paralepis atlanlica. and Lestrolepis intermedia at GC 18 (outer shelf), Robia legula, Ophidion selenops.
and Priacanthus spp. at GI 94 (mid-shelf), and Ophidion robinsi and Rhombopliles aurorubens at ST 54
158
Reproduced with permission of the copyright owner. Further reproduction prohibited without permission.

(inner shelf)- This is not unexpected since it has been suggested that mesopelagic and mid-oceanic larval
fishes may be present in deeper waters as an early adaptation to their later, adult life (Ahlstrom 1959;
Loeb 1979). Katsuragawa and Matsuura (19^0), for example, reported much higher catches of
myctophids, gonostomatids, paralepids and other mesopelagic taxa in oblique bongo tows than in neuston
tows. While there is a similar vertical trend in the platform collections, these taxa were relatively rare
and their abundances are likely underestimated due to the relatively shallow nature o f the platform
sampling (<23 m).
A possible explanation for the significantly higher subsurface plankton net densities (total catch)
at the outer and mid-shelf platforms is the probable high predation pressures in the illuminated surface
waters. The preflexion and early flexion larvae collected in passive plankton nets are less competent and
generally less able to swim to avoid predators. Many larval fish predators were collected in platform
samples, including larval and juvenile synodontids, carangids and scombrids. These visual predators
could have higher feeding success at night in the illuminated surface waters vs. the less-illuminated
subsurface waters. The relatively passive larval fishes, therefore, may be exposed to higher predation
pressures in surface waters near platforms. A true test o f this hypothesis would involve sampling
planktonic fishes upstream, within and downstream o f a platform to examine predator clearance rates.
Unfortunately, this was not a logistically feasible option during the onsite platform sampling.
In this study, the only downstream samples collected were with light-traps. O f the taxa
examined in these collections, there were some differences in distribution observed. Pelagic taxa such as
Caranx crysos and C. hipposJlatus at GC 18 (outer shelf), and Euthynnus alletteratus at GI 94(mid-shelf)
and ST 54 (inner shelf) were collected primarily with light-traps in surface waters, generally downstream
of the platform. Synodus foetens. in contrast, seemed to be common within the platform structure at GI
94. Overall, relatively few taxa were found solely in the off-platform Iight-trap samples: 4 genera at GC
18,7 at GI 94. and 12 at ST 54. In all cases, these taxa comprised <1% o f the off-platform I ight-trap total
catch, with the exception o f Pomatomus saltatrix at GC 18(1.5%). Across all three platform sites, only
the mullids were collected solely in off-platform samples. Since the distributions generally differed
among taxa, one can only speculate as which factors were important in determining the distributions o f
these fishes. Fishes sampled within the platform may be very photopositive (e.g., synodontids and
159
Reproduced with permission of the copyright owner. Further reproduction prohibited without permission.

blenniids) and may be responding partially to the illumination provided by the platform. Other fishes
may maintain a position just o ff the platform's structure, thus balancing the advantages o f increased
feeding opportunities near the platform with the disadvantage o f increased predation pressures. It is also
possible that the distributions are related to other environmental or physical cues (i.e., increased
turbulence and/or retention within the platform structure).
In general, taxon diversity and abundance o f fish in light-traps was higher in surface waters,
particularly within the platform structure. This result is noteworthy because the ambient light-field from
the platform itself could have decreased the effectiveness (i.e.. sampling efficiency) o f the light-
aggregating devices in the surface waters. A possible counter argument to that explanation, however,
could be that the ambient light-field o f the platform may have already drawn photopositive species to the
surface waters prior to sampling. The surface trap’s bright light was then able to fish in water with
relatively elevated densities o f larger and more photopositive fish than the subsurface waters (i.e.. a
fishing Iight-trap within a light-trap). With regards to differences in plankton net densities (Figure 4.1).
the effect o f the ambient light-field may have also increased surface catches o f photopositive fish, or may
have led to the higher densities in the subsurface collections due to decreased visual avoidance. With the
exception o f ST 54 (inner shelf) where there were only seven bottom net samples (Table 2.1), densities
were generally higher (although not significantly so) in the subsurface nets. I f the lights from the
platform had the effect o f drawing photopositive, and generally larger individuals to the surface waters,
then these individuals would be better able to avoid a passively fishing gear at the surface. In contrast, a
plankton net at depth would have the advantage o f fishing in a less intense light field, resulting in
decreased visual net avoidance.
In summary, densities o f preflexion and flexion larvae collected in plankton nets were generally
higher in subsurface waters, possibly a resuit o f decreased predation pressures and decreased net
avoidance in the less-illuminated deeper waters. Abundances o f primarily larger postflexion larvae and
juveniles collected in light-traps were higher in surface waters. Taxon-specific differences in spatial
distributions o f fishes in these surface waters were observed as well. The complex environment o f the
platforms necessitates a sampling protocol with multiple gear types and deployment strategies to account
160
Reproduced with permission of the copyright owner. Further reproduction prohibited without permission.

for the varied responses (e.g., feeding, predator avoidance, light attraction/avoidance, depth preferences)
o f the larval and juvenile fishes being sampled.
REFERENCES
Ahlstrom, E.H. 19S9. Vertical distribution o f pelagic fish eggs and larvae o ff California and Baja California. U.S. Fish and Wildlife Service, Fishery Bulletin 60:107-146.
Able, K.W., J.P. Manderson and A.L. Studholme. 1998. The distribution o f shallow water juvenile fishes in an urban estuary: the effects o f manmade structures in the lower Hudson River. Estuaries 2l(4B):731-744.
Bedinger, C.A., J.W. Cooper, A. Kwok, R.E. Childers and K.T. Kimball. 1980. Ecological investigations o f petroleum production platforms in the central Gulf o f Mexico. Volume I : Pollutant fate and effects studies. Draft final report submitted to the Bureau o f Land Management. Contract AA551-CT8-I7.
Brogan, M.W. 1994. Two methods o f sampling fish larvae over reefs: a comparison from the Gulf o f California. Marine Biology 118:33-44.
CDOP (Committee on Disposition o f Offshore Platforms). 1985. Disposal o f offshore platforms. Marine Board, Commission on Engineering and Technical Systems, National Research Council.National Academy Press. Washington. D.C.
Cha, S.S., M.F. McGowan and W.J. Richards. 1994. Vertical distribution o f fish larvae o ff the Florida Keys, 26 May-5 June 1989. Bulletin o f Marine Science 54(3):828-842.
Choat, J.H, PJ. Doherty, B.A. Kerrigan and J.M. Leis. 1993. A comparison o f towed nets, purse seine, and light-aggregation devices for sampling larvae and pelagic juveniles o f coral reef fishes. Fishery Bulletin 91:195-209.
Ditty, J.G. 1986. Ichthyoplankton in neritic waters o f the northern Gulf o f Mexico o ff Louisiana: composition, relative abundance and seasonality. Fishery Bulletin 84:935-946.
Ditty. J.G.. G.G. Zieske and R.F. Shaw. 1988. Seasonality and depth distribution o f larval fishes in the northern Gulf o f Mexico above latitude 26°00'N. Fishery Bulletin 86:811-823.
Finucane, J.H., L.A. Collins and L.E. Barger. 1979a. Determine the effects o f discharges on seasonalabundance, distribution, and composition o f ichthyoplankton in the oil field. In: Jackson. W.B.. editor. Environmental Assessment o f an Active Oil Field in the Northwestern Gulf o f Mexico. 1977-1978. NOAA Report to EPA, Contract Number EPA-IAG-D5-E693-EO. NMFS Southeast Fisheries Center, Galveston.
Finucane. J.H., L.A. Collins. L.E. Barger and J.D. McEachran. 1979b. Ichthyoplankton/mackerel eggs and larvae. In: Jackson. W.B., editor. Environmental Studies o f the South Texas Outer Continental Shelf 1976. Contract Number AA550-TA7-3. NOAA Final Report to BLM. NMFS Southeast Fisheries Center. Galveston.
Floyd, K.B., W.H. Courtenay and R.D. Holt. 1984. A new larval fish light trap: the quatrefoil trap. Progressive Fish-Culturist 46:216-219.
Hernandez, FJ., Jr. and D.G. Lindquist. 1999. A comparison o f two I ight-trap designs for sampling larval and presettlement juvenile fish above a reef in Onslow Bay, North Carolina. Bulletin o f Marine Science 64:173-184.
161
Reproduced with permission of the copyright owner. Further reproduction prohibited without permission.

Hick ford, M.J.H. and D.R. Schiei. 1999. Evaluation o f the performance o f light traps for sampling fish larvae in inshore temperate waters. Marine Ecology Progress Series 186:293-302.
Katsuragawa M. and Y. Matsuura. 1990. Comparison o f the diel and spatial distribution patterns o f ichthyoplankton and ichthyoneuston in the Southeastern Brazilian Bight. Bolm Institute Oceanografico, Sao Paulo 38(2): 133-146
Kelley, S.. J.V. Gartner. Jr., W.J. Richards and L. Ejsymont. 1993. SEAMAP 1984 and 1985-Ichthyoplankton: Larval distribution and Abundance o f Carangidae, Clupeidae, Coryphaenidae, Engraulidae, Gobiidae, Istiophoridae, Lutjanidae, Scombridae. Serranidae, and Xiphiidae in the G ulf o f Mexico. NOAA Technical Memorandum NMFS-SEFSC-317.
Kendall, A.W., Jr. and N.A. Naplin. 1981. Diel-depth distribution o f summer ichthyoplankton in the Middle Atlantic Bight. Fishery Bulletin 79(4):705-726.
Leis, J.M. 1991. The pelagic stage o f reef fishes: the larval biology o f coral reef fishes. In Sale, P.F., editor. The Ecology o f Fishes on Coral Reefs. Academic Press. San Diego.
Loeb, V.J. 1979. Vertical distribution and development o f larval fishes in the North Pacific central gyre during summer. Fishery Bulletin U.S. 77:777-793.
Love. M.S.. J.E. Caselle and L. Snook. 1999. Fish assemblages around seven oil platforms in the Santa Barbara Channel area. Fisheries Bulletin 98:96-117.
Magurran. A.E. 1988. Ecological Diversity and Its Measurement. Princeton University Press. Princeton.
Powell, A.B. and R.E. Robbins. 1998. Ichthyoplankton adjacent to live-bottom habitats in Onslow Bay, North Carolina. NOAA Technical Report NMFS 133
SAS Institute, Inc. 1989. SAS/STAT Users Guide, Version 6. SAS Institute, Cary.
Schoener, T.W. 1970. Non-synchronous spatial overlap o f lizards in patchy habitats. Ecology 51:408- 418.
Secor. D.H., J.M. Dean and J. Hansbarger. 1993. Modification o f the quatrefoil light trap for use in hatchery ponds. Progressive Fish Culturist 54:202-205.
Shinn. E.A. 1974. Oil structures as artificial reefs. In: Marine environmental implications o foffshore oil and gas development in the Baltimore Canyon region o f the Mid-Atlantic coast. Estuarine Research Federation 75-1.
Stanley. D.R. and C.A. Wilson. 1997. Seasonal and spatial variation in the abundance and sizedistribution o f fishes associated with a petroleum platform in the northern Gulf o f Mexico. Canadian Journal o f Fisheries and Aquatic Science 54:1166-1176.
Stanley, D.R. and C. Wilson. 2000. Seasonal and spatial variation in the biomass and size frequency distribution o f the fish associated with oil and gas platforms in the northern G ulf o f Mexico. OCS Study MMS 2000-005. U.S. Department o f Interior, Minerals Management Service, Gulf o f Mexico OCS Region, New Orleans.
Thorrold, S.R., J.M. Shenker, E. Wishinski. R. Mojica and E.D. Maddox. 1994. Larval supply o f shorefishes to nursery habitats around Lee Stocking Island, Bahamas. I. Small-scale distribution patterns. Marine Biology 118:555-566.
162
Reproduced with permission of the copyright owner. Further reproduction prohibited without permission.

CHAPTER 5
THE EARLY LIFE HISTORY STAGES OF REEF-DEPENDENT AND REEF-ASSOCIATED FISHES COLLECTED AT THREE OIL AND GAS PLATFORMS
163
Reproduced with permission of the copyright owner. Further reproduction prohibited without permission.

INTRODUCTION
Most fishes associated with reef environments have a pelagic larval stage, followed by a
settlement, or transition, to a demersal adult phase (Leis 1991). Since most reef fishes are relatively
sedentary as adults (Thresher 1984; Sale 1980), their planktonic stages are important in terms o f dispersal
and replenishment o f reef fish populations, which are often patchily distributed (Sale 1980; Richards and
Lindeman 1987; Carr 1991). Many studies have examined the relative importance o f reef fish
recruitment from external sources (i.e., adjacent or distant reef populations) vs. self-recruitment, with
mixed results (Cowen and Castro 1994; Danilowicz 1997; Mullineaux and Mills 1997; Swearer et al.
1999). It is increasingly important, therefore, for recruitment studies to sample the full size-range o f
pelagic phases, from preflexion and early flexion larvae (local supply) to postflexion larvae and juveniles
(potential settlers).
The rarity o f reef fish larvae in the plankton (Leis 1991). however, can be a major hindrance to
studies that attempt to address supply issues. Though most reef fishes are highly fecund, mortality
during the pelagic phase approaches 100% (Leis 1991). Settlement to the reef site is equally precarious,
as newly-settled postlarvae and juveniles can experience high predation pressures (i.e., the "wall o f
mouths" hypothesis) from resident adults (Emery 1973; Hamner et al. 1988). The pelagic- and
settlement-phase predation gauntlets, combined with the patchy nature o f suitable settlement habitat, can
therefore result in relatively few surviving juveniles available for recruitment.
In examining the across-shelf larval and juvenile fish assemblages collected at oil and gas
platforms in the northern Gulf o f Mexico (Gulf), samples were collected within and downstream o f
platform structures with passive plankton nets and light-traps (Chapter 2). These methodologies
complemented each other, since nets effectively sample yolk-sac, larval and some postlarval fishes,
whereas light-traps sample photopositive species at overlapping and larger sizes (Chapter 3). The
combined gears allow for the collection o f a more complete range o f available species, sizes and
developmental stages. The sampling design utilized plankton net samples to provide estimates o f nearby
spawning (possibly at upstream platforms within the vicinity) and the overall larval fish supply to the
platforms. Light-trap collections were used to provide estimates o f the presettlement or settlement-sized
fish that would represent potential recruits to the platforms. As expected, reef-associated and
164
Reproduced with permission of the copyright owner. Further reproduction prohibited without permission.
reef-dependent taxa were relatively rare compared to other, more common taxa found in ichthyoplankton
surveys in the northern Gulf (Chapter 2).
In this chapter I examine the relative abundances and size distributions o f reef fish larvae and
juveniles collected during the course o f the study. In order to determine which life history stages were
collected and how those specimens relate to supply and recruitment, size distributions o f platform-
collected reef fish larvae and juveniles are compared with literature-based sizes for hatchling, larval,
postlarval and settlement-sized juvenile reef fishes. Also, in an effort to compare platform-collected fish
abundances to continental shelf or "background" abundances, comparisons o f reef-dependent and reef-
associated fishes are made with nearby surveys from the Southeast Area Monitoring and Assessment
Program (SEAMAP).
MATERIALS AND METHODS
Data collection and analyses focused on three oil and gas platforms in the northern Gulf. Three
communities were characterized: a coastal assemblage (3-20 m depth), an offshore assemblage (20-60 m
depth), and a bluewater/tropical assemblage (>60 m). Mobil’s Green Canyon (GC) 18, which lies in
about 230 m o f water on the upper shelf slope (27°56'37"N. 9 lo0I'45"W), was sampled monthly during
new moon phases over a 2-3 night period during July 1995-June 1996. Mobil’s Grand Isle (GI) 94B,
which lies in approximately 60 m o f water at mid-shelf (28°30’57"N, 90°07’23’’W), was sampled twice
monthly during new and full moon phases over a three night period during April-August 1996. In
addition, during May extra samples during the first quarter and third quarter moon phases were collected,
but due to inclement weather, full moon collections were cancelled. Exxon's South Timbalier (ST) 54G,
which lies in approximately 20 m o f water on the inner shelf (28°50'01 ”N, 90°25'00" W), was sampled
twice monthly over a 2-3 night period during new and full moons during April-September, 1997.
Sampling protocols are described in detail elsewhere (Chapter 2). In general, passive plankton
nets (60-cm diameter 333pm mesh dyed green) were used to collect ichthyoplankton at the three
platform sites, both at depth ( 15-23 m for 10-20 min, set and retrieved closed) and near surface ( I -2 m for
10-15 min) within the platform structure. Plankton net samples were standardized to number o f fish per
100 m3 (density). Quatrefoil light-traps were deployed for 10 minutes at depth and near surface within
the platform structure. An additional light-trap was floated downstream (approximately 20 m) from the
165
Reproduced with permission of the copyright owner. Further reproduction prohibited without permission.

platform for off-platform collections. Both the subsurface and off-platform light-traps were deployed
with the light o ff until the sampling depth/location was reached, fished, and then retrieved with the light
off. Light-trap samples were standardized to a catch-per-unit-effort (CPUE) o f fish per 10 min.
While many fishes are found in association with natural and artificial reefs in the G ulf o f
Mexico, I followed the descriptions o f Choat and Bel (wood (1991) as a guide in defining reef-dependent
and reef-associated fishes. Reef-dependent taxa are those that are associated with reef habitat for the
duration o f their adult life and include individuals from the families Chaetodontidae (butterflyfishes),
Pomacanthidae (angelfishes), Acanthuridae (surgeonfishes), Scaridae (parrotfishes), Pomacentridae
(damselfishes) and Labridae (wrasses). Reef-associated taxa are those commonly found in association
with reef habitats and are often exploiting the resources o f the reef, but they may occur in other habitats
as well. While this definition is open to interpretation and may encompass many pelagic (e.g.,
Sphyraenidae, Rachycentridae, Scombridae, Carangidae) and benthic/demersal taxa (e.g., Gobiidae.
Opistognathidae. Muraenidae, Synodontidae), I w ill limit the discussion to just a few. common families:
Blenniidae (blennies), Lutjanidae (snappers), Serranidae (groupers and sea basses), and Holocentridae
(squirrelfishes).
Reef fish larvae and juveniles were identified to the lowest possible taxonomic level and
measured to the nearest millimeter with an ocular micrometer to determine notochord lengths (hatchling
and preflexion larvae) and standard lengths (flexion, postflexion and juvenile fishes). In the event that
the number o f fish in a sample was greater than SO for any single species, the largest, smallest and a
random subsampie o f 50 individuals were measured. Also, damaged fishes were not measured and
therefore not used in these analyses. Size distributions for the dominant reef-associated and reef-
dependent taxa collected at the oil and gas platforms were plotted against known sizes for different early
life history stages (hatchling, preflexion, flexion, postflexion and juvenile). Unfortunately, there is
relatively little information on the identification o f reef fish larvae and juveniles down to the genus or
species level (Leis 1991), and even less information is available on species-specific size ranges o f the
different early life history stages. Size ranges for the different life-history stages, therefore, are at the
family level and are compiled from numerous published studies (Table 5.1). Taxonomic richness (either
at the family or genus/species level) is used in reference to the number o f taxa collected.
166
Reproduced with permission of the copyright owner. Further reproduction prohibited without permission.
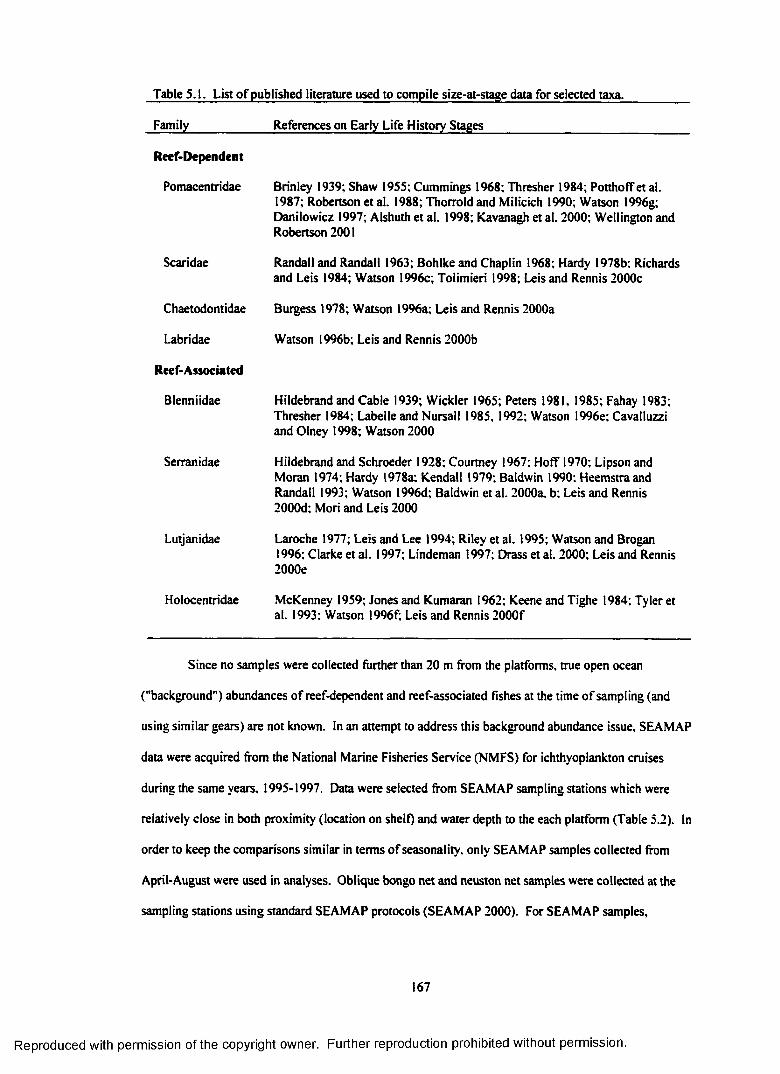
Table S. 1. List o f published literature used to compile size-at-stage data for selected taxa.
Family References on Early Life History Stages
Reef-Dependent
Pomacentridae Brinley 1939; Shaw 1955; Cummings 1968; Thresher 1984; Potthoff et al. 1987; Robertson et al. 1988; Thorrold and Milicich 1990; Watson 1996g; Danilowicz 1997; Alshuth et al. 1998; Kavanagh et al. 2000; Wellington and Robertson 2001
Scaridae Randall and Randall 1963; Bohlke and Chaplin 1968; Hardy 1978b; Richards and Leis 1984; Watson 1996c; Tolimieri 1998; Leis and Rennis 2000c
Chaetodontidae Burgess 1978; Watson 1996a; Leis and Rennis 2000a
Labridae Watson 1996b; Leis and Rennis 2000b
Reef-Associated
Blenniidae Hildebrand and Cable 1939; Wickler 1965; Peters 1981, 1985; Fahay 1983; Thresher 1984; Labelle and Nursall 1985, 1992; Watson 1996e: Cavalluzzi and Olney 1998; Watson 2000
Serranidae Hildebrand and Schroeder 1928; Courtney 1967; Hoff 1970; Lipson and Moran 1974; Hardy 1978a; Kendall 1979; Baldwin 1990; Heemstraand Randall 1993; Watson 1996d; Baldwin et al. 2000a, b; Leis and Rennis 2000d; Mori and Leis 2000
Lutjanidae Laroche 1977; Leis and Lee 1994; Riley et al. 1995; Watson and Brogan 1996; Clarke et al. 1997; Lindeman 1997; Drass et al. 2000; Leis and Rennis 2000e
Holocentridae McKenney 1959; Jones and Kumaran 1962; Keene and Tighe 1984; Tyler et al. 1993: Watson 1996f; Leis and Rennis 2000f
Since no samples were collected further than 20 m from the platforms, true open ocean
("background") abundances o f reef-dependent and reef-associated fishes at the time o f sampling (and
using similar gears) are not known, in an attempt to address this background abundance issue, SEAMAP
data were acquired from the National Marine Fisheries Service (NMFS) for ichthyoplankton cruises
during the same years, 1995-1997. Data were selected from SEAMAP sampling stations which were
relatively close in both proximity (location on shelf) and water depth to the each platform (Table 5.2). In
order to keep the comparisons similar in terms o f seasonality, only SEAMAP samples collected from
April-August were used in analyses. Oblique bongo net and neuston net samples were collected at the
sampling stations using standard SEAMAP protocols (SEAMAP 2000). For SEAMAP samples,
Reproduced with permission of the copyright owner. Further reproduction prohibited without permission.

Table 52. Location and maximum sampling depth range in meters (m) o f oblique bongo tows for SEAMAP sampling stations (oblique bongo and neuston collections) used for comparison with platform data._____________________________________________
Location Maximum depth range (m)
Outer shelf 28.00 N 90.00 W 193-20128.00 N 90.50 W t28.00 N 91.00 W 130-16728.00 N 91.50 W t28.00 N 92.00 W 73-117
Mid-shelf 28.50 N 90.50 W 31-3828.50 N 91.00 W 23-33
Inner shelf 29.00 N 90.50 W 6-1129.00 N 91.00 W 6-729.00 N 91.50 W 8-10
tNo oblique bongo sample collected so only neuston net collections were used.
abundances were calculated as number o f fish under 10 m2 o f seawater (fish/10 m2) for reef-dependent
and reef-associated families collected in oblique bongo tows (60 cm diameter frames with 333 urn mesh
nets). Mean abundances were calculated from samples collected at selected outer shelf (n=21), mid-shelf
(n=8) and inner shelf (n= 12) sampling stations. For platform data, only paired, passive plankton net
samples (surface and subsurface) were used in the calculation o f abundances (fish/10 m2):
[(N i + N2)/(V i + V:)j x D x 10 where N i = number o f fish in surface sampleN; = number o f fish in subsurface sample V i = volume of water filtered in surface sample V: = volume o f water filtered in subsurface sample D = total depth sampled
Since this calculation requires both subsurface and surface samples, the number o f comparisons were
limited due to one o f these gears fouling (Chapter 2), particularly at the inner shelf (ST 54, n=7) and outer
shelf (GC 18, n= 14) sites. A nearly full complement o f samples was available for comparison for the
mid-shelf site (GI 94. n= 161).
Similarly, the mean number o f fish collected in SEAMAP neuston net ( I x2 m opening with 948
pm mesh net) samples was calculated for outer shelf (n=25), mid-shelf (n=8) and inner shelf (n=12)
stations. These values were compared to the mean number o f fish collected in surface and off-platform
light-trap samples (surface) collected at the outer shelf (n = 154), mid-shelf (n=319) and inner shelf
168
Reproduced with permission of the copyright owner. Further reproduction prohibited without permission.

(n=146) platforms. No statistical comparisons were made due to the often large disparity in sampling
effort between the SEAMAP and platform samples (i.e., larger volumes o f water filtered in SEAMAP
samples and, therefore, higher probabilities o f encountering patches o f larvae), as well as the difficulties
in making meaningful comparisons among different sampling gears fished for different durations and
during different times o f the day (day vs. night). In addition, platform plankton net abundances are
conservative estimates, since the multiplier D (total depth sampled in the equation above) was only 15-23
m and not the total depth o f the water column as was the case for most SEAMAP data utilized.
RESULTS
Reef-dependent and reef-associated fishes were relatively uncommon in light-trap and plankton
net collections at all three platforms (Table 5.3). O f the 5,057 fish collected at shelf break platform (125
plankton net collections; 319 light-trap collections), only 87 fish were reef-dependent fishes and 184 were
reef-associated fishes, representing 1.7% and 3.6% o f the total catch, respectively. Scarids dominated the
Table 5.3. Total number o f fish and percent o f reef-dependent and reef-associated fishes collected at each platform site. Numbers and percentages in parentheses represent values based on non-clupeiform data.____________________________
Outer Shelf (GC 18)
Mid-Shelf (GI 94)
Inner Shelf (ST 54)
Total Number o f fish 5,057 (2,063) 45, 754(15. 550) 97,697 (2, 882)
Reef-Dependent 1.7% (4.2%) 0.4% (1.2%) 0.01% (0.3%)
Reef-Associated 3.6% (8.9%) 8.8% (26.0%) 0.2% (7.1%)
reef-dependent taxa collected (n=65). followed by pomacentrids (n=21) and chaetodontids (n= I ). The
most common reef-associated fishes were serranids (n=73), followed by lutjanids (n=49), blennies (n=41)
and holocentrids (n=22). At the mid-shelf platform (GI 94), 45,754 fish were collected (plankton net
collections, n=324; light-trap collections, n=474), o f which 187 fish were reef-dependent (0.4%) and
4,045 were reef-associated fishes (8.8%). The most common reef-dependent fishes were pomacentrids
(n= 183). followed by labrids (n=3) and chaetodontids (n= I). Blennies (n=3,874) dominated the reef-
associated taxa, followed by serranids (n=l 12), lutjanids (n=92) and holocentrids (n=12). At the inner
169
Reproduced with permission of the copyright owner. Further reproduction prohibited without permission.

shelf platform (ST 54), 97,697 fish were collected (plankton net collections, n=89; light-trap collections,
n=194), o f which only 9 fish represented reef-dependent taxa (0.01%) and 206 represented reef-
associated taxa (0.2%). The most common reef-dependent fishes were pomacentrids (n=7), labrids (n= I )
and scarids (n=l). Blennies (n=l87) dominated the reef-associated taxa, followed by lutjanids (n=18) and
serranids (n=8). Two o f the reef-dependent groups o f fishes, the pomacanthids and the acanthurids, were
not collected during the course o f the study.
Reef-Dependent Fishes Collected and Size-at-Stage Literature
Pomacentridae (Damselfishes)
Damselfishes are among the most speciose o f the reef fishes. Species accounts vary, but the
numbers range from 225 species in approximately 25 genera (Thresher 1984; Lieske and Myers 1996;
Alshuth et al. 1998) to approximately 321 species in approximately in 28 genera (Choat 1991; Allen
1991). Fourteen species (4 genera) occur in the Caribbean and Gulf o f Mexico (Robins et al. 1986;
Lieske and Myers 1996). Ten o f these species {Abudefduf saxatalis, Chromis cyanea, C. enchrysura, C.
insolata. C. multiiineata, C. scotti, Microspathodon chrysurus, Pomacentrus partitus. P. planifrons and
P. variabilis) have been observed on hard-bottom banks and other areas in the northcentral G ulf (Sonnier
et al. 1976; Hoese and Moore 1977; Dennis and Bright 1988). Damselfishes, particularly juveniles, are
common residents on artificial structures as well (Rooker et al. 1997). Abudefduf saxatilis, A. taurus, C.
multiiineata. P. fuscus, P. partitus, P. planifrons. and P. variabilis have been observed in association with
oil and gas platforms. O ff the Florida coast, P. variabilis are the most common pomacentrid observed at
artificial structures, but others (A. saxatilis, C. enchrysurus, C. scotti. and P. partitus) are present as well
(Hastings etal 1976).
Pomacentrids were among the most common reef-dependent taxa collected at the platforms.
Among reef-dependent fishes, damselfishes ranked second in abundance at the shelf break site (n=2i),
and first in abundance at the mid-shelf (n=!83) and inner shelf (n=7) sites. At the shelf break site (GC
18), only postflexion and juvenile Pomacentrus spp. (9-19 mm)were collected (Figure 5.1), most between
9-10 mm. These individuals were within the settlement size ranges (8.8-13.6 mm) described for five o f
the six western Atlantic species in the genus Pomacentrus (Wellington and Robertson 2001).
170
Reproduced with permission of the copyright owner. Further reproduction prohibited without permission.

14
12
10JAa3
» 8 TJ C'oi 6E3
Hatch__PrgfjgxiOT
_Rgxion_
PostflexionJuvenile ■ ^ 2 4 mm
■ Pomacentrus spp.
N = 21
I9 10 11 12 13 14 15 16 17 18 19
Size (mm)
Figure 5.1. Size distribution o f pomacentrids collected at the outer shelf platform (GC 18). Lines above the bars denote the size ranges for different early life history stages based on published literature. N = total number o f fish measured.
171
Reproduced with permission of the copyright owner. Further reproduction prohibited without permission.

At the mid-shelf site (GI 94), individuals were collected from a wider range o f sizes (3.0-25.0
mm) and taxa (3 genera; Figure 5.2). Pomacentrus spp. (n=85) ranged from 4.0-16.0 mm in length and
were mostly postflexion larvae and settlement-size juveniles (Wellington and Robertson 2001). Second
in abundance at the mid-shelf site were Chromis spp. (n=84), which ranged in size from 3.0-25.0 mm.
While there are five Chromis species in the Caribbean and Gulf, size-at-stage information is available for
only one, C. muliilineata, which has a hatchling size range o f2.09-2.45 mm and a relatively large
settlement size range o f 17.2-22.1 mm (Wellington and Robertson 2001). Most o f the Chromis
specimens collected at this site were in the postflexion/early juvenile stage. Seven Abudefduf spp. were
collected, with a size range o f 10.0-18.0 mm. Based on published size-at-stage data for the western
Atlantic A. saxatilis, the individuals collected at the mid-shelf site were in the postflexion larvae (9.9-13.1
mm) and juvenile ( 17.1-19.0 mm) size ranges (Alshuth et al. 1998).
At the inner shelf site, only one Pomacentrus ( 10.0 mm) and six Abudefduf (MAS mm)
individuals were collected, and they represented postflexion larvae and settlement juvenile size classes
(Alshuth etal. 1998; Wellington and Robertson 2001).
Scaridae (Parrotflshesl
Parrotfishes are a group o f colorful herbivores common in shallow tropical and subtropical reef
areas (Reeson 1983). There are approximately 60 species (10 genera) worldwide, with 14 o f these (4
genera) occurring in Caribbean and Gulf waters (Robins et al. 1986: Bellwood 1994). Six species
(Scarus taeniopterus, Scarus vetula. Scarus croicensis, Sparisoma atomarium, Sparisoma aurofrenatum
and Sparisoma viride) have been described as occasional or rare inhabitants on natural hard-bottom reefs
in the northern Gulf, generally in mid-shelf or inner shelf (<85 m) areas (Sonnier et al. 1976; Dennis and
Bright 1988). Also, Sparisoma aurofrenatum and S. viride have been observed at oil and gas platforms
o ff Louisiana (Rooker et al. 1997).
Sixty-ftve larval and juvenile scarids were collected at the shelf break platform (GC 18) in 1995
during the late summer (August) and fall months (October and November). At the inner shelf platform
(ST 54), a single individual was collected in April 1997. No scarids were collected at the mid-shelf
platform (GI 94). Sizes o f individuals collected at the shelf break site ranged from 2.0-10.0 mm, with
most o f the larvae (67%) in the 2.3-3.0 mm size range (Figure 5.3). The individual collected at the
172
Reproduced with permission of the copyright owner. Further reproduction prohibited without permission.

45
40
35
jo 30 a3
€ 25
1 20 E3z 15
10
Hatch
PreflexionFlexion
Postflexion
Juvenile
□ Pomacentrus spp. B Chromis spp.M Abudefduf spp.B Unidentified
N = 181
2 3 4 5 6 7 8 9 10 11 12 13 14 15 16 17 18 19 20 21 22 23 24 25
Size (mm)
Figure 52. Size distribution o f pomacentrids collected at the mid-shelf platform (GI 94). Lines above the bars denote the size ranges for different early life history stages based on published literature. N = total number o f fish measured.
173
Reproduced with permission of the copyright owner. Further reproduction prohibited without permission.

Hatch
■ Unidentified
Figure 5.3. Size distribution o f scarids collected at the outer shelf platform (GC 18). Lines above the bars denote the size ranges for different early life history stages based on published literature. N = total number o f fish measured.
174
Reproduced with permission of the copyright owner. Further reproduction prohibited without permission.

inner shelf platform was 11.0 mm.
Very little size-at-stage information is available for larval and juvenile parrotfishes, but previous
studies indicate that settlement occurs at a relatively small size (Watson 1996c; Tolimieri 1998). The
largest pelagic specimens collected in the Indo-Pacific, for example, range from 7.2-15.2 mm (Leis and
Rennis 2000c). Sparisoma viride, a common Caribbean species, settle at 10 mm (Tolimieri 1998). Based
on size-at-hatch information for Pacific taxa (1.6-1.7 mm), many o f the scarids collected at the shelf
break site were probably locally spawned, but several others were at least approaching settlement size (9-
11 mm).
Labridae (Wrasses)
The family Labridae is one o f the most speciose and diverse among reef fishes (Victor 1986).
There are anywhere between 400-500 species worldwide in approximately 50-60 genera (Victor 1986;
Choat and Bellwood 1991; Watson 1996). Twenty-one species occur in the Caribbean and Gulf,
representing 10 genera (Robins et al. 1986: Robins et al. 1991). These fishes are among the most
abundant reef-dependent taxa on natural and artificial habitats in the northern Gulf. Eleven taxa
(Bodianus pulchellus, B. rufiis, Clepticus parrai, Halichoeres bivittaius, H. caudal is. H. garnoti, H.
maculipinna. H. radiatus. Hemipteronotus spp., Lachnolaimus maximus, and Thalassoma bifasciatum)
have been reported from hard-bottom banks and other areas in the northwestern Gulf, primarily in
shallower (inner and mid-shelf) waters (Sonnier et al. 1976: Hoese and Moore 1977; Dennis and Bright
1988). Bodianus pulchellus, B. rufiis and T. bifasciatum are relatively common on oil and gas platforms,
while Clepticus parrai have been observed at these structures in fewer numbers (Sonnier et al. 1976;
Rooker et al. 1997). Rooker et al. (1997) noted that while labrids accounted for approximately 25% o f
the reef-dependent taxa at both their artificial and natural reefs, the species compositions differed. Both
sites held high numbers o f f . bifasciatum, for example, but more Bodianus spp. were found at platforms
than at natural reefs. Halichoeres spp. were only located on the natural reefs. In the northeastern Gulf.
Halichoeres caudalis, H. bivittaius, Hemipteronotus novacula, L maximus and T. bifasciatum were found
in association with artificial structures (Hastings et al. 1976).
Labrids were rare in collections at all platform sites. No wrasses were collected at the shelf
break platform. Three labrids were collected at the mid-shelf platform (3.0, 10.0 and 13.0 mm
175
Reproduced with permission of the copyright owner. Further reproduction prohibited without permission.

individuals) and only one individual was collected at the inner shelf site (15.0 mm). There is little size-
at-stage information available for western Atlantic wrasses. Based on personal observations and
information derived from Pacific specimens, most o f the specimens are in the postflexion (4.0-21.0 mm)
or juvenile (11.9-34.0 mm) size classes (Watson 1996b). Labrid hatchling sizes (Pacific taxa) range from
1.5-2.7 mm, while yolk-sac larvae range from 1.5-3.3 mm (Watson 1996b; Leis and Rennis 2000b).
Based on these sizes, the smallest individual (3.0 mm, mid-shelf) is likely a result o f local spawning.
Chaetodontidae (Butterflvfishes)
Butterflyfishes are small, warm-temperate and tropical fishes common around reefs and hard
structures (Robins et al. 1986). There are 114 recognized species (10 genera), o f which 6 species (1
genus) occur in the Gulf and Caribbean (Burgess 1978; Choat and Bellwood 1991). Adult Chaeiodon
aculeatus, C. ay a, C. ocellatus, C. sedentariits, C. capistratus and C. striatus have all been observed on
hard-bottom banks in the northern Gulf (Sonnier et al. 1976; Hoese and Moore 1977; Dennis and Bright
1988; Rooker et al. 1997). Several species have been observed in association with offshore platforms,
including C. sedentarius and C. striatus o ff Louisiana (Sonnier et al. 1976; Rooker et al. 1997), and C.
ocellatus and C. sedentarius o ff the Florida Gulf coast (Hastings et al. 1976). Since tagging experiments
and other observations have demonstrated that butterflyfishes are very site specific (Bardach I9S8; Aiken
1983; McBride and Able 1998), it is likely that adults on these sites are the result o f juvenile settlement
from the plankton rather than adult immigration.
Only two chaetodontids were collected during the course o f this study: a 4.0 mm individual at
the shelf break platform (GC 18) and a 4.0 mm individual at the mid-shelf platform (GI 94). Very little
information is available on the early life history stages o f these fishes. Based on a few described Pacific
taxa. chaetodontid larvae hatch at approximately 1.4-1.9 mm. with flexion not occurring until
approximately 4.0-5.3 mm (Watson 1996a; Leis and Rennis 2000a). Larger postflexion, "tholichthys"
and pelagic juvenile individuals have been described as well, with a composite size range o f 6.5-60 mm
(Burgess 1978: Watson 1996a: Leis and Rennis 2000a). Based on observations in this study and the
published size-at-stage descriptions, the two chaetodontids collected in this study were planktonic. early-
flexion larvae. Little is known about the length o f chaetodontid pelagic larval durations. Juveniles o f
several Atlantic and Caribbean taxa have been collected as far north as Cape Cod and Nova Scotia
176
Reproduced with permission of the copyright owner. Further reproduction prohibited without permission.

(McBride and Able 1998), but no recently-spawned, preflexion larvae have been collected in these
temperate waters. The individuals collected at these study sites are very likely from local spawning
populations.
Pomacanthidae (Angel fishes)
Angelfishes are closely related to butterflyfishes and are also common coral reef inhabitants
(Thresher 1984). There are 74 species (7 genera), o f which only 6 species (3 genera) occur in the Gulf o f
Mexico and Caribbean (Hoese and Moore 1977; Aiken 1983). While not very abundant, all six species
(Centropyge argi, Holacanthus bermudensis, H. ciliaris, H. tricolor, Pomacanlhus arcuatus, P. paru)
have been observed on hard-bottom banks in the northern Gulf (Sonnier et al. 1976; Hoese and Moore
1977; Dennis and Bright 1988). In addition. H. ciliaris, although rare, have been observed on offshore
platforms in the northcentral Gulf (Hoese and Moore 1977). and H. bermudensis were observed at
platforms surveyed in the northeastern G ulf (Hastings et al. 1976). Despite the occurrence o f the adults
on both natural and artificial reefs in the northern Gulf, no larvae and juveniles were collected during the
course o f the study.
Acanthuridae (Surgeon fishes!
Surgeonfishes are conspicuous herbivores on many shallow, tropical reefs (Thresher 1984;
Choat 1991). There are approximately 76 species (6 genera) worldwide, and four o f these occur in the
northern Gulf, all in the genus Acanthurus. Acanthurus bahianus, A. chirurgus, and A. coeruleus have
been observed on natural hard-bottoms in the northern Gulf, but the occurrences were relatively rare, and
generally more common inshore at depths less than 85 m (Hoese and Moore 1977; Dennis and Bright
1988). Adult A. chirurgus and A. coeruleus were all reported from oil and gas platforms in the
northcentral G ulf (Sonnier et al. 1976; Rooker et al. 1996), while A. chirurgus and A. coeruleus were
reported o ff research platforms in the northeastern G ulf (Hastings et al. 1976). Despite the occurrence o f
the adults on both natural and artificial reefs in the northern Gulf, no larvae and juveniles were collected
during the course o f this study.
177
Reproduced with permission of the copyright owner. Further reproduction prohibited without permission.

Reef-Associated Fishes Collected and Size-at-Stage Literature
Blenniidae (Combtooth Blennies)
Combtooth blennies are small, demersal fishes found in shallow reef and nearshore habitats
(Robins et al 1986). There are approximately 345 species worldwide (53 genera), 15 o f which (8 genera)
occur in the Caribbean and G ulf (Robins 1986; Robins et al. 1991; Watson I996e). While blennies have
been reported from natural habitats in the northern Gulf (Robins et al. 1986; Raugh 1996), they are often
underestimated or overlooked in surveys due to their small size and cryptic habits. Blennies commonly
inhabit the barnacle shells attached to oil and gas platforms, and these habitats serve as spawning areas
for these relatively sedentary and demersal spawning fishes (Gallaway 1980; Smith-Vaniz 1980;
Gallaway et al. 1981: Peters 1981; Raugh 1996). Ophioblennius allanticus and Hypleurochilus
geminatus were reported as common on oil and gas platforms in the northern Gulf, but were relatively
rare on adjacent natural reefs (Sonnier et al. 1976; Rooker et al. 1997). Parablennius marmoreus and
Hypsoblennius imemar were also present on platforms in the northwestern Gulf, while P. marmoreus and
H. geminatus were observed on platforms in the northeastern Gulf (Hastings et al. 1976; Raugh 1996;
Rooker et al. 1997). Since blennies are sedentary and spend their entire adult existence at a single
location, recruitment to a population is a result o f juvenile settlement and not immigration o f adults
(Peters 1981).
Blennies were among the most dominant reef-associated fishes collected at the three platform
sites. At the shelf break site (GC 18), blennies (n=41), primarily unidentified, preflexion individuals,
ranked second in numerical dominance among reef-associated taxa (Figure 5.4). Eighty-five percent o f
the individuals collected were between 1.0-3.0 mm in length, indicative o f local spawning. Two. early
flexion Hypsoblennius imemar (4.0 mm) were collected at this site. While no published size-at-stage
information is available for H. imemar, this flexion stage occurs in the same size range (4.0-5.0 mm) as
that for a closely related species, H. hentz (Hildebrand and Cable 1939; Fahay 1983; Cavalluzzi and
Olney 1998). Also, two relatively large (31.0 and 32.0 mm) Ophioblennius atlanticus juveniles were
collected.
At the mid-shelf site (GI 94), blennies were the most abundant reef-associated taxa (n=3,874),
dominated by Hypsoblennius spp. (n= 1,285) and Parablennius marmoreus (n= l, 153) individuals
178
Reproduced with permission of the copyright owner. Further reproduction prohibited without permission.

35 Hatch
Preflexion
30 Flexion
Postflexion25
;> 20
2 15
10
Juvenile
u -
"► 58 mm
-► 58 mm
■ Ophioblennius atlanticus □ Hypsoblennius invemar■ Unidentified
N = 41
1 2 3 4 5 6 7 8 9 10 31 32
Size (mm)
Figure 5.4. Size distribution o f blennies collected at the outer shelf platform (GC 18). Lines above the bars denote the size ranges for different early life history stages based on published literature. Note break in size scale. N = total number o f fish measured.
179
Reproduced with permission of the copyright owner. Further reproduction prohibited without permission.

(Figure 5.5). Hypsoblennius spp. individuals ranged from 3.0-14.0 mm and encompassed the published
size ranges for all early life history stages. Parablennius marmoreus individuals generally encompassed
a larger size range (4.0-23.0 mm), including many juveniles, but also included individuals from all early
life history stages. Scartella cristata individuals (n=134) ranged from 4.0-16.0 mm in length and were
primarily flexion and early postflexion larvae (approximately 81%). A few Hypleurochilus multifilis
(n=l8) individuals were collected at the mid-shelf site, most o f which were flexion and early postflexion
larvae. Many unidentified blennies, most o f which were too small to identify (approximately 70%
between 1.0-3.0 mm), were also collected. Overall, a wider range o f sizes and taxa were present at the
mid-shelf vs. the shelf break site.
At the inner shelf platform (ST 54), blennies (n= 187) were once again the numerically
dominant, reef-associated taxa (Figure 5.6). The most common individuals. Scartella/Hypleurochilus
spp. (n=6I), were identified as being o f the same type, but due to identification limitations, could not be
resolved as either Scartella species or Hypleurochilus species. While this type ranged from 3.0-15.0 mm
in length, most o f the individuals (84%) were small juveniles. Another species complex. Hypsoblennius
henttionthas. was second in abundance (n=49) and ranged in size from 2.0-14.0 mm, encompassing all
early life history stages. Hypsoblennius invemar individuals were also collected, but at generally larger
sizes (5.0-13.0 mm), and encompassed primarily postflexion and juvenile size classes. Only two
Parablennius marmoreus individuals were collected (8.0 mm and 18.0 mm in length). Unidentified
blennies were also collected (n=35). and represented primarily small, preflexion individuals.
Serranidae (Sea Perches. Groupers. Sea Basses and Soaoflshes)
The family Serranidae is large and diverse, and includes sea perches, groupers, sea basses and
soapfishes (Thresher 1984). Adult serranids range in size from 3 cm to approximately 3 m, and many are
o f great commercial and recreational fisheries value (Watson 1996d). There are anywhere from 350-450
species world-wide in approximately 62 genera (Bohlke and Chaplin 1993; Nelson 1994).
Approximately 59 species (18-20 genera) are found in the Caribbean and Gulf (Robins et al. 1986:
Robins et al. 1991). Many o f these taxa are common in the northwestern Gulf, either on hard-bottom
banks or in association with oil and gas platforms, and their distribution changes across the shelf with
depth (Hoese and Moore 1977; Dennis and Bright 1988). Some taxa are primarily deep water fishes
180
Reproduced with permission of the copyright owner. Further reproduction prohibited without permission.

350
300
250MCOI 200
2 150 E
100
50
Hatch
iJVeflexjo^^ Flexion
Postflexion
Juvenile58 mm
58 mm
■ UnidentifiedO Hypsoblennius spp.□ Hypleurochilus multifilus■ Parablennius marmoreus□ Scartella cristata
N = 2,737
- I B1 2 3 4 5 6 7 8 9 10 11 12 13 14 15 16 17 18 19 20 21 22 23
Size (mm)
Figure 5.5. Size distribution o f blennies collected at the mid-shetf platform (GI 94). Lines above the bars denote the size ranges for different early life history stages based on published literature. N = total number o f fish measured.
181
Reproduced with permission of the copyright owner. Further reproduction prohibited without permission.
1

45
40
35
« 30 <a3SI 25 co1 20 E3z 15
10
5
0
HatchPreflexion
□ L I
Flexion
PostnexionJuvenile
58 mm
■ Scartella/Hypleurochilus B Parablennius marmoreus□ Hypsoblennius imemarB Hypsoblennius hentz/ionthas□ Unidentified
N = 187
8 9 10 11 12 13 14 15 16 17 18
Size (mm)
Figure 5.6. Size distribution o f blennies collected at the inner shelf platform (ST 54). Lines above the bars denote the size ranges for different early life history stages based on published literature. N = total number o f fish measured.
182
Reproduced with permission of the copyright owner. Further reproduction prohibited without permission.

known to occur on outer shelf reefs, and include Epinephelus Jlavolimbatus, E. nb/eata, E. striatus.
Goniopiectrus hispanus, Hemanthias leptus, H. vhranus, Mycteroperca rubra, M. microlepis,
Centropristis ocyurus, and Liopropoma rubre (Sonnier et al. 1976; Dennis and Bright 1988; Hoese and
Moore 1977). Other species are known primarily to occur on reefs on inner shelf and mid-shelf areas,
including Epinephelus adscensionis, E. cruentatus, E. guttatus, Liopropoma eukrines, Mycteroperca
bonaci, and M. interstitialis (Sonnier et al. 1976; Dennis and Bright 1988; Hoese and Moore 1977). The
reefs and platforms o ff Texas and Louisiana also serve as habitat for tropical species whose distributions
are otherwise limited to the Caribbean and southern Gulf waters. These fishes include Epinephelus
inermis, Epinephelus Julva, E. guttatus, Goniopiectrus hispanus, Holanthias martinicensis, Mycteroperca
interstitialis, M. tigris, M. venenosa and Serranus annularis (Hoese and Moore 1977; Dennis and Bright
1988). A number o f species have also been observed in association with oil and gas platforms, including
Mycteroperca bonaci, M. interstitialis, M. microlepis, M. phenax, M. venenosa, Epinephelus
adscencionis, E. cruentatus, E.fulvus, E. inermis, E. itajara. E. nigritus, Paranthias furcifer, and
Rypticus maculatus {Sonnier etal. 1976: Rooker et al. 1997; Stanley and Wilson 1997.2000).
Serranid larvae and juveniles were collected at all three platforms. While it is difficult to
identify serranids to the genus or species level, there are distinct differences between the subfamilies.
Therefore, all larvae and juveniles were identified as anthiine. epinepheline, serranine, grammistine or
liopropomatine fishes. With the exception o f liopropomatines, individuals from ail subfamilies were
represented in the collections.
At the shelf break platform (GC 18), serranids (n=73) were the most dominant, reef-associated
taxa collected (Figure 5.7). Epinephelines (n=31) and anthiines (n=30) were the most common serranids
collected, followed by unidentified serranids (n=10) and grammistines (n=2). Epinephelines were either
Mycteroperca spp. or Epinephelus spp. Anthiines included Anthias nicholsi, Hemanthias vivanus and
Protogrammus martinicensus. A ll fishes ranged in size from 2.0-5.0 mm in length, with the exception o f
one 12.0 mm anthiine. Most o f these individuals, therefore, are the result o f local spawning events, and
represent hatchling (1.2-2.5 mm), preflexion (2.5-5.2 mm) and flexion (3.3-6.0 mm) stage larvae (Hardy
1978a; Baldwin 1990; Heemstra and Randall 1993; Watson I996d; Leis and Rennis 2000d; Baldwin et al.
183
Reproduced with permission of the copyright owner. Further reproduction prohibited without permission.

40
35
30
3•2
Z 2001i 15
10
Hatch,£rgfjgxjgn_
FlexionPostflexion
Juvenile
-► 17 mm
210 mm
□ Unidentified
■Grammistinae
■ Epinephilinae
BAnthiinae
N = 73
6 7
Size (mm)
10 11 12
Figure 5.7. Size distribution o f serranids collected at the outer shelf platform (GC 18). Lines above the bars denote the size ranges for different early life history stages based on published literature. N = total number o f fish measured.
184
Reproduced with permission of the copyright owner. Further reproduction prohibited without permission.

2000a, b). The larger, 12.0 mm anthiine was the only early juvenile collected (Watson 1996d; Leis and
Rennis 2000d).
At the mid-shelf platform (Gl 94), four serranid subfamilies were represented (Figure 5.8). Most
were serranines (n=72), followed by anthiines (n=26), epinephelines (n=8) and grammistines (n=6).
Little is known about serranine larvae, but based on a few Pacific species, transformation usually occurs
around 11.0 mm (Watson 1996d). Approximately half o f the serranine larvae were early juveniles (16.0-
17.0 mm), while the others were preflexion, flexion and early postflexion sizes (3.0-9.0 mm). Similarly,
approximately half o f the anthiines were late postflexion and early juveniles (9.0-10.0 mm), while the
other half were preflexion and flexion-stage larvae (3.0-6.0 mm). Although few in number, a wide range
o f sizes was observed for epinephelines, including preflexion and flexion larvae (3.0-5.0 mm), as well as
postflexion larvae (9.0-10.0 mm) and juveniles (16.0-22.0 mm). Grammistines were represented in the
samples by two preflexion larvae (3.0-4.0 mm) and four early postflexion larvae (7.0-8.0 mm).
Relatively few serranids were collected at the inner shelf platform (Figure 5.9). Eight
unidentified serranids. including preflexion and early flexion larvae (2.0-5.0 mm) and one, postflexion
specimen (15.0 mm) were collected.
Lutianidae (Snappers)
Snappers are common residents in many reef and shallow coastal areas and many species are
targeted by recreational and commercial fishing efforts (Allen 1985). There are between 92-103 species
worldwide in 17 recognized genera (Allen 1985: Leis and Rennis 2000e). Eighteen o f these species (6
genera) occur in the Caribbean and Gulf (Allen 1985; Robins et al. 1991), with several species being
fairly common in the northern Gulf. Luljanus campechanus, a deep water species, is a common resident
on both natural and artificial reefs in the northern Gulf (Sonnier et al. 1976: Allen 1985: Dennis and
Bright 1988: Stanley and Wilson 1990. 1997. 2000; Rooker et al. 1997). Rhomboplites aurorubens is
another resident o f moderately deep waters, and has also been observed on natural reefs and platforms,
primarily along the mid-shelf (Sonnier et al. 1976; Allen 1985; Dennis and Bright 1988). Pristipomoides
aquilonaris another common resident o f hard-bottom banks on the mid- and outer shelf (Hoese and
Moore 1977). Other, more tropical snapper species are less common in the northern Gulf. Lutjanus
185
Reproduced with permission of the copyright owner. Further reproduction prohibited without permission.

HatchPreflexion
Postflexion
Juvenile
■Serraninae
■Grammistinae
□ Epinephelinae
BAnthiinae
1 2 3 4 5 6 7 8 9 10 11 12 13 14 15 16 17 18 19 20 21
Size (mm)
Figure 5.8. Size distribution o f serranids collected at the mid-shelf platform (Gl 94). Lines above the bars denote the size ranges for different early life history stages based on published literature. N = total number o f fish measured.
186
Reproduced with permission of the copyright owner. Further reproduction prohibited without permission.

Hatch Preflexion
Flexion
Postflexion■̂ ►17.0 mm
a■o
£ 2 o
E3
Juvenile-► 210 mm
■ Unidentified
N = 8
1 2 3 4 5 6 7 8 9 10 11 12 13 14 15
Size (mm)
Figure 5.9. Size distribution o f serranids collected at the inner shelf platform (ST 54). Lines above the bars denote the size ranges for different early life history stages based on published literature. N = total number o f fish measured.
187
Reproduced with permission of the copyright owner. Further reproduction prohibited without permission.

apodus, L griseus, L.jocu, L. synagris, L. cyanopterus and Ocyurus chrysurus are relatively rare, but
have been observed on natural banks in the northwestern G ulf (Sonnier et al. 1976; Dennis and Bright
1988). Similarly, some snappers (e.g., L cyanopterus, L. griseus, O. chrysurus) have been observed in
association with platforms in the northern Gulf (Hastings et al. 1976; Sonnier et al. 1976; Stanley and
Wilson 1997,2000).
Lutjanids were relatively common, reef-associated taxa at all three platforms sampled. At the
shelf break platform (GC 18), 34 Pristipomoides aquiionaris individuals were collected, and other than
one 40.0 mm juvenile, all were between 2.0-6.0 mm in length (Figure 5.10). Based on published studies,
these individuals were representative o f preflexion (3.2-4.7 mm), flexion (3.7-S.2 mm) and postflexion
(5.0-42.4 mm) stages (Leis and Lee 1994). Leis and Lee (1994) have noted that P. aquiionaris, as well as
other Pristipomoides species, may remain pelagic until relatively large sizes. Unidentified lutjanids
(n=24) were collected as well, and included a group o f small, preflexion and flexion-sized individuals
(2.0-5.0 mm) and a group o f larger, postflexion larvae and possibly early juveniles (13.0-16.0 mm).
At the mid-shelf platform, two groups o f lutjanids were collected. Lutjanus spp. (n=62) were
dominant and ranged in size from 3.0-11.0 mm in length (Figure 5.11). Based on previous studies on the
early life history stages o f several Lutjanus species, these individuals were representative o f preflexion
(2.6-5.5 mm), flexion (3.8-6.2 mm) and early postflexion (5.0-14.8 mm) stages (Watson and Brogan
1996; Clarke et al. 1997; Drass et al. 2000). Two size groupings o f Rhomboplites aurorubens (3.0-12.0
mm and 20.0-25.0 mm) were also collected at the mid-shelf platform. The smaller sizes are
representative o f early preflexion (approximately 3.0-4.7 mm), flexion (approximately 4.7-5.0 mm),
postflexion (5.0-8.3 mm) and early juvenile (8.3-10.9 mm) individuals (Laroche 1977). The second
grouping consisted o f small, presettlement juveniles.
At the inner shelf site (ST 54), few lutjanids were collected (n=l 8), but they represented the
second most abundant reef-associated taxa (Figure 5.12). Six Rhomboplites aurorubens individuals were
collected, including one postflexion larvae (10.0 mm) and five juveniles ( 19.0-29.0 mm). Four Lutjanus
campechanus specimens were collected, including one postflexion larva (6.0 mm) and three, early
juveniles (23.0-24.0 mm; Drass et al. 2000). Eight unidentified snapper larvae and juveniles were also
collected and ranged in size from 2.0-21.0 mm.
188
Reproduced with permission of the copyright owner. Further reproduction prohibited without permission.

18
16
14
12
I 10
£ 8
Hatch
Pggtflgwion-Juranite
B Pristipomoides aquiionaris ■ Unidentified
N =46
. 1 .1 2 3 4 5 6 7 8 9 10 11 12 13 14 15 16 17 18 19 20 40
Size (mm)
Figure 5.10. Size distribution o f lutjanids collected at the outer shelf platform (GC 18). Lines above the bars denote the size ranges for different early life history stages based on published literature. N = total number o f fish measured. Note break in size scale.
189
Reproduced with permission of the copyright owner. Further reproduction prohibited without permission.

35
30
25
ifi<0
I 20■oc
2 15 E3Z
10
Hatch
Preflexion
Flexion
Juvenile40 mm
■ Rhomboplites aurorubens■ Lutjanus spp.
N = 116
IIIIII1 2 3 4 5 6 7 8 9 10 11 12 13 14 15 16 17 18 19 20 21 22 23 24 25
Size (mm)
Figure 5.11. Size distribution o f lutjanids collected at the mid-shelf platform (GI 94). Lines above the bars denote the size ranges for different early life history stages based on published literature. N = total number o f fish measured.
190
Reproduced with permission of the copyright owner. Further reproduction prohibited without permission.
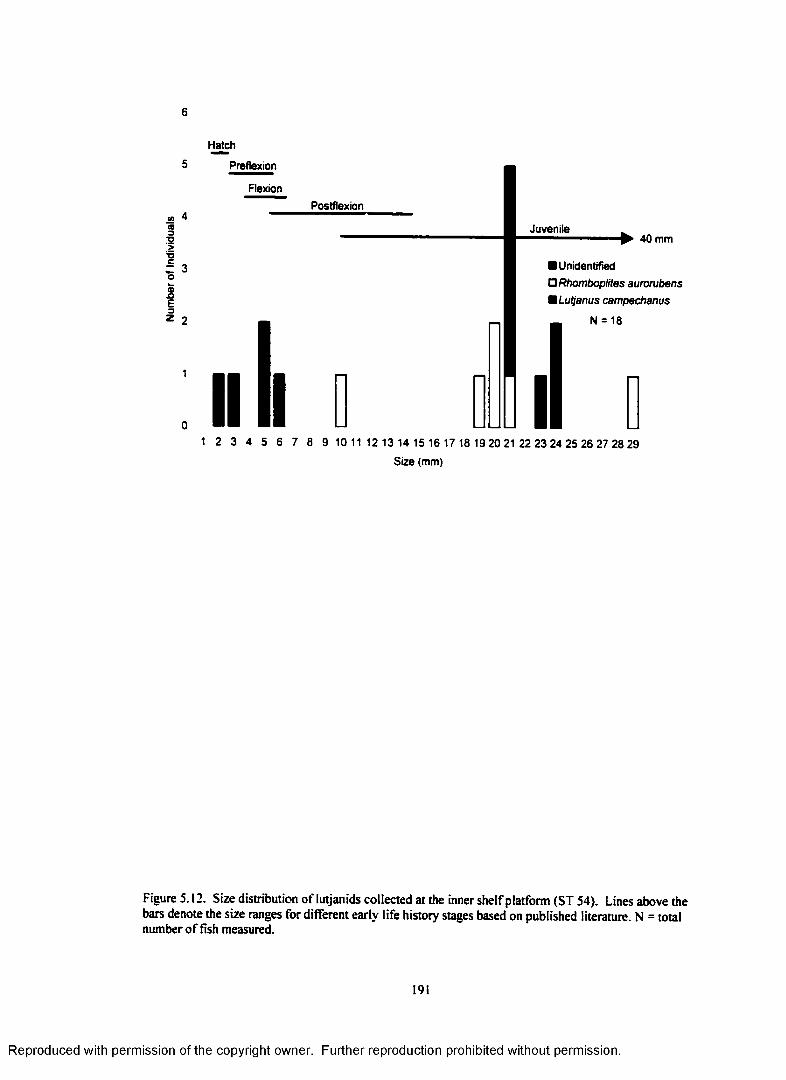
6
J2co3*o'5■ocZ 301E3
Hatch
Preflexion
FlexionPostflexion
Juvenile40 mm
■ Unidentifieda Rhomboplites aurorubens■ Lutjanus campechanus
N = 18
1 2 3 4 5 6 7 8 9 10 11 12 13 14 15 16 17 18 19 20 21 22 23 24 25 26 27 28 29Size (mm)
Figure 5.12. Size distribution o f lutjanids collected at the inner shelf platform (ST 54). Lines above the bars denote the size ranges for different early life history stages based on published literature. N = total number o f fish measured.
191
Reproduced with permission of the copyright owner. Further reproduction prohibited without permission.

Holocentridae (Squirrel fishes!
Squirrelfishes are relatively small, nocturnal fishes that occupy the crevices o f rocky ledges and
reefs during the day (Robins et al. 1986; Wyatt 1976). World-wide, there are approximately 65 species (8
genera), o f which 11 (4 genera) occur in the Gulf and Caribbean (Robins et al. 1986; Robins et al. 1991).
Holocentrus ascensionis and Myripristis jacobus are the most common species found in association with
natural banks in the northwestern Gulf, but other species (H. marianus, H. poco, H. rufus. H. vexillarius,
and Plecirypops retrospinis) have been observed as well (Sonnier et al. 1976; Hoese and Moore 1977;
Dennis and Bright 1988). In contrast, few squirrelfish (Holocentrus spp. and H. marianus) have been
reported in association with oil and gas platforms (Stanley and Wilson 1991; Rooker et al. 1997).
Interestingly, holocentrids have a protracted pelagic existence, which includes a unique, postlarval
"rhynchichthys" stage (McKenney 1959; Wyatt 1976; Tyler et al. 1993). This extended pelagic phase
culminates for most species with settlement at approximately 30-50 mm (Tyler et al. 1993). However, at
least two, common western Atlantic species (Holocentrus ascensionis and H. rufus) have an even longer
pelagic existence before settlement in a prejuvenile, "meeki" stage (Tyler et al. 1993).
Larval and juvenile holocentrids were collected at the shelf break (GC 18) and mid-shelf (Gl 94)
platforms only. At the shelf break platform, 25 holocentrids from a relatively wide range o f sizes (2.0-
37.0 mm) were collected (Figure 5.13). Approximately 40% o f the holocentrids collected were pre-
rhynchichthys stage larvae (2.0-9.0 mm) and included preflexion, flexion and postflexion stages. No
information is known about the hatchling sizes o f squirrelfishes, but McKenney (1959) reported the
collection o f a 1.8 mm Holocentrus vexillarius with some yolk remaining. It is probable, therefore, that
some o f the holocentrid larvae (i.e., 2.0-4.0 mm individuals) are the result o f local spawning. Other,
relatively large rhynchichthys and juvenile individuals were collected (9.0-37.0 mm) as well, but no
meeki holocentrids were represented. These larger individuals were identified as H. vexillarius (n=9). H.
poco (n=3) and H. rufus (n=l). Holocentrus vexillarius individuals (20.0-33.0 mm) ranged from late
rhynchichthys stages to early settled juveniles (McKenney 1959). AH H. poco individuals were post-
rhynchichthys individuals. The single H. rufus specimen collected (25.0 mm) was a pelagic,
rhynchichthys (Tyler etal. 1993).
192
Reproduced with permission of the copyright owner. Further reproduction prohibited without permission.

5 Preflexion N = 25 ® Holocentrus vexillarius
FlexionPostflexion
■ Holocentrus rufus B Holocentrus poco □ Holocentrus spp.
4 Rhynchichthys^ 66 mm
t 106 mm 120 mm
MeekiJuvenile —
0 ili i1 3 5 7 9 11 13 15 17 19 21 23 25 27 29 31 33 35 37
Size (mm)
Figure 5.13. Size distribution o f holocentrids collected at the outer shelf platform (GC 18). Lines above the bars denote the size ranges for different early life history stages based on published literature. N = total number o f fish measured.
193
Reproduced with permission of the copyright owner. Further reproduction prohibited without permission.

Twelve holocentrids were collected at the mid-shelf platform (G I94), primarily smaller
preflexion, flexion and postflexion Holocentrus spp (3.0-10.0 mm; Figure 5.14). One 36.0 mm H.
vexillarius juvenile was also collected. No holocentrid early life history stages were collected at the inner
shelf site (ST 54).
SEAMAP Comparisons: 60-cm, Oblique Bongo Tows vs. 60-cm, Passive Plankton Collections
Several trends were evident in the comparisons o f reef fish abundances collected in the passive
plankton nets vs. SEAMAP oblique bongo tows. Across the shelf, pomacanthids were absent in both the
platform plankton net collections and the SEAMAP bongo samples analyzed, and acanthurids were only
collected in SEAMAP collections on the outer shelf in relatively low abundances (Table 5.4).
In the outer shelf comparisons, reef-dependent pomacentrids, labrids and scarids were present in
SEAMAP samples, but not in platform samples (Table 5.4). Only chaetodontids were present at the
platforms and absent in SEAMAP bongo tows. However, at the outer shelf platforms reef-associated taxa
were generally more abundant, with the exception o f serranids. In general, abundances within both data
sets were relatively low, with the exception o f serranids (72.3 fish/m2) collected in SEAMAP bongo tows.
At the platforms, the most abundant taxa were lutjanids (8.2 fish/m2).
In the mid-shelf comparisons, both reef-dependent and reef-associated fishes were generally
more abundant at the platform locations than in the SEAMAP samples (Table 5.4). No reef-dependent
taxa were present in the SEAMAP bongo collections, but chaetodontids, pomacentrids and labrids were
collected at the platforms, though at relatively low abundances. Similar to the outer shelf comparisons,
reef-associated taxa were more abundant at the platform sites than in the SEAMAP bongo collections,
again with the exception o f the serranids. Serranids were the most abundant reef-associated taxa in
SEAMAP bongo tows (5.6 fish/m2), although abundances were considerably lower than in the outer shelf
samples. Blenniids were the most abundant reef-associated taxa in the platform samples (17.6 fish/m2).
In the inner shelf comparisons, very few reef-associated and reef-dependent fishes were collected (Table
5.4). No reef-dependent taxa were collected in SEAMAP samples at the inner shelf sites, while only
scarids were present (0.5 fish/m2) at the platforms. Blenniids were the most abundant reef-associated
fishes collected, but again abundances were very low both in the SEAMAP (0.7 fish/m2) and platform
(12 fish/m2) collections.
194
Reproduced with permission of the copyright owner. Further reproduction prohibited without permission.

PreflexioiFlexion
Rhynchichthys
Meeki
Juvenil
■ Holocentrus spp.
N = 12
1 2 3 4 5 6 7 8 9 10 36
Size (mm)
Figure 5.14. Size distribution o f holocentrids collected at the mid-shelf platform (G I94). Lines above the bars denote the size ranges for different early life history stages based on published literature. Note break in size scale. N = total number o f fish measured.
195
Reproduced with permission of the copyright owner. Further reproduction prohibited without permission.

Reproduced
with perm
ission of the
copyright ow
ner. Further
reproduction prohibited
without
permission.
Table 5.4. Mean abundance (fish/m2) and standard deviation (SD) for reef fish collected at selected SEAMAP ichtyoplankton sampling stations (oblique bongo tows) and at three oil and gas platforms (passive plankton net, subsurface and surface) across the continental shelf.___________
Outer Shelf Mid-shelf Inner Shelf
SEAMAPt Mean (SD)
GC I8 | Mean (SD)
SEAMAPt Mean (SD)
Gl 94$ Mean (SD)
SEAMAPt Mean (SD)
ST 54* Mean (SD)
Reef-dependentChaetodontidae 0(0) 0.8 (0.7) 0(0) <0.1 (0.5) 0(0) 0(0)Pomacanthidae 0(0) 0(0) 0(0) 0(0) 0(0) 0(0)Pomacentridae 1.3 (4.0) 0(0) 0(0) l . l (6.7) 0(0) 0(0)Labridae 4.4 (7.2) 0(0) 0(0) <0.1 (0.8) 0(0) 0(0)Acanthuridae 0.3 (1.5) 0(0) 0(0) 0(0) 0(0) 0(0)Scaridae 1.6 (3.7) 0(0) 0(0) 0(0) 0(0) 0.5 (1.3)
Reef-associatedHolocentridae 0.3 (1.2) 0.6 (1.5) 0(0) 0.3 (1.7) 0(0) 0(0)Serranidae 72.3 (83.2) 3.0 (3.9) 5.6 (5.0) 1.2 (3.4) 0.2 (0.7) 0(0)Lutjanidae 3.2 (5.1) 8.2(12.6) 1.9 (5.4) 2.1 (6.7) 0(0) 0(0)Blenniidae 0(0) 4.1 (13.3) 3.2 (5.4) 17.6(19.3) 0.7 (2.0) 1.2 (2.4)
tMeans calculated for five outer shelf(n=2l samples), two mid-shelf (n=8) and three inner shelf (n= l2) SEAMAP sampling stations (1995-1997). ^Means calculated for paired (subsurface and surface), passive plankton net samples collected al GC 18 (n=l4), Gl 94 (n= 161) and ST 54 (n=7).

SEAMAP Comparisons: 1 x 2 m Neuston Tows vs. Light-trap Collections
Similar trends were observed in comparisons between SEAMAP neuston tows and platform
light-trap collections. Overall, pomacanthids and acanthurids were absent in both SEAMAP and platform
samples (Table 5.5). Chaetodontids were absent in all light-trap collections, while scarids and
holocentrids were not collected in neuston tows.
In the outer shelf comparisons, reef-dependent taxa were rare (Table 5.5). Pomacentrids and
labrids were present in SEAMAP neuston tows, and pomacentrids and scarids were present in light-trap
samples, but al! mean abundances were low (<1 fish/sample). As a group, reef-associated fish were
generally more common, but abundances were still generally low. Serranids were the most abundant
reef-associated taxa collected in neuston tows ( 1.7 fish/sample).
In the mid-shelf comparisons, reef-dependent fishes were nearly absent in SEAMAP collections
(Table 5.5). Only chaetodontids occurred in small numbers (0.1 fish/sample). Pomacentrids and labrids
were the only reef-dependent fishes collected in light-trap samples at the mid-shelf platform. Blenniids
and lutjanids were the only reef-associated fishes present in SEAMAP neuston samples at the mid-shelf
stations. Serranids, which were the most dominant taxa in the SEAMAP bongo samples at these stations,
were absent in the neuston collections. They were, however, present in platform light-trap collections.
The most common reef-associated fishes in the platform light-trap samples were blenniids (11.2
fish/sample). Holocentrids, serranids and lutjanids were collected in light-traps. but abundances were
very low (approximately 0.1 fish/sample).
In the inner shelf comparisons, reef-dependent fishes were absent in SEAMAP neuston
collections and were virtually absent in platform light-trap samples (Table 5.5). Only pomacentrids were
present in low numbers (<0.1 fish/sample) in the platform light-trap samples. Reef-associated taxa were
also rare in both data sets. Blenniids (0.6 fish/sample) and lutjanids (0.3 fish/sample) were collected in
SEAMAP neuston nets. Abundances o f blenniids, lutjanids and serranids were low in platform light-trap
samples as well.
DISCUSSION
Due to the demersal and relatively sedentary nature o f most adult reef fishes, it is generally
believed that reef fish populations are maintained, in part, by the continuous settlement o f pelagic larvae
197
Reproduced with permission of the copyright owner. Further reproduction prohibited without permission.

Reproduced
with perm
ission of the
copyright ow
ner. Further
reproduction prohibited
without
permission.
Table S.S. Mean number (fish/sample) and standard deviation (SD) o f reef fish collected at selected SEAMAP ichtyoplankton sampling stations (neuston tows) and at three oil and gas platforms (light-traps, surface and ofT-platform) across the continental shelf._______________________
Outer Shelf Mid-shelf Inner Shelf
SEAMAPt Mean (SD)
GC 18$ Mean (SD)
SEAMAPt Mean (SD)
Gl 94$ Mean (SD)
SEAMAPt Mean (SD)
ST 54$ Mean (SD)
Reef-dependentChaetodontidae 0(0) 0(0) 0.1 (0.4) 0(0) 0(0) 0(0)Pomacanthidae 0(0) 0(0) 0(0) 0(0) 0(0) 0(0)Pomacentridae 0.2 (1.0) 0.1 (1.0) 0(0) 0.5 (1.9) 0(0) <0.1 (0.4)Labridae <0.1 (0.2) 0(0) 0(0) <0.1 (0.1) 0 (0 ) 0 (0 )Acanthuridae 0(0) 0(0) 0(0) 0(0) 0(0 ) 0(0)Scaridae 0(0) <0.1 (0.3) 0(0) 0(0) 0(0) 0(0)
Reef-associatedllolocentridac 0(0) 0.1 (0.5) 0(0) <0.1 (0.1) 0 (0 ) 0(0)Serranidae 1.7 (5.6) <0.1 (0.2) 0(0) 0.1 (0.4) 0(0) <0.1 (0.1)Lutjanidae 0.2 (0.7) <0.1 (0.2) 0.9 (2.1) 0.1 (0.3) 0.3 (0.6) <0.1 (0.1)Blenniidae 0.4 (1.6) 0.1 (1.4) 1.0 (1.4) 11.2 (31.1) 0.6 (1.0) 1.0(3.5)
tMeans calculated for five outer shelf(n=25 samples), two mid-shelf(n=8) and three inner shelf(n=l2) SEAMAP sampling stations (1995-1997). |Means calculated for light-trap (surface and off-platform) samples collected at GC 18 (n=l54), Gl 94 (n=3l9)and ST 54 (n= 146).

(Leis 1991). One o f the proposed benefits o f artificial reefs (e.g., o il and gas platforms), is that they may
contribute to increased production by providing additional spawning habitat for adults, as well as
settlement habitat for juveniles, and/or additional habitat which is otherwise limited for sub-adults and
adults. By examining the different early life history stages, it is possible to infer i f the reef fish collected
were spawned locally (very small or young larvae) or i f they are potential settlers to a reef or platform
environment (juveniles). McGowan (1983), for example, used the sizes o f larval fish collected near the
Flower Garden Banks (outer shelf, northwestern Gulf) and adjacent oil platforms to infer local spawning
events. He determined, based on the collection o f small, preflexion individuals, that a number o f reef fish
were actively spawning in the vicinity, including apogonids, acanthurids. labrids, scarids, lutjanids,
serranids and pomacentrids. Although fish were sampled just above the reef environment, juveniles were
not collected, probably due to the nature o f the sampling gear (bongo nets), which targeted smaller larvae
(McGowan 1985).
A similar approach was taken in this study, in conjunction with an extensive literature search on
the sizes o f the early life history stages o f reef fish, from likely adults to be encountered in the study area.
In doing so, a number o f fishes have been identified as having local spawning populations relative to the
platforms sampled. At the outer shelf platform, there is evidence o f local spawning by chaetodontids,
scarids, holocentrids, serranids, lutjanids and blenniids. Relatively small, preflexion chaetodontids.
pomacentrids. and labrids, as well as holocentrids, serranids, lutjanids and blenniids were also collected at
the mid-shelf platform. At the inshore platform, evidence o f local spawning events was found only for
serranids, lutjanids and blenniids. While examining the size-at-stage information for these fishes gives an
indication o f local spawning populations, it does not give information on the source o f the larvae, i.e..
whether they were spawned from populations inhabiting natural reef or artificial reef environments.
Since adult reef fishes are found in association with both habitat types, it is possible that the pool o f larval
fishes sampled is a result o f spawning efforts o f adults in both environments. The platforms do not equal
the natural reefs and hard bottoms in terms o f measurable hard-bottom surface area Gulf-wide (i.e.. 0.4%
o f "total reef habitat"; Gallaway 1998). However, along the platform transect in this study (just west o f
the Mississippi River Delta and within its historical sedimentary plume), the preponderance o f platforms
Reproduced with permission of the copyright owner. Further reproduction prohibited without permission.

vs. natural reefs, particularly in the mid- and inner shelf environments, would appear to statistically
increase their probable significance as spawning sites for adults, and thus sources o f larvae.
Knowledge o f the spawning habits o f some adult reef fishes may give insight into the
importance o f oil and gas platforms as artificial reefs. While most reef-associated and reef-dependent
fishes are broadcast spawners, some fishes lay demersal eggs on the reef substrate. Blenniids, for
example, were relatively common among the reef fishes collected at the platforms, and these fishes lay
demersal eggs on the hard substrate o f reefs (Thresher 1984; Cowen and Sponaugle 1997). Blenniids are
small, cryptic, reef-associated demersal fishes and are, therefore, particularly well-adapted to the platform
environments. They are one o f the most abundant species on platforms and typically inhabit dead
barnacle shells (Workman and Jones 1979; Gallaway and Lewbel 1982). These shells provide suitable
habitat for blenniid spawning and egg deposition, which occurs in small crevices (Smith-Vaniz 1980;
Gallaway et al. 1981; Thresher 1984). Large numbers o f preflexion blennies were collected at all
platforms, a strong indication that the platforms may be the source o f small larvae.
Pomacentrids are reef-dependent fishes that also deposit demersal eggs (Thresher 1984), and
adults and juveniles are commonly found in association with oil and gas platforms. At least one species
(Abudefduf saxatilis) has been observed guarding nests on an oil and gas platform structure
(Scarborough-Bull and Kendall 1994). While larger, postflexion larvae and juveniles were present at all
platforms, prefiexion pomacentrids were only collected at the mid-shelf platform. With the lack o f
preflexion larvae at the outer and inner shelf platforms, it is difficult to conclude how important the
platforms may be to pomacentrid spawning and reproduction. In any event, it may be that the platforms
serve a different (unction in the life history o f these fishes in the northern Gulf. Rooker et al. (1997)
noted that pomacentrids (and blenniids) are shallow water reef species and the depths o f natural reefs in
the northern Gulf (>20 m) may inhibit their colonization o f these habitats. The authors noted increased
abundances o f adult A. saxatilis on the Flower Garden Banks shortly afler the deployment o f mooring
buoys above the site. These buoys supported large numbers o f juvenile A. saxatilis. which the authors
postulated resulted in a subsequent increase colonization o f the Flower Garden Banks by this species. In
addition. A. saxatilis. which were once considered transients in the northwestern Gulf, have recently
established permanent populations in this area along the near-surface supports o f oil and gas platforms
200
Reproduced with permission of the copyright owner. Further reproduction prohibited without permission.

(Dennis and Bright 1988). The collection o f relatively large numbers o f pomacentrid juveniles at these
platforms supports this notion o f near-surface, artificial structures serving as important habitat for
juveniles.
The other reef-dependent and reef-associated taxa o f interest in this study are typical o f most
marine fishes in that pelagic eggs are released and fertilized (Cowen and Sponaugle 1997). Most o f the
reef-dependent fishes were absent or rare (e.g., chaetodontids, pomacanthids, labrids and acanthurids),
with the exception o f scarids, which were relatively common at the outer shelf platform. Many o f these
scarids were preflexion and early flexion larvae, indicative o f a local spawning population. O f particular
interest is the rarity o f labrid larvae at the platform sites. Labrids are often the dominant taxa on natural
and artificial reefs in the northern Gulf (Dennis and Bright 1988; Rooker et al. 1997), including several
species common in temperate environments (e.g., Halichoeres btvittatus and Lachnolaimus maximus). It
is difficult to hypothesize why labrids and other reef-dependent larvae and juveniles were not more
common in the platform samples or within the oil fields. Recruitment events for these taxa can be
extremely episodic (Choat et al. 1993; Rooker et al. 1996), with most o f the reef fish replenishment
occurring over the course o f 1-3 nights (Thorrold et al. 1994; Rooker et al. 1996). Labrids, for example,
can have acyclic spawning patterns, as well as settlement during quarter moon phases (Thorrold et al.
1994). The pelagic larval durations for labrids can also vary greatly, potentially allowing for
asynchronous settlement events (Victor 1986). Pelagic larval durations for two common platform
residents, Bodianus pulchellus and Thalassoma bifasciatum, range from 32-51 days and 38-78 days,
respectively (Victor 1986). Although peak times o f settlement and recruitment (new and full moon
periods) were targeted, it is possible that settlement peaks were missed during the course o f the study's 2-
3 day sampling trips, or that settlement events were temporally spread out over long periods o f time,
decreasing the chances o f sampling patchily distributed taxa in larger numbers.
Several characteristics unique to oil and gas platforms as artificial habitats may influence the
frequency or magnitude o f settlement events. For example, platforms always provide shallow water, hard
substrate/habitat regardless o f the water depth or location on the continental shelf. This may be
particularly important for many reef fishes settling from the plankton, particularly since many o f the
natural hard bottom and reefs are relatively deep compared to reefs in the eastern G ulf and Caribbean.
201
Reproduced with permission of the copyright owner. Further reproduction prohibited without permission.

The chances o f a potential settler encountering a platform vs. a natural habitat are relatively high, since
most ichthyoplankton and pelagic juveniles are found in the upper water column. For example, several
studies have documented the presence o f reef fish larvae and juveniles in pelagic drift algae communities,
including reef-dependent (pomacentrids and labrids) and reef-associated (serranids, lutjanids, blenniids,
holocentrids, mullids, priacanthids and lobotids) fishes (Bortone et al. 1977; Kingsford 1992; Franks et al.
2001). Since floating Sargassum mats are not uncommon in the northern Gulf, it is possible that these
algal patches may serve as vectors o f recruitment for some fishes as they move along the surface, perhaps
encountering platforms. Another important aspect o f the platforms may be the large light-field associated
with the structure at night. Many reef fish juveniles are attracted to light (Doherty 1987) and it is possible
that the platforms may aggregate juveniles and draw them towards the artificial habitat. Munday et al.
(1998) used light-aggregation devices (modified light-traps) to enhance settlement above small patch
reefs. The authors determined that greater numbers and species o f juveniles settled on light-enhanced
reefs vs. control reefs (no lights) or surface buoy-enhanced reefs (see Rooker et al. 1997 discussion
above).
Reef-associated fishes, particularly blenniids. serranids and lutjanids, were generally more
common in the platform samples. This result is not surprising, since many o f these fishes are common in
temperate as well as tropical environments (Hoese and Moore 1977). Their occurrence should be higher
relative to reef-dependent taxa that are more restricted by both environmental (i.e.. temperature
tolerances) and habitat (reef) requirements. At the shelf break platform, most o f the serranids collected
were preflexion and flexion larvae, indicative o f local spawning events. Unfortunately, the inability to
confidently identify many o f these early life history stages to species limits comparisons with known
adult distributions across the shelf. For example, epinephelines were either Mycteroperca spp. or
Epinephelus spp., which represent 10-12 and 7-8 possible species, respectively. When identifications
were possible, however, larval and juvenile data generally agreed with adult across-shelf distributions.
Anthiines were believed to be mostly Hemanthias vivanus and Protogrammus martinicensus, both o f
which occur on deep, offshore reef environments (Hoese and Moore, 1977). In contrast, most o f the
serranids collected at the mid-shelf platform were serranines (sea basses), including many juveniles.
Again, most o f these could only be identified to the genus level: Centropristis spp. (3 species).
202
Reproduced with permission of the copyright owner. Further reproduction prohibited without permission.

Diplectrum spp. (2 species) and Serranus spp. (4 species). Many o f these fishes, however, are relatively
common along the mid-shelf and inner shelf environments (Hoese and Moore 1977).
Similar patterns were observed with lutjanids, o f which several were identified to the species
level. Many preflexion Pristipomoides aquiionaris larvae were collected at the outer shelf platform.
These lutjanids are among the most common fishes associated with mid- and outer shelf hard-bottom
areas (Hoese and Moore 1977). Across-shelf collections o f Rhomboplites aurorubens (mid- and inner
shelf platforms) and Lutjanus campechanus (inner shelf platform) were also in agreement with known
adult distributions.
Overall, across-shelf distribution patterns in reef-dependent and reef-associated larval and
juvenile distributions were as expected. What remains problematic, however, is why the early life history
stages o f these fishes are so rare in the plankton when compared with other marine fishes. A number o f
studies have investigated the relative abundances o f different larval fishes in the Gulf, including reef-
dependent and reef-associated fishes (Ditty 1986; Kelley et al. 1990. 1993: McGowan 1985). In general,
these taxa are among the rarest in the ichthyoplankton. especially compared to common coastal or
oceanic pelagics or demersal fishes (e.g., Clupeidae, Engraulidae, Carangidae, Sciaenidae).
The estimates o f "background" plankton abundances (SEAMAP data) appeared relatively similar
to the abundances at the platforms sampled. Although no statistical tests could be run to rigorously
support this conclusion, there were relatively few order o f magnitude differences in comparisons o f taxa
collected within or immediately downstream o f platforms vs. SEAMAP surveys. For the outer shelf
comparisons, the largest differences were between serranids, where abundances were higher in the
SEAMAP surveys than at the platforms, particularly in the bongo net samples. At the mid-shelf,
blenniids were found to be generally more abundant in association with the platform. Similar to the
results at the platforms, SEAMAP surveys generally collected more reef-associated fishes than reef-
dependent species.
While high on-site predation rates may help explain the rarity o f reef fish larvae at platforms, it
is difficult to determine why they are relatively rare in the Gulf-wide, open water ichthyoplankton
assemblage. Some reef fish larvae have been reported as rare even in the eastern Gulf and Caribbean,
where more natural reef habitat is available and many o f these fishes are abundant as adults (Richards
203
Reproduced with permission of the copyright owner. Further reproduction prohibited without permission.

1984; Limouzy-Paris et al. 1994). For example, Richards (1984) surveyed the Caribbean Sea (109
oblique bongo samples) and collected very few larvae (<13 individuals) o f such common reef fishes as
holocentrids, lutjanids, chaetodontids, pomacentrids, mullids and blenniids. In terms o f the relative
abundances o f reef fishes, the results o f this study are in general agreement with previous surveys. Reef-
dependent and reef-associated fishes made up a relatively small percentage o f the total ichthyoplankton
assemblage at each o f the platforms. What does appear interesting at the platforms, however, is the
presence o f a full spectrum o f sizes and developmental stages which may not be as well represented (abiet
at very low densities) elsewhere.
REFERENCES
Aiken, K. 1983. The biology, ecology and bionomics o f the butterfly and angelfishes, Chaetodontidae. In Munro, J.L., editor. Caribbean Coral Reef Fishery Resources. International Center for Living Aquatic Resources Management, Manila.
Allen. G.R. FAO species catalogue. Snappers o f the world: an annotated and illustrated catalogue o f lutjanid species known to date. FAO Fisheries Synopsis 125(6): I -208.
Allen. G.R. 1991. Damselfishes o f the world. Aquarium Systems. Mentor.
Alshuth, S.R., J.W. Tucker. Jr. and J. Hateley. 1998. Egg and larval development o f laboratory-reared sergeant major, Abudefduf saxatilis (Pisces, Pomacentridae). Bulletin o f Marine Science 62(I):I21-I33.
Baldwin, C.C. 1990. Morphology o f the larvae o f American Anthiinae (Teleostei: Serranidae). with comments on relationships within the subfamily. Copeia 1990(4):913-955.
Baldwin. C.C. J.M. Leis and D.S. Rennis. 2000a. Epinephelinae. Tribes Dipioprionini, Liopropomini and Grammistini. In J.M. Leis and B.M. Carson-Ewart, eds. The larvae o f Indo-Pacific coastal fishes: an identification guide to marine fish larvae. Brill, Leiden.
Baldwin, C.C, J.M. Leis and D.S. Rennis. 2000b. Epinephelinae. Tribes Niphonini and Epinephelini. In J.M. Leis and B.M. Carson-Ewart. eds. The larvae o f Indo-Pacific coastal fishes: an identification guide to marine fish larvae. Brill. Leiden.
Bellwood, D.R. 1994. A phylogenetic study o f the parrotfishes family Scaridae (Pisces: Labroidei). with a revision o f genera. Records o f the Australian Museum, Supplement 20:1-86.
Bardach. J.E. 1958. On the movements o f certain Bermuda reef fishes. Ecology 39:139-146.
Bohlke, J.E. and C.C.G. Chaplin. 1993. Fishes o f the Bahamas and adjacent waters. Academy o f Natural Sciences o f Philadelphia and University o f Texas, Austin.
Bortone, S. A. P. A. Hastings and S.B. Collard. 1977. The pelagic-5nrgassum ichthyofauna o f the eastern Gulf o f Mexico. Northeast G ulf Science l(2):60-67.
Brinley, F.J. 1939. Spawning habits and development o f beaugregory (Pomacentrus leucostictus). Copeia 1939: 185-188.
204
Reproduced with permission of the copyright owner. Further reproduction prohibited without permission.

Burgess, W.E. 1978. A monograph o f the butterflyfishes (family Chaetodontidae). T.F.H. Publications, Inc., Neptune.
Carr, M.H. 1991. Habitat selection and recruitment o f an assemblage o f temperate zone reef fishes. Journal o f Experimental Marine Biology and Ecology 146:113-137.
Cavalluzzi, M.R. and J.E. Olney. 1998. Preliminary guide to the identification o f the early life history stages o f blennioid fishes o f the western central Atlantic, faunal list and meristic data for all known blennioid species. NOAA Technical Memorandum NMFS-SEFSC-416.
Choat, J.H. 1991. The biology o f herbivorous fishes on coral reefs. In Sale, P.F.. editor. The Ecology of Fishes on Coral Reefs. Academic Press, San Diego.
Choat, J.H. and D.R. Beilwood. 1991. Reef fishes: their history and evolution. In Sale, P.F., editor.The Ecology o f Fishes on Coral Reefs. Academic Press, San Diego.
Choat. J.H, P.J. Doherty, B.A. Kerrigan and J.M. Leis. 1993. A comparison o f towed nets, purse seine, and light-aggregation devices for sampling larvae and pelagic juveniles o f coral reef fishes. Fishery Bulletin 91:195-209.
Clarke, M.E., M.L. Domeier and W.A. Laroche. 1997. Development o f larvae and juveniles o f the munon snapper (Lutjanus analis), lane snapper (Lutjanus synagris) and yellowtaii snapper (Lutjanus chrysurus). Bulletin o f Marine Science 61(3):511-537.
Courtenay, W.R., Jr. 1967. Atlantic fishes o f the genus Rypticus (Grammistidae). Proc. Acad. Nat. Sci. Phila. 119(6):241-293.
Cowen, R.K. and S. Sponaugle. 1997. Relationships between early life history traits and recruitment among coral reef fishes. In Chamber, R.C. and E.A. Trippel, editors. Early life history and recruitment in fish populations. Champman and Hall, London.
Cummings, W.C. 1968. Reproductive habits o f the sergeant major, Abudefduf saxatilis (Pisces:Pomacentridae) with comparative notes on four other damselfishes. PhD Dissertation. University o f Miami. 172pp.
Danilowicz, B.S. 1997. A potential mechanism for episodic recruitment o f a coral reef fish. Ecology. 78(5): 1415-1423.
Dennis, G.D. and T.J. Bright. 1988. Reef fish assemblages on hard banks in the northwestern Gulf o f Mexico. Bulletin o f Marine Science 43(2):280-307.
Ditty. J.G. 1986. Ichthyoplankton in neritic waters o f the northern Gulf o f Mexico o ff Louisiana: composition, relative abundance and seasonality. Fishery Bulletin 84:935-946.
Doherty, P.J. 1987. Light traps: selective but useful devices for quantifying the distributions and abundances o f larval fishes. Bulletin o f Marine Science 41:423-431.
Drass. D.M., K.L. Bootes, J. Lyczkowski-Shultz, B.H. Comyns. G.J. Holt, C.M. Riley and R.P. Phelps. 2000. Larval development o f red snapper, Lutjanus campechanus, and comparisons with cooccurring snapper species. Fishery Bulletin. 98:507-527.
Emery, A.R. 1973. Comparative ecology and functional osteology o f fourteen species o f damselfish (Pisces: Pomacentridae) at Alligator Reef. Florida Keys. Bulletin o f Marine Science 23:649- 770.
205
Reproduced with permission of the copyright owner. Further reproduction prohibited without permission.

Fahay, M.P. 1983. Guide to the early stages o f marine fishes occurring in the Western North Atlantic ocean. Cape Hatteras to the Southern Scotian Shelf. Journal o f Northwest Atlantic Fishery Science 4.
Franks, J.S. J.T. Ogle, J.R. Hendon, D.N. Barnes and L.C. Nicholson. 2001. Growth o f captive juvenile tripletail Lobotes surinamensis. Gulf and Caribbean Research 13:75-78.
Gallaway, B.J. 1980. Structure-associated communities, pelagic, reef, demersal fishes andmacrocrustaceans. In Jackson, W.B. and P. Wilkens, editors. Environmental assessment o f an active oil field in the northwestern Gulf o f Mexico. Milestone report to NOAA. EPA project Number EPA-IAG-DS-E693-EO.
Gallaway. B. J. 1981. An ecosystem analysis o f oil and gas development on the Texas-Louisianacontinental shelf. U.S. Fish & Wildlife Service. Office o f Biological Services, FWS/OBS-81/27, Washington, D.C.
Gallaway, B. J. 1998. Cumulative ecological significance o f oil and gas structures in the Gulf o f Mexico: Information search, synthesis, and ecological modeling: Phase I, Final Report. U. S. Geological Survey, Biological Research Division, Washington, D.C. USGS/BRD/CR-1997-0006.
Gallaway, B.J. and G.S. Lewbel. 1982. The ecology o f petroleum platforms in the northwestern Gulf o f Mexico: a community profile. U.S. Fish and Wildlife Service, FWC/OBS-82/27. Office o f Biological Services, Washington. D.C.
Gallaway, B.J., L.R. Martin. R.L. Howard. G.S. Boland and G.D. Dennis. 1981. Effects on artificial reef and demersal fish and macrocrustaceans communities. In Middleditch. B.S.. editor. Environmental effects o f offshore oil production. The Buccaneer gas and oil field study. Plenum Press, New York.
Hamner. W.M. M.S. Jones, J.H. Carleton, J.R. Hauri and D. McM. Williams. 1988. Zooplankton,planktivorous fish, and water currents on a windward reef face: Great Barrier Reef, Australia. Bulletin o f Marine Science 42:459-479.
Hardy, J.D., Jr. 1978a. Development o f fishes o f the mid-Atlantic bight an atlas o f egg, larval, andjuvenile stages. Vol. III. Aphredonderidae through Rachycentridae. U.S. Fish Wild). Ser. Biol. Serv. Program FWS/OBS-78/12.
Hardy. J.D.. Jr. 1978b. Development o f fishes o f the mid-Atlantic bight an atlas o f egg, larval, andjuvenile stages. Vol. V. Chaetodontidae through Ophidiidae. U.S. Fish Wildl. Ser. Biol. Serv. Program FWS/OBS-78/12.
Hastings. R.W.L. Ogden, M.T. Mabry. 1976. Observations on the fish fauna associated with offshore platforms in the northeastern Gulf o f Mexico. Fiehery Bulletin 74(2):387-402
Heemstra, P.C. & J.E. Randall. 1993. Groupers o f the World. FAO Fish. Syn. No. 125. I6:382p + 31 pis
Hildebrand. S.F. and L.E.Cable. 1939. Further notes on the development and life history o f some teleosts at Beaufort North Carolina. Bull. U.S. Bur. Fish. 48:41-117.
Hildebrand, S.F. and W.C. Schroeder. 1928. Fishes o f the Chesapeake Bay. Bull. U.S. Bur. Fish. 43(pt. I ):366 pp.
Hoese, H.D. and R.H. Moore. 1977. Fishes o f the G ulf o f Mexico: Texas, Louisiana, and Adjacent Waters. Texas A&M University Press, College Station.
206
Reproduced with permission of the copyright owner. Further reproduction prohibited without permission.

Hoff, F.H., Jr. 1970. Artificial spawning o f black sea bass, Ceruropristes striatus melanus Gins burg,aided by chorionic gonadotrophic hormones. Fla. Dept. Nat. Resour., Mar. Res. Lab., Spec. Sci. Rept. 25. Iv+17 pp.
Jones, S. and M. Kumaran. 1962. Notes on eggs, larvae and juveniles o f fishes from Indian waters. XII. Myripristis murdjan. X III. Holocentrus sp. Indian J. Fish. Sect. A 9( I ): 155-167.
Kavanagh, K.D, J.M. Leis and D.S. Rennis. 2000. Pomacentridae. In J.M. Leis and B.M. Carson-Ewart, eds. The larvae o f Indo-Pacific coastal fishes: an identification guide to marine fish larvae. Brill, Leiden.
Keene. M.J. and K.A. Tighe. 1984. Beryciformes: development and relationships. In: Moser. H.G., W.J. Richards, W.J. Cohen, D.M., M.P. Fahay, A.W. Kendall and S.L. Richardson, eds. Ontogeny and systematics o f fishes. American Society o f Ichthyologists and Herpetologists Special Publication 1:383-392.
Kelley, S., J.V. Gartner. Jr., W.J. Richards and L. Ejsymont. 1990. SEAMAP 1986 Ichthyoplankton:Larval distribution and abundance o f Engraulidae, Carangidae, Clupeidae, Gobiidae. Lutjanidae. Serranidae, Coryphaenidae, Istiophoridae. and Scombridae in the G ulf o f Mexico. NOAA Technical Memorandum, NMFS-SEFC-245
Kelley, S. J.V. Gartner, Jr.. W.J. Richards and L. Ejsymont. 1993. SEAMAP 1984 & 1985Ichthyoplankton: Larval distribution and abundance o f Carangidae. Clupeidae, Coryphaenidae, Engraulidae, Gobiidae, Istiophoridae. Lutjanidae. Scombridae, Serranidae, and Xiphiidae in the Gulf o f Mexico. NOAA Technical Memorandum NMFS-SEFSC-317.
Kendall, A.W.. Jr. 1979. Morphological comparisons o f North American sea bass larvae (Pisces:Serranidae). NOAA Tech. Rep. NMFS Circ.(428): 50 pp.
Kingsford, M.J. 1992. Drift algae and small fish in coastal waters o f northeastern New Zealand. Marine Ecology Progress Series 80:41-55.
Labelle. M. and J.R. Nursall. 1985. Some aspects o f the early life history o f the redlip blenny. Ophioblennius atlanticus (Teleostei: Blenniidae). Copeia. 1985(I):39-49.
Labelle, M. and J.R. Nursall. 1992. Population biology o f the redlip blenny, Ophioblennius atlanticus macclurei (Sylvester) in Barbados. Bulletin o f Marine Science 50( I ): 186-204.
Laroche. W.A. 1977. Description o f larval and early juvenile vermilion snapper. Rhomboplites aurorubens. Fishery Bulletin. 75:547-554
Leis. J.M. 1991. The pelagic stage o f reef fishes: the larval biology o f coral reef fishes. In Sale, P.F., editor. The Ecology o f Fishes on Coral Reefs. Academic Press, San Diego.
Leis, J.M. and B.M. Carson-Ewart. 1997. In situ swimming speeds o f the late pelagic larvae o f o f some Indo-Pacific coral-reef fishes. Marine Ecology Progress Series 159:165-174.
Leis, J.M. and K. Lee. 1994. Larval development in the lutjanid subfamily Etelinae (Pisces): the genera Aphareus, Aprion, Etelis and Pristipomoides. Bulletin o f Marine Science 55(1): 46-125.
Leis. J.M. and D.S. Rennis. 2000a. Chaetodontidae (butterflyfishes). In J.M. Leis and B.M. Carson- Ewart, eds. The larvae o f Indo-Pacific coastal fishes: an identification guide to marine fish larvae. Brill, Leiden.
Leis, J.M and D.S. Rennis. 2000b. Labridae (wrasses). In J.M. Leis and B.M. Carson-Ewart, eds. Thelarvae o f Indo-Pacific coastal fishes: an identification guide to marine fish larvae. Brill, Leiden.
207
Reproduced with permission of the copyright owner. Further reproduction prohibited without permission.

Leis, J.M. and D.S. Rennis. 2000c. Scaridae (parrotfishes). In J.M. Leis and B.M. Carson-Ewart, eds.The larvae o f Indo-Pacific coastal fishes: an identification guide to marine fish larvae. Brill, Leiden.
Leis, J.M. and D.S. Rennis. 2000d. Anthiinae (perchlets, reef basses). In J.M. Leis and B.M. Carson- Ewart, eds. The larvae o f Indo-Pacific coastal fishes: an identification guide to marine fish larvae. Brill, Leiden.
Leis, J.M and D.S. Rennis. 2000e. Lutjanidae. In J.M. Leis and B.M. Carson-Ewart. eds. The larvae of Indo-Pacific coastal fishes: an identification guide to marine fish larvae. Brill, Leiden.
Leis, J.M and D.S. Rennis. 2000f. Holocentridae. In J.M. Leis and B.M. Carson-Ewart, eds. The larvae o f Indo-Pacific coastal fishes: an identification guide to marine fish larvae. Brill, Leiden.
Lieske, E. and R. Myers. 1999. Coral reef fishes: Caribbean, Indian Ocean, and Pacific Ocean including the Red Sea. Princeton University Press, Princeton.
Limouzy-Paris, C., M.F. McGowan, W.J. Richards. J.P. Umaran and S.S. Cha. 1994. Diversity o f fish larvae in the Florida Keys: Results from SEFCAR. Bulletin o f Marine Science 54(3):857-870.
L indeman. K.C. 1997. Development o f grunts and snappers o f Southeast Florida: cross-shelf distributions and effects o f beach management alternatives. PhD Dissertation, University o f Miami, Coral Gables, Florida.
Lippson, A.J. and R.L. Moran. 1974. Manual for identification o f early developmental stages o f fishes o f the Potomac River estuary. Environmental Technology Center, Martin Marietta Corp.. PPSP- MP-13.
McBride, R.S. and K.W. Able. 1998. Ecology and fate o f butterflyfishes, Chaetodon spp., in the temperate. Western North Atlantic. Bulletin o f Marine Science 63(2): 401-416.
McGowan, M.F. 1985. Ichthyoplankton o f the Flower Garden Banks, northwest Gulf o f Mexico. PhD. Dissertation. University o f Miami, Coral Gables.
McKenney, T.W. 1959. A contribution to the life history o f the squirrel fish Holocentrus vexillarius Poey. Bulletin o f Marine Science o f the G ulf and Caribbean. 9(2): 174-221.
Mori K. and J.M. Leis. 2000. Serraninae (sea basses). In J.M. Leis and B.M. Carson-Ewart, eds. The larvae o f Indo-Pacific coastal fishes: an identification guide to marine fish larvae. Brill,Leiden.
Mullineaux, L.S. and S.W. Mills. 1997. A test o f the larval retention hypothesis in seamount-generated flows. Deep-Sea Research 144(5):745-770.
Munday, P.L. G.P. Jones, M.C. Ohman and U.L. Kaly. 1998. Enhancement o f recruitment to coral reefs using light-attractors. Bulletin o f Marine Science 63(3):581-588.
Nelson. J.S. 1994. Fishes o f the world. John Wiley and Sons, Inc., New York.
Peters, K.M. 1981. Reproductive biology and developmental osteology o f the Florida blenny. Chasmodes saburrae (Perciformes: Blenniidae). Northeast G ulf Science. 4(2):79-98.
Peters, K.M. 1985. Larval development o f Lupinoblennius nicholsi with comments on larval blenniini identification in Tampa Bay, Florida. Bulletin o f Marine Science 36(3): 445-453.
208
Reproduced with permission of the copyright owner. Further reproduction prohibited without permission.

PotthofF, T. S. Kelley, V. Saksena, M. Moe and F. Young. 1987. Description oflarval and juvenile yellowtail damselfish, Microspathodon chrysurus, Pomacentridae, and their osteological development. Bulletin o f Marine Science 40:330-375.
Randall, J.E. and H.A. Randall. 1963. The spawning and early development o f the Atlantic parrotfish, Sparisoma rubripinne, with notes on other scarid and labrid fishes. Zoologica (N.Y.) 48:49-60.
Raugh, T.J. 1996. Effect o f size and prior residence on dominance in male seaweed blennies, Parablennius marmoreus. G ulf o f Mexico Science 2:105-111.
Reeson, P.H. 1983. The biology, ecology and bionomics o f the parrotfishes, Scaridae. In Munro, J.L., editor. Caribbean Coral Reef Fishery Resources. International Center for Living Aquatic Resources Management, Manila.
Richards, W.J. 1984. Kinds and abundances o f fish larvae in the Caribbean Sea and adjacent areas.NOAA Technical Report NMFS SSRF-776.
Richards, W.J. and J.M. Leis. 1984. Labroidei: development and relationships. In: Moser, H.G., W.J. Richards, W.J. Cohen, D.M., M.P. Fahay, A.W. Kendall and S.L. Richardson, eds. Ontogeny and systematics o f fishes. American Society o f Ichthyologists and Herpetologists Special Publication 1:542-547.
Richards, W.J. and K.C. Lindeman. 1987. Recruitment dynamics o f reef fishes: planktonic processes, settlement and demersal ecologies, and fishery analysis. Bulletin o f Marine Science 41:392-410
Riley, C.M., G.J. Holt and C.R. Arnold. 1995. Growth and morphology oflarval and juvenile captive bred yellowtail snapper, Ocyurus chrysurus. Fishery Bulletin. 93:179-185.
Robertson, D.R., D.G. Green and B.C. Victor. 1988. Temporal coupling o f production and recruitment o f larvae o f a Carbbean reef fish. Ecology 69(2):370-381.
Robins, C. R., G.C. Ray and J. Douglass. 1986. A Field Guide to the Atlantic Coast Fishes o f North America. Houghton M ifflin Company, Boston.
Robins. C. R.. R.M. Bailey, C.E. Bond, J.R. Brooker, E.A. Lachner, R.N. Lea and W.B. Scott. 1991.Common and scientific names o f fishes from the United States and Canada. American Fisheries Society Special Publication 20. American Fisheries Society, Bethesda.
Rooker, J.R., G.D. Dennis and D. Goulet. 1996. Sampling larval fishes with a nightlight lift-net in tropical inshore waters. Fisheries Research 26:1-15.
Rooker, J.R., Q.R. Dokken. C.V. Pattengill and G.J. Holt. 1997. Fish assemblages on artificial andnatural reefs in The Flower Garden Banks National Marine Sanctuary, USA. Coral Reefs 16:83- 92.
Sale, P.F. 1980. The ecology o f fishes on coral reefs. Oceanography and Marine Biology 18:367-421.
Scarborough-Bull. A. and J.J. Kendall, Jr. 1994. An indication o f the process: offshore platforms as artificial reefs in the Gulf o f Mexico. Bulletin o f Marine Science 55(2-3): 1086-1098.
SEAMAP (Southeast Area Monitoring and Assessment Program) 2000. Environmental andbiological atlas o f the G ulf o f Mexico 1998. Number 75. G ulf States Marine Fisheries Commission, Ocean Springs.
Shaw, E.S. 1955. The embryology o f the sergeant major, Abudefduf saxatilis. Copeia 2(May 20):85-89.
209
Reproduced with permission of the copyright owner. Further reproduction prohibited without permission.
Smith-Vaniz, W.F. 1980. Revision o f western Atlantic species o f the blenniid fish genus Hypsoblennius. Proceedings o f the Academy o f Natural Sciences o f Philadelphia 132:282-305.
Sonnier, F., J. Teerling and H.D. Hoese. 1976. Observations on the offshore reef and platform fish fauna o f Louisiana. Copeia 1976:15-111.
Stanley, D.R. and C.A. Wilson. 1990. A fishery-dependent based study o f fish species composition and associated catch rates around oil and gas structures o ff Louisiana. Fishery Bulletin, U.S. 88:719- 730.
Stanley, D.R. and C.A. Wilson. 1991. Factors affecting the abundance o f selected fishes near oil and gas platforms in the northern Gulf o f Mexico. Fishery Bulletin, U.S. 89:149-159.
Stanley, D.R. and C.A. Wilson. 1997. Seasonal and spatial variation in the abundance and sizeddistribution o f fishes associated with a petroleum platform in the northern G ulf o f Mexico. Canadian Journal o f Fishery and Aquatic Science 54:1166-1176.
Stanley, D.R. and C. Wilson. 2000. Seasonal and spatial variation in the biomass and size frequency distribution o f the fish associated with oil and gas platforms in the northern Gulf o f Mexico.OCS Study MMS 2000-005. U.S. Department o f Interior. Minerals Management Service, Gulf o f Mexico OCS Region, New Orleans.
Swearer. S.E., J.E. Caselle. D.W. Lea and R.R. Warner. 1999. Larval retention and recruitment in an island population o f a coral-reef fish. Nature 402:799-802.
Thorrold, S.R. and M.J, Milicich. 1990. Comparison oflarval and pre- and post-settlement growth in two species o f damselfish, Chromis atripectoralis and Pomacentrus coelestis (Pisces: Pomacentridae), from the Great Barrier Reef. Marine Biology 105:375-384.
Thorrold, S.R.. J.M. Shenker, E. Wishinski, R. Mojica and E.D. Maddox. 1994. Larval supply o f shorefishes to nursery habitats around Lee Stocking Island, Bahamas. I. Small-scale distribution patterns. Marine Biology 118:555-566.
Thresher, R.E. 1984. Reproduction in Reef Fishes. T.F.H. Publications, Inc.
Tolimieri, N. 1998. The relationship among microhabitat characteristics, recruitment and adult abundance in the stoplight parrotfish, Sparisoma viride, at three spatial scales. Bulletin o f Marine Science 62(l):253-268.
Tyler, J.C., G.D. Johnson, E.B. Brothers, D.M. Tyler and C. Lavett Smith. 1993. Comparative early life histories o f Western Atlantic squirrelfishes (Hoiocentridae): age and settlement o f rhynchichthys, meeki, and juvenile stages. Bulletin o f Marine Science 53(3): 1126-1150.
Victor. B.C. 1986. Duration o f the planktonic larval stage o f one hundred species o f Pacific and Atlantic wrasses (family Labridae). Marine Biology 90:317-326.
Watson, W. 1996a. Chaetodontidae: butterflyfishes. In H.G. Moser, ed. The early life history stages o f fishes in the California Current region. CalCOFI Atlas No. 33. Allen Press, Inc., Lawrence, Kansas.
Watson, W. 1996b. Labridae: wrasses. In H.G. Moser, ed. The early life history stages o f fishes in the California Current region. CalCOFI Atlas No. 33. Allen Press, Inc., Lawrence, Kansas.
Watson, W. 1996c. Scaridae: parrotfishes. In H.G. Moser, ed. The early life history stages o f fishes in the California Current region. CalCOFI Atlas No. 33. Allen Press, Inc., Lawrence. Kansas.
210
Reproduced with permission of the copyright owner. Further reproduction prohibited without permission.

Watson, W. 1996d. Serranidae: sea basses. In H.G. Moser, ed. The early life history stages o f fishes in the California Current region. CalCOFI Atlas No. 33. Allen Press, Inc., Lawrence, Kansas.
Watson, W. 1996e. Blenniidae: combtooth blennies. In H.G. Moser, ed. The early life history stages o f fishes in the California Current region. CalCOFI Atlas No. 33. Allen Press, Inc., Lawrence, Kansas.
Watson, W. I996f. Holocentridae: squirrelfishes. In H.G. Moser, ed. The early life history stages o f fishes in the California Current region. CalCOFI Atlas No. 33. Allen Press. Inc., Lawrence, Kansas.
Watson, W. 1996g. Pomacentridae: damselfishes. In H.G. Moser, ed. The early life history stages o f fishes in the California Current region. CalCOFI Atlas No. 33. Alien Press, Inc., Lawrence, Kansas.
Watson, W. 2000. Blenniidae. In J.M. Leis and B.M. Carson-Ewart, eds. The larvae o f Indo-Pacific coastal fishes: an identification guide to marine fish larvae. Brill, Leiden.
Watson. W. and M.W. Brogan. 1996. Lutjanidae: snappers. In H.G. Moser, ed. The early life history stages o f fishes in the California Current region. CalCOFI Atlas No. 33. Allen Press. Inc.. Lawrence, Kansas.
Wellington, G.M. and D.R. Robertson. 2001. Variation in larval life-history traits among reef fishes across the Isthmus o f Panama. Marine Biology 138:11-22.
Wickler. W. 1965. Zur Biologie und Ethologie von Ecsenius bicolor (Pisces, Teleostei. Blenniidae). Z. Tierepsychol. 22:36-49.
Workman, I.K. and C.E. Jones. 1979. Determine effects o f oil field discharges on species composition and abundance o f pelagic fishes and demersal fishes and macro-crustaceans in the oil field. In Jackson. W.B., editor. Environmental Assessment o f an Active O il Field in the Northwestern Gulf o f Mexico, 1977-1978. NOAA Report to EPA, NMFS Southeast Fisheries Center, Galveston, Contract Number EPA-IAG-D5-E693-EO, 299 pp.
Wyatt, J.R. 1983. The biology, ecology and bionomics o f the squirrelfishes, Holocentridae. In Munro, J.L., editor. Caribbean Coral Reef Fishery Resources, international Center for Living Aquatic Resources Management. Manila.
211
Reproduced with permission of the copyright owner. Further reproduction prohibited without permission.

CHAPTER 6
POTENTIAL IMPACTS OF OIL AND GAS PLATFORMS ON LARVAL AND JUVENILE ASSEMBLAGES IN THE NORTHERN GULF OF MEXICO
212
Reproduced with permission of the copyright owner. Further reproduction prohibited without permission.

SUMMARY
This study, along with a companion project addressing differennquestions (Tolan 2001),
represents the first comprehensive look at the ichthyoplankton and juvenile fish assemblages collected
within oil and gas platforms in the Gulf o f Mexico (Gulf), and to my knowledge, the world. It is also a
first (yet preliminary) attempt at comparing such assemblages across different depth zones and
geographical regions. It is apparent that a diverse assemblage o f recently-spawned larvae, postlarval and
juvenile fishes occurs in the waters within and immediately downstream o f platforms, and that these
structures may be important to reef fish population dynamics. Based on the results o f this study, three
obvious conclusions stand out: the peak in taxonomic richness and diversity at the mid-shelf platform (GI
94); the relatively low abundance o f reef-associated and reef-dependent postlarvae and juveniles present
at the platforms (as is the case with shelf-wide ichthyoplankton surveys); and the presence, albeit in low
abundances, o f recently-spawned, preflexion, flexion, postflexion and juvenile reef-dependent and reef-
associated species at platforms.
Mid-Shelf Peak in Taxonomic Richness and Diversity
In general, while reef-associated and reef-dependent taxa were collected at all platform sites,
taxonomic richness and diversity was highest at GI 94 (mid-shelf). Due to the pelagic nature o f most
reef-dependent eggs and larvae, dispersal in the oceanic environment plays a large role in the eventual
settlement and recruitment o f postlarvae and juveniles to adult environments. While some studies have
determined mechanisms oflarval retention in reef environments (Swearer et al. 1999; Cowen et al. 2000),
it is widely believed that recruitment is variable and dependent, in part, on the supply from nearby,
upstream reefs (Sale 1980; Richards and Lindeman 1987; Doherty and Williams 1988; Doherty 1991). In
the northern Gulf, most oil and gas platforms are concentrated along the inner and mid-shelf region,
where 93% o f the structures are located in water depths ranging from 0-75 m (Grace Hawayek. Minerals
Management Service, New Orleans Office, pers. com.). At GI 94, which was the mid-shelf platform (60
m depth), the proximity to the high density o f surrounding platforms may have created generally
favorable conditions for the recruitment o f reef taxa. The presence, proximity and concentration o f
upstream reefs (natural or artificial) and spawning habitats is known to play an important role in the
eventual makeup o f the pre-adult assemblages.
213
Reproduced with permission of the copyright owner. Further reproduction prohibited without permission.

At GC 18 (shelf break), the relatively low abundance o f reef fish larvae and juveniles may
likewise be due to a combination o f depth (> 200m), distance from other natural/artificial reefs, and
oligotrophic, open ocean waters devoid o f possible recruits. Similarly, the close proximity o f ST 54
(inner shelf) to the coastal boundary current and hydrologic interactions with the Mississippi River plume
(e.g., low salinity and high turbidity), along with its shallow water depth (20 m) which makes it more
susceptible to rapid cooling during winter cold fronts, may result in fluctuating conditions generally
unfavorable for most reef-associated or reef-dependent fishes, but more suitable for estuarine and coastal
pelagic taxa, which dominated the collections. Previous research on the adult assemblages associated
with the sampling sites (Stanley and Wilson 2000) involving hydroacoustical and underwater video
surveys utilizing remote controlled vehicles have shown similar results, with the highest taxonomic
richness, particularly among reef-dependent taxa, occurring at G194 (mid-shelf). Adult biomasses were
significantly higher at GI 94 as well. Mean adult densities at GI 94 were approximately 15-17 times
higher than at ST 54 (inner shelf) and GC 18 (Stanley and Wilson 2000).
Rarity of Reef-Associated and Reef-Dependent Larvae and Juveniles
The fact that relatively few individuals o f reef-dependent and reef-associated taxa were
collected, particularly lutjanid and serranid specimens, is not surprising for several reasons. First o f all,
due to the high mortality rates experienced by pelagic larvae prior to settlement (approaching 100%),
reef-dependent juveniles are relatively rare in general (Leis 1991). This, coupled with potentially high
predation rates at the settlement site itself (see below), may result in very low abundance o f early life
stages available for capture. Secondly, recruitment events for these taxa can be extremely episodic
(Choat et al. 1993; Rooker et al. 1996), with most o f the reef fish replenishment occurring over the course
o f 1-3 nights (Thorrold et al. 1994; Rooker et al. 1996). Although peak times o f settlement and
recruitment (new and full moon periods) were targeted for 2-3 night periods, it is still very possible that
settlement peaks were missed during the course o f the study. Finally, although light-traps were used as a
means o f collecting larger postlarvae and juveniles, light-aggregation devices can be very taxon-selective.
While some reef-dependent taxa, such as pomacentrids, have been collected in large numbers, few
research efforts have been able to collect many lutjanids or serranids with light-aggregation devices
(Dennis etal. 1991; Choat etal. 1993;Brogan 1994; Rooker etal. 1996; Hernandez and Lindquist 1999).
214
Reproduced with permission of the copyright owner. Further reproduction prohibited without permission.

A popular justification for artificial reefs is that they increase fish populations by improving
recruitment (Bohnsack et al. 1994). The occurrence o f extremely large numbers o f postlarvae and newly-
settled juveniles on new reefs, which are devoid o f high numbers o f adults, suggests that there is a pool o f
opportunistic surplus larvae (Bohnsack et al. 1994). Numerous observations on the subsequent, rapid
disappearance o f these newly-settled juveniles, however, support the "wall o f mouths hypothesis" (Emery
1973; Hamneret al. 1988) and the "limited shelter hypothesis” (Shulman 1985; Hixon and Beets 1989),
which state that for postlarva! reef fish, the time o f settlement, especially in the absence o f suitable
shelter, is characterized by exceedingly high predation-mortality rates by the larger, predominately
carnivorous resident population, many o f which are conspecifics. Thus, the presence o f presettlement
postlarvae and postsettlement juveniles may often be "displaced" from the most favorable reef habitat by
this intensive, on-site, adult predation (Frederick 1997).
While much o f the evidence for the "wall o f mouths" and related hypotheses has been collected
from natural reefs, there is some supporting evidence from oil and gas platform studies. Scarborough-
Bull and Kendall (1994) studied juvenile recruitment and colonization on three offshore oil and gas
platforms that were converted to artificial reefs. Two platforms were explosively toppled and had
virtually all o f their resident fish community lethally concussed. These sites subsequently served as
recruitment sites for juveniles/immature reef fish. A third rig was toppled during a hurricane and
experienced minimum impact to its adult fish communities and did not serve as a recruitment site, i.e.,
virtually all fish observed were adults (Scarborough-Bull and Kendall 1994).
It is with this paradigm in mind (increased production by improving recruitment) that light-traps
were used within the sampling design in an effort to collect settiement-stage postlarvae and juveniles.
The presence o f these larger, more competent individuals could provide indirect evidence for the nursery
area/refuge function o f the petroleum platforms. The adult populations o f reef fish at the sites are well-
known. Stanley and Wilson (2000) have documented reef-dependent adults at the outer shelf platform
(GC 18: Epinephelus inermis, kfycteroperca phenax. Paranthias fitrcifer, Pristipomoides aquilonaris,
Balistes capriscus), the mid-shelf platform (GI 94: Epinephelus fulvus, £. inermis, Mycteroperca bonaci,
M. microlepis. M. phenax, M. venenosa, P. fitrcifer, Lutjanus campechanus, L griseus, Rhomboplites
aurorubens, B. capriscus) and the inner shelf platform (ST 54: Epinephelus adscensionis, L
215
Reproduced with permission of the copyright owner. Further reproduction prohibited without permission.

campechartus, L. griseus, B. capriscus). However, few reef-dependent, settlement-size postlarvae and
juveniles were collected, mostly pomacentrids and blenniids.
The abundance o f postlarval and juvenile synodontids and scombrids near the platforms suggests
that even the early life stage predatory field is probably high, i.e., postlarvae/juvenile predation on other
postlarvae and juveniles, plus cannibalism. Most synodontids and scombrids are piscivorous as early as
the postlarval stage (Naughton and Saloman 1981; Uchida 1981; Sweatman 1984; Thresher et al. 1986).
Larvae and juveniles o f synodontids were frequently collected in the light-trap samples (as were
scombrids to a lesser extent) and were observed preying on other organisms retained in the cod end.
Small, cryptic species such as synodontids are often overlooked in surveys and, therefore, their
abundances are usually unknown. The presence o f a large population o f synodontids may have a major
impact on fish community dynamics, since they prey directly on postlarvae and juveniles of many
commercially- and recreationally-important species (Thresher et al. 1986). Observations on piscivory by
a synodontid suggest that new recruits can face a 65% annual chance o f predation from just a single
species o f lizardfish (Sweatman 1984). The high numbers o f piscivorous juveniles collected in this study,
primarily with light-traps, indicate that predation is important in determining local reef assemblages.
Full Range of Early Life History Stages of Reef-Dependent and Reef-Associated Fishes
A functional attribute often credited to artificial reefs is that they increase fish production by
increasing the available habitat for adult nesting or spawning (Grossman et al. 1997). While this study
did not examine adult spawning activity or pelagic egg densities, smaller, yolk-sac and preflexion larvae
were present in the plankton net collections. At the outer shelf platform (GC 18). for example, preflexion
blenniids, holocentrids, serranids, lutjanids. and scarids were collected, suggesting nearby spawning or
local supply. Similarly, reef-dependent/associated, preflexion individuals were collected at the mid-shelf
platform, GI 94 (pomacentrids, blenniids, holocentrids, lutjanids. and serranids), and at the inner shelf
platform, ST 54 (blenniids and lutjanids). While the passive plankton net collections do not necessarily
reflect platform-association, they do provide an indication o f local supply. Since preflexion, reef-
dependent larvae were collected, it is likely that they were locally spawned at either natural or artificial
habitats nearby. Platforms are more abundant on the mid- and inner shelf, increasing their potential
importance. At the shelf break platform, the number o f possible upstream spawning sites is very much
216
Reproduced with permission of the copyright owner. Further reproduction prohibited without permission.

restricted when compared to the mid-shelf platform (with the most possible adjacent, upstream sites) or
even the inner shelf site.
With the limited amount o f hard-substrate habitat available in the northcentral Gulf o f Mexico,
the addition o f artificial habitats (platforms) may increase the chances o f finding suitable settlement
habitat, particularly where they are most dense (mid- and inner shelf). The available natural hard-bottom
habitats in the Gulf are widely scattered and relatively deep, particularly for many reef-dependent taxa
accustomed to shallow water habitats. The chances o f encountering a platform in the northern Gulf
(especially west o f the Mississippi River Delta) is probably relatively high compared to those o f
encountering a natural reef or hard-bottom. Also, since most larval and juvenile fishes are in the upper
water column, the encounter rate is potentially enhanced by the vertical nature o f platform structures.
Platforms may not equal natural hard-bottom banks in terms o f settlement area or suitable
porosity/rugosity, but they potentially serve as a settlement site for fishes that otherwise might be "lost"
from the system.
MANAGEMENT IMPLICTIONS
From a management perspective, fish early life history data from a cross-shelf study o f
petroleum platforms could provide information useful in deciding the future placement o f artificial
structures (Shinn and Wicklund 1989) and in determining whether or not the platforms serve as refugia
for reef species (Steimle and Meier 1997). While oil and gas platforms may be very suitable habitat for
adult fishes, the physical meso- and micro-structure o f these artificial reefs may not be ideal for settling
postlarvae and juveniles. Previous studies have shown that smaller reefs tend to hold a greater
cumulative numbers o f total and resident species, higher fish densities, and more settlers (Bohnsack et al.
1994). The higher carrying capacity and settlement success o f smaller reefs is probably a function o f
their. I ) greater edge effect (higher ratio o f perimeter to reef area; Bohnsack et al. 1994); 2) lower
vertical relief which often favors juvenile over adult reef fish (West et al. 1994); and 3) greater porosity
or availability o f small shelter holes (< a few cm), which has been repeatedly shown to be important for
post-settlement survival (Shulman 1985; Hixon and Beets 1989: West et al. 1994). Petroleum platforms,
in contrast, are large reefs and are generally characterized as having a higher profile (high vertical relief),
less complexity, and lower porosity than natural reefs.
217
Reproduced with permission of the copyright owner. Further reproduction prohibited without permission.

1 believe the lack o f structural complexity o f platforms, combined with the high predation
pressures (see above) results in a habitat that is not very suitable for a settling juvenile. The "wall o f
mouths" predation pressure is enhanced by the large constant light fields associated with platforms that
allow for additional nocturnal surface feeding by visual predators. Some opportunistic settlement events
undoubtedly occur, as evident by the presence o f settlement-sized juveniles at the platforms and by the
presence o f sedentary, reef-dependent adult species (e.g., chaetodontids and labrids). However, I believe
the major value o f oil and gas platforms as artificial habitat lies in their increased carrying capacity for
adult fishes and potential as spawning habitat. The vertical structure o f the platform, while unique, is not
as important for most larval and juvenile fishes.
FUTURE CONSIDERATIONS
This study represents one o f the first intensive investigations o f the relationships between larval
and juvenile fishes and oil and gas platforms. It is apparent that much has yet to be learned about the role
platforms may play as habitat for early life stages o f fishes, particularly reef-associated and reef-
dependent fishes. One aspect that should be investigated further is the near-bottom vertical structure o f
the platforms. Logistically, this study was limited in its sampling scope to the surface and near-surface
waters (15-23 m depth as determined by the first level o f structural cross members). While some taxa
may settle in relatively shallow waters and remain on a platform's upper support structures as adults (e.g..
pomacentrids, chaetodontids and blenniids), others are more demersal as adults and probably recruit to
the bottom support structures and pilings (e.g., serranids and lutjanids) as late-stage juveniles or even sub
adults. In addition, any low-relief benthic modification that may result from platform
placement/construction (e.g.. foundational bottom hardening, shell pads) or subsequent production (e.g..
bottom oil or gas distributional pipelines) may also represent potentially valuable recruitment habitat.
This platform-related, benthic sphere o f influence may be further enhanced by the no trawling halo that is
enforced immediately adjacent to all platforms. Future investigations should attempt to sample the
deeper hard-bottom habitat provided by platforms.
Another important consideration in artificial reef studies is the degree to which organisms
associated with the hard substrate habitat interact with pelagic species and contribute to off-reef
production (Lindberg 1997). The scombrids, for example, are pelagic but often structure-associated, and
218
Reproduced with permission of the copyright owner. Further reproduction prohibited without permission.

the juveniles are competent swimmers and highly piscivorous. I f these juveniles, which were relatively
abundant in the collections, are actively feeding in association with the platforms, then they, and similar
taxa (e.g., carangids) could serve as an important trophic link between the reef and pelagic environments.
Blennies, for example, could be an important link between production at the platforms and pelagic,
transient predators. These fishes are structure-dependent and are attracted to the numerous habitats
created by the biofouling community (e.g., barnacles) on the platform legs and cross members, as well as
the to the associated zoopiankton food resources (Gallaway 1981; Bohnsack and Sutherland 1985). Some
blennies have been cited as important components o f the diets o f fishes such as Archosargus
probatocephalus (Gallaway 1980) and Seriola rivoliana (Gallaway and Martin 1980).
The importance o f platform primary and secondary production in different trophic pathways
could be elucidated with the use o f stable isotopes analyses (Thomas and Cahoon 1993). Since the sessile
invertebrates (and associated meiofauna and macrofauna) on platforms represent "vertical benthos” , it is
likely there is a distinct platform isotopic signature in the fishes that utilize these food resources.
Predatory taxa such as carangids and scombrids with more generalized habitat requirements may be
attracted to the concentrations o f zoopiankton and forage fish that are dependent on the platforms
(Keenan et al. in press). The use o f stable isotope analyses could help to determine the relative
contribution o f platform vs. off-platform food resources in these trophic pathways.
A major problem for managing reef resources is the incomplete understanding o f the interactions
between recruitment and habitat structure. Although habitat space may ultimately be limiting, many reef
fish populations are not at the carrying capacity o f their environment and changes in abundance may be
controlled by settlement from the plankton or by early postsettlement mortality. Virtually nothing is
known about the relationship between offshore petroleum platforms and the early life history stages o f
fishes anywhere in the world. These findings, therefore, represent an important first step towards this
aspect o f artificial reef research.
REFERENCES
Bohnsack. J.A. and D.L. Sutherland. 1985. Artificial reef research: a review with recommendations forfuture priorities. Bulletin o f Marine Science 37: 11-19.
219
Reproduced with permission of the copyright owner. Further reproduction prohibited without permission.
Bohnsack, J.A., D.E. Harper, D.B. McClellan and M. Huisbeck. 1994. Effects o f reef size on colonization and assemblage structure o f fishes at artificial reefs o ff southeastern Florida, U.S.A. Bulletin o f Marine Science 55:796-823.
Brogan, M.W. 1994. Two methods o f sampling fish larvae over reefs: a comparison from the Gulf o f California. Marine Biology 118:33-44.
Cowen, R.K., K.M.M. Lwiza, S. Sponaugle, C.B. Paris and D.B. Olson. 2000. Connectivity o f marine populations: open or closed? Science 287:857-859.
Choat, J.H, P.J. Doherty, B.A. Kerrigan and J.M. Leis. 1993. A comparison o f towed nets, purse seine, and light-aggregation devices for sampling larvae and pelagic juveniles o f coral reef fishes. Fishery Bulletin 91:195-209.
Dennis, G.D., D. Goulet and J.R. Rooker. 1991. Ichthyoplankton assemblages sampled by night lighting in nearshore habitats o f southwestern Puerto Rico. NOAA/NMFS Technical Report 95: 89-97.
Doherty, P.J. 1991. Spatial and temporal patterns in recruitment. In Sale, P.F., ed. The ecology o f fishes on coral reefs. Academic Press, San Diego.
Doherty, P.J. and D. McB. Williams. 1988. The replenishment o f coral reef fish populations. Oceanography and Marine Biology 26:487-551.
Emery, A.R. 1973. Comparative ecology and functional osteology o f fourteen species o f damselfish (Pisces: Pomacentridae) at Alligator Reef, Florida Keys. Bulletin o f Marine Science 23: 649- 770.
Frederick. J.L. 1997. Post-settlement movement o f coral reef fishes and bias in survival estimates. Marine Ecology Progress Series 150:65-74.
Gallaway, B.J. 1980. Structure-associated communities, pelagic, reef, demersal fishes andmacrocrustaceans. In Jackson. W.B. and P. Wilkens, eds. Environmental assessment o f an active oil field in the northwestern G ulf o f Mexico. Milestone report to NOAA. EPA project Number EPA-IAG-DS-E693-EO.
Gallaway, B.J. 1981. An ecosystem analysis o f oil and gas development on the Texas-Louisiana continental shelf. FWS/OBS-8I/27. U.S. Fish & Wildlife Service, Office o f Biological Services, Washington, D.C.
Gallaway, B.J. and L.R. Martin. 1980. Volume Hl-Effects o f gas and oil field structures andeffluents on pelagic and reef fishes, demersal fishes and macrocrustaceans. In Jackson. W.B. and E.P. Wilkens, eds. Environmental assessment o f Buccaneer Gas and Oil Field in the northwestern G ulf o f Mexico. 1978-1979. NOAA Technical Memorandum, NMFS-SEFC-37.
Grossman, G.D.. G.P. Jones and W.J. Seaman. Jr. 1997. Do artificial reefs increase regional fish production? A review o f existing data. Fisheries 22(4): 17-23.
Hamner, W.M. M.S. Jones, J.H. Carleton, J.R. Hauri and D. McM. Williams. 1988. Zoopiankton,planktivorous fish, and water currents on a windward reef face: Great Barrier Reef, Australia. Bulletin o f Marine Science 42:459-479.
Hernandez, F.J., Jr. and D.G. Lindquist. 1999. A comparison o f two light-trap designs for samplinglarval and presettlement juvenile fish above a reef in Onslow Bay, North Carolina. Bulletin o f Marine Science 64:173-184.
220
Reproduced with permission of the copyright owner. Further reproduction prohibited without permission.

Hixon, M.A. and J.P. Beets. 1989. Shelter characteristics and Caribbean fish assemblages: experiments with artificial reefs. Bulletin o f Marine Science 44:666-680.
Keenan, S.F., M.C. Benfield and R.F. Shaw. In press. Zooplanktivory by blue runner Caranx crysos: apotential energetic subsidy to G ulf o f Mexico fish populations at petroleum platforms. American Fisheries Society Special Symposium Series.
Leis, J.M. 1991. The pelagic stage o f reef fishes: the larval biology o f coral reef fishes. In Sale, P.F.. editor. The Ecology o f Fishes on Coral Reefs. Academic Press, San Diego.
Lindberg, W.J. 1997. Can science resolve the attraction-production issue? Fisheries 22(4): 10-13.
Naughton S.P. and C.H. Saloman. 1981. Stomach contents o f juveniles o f king mackerel(Scomberomorus cavalla) and Spanish mackerel (S. maculatus). Northeast Gulf Science 5( 1): 71-74.
Richards, W.J. and K.C. Lindeman. 1987. Recruitment dynamics o f reef fishes: planktonic processes,settlement and demersal ecologies, and fishery analysis. Bulletin o f Marine Science 41:392-410.
Rooker, J.R., G.D. Dennis and D. Goulet. 1996. Sampling larval fishes with a nightlight lift-net in tropical inshore waters. Fisheries Research 26:1-15.
Sale, P.F. 1980. The ecology o f fishes on coral reefs. Oceanography and Marine Biology 18:367-421.
Scarborough-Bull, A. and J.J. Kendall. Jr. 1994. An indication o f the process: offshore platforms as artificial reefs in the Gulf o f Mexico. Bulletin o f Marine Science 55:1086-1098.
Shinn, E.A. and R.l. Wicklund. 1989. Artificial reef observations from a manned submersible o ff southeast Florida. Bulletin o f Marine Science 44:1051-1057.
Shulman, M.J. 1985. Recruitment o f coral reef fishes: effects o f distribution o f predators and shelter. Ecology 66: 1056-1066.
Stanley, D.R. and C. Wilson. 2000. Seasonal and spatial variation in the biomass and size frequency distribution o f the fish associated with oil and gas platforms in the northern Gulf o f Mexico. OCS Study MMS 2000-005. U.S. Department o f Interior, Minerals Management Service, Gulf o f Mexico OCS Region, New Orleans.
Steimle, F.W. and M.H. Meier. 1997. What information do artificial reef managers really want from fishery science? Fisheries 22(4):6-8.
Swearer. S.E., J.E. Caselle, D.W. Lea and R.R. Warner. 1999. Larval retention and recruitment in an island population o f a coral-reef fish. Nature 402:799-802.
Sweatman. H.P.A. 1984. A field study o f the predatory behavior and feeding rate o f a piscivorous coral reef fish, the lizardfish Synodus englemam. Copeia 1984:187-193.
Thomas. C.J. and L.B. Cahoon. 1993. Stable isotope analyses differentiate between different trophic pathways supporting rocky-reef fishes. Marine Ecology Progress Series 95:19-24.
Thorrold, S.R.. J.M. Shenker, E. Wishinski, R. Mojica and E.D. Maddox. 1994. Larval supply o f shorefishes to nursery habitats around Lee Stocking Island. Bahamas. I. Small-scale distribution patterns. Marine Biology 118:555-566.
Reproduced with permission of the copyright owner. Further reproduction prohibited without permission.

Thresher, R.K., K.L. Sainsbury, J.S. Gunn and A.W. Whitelaw. 1986. Life history strategies and recent changes in population structure in the lizardfish genus Saurida, on the Australian northwest shelf. Copeia I986(l):876-885.
Tolan. J.M. 2001. Patterns o f reef fish larval supply to petroleum platforms in the northern Gulf o f Mexico. Doctoral dissertation. Louisiana State University, Baton Rouge.
Uchida, R.N. 1981. Synopsis o f biological data on frigate tuna, Auxis [hazard, and bullet tuna, A. rochei. NOAA Technical Report, NMFS Circ. 436.
West, J.E., R.M. Buckley and D.C. Doty. 1994. Ecology and habitat use o f juvenile rockfishes (Sebasles spp.) associated with artificial reefs in Puget Sound, Washington. Bulletin o f Marine Science 55:344-350.
Reproduced with permission of the copyright owner. Further reproduction prohibited without permission.
VITA
Frank Joseph Hernandez, Jr. was bom on April 2, 1971 in New Roads, Louisiana. He is the son
o f Frank J. Hernandez, Sr. and Mary A. Hernandez (deceased), and the brother o f Phyllis Jarreau and
Amy Hernandez. Frank grew up in Baton Rouge where he attended Scotlandville Magnet High School,
graduating in 1989. After a year at the University o f Southwestern Louisiana, Frank transferred to
Louisiana State University where he completed a bachelor o f science degree in Zoology, graduating in
1993. He then moved "north" to pursue a master o f science degree in Marine Biology at the University o f
North Carolina at Wilmington. Under the direction o f Dr. David G. Lindquist, Frank discovered the
world o f ichthyoplankton and completed a thesis which compared the efficiency o f different
ichthyoplankton sampling gears. He graduated in 1996 and worked for Dr. Lindquist on miscellaneous
projects until 1997. Frank returned to LSU in 1997 to continue his graduate studies in the Department o f
Oceanography and Coastal Sciences under the direction o f Dr. Richard F. Shaw. His research has
focused on the relationships between larval and juvenile fishes and artificial habitats, particularly
petroleum platforms, in the northcentral Gulf o f Mexico. He is currently looking forward to a post
doctoral research position at the NOAA lab in Beaufort. North Carolina. Frank w ill receive the Doctor o f
Philosophy degree in Oceanography and Coastal Sciences (minor in Experimental Statistics) in December
2001.
223
Reproduced with permission of the copyright owner. Further reproduction prohibited without permission.

DOCTORAL EXAMINATION AND DISSERTATION REPORT
Candidate: Frank Joseph Hernandez, Jr.
Major Field: Oceanography and Coastal Sciences
Title of Dissertation: The Across-Shelf Distribution of Larval,Postlarval and Juvenile Fishes Collected at Oil and Gas Platforms and a Coastal Jetty Off Louisiana West of the Mississippi River Delta
Approved:
aduate School
EXAMINING COMMITTEE:
Date of Kraei nation:
O rm h o r 7 L t 2001
Reproduced with permission of the copyright owner. Further reproduction prohibited without permission.