the aci traffic forecast report (tfr) events/statistics_and_forecasting... · the aci traffic...
TRANSCRIPT
0© DKMA 2011
The ACI Traffic Forecast Report (TFR)
ACI Statistics and Forecasting Workshop
Catherine Harmel-Tourneur, DKMA
March 2011
1© DKMA 2011
Overview of the Presentation
• Presentation of the ACI Traffic Forecasts.– Methodology.– ACI vs. other industry forecasts.
• Key forecast results:– The ACI long term forecast; and– The ACI short term forecast.
2© DKMA 2011
ACI Traffic Forecast Report (TFR)
• The ACI report is prepared in partnership with DKMA since 2006.– DKMA is an aviation market, research and forecasting specialist.– Aside from the TFR, still in partnership with ACI, we prepare individual airport forecasts (aka as the ‘Traffic
Forecast Advisory Services’).– Finally we also manage the Airport Survey Quality (ASQ).
• The report highlights traffic from the perspective of the airport industry.– Period covered: 2009-2029.– Latest edition was released in Q4 2010.
• The report is based on the traffic forecasts from over 300 airports.– Additionally, inputs/ adjustments are made.
• The forecast covers:– Development of worldwide passengers;– Traffic projections by world regions;– Individual countries;– Forecast traffic growth between region pairs; and– Freight and aircraft movement forecast.
3© DKMA 2011
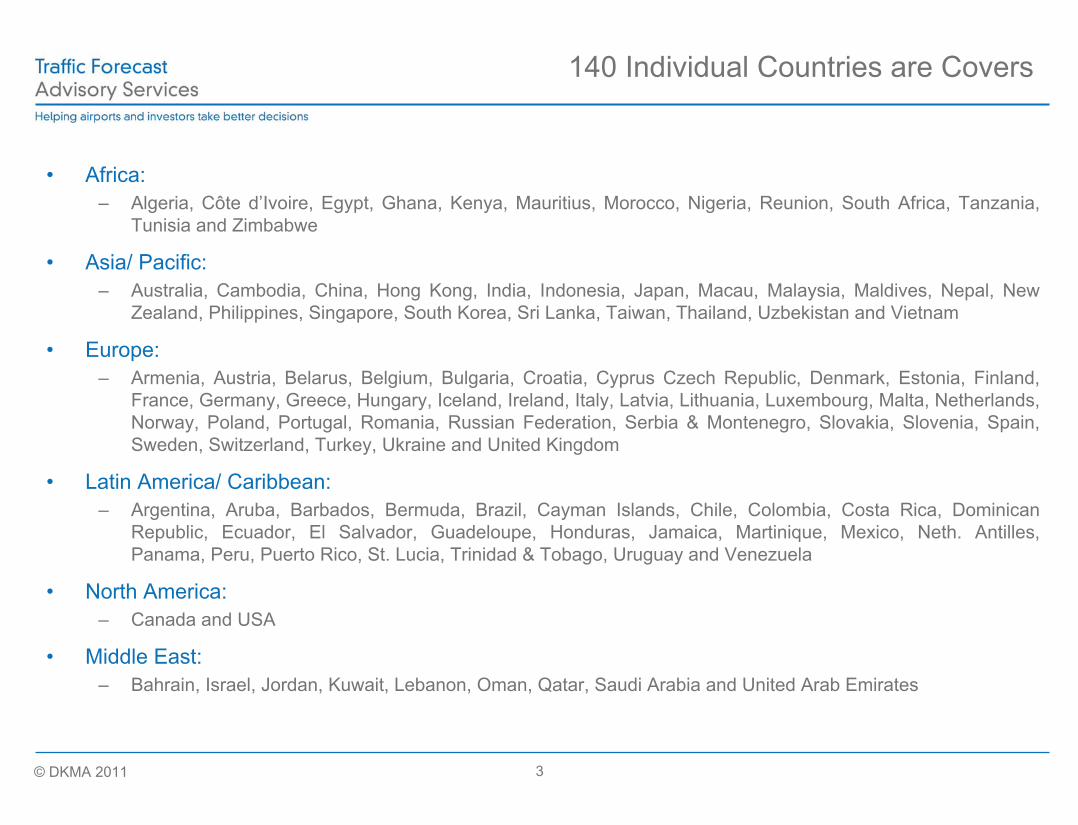
140 Individual Countries are Covers
• Africa:– Algeria, Côte d’Ivoire, Egypt, Ghana, Kenya, Mauritius, Morocco, Nigeria, Reunion, South Africa, Tanzania,
Tunisia and Zimbabwe
• Asia/ Pacific:– Australia, Cambodia, China, Hong Kong, India, Indonesia, Japan, Macau, Malaysia, Maldives, Nepal, New
Zealand, Philippines, Singapore, South Korea, Sri Lanka, Taiwan, Thailand, Uzbekistan and Vietnam
• Europe:– Armenia, Austria, Belarus, Belgium, Bulgaria, Croatia, Cyprus Czech Republic, Denmark, Estonia, Finland,
France, Germany, Greece, Hungary, Iceland, Ireland, Italy, Latvia, Lithuania, Luxembourg, Malta, Netherlands, Norway, Poland, Portugal, Romania, Russian Federation, Serbia & Montenegro, Slovakia, Slovenia, Spain, Sweden, Switzerland, Turkey, Ukraine and United Kingdom
• Latin America/ Caribbean: – Argentina, Aruba, Barbados, Bermuda, Brazil, Cayman Islands, Chile, Colombia, Costa Rica, Dominican
Republic, Ecuador, El Salvador, Guadeloupe, Honduras, Jamaica, Martinique, Mexico, Neth. Antilles, Panama, Peru, Puerto Rico, St. Lucia, Trinidad & Tobago, Uruguay and Venezuela
• North America:– Canada and USA
• Middle East:– Bahrain, Israel, Jordan, Kuwait, Lebanon, Oman, Qatar, Saudi Arabia and United Arab Emirates
4© DKMA 2011
Overview of the Methodology
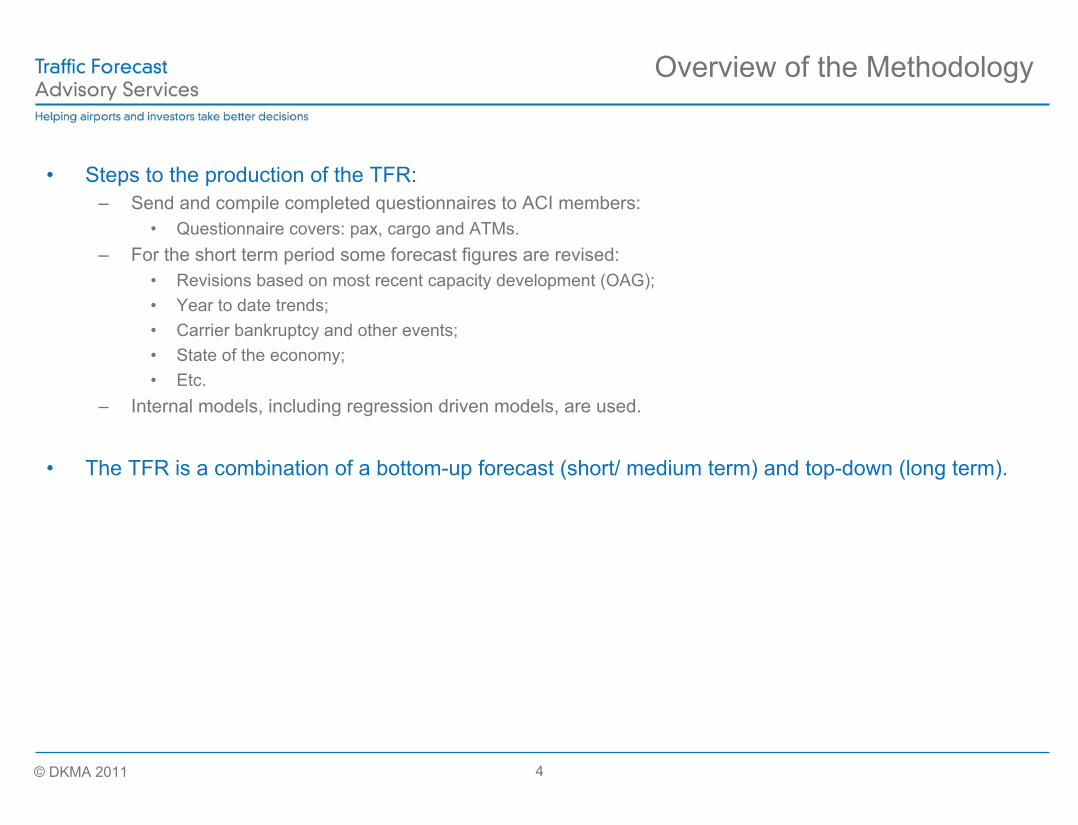
• Steps to the production of the TFR: – Send and compile completed questionnaires to ACI members:
• Questionnaire covers: pax, cargo and ATMs.– For the short term period some forecast figures are revised:
• Revisions based on most recent capacity development (OAG); • Year to date trends;• Carrier bankruptcy and other events;• State of the economy;• Etc.
– Internal models, including regression driven models, are used.
• The TFR is a combination of a bottom-up forecast (short/ medium term) and top-down (long term).
5© DKMA 2011
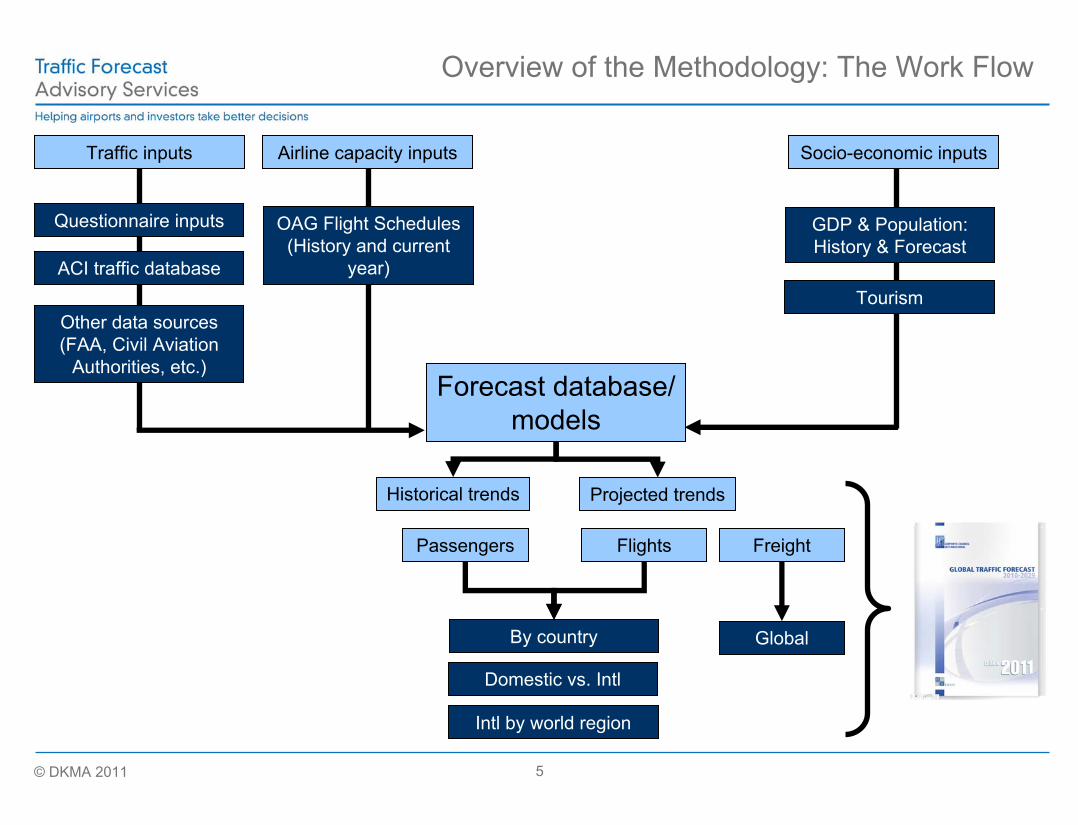
Overview of the Methodology: The Work Flow
Forecast database/models
Traffic inputs
By country
Domestic vs. Intl
Intl by world region
Historical trends Projected trends
Questionnaire inputs OAG Flight Schedules(History and current
year)ACI traffic database
Other data sources(FAA, Civil Aviation
Authorities, etc.)
GDP & Population: History & Forecast
Tourism
Passengers Flights Freight
Global
Airline capacity inputs Socio-economic inputs
6© DKMA 2011
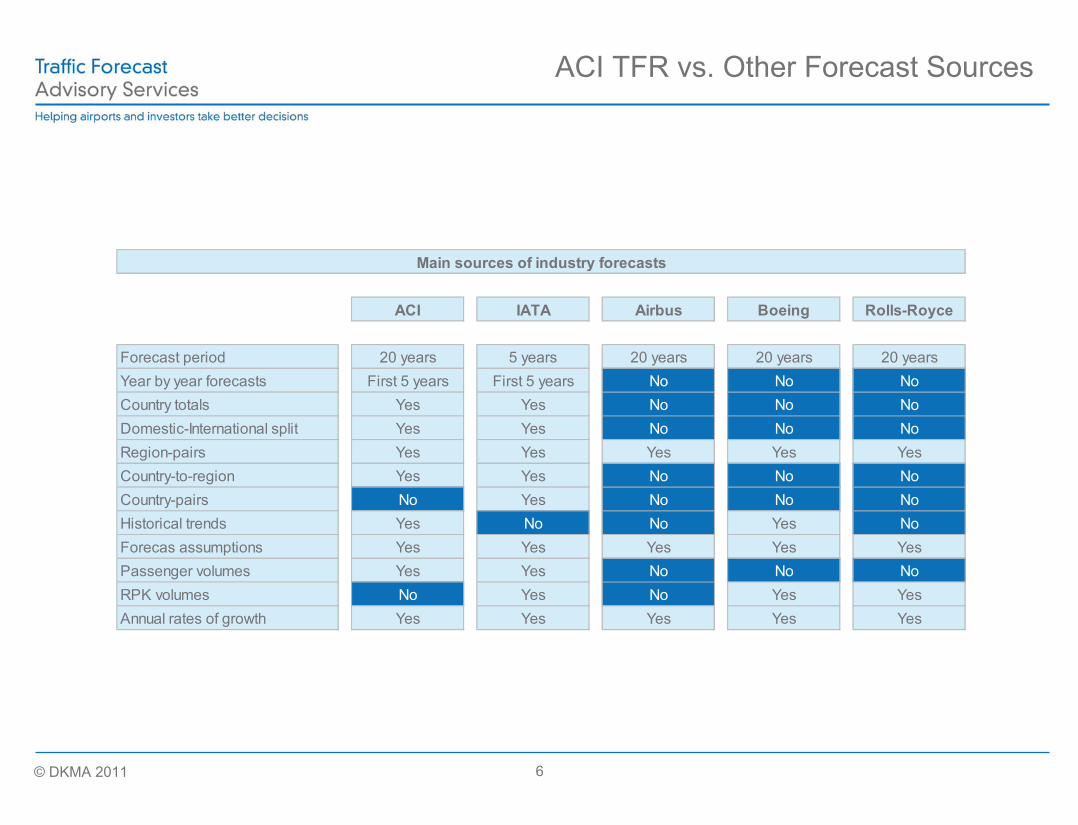
ACI TFR vs. Other Forecast Sources
ACI IATA Airbus Boeing Rolls-Royce
Forecast period 20 years 5 years 20 years 20 years 20 yearsYear by year forecasts First 5 years First 5 years No No NoCountry totals Yes Yes No No NoDomestic-International split Yes Yes No No NoRegion-pairs Yes Yes Yes Yes YesCountry-to-region Yes Yes No No NoCountry-pairs No Yes No No NoHistorical trends Yes No No Yes NoForecas assumptions Yes Yes Yes Yes YesPassenger volumes Yes Yes No No NoRPK volumes No Yes No Yes YesAnnual rates of growth Yes Yes Yes Yes Yes
Main sources of industry forecasts
7© DKMA 2011
Global Results: Comparing Forecasts
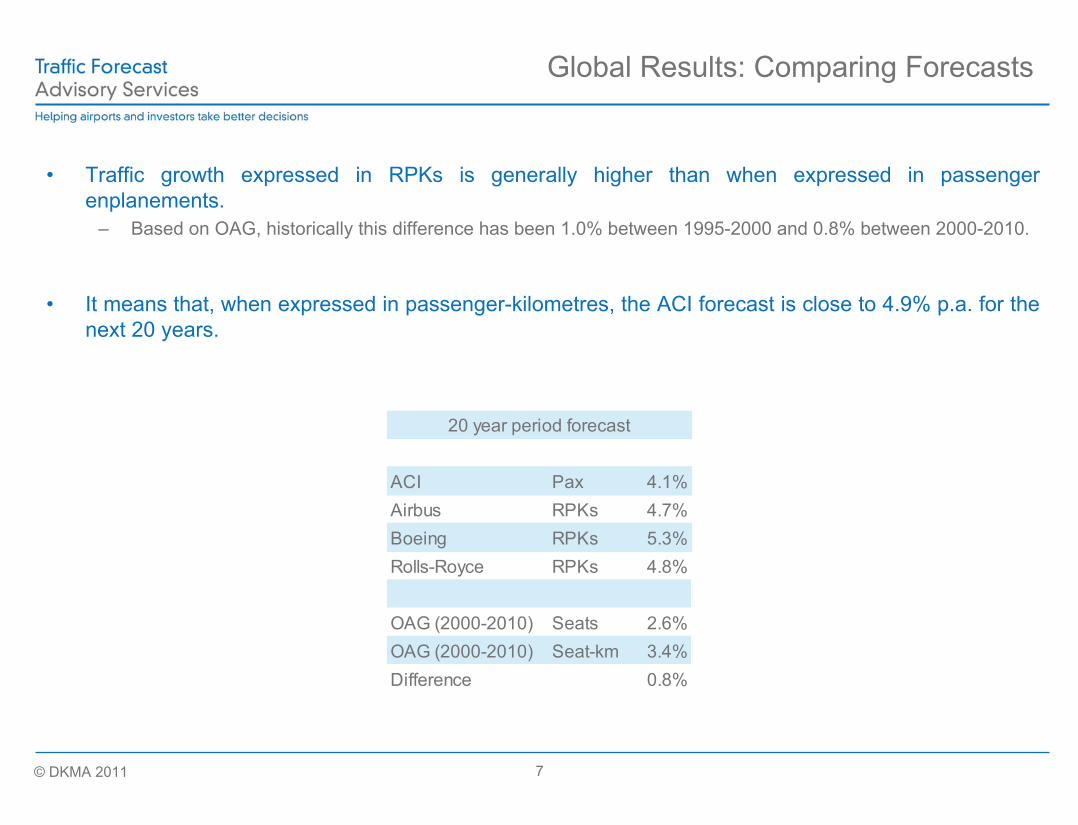
• Traffic growth expressed in RPKs is generally higher than when expressed in passenger enplanements.
– Based on OAG, historically this difference has been 1.0% between 1995-2000 and 0.8% between 2000-2010.
• It means that, when expressed in passenger-kilometres, the ACI forecast is close to 4.9% p.a. for the next 20 years.
ACI Pax 4.1%Airbus RPKs 4.7%Boeing RPKs 5.3%Rolls-Royce RPKs 4.8%
OAG (2000-2010) Seats 2.6%OAG (2000-2010) Seat-km 3.4%Difference 0.8%
20 year period forecast
8© DKMA 2011
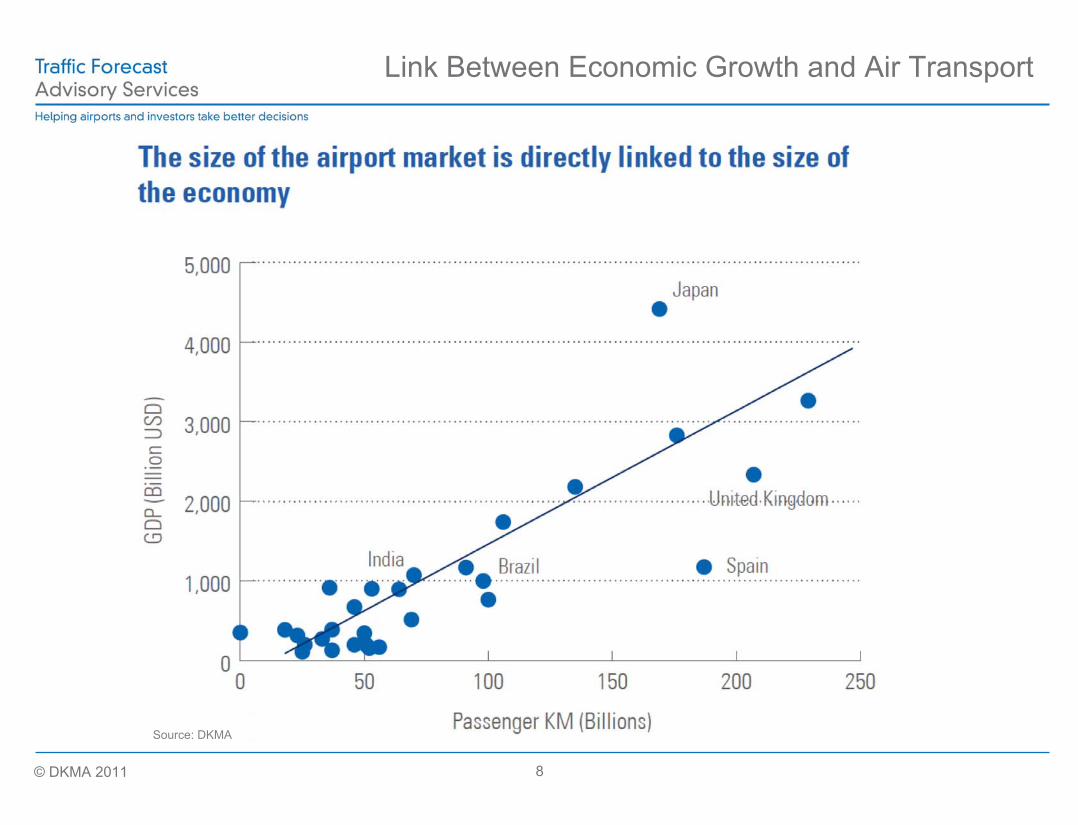
Link Between Economic Growth and Air Transport
Source: DKMA
9© DKMA 2011
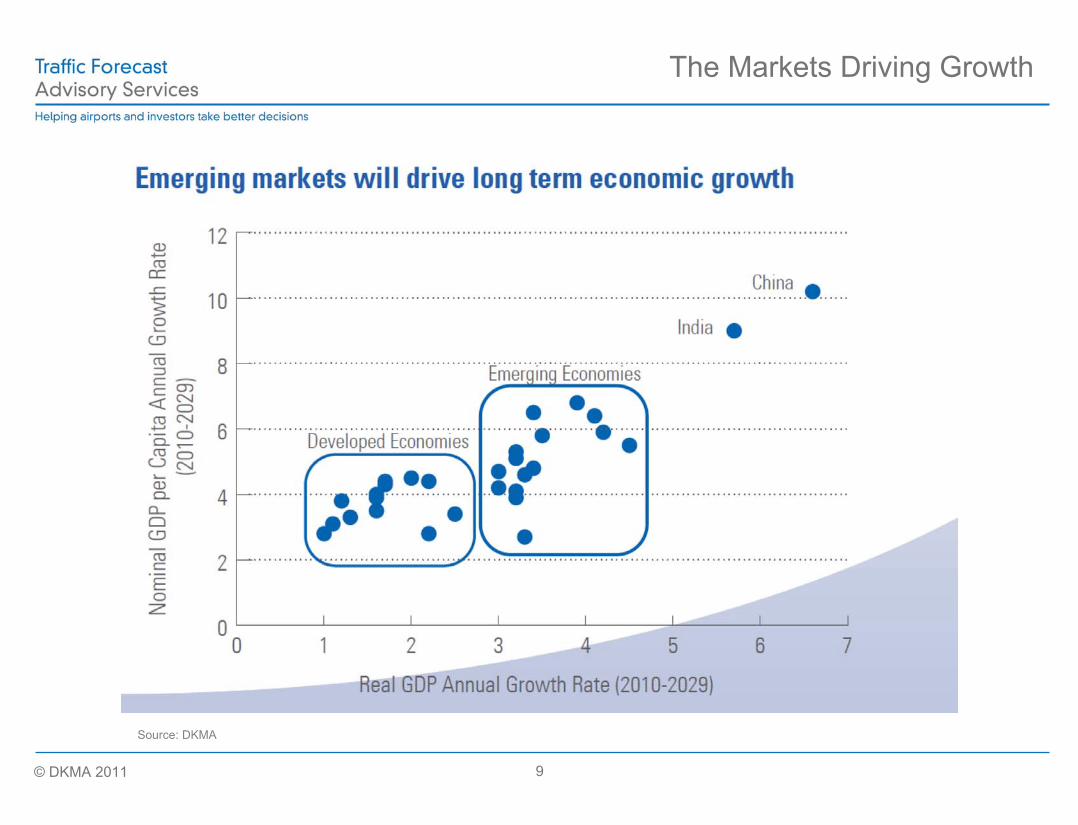
The Markets Driving Growth
Source: DKMA
10© DKMA 2011
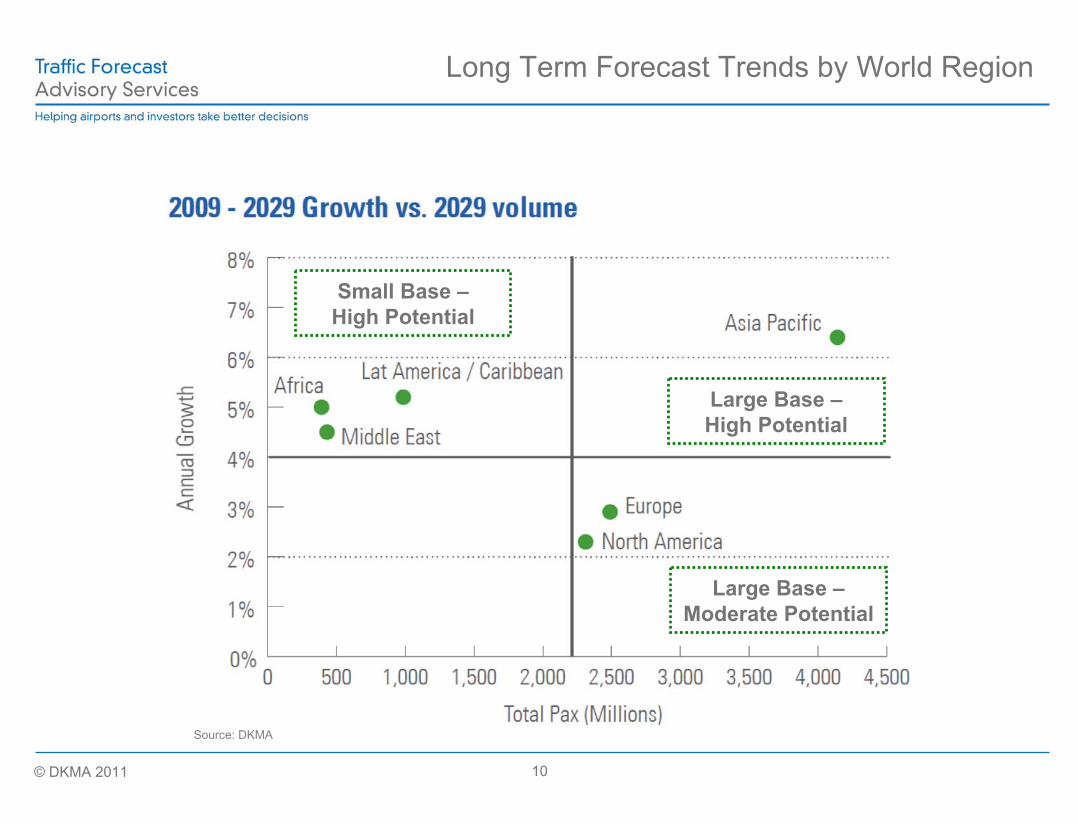
Long Term Forecast Trends by World Region
Small Base –High Potential
Large Base –Moderate Potential
Source: DKMA
Large Base –High Potential
11© DKMA 2011
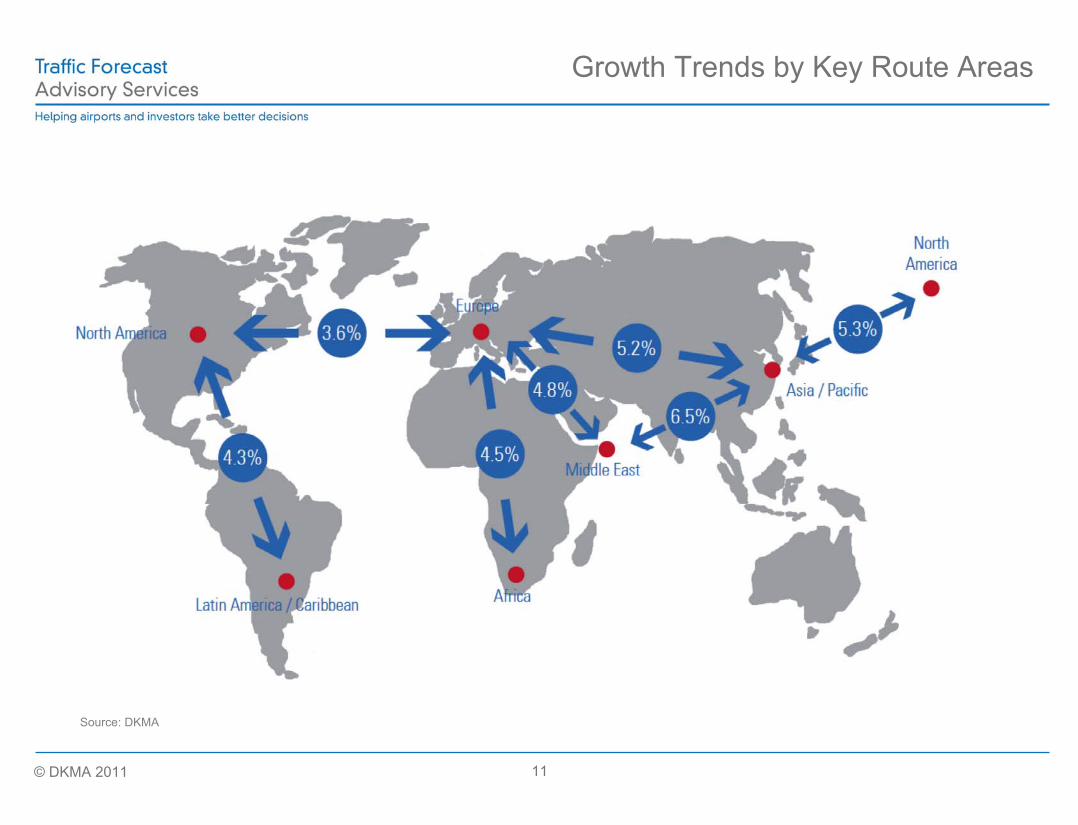
Growth Trends by Key Route Areas
Source: DKMA
12© DKMA 2011
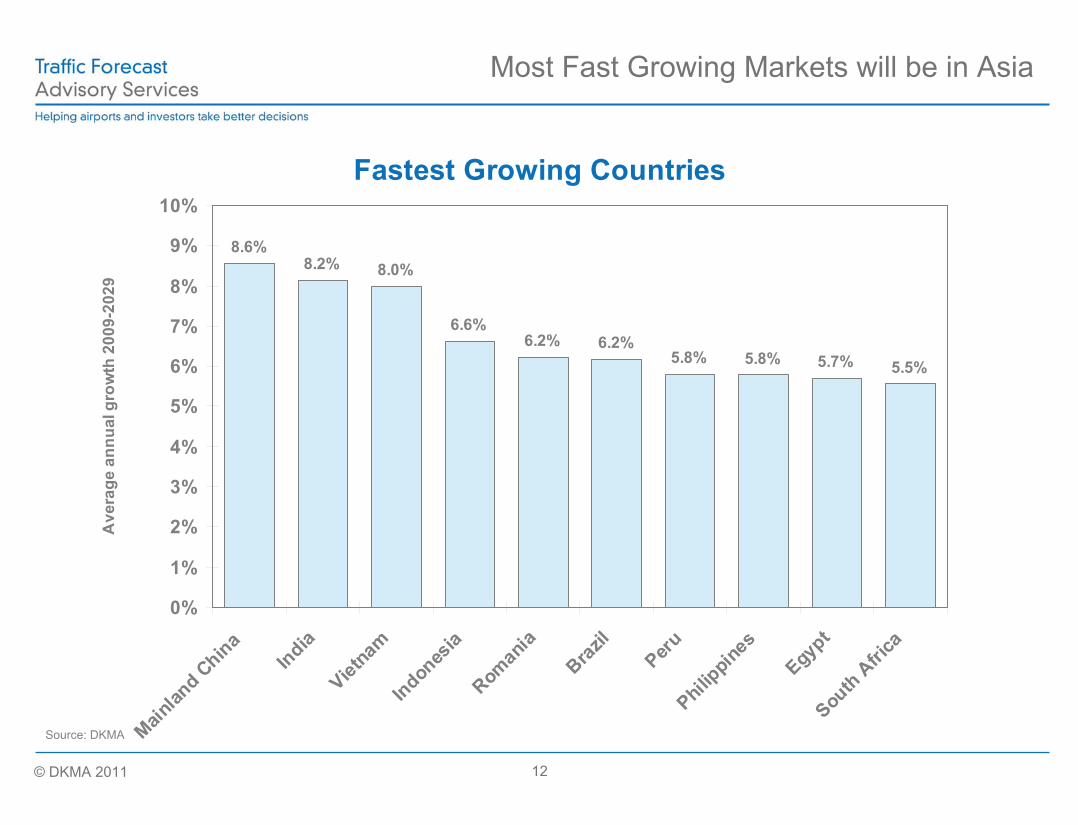
Fastest Growing Countries
8.6%8.2% 8.0%
6.6%6.2% 6.2%
5.8% 5.8% 5.7% 5.5%
0%
1%
2%
3%
4%
5%
6%
7%
8%
9%
10%
Mainlan
d China
IndiaViet
nam
Indones
iaRom
ania
Brazil
PeruPhil
ippines
Egypt
South A
frica
Ave
rage
ann
ual g
row
th 2
009-
2029
Most Fast Growing Markets will be in Asia
Source: DKMA
13© DKMA 2011
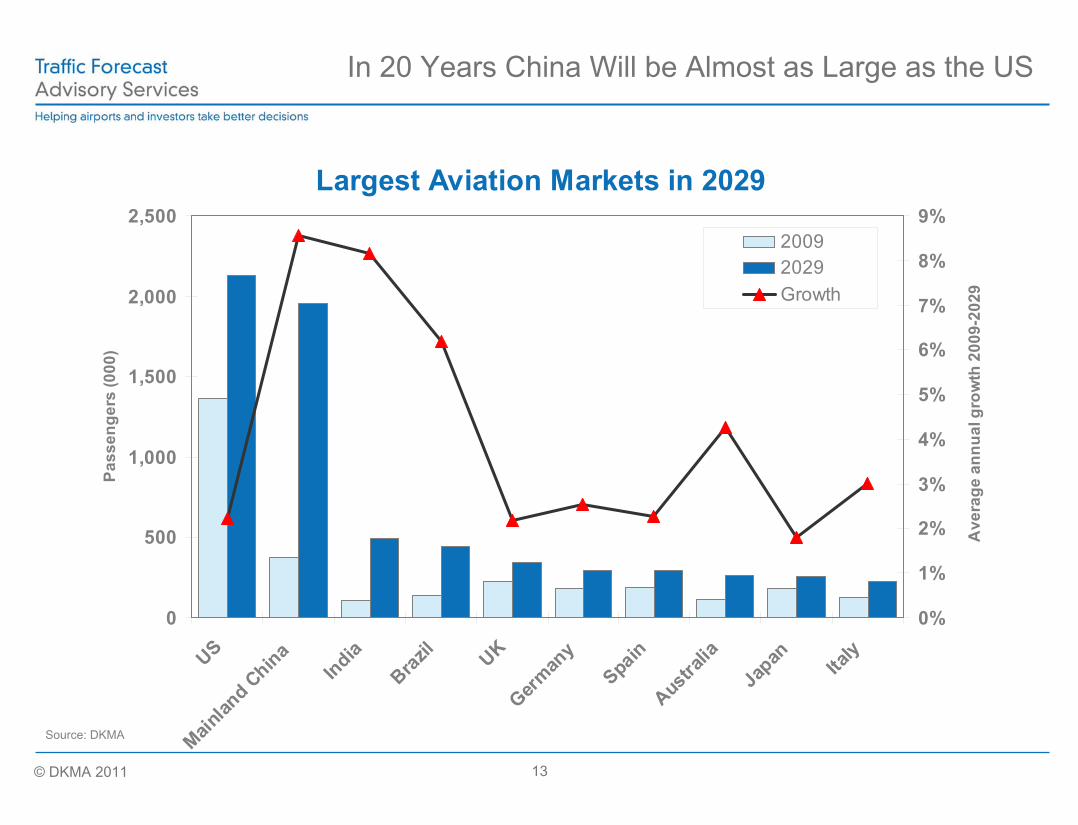
Largest Aviation Markets in 2029
0
500
1,000
1,500
2,000
2,500
USMain
land C
hina
India
Brazil UK
German
y
Spain
Austra
lia
Japan Ita
ly
Pass
enge
rs (0
00)
0%
1%
2%
3%
4%
5%
6%
7%
8%
9%
Ave
rage
ann
ual g
row
th 2
009-
2029
20092029Growth
In 20 Years China Will be Almost as Large as the US
Source: DKMA
14© DKMA 2011
Short Term Forecast
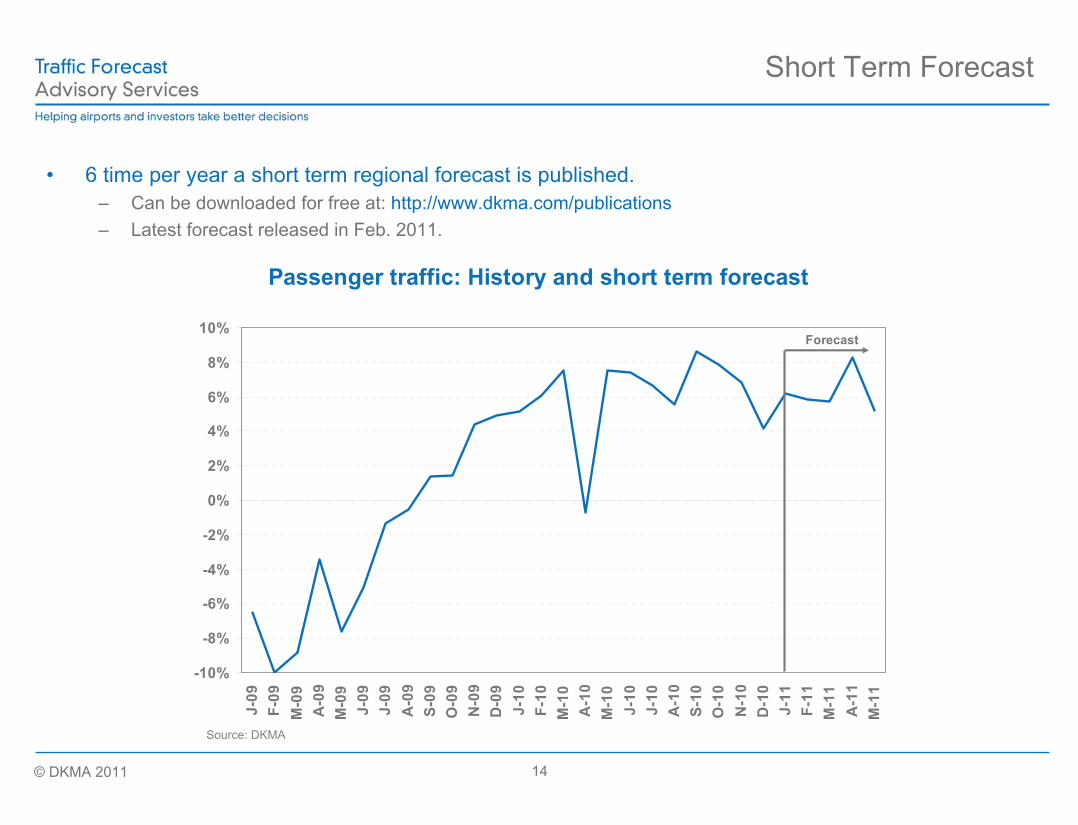
• 6 time per year a short term regional forecast is published.– Can be downloaded for free at: http://www.dkma.com/publications– Latest forecast released in Feb. 2011.
Passenger traffic: History and short term forecast
-10%
-8%
-6%
-4%
-2%
0%
2%
4%
6%
8%
10%
J-09
F-09
M-0
9A
-09
M-0
9J-
09J-
09A
-09
S-09
O-0
9N
-09
D-0
9J-
10F-
10M
-10
A-1
0M
-10
J-10
J-10
A-1
0S-
10O
-10
N-1
0D
-10
J-11
F-11
M-1
1A
-11
M-1
1
Forecast
Source: DKMA
15© DKMA 2011
Short Term Forecast
Source: DKMA
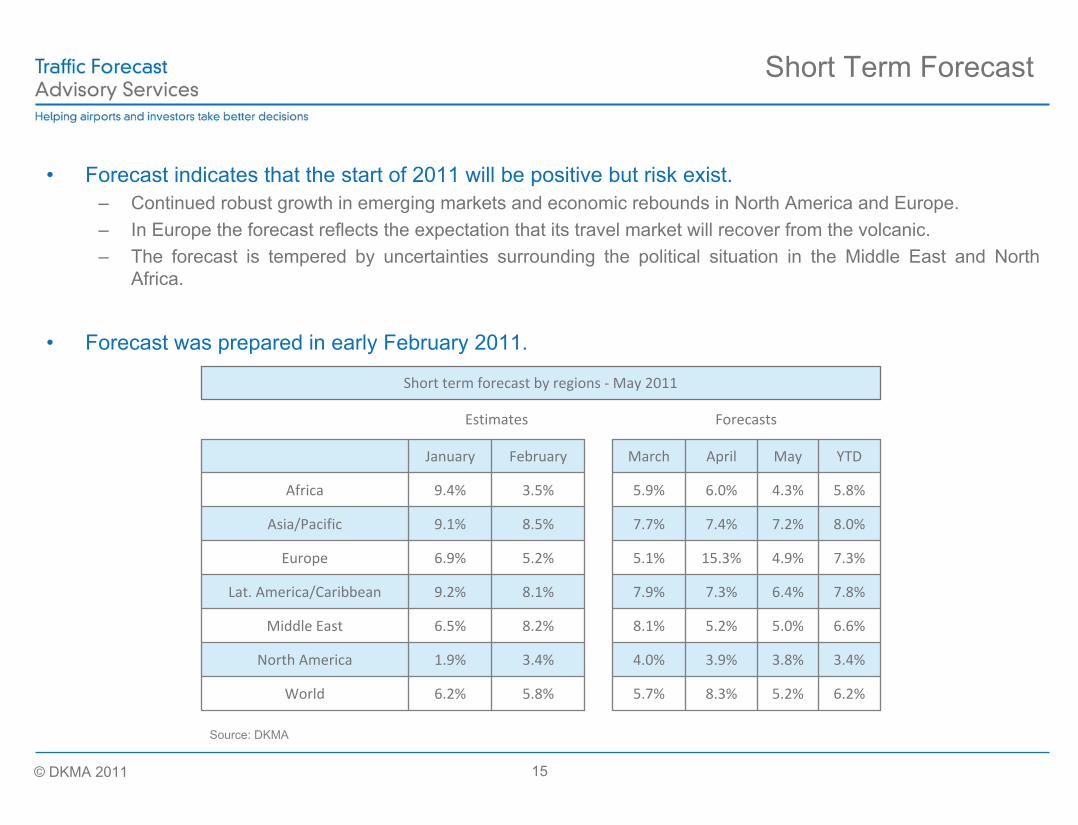
• Forecast indicates that the start of 2011 will be positive but risk exist.– Continued robust growth in emerging markets and economic rebounds in North America and Europe.– In Europe the forecast reflects the expectation that its travel market will recover from the volcanic.– The forecast is tempered by uncertainties surrounding the political situation in the Middle East and North
Africa.
• Forecast was prepared in early February 2011.
6.2%5.2%8.3%5.7%5.8%6.2%World
3.4%3.8%3.9%4.0%3.4%1.9%North America
6.6%5.0%5.2%8.1%8.2%6.5%Middle East
7.8%6.4%7.3%7.9%8.1%9.2%Lat. America/Caribbean
7.3%4.9%15.3%5.1%5.2%6.9%Europe
8.0%7.2%7.4%7.7%8.5%9.1%Asia/Pacific
5.8%4.3%6.0%5.9%3.5%9.4%Africa
YTDMayAprilMarchFebruaryJanuary
ForecastsEstimates
Short term forecast by regions ‐ May 2011
16© DKMA 2011
Catherine Harmel-Tourneur
Director
Tel: +1 450 550 6951E-mail: [email protected]
For more a copy of the short term forecast, information or questions, please contact:
or check our website: www.aci-forecast.aero
Contacts