the achievement initiative end-of-year report
TRANSCRIPT

Bear Valley Unified School District
2018/2019
End-of-Year Report
The Achievement Initiative

© 2019 School Innovations & Achievement. All rights reserved. Proprietary information not for copy or distribution.
The Achievement Initiative
Early Years: Creating a Culture Around Attendance
4
Just in this year alone, you have 43 students that are in danger of reading below grade level by the third grade.
The largest proportion being White students, followed by Hispanic students.
FACT: 83% of students who are chronically absent in Kindergarten and first grade cannot read at grade level by the third grade.
877.954.4357 • www.sia-us.com
* Student count less than 10. Values in this instance will reflect 10, to protect personally identifiable information. Attendance Through: 6/13/2019
Hispanic includes Latino(a). Black includes African American.
51
21
10
30
43
18
9
25
0
10
20
30
40
50
60
All Students
HispanicStudents
BlackStudents*
White Students
KG & 1st Grade Students
Chronic In Danger

© 2019 School Innovations & Achievement. All rights reserved. Proprietary information not for copy or distribution.
The Achievement Initiative
Importance of Attending Class in High School
5
3.0
2.7
2.5
2.3
1.8
0.0
0.5
1.0
1.5
2.0
2.5
3.0
3.5
< 5 Days 5-9 Days 10-14 Days 15-19 Days 20+ Days
Ave
rage
Nin
th G
rad
e G
PA
Ninth Grade Absences
High Scoring Ninth Graders' GPA by Absences
• Absences can have a dramatic impact on high performing students.
• Just 5 days of school missed – excused or unexcused – can dramatically affect a student’s chance for success.
• Even high-performing students are affected by absences – not just average and poor-performing students.
• As little as 5-9 absences a semester can drop a student’s GPA from a 3.0 to a 2.7.
Source: The University of Chicago Consortium on Chicago School Research, Allensworth & Easton, 2007.
877.954.4357 • www.sia-us.com

© 2019 School Innovations & Achievement. All rights reserved. Proprietary information not for copy or distribution.
2018-19 Day Absence Breakdown, by Grade
Data as of 6/13/2019
District Summary
8
© 2019 School Innovations & Achievement. All rights reserved. Proprietary information not for copy or distribution.
The Achievement Initiative
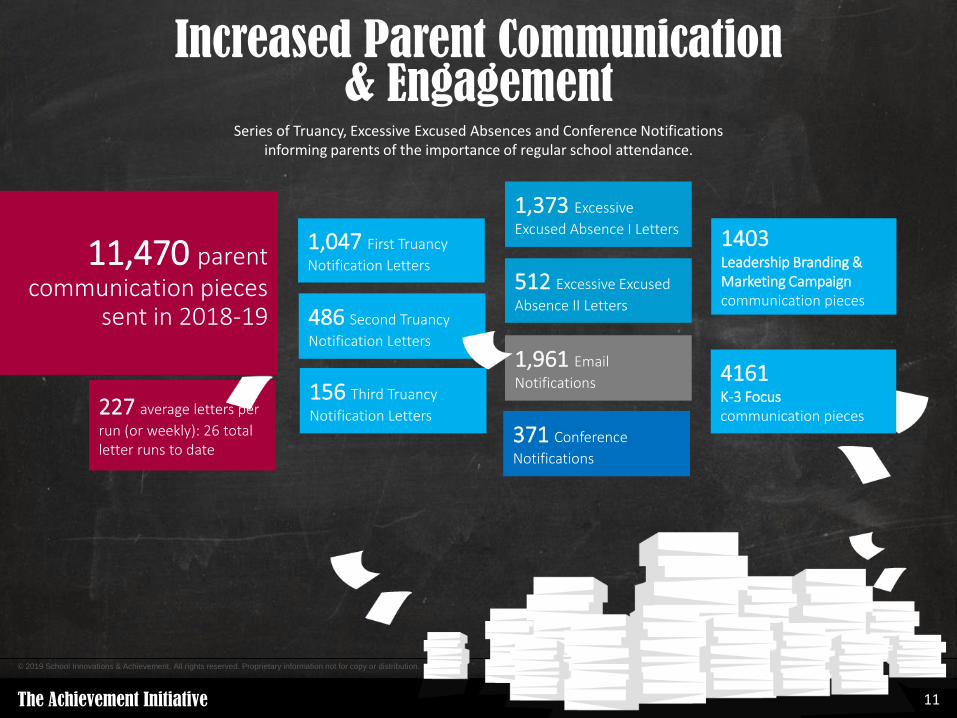
1,961 Email
Notifications 156 Third Truancy
Notification Letters
486 Second Truancy
Notification Letters
1,047 First Truancy
Notification Letters
371 Conference
Notifications
512 Excessive Excused
Absence II Letters
1,373 Excessive
Excused Absence I Letters
227 average letters per
run (or weekly): 26 total letter runs to date
Increased Parent Communication & Engagement
Series of Truancy, Excessive Excused Absences and Conference Notifications informing parents of the importance of regular school attendance.
11,470 parent communication pieces
sent in 2018-19
11
1403 Leadership Branding & Marketing Campaign communication pieces
4161 K-3 Focus communication pieces

© 2019 School Innovations & Achievement. All rights reserved. Proprietary information not for copy or distribution.
The Achievement Initiative
The higher, the better.
2018-19 Overall SaveRate vs. A2A Average
Data as of 6/13/2019 SaveRATE: Defined as the percent of students that do not continue on a path toward chronic absenteeism after an A2A intervention
877.954.4357 • www.sia-us.com
A2A Average SaveRate: 56.2% District Average SaveRate: 59.0%

© 2019 School Innovations & Achievement. All rights reserved. Proprietary information not for copy or distribution.
Truancy Letters Printed Year-over-Year
Data as of 6/13/2019

© 2015 School Innovations & Achievement. All rights reserved. Proprietary information not for copy or distribution.
2018-19 Conference Closed Reasons
877.954.4357 • www.sia-us.com
Data as of 6/17/2019

Measuring the Right Things Districtwide, Grade, and
School Site Absence Summaries

State of Attendance
Before we look at our year-over-year data…
Factors impacting attendance statewide and nationwide
28
Political Climate: Immigration
concerns or fears (ICE/DACA)
Weather: Flooding, fires,
smoke/air quality Illness:
Flu outbreaks, norovirus
School Safety: Increased threats
(either false or real), current
events
© 2019 School Innovations & Achievement. All rights reserved. Proprietary information not for copy or distribution.
The Achievement Initiative
2 3 4 5 6 1 2 3 1 2 3 4 5
9 10 11 12 13 6 7 8 9 10 3 4 5 6 7 8 9 10 11 12
16 17 18 19 20 13 14 15 16 17 10 11 12 13 14 15 16 17 18 19
23 24 25 26 27 20 21 22 23 24 17 18 19 20 21 22 23 24 25 26
30 31 27 28 29 30 31 24 25 26 27 28 29 30 31
1 2 1 2 3 4 1
5 6 7 8 9 3 4 5 6 7 7 8 9 10 11 4 5 6 7 8
12 13 14 15 16 10 11 12 13 14 14 15 16 17 18 11 12 13 14 15
19 20 21 22 23 17 18 19 20 21 21 22 23 24 25 18 19 20 21 22
26 27 28 29 30 24 25 26 27 28 28 29 30 31 25 26 27 28
31
1 1 2 3 4 5 1 2 3
4 5 6 7 8 8 9 10 11 12 6 7 8 9 10 3 4 5 6 7
11 12 13 14 15 15 16 17 18 19 13 14 15 16 17 10 11 12 13 14
18 19 20 21 22 22 23 24 25 26 20 21 22 23 24 17 18 19 20 21
25 26 27 28 29 29 30 27 28 29 30 31 24 25 26 27 28
172.3 178.5 164.7 171.2 174.5 127.8 103.0 98.4 100.0
147.2 141.4 103.2 120.7 137.8 Holiday 216.1 183.0 149.0
170.5
124.2 93.2 99.9
112.7 88.8 91.8
279.2 161.7
Holiday
Holiday Holiday Holiday Holiday
76.7
Holiday
Holiday
138.7 106.3 114.0 191.3 262.3
131.1 100.7 100.8 101.3 118.2 108.8
121.0
Holiday Holiday
147.8 136.0 111.0 120.2 163.0
127.8 73.0 69.7 99.3 Holiday
Holiday Holiday
182.2 Holiday
Holiday 146.0 116.2
161.5
263.2
128.1 109.8 92.2 103.2 102.8
128.1 42.2 105.3 100.8 132.9 Holiday
91.9 92.7 123.7
94.2 81.6 102.8 118.8
53.5 51.8
135.2 123.2 119.7 136.5
129.0 115.6 151.9 169.3
165.7
113.8
159.7 93.5 99.0 109.4 151.2
145.4 95.0
Holiday Holiday Holiday
110.7 94.0
Holiday
133.3
Holiday Holiday Holiday Holiday Holiday
149.6 139.2 190.4 128.4 177.4
171.7 3.0 135.0 154.7 158.9
133.6 Holiday Holiday
Holiday
March 2019 April 2019 May 2019
154.5
248.4 124.7 120.3 108.0 131.7 163.7
196.7 193.2 195.3 202.7
Holiday Holiday Holiday
136.0 145.5 134.3 183.2 323.8
149.6 172.2 Holiday Holiday Holiday
132.7 104.6 106.3 123.5 151.7
Holiday 129.8 135.7 158.3 171.8
207.7 156.8
Holiday Holiday Holiday
102.4 101.8 97.2 96.0 131.5 125.1 106.8 113.3
138.0 89.3
Holiday Holiday87.3 83.2 102.7 86.9
95.1 90.0 140.8 109.7 109.7 100.5 126.8
81.9 100.7 129.1
Holiday Holiday Holiday Holiday Holiday124.2 100.9 99.5 105.8
108.2 107.0 132.2 145.5
July 2018 August 2018 September 2018 October 2018
November 2018 December 2018 January 2019 February 2019
118.0
109.3
June 2019
127.1 93.2
Holiday
35.3 54.3
65.2 50.0 60.7 70.0 105.8
120.1
95.8
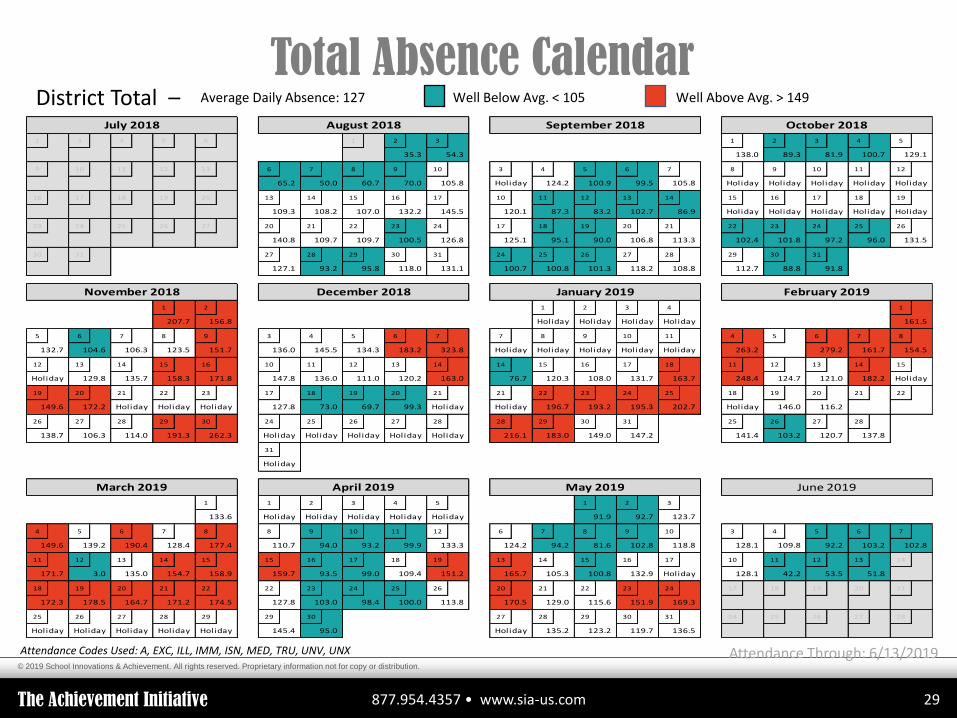
Total Absence Calendar
877.954.4357 • www.sia-us.com 29
District Total – Average Daily Absence: 127 Well Below Avg. < 105 Well Above Avg. > 149
Attendance Through: 6/13/2019 Attendance Codes Used: A, EXC, ILL, IMM, ISN, MED, TRU, UNV, UNX

© 2019 School Innovations & Achievement. All rights reserved. Proprietary information not for copy or distribution.
The Achievement Initiative
1.5%
10.0%
32.6%
45.5%
10.4%
Data as of 6/13/2019
877.954.4357 • www.sia-us.com
2018-19 Total Absence Summary
• 55.92% (1,332) of your students fall in the Excellent and Satisfactory groups. • 44.08% (1,050) of your students have missed more than 9.0 days of school.
Severe Chronic (>20%)
36.0+ days missed 35 students
Chronic (10%-19.99%)
18.0-36.0 days missed 238 students
Manageable (5%-9.99%)
9.0-18.0 days missed 777 students Satisfactory
(1%-4.99%) 1.8-9.0 days missed
1,084 students
Excellent (<1%)
< 1.8 days missed 248 students

Grade and School Site Absence Summary

© 2019 School Innovations & Achievement. All rights reserved. Proprietary information not for copy or distribution.
The Achievement Initiative
Data as of 6/13/2019 A2A Truant - A student who has accumulated the equivalent of three or more full days of unexcused absences.
877.954.4357 • www.sia-us.com
2018-19 District A2A Truancy Rates vs. A2A Average

© 2019 School Innovations & Achievement. All rights reserved. Proprietary information not for copy or distribution.
The Achievement Initiative
2018-19 District EEA Rates vs.
A2A Average
Data as of 6/13/2019 Excessively Excused - A student who has accumulated the equivalent of seven or more full day of excused absences.
The lower, the better.
877.954.4357 • www.sia-us.com

© 2019 School Innovations & Achievement. All rights reserved. Proprietary information not for copy or distribution.
The Achievement Initiative
2018-19 District A2A Chronic Rates vs. A2A Average The lower, the better.
Data as of 6/13/2019 Chronically Absent - A student who is absent for 10% or more of the school year due to all absences.
877.954.4357 • www.sia-us.com

Goals Moving Forward Nationally, 83% of students chronically absent in kindergarten and first grade cannot read on-level by third grade.
• In BVUSD over 43% of our TK – 2nd grade student are absent more than 10 days. – Fall Focus on A2A conferences for grades K – 2
• Improve the number of A2A conferences held at school sites from 38.5% to 50%.
– Recognizing that attendance will be addressed at Individual Education Plans, 504’s and Student Study Team’s and School Attendance Review Teams.
• District will provide a monthly update from A2A for our principals
• “Turn November Green” where each school will have a plan with incentives to improve daily attendance in November.
– That’s a student every 26 seconds – or 7,000 a day
• High school dropouts are NOT eligible for 90% of the jobs in America

Goals Moving Forward
• District will meet with school sites monthly with a focus on students in the “Manageable” group. The goal will be to brainstorm strategies and decrease number of days missed to less than 10 for 25% of the “Manageable” group.
• Notification letters to our families regarding their student’s attendance have been modified with a focus on the importance of their student’s attendance and a friendlier tone.
• The Student Attendance Review Team (SART) contract has been updated and now encourages our teams to use additional interventions to improve attendance.
• Student Attendance Incentive programs will be implemented at each site to improve attendance.
– That’s a student every 26 seconds – or 7,000 a day
• High school dropouts are NOT eligible for 90% of the jobs in America
