the accion camel - center for financial inclusion blog
TRANSCRIPT

The ACCIONCAMEL
Technical Note

This work was supported by the U.S. Agency for International Development, Global Bureau,Economic Growth Section, Microenterprise Development Office, through funding to theMicroenterprise Best Practices (MBP) Project, contract number: PCE-C-00-96-90004-00.
The ACCION CAMEL
Technical Note
by
Sonia B. SaltzmanDarcy Salinger
ACCION International
September 1998

Sonia B. Saltzman was Vice President for Research and Development for ACCION International in Somerville,Massachusetts. For 10 years, she headed the Financial Services Department, which houses the various fundsmanaged by ACCION including the U.S. and Latin America Bridge Funds and the Gateway Fund. Ms. Saltzman hasbeen involved in the ACCION CAMEL process since its inception in 1993.
Darcy Salinger is Director of Financial Analysis for ACCION International in Somerville, Massachusetts. A memberof the ACCION staff since 1986, she has worked in the areas of grants management, management of ACCION’s U.S.and Latin America Bridge Funds, and credit and investment analysis. Ms. Salinger has participated in severalACCION CAMEL evaluations.

Acknowledgments
i
ACKNOWLEDGMENTS
We wish to express our appreciation to the many people who assisted in the writing of thisTechnical Note. Several ACCION International colleagues generously contributed theirideas and experience to its preparation including Carlos Castello, Vice President, LatinAmerica Operations, who has managed the CAMEL process since its inception; Cesar Lopez,Senior Director, Latin America Operations, who has led many CAMEL evaluations; andRachel Rock, coauthor of ACCION’s Discussion Paper on the CAMEL instrument. Liliande Rivas, Carolina Novoa, and Juan Carlos Diaz, our colleagues at Centro ACCION,Colombia, who make up the CAMEL team, also worked closely with us throughout thepreparation of this document. We also gratefully acknowledge the contribution of MariaOtero, Executive Vice President, who so ably guided our writing. Our thanks as well toSusana Barton, Senior Director of Organizational Development, and Julie Gerschick,research intern to ACCION, for their contributions.
We owe enormous gratitude to Robert P. Christen, Director of the Microfinance Program atthe Economics Institute in Boulder, Colorado, who developed the first version of theACCION CAMEL Technical Note in 1992 in response to ACCION’s request for a financialassessment instrument for microfinance institutions. Mr. Christen has been key in assistingACCION in the application and evolution of the CAMEL instrument. Finally, without thesupport, patience, and feedback of the ACCION affiliates in Latin America who allowed theapplication and evolution of the CAMEL instrument, this document would not have beenpossible. Any errors or omissions are solely the responsibility of the authors.

iii
TABLE OF CONTENTS
EXECUTIVE SUMMARY vii
CHAPTER ONEINTRODUCTION 1
HISTORY OF THE ACCION CAMEL................................................................................ 1CHALLENGES TO DEVELOPING, APPLYING, AND DISSEMINATING THE CAMEL ................ 2ACCION’S CAMEL AND ESTABLISHING MICROFINANCE STANDARDS............................. 3
CHAPTER TWOCAMEL: OVERVIEW, PURPOSE, AND SCOPE 5
WHAT CAMEL DOES NOT MEASURE .............................................................................. 5WHAT CAMEL DOES MEASURE ...................................................................................... 7COMPONENTS OF THE CAMEL INSTRUMENT .................................................................... 8CAMEL RATING ........................................................................................................... 12HOW THE ACCION CAMEL DIFFERS FROM THE ORIGINAL CAMEL............................. 13
CHAPTER THREEAPPLICATION OF THE ACCION CAMEL 17
NECESSARY CONDITIONS FOR AN EFFECTIVE CAMEL.................................................... 17Transparency and Availability of Information.................................................... 17Trust.................................................................................................................. 18Availability of Staff for Interviews .................................................................... 18Appropriate Mix of Team Member Skills .......................................................... 18
LEVEL OF EFFORT .......................................................................................................... 18TEAM COMPOSITION ...................................................................................................... 19DIVISION OF LABOR AND PROCESS ................................................................................. 20THE REPORT .................................................................................................................. 21CHALLENGES TO APPLICATION ....................................................................................... 22
CHAPTER FOURCAMEL INFORMATION AND ADJUSTMENTS 25
INFORMATION REQUIRED FROM INSTITUTION ................................................................. 25Financial Statements and the Adjusted CAMEL Format .................................... 26Programmatic Information................................................................................. 27
CAMEL ADJUSTMENTS................................................................................................. 28Adjusting for the Scope of Microfinance Activity .............................................. 29Adjusting the Loan Loss Provision .................................................................... 29Adjusting Loan Write-Offs ................................................................................ 31
iv
Adjusting for Explicit and Implicit Subsidies ..................................................... 32Adjusting for the Effects of Inflation.................................................................. 33Adjusting for Accrued Interest Income .............................................................. 33
CHAPTER FIVECAMEL SCORING 35
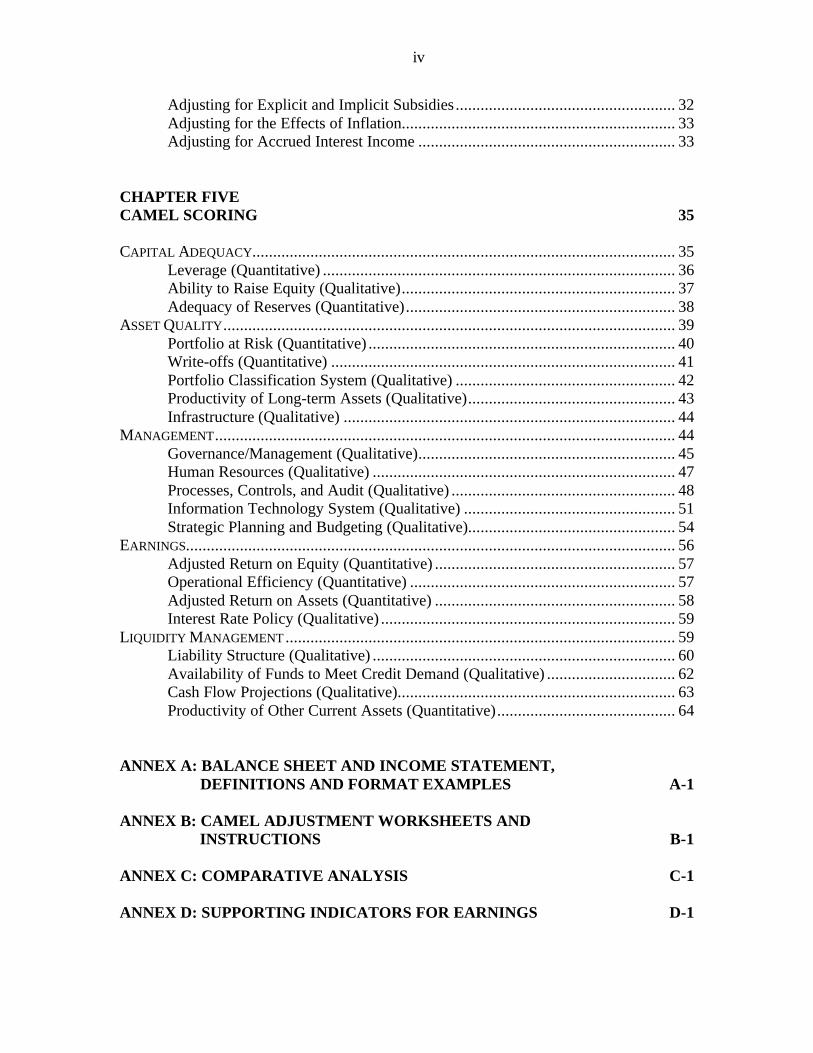
CAPITAL ADEQUACY...................................................................................................... 35Leverage (Quantitative) ..................................................................................... 36Ability to Raise Equity (Qualitative).................................................................. 37Adequacy of Reserves (Quantitative)................................................................. 38
ASSET QUALITY............................................................................................................. 39Portfolio at Risk (Quantitative) .......................................................................... 40Write-offs (Quantitative) ................................................................................... 41Portfolio Classification System (Qualitative) ..................................................... 42Productivity of Long-term Assets (Qualitative).................................................. 43Infrastructure (Qualitative) ................................................................................ 44
MANAGEMENT............................................................................................................... 44Governance/Management (Qualitative).............................................................. 45Human Resources (Qualitative) ......................................................................... 47Processes, Controls, and Audit (Qualitative) ...................................................... 48Information Technology System (Qualitative) ................................................... 51Strategic Planning and Budgeting (Qualitative).................................................. 54
EARNINGS...................................................................................................................... 56Adjusted Return on Equity (Quantitative) .......................................................... 57Operational Efficiency (Quantitative) ................................................................ 57Adjusted Return on Assets (Quantitative) .......................................................... 58Interest Rate Policy (Qualitative) ....................................................................... 59
LIQUIDITY MANAGEMENT .............................................................................................. 59Liability Structure (Qualitative) ......................................................................... 60Availability of Funds to Meet Credit Demand (Qualitative) ............................... 62Cash Flow Projections (Qualitative)................................................................... 63Productivity of Other Current Assets (Quantitative)........................................... 64
ANNEX A: BALANCE SHEET AND INCOME STATEMENT, DEFINITIONS AND FORMAT EXAMPLES A-1
ANNEX B: CAMEL ADJUSTMENT WORKSHEETS AND INSTRUCTIONS B-1
ANNEX C: COMPARATIVE ANALYSIS C-1
ANNEX D: SUPPORTING INDICATORS FOR EARNINGS D-1

v
LIST OF TABLES AND FIGURES
Table Page
1 CAMEL Indicators with Weightings 102 Ratios Used to Determine CAMEL Quantitative Indicators 113 ACCION CAMEL Provisioning Rates 304 Example of Gap Ratio Calculation Matrix 61
Figure
1 CAMEL Analysis Process 9

Executive Summary
vii
EXECUTIVE SUMMARY
The CAMEL methodology was originally adopted by North American bank regulators toevaluate the financial and managerial soundness of U.S. commercial lending institutions. TheCAMEL reviews and rates five areas of financial and managerial performance: CapitalAdequacy, Asset Quality, Management, Earnings, and Liquidity Management. Asmicrofinance institutions (MFIs) increasingly reach out to formal financial markets to accesscapital, there is a need for a similar tool to gather and evaluate data on the performance ofMFIs. Based on the conceptual framework of the original CAMEL, ACCION developed itsown instrument. Although the ACCION CAMEL reviews the same five areas as the originalCAMEL, the indicators and ratings used by ACCION reflect the unique challenges andconditions facing the microfinance industry. To date, ACCION has used its CAMELprimarily as an internal assessment tool, which has contributed to setting performancestandards both for the ACCION Network and for the microfinance industry as a whole.
The ACCION CAMEL analyzes and rates 21 key indicators, with each indicator given anindividual weighting. Eight quantitative indicators account for 47 percent of the rating, and13 qualitative indicators make up the remaining 53 percent. The final CAMEL compositerating is a number on a scale of zero to five, with five as the measure of excellence. Thisnumerical rating, in turn, corresponds to an alphabetical rating (AAA, AA, A; BBB, BB, B;C; D; and not rated).
CAMEL INFORMATION AND ADJUSTMENTS
The MFI is required to gather the following information for a CAMEL examination: (1)financial statements; (2) budgets and cash flow projections; (3) portfolio aging schedules ;(4) funding sources; (5) information about the board of directors; (6) operations/staffing; and(7) macroeconomic information.
Financial statements form the basis of the CAMEL’s quantitative analysis. MFIs are requiredto present audited financial statements from the last three years and interim statements for themost recent 12-month period. The other required materials provide programmaticinformation and show the evolution of the institution. These documents demonstrate toCAMEL analysts the level and structure of loan operations and the quality of the MFI’sinfrastructure and staffing.
Once the financial statements have been compiled, adjustments need to be made. Theseadjustments serve two purposes: first, they place the MFI’s current financial performance inthe context of a financial intermediary; second, they enable comparisons among the differentinstitutions in the industry. The CAMEL performs six adjustments, for the scope of

Microenterprise Best Practices Development Alternatives, Inc.
viii
microfinance activity, loan loss provision, loan write-offs, explicit and implicit subsidies,effects of inflation, and accrued interest income.1
CAMEL SCORING
Based on the results of the adjusted financial statements and interviews with the MFI’smanagement and staff, a rating of one to five is assigned to each of the CAMEL’s 21indicators and weighted accordingly. A definition of each area and the criteria ranges fordetermining each rating are as follows.2
# Capital Adequacy. The objective of the capital adequacy analysis is to measure thefinancial solvency of an MFI by determining whether the risks it has incurred areadequately offset with capital and reserves to absorb potential losses. One indicator isleverage, which illustrates the relationship between the risk-weighted assets of the MFIand its equity. Another indicator, ability to raise equity, is a qualitative assessment of anMFI’s ability to respond to a need to replenish or increase equity at any given time. Athird indicator, adequacy of reserves, is a quantitative measure of the MFI’s loan lossreserve and the degree to which the institution can absorb potential loan losses.
# Asset Quality. The analysis of asset quality is divided into three components: portfolioquality, portfolio classification system, and fixed assets. Portfolio quality includes twoquantitative indicators: portfolio at risk, which measures the portfolio past due over 30days; and write-offs/write-off policy, which measures the MFI’s adjusted write-offs basedon CAMEL criteria. Portfolio classification system entails reviewing the portfolio’s agingschedules and assessing the institution’s policies associated with assessing portfolio risk.Under fixed assets, one indicator is the productivity of long-term assets, which evaluatesthe MFI’s policies for investing in fixed assets. The other indicator concerns theinstitution’s infrastructure, which is evaluated to determine whether it meets the needs ofboth staff and clients.
# Management. Five qualitative indicators make up this area of analysis: governance;human resources; processes, controls, and audit; information technology system; andstrategic planning and budgeting. Governance focuses on how well the institution’sboard of directors functions, including the diversity of its technical expertise, itsindependence from management, and its ability to make decisions flexibly andeffectively. The second indicator, human resources, evaluates whether the department ofhuman resources provides clear guidance and support to operations staff, includingrecruitment and training of new personnel, incentive systems for personnel, andperformance evaluation system. The third indicator, processes, controls, and audit,focuses on the degree to which the MFI has formalized key processes and theeffectiveness with which it controls risk throughout the organization, as measured by its
1 Annex B of the Technical Note comprises examples of CAMEL adjustment worksheets and step-by-step
instructions.2 Annex C of the Technical Note provides CAMEL ratings for 28 MFIs from different parts of the world for
comparative analysis.

Executive Summary
ix
control environment and the quality of its internal and external audit. The fourthindicator, information technology system, assesses whether computerized informationsystems are operating effectively and efficiently, and are generating reports formanagement purposes in a timely and accurate manner. This analysis reviews theinformation technology environment and the extent and quality of the specificinformation technology controls. The fifth indicator, strategic planning and budgeting,looks at whether the institution undertakes a comprehensive and participatory process forgenerating short- and long-term financial projections and whether the plan is updated asneeded and used in the decision-making process.
# Earnings. The ACCION CAMEL chooses three quantitative and one qualitativeindicator to measure the profitability of MFIs: adjusted return on equity, operationalefficiency, adjusted return on assets, and interest rate policy. Adjusted return on equity(ROE) measures the ability of the institution to maintain and increase its net worththrough earnings from operations. Operational efficiency measures the efficiency of theinstitution and monitors its progress toward achieving a cost structure that is closer to thelevel achieved by formal financial institutions. Adjusted return on assets (ROA)measures how well the MFI’s assets are utilized, or the institution’s ability to generateearnings with a given asset base. CAMEL analysts also study the MFI’s interest ratepolicy to assess the degree to which management analyzes and adjusts the institution’sinterest rates on microenterprise loans (and deposits if applicable), based on the cost offunds, profitability targets, and macroeconomic environment.
# Liquidity Management. The fifth area of the ACCION CAMEL evaluates the MFI’sability to accommodate decreases in funding sources and increases in assets and to payexpenses at a reasonable cost. Indicators in this area are liability structure, availability offunds to meet credit demand, cash flow projections, and productivity of other currentassets. Under liability structure, CAMEL analysts review the composition of theinstitution’s liabilities, including their tenor, interest rate, payment terms, and sensitivityto changes in the macroeconomic environment. The types of guarantees required oncredit facilities, sources of credit available to the MFI, and the extent of resourcediversification are analyzed as well. This indicator also focuses on the MFI’s relationshipwith banks in terms of leverage achieved based on guarantees, the level of credibility theinstitution has with regard to the banking sector, and the ease with which the institutioncan obtain funds when required. Availability of funds to meet credit demands measuresthe degree to which the institution has delivered credit in a timely and agile manner.Cash flow projections evaluate the degree to which the institution is successful inprojecting its cash flow requirements. The analysis looks at current and past cash flowprojections prepared by the MFI to determine whether they have been prepared withsufficient detail and analytical rigor and whether past projections have accuratelypredicted cash inflows and outflows. Productivity of other current assets focuses on themanagement of current assets other than the loan portfolio, primarily cash and short-terminvestments. The MFI is rated on the extent to which it maximizes the use of its cash,bank accounts, and short-term investments by investing in a timely fashion and at thehighest returns, commensurate with its liquidity needs.

Chapter One—Introduction
1
CHAPTER ONEINTRODUCTION
HISTORY OF THE ACCION CAMEL
CAMEL is an acronym for five measurements of a financial institution: Capital adequacy,Asset quality, Management, Earnings, and Liquidity management. CAMEL was createdinitially to enable North American bank regulators to measure the financial and managerialsoundness of U.S. commercial lending institutions using key ratios, indicators, andinstitutional policies and procedures.1
Beginning in the 1980s, ACCION2 and its network of affiliate institutions in Latin Americarecognized an increasing need to access capital from formal financial markets to achievemassive client outreach. A significant first step in meeting this need was the establishment in1984 of the Latin American Bridge Fund, a guarantee fund for ACCION affiliates to securelines of credit from local commercial lending institutions. As affiliates began to make use ofthe Bridge Fund and deal directly with bankers, it became clear that they required recognizedfinancial performance measurements to demonstrate the health of their institutions.Moreover, the directors of the ACCION affiliates needed this financial performanceinformation to manage their institutions successfully. ACCION International also requiredthis information to provide quality control for its network and to better focus its technicalassistance efforts.
In response to this demand for financial performance information, ACCION held a series offinancial management workshops to train microfinance managers. ACCION and its affiliates,however, continued to lack a tool for efficiently and effectively gathering the appropriatefinancial ratios. In 1992, ACCION International designed a financial assessment instrumentfor use by microfinance institutions that took the original North American CAMEL as itsconceptual framework.3 ACCION’s CAMEL reviews the same five areas of financial andmanagerial performance as the original CAMEL, but the indicators used by ACCION
1 In 1978 the Federal Financial Institutions Examination Council, which includes senior management officials
from several U.S. regulatory agencies—the Office of the Comptroller of the Currency, the Federal Reserve,the Federal Deposit Insurance Corporation, the Office of Thrift Supervision, and the National Credit UnionAssociation—decided to design a standardized rating system. These agencies adopted the CAMEL in 1979.In 1996, the CAMEL was revised to include an “S” for Sensitivity to market risk.This chapter, on the ACCION CAMEL, draws from ACCION International’s discussion paper no. 7,Performance and Standards in Microfinance: ACCION’s Experience with the CAMEL Instrument (1998),written by Sonia B. Saltzman, Rachel Rock, and Darcy Salinger.
2 ACCION International is a nonprofit institution based in Somerville, Massachusetts, founded in l961, anddedicated exclusively to microfinance. Its network of affiliates includes both NGOs and regulated financialinstitutions, totaling 14 and 4, respectively as of December 31, 1997. The total number of clients and totalloan portfolio of the ACCION affiliates stood at 341,000 and $226 million, respectively, as of December 31,1997.
3 ACCION International commissioned Robert P. Christen, a financial consultant with many years ofexperience in the microfinance field and a former ACCION staff member, to design the financial evaluationinstrument.

Microenterprise Best Practices Development Alternatives, Inc.
2
respond to the specific challenges facing the microfinance industry. Additionally, theACCION ranges for rating each area and its indicators reflect the characteristics of thisindustry.
The ACCION CAMEL was presented to the ACCION network at its annual Director’sConference in 1993. At that time, working groups consisting of affiliate directors andACCION staff discussed issues related to the content, application, and dissemination of theCAMEL. This process gave ACCION affiliates a formal opportunity to approve the use ofthe CAMEL and to participate in its development. The Conference established a foundationof mutual collaboration, which has proven essential to deploying the CAMEL analysis.
CHALLENGES TO DEVELOPING, APPLYING, AND DISSEMINATING THE CAMEL
The first challenge in the development of the ACCION CAMEL instrument was to define thekey variables to assess the performance of a microfinance institutions and to decide how tomeasure these variables. For example, in assessing the quality of a microfinance loanportfolio, the key variables identified were the delinquency and write-off rates, and theportfolio classification system. How to measure these variables represented anotherchallenge. For example, the concept of contaminated portfolio,4 rather than payments pastdue, was selected as a measure of portfolio quality, with a period of 30 days past dueconsidered as the relevant cut-off point for measuring the contaminated portfolio. In selectingthe key indicators, it was also important to identify independent variables.
Defining the standards to measure the financial performance of microfinance institutions wasthe second significant challenge in the development of the ACCION CAMEL instrument. Nodatabase of information existed that defined an expected and realistic level of financialperformance for microfinance institutions. Christen and ACCION based the initial standardranges on available information. Then, a series of three pilot applications of the CAMELwere completed, after which revisions were made to the instrument. In the last four years,ACCION has continued to make significant progress in refining these standards, but theeffort is ongoing.
The first major challenge to applying the CAMEL was the availability and accessibility ofinformation. Because of the CAMEL’s rigorous information requirements which initiallyincluded five year’s worth of financial and programmatic information, relativelysophisticated management information systems (MIS) become essential.5 In many cases,such MIS were nonexistent. In some cases where the microfinance institution (MFI) mayhave had the MIS capacity, its staff was unaccustomed to extracting the information neededfor the CAMEL examination. ACCION affiliates have made significant progress inovercoming this challenge, but efforts are underway to further streamline the informationgathering process.
4 Contaminated portfolio represents the principal value of loans that have payments over 30 days past due.5 The ACCION CAMEL currently includes three years of audited financials plus the most recent interim
statement.
Chapter One—Introduction
3
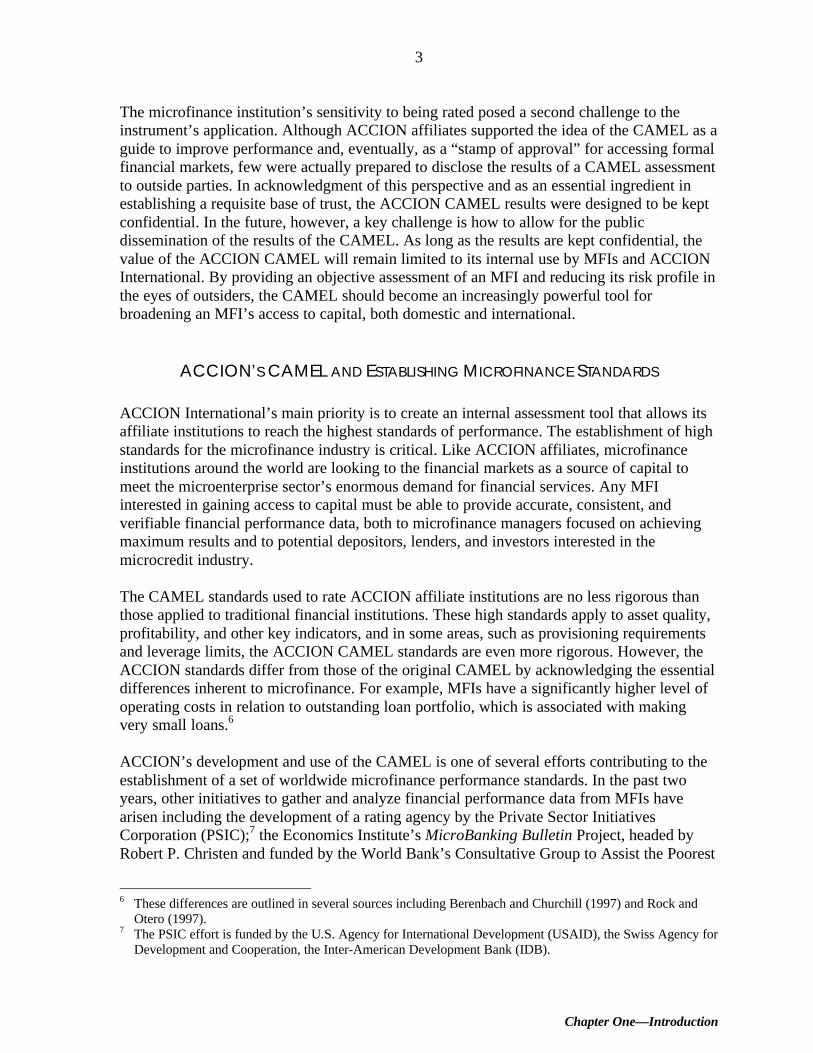
The microfinance institution’s sensitivity to being rated posed a second challenge to theinstrument’s application. Although ACCION affiliates supported the idea of the CAMEL as aguide to improve performance and, eventually, as a “stamp of approval” for accessing formalfinancial markets, few were actually prepared to disclose the results of a CAMEL assessmentto outside parties. In acknowledgment of this perspective and as an essential ingredient inestablishing a requisite base of trust, the ACCION CAMEL results were designed to be keptconfidential. In the future, however, a key challenge is how to allow for the publicdissemination of the results of the CAMEL. As long as the results are kept confidential, thevalue of the ACCION CAMEL will remain limited to its internal use by MFIs and ACCIONInternational. By providing an objective assessment of an MFI and reducing its risk profile inthe eyes of outsiders, the CAMEL should become an increasingly powerful tool forbroadening an MFI’s access to capital, both domestic and international.
ACCION’S CAMEL AND ESTABLISHING MICROFINANCE STANDARDS
ACCION International’s main priority is to create an internal assessment tool that allows itsaffiliate institutions to reach the highest standards of performance. The establishment of highstandards for the microfinance industry is critical. Like ACCION affiliates, microfinanceinstitutions around the world are looking to the financial markets as a source of capital tomeet the microenterprise sector’s enormous demand for financial services. Any MFIinterested in gaining access to capital must be able to provide accurate, consistent, andverifiable financial performance data, both to microfinance managers focused on achievingmaximum results and to potential depositors, lenders, and investors interested in themicrocredit industry.
The CAMEL standards used to rate ACCION affiliate institutions are no less rigorous thanthose applied to traditional financial institutions. These high standards apply to asset quality,profitability, and other key indicators, and in some areas, such as provisioning requirementsand leverage limits, the ACCION CAMEL standards are even more rigorous. However, theACCION standards differ from those of the original CAMEL by acknowledging the essentialdifferences inherent to microfinance. For example, MFIs have a significantly higher level ofoperating costs in relation to outstanding loan portfolio, which is associated with makingvery small loans.6
ACCION’s development and use of the CAMEL is one of several efforts contributing to theestablishment of a set of worldwide microfinance performance standards. In the past twoyears, other initiatives to gather and analyze financial performance data from MFIs havearisen including the development of a rating agency by the Private Sector InitiativesCorporation (PSIC);7 the Economics Institute’s MicroBanking Bulletin Project, headed byRobert P. Christen and funded by the World Bank’s Consultative Group to Assist the Poorest
6 These differences are outlined in several sources including Berenbach and Churchill (1997) and Rock and
Otero (1997).7 The PSIC effort is funded by the U.S. Agency for International Development (USAID), the Swiss Agency for
Development and Cooperation, the Inter-American Development Bank (IDB).

Microenterprise Best Practices Development Alternatives, Inc.
4
(CGAP); the BASE8 Kenya Micro Finance Institution Monitoring and Analysis System,funded by the British Department for International Development (DfID), formerly theOverseas Development Administration (ODA); and the PEARLS9 rating system, as used bythe World Council of Credit Unions (WOCCU). Parallel to these applied efforts has been thecreation of several guides to gathering financial performance data, including the GEMINIproject’s 1995 publications on “Financial Management Ratios,” by Margaret Bartel, MichaelMcCord, and Robin Bell; Robert P. Christen’s Banking Services for the Poor: Managing forFinancial Success; the Small Enterprise Education and Promotion (SEEP) Network’s 1995Financial Ratio Analysis of Micro-Finance Institutions; the Inter-American DevelopmentBank’s 1994 Technical Guide for the Analysis of Microenterprise Finance Institutions; andWomen’s World Banking’s Principles and Practices of Financial Management. Ultimately,as worldwide data is amassed, a set of accepted standards and peer groups will emerge.Several of the institutions and individuals, including ACCION, mentioned above arecurrently coordinating efforts to develop common adjustments to financial statements andcommon ways of measuring key indicators to further develop standards for the microfinanceindustry.
8 BASE is British Aid to Support Enterprises.9 PEARLS is Protection, Effective Financial Structure, Asset Quality, Rates of Return and Costs, Liquidity,
Signs of Growth.

Chapter Two—CAMEL: Overview, Purpose, and Scope
5
CHAPTER TWOCAMEL: OVERVIEW, PURPOSE, AND SCOPE
WHAT CAMEL DOES NOT MEASURE
The ACCION CAMEL plays a critical role in the development and management of healthyand sustainable microfinance institutions (MFIs). It is not, however, an all-purpose tool.What does the CAMEL instrument measure? And equally important, what doesn’t itmeasure? According to Rhyne and Otero (1994), the two pillars of success for microfinanceare scale and sustainability. Scale refers to the degree to which an MFI reaches its targetmarket, in other words, the extent of client coverage. Sustainability refers to the extent towhich, in reaching its target market, an institution covers the costs of providing financialservices after adjustments to its profit and loss statement. The ACCION CAMEL assessmentinstrument measures the level of sustainability of an MFI. However, it does not rate theinstitution in terms of client coverage per se, but rather, for example, it measures the financialimplications of client coverage for the institution in terms of efficiency and profitability.Also, the CAMEL doesn’t rate the institution in terms of social or economic impact at theclient level.10
In reviewing the list of factors excluded from the CAMEL rating, it is important to keep inmind the instrument’s key objective: to lead institutions toward accessing financial markets.Thus, only those aspects which “the market” assesses as important are included in theCAMEL rating. Moreover, the market has a clear hierarchy of performance, reflected in theCAMEL rating system, which is indifferent to the stage of development of the microfinanceinstitution or the limitations of the financial markets.
Target market. Although the original CAMEL was adapted for use in examiningmicrofinance institutions, there are still differences between the target market of commerciallending institutions and that of MFIs. CAMEL does not account for the following variances.
Size of target market (scale). As noted above, the CAMEL only measures those variablesthat are key to accessing financial markets. In this context, the client coverage achievedby the institution, while of extreme importance to institutions like ACCION Internationaland many others, is relevant for the CAMEL rating only in terms of its financial impact,that is, market share or economies of scale achieved. For example, if an MFI projects tomaintain market share while only minimally increasing the number of clients, it wouldnot be penalized under the CAMEL rating system. From a social impact perspective,however, the stagnant client coverage would not be desirable.
10 In other words, an MFI may receive a very high CAMEL rating given its overall financial performance,
despite the fact that its client coverage might be small and projected to grow only minimally. Some in themicrofinance industry have suggested that an “S” be added to the CAMEL diagnostic to measure socialimpact. For the immediate future, ACCION has no plans to make this change with its CAMEL instrument.

Microenterprise Best Practices Development Alternatives, Inc.
6
Appropriate outreach in terms of loan size. Average loan size is a recognized measure ofan MFI’s effectiveness in reaching the microenterprise sector (as distinct from the smallbusiness sector). While a range exists within this average loan size measurement, theACCION CAMEL does not account for where an MFI may fall within the range nor doesit penalize an institution whose average loan size is above this range.
Geographic location of clients and density of microfinance market. Althoughmicroentrepreneurs operate in both urban and rural settings, the majority of ACCIONaffiliates exclusively service urban microentrepreneurs. The standard ranges used by theACCION CAMEL to rate an MFI’s efficiency are based on urban microlending whereclients are usually densely clustered in marketplaces or neighborhoods. The CAMELdoes not make any adjustments for population density in a given market.
Lending methodology. The CAMEL examination is neutral to the type of lendingmethodology used by the microfinance institution. The same yardstick is appliedregardless of whether the institution lends to individuals, solidarity groups, bothindividual and solidarity groups, or whether it applies the village banking methodology.
Evolution. Three levels of evolution are relevant to the development of microfinance. Thefirst is the microfinance institution’s internal evolution; second is the evolution of the localmicrofinance market; and third is the evolution of the national economy and the localfinancial sector.
Microfinance institution. The field of microenterprise development has spawned a rangeof institutions. Some have been in operation for 20 years and others have just opened inthe past year. One result of this difference in duration of operation may be the volume ofclients the institution has been able to reach. An institution that is in its start-up phase islikely to have a lower level of operating efficiency, and will be given a lower rating in theearnings area, than one that has had the time to reach economies of scale. Likewise, in themanagement area, where the CAMEL assesses the level of formality of an MFI’s policiesand procedures, a start-up may receive a lower rating than an established MFI. TheCAMEL rating makes no exceptions for the start-up phase.
Microfinance market. The extent to which competition exists in servicing themicroenterprise sector varies widely across national boundaries. The lack of directcompetition, for example, allows an institution wider latitude in setting its interest rates,potentially resulting in a high rating for profitability. It may also result in a high rating inthe capital adequacy area as the MFI is able to accumulate retained earnings. TheCAMEL makes no adjustments for the existence or absence of competition.
Macroeconomy and development of local financial sector. The CAMEL does not adjustfor variances in the macroeconomy in which an MFI operates. In areas where a recessionmay be undermining repayment rates or the ability of an institution to increase its volumeof clients, the CAMEL is indifferent. Additionally, adjustments are not made for country-specific legal and regulatory characteristics. Among the most relevant characteristics isinterest rate ceilings. In a country where none exist, an MFI can mask inefficiency by

Chapter Two—CAMEL: Overview, Purpose, and Scope
7
charging the necessary rate to make a profit. Alternatively, MFIs that operate whereinterest rate ceilings do exist may not be able to adequately cover the higher costs ofservicing the microenterprise sector.
Type of microfinance institution. Most relevant in this case is whether or not an MFI isregulated. Certain costs are associated with regulation such as increased security, a morecomplex management information system (MIS), and staff training. These costs will affect aninstitution’s operating efficiency and profitability indicators. The CAMEL analyzesnongovernmental organizations (NGOs) and regulated financial institutions with the samestandards.
As financial information is obtained from microenterprise programs around the world, peergroups—for instance, groups that include institutions operating in less densely populatedareas than most of the ACCION International network—will emerge, allowing examiners touse a different set of ranges for rating institutions on various key indicators.
WHAT CAMEL DOES MEASURE
The CAMEL does examine the five areas traditionally considered to be most important in theoperation of a financial intermediary.
Capital adequacy. The capital position of the institution and its capacity to support both thegrowth of the loan portfolio and a potential deterioration in assets are assessed. The CAMELanalysis looks at the institution’s ability to raise additional equity in the case of losses, and itsability and policies to establish reserves against the risks inherent in its operations.
Asset quality. The overall quality of the loan portfolio and other assets includinginfrastructure (for example, office location and environment) is examined. This requiresanalyzing the level of portfolio at risk and write-offs as well as the existence and applicationof credit policies and procedures and the appropriateness of the portfolio classificationsystem, collection procedures, and write-off policies.
Management. Governance, the general management of the institution, human resourcepolicy, management information systems (MIS), internal control and auditing, and strategicplanning and budgeting are examined as distinct areas that reflect the overall quality ofmanagement.
Earnings. The key components of revenues and expenses are analyzed, including the level ofoperational efficiency and the institution’s interest rate policy, as are the overall results asmeasured by return on equity (ROE) and return on assets (ROA).
Liquidity management. This component of the analysis looks at the institution’s ability toproject funding needs in general and credit demand in particular. The liability structure of theinstitution and the productivity of its current assets are also important aspects of the overallassessment of an institution’s liquidity management.

Microenterprise Best Practices Development Alternatives, Inc.
8
COMPONENTS OF THE CAMEL INSTRUMENT
This section is a general discussion of the components of the CAMEL instrument. Eachcomponent is discussed in further detail in Chapter Four, including the definitions for each ofthe financial indicators.
The CAMEL instrument analyzes and rates 21 key indicators employing two components: theCAMEL Manual and the CAMEL Spreadsheets (Figure 1). These indicators are groupedunder the five major areas of analysis (CAMEL). The indicators are either quantitative orqualitative and each are given a weighting (Table 1). Eight quantitative indicators (ratios)contribute to 47 percent of the final rating; 13 qualitative indicators contribute to 53 percentof the final rating.
The CAMEL Manual provides three elements for the examination of an MFI:
§ The relevance of each indicator within the context of microfinance,
§ The ranges or descriptive information that allow the examiner to give the institution arating on a scale of zero to five (with five as the measure of excellence), and
§ The weightings for each indicator.
The Manual also guides the examiner in completing the CAMEL Spreadsheets, whichcontain two types of information:
§ The institution’s balance sheet and income statement, which have been inputted into thespreadsheets and adjusted to make the financial information comparable acrossinstitutions; and
§ Programmatic statistics related to the microfinance institution.
The adjusted balance sheets and income statements of the CAMEL Spreadsheets are used togenerate the key quantitative indicators (Table 2). This adjusted data is also used, along withthe programmatic statistics, to generate what are considered supporting indicators. Thesequantitative supporting indicators are not used in the rating system, but they allow the analystto better understand the factors impacting a given indicator, whether quantitative orqualitative.
The information to measure the qualitative indicators is gathered through staff interviews andanalyses of the institution’s policies and procedures. Qualitative indicators analyze thoseaspects of the institution which are nonquantifiable yet directly impact the financial situationand performance of the institution. The qualitative indicators are highly specific and areapplied consistently to each institution. Qualitative indicators are used in conjunction withquantitative indicators in each of the five main areas examined under CAMEL with theexception of the assessment of management, which is exclusively qualitative.

Chapter Two—CAMEL: Overview, Purpose, and Scope
9
Figure 1: CAMEL Analysis Process
CAMEL Manual and CAMEL Spreadsheets
Quantitative Information Qualitative Information
Key Quantitative Indicators Computed and Rated
Supporting Indicators
Key Qualitative Indicators Examined and Rated
Component Rating Determined (CAMEL)
Composite Rating Determined
CAMEL Spreadsheets
ProgrammaticInformation
AdjustedFinancialStatements

Microenterprise Best Practices Development Alternatives, Inc.
10
Table 1: CAMEL Indicators with Weightings
QUANTITATIVEINDICATORS
QUALITATIVEINDICATORS
CAPITAL ADEQUACY Weighting (%)(15%)
Leverage 5Adequacy of Reserves 5
Weighting (%)
Ability to Raise Equity 5
ASSET QUALITY(21%)
Portfolio at Risk 8Write-offs/Write-off Policy 7
Portfolio Classification System 3Productivity of Long-term Assets 1.5Infrastructure 1.5
MANAGEMENT(23%)
Governance/Management 6Human Resources 4Processes, Controls, and Audit 4Information Technology System 5Strategic Planning and Budgeting 4
EARNINGS(24%)
Return on Equity 5Operational Efficiency 8Return on Assets 7
Interest Rate Policy 4
LIQUIDITY MANAGEMENT(17%)
Productivity of Other Current Assets 2 Liability Structure 8Availability of Funds to
Meet Credit Demand 4Cash Flow Projections 3
TOTAL 47%(100)
53%

Chapter Two—CAMEL: Overview, Purpose, and Scope
11
Table 2: Ratios Used to Determine Camel Quantitative Indicators
AREA/INDICATOR RATIO
CAPITAL ADEQUACY
Leverage ADJ. RISK ASSETSADJ. EQUITY
Adequacy of Reserves ACTUAL LOAN LOSS RESERVE (after write-offs)ADJ. LOAN LOSS RESERVE (after write-offs)
ASSET QUALITY
Portfolio at RiskADJ. PORTFOLIO PAST DUE>30 DAYS+LOANS IN LEGAL
RECOVERY+RESCHEDULED PORTFOLIO 0-30 DAYSADJ. GROSS LOAN PORTFOLIO
Write-offs ADJ. NET WRITE-OFFSADJ. RELEVANT LOAN PORTFOLIO
EARNINGS
Return on Equity ADJ. NET INCOMEADJ. AVG. EQUITY
Operational Efficiency ADJ. OPERATIONAL EXPENSESADJ. AVERAGE GROSS LOAN PORTFOLIO
Return on Assets ADJ. NET INCOMEADJ. AVERAGE ASSETS
LIQUIDITY
Productivity of Other CurrentAssets
INTEREST INCOME RECEIVED ON CASH AND CASHEQUIVALENTS OVER PAST 12 MO.
(AVG. MTHLY CASH + CASH EQUIV. BALANCES- LIQ. CUSHION)* (AVG.3-MO. CD RATE)+(LIQ. CUSHION*AVG. SAVING RATE)

Microenterprise Best Practices Development Alternatives, Inc.
12
CAMEL RATING
Once the information is gathered—and, in the case of the quantitative indicators, adjusted—and analyzed, each indicator is given a rating. For the quantitative indicators, the numericalresult of a given ratio determines the rating, as detailed in the Manual. For the qualitativeindicators, once a given policy or procedure is analyzed, the Manual provides guidance onhow to rate the MFI for this indicator. Once an indicator has been rated, it is multiplied by apredetermined percentage (weighting). Adding up all of these weighted ratings determinesthe component rating in each of the five areas (CAMEL). These component ratings aretotaled to compute a final composite rating that corresponds to an alphabetical rating.
This final CAMEL composite rating is a number on a scale of zero to five, with five as themeasure of excellence. This corresponds to an alphabetical rating (AAA, AA, A; BBB, BB,B; C; D; and NC, or not rated). It is important to point out that the rating system covers abroad spectrum of institutions and does not necessarily represent a continuum of movementfrom the NGO sector to the formally regulated sector. Rather, it represents a continuum ofthe quality and level of sophistication of financial management of the institution independentof its corporate structure. In other words, a “B” rated institution may be regulated and anNGO may receive an “A” rating and be capable of performing in the regulated formalfinancial sector. The alphabetical rating system provides the framework and parameters forassessing MFIs.
“A” category classification generally indicates an MFI with strong financial performance inall of the areas analyzed. Such performance has been maintained over time and is a result ofcarefully developed policies and planning.
Composite AlphabeticalRating
Description of Institution Composite NumericalRating
AAA
An MFI that exhibits superiorperformance in every areaexamined. It is resistant to thepeaks and valleys of thebusiness cycle and the impactof unforeseen circumstances.
4.6-5.0
AA
An institution that, in generalterms, is considered excellent,but scored lower in somevariables.
4.3-4.59
AA good institution with someminor weaknesses that lowerthe score.
4.0-4.29
“B” category classification may be applied to institutions undergoing a difficult period thatnegatively impacts their normally strong financial condition.
Chapter Two—CAMEL: Overview, Purpose, and Scope
13
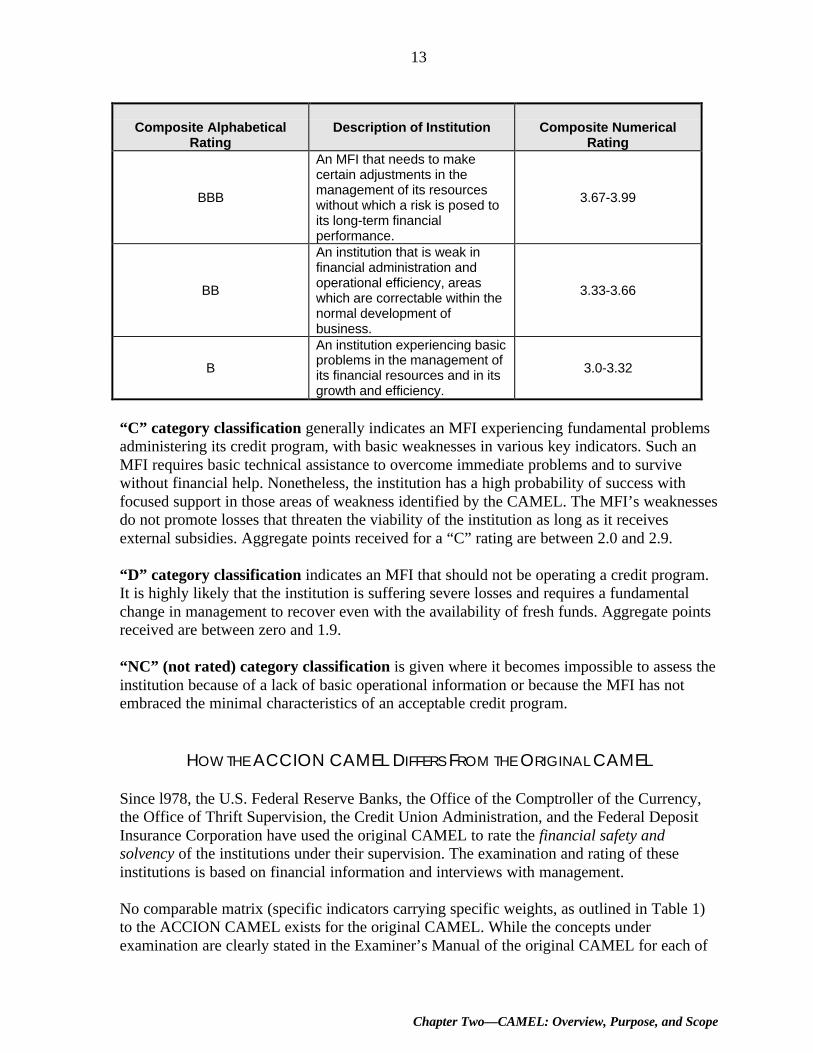
Composite AlphabeticalRating
Description of Institution Composite NumericalRating
BBB
An MFI that needs to makecertain adjustments in themanagement of its resourceswithout which a risk is posed toits long-term financialperformance.
3.67-3.99
BB
An institution that is weak infinancial administration andoperational efficiency, areaswhich are correctable within thenormal development ofbusiness.
3.33-3.66
B
An institution experiencing basicproblems in the management ofits financial resources and in itsgrowth and efficiency.
3.0-3.32
“C” category classification generally indicates an MFI experiencing fundamental problemsadministering its credit program, with basic weaknesses in various key indicators. Such anMFI requires basic technical assistance to overcome immediate problems and to survivewithout financial help. Nonetheless, the institution has a high probability of success withfocused support in those areas of weakness identified by the CAMEL. The MFI’s weaknessesdo not promote losses that threaten the viability of the institution as long as it receivesexternal subsidies. Aggregate points received for a “C” rating are between 2.0 and 2.9.
“D” category classification indicates an MFI that should not be operating a credit program.It is highly likely that the institution is suffering severe losses and requires a fundamentalchange in management to recover even with the availability of fresh funds. Aggregate pointsreceived are between zero and 1.9.
“NC” (not rated) category classification is given where it becomes impossible to assess theinstitution because of a lack of basic operational information or because the MFI has notembraced the minimal characteristics of an acceptable credit program.
HOW THE ACCION CAMEL DIFFERS FROM THE ORIGINAL CAMEL
Since l978, the U.S. Federal Reserve Banks, the Office of the Comptroller of the Currency,the Office of Thrift Supervision, the Credit Union Administration, and the Federal DepositInsurance Corporation have used the original CAMEL to rate the financial safety andsolvency of the institutions under their supervision. The examination and rating of theseinstitutions is based on financial information and interviews with management.
No comparable matrix (specific indicators carrying specific weights, as outlined in Table 1)to the ACCION CAMEL exists for the original CAMEL. While the concepts underexamination are clearly stated in the Examiner’s Manual of the original CAMEL for each of

Microenterprise Best Practices Development Alternatives, Inc.
14
the five areas (capital adequacy, asset quality, management, earnings, and liquiditymanagement), there is no matrix that outlines (1) the formulas or specific qualitative criteriato be used for each of the five areas under examination, (2) ranges for each of the ratios orqualitative criteria chosen, and (3) the respective weights in the composite ratio of thequantitative or qualitative criteria under examination. Uniformity in the application of thismatrix is achieved by established review committees and through use of peer groupcomparisons.
Although initiatives like the MicroBanking Bulletin Project are now underway to establishpeer groups in the microfinance field, few institutions currently participate in such initiatives.This limits the extent of readily available and comparable information among MFIs. The lackof sufficient peer group data coupled with the need to ensure objectivity in the application ofthe ACCION CAMEL significantly reduces the flexibility of the examiner of the ACCIONCAMEL as compared to the examiner of the original CAMEL. The introduction of a matrixspecifying ranges and criteria for each variable of the ACCION CAMEL aims to help theexaminer overcome these problems. Another factor that led to the creation of a matrix wasthe need to clarify the expectations of MFIs participating in the evaluation process about howthey would be rated.
Although the ACCION CAMEL and the original CAMEL both seek to rate the financialsolvency, safety, and soundness of an institution by analyzing the same five areas, thespecific ranges for certain financial indicators are not the same. In areas like operationalefficiency (administrative costs in relation to loan portfolio) and leverage, for example, theranges are significantly different between the two CAMELS because they respond to twodifferent types of businesses, that is traditional banking versus microfinance. (Thesedifferences are covered further in Chapter Four.)
The ranges for each of the indicators included in the ACCION CAMEL were developed bytaking into consideration the performance of formal financial institutions, theoreticalconclusions about a given indicator, and the performance of the ACCION network and ofmicrofinance institutions outside the network for which data was available. For example, insetting the range for return on equity, ACCION looked at the comparable rate in the financialsystem because, unless this rate is achieved, one cannot expect to attract investors. However,the leverage ranges come about as a result of a theoretical analysis of what the level ofindebtedness should be for this type of institution, as compared to the formal financialsystem, given the unique characteristics of microlending. Once these two ranges weredefined, the return on assets calculation becomes a given and is tested by comparing it to thereturn on assets range achieved by ACCION and non-ACCION affiliates. In contrast, in theoriginal CAMEL, the ratios that the examiner chooses to evaluate are compared to financialratios of that institution’s peer group that are updated on a regular basis. The peer group isdetermined based on the institution’s asset size, the number of domestic branches, andwhether it operates in a metropolitan area.
In the original CAMEL, the rating is a function of three factors: (1) the institution’s standingrelative to its peer group, (2) the trends observed for the institution in question, (3) and “bestpractices” for the industry. The examiner applying the original CAMEL uses his or her

Chapter Two—CAMEL: Overview, Purpose, and Scope
15
discretion in weighing these three aspects for any given rating. If, for example, the entire peergroup is suffering from poor asset quality because of a recessionary environment, those whohave fared best, and are therefore within the highest percentile for their peer group, wouldstill not be given a high asset quality ranking. In this example, the peer group data serves toinform the examiner of the impact of the recession vis-a-vis asset quality.
U.S. examiners give a composite CAMEL rating between one and five, with one being thehighest rating and five the lowest. However, no specified weighting is given to each of thefive areas under examination to arrive at the composite rating. The ACCION CAMEL hasbeen ranking institutions in the reverse manner, with five being the highest rating. Theinterpretations of the five rating categories given by U.S. examiners coincide with that of theACCION CAMEL; for example, the U.S. Examiner’s CAMEL Manual describes the highestrating as indicating an institution that is sound in every respect and that is resistant to externaleconomic and financial disturbances.
It is interesting to note that, although the ACCION CAMEL is almost equally dividedbetween quantitative and qualitative components, approximately 70 percent of the indicatorsthat make up the composite rating for the original CAMEL are quantitative. The ACCIONCAMEL’s greater emphasis on qualitative indicators stems from the instrument’s purpose.The ACCION CAMEL was designed to serve as a guide—a road map to microfinanceinstitutions seeking to become formal financial intermediaries. Thus, many of the qualitativecomponents of the CAMEL rating outline the types of practices (audit practices, portfolioclassification, strategic planning) that need to be in place if the institution is to become asuccessful financial intermediary.

Chapter Three—Application of the ACCION CAMEL
17
CHAPTER THREEAPPLICATION OF THE ACCION CAMEL
NECESSARY CONDITIONS FOR AN EFFECTIVE CAMEL
ACCION’s experience demonstrates that certain conditions must exist to complete asuccessful CAMEL analysis of a microfinance institution.
Transparency and Availability of Information
The depth and quality of the CAMEL analysis depends most fundamentally on theavailability of financial performance information. The extent to which this condition is met isshaped by two factors: (1) an MFI’s ability to provide the information, and (2) the MFI’swillingness to provide the information.
The ability to provide information flows primarily from an institution’s managementinformation systems (MIS). The MIS should provide accurate and timely information and besufficiently flexible so that a variety of meaningful reports can be generated.
Because, in some areas, the CAMEL might require reports that the financial institution hasnever before generated, its MIS might not be able to automatically respond to the informationrequests. In some cases, new MIS programs are installed while the CAMEL team is still on-site and, as a result, the information is eventually provided. In other cases, a more thoroughupgrading of the MIS is required.
The willingness of an institution to provide information stems from different issues. Oneissue is confidence on the part of management that the effort to gather the information isworth the result of the CAMEL analysis. How will a CAMEL analysis benefit an MFI eitherinternally or externally? As noted previously, ACCION’s affiliates’ basic acceptance of thevalue of the CAMEL was in place from the beginning. Nonetheless, during a few of theinitial CAMEL examinations, the required information was not easily obtained as a result ofa lack of familiarity with the in-depth nature of the analysis and with its practical value as amanagement tool. In most cases, once this obstacle was overcome by experience, theinformation gathering process was greatly strengthened.
Another issue is timing. Once an institution demonstrates the ability and willingness toprovide the required information for the CAMEL analysis, the issue becomes when theCAMEL team can receive it. Ideally, an MFI would provide the team with financialperformance data in advance of the on-site analysis. This has only occurred in a very fewcases, mainly because of a lack of time on the part of busy microfinance managers and, ascritical, the lack of a mechanism (and associated training) to easily gather the informationoff-site.

Microenterprise Best Practices Development Alternatives, Inc.
18
Trust
A second condition is related to trust and confidence on the part of MFI management that theinformation provided will remain confidential unless the institution decides otherwise.Because the examination may appear threatening to senior management, it is informed of theresults prior to the initial oral presentation given to the institution’s Board of Directors.Additionally, senior management is given the opportunity to respond in writing to the finalwritten report. These comments are attached to the final report submitted to the Board.
Availability of Staff for Interviews
A third condition is the availability of staff for interviews by the CAMEL team. Suchwillingness is initiated and directed by the Executive Director of the institution and requiresthat the examination be carefully scheduled by the Executive Director to take into accountthe significant investment of time required by the entire staff.
The CAMEL examination requires a verification and cross-checking of information thatinvolves visits to the microfinance institution’s branches, visits with clients, and interviewswith local staff at various levels of the institution. This due diligence process requires asignificant investment in time on the part of the local staff to coordinate field visits, obtaincredit files, and be interviewed themselves.
Appropriate Mix of Team Member Skills
The skills required of the CAMEL team span a range of disciplines including financialanalysis, microcredit methodology, internal control and internal audit, organizationaldevelopment and human resources, and management information systems. Each member ofthe team must also have expertise in the broader context of microfinance.
LEVEL OF EFFORT
The level of effort required to complete a CAMEL examination depends upon severalvariables including the level of complexity of the institution, whether a CAMEL examinationhas previously been completed, and the extent to which the requisite financial performanceinformation is readily available and provided on a timely basis.
The suggested number of analysts and composition of the team reflects the experience ofACCION International over the past four years. That experience revealed that a first-timeCAMEL requires a team of three to four people, including a team leader and two or threeanalysts. This team generally needs 10 working days on-site at the affiliate institution togather, adjust, and analyze financial statements and management information. In the casewhere a CAMEL has been previously completed, the team could be reduced to three peopleworking for eight days on-site. If significant changes were made in the institution’s

Chapter Three—Application of the ACCION CAMEL
19
management or methodology since the last CAMEL, however, this reduction in the numberof analysts might not apply.
During its time at the institution, the team completes the following tasks:
§ Gathers and adjusts data;§ Interviews staff and clients;§ Reviews policies and procedures; and§ Analyzes the information and determines the rating.
In the case of a first-time CAMEL, the entire team has traditionally arrived simultaneouslyand collectively completed the tasks. More recently, however, ACCION has implemented anew approach in its application of CAMEL: One member of the team has arrived at theinstitution one week in advance of the others to complete the first task. Not only does thisallow for the number of team members to be reduced to three, but it also allows the team toinitiate its activities at an advanced point. With the adjustments to the data alreadycompleted, the remaining tasks can be completed in significantly less time and, thus, at alower cost.11
TEAM COMPOSITION
ACCION and its affiliates initially believed that the CAMEL team should include individualsoutside of ACCION. Because of the closeness of the technical assistance relationshipbetween ACCION and its affiliates, it was felt that the ACCION employees involved inCAMEL would not be sufficiently objective to dissect the inner workings of the institution.Therefore, the first-year CAMEL analyses included professionals from a premierinternational accounting/management consulting firm. The participation of these outsideprofessionals was unsuccessful, however, because they lacked several importantcharacteristics including an in-depth knowledge of microfinance and a professionalcommitment to the task, which was deemed a low priority in the broader portfolio ofactivities of the accounting/consulting firm. Another problem was the lack of permanence ofthese professionals in the CAMEL effort because they were rotated through different clientprojects rather than staying with the ACCION project.
Based on this unsuccessful experience, in 1994, ACCION decided to build up its internalCAMEL examination capacity so that the entire team would be ACCION staff. CAMELs arenow conducted by a team of ACCION staff members only. There is a core CAMEL team,which consists of a team leader and two other experienced professionals whose primary
11 Using the old application in which the entire team arrives together, the cost to ACCION of a first-time
CAMEL has been approximately $20,000. With the new approach, ACCION has been able to reduce the costto about $15,000. The cost for subsequent CAMELs is about $15,000 under the old approach and about$11,000 using the new approach. Included in the cost is all CAMEL staff time (including fringe andoverhead), travel, hotel, and meals for each team member. Staff time includes the time to prepare prior to thesite visit, the time on-site, and the time required to generate the final report.

Microenterprise Best Practices Development Alternatives, Inc.
20
responsibility is to the CAMEL. Additional operational staff members join this core CAMELteam when needed.
The level of experience of the examination team is an important contributor to theconclusions of the CAMEL. Although the CAMEL Manual clearly defines areas of analysis,procedures, required information, and rating criteria (ensuring standardized application),team members draw on their own experience in assessing microfinance institutions as theyintegrate the qualitative and quantitative indicators. The ability to take the information andimpressions gathered during a CAMEL examination, organize and analyze this information,and adequately contextualize the results requires experience with a range of MFIs.
DIVISION OF LABOR AND PROCESS
There are two dimensions to determining the division of labor to complete the first threetasks of the CAMEL: the CAMEL team effort and the institutional effort. (The fourth task,which involves the process of determining the rating, is completed by the team only.)
The institution receives a list of required information that falls into several areas includingeconomic, financial, portfolio quality, accounting, human resource management, strategicplanning and budgeting, and procedures and manuals. Ideally, the institution would gatherand send the quantitative information to the CAMEL team in advance, and would gather theinformation required to assess qualitative indicators (such as the personnel manual) beforethe team’s arrival on-site.
The next best option is for the institution to have this information ready for the CAMELteam’s arrival. It is because this second option is not always possible that ACCION made thedecision to send a team member in advance to support the quantitative information-gatheringprocess. Only when this information is available can the CAMEL team focus on theverification and analysis of the quantitative data and on the measurement of the qualitativeindicators through interviews and observations.
The division of labor within the CAMEL team generally follows a set pattern.
Team Member #1: Gather, input, and adjust the quantitative information in the CAMELSpreadsheets. Complete the analysis of one of the five main areas.
Team Member #2: Complete one area of analysis plus additional aspects of a second area ofanalysis.
Team Member #3: Same as Member #2.
Team Member #4: Same as Member #2.
When determining who should be given which area, several factors are considered. Onefactor is the need to balance the need for versatility and specialization of skills. On one hand,

Chapter Three—Application of the ACCION CAMEL
21
it is important that specific individuals with the appropriate training become the mostknowledgeable of specific areas of the CAMEL. On the other hand, the team will be moreflexible if several individuals can complete any given task. Another factor is theacknowledgment that certain CAMEL tasks are more interesting than others, and that, tocombat the tendency toward boredom, team members need to be rotated.
In terms of the level of effort on the part of the institution, key members of the seniormanagement team are expected to make a presentation to the CAMEL team on the first dayof the examination. This presentation should include the historical development of theinstitution, its strategic plan and organizational structure; current interest rates and inflationstatistics, relevant national regulations, and characteristics of the market; and an overview ofthe financial statements and the current state of the portfolio.
The presentation by senior management normally lasts for half a day and serves severalpurposes. First, it sets the stage for the CAMEL examination by introducing the team to theinstitution. Second, it allows formal introductions to be made between the team members andthe staff with whom they will be working. Third, it allows the CAMEL team to explain theprocess and procedures of the CAMEL examination. The CAMEL team’s work involvesinteracting with employees from all levels of the institution, from senior management toadministrative staff. During this presentation, interview prospects are identified andappointments are made. Finally, this presentation gives the team an opportunity to work withthe MIS staff on the process of completing the CAMEL information requests.
The involvement of the staff of the institution centers on gathering any necessaryinformation, such as procedures manuals and client files. In addition, staff are relied on tocoordinate visits to branch offices to interview managers and loan officers and interviewswith clients and bank officers in charge of the lending relationship with the institution.Ideally, team members conduct these interviews and visits without the accompaniment of theinstitution’s senior staff because it allows for a more frank and honest discussion and a moreaccurate determination about whether field application is consistent with stated practice.
Finally, periodic debriefings occur among the CAMEL team to integrate information aboutthe examination. At the end of the analysis and while still in country, the team develops theratings based on individual and collective information.
THE REPORT
On the final day of the CAMEL examination, the team makes two separate on-sitepresentations; the first presentation is made to the institution’s senior management team andthe second to the Board of Directors. These critical presentations ensure that CAMELfindings reach the highest levels of the institution. The presentation to senior managementenables the staff of the institution to comment on the CAMEL results and, perhaps, identifywhere the team may have made faulty assumptions or interpretations. The presentation to theBoard is less detailed than that to the staff, but highlights all the key issues and conclusions

Microenterprise Best Practices Development Alternatives, Inc.
22
reached by the CAMEL team. A challenge faced by the CAMEL team lies in obtaining asignificant level of attendance at these presentations by members of the Board.
In the weeks following the on-site assessment, the team prepares a comprehensive butconcise written report and sends a draft to the Executive Director of the institution. The draftincludes the following:
§ An executive summary.
§ Detailed narrative analyses of each of the 21 quantitative and qualitative indicators(usually up to one page on each indicator). Reference is made to the supportingindicators, where relevant. Because the ACCION CAMEL instrument is an integralcomponent of the technical assistance ACCION International provides, the report notonly identifies issues or problems that the MFI might have, but also recommendsimprovements in these weak areas.
§ The CAMEL-adjusted financial statements, which incorporate the previous three years ofdata plus the most recent interim statement. Financial figures are expressed in localcurrency terms, both nominal and constant, as well as in U.S. dollars.
§ A listing of the resulting key and supporting indicators.
§ Various appendixes including a classification of loan portfolio and breakdown by aging,programmatic statistics, and entries made for each adjustment with correspondingbackground information.
Upon receipt of the report, the senior management of the local institution has two weeks torespond in writing to the CAMEL team. If this response is received within the two-weekperiod, the comments are annexed to the final version of the report sent to the Board. If theCAMEL team deems it appropriate, these comments may also be incorporated into thenarrative analysis of the final CAMEL report. The final CAMEL report is a confidentialdocument. The remainder of the institution’s staff is not given access to the CAMEL report,unless the Executive Director decides to do so, nor are the results disseminated to thirdparties unless ACCION and the institution mutually agree to do so.
CHALLENGES TO APPLICATION
A significant challenge to the application of the CAMEL to microfinance is how to bringabout the public dissemination of its results. Seen another way, the challenge is how toencourage demand for the CAMEL results and, thus, motivate disclosure.
The confidential nature of the CAMEL examinations applied by ACCION mirror the practiceof the original CAMEL. Neither U.S. regulatory agencies nor the subject institutions arepermitted to disseminate the results. It is the public rating agencies, such as Moody’s andStandard and Poor’s, that serve as the mechanism for sharing requisite financial performance

Chapter Three—Application of the ACCION CAMEL
23
information with lenders and investors. These rating agencies exist because of the demandfor information by the capital markets. Although they are given less access than regulators,rating agencies are able to successfully fulfill the demand for information because of a clearincentive for disclosure on the part of the subject institution; a public rating impliestransparency and thus financial legitimacy to a well-established market of potential investors.In the case of microfinance, no such well-established market exists. Yet without publiclyavailable and verifiable financial performance information, the evolution of this market willbe significantly inhibited.
As long as the results are kept confidential, the value of the CAMEL examination tomicrofinance will remain limited. However, the single most important factor in achievingwidespread dissemination of CAMEL results is the demand by the sources of funding formicrofinance, including donor agencies, lenders, and investors, for verifiable performanceinformation. Because the demand by the capital markets for in-depth analysis of MFIs is stillvery limited, it has been suggested that it could be the role of donor agencies to create ademand for the CAMEL rating for funding purposes.
A second challenge is to determine what entity will complete CAMEL examinations in thelong-term. Can, and should, it be the so-called apex institutions, which provide technicalassistance to MFIs, such as ACCION, FINCA, Calmeadow, and Women’s World Banking?Or will an independent body evolve to become a specialized rating agency, which can ensurethat the results will meet the demands of these technical assistance providers in addition tothose of the sources of funding? However, if this specialized agency is to be successful inobtaining the credibility of financial markets, it must be set up to guarantee objectivity ofapplication and the highest professional standards in terms of the depth of analysis anddegree of experience of those involved in generating the rating.

Chapter Four—CAMEL Information and Adjustments
25
CHAPTER FOURCAMEL INFORMATION AND ADJUSTMENTS
This chapter will (1) outline the information required of the MFI in order to conduct theCAMEL examination, (2) describe the various adjustments that the examiner makes to thefinancial statements—-the reasons for them and the mechanics of each, and (3) discuss therelevance of the 21 indicators for each of the five areas (CAMEL) analyzed and provide adefinition of each as well as the ranges or criteria for rating (zero to five) the microfinanceinstitution (MFI) in each area for all indicators.
INFORMATION REQUIRED FROM INSTITUTION
FINANCIAL STATEMENTS:§ Audited financial statements for the past three years, including Management Letters; and§ Unaudited financial statements, including balance sheet, income statement, and cash
flows, from most recent period and same period for prior two years.
BUDGETS/PROJECTIONS:§ Annual budgets for the past three years, approved by the Board of Directors;§ Cash flow projections; and§ The most recent strategic plan, including financial projections.
PORTFOLIO QUALITY:§ Aging schedules of the loan portfolio for most recent period and year-end for the past
three fiscal years; and§ Loan portfolio risk classification.
FUNDING:§ Detailed outline of donations received (monetary and in-kind) with amounts, conditions,
and uses; and§ Documentation on credit facilities and loan agreements.
BOARD INFORMATION:§ Minutes from Board meetings from past three years; and§ Background on Board members including curricula vitae (CVs) and other documents
outlining current employment and experience.
OPERATIONS/STAFFING:§ Key policies and procedures manuals in areas such as credit, personnel, collections, and
provisioning;§ Information on employee benefits programs, including loan officer incentive program;§ Yearly analysis of new hires and employees who have left the institution for the past
three years; and§ Programmatic data.

Microenterprise Best Practices Development Alternatives, Inc.
26
MACROECONOMIC INFORMATION:§ Local bank and finance company rates on loans and deposits for the past three years;§ Local consumer price index for the past three years;§ Exchange rate between dollar and local currency for the past three years;§ Local GNP per capita for the current year; and§ Local minimum monthly wage for the past three years.
Financial Statements and the Adjusted CAMEL Format
The financial statements form the basis for the CAMEL’s quantitative analysis. The specificformat for the statements is used first to standardize the institution’s financial data intoCAMEL accounts and then to incorporate the adjustments. For comparative purposes, theadjusted financial statements are presented in three versions—constant local currency,nominal local currency, and U.S. dollars.
Expressing financial statements in constant currency allows the analyst to compareperformance over the periods studied without the distorting factor of annual inflation.Converting to constant currency involves taking the most recent period analyzed as the baseperiod and restating prior periods in base-period terms using the inflation rate for those priorperiods. Converting the statements to U.S. dollars facilitates comparison among institutionsin different countries.
Three-years worth of audited financial statements are used for the CAMEL analysis. Inaddition, the institution’s most recent available interim financial statements are analyzed,with the income statement reconstructed based on a 12-month period.12 Microfinance inLatin America has proven to be a seasonal business, with the greatest lending activityoccurring in the fourth quarter of the calendar year. Therefore, annualizing interim statements(projecting year-end based on year-to-date activity) would underestimate the probable realyear-end results. By using a 12-month period for interim statements, the seasonal factor issmoothed out.
The total number of periods studied will vary from three to five depending on the timing ofthe evaluation. For example, if the most recent period available for an evaluation isSeptember 30, 1997, then that period will be compared to September 30, 1996. In addition,the audited statements for December 31, 1996, December 31, 1995, and December 31, 1994,will be included and analyzed.
12 For the interim statements, the income statement needs to be shown on a 12-month basis. The statement is
derived by adding the interim period income statement for the current year to the prior year-end incomestatement and then subtracting the income statement for the same period from the prior year. For example,((09/31/97 income statement + 12/31/96 income statement) - 09/31/96 income statement). This creates anincome statement for the period September 30, 1996 to September 30, 1997. The same process must becarried out to derive a comparative statement for September 30, 1995 to September 30, 1996. In thisexample, the financial statements required are for the periods December 31, 1994, December 31, 1995,December 31, 1996, September 30, 1996, September 30, 1996, and September 30, 1997.

Chapter Four—CAMEL Information and Adjustments
27
Although indicators are calculated for all periods analyzed, the key quantitative indicatorsused for the final rating are taken from the most recent period analyzed. Annex A presentssample CAMEL-formatted financial statements (balance sheet and income statement) for theperiod September 30, 1996, to September 30, 1997, and provides definitions of all accountsused.
Programmatic Information
The programmatic information for the CAMEL examination is gathered for all of the periodsanalyzed and is used to show the evolution of the institution as well as to calculate a numberof supporting indicators that are used in the analysis. The information is obtained principallyfrom the finance and administration, loan operations, and human resources areas.
CREDIT ACTIVITY:§ Number of Active Borrowers—Number of clients currently receiving credit from the
institution.
§ Number of Active Solidarity Groups—Number of solidarity groups currently receivingcredit from the institution.
§ Total Borrowers—Total number of borrowers that have received credit since theinstitution’s inception.
§ Total Solidarity Groups—Total number of solidarity groups that have received creditsince the institution’s inception.
§ Total Amount of Credit Disbursed During the Period—Total amount of loans made in theperiod.
§ Total Amount of First-Time Loans Disbursed During the Period—Total amount of loansto first-time borrowers made in the period.
§ Number of Credit Operations—Total number of loans disbursed during the period.
§ Average Loan Portfolio—The average of the monthly gross portfolio balances.
INFRASTRUCTURE/STAFFING:§ Number of Branches—Offices that are very decentralized, and operate with a certain
amount of administrative autonomy.
§ Number of Agencies—Offices that typically are manned by only one loan officer and areceptionist, and depend heavily on a branch office.
§ Number of Persons Hired—Number of people hired as regular employees for themicrofinance activity during the period.

Microenterprise Best Practices Development Alternatives, Inc.
28
§ Number of Employees Leaving the MFI—Number of employees of the microfinanceactivity who leave the institution during the period.
§ Number of Current Employees—Total current number of employees of the microfinanceactivity.
§ Number of Loan Advisors—Total current number of loan officers.
§ Number of Field Personnel—Collection agents, marketing agents, and branch managers(if branch managers report to Operations rather than Administration).
CAMEL ADJUSTMENTS
Once the financial statements for all the periods to be analyzed have been compiled andreclassified using the CAMEL format, the next step in the CAMEL process is to perform thenecessary adjustments. The adjustments to the financial statements are made beginning withthe first year analyzed (Year 1) and ending with the most recent period (Year 3).
The purpose of the CAMEL adjustments is twofold. First, they place the MFI’s currentfinancial performance in the context of a financial intermediary, permitting the analyst todetermine how viable the institution would be as a commercial financial institution. Second,the adjustments place all MFIs on a level playing field for the purpose of makingcomparisons among different institutions. The overall effect of the adjustments is to isolatethe performance of the microfinance activity, to accurately measure the quality of the loanportfolio, and to account for the imputed cost of various subsidies.
The CAMEL carries out a total of six adjustments: 13
§ Adjusting for the scope of microfinance activity§ Adjusting the loan loss provision§ Adjusting loan write-offs§ Adjusting for explicit and implicit subsidies§ Adjusting for the effects of inflation§ Adjusting for accrued interest income
13 Annex B provides a worksheet with an example for all adjustments, except Adjusting for the Scope of
Microfinance Activity, and instructions on completing the adjustment and entering it into the financialstatements.

Chapter Four—CAMEL Information and Adjustments
29
Adjusting for the Scope of Microfinance Activity
Philosophy Behind the Adjustment
Many MFIs are involved in activities other than microfinance; this includes NGOs involvedin various development activities and commercial institutions offering financial services todiverse sectors. Therefore, the CAMEL segregates the microfinance activity for analysis tomeasure its performance and viability separate from the overall institutional performance.
Adjustment Summary
In conjunction with the process of reclassifying the financial statements using the CAMELformat, the analyst determines whether the institution is involved in activities unrelated tomicrofinance. Nonlending services that are offered as part of the loan product, such as loanfees charged that include the cost of training courses offered to borrowers, are considered tobe related to the microfinance activity. Once the various unrelated activities are identified,the analyst must determine what revenue, expenses, assets, liabilities, and equity are relatedto each of the activities to prepare financial statements that are specific to the microfinanceactivity. In some instances, this will be clearly accounted for by the institution. In others, theanalyst will need to determine how to allocate the necessary overhead expenses to themicrofinance activity as well as how to account for particular fixed assets, liabilities, andequity. This adjustment cannot be accomplished by simple prorating. It requires a thoroughanalysis of the costs and infrastructure required to run the microfinance activity alone. Theanalyst will need to identify the various relevant factors that cause costs to be incurred. Forexample, the human resource expense, which is the largest cost component for an MFI, isdriven by the number of employees dedicated to a given activity.
Adjusting the Loan Loss Provision
Philosophy Behind the Adjustment
The loan loss provision is one of the key expenses of any financial institution. Its purpose isto reserve against potential losses arising from nonpayment of loans. The provision reducesnet income and is accumulated in the loan loss reserve on the balance sheet as a contra-assetthat offsets the value of the loan portfolio. For NGOs, the loan loss provision provides no taxbenefit, and, therefore, is viewed only as a reduction to net income. Because of this view, andbecause of the fear among some NGOs that provisioning might signal problems with theportfolio to donors, the level of the loan loss reserve is often underestimated by MFIs. TheCAMEL adjustment ensures that the loan loss reserve bears an appropriate relationship to thequality of the loan portfolio.

Microenterprise Best Practices Development Alternatives, Inc.
30
Based on the volatile nature of microloan portfolios, the ACCION CAMEL has identified theneed for MFIs to provision more rapidly than traditional financial institutions and hasdeveloped provisioning rates (Table 3). However, if the institution’s adjusted loan loss rate(see Adjusting Loan Write-offs) for the most recent period studied is abnormally high, above8 percent, the analyst may want to provision at an even greater rate than what is shown inTable 3.
Table 3: ACCION CAMEL Provisioning Rates
Provision percentRescheduled Aging Status
Regular Portfolio PortfolioCURRENT LOANS 0RESCHEDULED LOANS (CURRENT) 0 10LOANS PAST DUE 1-30 DAYS 10 50LOANS PAST DUE 31-90 DAYS 30 75LOANS PAST DUE 91-180 DAYS 60 100LOANS PAST DUE > 180 DAYS 100 100LOANS IN LEGAL RECOVERY < 180 DAYS 100 100*Note: Regular portfolio is defined here as portfolio that has not been rescheduled.
Adjustment Summary
The ACCION CAMEL assesses the quality of the microfinance institution’s loan portfoliofor each of the periods analyzed and, based on the predetermined percentages of the CAMELprovisioning table, calculates the appropriate level of the loan loss reserve for each of theyears. This reserve amount is compared to the actual reserve accounted for on theinstitution’s balance sheet. In the event of a deficiency, the deficient amount is expensed onthe income statement and added to the loan loss reserve account on the balance sheet. Thisadjustment is spread out over the periods studied. Therefore, the cumulative adjustment fromthe prior periods studied is also added to the loan loss reserve on the balance sheet anddebited from the institution’s prior period retained earnings.
Rescheduling loans—that is, reducing the payment amounts and postponing the final duedate to facilitate repayment of the loan—is uncommon among MFIs. The key to theseinstitutions’ lending methodology is the proper structuring of loans to meet the client’sability to repay. Other than in extreme situations external to the microenterprises, like acholera epidemic or a widespread recession, the necessity to undertake significantrescheduling of loans indicates poor loan structuring on the part of the MFI. MFIs thatreschedule often revert these past due loans to “current” status, in effect masking their trueportfolio at risk. Having become delinquent in the past, rescheduled loans are at greater riskof becoming delinquent in the future. Therefore, when rescheduled portfolio is identified, amore stringent provisioning policy is applied.
The provisioning rates used for the CAMEL are based on ACCION’s experience with thevolatility of microloan portfolios. Most commercial banks would forgo provisioning loansthat are 130 days past due because they deal with longer term loans, and, therefore, wouldconsider the risk of nonpayment to be very low during such early stages of delinquency.

Chapter Four—CAMEL Information and Adjustments
31
MFIs, by contrast, manage portfolios with rapid turnover (in the case of ACCION’s network,loan tenors average four months) and weekly or biweekly repayment schedules. As a result,an MFI must be very cautious about the early stages of late payment and set its provisioningrates accordingly. Given the four-month average tenor, the CAMEL suggests that loansshould be written off after they are 180 days past due. Therefore, the provisioning of eachaging category must gradually increase to coincide with the need to be 100 percentprovisioned by the time a loan is 180 days past due in order for the loan loss reserve to be ata level sufficient to absorb the write-off. Although recommended provisioning levels for themicrofinance industry vary somewhat,14 ACCION believes that the provisioning levels inTable 3 are sufficiently stringent and, given our experience, adequately capture the typicalprogression of delinquent loans in a microfinance portfolio.
Adjusting Loan Write-Offs
Philosophy Behind the Adjustment
Once a loan is determined to be uncollectable, from an accounting standpoint, it should bewritten off. That is, it is removed from both the gross loan portfolio and the loan loss reserveaccounts on the balance sheet. The net effect on the balance sheet is zero and, given that theloan loss reserve is adjusted to the appropriate level, it will be sufficient to absorb the write-off, and there should be no additional effect on the income statement.
Because most MFIs are unregulated, write-offs are not mandated, and as a result, many MFIsperform write-offs on an infrequent basis. Therefore, loans may remain in the portfolio evenwhen they have become seriously past due. MFIs may be reluctant to perform write-offsbecause they may not be provisioning adequately. In such cases, writing off a bad loan wouldmean taking an added expense on the income statement. In addition, many MFIs equate theaccounting act of removing a bad loan from their books with giving up on collection efforts.In reality, even when loans are written off the balance sheet, the institution should continueto pursue collection efforts to the best of its ability. By not writing off uncollectable loanswithin an appropriate time frame, an institution is inflating its loan portfolio and, dependingon the volume of bad loans, skewing its performance ratios.
Adjustment Summary
The ACCION CAMEL has established that, given the average four-month tenor ofmicrofinance loans in the ACCION network and the weekly or biweekly repaymentschedules, once a loan becomes 180 days past due or is in legal collection, the chances ofcollecting such a loan are low. Therefore, it should be written off. For microfinanceinstitutions where the write-off policy is less stringent, the ACCION CAMEL adjusts the
14 The Inter-American Development Bank, for example, recommends 10 percent provisioning for loans 1-30
days past due, 25 percent for 31-60 days, 50 percent for 61-90 days, and 100 percent over 90 days.

Microenterprise Best Practices Development Alternatives, Inc.
32
financial statements by writing off all loans over 180 days past due as well as those in legalrecovery.
Adjusting for Explicit and Implicit Subsidies
Philosophy Behind the Adjustment
To obtain a true picture of the MFI’s potential for commercial viability, the institution’sfinancial statements must be adjusted for subsidies. The most obvious subsidies are directdonations, which are typically accounted for by MFIs as revenue. If the institution were acommercial entity, the equivalent of those donations would be equity investments. Therefore,the CAMEL adjustment removes cash donations from the income statement and reclassifiesthem as capital on the balance sheet.
A second subsidy that needs to be adjusted is subsidized debt. Many nonprofit MFIs haveaccess to below-market financing for their portfolios. However, the savings they obtain fromthese low-interest loans are not necessarily passed on to borrowers. In fact, this type ofsubsidy actually may mask real inefficiencies in the institution and skew profitability. Thepurpose of adjusting for subsidized debt is to demonstrate the cost of those funds atcommercial rates and the institution’s ability to cover those costs. An MFI interested inbecoming a financial intermediary usually will not have access to subsidized funding andmust, therefore, establish that it is capable of covering the cost of commercial funds.
Subsidized debt refers to those MFI liabilities that carry an interest rate that is 75 percent orlower than the “alternative commercial funding source” for the MFI. The alternativecommercial funding source is (a) the three-month CD rate if the MFI is capturing deposits, or(b) the average short-term loan rate in the financial system if the MFI cannot capturedeposits. Once it is determined that a liability needs to be adjusted, the interest rate used forthe adjustment depends on the cost of alternative commercial funding available to theinstitution. If the MFI borrows at commercial rates of interest, the weighted average of theMFI’s liabilities at commercial rates of interest should be calculated and the resulting interestrate used to adjust the institution’s subsidized debt. If, on the other hand, the institution hasno liabilities at commercial rates of interest, the interest rate to be used for adjustingsubsidized liabilities is the average interest on short-term loans of the financial system wherethe MFI operates. Where interest rates are regulated resulting in negative real rates of interestpaid on the MFI’s liabilities (interest rates below the local inflation), the subsidized debtshould be adjusted using the local inflation rate.
Finally, some MFIs operate with rent-free or significantly subsidized facilities. Others mayreceive assistance from external consultants or have key managers paid for by outside parties.The operating subsidy adjustment is used to estimate the additional cost the institution wouldincur if it did not receive these subsidies. However, in these cases, it is important that theexaminer determine whether the institution would have entered into an agreement for a givenfacility or consultancy were it not for the subsidy or in-kind donation received. The answer to

Chapter Four—CAMEL Information and Adjustments
33
this should be reflected in the extent, if any, of the adjustment made to the financialstatements.
Adjusting for the Effects of Inflation
Philosophy Behind the Adjustment
Many MFIs operate in inflationary economies where the value of goods and services isconstantly increasing while the real value of money is decreasing. For a financial institutionwhose major assets are monetary, maintaining the value of those assets against the effects ofinflation poses a challenge. Inflation has two major effects on the institution. The real valueof fixed assets will keep pace with inflation, and, to the extent that equity is tied up inmonetary assets, the real value of equity will be eroded.
In noninflationary economies, fixed assets are accounted for at original cost. In inflationaryeconomies, however, accounting standards may allow for fixed assets and equity to beadjusted to keep up with inflation. Accounting for inflation differs from country to country.In some countries, no inflation adjustment is used and in others the adjustment may only bepartial. The CAMEL fully adjusts for inflation.
Adjustment Summary
The analyst studies the institution’s accounting policies regarding inflation and determineswhether a full or marginal adjustment will be required. The year-on-year inflation rate is thenmultiplied by the average net fixed assets. The result constitutes a gain for the institution andis credited as revenue on the income statement and is also debited on the balance sheetaccount under revaluation of assets, which has the effect of increasing the value of net fixedassets. The inflation rate is then multiplied by the average value of the institution’s equity,which constitutes a loss and is debited on the income statement. The amount is also creditedon the equity account under adjustments to equity. If the value of net fixed assets exceeds thevalue of equity, these adjustments generate a net gain, but if equity exceeds the value of netfixed assets, the institution will have a net loss.
Adjusting for Accrued Interest Income
Philosophy Behind the Adjustment
Regulated financial institutions may accrue interest on loans provided they are current or pastdue up to a specified period of time. But once a loan becomes past due beyond the specifiedperiod, the institutions are required to stop accruing interest as the likelihood of actuallycollecting that interest is decreased. Because of the frequent payments made on microloans,

Microenterprise Best Practices Development Alternatives, Inc.
34
accruing interest is uncommon among MFIs and, if done, the amount of accrued interestincome is generally small. This adjustment involves eliminating interest income accruals onportfolio past due over 30 days from the income statement and balance sheet because notdoing so overstates the MFI’s income given the small probability of collecting that interest.
Adjustment Summary
The institution’s accounting policies are studied to determine whether interest revenue isaccounted for on an accrual basis. If the institution does not accrue interest, no adjustment isnecessary. Likewise, if the institution accrues interest but only on its current and past dueportfolio up to 30 days, no adjustment is made. However, if the institution accrues interest onits past due portfolio over 30 days, the amount needs to be quantified and eliminated from theincome statement as well as from the accrued interest account on the balance sheet. Thecumulative adjustment from prior periods is debited on the balance sheet from prior periodretained earnings and credited to accrued interest.

Chapter Five—CAMEL Scoring
35
CHAPTER FIVECAMEL SCORING
This chapter discusses the relevance and weighting of the 21 quantitative and qualitativeindicators for each of the five areas (CAMEL) analyzed.15 It then provides a definition ofeach area and the ranges or criteria for rating (zero to five) the microfinance institution ineach area for all indicators.
CAPITAL ADEQUACY
Key Indicator Summary Weighting (%)
Leverage (Quantitative) 5.0Ability to Raise Equity (Qualitative) 5.0Adequacy of Reserves (Quantitative) 5.0
Total 15.0
The objective of the capital adequacy analysis lies in measuring the financial solvency of aninstitution, which consists of determining whether the risks incurred by the institution areadequately offset with capital and reserves to absorb potential losses. Credit risk, forexample, has a direct impact on a bank’s capital position. Profits are diminished throughprovision expenses to cover actual or potential losses through the allowance for loan losses.Lower profits mean lower equity capital.
One of the key indicators for a financial intermediary is the relationship between theinstitution’s capital base and its assets or liabilities. Most countries require a minimumcapital amount to establish a financial institution and then regulate the extent to which thatinstitution can borrow in relation to the capital it has; that is, the extent to which theinstitution can leverage itself. The Basle Agreement, a report prepared by the Committee onBanking Supervision,16 adopted the ratio of eight percent equity to risk assets as theinternational standard. The capital adequacy ratio takes into account the composition of abank’s assets and its capital, assigning, on the asset side, one of five different weights to thevarious asset categories depending on the risk profile of each.
Only the financial implications of an institution’s capital structure are dealt with in thisCAMEL area. The Management area of CAMEL evaluates the governance implications of aninstitution’s capital structure. The fact that many microfinance institutions are structured as
15 Table 2 in Chapter One shows the breakdown of all 21 indicators, with weightings, for the five CAMEL
areas. Table 3 in Chapter One shows the ratios used to determine the quantitative indicators.16 An agreement of the G-10 Governors in December 1974 to set up a committee to improve collaboration
between bank supervisors created the Basle Committee on Banking Supervision, the Secretariat for which isprovided by the Bank for International Settlements (BIS). The Basle Agreement report was issued in 1983,and in 1992 the Committee strengthened its provisions by agreeing on minimum standards for thesupervision of international banking groups and their cross-border establishments. [Source: BIS web page,<www.bis.org>.]

Microenterprise Best Practices Development Alternatives, Inc.
36
nonprofit institutions, however, is reflected in the ranges that CAMEL has established for theleverage indicator.
Leverage (Quantitative)
This indicator is the relationship between the institution’s risk weighted assets and its equity.Most traditional commercial banks operate within a parameter of risk assets/equity of about12.5 times. This is the maximum figure recommended by the Committee on BankingSupervision, which has been adopted by Superintendencies in many countries. As shown inAnnex C, for the 11 Latin American countries in Table C-3, the indicator measuring assets toequity ranged from an average of 5.41 times in Ecuador to a maximum of 17 times for banksin Nicaragua, with the remaining nine countries averaging 12 times in terms of assets/equity.
Several reasons exist, however, to support the argument that maximum leverage formicrofinance institutions should be lower than the recommended level for commercial banks.First, although delinquency rates for a microfinance institution can be better than fortraditional banks, the volatility of this rate is much greater in the microfinance sector. Asecond reason is that operating expenses as a percent of assets are much higher for an MFIthan for a traditional bank. Thus, when management loses control of expenses, which canhappen when faced with a rapidly changing macroeconomic environment, the resultingincrease in this ratio would generate significant losses to equity. Third, the ability ofmicrofinance institutions to obtain additional funding from shareholders or donors, in thecase of NGOs, is much more restricted than for a traditional financial institution. Even mostprivate sector microfinance institutions do not yet have the broad-based participation of theprivate sector that allows for a quick response in recapitalizing an institution in times ofcrisis.
Moreover, a microfinance institution has a more simplified asset composition than atraditional bank, which results in a reduced number of categories for risk-weighting purposes.The weighting given to each category is a function of the degree of risk of that particularasset; thus, a 100 percent weight means twice as much risk as a 50 percent weight. Theweighting used in the CAMEL is as follows:
Asset Risk Weighting(percent)
Cash on hand and deposited in banks 0Investments:
Government paper (mat.< one yr.)Nongovernment bonds (mat.< one yr.)Bonds with maturities over one yr./SharesPermanent investments in other inst.
010
100100
Loan portfolio 100Loan loss reserve 100Other receivables 100Net fixed assets 50Assets received in lieu of loan payments 100Other assets 100

Chapter Five—CAMEL Scoring
37
The numerator of the leverage indicator is arrived at by multiplying each of these categoriesby their respective weights and adding them all together. The denominator is the CAMEL-adjusted equity of the institution. Significant adjustments to equity will have a marked impacton the institution’s leverage, or level of indebtedness. Once calculated, the leverage (riskassets/equity) indicator is rated on a scale of zero to five.
Rating LeverageScale Range
5 less than or equal to 6.04 6.1 to 7.03 7.1 to 8.02 8.1 to 9.01 9.1 to 10.00 over 10.1
These leverage ratios apply to either NGOs or for-profit institutions with limited access toprivate equity, which is the typical profile of institutions currently lending to themicroenterprise sector. If, however, the microfinance activity is carried out by an institution(such as a large commercial bank) that can mobilize significant amounts of equity in a shortperiod of time and whose portfolio is diversified (including various loan products other thanmicrofinance loans), a higher level of indebtedness would be justified and the scoring will bedetermined on a case-by-case basis by the analyst.
Ability to Raise Equity (Qualitative)
The analyst is not only concerned with the financial solvency of the institution at a giventime, but also with the institution’s ability to respond to a need to replenish or increaseequity. Such a need could arise, for example, as a result of a deterioration in asset quality orbecause of growth rates that go beyond profits reinvested in the business.
Rating Ability to Raise EquityScale Range
5 The institution has a proven capacity and/or a clear, aggressive, and effective policyfor mobilizing a significant amount of equity from the private sector, as evidenced bylarge equity injections in the past and/or firm commitments for future capitalization.
4 The institution has a clear commitment to obtaining equity from the private sector,but it has not yet achieved this on a significant level. It does, however, havesignificant support from specialized institutions (multilateral and bilateral institutions)and the capacity to tap into those resources for future capitalization.
3 The institution relies exclusively on internally generated funds to increase its equitybase by achieving profits in real terms.
2 The institution is able to maintain its equity base in real terms by relying ondonations from individuals, corporations, or development institutions.
1 The institution has no policy with regards to capitalization; its goal is to obtain a cashflow surplus, but it does not aim to maintain the value of its equity in real terms. Theinstitution could possibly tap into monies from development institutions.
0 The value of the institution’s equity is being eroded by inflation. It does not have thecredibility with third parties that would allow it to tap into resources for futurecapitalization.

Microenterprise Best Practices Development Alternatives, Inc.
38
Adequacy of Reserves (Quantitative)
The reserves established by a financial institution are created to absorb losses that have ahigh probability of occurring and that are separate from the general business risk incurred bythe institution. For example, an increase in interest rates on monies borrowed by theinstitution without the ability to increase its loan rate by a commensurate amount willresult—all things being equal—in a reduction in profits. A financial institution is not able toprovision for movements in interest rates; this constitutes general business risk.
Among the reserves established by financial institutions are those related to loan losses,foreign exchange fluctuations, and employee benefits. The principal reserve examined underthis indicator is the one for loan losses. However, the analyst must also evaluate whetherother reserves would be required and attempt to quantify these reserves to determine theirimpact on the institution’s financial statements.
It is important to mention that for-profit financial institutions have an incentive to createreserves because they reduce the institution’s tax burden. Thus, regulators have very clearpolicies regarding the creation of reserves. For a nonprofit institution, however, the taxincentive is not applicable; instead, the institution is generally interested in not reducingprofits by a loan loss provision and in not signaling to donors, via the creation or increase ofa reserve, that asset quality is deteriorating.
The analyst will evaluate the sufficiency of the loan loss reserve by taking into account thefollowing:
§ CAMEL-adjusted historic loan loss rate,§ Rescheduled loan portfolio,§ Loan portfolio aging schedule, and§ Size of current loan loss reserve.
The reserve adequacy indicator is calculated by dividing the institution’s actual loan lossreserve (after CAMEL-adjusted write-offs) by the CAMEL-adjusted loan loss reserve. TheCAMEL-adjusted loan loss reserve is calculated by applying set provisioning percentages tothe portfolio, based on an aging classification. The provisioning adjustments are shown inTable 3 in Chapter Four. The CAMEL-adjusted provisioning requirements will be harsher ifthe institution is rescheduling and, in doing so, reclassifying the loan as current. The highestrating for this indicator is obtained by those institutions whose actual loan loss reserve equals80 percent or more of the CAMEL-adjusted loan loss reserve.
Rating Adequacy of ReservesScale Range
5 over 80 percent4 60 to 79 percent3 40 to 59 percent2 20 to 39 percent1 0 to 19 percent0 less than 0 percent

Chapter Five—CAMEL Scoring
39
If the analyst has determined, by talking with clients and loan officers, that rescheduling istaking place, but the institution does not keep a record of the amount of the rescheduledportfolio, the analyst will downgrade this indicator by one point to reflect the higher risk inthe portfolio.
Most microfinance programs will have other possible future expenses—such as exchangelosses for loans denominated in foreign currency or severance pay for employees—that willrequire the creation of reserves. The analyst must determine whether the institution has madethe appropriate reserves and for the appropriate amounts. If the institution is deficient inthese other reserves, the analyst can reduce the scoring for adequacy of reserves by one pointto account for this deficiency in other reserves. Thus, this indicator is subject to a reductionof two points if the rescheduled loan portfolio cannot be quantified and if other reserves areinsufficient.
One supporting indicator—CAMEL-adjusted loan loss reserve (after write-offs andrecoveries) /adjusted loan portfolio—for reserve adequacy is a frequently calculated ratio forfinancial institutions. For regulated institutions that are required to provision for loan lossesaccording to specific parameters, this indicator speaks to the quality of their portfolios.However, when provisioning policies are applied very differently among institutions (as isthe case in the microfinance sector, which includes both regulated and unregulatedinstitutions), only the adjusted loan loss reserve number will generate an indicator thatreveals the quality of the portfolio. The average range for this supporting indicator is one tofour percent.
A second supporting indicator—(adjusted equity + adjusted loan loss reserve)/adjusted pastdue portfolio > 30 days—for the reserve adequacy looks at the coverage for delinquentportfolio beyond the loan loss reserve. That is, it quantifies the extent to which equityrepresents an added cushion against loan losses. This indicator should be a minimum of oneor more, meaning that adjusted equity plus loan loss reserves should be greater than theadjusted portfolio > 30 days past due.
ASSET QUALITY
Key Indicator Summary Weighting (%)
Portfolio at Risk (Quantitative) 8.0Write-offs (Quantitative) 7.0Portfolio Classification System (Qualitative) 3.0Productivity of Long-term Assets (Qualitative) 1.5Infrastructure (Qualitative) 1.5
Total 21.0
The asset quality of a microfinance institution refers primarily to the quality of theinstitution’s main asset, the loan portfolio, although the productivity of the entity’s fixedassets and long-term investments are also important. The combined performance of theseassets reflects the quality of the management of the institution’s basic business. Whether the

Microenterprise Best Practices Development Alternatives, Inc.
40
institution is a nonprofit or for-profit entity, the analysis in this area is identical. The type ofentity will not affect the performance of the portfolio, nor are the acceptable levels of assetquality adjusted to match the type of entity.
Clear policies for credit and collection, a proven lending methodology, and good monitoringsystems alone do not guarantee a low late payment rate. These procedures (discussed laterunder management area) must be combined with a serious attitude toward repayment—thatis, a corporate culture that simply does not tolerate late payment, a quality that is measured inthe final results.
The analysis of asset quality is divided into three areas: portfolio quality, which includesportfolio at risk and loan loss rate; portfolio classification system; and other assets, whichconsiders the productivity and appropriateness of the institution’s fixed assets and the policyfor investing in fixed assets.
The portfolio quality of an MFI is measured in the final results. Therefore, the two keyindicators in this area are portfolio greater than 30 days past due and loan loss rate. Theportfolio past due indicator shows the percentage of the portfolio that is at risk ofnonpayment and indicates potential losses. In contrast, the loan loss rate indicates the level ofactual and adjusted write-offs.
Portfolio at Risk (Quantitative)
Historically, MFIs have reported their portfolio at risk as the total amount of payments pastdue divided by the total portfolio. However, this method underestimates the fact that if a loanhas one or more payments past due then not only are those payments at risk of remainingunpaid, but the entire balance of the loan is at risk. Therefore, the more conservativemeasurement, and the one traditionally used by the banking sector, is to calculate the totalbalance of loans with payments past due divided by the total portfolio.
For this indicator, the institution is asked to prepare a portfolio aging schedule based on thefollowing categories:
§ Current loans—loans that have no payments past due.§ Rescheduled loans—loans that are current but have been rescheduled at some point in the
past.§ 1-30 days—loans with a payment or payments past due from 1 to 30 days.§ 31-90 days—loans with a payment or payments past due from 31 to 90 days.§ 91-180 days—loans with a payment or payments past due from 91 to 180 days.§ Greater than 180 days—loans with a payment or payments greater than 180 days past due
(not including loans in legal recovery).§ Legal recovery—loans that are in legal collection proceedings.
The CAMEL uses the portfolio greater than 30 days past due (the sum of the aging categoriesbeginning with 31 to 90 days), including loans in legal recovery, to calculate this indicator.

Chapter Five—CAMEL Scoring
41
Microfinance loans are typically short-term, averaging 120 days, amortized weekly orbiweekly. Therefore, within a 30-day period, anywhere from two to four payments come dueon a typical loan.
If an institution has any rescheduled portfolio between zero and 30 days, it should also beadded to the numerator of the past due indicator to recognize that it represents a greater riskthan the nonrescheduled portfolio that is between zero and 30 days. If the institution is onlyable to provide a global figure for its rescheduled portfolio, rather than a breakdown of theaging schedule, the analyst should consider 50 percent of the total rescheduled portfolio aspart of the portfolio past due for this indicator.17
As shown in Annex C, for the 11 Latin American banks listed in Table C-3, the range interms of overdue loans/gross loans ranged from a low of 1.05 percent in Chile to a high of11.15 percent in Argentina, with the average of this indicator for the remaining nine othercountries at 5.18 percent.
Rating Portfolio at RiskScale Range
5 less than 3.0 percent4 3.1 to 6.0 percent3 6.1 to 9.0 percent2 9.1 to 12.0 percent1 12.1 to 15.0 percent0 greater than 15.0 percent
Write-offs (Quantitative)
The loan loss rate is derived by taking the loan write-offs for the period (actual and adjusted,see Adjusting Loan Write-Offs in Chapter Four) net of recovered loans in the period anddividing the result by the “relevant portfolio.” The relevant portfolio is an approximation ofthe outstanding portfolio from which the loans being written off originated. Because a loanthat is over 180 days past due would have, at the earliest, been disbursed six months and oneweek (if payments are on a weekly basis) prior to the date of the aging schedule report, therelevant portfolio would be the average portfolio over a 12-month period, beginning sixmonths prior to the date of the aging schedule report. In other words, if the period for whichthe write-offs are being performed is September 30, 1997, the relevant portfolio would be theaverage portfolio (based on monthly balances) between March, 30, 1996, and March 30,1997.18
17 If the analyst determines that the institution is rescheduling loans but is unable to obtain details on the
amount of rescheduled portfolio, one point should be taken off the final Portfolio at Risk rating.18 If the analyst determines that the institution is rescheduling loans but is unable to obtain details on the
amount of rescheduled portfolio, one point should be taken off the final rating for Loan Loss Rate.

Microenterprise Best Practices Development Alternatives, Inc.
42
Rating Write-offs (Loan Loss Rate)Scale Range
5 less than 2.0 percent4 2.1 to 3.5 percent3 3.6 to 5.0 percent2 5.1 to 7.0 percent1 7.1 to 10.0 percent0 greater than 10.0 percent
Portfolio Classification System (Qualitative)
The analytical work in this area requires reviewing the portfolio’s aging schedule andassessing the institution’s policies associated with preparing that schedule and any additionalrisk classification used.
Many MFIs are reluctant to prepare an aging schedule of their portfolio, preferring instead tomonitor the late payment rate (total payments past due/total portfolio), which understates thetrue risk of a late payment. Often, the institution is motivated by a desire to present optimisticresults to donor agencies.
An aging schedule is prepared to estimate the potential losses associated with loans that arepast due. Financial institutions, however, rate the quality of their portfolios not only based onthe level of late payment but also taking into account other factors such as the collectibility ofguarantees, client history, loan type, and client type. For example, at a typical financialinstitution, a client who may be current with his or her present loan, but was delinquent on aprior loan, would be classified by the institution as riskier than one who has never beendelinquent in the past. In other words, in addition to classifying clients by their currentrepayment status, they should be classified by other risk factors such as their credit history,existence and quality of guarantees, and so forth. Commercial financial institutions usuallyclassify the riskiness of their borrowers as A, B, C, or D. For a microfinance institution, therisk classification system could be based on observed patterns of loan repayment with regardto specific lines of business (commerce vs. production) or geographic location (rural vs.urban portfolio or specific branches. These classifications could be used not only to establishprovisioning rates but to set differential risk-based interest rates.
However, most MFIs do not use a risk classification system, and there are no firm outlinesfor creating one. Bank regulators in different countries use different criteria. As themicrofinance industry continues to develop and become more complex, the need for MFIs toincorporate risk classification systems will become more pronounced.
This analysis is a rating of the method developed by the institution for classifying itsportfolio and the effectiveness of estimating losses by comparing real losses to pastestimates. Emphasis will be given in the rating on the institution’s development of newmethods for estimating risk based on their own experience rather than on a predeterminedformat. The fact that an institution is developing databases that allow it to carry out this typeof classification is a key factor in the rating for this indicator.

Chapter Five—CAMEL Scoring
43
Rating Portfolio Classification SystemScale Range
5 The institution has a formal portfolio classification system broken down by levelof risk and by aging, which is based on a historical analysis of the specificportfolio classification. Provisions reflect the portfolio classification system thatis broken down by risk.
4 The institution has a formal portfolio classification system broken down by levelof risk, but based more on intuition than on a historical analysis. The systemincludes provisions that are not differentiated by risk but instead are based onan analysis of actual late payment rates.
3 The institution has a formal classification system based primarily on the agingof the portfolio.
2 The institution does not have a formal portfolio classification system. However,it has the intention and the available database of information to develop one.
1 The institution does not have a formal portfolio classification system and it lacksthe information systems and/or verifiable historical data to create one.
0 The institution does not have a formal portfolio classification system and hasneither the information nor the intention of creating one.
MFIs manage other assets in addition to their loan portfolios. These other current assets (suchas cash and temporary investments) are analyzed under the liquidity area of the CAMEL.Long-term assets, such as fixed assets and long-term investments, also impact theinstitution’s financial performance.
Productivity of Long-term Assets (Qualitative)
For this indicator, the analyst evaluates the policies for investing in fixed assets. In addition,there should be an analysis of the appropriateness of these investment decisions with respectto productivity and morale among staff, of customer satisfaction, and of the financial impactof the decisions on the institution, both in the present and in the future.
Some aspects to be considered when evaluating fixed assets and long-term investments are asfollows:
§ Cost savings—For example, renting a building vs. buying one.§ Inflation adjustments—Is the purpose of the investment as a hedge against inflation (see
Adjusting for the Effects of Inflation)?§ Guarantees—Are the fixed assets serving the purpose of backing credit lines for the
institution?§ Risk—Is there a need to provision for long-term assets or donated goods?§ Actual administration of these assets—Are they underutilized?§ Donations for fixed assets—Are donations that are specifically tied to the purchase of
fixed assets being used appropriately, and did the institution do adequate research beforemaking the purchase?
§ Cost benefit analysis—Does the institution study the cost/benefit of investing in fixedassets over increasing the loan portfolio, including financing costs?
§ Future growth of infrastructure—Is the institution planning appropriately for its futuregrowth needs?

Microenterprise Best Practices Development Alternatives, Inc.
44
The supporting indicator of total fixed assets/total assets quantifies the institution’s level offixed asset investment in relation to total assets. The typical range for MFIs is 5-10 percent.A high ratio would warrant further investigation as the institution may be investing tooheavily in fixed assets, diverting valuable resources from the MFIs main business, lending.However, a new institution may not yet have built up its portfolio in relation to its level offixed assets.
Rating Productivity of Long-Term AssetsScale Range
5 The institution optimizes the utilization of its long-term assets as a result of athorough cost/benefit analysis
4 The institution manages its long-term assets without a thorough analysis oftheir impact on the entity. Nevertheless, at this time, this lack of analyticalrigor does not pose a risk to the institution.
3 The institution faces possible risks in the future by not analyzingappropriately the consequences of the management of its long-term assets.
2-0 The financial results of the institution are negatively affected by theinstitution’s lack of planning and assessment of its long-term assets.
Infrastructure (Qualitative)
The infrastructure of the institution should be evaluated to determine if it is adequate to meetthe needs of both staff and clients. In many cases, especially for NGOs, the infrastructure isinadequate and lacks basic elements to ensure optimal productivity.
Rating InfrastructureScale Range
5 The institution has an infrastructure that guarantees maximum productivity.This includes its physical space and vehicles to transport loan officers. Theoffice space is comfortable for the clients, well located for them, and secure.
4 The institution has an infrastructure that may not guarantee maximumproductivity, but is adequate in almost all respects.
3 The institution has an infrastructure that is basically adequate, but withproblems that may impede productivity.
2-0 The institution does not have an adequate infrastructure, productivity isaffected, and the clients receive poor service as a result of theseinadequacies.
MANAGEMENT
Key Indicator Summary Weighting (%)
Governance/Management (Qualitative) 6.0Human Resources (Qualitative) 4.0Processes, Controls, and Audit (Qualitative) 4.0Information Technology System (Qualitative) 5.0Strategic Planning and Budgeting (Qualitative) 1.5
Total 23.0

Chapter Five—CAMEL Scoring
55
the breadth of inputs required for a meaningful and well-grounded plan. The basic elementsin a strategic plan are as follows:
§ Identify the elements that differentiate the institution from others of its kind and areresponsible for its success. This involves analyzing pricing, products, and service.
§ Analyze the environment in which it operates, both at the macro level (the economy andthe political situation) and the micro level (its competition and the market segments thatthe institution reaches or desires to reach; the size and location of the institution’s and itscompetitors’ markets).
§ Define the institutional objectives.§ Identify the risks and obstacles faced by the institution in reaching these objectives.§ Formulate the strategies that allow the institution to manage risk and overcome obstacles
to meet the desired goals.§ Analyze the implications of these strategies in terms of the resources needed (financial,
infrastructure, and human resources).§ Translate objectives, strategies, and resources into quantitative terms and, in doing so,
checking for internal inconsistencies (such as client growth that does not match thenumber of loan officers required to service the projected loan volume).
The strategic plan should be a permanent guide in the decision-making process ofmanagement. Its relevance, however, will only be maintained over time if the plan is updatedwhen key assumptions have changed.
Although the CAMEL does not penalize institutions that are not increasing the number ofclients they service, the analyst should assess whether the assumptions for growth in numberof clients serviced by the institution versus those serviced by its competition result in areduction in the institution’s market share. A reduction in market share leaves the institutionvulnerable, with potentially negative financial effects. On the other hand, the analyst shouldalso be cautious of projected growth that is excessive such as growth that results fromintroducing new products on a massive scale without adequate pilot testing.
The annual budget flows from the strategic plan. It serves to guide the institution in itsdecision-making. On a monthly basis, the institution’s actual results should be measuredagainst the budgeted numbers. The extent to which the institution is successful in meeting itsbudget reflects on the quality of management. When the actual results do not match thebudget, the institution should be re-projecting expected results and analyzing the reasons forthe deficiencies in meeting budgeted numbers.
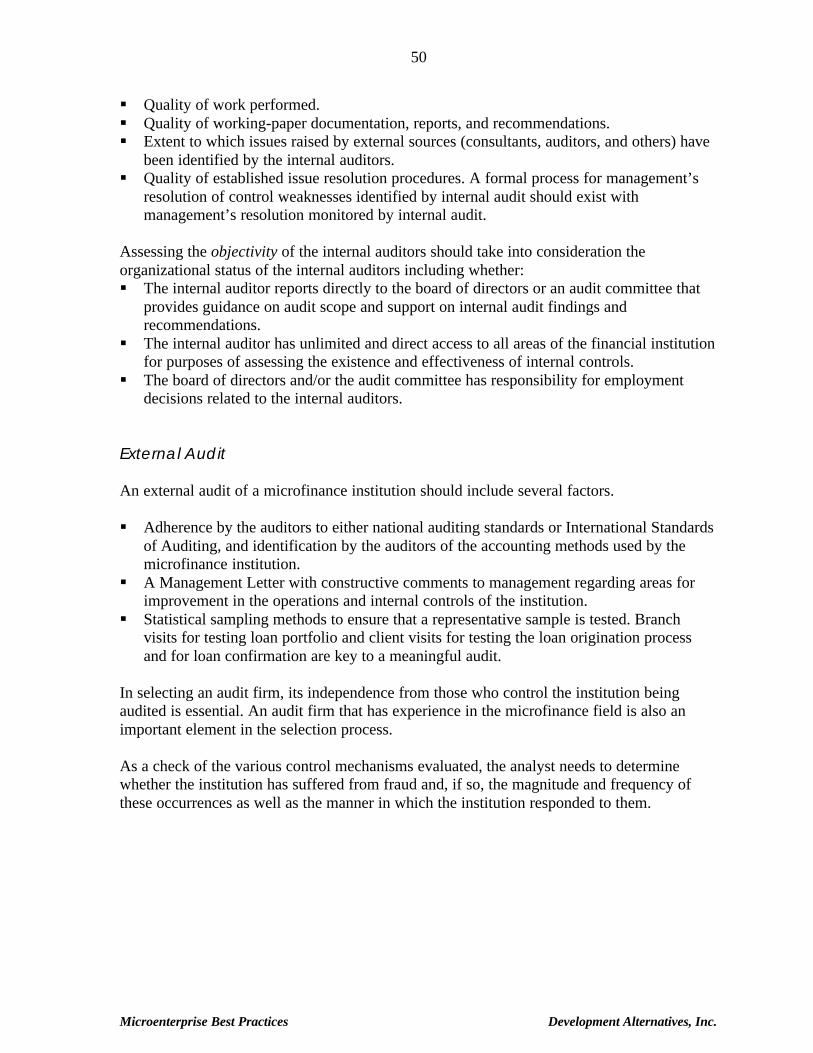
Microenterprise Best Practices Development Alternatives, Inc.
56
Rating Strategic Planning and BudgetingScale Range
5 The institution undertakes a comprehensive and participatory process forgenerating short- and long-term financial projections, grounded on technicalcriteria. The strategic plan incorporates an analysis of institutional franchise,goals, obstacles, and strategies, and is based on assumptions that arereasonable and internally coherent and that translate into an increase ormaintenance of market share for the institution. The plan is updated as neededand used in the decision-making process. A monthly review of the budget isundertaken by staff and the Board. The budget is a key tool in the decision-making process. The MFI is successful to a large extent in meeting theprojected annual budget.
4 The institution undertakes both short- and long-term projections. The strategicplan has some minor deficiencies. Both the plan and budget serve as a guidein the decision-making process. The institution is aware of its positioning withrespect to current and future market share.
3 The institution has undertaken some projections, but more as an exercise thanas a process for generating information that becomes key to the decision-making process of the institution.
2 In the past, the institution has generated projections, but these have not beenupdated and, therefore, are not used in the decision-making process.
1 Some aspects of the institution’s activities have been projected, primarily inresponse to donors, but no overall exercise has been undertaken.
0 The institution has no strategic planning process or, if it does, it is entirely forthe purposes of obtaining donations.
EARNINGS
Key Indicator Summary Weighting (%)
Return on Equity (Quantitative) 5.0Operational Efficiency (Quantitative) 8.0Return on Assets (Quantitative) 7.0Interest Rate Policy (Qualitative) 4.0
Total 24.0
A basic prerequisite for any MFI interested in becoming a financial intermediary is to operateprofitably. Unless profitable, the institution will be unable to attract the resources ofshareholders or depositors. As in the area of asset quality, the profitability of the institution ismeasured essentially quantitatively. Profitability is the result of the effective management ofpricing, costs, financing, asset quality, liquidity, marketing, human resources, and the like.
For the purposes of the ACCION CAMEL, three quantitative indicators that represent thechallenges and objectives of microfinance institutions have been chosen to measureprofitability. These are (1) to maintain and subsequently increase net worth (return onequity); (2) to operate with a cost structure that, while more onerous than that of otherfinancial institutions, continues to move closer to the efficiency levels achieved by thetraditional financial sector (operating efficiency); and (3) to maintain and increase theinstitution’s return on its asset base (return on assets).

Chapter Five—CAMEL Scoring
57
Another important issue related to earnings is the institutional policy on maintaining the realvalue of equity. Although measurable in the rate of return on equity, the analyst must alsoassess the institution’s attitudes and explicit policies in this area.
Earnings indicators used for the ratings are adjusted for loan loss provision, inflation, accruedinterest, and explicit and implicit subsidies (see Adjusting the Loan Loss Provision,Adjusting for the Effects of Inflation, Adjusting for Accrued Interest Income, Adjusting forExplicit and Implicit Subsidies). In addition, there are numerous supporting indicators thatcan be used when analyzing earnings ( Annex D).
Adjusted Return on Equity (Quantitative)
Adjusted return on equity (ROE) is calculated by dividing the adjusted net income of themicrofinance activity by the average adjusted equity. This ratio measures the institution’sability to increase its equity base through earnings from operations adjusted for the effects ofinflation, appropriate levels of loan loss provisions, accrued interest income, and explicit andimplicit subsidies. The result will be a function of the financial margin and the level ofoperating efficiency, asset utilization, and leverage or debt financing, in relation to equity. Areturn of 0 percent implies that the institution does not generate a return on equity beyond theinflation rate. For the 11 Latin American countries shown in Table C-3 in Annex C, the rangein ROE went from a low of -10.6 percent in Mexico to a high of 17.98 percent in Peru, withthe average of the remaining nine institutions at 11.8 percent.
Rating Adjusted Return on EquityScale Range
5 above 15.0 percent4 10.0 to 14.9 percent3 5.0 to 9.9 percent2 0 to 4.9 percent1 (5.0) to (0.9) percent0 less than (5.0) percent
Operational Efficiency (Quantitative)
A key area of analysis in the CAMEL is operational efficiency, especially for thoseinstitutions facing competition in their markets.
Operational efficiency is measured as a percentage of total operating expenses to the averageloan portfolio. More than profitability, this indicator measures the efficiency of the institutionand allows for monitoring its progress toward the goal of functioning within margins that arecloser to those of formal financial institutions. For the 11 Latin American banks in Table C-3, operating expenses/gross loans ranged from a low of 4.7 percent in Chile to a high of 14.3percent in Brazil. The average of the nine remaining institutions stood at 9.4 percent,significantly lower than the “average-type” performance of a microfinance institution in

Microenterprise Best Practices Development Alternatives, Inc.
58
Latin America as indicated by the “3” rating below, which would imply a range of between26 to 30 percent.
Rating Operational EfficiencyScale Range
5 Less than 20 percent4 20 to 25 percent3 26 to 30 percent2 31 to 40 percent1 41 to 50 percent0 above 50 percent
Undoubtedly, making numerous small loans will always be more expensive than traditionalcommercial bank lending. However, those institutions that try to operate within the financialintermediary framework where financial margins are relatively inflexible will have to lookfor a way to maximize the efficiency of their staff and processes. Some MFIs have lacked thecompetitive pressure to do so, while others simply have not achieved the economies of scalethat will allow them maximum efficiency.
Adjusted Return on Assets (Quantitative)
This indicator calculates the adjusted net income of the microfinance activity to averageassets. It measures how well the institution’s assets are utilized, or its ability to generateearnings with a given asset base. Unlike the adjusted return on equity, this indicator isindependent of the level of leverage, or debt financing, employed by the institution.
As Table C-3 shows, ROA ranged from a low of -0.67 percent in Mexico to a high of 1.64percent in Colombia, with the remaining nine Latin American countries averaging 0.93percent in terms of return on assets. The “average performance” for microfinance, asreflected in the “3” rating below, is somewhat higher than the 0.93 percent average of thenine Latin American countries, ranging between 1.0 and 1.5 percent. This reflects theassumption of lower leverage in microfinance, while maintaining the need for competitiveROEs to succeed in attracting equity capital.
Rating Adjusted Return on AssetsScale Range
5 above 3.0 percent4 2.0 to 3.0 percent3 1.0 to 1.9 percent2 0 to 0.99 percent1 (2%) to (0.99) percent0 less than (1.9) percent

Chapter Five—CAMEL Scoring
59
Interest Rate Policy (Qualitative)
The analyst should assess management’s policies for setting interest rates on microenterpriseloans and for deposits, if applicable. Interest rates should be set based on an analysis of ratescharged by the various sources of funding available to this sector, including both formal andinformal lenders, as well as an analysis of the institution’s cost of funds and financialmargins necessary for achieving the profitability targets of the institution. The analyst shouldlook at actual revisions to interest rates made in the past and the application of the statedpolicies.
The analytical work for this indicator places emphasis on the institution’s policy for settinginterest rates and the degree to which the institution anticipates and responds tomacroeconomic changes by analyzing and, if necessary, adjusting its interest rates.
Rating Interest Rate PolicyScale Range
5 The institution structures its interest rates according to its cost structureincluding financing and operating costs, loan loss provision, and targetedcapital increases. It also takes into account the market rates charged by bothformal and informal lenders. The institution adjusts its interest ratesaggressively in the face of macroeconomic changes.
4 The institution sets its interest rates based on the market rates of both informaland formal lenders rather than on a technical analysis. However, some costvariables are included in the interest rate set by the institution.
3 The institution sets its interest rates based solely on the market rates for loanscharged by both informal and formal lenders, and does not include an analysisof costs.
2 The institution charges bank rates without taking into account its costs.0-1 The institution charges rates below local bank rates. There is a total lack of
technical criteria.
LIQUIDITY MANAGEMENT
Key Indicator Summary Weighting (%)
Liability Structure (Qualitative) 8.0Availability of Funds to Meet Credit Demand (Qualitative) 4.0Cash Flow Projections (Qualitative) 3.0Productivity of Other Current Assets (Quantitative) 2.0
Total 17.0
Liquidity is traditionally defined as the ability to meet obligations as they come due. It is theinstitution’s ability to accommodate decreases in funding sources and increases in assets, andto pay expenses at a reasonable cost. Microfinance institutions incur liquidity risk in thenormal course of operations. Such risk can be planned or unintentional. Various demands onliquidity and specific examples include loan portfolio growth, purchase of fixed assets,withdrawals of deposits, planned runoff of certificates of deposits, dividend payments,scheduled loan payments, salaries, and utility bills.

Microenterprise Best Practices Development Alternatives, Inc.
60
Liquidity risk from normal operations can be limited by establishing and adhering to specificguidelines on balance sheet composition such as loan to deposit ratios, loans to core depositsratios, parameters on asset mix, parameters on liability mix, minimum and maximummaturities on asset categories, and funding source limits.
Liquidity risk from unplanned activities can be limited by defining and identifying liquiditysources available to the microfinance institution such as primary and secondary sources ofliquidity on the asset side of the balance sheet (cash, short term investments) and prearrangedborrowing agreements with other financial services institutions.
While liquidity management focuses on meeting short-term disbursement needs, liabilitymanagement refers to the general funding strategy over the medium- to long-term.
Liability Structure (Qualitative)
The analyst reviews the composition of the institution’s current liabilities including theirtenor, interest rate, payment terms, and sensitivity to changes in the macroeconomicenvironment. The types of guarantees required on credit facilities, the sources of creditavailable to the MFI, and the extent of diversification of these resources are analyzed as well.This indicator also focuses on the MFI’s relationships with banks in terms of leverageachieved based on guarantees, the level of credibility the institution has vis-a-vis the bankingsector and/or depositors, and the ease with which it can obtain funds when required.
Gap Ratio for Repricing of Assets/Liabilities
This ratio measures the “gap” between rate-sensitive assets and rate-sensitive liabilities,defined as those that reprice during a specified period of time. It is concerned with theperiods when assets and liabilities reprice, rather than with their final maturity. For example,if a loan matures in two years, but every three months the interest rate is set in reference to aspread over a given indicator, then this loan would fall in the period labeled 31-90 days inTable 4 below. If, in this period, the institution has more assets than liabilities that reprice inan environment where interest rates are falling, this situation would constitute a risk for theinstitution. If interest rates were increasing, on the other hand, this type of mismatch wouldresult in an opportunity to enhance profits. Thus, the ratio needs to be analyzed within thecontext of the environment in which the MFI operates. Table 4 shows breakdown periodsthat are useful in calculating the gap ratio and provides an example of this calculation.

Chapter Five—CAMEL Scoring
61
Table 4: Example of Gap Ratio Calculation Matrix
0-30 days 31-90 days 91-180days
Over 181days
Total
Assets 50 90 30 5 175Liabilities (60) (50) (40) (30) (180)Difference(Gap amount) (10) 40 (10) (25) (5)
Gap ratio(Assets/Liabilities)
0.83 1.80 0.75 0.16 0.97
If the gap ratio for a given period is less than one, the risk for the institution lies in a rateincrease. If it is more than one, the risk is of a rate decrease. The gap amount can becompared to the total loan portfolio to understand its magnitude. In Table 4, the gap of (10)for the 0-31 day period would be compared to the institution’s total portfolio, which, in thiscase, is the total value of assets that are repricing, or 175, resulting in 5.7 percent.
Maturities Gap
Table 4 can also be used to calculate the gap in maturities. In this instance, the analyst isconcerned with the final maturity of the asset or liability. Thus, in Table 4, the loan thatactually matures two years from the current period—regardless of when it reprices—isclassified in the over 180 day column. If the gap ratio for a given period is less than one, thenthe institution’s concern is with the availability of resources in the system to fund this gap.
Foreign Currency Gap
The foreign currency gap is relevant for institutions that fund or have assets in more than onecurrency. The analyst is concerned with quantifying the degree to which assets and liabilitiesin foreign currencies might not be matched to assess the impact of a devaluation orrevaluation on the institution. It is useful to express the currency gap as an absolute amountand as a percentage of equity. If the absolute number is positive, then the institution would beat risk of a revaluation; if it is negative, the risk is of a devaluation. The table for calculatingthe currency gap would look as follows:
AmountForeign Currency AssetsForeign Currency LiabilitiesDifference
Liquidity Ratio
The liquidity ratio includes both “stored” liquidity (cash plus short-term investments) plusthat available through overdraft-type lines of credit from other financial institutions, as a

Microenterprise Best Practices Development Alternatives, Inc.
62
percentage of the end of period loan portfolio. The larger the ratio, the greater theinstitution’s liquidity to fund future growth. However, the magnitude and composition of thestored liquidity will determine whether the institution has achieved an appropriate balancebetween the goals of liquidity and profitability. If the institution’s liquidity is primarily in theform of overdraft facilities and loan commitments, the institution will most probably haveenhanced its productivity of other short-term assets (see Productivity of Other CurrentAssets.
Rating Liability StructureScale Range
5 The institution has a clear financing strategy evidenced by a diversified fundingbase, minimization of financing costs, and an optimal maturity structure of itsliabilities. The institution has ample credibility in the financial system and caneasily access significant resources based on documented arrangements withbanks and past experience.
4 The institution does have a financing strategy, but it has not been successful infully implementing it, resulting in a heavy reliance on a few funding sources.This financial structure does not minimize financing costs nor does it result inan optimal maturity structure. The institution has ample credibility with thefinancial system and access to some future resources, but these arrangementshave not been formalized or documented.
3 The institution does not have a clear financing strategy. It has some credibilityin the financial system and a limited degree of access to resources from thefinancial system.
2 The institution does not have a clear financing strategy. It has limited credibilityin the financial system and limited accessibility to financial resources from thesystem.
1 The institution does not have a financing strategy nor access to resources fromthe financial system, but there is potential for obtaining financial resources.
0 The institution has no financing strategy, no access to resources from thefinancial system, and no potential for obtaining these resources in the nearfuture.
Availability of Funds to Meet Credit Demand (Qualitative)
Studies on loan delinquency show clearly that restrictions on credit are one of the principalcauses of late payment. When the MFI lacks the liquidity to disburse loan funds to clientswho are complying with the terms and conditions of their current loans, it creates a strongdisincentive for repayment. Microfinance NGOs may suffer added liquidity problems if theydepend excessively on donor funds that may be delayed due to bureaucracy. This indicatormeasures the degree to which the institution has delivered credit in a timely and agilemanner.

Chapter Five—CAMEL Scoring
63
Rating Availability of Funds to Meet Credit DemandScale Range
5 Borrowers receive their loans in a timely and agile manner.4 With minor exceptions, the institution is successful at disbursing loans in a
timely and agile manner.3 The institution has occasionally encountered difficulties with timely and agile
disbursement of loans. These difficulties have been resolved but with somedelay.
2 The institution suffers from frequent liquidity problems that translate intoinsufficient funds to increase loans as anticipated by borrowers and/or delaysin disbursement.
1 At times, the institution stops disbursements for lack of liquidity.0 The institution frequently stops disbursement because of liquidity problems.
Cash Flow Projections (Qualitative)
This indicator evaluates the degree to which the institution is successful at accuratelyprojecting the overall cash flow requirements of the institution. In assessing this area, theanalyst looks at current and past cash flow projections prepared by the microfinanceinstitution to determine whether they have been prepared with sufficient detail and analyticalrigor and whether past projections have accurately predicted cash inflows and outflows. Forexample, in projecting loan demand the institution should differentiate between current andnew borrowers, taking into account historical patterns of loan increases for subsequent loans,client desertion rates, and seasonality factors.
Rating Cash Flow ProjectionsScale Range
5 The institution prepares comprehensive cash flow projections that include cashinflows from loan repayment and other sources as well as outflows for creditdisbursement and other expenses for periods of 30, 60, and 90 days. Theseprojections have been prepared in a thorough and easily replicable mannerand have generated figures that are quite close to the actual numbers.
4 The institution prepares cash flow projections for periods of up to 60 days.These projections have been prepared in a thorough and easily replicablemanner and, with few exceptions, have generated results that are close to theactual numbers.
3 The institution prepares cash flow projections for periods of up to 30 days.2 The institution estimates disbursement needs based on past experiences
rather than on the basis of cash flow projections. To date, these estimateshave proven to be close to the institution’s actual disbursement needs.
1 The institution estimates disbursement needs based on past experience.These estimates have proven to be imprecise.
0 The institution does not estimate disbursement needs.

Microenterprise Best Practices Development Alternatives, Inc.
64
Productivity of Other Current Assets (Quantitative)
The ratio for determining this indicator is interest income received on cash and cashequivalents over past 12 months/[(average monthly cash + cash equivalent balances -liquiditycushion)*(average three-month CD rate) + (liquidity cushion*average saving rate)].
Liquidity Cushion
This indicator focuses on the management of current assets other than the loan portfolio;primarily cash and short-term investments. At times it is difficult for microfinanceinstitutions to administer their short-term assets efficiently because of constraints imposed bythird parties such as donors requiring that funds be kept in a segregated account and investedin a specific manner. A microfinance institution with excessive liquidity may produceearnings below that possible with a properly managed liquidity position if, for example, theinstitution keeps large cash balances in checking accounts.
The formula for liquidity cushion—[(operating expenses + financial expenses - depreciation+ loan disbursements - loan repayments)/52] * 4, while intimidating at first glance, isconceptually very simple. It aims to measure whether the MFI maximized the use of its cash,bank accounts, and short-term investments. This implies investing these assets in a timelyfashion and at the highest returns, commensurate with liquidity needs. The institution isequally penalized if its liquidity management is too conservative or too aggressive. Theexaminer compares the interest earned on cash and cash equivalents (checking accounts andup to three-month CDs and Treasury notes) to what the institution could have earned (net ofbank commissions) if it had invested the liquidity cushion component of these funds (asdefined above) in a liquid investment and the balance in a more aggressive investment (three-month CDs). The institution’s cash outflows included in the liquidity cushion are thoseincurred by the MFI in the past 12 months. This amount is divided by 52 weeks and thenmultiplied by 4, assuming that four weeks would be an average duration of a liquidity crisis.
Rating Productivity of Other Current AssetsScale Range
5 + 0 to 10 percent4 +11 to 20 percent3 +21 to 30 percent2 +31 to 40 percent1 +41 to 50 percent0 over 50 percent