the academic resilience scale (ars-30): a new
TRANSCRIPT

The Academic Resilience Scale (ARS-30) : a new multidimensional construct
measureCassidy, SF
http://dx.doi.org/10.3389/fpsyg.2016.01787
Title The Academic Resilience Scale (ARS-30) : a new multidimensional construct measure
Authors Cassidy, SF
Publication title Frontiers in Psychology
Publisher Frontiers
Type Article
USIR URL This version is available at: http://usir.salford.ac.uk/id/eprint/40582/
Published Date 2016
USIR is a digital collection of the research output of the University of Salford. Where copyright permits, full text material held in the repository is made freely available online and can be read, downloaded and copied for non-commercial private study or research purposes. Please check the manuscript for any further copyright restrictions.
For more information, including our policy and submission procedure, pleasecontact the Repository Team at: [email protected].

fpsyg-07-01787 November 16, 2016 Time: 14:6 # 1
ORIGINAL RESEARCHpublished: 18 November 2016
doi: 10.3389/fpsyg.2016.01787
Edited by:Jesus De La Fuente,
University of Almería, Spain
Reviewed by:Rickard Enström,
MacEwan University, CanadaEdward H. Powley,
Naval Postgraduate School, USA
*Correspondence:Simon Cassidy
Specialty section:This article was submitted to
Educational Psychology,a section of the journalFrontiers in Psychology
Received: 27 July 2016Accepted: 31 October 2016
Published: 18 November 2016
Citation:Cassidy S (2016) The Academic
Resilience Scale (ARS-30): A NewMultidimensional Construct Measure.
Front. Psychol. 7:1787.doi: 10.3389/fpsyg.2016.01787
The Academic Resilience Scale(ARS-30): A New MultidimensionalConstruct MeasureSimon Cassidy*
Directorate of Psychology and Public Health, University of Salford, Salford, UK
Resilience is a psychological construct observed in some individuals that accounts forsuccess despite adversity. Resilience reflects the ability to bounce back, to beat theodds and is considered an asset in human characteristic terms. Academic resiliencecontextualizes the resilience construct and reflects an increased likelihood of educationalsuccess despite adversity. The paper provides an account of the development of anew multidimensional construct measure of academic resilience. The 30 item AcademicResilience Scale (ARS-30) explores process—as opposed to outcome—aspects ofresilience, providing a measure of academic resilience based on students’ specificadaptive cognitive-affective and behavioral responses to academic adversity. Findingsfrom the study involving a sample of undergraduate students (N = 532) demonstratethat the ARS-30 has good internal reliability and construct validity. It is suggested thata measure such as the ARS-30, which is based on adaptive responses, aligns moreclosely with the conceptualisation of resilience and provides a valid construct measure ofacademic resilience relevant for research and practice in university student populations.
Keywords: resilience, academic resilience, adversity, measuring resilience, student health and wellbeing, studentretention, self-efficacy, self-regulated learning
INTRODUCTION
Psychological Resilience and Context-Specific ConstructsIdentifying characteristics that enable academic achievement and that distinguish individuals whoare successful from those who are not, setting intellectual capacity aside, remains a worthy pursuitfor educational research and practice. One such characteristic is resilience. Resilience is defined byMasten et al. (1990, p. 426) as “the process of, capacity for, or outcome of successful adaptationdespite challenging or threatening circumstances,” and by Riley and Masten (2005, p. 13) as“referring to patterns of positive adaptation in the face of adversity.”
On the basis that judgements about risk and adversity and evaluations of competencies andoutcomes all relate directly to specific events occurring in specific contexts—in a similar way toself-efficacy beliefs (Bandura, 1997)—the existence and relevance of a unidimensional generalizedglobal resilience construct has been questioned in favor of a multidimensional context-specificapproach to resilience (Liddle, 1994; Waxman et al., 2003; Riley and Masten, 2005). As such,academic [sometimes educational] resilience has emerged as a context-specific form of individualpsychological resilience and, as argued by Colp and Nordstokke (2014), was created to offergreater assessment and prediction specificity to resilience research. Closely related to individualpsychological resilience, which examines the capacity for dealing with challenge and adversity,academic resilience is concerned primarily with the relevance of resilience in educational contexts
Frontiers in Psychology | www.frontiersin.org 1 November 2016 | Volume 7 | Article 1787

fpsyg-07-01787 November 16, 2016 Time: 14:6 # 2
Cassidy The Academic Resilience Scale (ARS-30)
and is defined as “a capacity to overcome acute and/or chronicadversity that is seen as a major threat to a student’s educationaldevelopment” (Martin, 2013, p. 488). Discussing academicresilience, Martin and Marsh (2006) note that whilst there aremany students who perform poorly and continue to performpoorly, there are a significant number of others who manageto turn around their academic misfortunes, flourishing andthriving despite adversity. An often-cited adversity that affectsacademic achievement is poverty (Kanevsky et al., 2008), and itis the capacity of some children to overcome the limitations ofpoverty and to succeed when others do not (Gizir, 2004), thatillustrates the existence of individual resilience and underlines itsimportance as a psychological construct. In an academic context,resilience is characterized by those students that present with thecapacity to reverse academic misfortune and failure and succeedwhile others continue to perform poorly and fail (Martin andMarsh, 2006).
Resilience is—universally—considered a strength or asset, adesirable and advantageous quality, characteristic or processthat is likely to impact positively on aspects of an individual’sperformance, achievement, health and wellbeing (Bartley et al.,2010). Martin and Marsh (2009), for instance, refer to theirapproach to academic resilience as an inherently asset-orientated,strength-based and aspirational approach to students’ responseto academic adversity and the benefits of academic resilience aredemonstrated by studies that report resilience as a significantpredictor of coping at university (McLafferty et al., 2012), thatreport a positive relationship between academic resilience andacademic achievement (Fallon, 2010), that suggest the potentialto foster increased resilience through interventions (Gardynik,2008) and that report the positive effects of educationalinterventions that incorporate aspects of academic resilience(Martin and Marsh, 2008). Martin and Marsh (2006) havesuggested that that all students, at some point, will experiencepoor performance, challenge or pressure. Citing the work ofTopham and Moller (2011), along with increasing suicide figuresamong university students (Office for National Statistics, 2013),Cheng and Catling (2015) suggest that university students havean increased vulnerability to mental illness that implies lowresilience in coping with academic stress and change. Consideredtogether, these points help to illustrate the continued relevance ofacademic resilience and its value as a desirable characteristic instudents.
Measuring ResilienceIn accepting the value and relevance of resilience, we arefaced with the task of capturing its essence in a reliable andvalid construct measure. As with many latent psychologicalconstructs, measurement of resilience has inevitably involvedpsychometric scales. Examples of notable resilience scales includeWagnild and Young’s (1993) Resilience Scale, the Connor-Davidson Resilience Scale (Connor and Davidson, 2003), theResilience Scale for Adults (Friborg et al., 2003) and the BriefResilience Scale (Smith et al., 2008). Each of these scales presentsrespondents with attitudinal statements constructed accordingto characteristics commonly associated with resilience. Theseinclude personal and social competence, acceptance of self and
life, self-esteem, action-orientation, adaptability, goal-orientatedstrategies, problem solving, social support and family coherence,personal structure, sense of humor, endurance, and optimism andrelate to the key resilience categories of dispositional attributes,family cohesion, and external supporting systems (Hoge et al.,2007). The emergent factor structure of these scales can providefurther insight in to the composite elements of resilience.The Connor-Davidson Resilience Scale, for example, has beenreported as yielding a five factor structure: personal competence,high standards and tenacity; trust in one’s instincts, toleranceof negative affect and strengthening effect of stress/stress-relatedgrowth; positive acceptance of change and secure personalrelationships; personal control; and spiritual influences/spiritualorientation to the future, with personal competence, highstandards and tenacity identified as the factor accounting for thelargest proportion of variance (Connor and Davidson, 2003; seealso Lamond et al., 2009).
The reported factor structure for the Connor-DavidsonResilience Scale is not fully consistent (Campbell-Sills and Stein,2007; Lamond et al., 2009; Green et al., 2014), and with thehardiness characteristics of commitment, control and challengealso reported as features of resilience, Hoge et al. (2007) notesthat despite the development of a number of scales purporting tomeasure resilience, there exists little consensus regarding whichof these scales best captures and quantifies the construct ofresilience. Lamond et al. (2009) also notes the lack of consensuson the construct definition of resilience and Hoge et al. (2007)go on to suggest that this lack of consensus is indicative ofan inherent difficulty in defining the ‘notion’ of resilience; themeasurement of academic resilience does not transcend this‘inherent difficulty.’
Whilst interest in the field continues (e.g., Ricketts et al.,2015; Edwards et al., 2016), research specifically focussing onacademic resilience is limited, and advances in terms of definingthe construct and its associated predictive factors has been slow(Martin, 2002; Martin et al., 2010). Such advances, it is argued, area necessary precondition for subsequent advances in constructmeasurement and this may, in part, explain the lack of availablestandardized measures of academic resilience (Cassidy, 2015).Although reference to standardized context-specific measures arerare, one popular measure—often cited in the related literature—used to measure academic resilience was presented by Martin andMarsh (2006) in their study examining educational correlates ofresilience in high school children. Comprising just six items, thisacademic resilience subscale asks students to rate their abilityto deal with setbacks, challenge, adversity and pressure in anacademic setting. Individual items refer specifically to mentaltoughness, study stress, bouncing back from a poor mark, dealingwith schoolwork pressures, confidence and dealing with suchsetbacks as bad marks and negative feedback. Although a briefattitudinal scale developed for use with school children, theMartin and Marsh scale arguably remains the prevalent measureof academic resilience currently available.
Present StudyQuestioning the validity of resilience measures that captureonly state characteristics or positive attitudes or mood,
Frontiers in Psychology | www.frontiersin.org 2 November 2016 | Volume 7 | Article 1787

fpsyg-07-01787 November 16, 2016 Time: 14:6 # 3
Cassidy The Academic Resilience Scale (ARS-30)
and referring to a definition of resilience that includesreference to a response to some specific event or situation,Hoge et al. (2007) argue that resilience should in fact bemeasured by observing individuals during a stressful experienceand assessing how well they return to normal functioning(i.e., capacity for ‘bouncing back’), “a true resilience scalemeasures an individual’s reaction to an experimental stressparadigm.” (Hoge et al., 2007, p. 147). Friedland (2005) alsoemphasizes the importance of behavioral responses (in additionto attitudinal measures) in the measurement of resilience,yet the majority of studies examining academic resilienceemploy generalized attitudinal response scales, mainly withsamples of school children. Thus, there is an apparent lackof suitably developed standardized construct measures availableto investigate academic resilience, particularly in samples ofuniversity students (Khalaf, 2014).
Waxman et al. (2003) have described resilience as referringto factors and processes that limit negative behaviors associatedwith stress and result in adaptive outcomes in the presenceof adversity, while Morales (2008), citing McGubbin (2001),notes the discussion of resilience that considers whetherit should be characterized in terms of an outcome (e.g.,academic success, good grades) or process (e.g., protectivefactors such as a strong work ethic that helps mitigate riskand adversity). The present study offers an alternative process-based measure of academic resilience, focusing on adaptiveand non-adaptive cognitive-affective and behavioral responses toacademic adversity. Recognizing the need for significant adversityand adequate adaptability in the face of such adversity (Rileyand Masten, 2005; Hoge et al., 2007), the 30 item AcademicResilience Scale (ARS-30) developed in the present studymeasures the responses of university students to a hypothetical,but authentic, academic adversity case vignette. The vignettewas developed to portray adversity in an educational context,allowing students to respond in an adaptive or non-adaptivemanner, thus providing a measure of academic resilience that isbased on responses to a specific instance of academic adversityin a similar way to other resilience scales developed to captureresilience responses to specific life events (e.g., Hardy et al.,2004).
Self-regulated learning (SRL) has been conceptualized as theway in which learners control their thoughts, feelings and actionsin order to achieve academically (Zimmerman and Schunk,2001) and self-efficacy as “people’s judgments of their capabilitiesto organize and execute courses of action required to attaindesignated types of performances” (Bandura, 1997, p. 391). Bothconcepts are salient features of the literature related to academicresilience. Martin and Marsh (2006) for example refer closely
to these concepts when proposing their 5-C model of academicresilience: confidence (self-efficacy), commitment (persistence),coordination (planning), control (how hard work and effectivestrategies impact achievement) and composure (low anxiety), andNewman (2002) and Sautelle et al. (2015) reported an associationbetween high self-regulation (including adaptive help-seeking)and resilience. As such, the items comprising the ARS-30 wereselected to reflect the conceptual areas of self-efficacy and self-regulation together with the range of attributes, characteristicsand factors commonly associated with resilience.
A principal feature of resilience is the capacity to bounce back[from adversity], to recover and restore previous, pre-adversity,level normal functioning (Smith et al., 2008). In combining theacademic adversity vignette with the presentation of associatedadaptive and non-adaptive cognitive-affective and behavioralresponses, it is suggested that the ARS-30 encompasses, tosome degree, both the stressful experience and the quantificationof the capacity to return to normal functioning posited asnecessary components of a true measure of [academic] resilience(Friedland, 2005; Hoge et al., 2007). It is argued that theadversity vignette represents the critical incident from whichit is necessary to recover and the degree to which adaptiveresponses are selected [over non-adaptive responses] conferscapacity for ‘bounce back.’ The aim of the present studyis to assess, evaluate and report the psychometric propertiesof the ARS-30 and consider its potential as a valid andreliable construct measure of academic resilience in universitystudents.
MATERIALS AND METHODS
Participants and DesignThe sample consisted of 532 British undergraduate universitystudents (mean age 22.4 years, SD = 6.2). The mainanalysis was conducted using a sub-group of 321 participantswho completed the original vignette version of the ARS-30(Table 1); the remaining participants (n = 211) completedthe alternative vignette version of the ARS-30 that was usedto assess discriminant validity [see Section The AcademicResilience Scale-30 (ARS-30)]. Participants were randomlyallocated to sub-groups. The nature of the study—questionnairedevelopment—required that a self-report questionnaire-baseddesign with correlational and between-subjects componentswas employed. Academic resilience and academic self-efficacymeasures were completed during a single data collectionpoint at which time participants’ gender, age and yearof study data were also recorded. Though females were
TABLE 1 | Sample details by sub-group.
Sub-group N Mean Age (SD) n
Males Females Year 1 Year 2 Year 3
Original vignette group 321 22.4 (6.4) 56 264 237 52 31
Alternative-vignette group 211 22.5 (5.8) 34 176 157 22 32
Frontiers in Psychology | www.frontiersin.org 3 November 2016 | Volume 7 | Article 1787

fpsyg-07-01787 November 16, 2016 Time: 14:6 # 4
Cassidy The Academic Resilience Scale (ARS-30)
overrepresented in the sample, introducing potential bias in tothe data, this imbalance has been reported as representativeof typical undergraduate intakes in a number of disciplinesincluding psychology, education, subjects allied to medicine,social science, creative arts and design, veterinary science,languages and law (Bourne, 2014; Hillman and Robinson,2016) and reflects the growing trend for females to outnumbermales on two thirds of university courses (Universities andColleges Admissions Service [UCAS], 2016) and in five sixthsof higher education institutions (Hillman and Robinson,2016).
MaterialsThe Academic Resilience Scale-30 (ARS-30)The aim underlying the ARS-30 was to develop a context-specificconstruct measure of academic resilience based on studentresponses to academic adversity. Scale items thus represent asample of relevant positively and negatively phrased cognitive-affective and behavioral responses to adversity informed by, andderived from, the published literature in the fields of individualpsychological resilience and academic resilience, self-regulatedlearning (Zimmerman and Schunk, 2001) and self-efficacy(Bandura, 1997). All items were formulated in to statementsthat align with accepted good practice for questionnaire design(Oppenheim, 1992; Kline, 1993). Responses to the 30 scale itemswere made by participants, along a 5-point Likert scale from likely(1) to unlikely (5), once they have been exposed to (i.e., hadread) a short vignette. The vignette was constructed to portray anexample of academic adversity, representing significant academicchallenge and struggle:
You have received your mark for a recent assignment and itis a ‘fail.’ The marks for two other recent assignments werealso poorer than you would want as you are aiming to get asgood a degree as you can because you have clear career goals inmind and don’t want to disappoint your family. The feedbackfrom the tutor for the assignment is quite critical, includingreference to ‘lack of understanding’ and ‘poor writing andexpression,’ but it also includes ways that the work could beimproved. Similar comments were made by the tutors whomarked your other two assignments.
Participants are asked to imagine themselves as the studentcharacterized in the vignette and thus experiencing academicadversity. Scoring of positively phrased items was reversed sothat a high ARS-30 score indicated greater academic resilience.With each of the scale items weighted equally, the global ARS-30 score, achieved by summing responses to the 30 individualitems, has a theoretical range of 30–150. The scale and vignettewere piloted with a group of final year undergraduate studentsto gather feedback on the authenticity of the vignette and therelevance of the list of 30 potential associated scale items. All 30items were retained and no revisions were made to the vignette asa result of piloting.
For the purposes of assessing discriminate validity analternative form of the vignette was also used in the study.The original vignette was modified so that, in its alternative
form, it now depicted academic adversity being experienced bya fellow student; participants now had to complete the ARS-30 according to how they felt the student represented in thealternative vignette should respond to adversity, e.g., ‘He shouldkeep trying’ (Cassidy, 2015):
John has received a mark for a recent assignment and itis a ‘fail.’ The marks John received for two other recentassignments were also poorer than he would want as he isaiming to get as good a degree as he can because he hasclear career goals in mind and doesn’t want to disappointhis family. The feedback John received from the tutor for thefailed assignment is quite critical, including reference to ‘lackof understanding’ and ‘poor writing and expression,’ but italso includes ways that the work could be improved. Similarcomments were made by the tutors who marked John’s othertwo assignments.
The General Academic Self-Efficacy Scale (GASE)The General Academic Self-Efficacy Scale (GASE) is a measure ofgeneral academic self-efficacy developed for use with universitystudents. Participants respond to 23 statements relating to self-efficacy beliefs in an academic context according to their levelof agreement with each statement, from completely disagree tocompletely agree using a 9-point Likert scale. Example itemsinclude: ‘I know I have the ability to complete this coursesuccessfully’; ‘I have some doubts about my ability to grasp someof the topics taught on this course’; ‘I know I have the ability topass my examinations without too much difficulty.’ The authorsof the scale report high internal (α= 0.86) and external (r= 0.71)reliability and suggest that significant correlations with measuresof academic locus of control and computer user self-efficacydemonstrate the scale’s construct validity (Cassidy and Eachus,2002). The GASE has a theoretical range of 23–207, with higherscores indicating greater academic self-efficacy (i.e., more positiveacademic self-efficacy beliefs).
ProcedureOnce informed consent had been obtained participantscompleted the GASE and ARS-30 together with a demographicsquestionnaire recording age, gender, and year of study. A sub-group of the sample (n = 211) completed the ASR-30 followingexposure to the alternative vignette modified to depict academicadversity experienced by a fellow student instead of beingpersonally experienced by the participant [see Section TheAcademic Resilience Scale-30 (ARS-30)]. The remainder ofthe sample (n = 321) completed the ARS-30 on the basis ofthe original—personal adversity—vignette [see Section TheAcademic Resilience Scale-30 (ARS-30)]. Participants wererandomly assigned to the sub-groups exposed to either thealternative or original vignette. Data collection was anonymousin order to improve the validity of responses.
The study was carried out in accordance with therecommendations of both the British Psychological SocietyCode of Ethics and Conduct and the Research, Innovation andAcademic Engagement Ethical Approval Panel, University of
Frontiers in Psychology | www.frontiersin.org 4 November 2016 | Volume 7 | Article 1787

fpsyg-07-01787 November 16, 2016 Time: 14:6 # 5
Cassidy The Academic Resilience Scale (ARS-30)
Salford with written informed consent from all participants inaccordance with the Declaration of Helsinki.
RESULTS
Descriptive StatisticsTable 2 presents mean scores and standard deviations foreach of the 30 items of the ARS-30, along with the globalacademic resilience score, based on the responses of a sample ofundergraduate students (n = 321). For all items, a higher score(range 1–5) indicates greater agreement with the statement. Theglobal ARS-30 score represents the summation of responses tothe 30 individual items, with a higher global score (theoreticalrange 30–150) reflecting greater academic resilience.
TABLE 2 | Mean score and standard deviation for individual academicresilience items Academic Resilience Scale (ARS-30).
Item Mean ± SD
(1) I would not accept the tutors’ feedback 4.26 ± 1.11
(2) I would use the feedback to improve my work 4.75 ± 0.55
(3) I would just give up 4.47 ± 0.86
(4) I would use the situation to motivate myself 4.13 ± 1.02
(5) I would change my career plans 4.14 ± 0.98
(6) I would probably get annoyed 2.54 ± 1.21
(7) I would begin to think my chances of success at universitywere poor
3.17 ± 1.12
(8) I would see the situation as a challenge 3.88 ± 1.03
(9) I would do my best to stop thinking negative thoughts 3.84 ± 1.02
(10) I would see the situation as temporary 3.70 ± 1.02
(11) I would work harder 4.61 ± 0.78
(12) I would probably get depressed 3.22 ± 1.22
(13) I would try to think of new solutions 4.17 ± 0.82
(14) I would be very disappointed 1.83 ± 1.12
(15) I would blame the tutor 4.31 ± 0.93
(16) I would keep trying 4.52 ± 0.72
(17) I would not change my long-term goals and ambitions 4.13 ± 0.98
(18) I would use my past successes to help motivate myself 4.26 ± 0.94
(19) I would begin to think my chances of getting the job I wantwere poor
3.38 ± 1.17
(20) I would start to monitor and evaluate my achievements andeffort
3.99 ± 0.96
(21) I would seek help from my tutors 4.30 ± 0.99
(22) I would give myself encouragement 4.03 ± 0.96
(23) I would stop myself from panicking 3.41 ± 1.15
(24) I would try different ways to study 4.03 ± 0.95
(25) I would set my own goals for achievement 4.13 ± 0.85
(26) I would seek encouragement from my family and friends 3.77 ± 1.31
(27) I would try to think more about my strengths andweaknesses to help me work better
4.05 ± 0.93
(28) I would feel like everything was ruined and was going wrong 3.47 ± 1.23
(29) I would start to self-impose rewards and punishmentsdepending on my performance
2.84 ± 1.22
(30) I would look forward to showing that I can improve mygrades
4.27 ± 0.91
Global ARS-30 score 115.61 ± 14.78
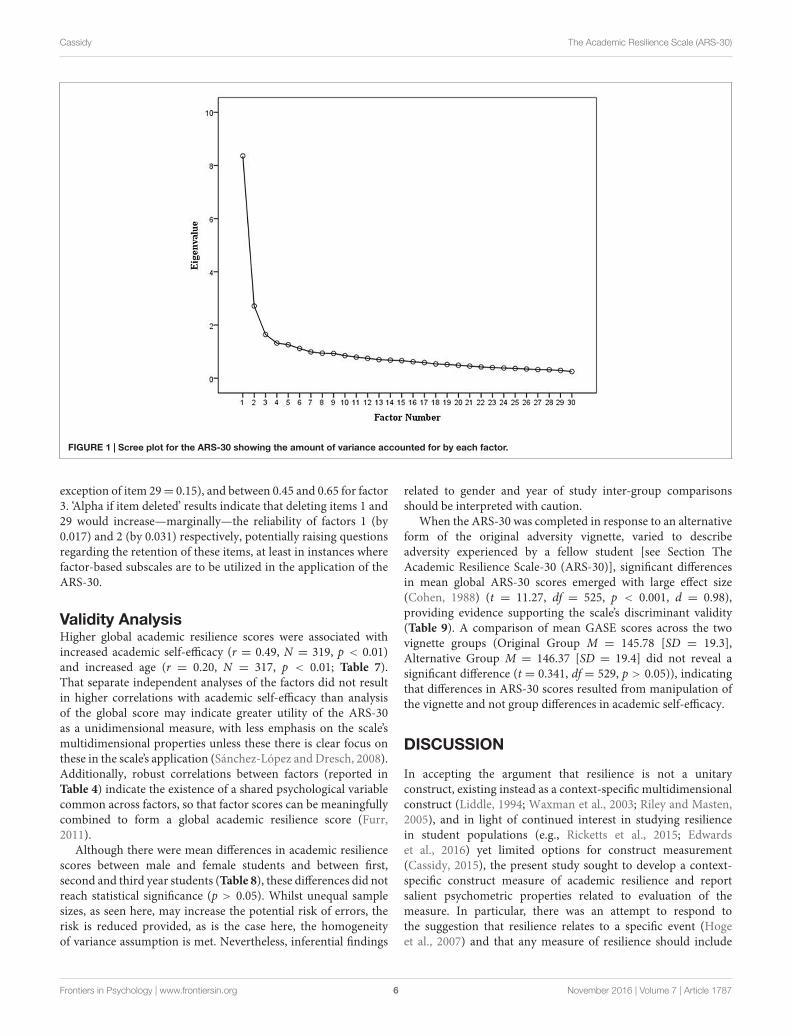
Factor StructureThe scree plot presented in Figure 1 indicates that there are threemeaningful factors for extraction, including factor 3 located at thepoint of inflection (Cattell, 1966; Field, 2013). Initial retentionof three factors is supported by the total variance of 42.4%accounted for by the three factors: 27, 9.1, and 5.5%, respectively.Given that the sample size exceeds 200 the scree plot is considereda reliable basis for factor selection (Stevens, 2002; Field, 2013).Equally, retention of the three factors meets Kaiser’s (1960)criterion for retaining factors with eigenvalues greater than1(factor 1 = 8.359, factor 2 = 2.716, factor 3 = 1.644), althoughKaiser’s criteria was not the primary criterion for selection giventhe suggestion that this can overestimate the number of factorsto be retained (Field, 2013). Sampling adequacy was verified byKMO = 0.897 (Kaiser, 1970; Hutcheson and Sofroniou, 1999, ascited in Field, 2013). Bartlett’s test of sphericity (χ2
= 3457.39,df = 435, p < 0.001) and determinant of R-matrix > 0.00001indicate that inter-variable correlations are suitable for factoranalysis (Field, 2013).
Table 3 shows factor loadings after maximum likelihoodoblique (promax) rotation, with loading of 0.3 and above in bold(Field, 2013). Item clustering suggests that factor 1 (items 1, 2, 3,4, 5, 8, 9, 10, 11, 13, 15, 16, 17, and 30) represents perseverance,factor 2 (items 18, 20, 21, 22, 24, 25, 26, 27, and 29) reflecting andadaptive help-seeking and factor 3 (items 6, 7, 12, 14, 19, 23, and28) negative affect and emotional response.
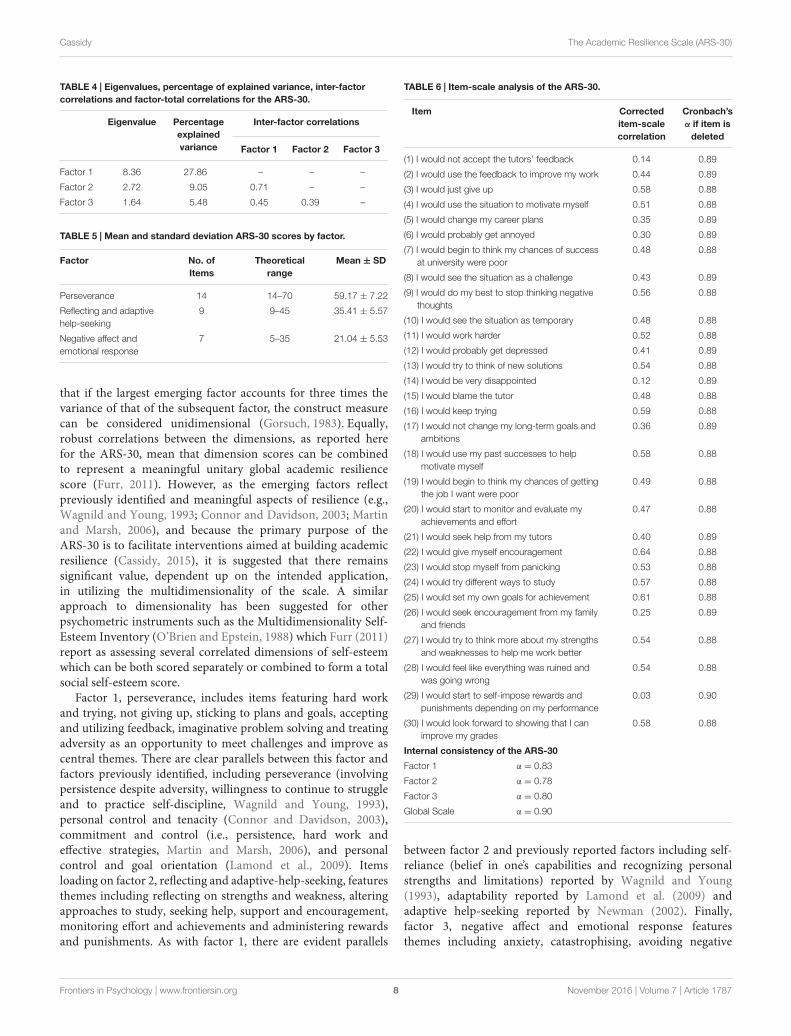
The inter factor correlations presented in Table 4 indicatemedium to large positive correlations between the three factors.Increased perseverance was associated with increased reflectingand adaptive help-seeking (r = 0.71) and increased avoidanceof negative affective and emotional response (r = 0.45);increased reflecting and adaptive help-seeking was associatedwith increased avoidance of negative affective and emotionalresponse (r = 0.39).
Table 5 presents mean scores and standard deviations foreach of the three factors of the ARS-30, perseverance, reflectingand adaptive help-seeking, and negative affect and emotionalresponse based on the responses from a sample of undergraduatestudents (n = 321). For each factor, the factor score representsthe summation of responses to the individual items loadinghighest on that factor (Table 3), with higher scores reflectingmore adaptive responses for each factor.
Reliability AnalysisItem-scale analysis is presented in Table 6 for the ARS-30.Cronbach’s α of 0.90 indicated high internal consistency reliabilityfor the global scale (i.e., summation of the 30 items). All item-total correlations were above 0.3 (Field, 2013) with the exceptionof items 1 (0.14) and 14 (0.12); as deletion of these items doesnot increase the overall Cronbach’s α it is suggested that all itemsare contributing positively to the scale’s reliability, supporting thecase for retaining these items (Field, 2013). Cronbach’s α was alsoacceptable for each of the three retained factors: factor 1 α= 0.83;factor 2 α = 0.78; and factor 3 α = 0.80. Item-total correlationsranged between 0.41 and 0.63 for factor 1(with the exceptionof item 1 = 0.11), between 0.37 and 0.65 for factor 2 (with the
Frontiers in Psychology | www.frontiersin.org 5 November 2016 | Volume 7 | Article 1787
fpsyg-07-01787 November 16, 2016 Time: 14:6 # 6
Cassidy The Academic Resilience Scale (ARS-30)
FIGURE 1 | Scree plot for the ARS-30 showing the amount of variance accounted for by each factor.
exception of item 29= 0.15), and between 0.45 and 0.65 for factor3. ‘Alpha if item deleted’ results indicate that deleting items 1 and29 would increase—marginally—the reliability of factors 1 (by0.017) and 2 (by 0.031) respectively, potentially raising questionsregarding the retention of these items, at least in instances wherefactor-based subscales are to be utilized in the application of theARS-30.
Validity AnalysisHigher global academic resilience scores were associated withincreased academic self-efficacy (r = 0.49, N = 319, p < 0.01)and increased age (r = 0.20, N = 317, p < 0.01; Table 7).That separate independent analyses of the factors did not resultin higher correlations with academic self-efficacy than analysisof the global score may indicate greater utility of the ARS-30as a unidimensional measure, with less emphasis on the scale’smultidimensional properties unless these there is clear focus onthese in the scale’s application (Sánchez-López and Dresch, 2008).Additionally, robust correlations between factors (reported inTable 4) indicate the existence of a shared psychological variablecommon across factors, so that factor scores can be meaningfullycombined to form a global academic resilience score (Furr,2011).
Although there were mean differences in academic resiliencescores between male and female students and between first,second and third year students (Table 8), these differences did notreach statistical significance (p > 0.05). Whilst unequal samplesizes, as seen here, may increase the potential risk of errors, therisk is reduced provided, as is the case here, the homogeneityof variance assumption is met. Nevertheless, inferential findings
related to gender and year of study inter-group comparisonsshould be interpreted with caution.
When the ARS-30 was completed in response to an alternativeform of the original adversity vignette, varied to describeadversity experienced by a fellow student [see Section TheAcademic Resilience Scale-30 (ARS-30)], significant differencesin mean global ARS-30 scores emerged with large effect size(Cohen, 1988) (t = 11.27, df = 525, p < 0.001, d = 0.98),providing evidence supporting the scale’s discriminant validity(Table 9). A comparison of mean GASE scores across the twovignette groups (Original Group M = 145.78 [SD = 19.3],Alternative Group M = 146.37 [SD = 19.4] did not reveal asignificant difference (t = 0.341, df = 529, p > 0.05)), indicatingthat differences in ARS-30 scores resulted from manipulation ofthe vignette and not group differences in academic self-efficacy.
DISCUSSION
In accepting the argument that resilience is not a unitaryconstruct, existing instead as a context-specific multidimensionalconstruct (Liddle, 1994; Waxman et al., 2003; Riley and Masten,2005), and in light of continued interest in studying resiliencein student populations (e.g., Ricketts et al., 2015; Edwardset al., 2016) yet limited options for construct measurement(Cassidy, 2015), the present study sought to develop a context-specific construct measure of academic resilience and reportsalient psychometric properties related to evaluation of themeasure. In particular, there was an attempt to respond tothe suggestion that resilience relates to a specific event (Hogeet al., 2007) and that any measure of resilience should include
Frontiers in Psychology | www.frontiersin.org 6 November 2016 | Volume 7 | Article 1787

fpsyg-07-01787 November 16, 2016 Time: 14:6 # 7
Cassidy The Academic Resilience Scale (ARS-30)
TABLE 3 | Maximum likelihood estimates of the oblique (promax) rotated factor loadings for the ARS-30.
ARS-30 Item Factor loadings
Factor 1 Factor 2 Factor 3
Factor 1 (Perseverance):
(11) I would work harder 0.776 −0.013 −0.174
(16) I would keep trying 0.758 −0.008 −0.046
(2) I would use the feedback to improve my work 0.685 −0.069 −0.129
(3) I would just give up 0.629 −0.136 0.242
(13) I would try to think of new solutions 0.629 0.096 −0.085
(5) I would change my career plans 0.585 −0.247 0.080
(4) I would use the situation to motivate myself 0.505 0.030 0.079
(17) I would not change my long-term goals and ambitions 0.502 −0.053 −0.033
(8) I would see the situation as a challenge 0.427 0.154 −0.097
(30) I would look forward to showing that I can improve my grades 0.429 0.242 0.047
(10) I would see the situation as temporary 0.384 0.033 0.182
(9) I would do my best to stop thinking negative thoughts 0.290 0.161 0.254
(15) I would blame the tutor 0.260 0.158 0.168
(1) I would not accept the tutors’ feedback 0.146 −0.063 0.103
Factor 2 (Reflecting and adaptive help-seeking):
(27) I would try to think more about my strengths and weaknesses to help me work better −0.046 0.823 −0.098
(22) I would give myself encouragement −0.010 0.707 0.145
(26) I would seek encouragement from my family and friends −0.211 0.580 −0.024
(24) I would try different ways to study 0.104 0.571 0.033
(25) I would set my own goals for achievement 0.212 0.563 −0.026
(21) I would seek help from my tutors 0.055 0.448 0.016
(20) I would start to monitor and evaluate my achievements and effort 0.322 0.356 −0.144
(29) I would start to self-impose rewards and punishments depending on my performance −0.101 0.323 −0.207
(18) I would use my past successes to help motivate myself 0.317 0.321 0.095
Factor 3 (Negative affect and emotional response):
(28) I would feel like everything was ruined and was going wrong 0.049 0.015 0.730
(7) I would begin to think my chances of success at university were poor 0.093 −0.074 0.672
(12) I would probably get depressed 0.058 −0.107 0.669
(14) I would be very disappointed −0.386 −0.001 0.657
(19) I would begin to think my chances of getting the job I want were poor 0.144 −0.085 0.635
(6) I would probably get annoyed −0.138 0.074 0.505
(23) I would stop myself from panicking 0.073 0.281 0.386
KMO Bartlett’s sphericity Determinant
0.9 χ2 = 3457.39, p < 0.001 1.36
Eigenvalues 8.36 2.72 1.64
% of variance 27.86 9.05 5.48
Cronbach’s α 0.83 0.78 0.80
behavioral responses to that event (Friedland, 2005). The thirty-item Academic Resilience Scale (ARS-30) is a context-specificmeasure of academic resilience comprising cognitive-affectiveand behavioral responses to adversity in an academic setting.Scale items are drawn from theoretically relevant conceptdomains including self-efficacy and self-regulated learning andreflect commonly cited definitions and dispositional attributesassociated with psychological resilience (Hoge et al., 2007).
Factor StructureExploratory factor analysis was conducted to investigate thefactor structure of the ARS-30. Three factors emerged: factor
1, interpreted as perseverance; factor 2, interpreted as reflectingand adaptive-help-seeking; and factor 3, interpreted as negativeaffect and emotional response. The emerging factors accountedfor a total of 42.4% of variance in academic resilience scoresand resemble factors previously reported in studies focussing onthe measurement of resilience (e.g., Connor and Davidson, 2003;Hoge et al., 2007; Lamond et al., 2009) as well as reflecting aspectsof self-regulation and self-efficacy. The most important factor wasperseverance, accounting for 27% of variance. This was followedby reflecting and adaptive-help-seeking, accounting for 9.1%of variance, and finally negative affect and emotional responseaccounting for 5.5% of variance. Some authors have suggested
Frontiers in Psychology | www.frontiersin.org 7 November 2016 | Volume 7 | Article 1787
fpsyg-07-01787 November 16, 2016 Time: 14:6 # 8
Cassidy The Academic Resilience Scale (ARS-30)
TABLE 4 | Eigenvalues, percentage of explained variance, inter-factorcorrelations and factor-total correlations for the ARS-30.
Eigenvalue Percentageexplainedvariance
Inter-factor correlations
Factor 1 Factor 2 Factor 3
Factor 1 8.36 27.86 – – –
Factor 2 2.72 9.05 0.71 – –
Factor 3 1.64 5.48 0.45 0.39 –
TABLE 5 | Mean and standard deviation ARS-30 scores by factor.
Factor No. ofItems
Theoreticalrange
Mean ± SD
Perseverance 14 14–70 59.17 ± 7.22
Reflecting and adaptivehelp-seeking
9 9–45 35.41 ± 5.57
Negative affect andemotional response
7 5–35 21.04 ± 5.53
that if the largest emerging factor accounts for three times thevariance of that of the subsequent factor, the construct measurecan be considered unidimensional (Gorsuch, 1983). Equally,robust correlations between the dimensions, as reported herefor the ARS-30, mean that dimension scores can be combinedto represent a meaningful unitary global academic resiliencescore (Furr, 2011). However, as the emerging factors reflectpreviously identified and meaningful aspects of resilience (e.g.,Wagnild and Young, 1993; Connor and Davidson, 2003; Martinand Marsh, 2006), and because the primary purpose of theARS-30 is to facilitate interventions aimed at building academicresilience (Cassidy, 2015), it is suggested that there remainssignificant value, dependent up on the intended application,in utilizing the multidimensionality of the scale. A similarapproach to dimensionality has been suggested for otherpsychometric instruments such as the Multidimensionality Self-Esteem Inventory (O’Brien and Epstein, 1988) which Furr (2011)report as assessing several correlated dimensions of self-esteemwhich can be both scored separately or combined to form a totalsocial self-esteem score.
Factor 1, perseverance, includes items featuring hard workand trying, not giving up, sticking to plans and goals, acceptingand utilizing feedback, imaginative problem solving and treatingadversity as an opportunity to meet challenges and improve ascentral themes. There are clear parallels between this factor andfactors previously identified, including perseverance (involvingpersistence despite adversity, willingness to continue to struggleand to practice self-discipline, Wagnild and Young, 1993),personal control and tenacity (Connor and Davidson, 2003),commitment and control (i.e., persistence, hard work andeffective strategies, Martin and Marsh, 2006), and personalcontrol and goal orientation (Lamond et al., 2009). Itemsloading on factor 2, reflecting and adaptive-help-seeking, featuresthemes including reflecting on strengths and weakness, alteringapproaches to study, seeking help, support and encouragement,monitoring effort and achievements and administering rewardsand punishments. As with factor 1, there are evident parallels
TABLE 6 | Item-scale analysis of the ARS-30.
Item Correcteditem-scalecorrelation
Cronbach’sα if item is
deleted
(1) I would not accept the tutors’ feedback 0.14 0.89
(2) I would use the feedback to improve my work 0.44 0.89
(3) I would just give up 0.58 0.88
(4) I would use the situation to motivate myself 0.51 0.88
(5) I would change my career plans 0.35 0.89
(6) I would probably get annoyed 0.30 0.89
(7) I would begin to think my chances of successat university were poor
0.48 0.88
(8) I would see the situation as a challenge 0.43 0.89
(9) I would do my best to stop thinking negativethoughts
0.56 0.88
(10) I would see the situation as temporary 0.48 0.88
(11) I would work harder 0.52 0.88
(12) I would probably get depressed 0.41 0.89
(13) I would try to think of new solutions 0.54 0.88
(14) I would be very disappointed 0.12 0.89
(15) I would blame the tutor 0.48 0.88
(16) I would keep trying 0.59 0.88
(17) I would not change my long-term goals andambitions
0.36 0.89
(18) I would use my past successes to helpmotivate myself
0.58 0.88
(19) I would begin to think my chances of gettingthe job I want were poor
0.49 0.88
(20) I would start to monitor and evaluate myachievements and effort
0.47 0.88
(21) I would seek help from my tutors 0.40 0.89
(22) I would give myself encouragement 0.64 0.88
(23) I would stop myself from panicking 0.53 0.88
(24) I would try different ways to study 0.57 0.88
(25) I would set my own goals for achievement 0.61 0.88
(26) I would seek encouragement from my familyand friends
0.25 0.89
(27) I would try to think more about my strengthsand weaknesses to help me work better
0.54 0.88
(28) I would feel like everything was ruined andwas going wrong
0.54 0.88
(29) I would start to self-impose rewards andpunishments depending on my performance
0.03 0.90
(30) I would look forward to showing that I canimprove my grades
0.58 0.88
Internal consistency of the ARS-30
Factor 1 α = 0.83
Factor 2 α = 0.78
Factor 3 α = 0.80
Global Scale α = 0.90
between factor 2 and previously reported factors including self-reliance (belief in one’s capabilities and recognizing personalstrengths and limitations) reported by Wagnild and Young(1993), adaptability reported by Lamond et al. (2009) andadaptive help-seeking reported by Newman (2002). Finally,factor 3, negative affect and emotional response featuresthemes including anxiety, catastrophising, avoiding negative
Frontiers in Psychology | www.frontiersin.org 8 November 2016 | Volume 7 | Article 1787

fpsyg-07-01787 November 16, 2016 Time: 14:6 # 9
Cassidy The Academic Resilience Scale (ARS-30)
TABLE 7 | Correlation coefficients between ARS-30 and General AcademicSelf-Efficacy Scale (GASE).
ARS-30 GASE
r p N
Global score 0.49 <0.01 319
Factor 1 0.48 <0.01 320
Factor 2 0.35 <0.01 320
Factor 3 0.31 <0.01 319
emotional responses, optimism and hopelessness and is similar toacceptance of negative affect reported by Connor and Davidson(2003) and Lamond et al. (2009), composure (low anxiety)reported by Martin and Marsh (2006) and meaningfulness (thebelief that one has purpose in life and something to live for)reported by Wagnild and Young (1993).
Each of the emerging factors represents common featuresevident in existing research studies investigating resilience, withclear similarities and overlaps with concepts and constructsidentified as relevant in previous studies of general and context-specific resilience. Thus, the emerging factor structure, and thedegree to which it relates to accepted theoretical definitionsand relevant constituents of resilience, supports the constructvalidity of the ASR-30 and the notion of academic resilience asa context-specific—multidimensional—resilience construct.
ReliabilityItem analysis presented convincing evidence for the internalconsistency reliability of the scale, with the reported Cronbach’salpha of 0.90 exceeding levels normally considered acceptable(Cronbach, 1990; Field, 2013). Equally acceptable alphas between0.78 and 0.83 were reported for factor level reliability analysis.Low item-total correlations did raise doubts regarding thefunctioning of three items (items, 1, 14, and 29). However, asdeletion of these items did not raise the overall reliability of theglobal scale, and did so only marginally at factor level, they wereretained on the basis that all items contributed positively to theinternal reliability of the scale (Field, 2013).
ValidityPrevious studies have reported significant associations betweenresilience and theoretically relevant constructs including self-efficacy (Hamill, 2003; Martin and Marsh, 2006, 2008). Thesignificant positive correlation between ARS-30 scores andacademic self-efficacy (r = 0.49) reported in the present studyserves to demonstrate the concurrent validity of the scale. Thediscriminant validity of the scale was supported by significant
TABLE 9 | Mean global ARS-30 score by vignette group.
Mean ARS-30 Score ± SD
Original vignette group (n = 319) Alternative vignette group (n = 208)
115.61 ± 14.78 128.54 ± 11.46
mean differences and large effect size (d = 0.98) in ASR-30 responses to two independent versions of the academicadversity vignette (p < 0.001), which was not explained by groupdifferences in academic self-efficacy (p > 0.05). Findings fromprevious studies examining the relationship between resilienceand age, gender and experience have been mixed (e.g., Martinand Marsh, 2006, 2008; Allan et al., 2014; Khalaf, 2014). As such,the weak but significant negative correlation between ARS-30scores and age (r = 0.20), along with small but non-significant(p > 0.05) gender and experience differences in mean ARS-30scores reported in the present study offer no clearly interpretableadditional evidence regarding the validity of the ARS-30. Thatscale items were selected to reflect generally accepted definitions,theoretical understandings and factors, constructs and attributescommonly associated with resilience is presented as evidence ofthe Scale’s content validity (Wagnild and Young, 1993).
CONCLUSION
Whilst the psychometric properties reported here are convincingand support the ARS-30 as a construct measure of academicresilience, further developmental work in several areas is needed,particularly involving assessment of academic resilience acrossa number of data points in order to establish the test-retestreliability and predictive validity of the scale.
The degree to which the ARS-30 captures ‘bounce back’or recovery from the challenge of academic adversity alsoneeds further evaluation. While it is suggested that ARS-30 scores reflect the capacity for bounce back, this canonly be fully established once findings from studies involvingrecovery to original functioning—actual bounce back—areavailable. Quantifying and calculating actual bounce back canhowever be problematic, requiring pragmatism, as the basis forassessment and measurement is likely to shift according to theparticular study or practice parameters, as well as—ideally—theneed for the existence of a pre-adversity baseline functioningmeasure against which to compare post-adversity functioningto determine recovery. Additionally, temporal trajectories ofresilience can be complex, so bounce back may not beimmediate but instead occur over a period of time post adversity
TABLE 8 | Mean ARS-30 scores by gender and year of study.
Mean ARS-30 score ± SD
Male (n = 56) Female (n = 262) Year 1 (n = 235) Year 2 (n = 52) Year 3 (n = 31)
113.46 ± 15.73 116.03 ± 14.58 116.22 ± 15.12 115.13 ± 13.41 111.45 ± 14.36
Frontiers in Psychology | www.frontiersin.org 9 November 2016 | Volume 7 | Article 1787
fpsyg-07-01787 November 16, 2016 Time: 14:6 # 10
Cassidy The Academic Resilience Scale (ARS-30)
(e.g., Bonanno et al., 2015). Studies exploring associationsbetween ARS-30 scores and existing measures of resilience thatspecifically target bounce back, such as the Brief Resilience Scale(Smith et al., 2008), may help gain further insight in to thecapacity of the ARS-30 to capture bounce back as a feature ofacademic resilience.
Equally, given the underrepresentation of males in the sampleused in the present study, there is need to conduct furtherstudies that specifically address the issue of generalizability ofthe ARS-30 to male students. Advances in psychometric theorywhich are currently emerging in the field, such as GeneralizabilityTheory, may also offer greater insight in to potential sourcesof measurement error that is particularly pertinent to appliedassessment contexts, such as universities and schools, as in thecase of the ARS-30 (Briesch et al., 2014).
Nevertheless, the ARS-30 represents a unique and novelapproach to the measurement of academic resilience in universitystudents. It is argued that the measure offers validity beyondthat offered by existing generalized attitudinal measures ofresilience that capture only state attributes and mood (Hogeet al., 2007). Because the ARS-30 measures cognitive-affectiveand behavioral responses to instances of academic adversity,representing positive enabling factors such as sense of mastery,belief that one’s efforts can make a difference and effectiveapproaches to learning (Bandura, 2006)—that Newman andBlackburn (2002) state have been under researched in thecontext of resilience—, together with assessment of emotionalresponses to adversity, believed to facilitate or impede resilience(Fredrickson, 2001), it is suggested that it can be utilized inboth research and practice as a diagnostic measure, identifyingnon-adaptive responses to academic adversity and helping
inform interventions aimed at developing resilience in students.Martin and Marsh (2009) have already proposed that studentscan learn to be more academically resilient through thedevelopment of positive cognitive, affective and behavioralorientations to school and academic life, which Martin andMarsh go on to suggest may be more effectively achievedby increasing individuals’ exposure to protective and enablingfactors. Edwards et al. (2016) point out that as it is notpossible to control the extent to which individual studentsare exposed to adversity, the focus should be on interventionsaimed at improving resilience in those at risk of negativeoutcomes associated with adverse experiences. The ARS-30,it is suggested, has the potential to help identify limitationsin existing student responses to academic adversity and toassist the development of interventions aimed at fosteringadaptive responses, and to provide a measure of the efficacy ofsuch interventions in terms of developing students’ academicresilience.
AUTHOR CONTRIBUTIONS
The contribution of author SC meets the following criteria:Substantial contributions to the conception or design of the work;or the acquisition, analysis, or interpretation of data for the work;and Drafting the work or revising it critically for importantintellectual content; and Final approval of the version to bepublished; and Agreement to be accountable for all aspects ofthe work in ensuring that questions related to the accuracy orintegrity of any part of the work are appropriately investigatedand resolved.
REFERENCESAllan, J. F., McKenna, J., and Dominey, S. (2014). Degrees of resilience: profiling
psychological resilience and prospective academic achievement in universityinductees. Br. J. Guid. Couns. 42, 9–25. doi: 10.1080/03069885.2013.793784
Bandura, A. (1997). Self-Efficacy: The Exercise of Control. New York, NY: Freeman.Bandura, A. (2006). “Guide for constructing self-efficacy scales,” in Self-Efficacy
Beliefs of Adolescents, Vol. 5, eds F. Pajares and T. Urdan (Greenwich, CT:Information Age Publishing), 307–337.
Bartley, M., Schoon, M. R., and Blane, M. (2010). “Resilience as an asset for healthydevelopment,” in Health Assets in a Global Context, eds A. Morgan, M. Davies,and E. Ziglio (New York, NY: Springer), 101–115. doi: 10.1007/978-1-4419-5921-8_6
Bonanno, G. A., Romero, S. A., and Klein, S. L. (2015). The temporalelements of psychological resilience: an integrative framework for the studyof individuals, families, and communities. Psychol. Inq. 26, 139–169. doi:10.1080/1047840X.2015.992677
Bourne, V. (2014). To what extent is mathematical ability predictive ofperformance in a methodology and statistics course? Can an action researchapproach be used to understand the relevance of mathematical ability inpsychology undergraduates. Psychol. Teach. Rev. 20, 14–27.
Briesch, A. M., Swaminathan, H., Welsh, M., and Chafouleas, S. M. (2014).Generalizability theory: a practical guide to study design, implementation, andinterpretation. J. Sch. Psychol. 52, 13–35. doi: 10.1016/j.jsp.2013.11.008
Campbell-Sills, L., and Stein, M. B. (2007). Psychometric analysis and refinementof the Connor-Davidson Resilience Scale (CD-RISC): validation of a 10-itemmeasure of resilience. J. Trauma Stress 20, 1019–1028. doi: 10.1002/jts.20271
Cassidy, S. (2015). Resilience building in students: the role of academic self-efficacy.Front. Psychol. 6:1781. doi: 10.3389/fpsyg.2015.01781
Cassidy, S., and Eachus, P. (2002). The development of the General AcademicSelf- Efficacy (GASE) scale. Paper Presented at the British Psychological SocietyAnnual Conference, Blackpool.
Cattell, R. B. (1966). The scree test for the number of factors. Multivar. Behav. Res.1, 245–276. doi: 10.1207/s15327906mbr0102_10
Cheng, V., and Catling, J. C. (2015). The role of resilience, delayed gratificationand stress in predicting academic performance. Psychol. Teach. Rev. 21,13–24.
Cohen, J. (1988). Statistical Power Analysis for the Behavioral Sciences, 2nd Edn.Hillsdale, NJ: Lawrence Earlbaum Associates.
Colp, S. M., and Nordstokke, D. W. (2014). “Exploring the measurement ofacademic resilience,” in Proceedings of the Symposium presentation at theCanadian Psychological Association’s 75th Annual Convention. Vancouver,British Columbia.
Connor, K. M., and Davidson, J. R. (2003). Development of a new resilience scale:the Connor-Davidson Resilience Scale (CD-RISC). Depress. Anxiety 18, 76–82.doi: 10.1002/da.10113
Cronbach, L. J. (1990). Essentials of Psychological Testing, 5th Edn. New York, NY:Harper Collins.
Edwards, T., Catling, J. C., and Parry, E. (2016). Identifying predictors of resiliencein students. Psychol. Teach. Rev. 22, 26–31.
Fallon, C. M. (2010). School Factors that Promote Academic Resilience inUrban Latino High School Students. Doctoral Dissertation paper 122, LoyolaUniversity, Chicago.
Field, A. (2013). Discovering Statistics Using IBM SPSS Statistics, 4th Edn. London:Sage.
Fredrickson, B. L. (2001). The role of positive emotions in positive psychology: thebroaden-and-build theory of positive emotions. Am. Psychol. 56, 218–226. doi:10.1037//0003-066x.56.3.218
Frontiers in Psychology | www.frontiersin.org 10 November 2016 | Volume 7 | Article 1787
fpsyg-07-01787 November 16, 2016 Time: 14:6 # 11
Cassidy The Academic Resilience Scale (ARS-30)
Friborg, O., Hjemdal, O., Rosenvinge, J. H., and Martinussen, M. (2003). A newrating scale for adult resilience: what are the central protective resourcesbehind healthy adjustment? Int. J. Methods Psychiatr. Res. 12, 65–76. doi:10.1002/mpr.143
Friedland, N. (2005). “Introduction–The "elusive" concept of social resilience,” inThe Concept of Social Resilience, eds N. Friedland, A. Arian, A. Kirschnbaum,A. Karin, and N. Fleischer (Haifa: The Technion. Samuel Neaman Institute),7–10.
Furr, R. M. (2011). Scale Construction and Psychometrics for Social and PersonalityPsychology. London: Sage.
Gardynik, U. (2008). Defying the odds: Academic Resilience of Students withLearning Disabilities. Doctoral thesis, University of Alberta, Edmunton.
Gizir, C. (2004). Academic Resilience: An Investigation of Protective FactorsContributing to the Academic Achievement of Eighth Grade Students of Poverty.Doctoral thesis, Middle East Technical University, Ankara.
Gorsuch, R. L. (1983). Factor Analysis, 2nd Edn. Hillsdale, NJ: Erlbaum.Green, K. T., Hayward, L. C., Williams, A. M., Dennis, P. A., Bryan, B. C.,
Taber, K. H., et al. (2014). Examining the factor structure of the Connor-Davidson Resilience Scale (CD-RISC) in a post-9/11 U.S. military veteransample. Assessment 21, 443–451. doi: 10.1177/1073191114524014
Hamill, S. K. (2003). Resilience and self-efficacy: the importance of efficacy beliefsand coping mechanisms in resilient adolescents. Colgate Univ. J. Sci. 35, 115–146.
Hardy, S. E., Concato, J., and Gill, T. M. (2004). Resilience of communitydwelling older persons. J. Am. Geriatr. Soc. 52, 257–262. doi: 10.1111/j.1532-5415.2004.52065.x
Hillman, N., and Robinson, N. (2016). Boys to Men: The Underachievement ofYoung Men in Higher Education–and how to Start Tackling it. Oxford: HigherEducation Policy Institute.
Hoge, E. A., Austin, E. D., and Pollack, M. H. (2007). Resilience: research evidenceand conceptual considerations for posttraumatic stress disorder. Depress.Anxiety 24, 139–152. doi: 10.1002/da.20175
Hutcheson, G. D., and Sofroniou, N. (1999). The Multivariate Social Scientist:an Introduction to Generalized Linear Models. London: Sage Publications. doi:10.4135/9780857028075
Kaiser, H. F. (1960). The application of electronic computers to factor analysis.Educ. Psychol. Meas. 20, 141–151. doi: 10.1177/001316446002000116
Kaiser, H. F. (1970). A second generation little jiffy. Psychometrika, 35, 401–415.doi: 10.1007/bf02291817
Kanevsky, L., Corke, M., and Frangkiser, L. (2008). The academic resilience andpsychosocial characteristics of inner-city English learners in a museum-basedschool program. Educ. Urban Soc. 40, 452–475. doi: 10.1177/0013124507304693
Khalaf, M. A. (2014). Validity and reliability of the academic resilience scale inegyptian context. US China Educ. Rev. B 4, 202–210.
Kline, P. (1993). Personality: The Psychometric View. London: Routledge.Lamond, A. J., Depp, C. A., Alllison, M., Langer, R., Reichstadt, J., Moore,
D. J., et al. (2009). Measurement and predictors of resilience amongcommunity-dwelling older women. J. Psychiatr. Res. 43, 148–154. doi:10.1016/j.jpsychires.2008.03.007
Liddle, H. A. (1994). “Contextualizing resiliency,” in Educational Resilience inInner-City America: Challenges and Prospects, eds M. C. Wang and E. W.Gordon (Hillsdale, NJ: Erlbaum), 167–177. doi: 10.4324/9780203052723
Martin, A. J. (2002). Motivation and academic resilience: developinga model of student enhancement. Aust. J. Educ. 46, 34–49. doi:10.1177/000494410204600104
Martin, A. J. (2013). Academic buoyancy and academic resilience: exploring‘everyday’ and ‘classic’ resilience in the face of academic adversity. Sch. Psychol.Int. 34, 488–500. doi: 10.1177/0143034312472759
Martin, A. J., Colmer, S., Davey, L., and Marsh, H. (2010). Longitudinal modellingof academic buoyancy and motivation: do the “5 Cs” hold up over time? Br. J.Educ. Psychol. 80, 473–496. doi: 10.1348/000709910x486376
Martin, A. J., and Marsh, H. (2006). Academic resilience and its psychological andeducational correlates: a construct validity approach. Psychol. Sch. 43, 267–281.doi: 10.1002/pits.20149
Martin, A. J., and Marsh, H. W. (2008). Academic buoyancy: towards anunderstanding of students’ everyday academic resilience. J. Sch. Psychol. 46,53–83. doi: 10.1016/j.jsp.2007.01.002
Martin, A. J., and Marsh, H. W. (2009). Academic resilience and academicbuoyancy: multidimensional and hierarchical conceptual framing of causes,
correlates and cognate constructs. Oxf. Rev. Educ. 35, 353–370. doi:10.1080/03054980902934639
Masten, A. S., Best, K. M., and Garmezy, N. (1990). Resilience and development:contributions from the study of children who overcome adversity. Dev.Psychopathol. 2, 425–444. doi: 10.1017/s0954579400005812
McGubbin, L. (2001). Challenges to the definition of resilience. Paper Presentedat the Annual Meeting of the American Psychological Association. SanFrancisco,CA.
McLafferty, M., Mallet, J., and McCauley, V. (2012). Coping at university: the roleof resilience, emotional intelligence, age and gender. J. Quant. Psychol. Res. 1,1–6.
Morales, E. E. (2008). A focus on hope: toward a more comprehensive theory ofacademic resiliency among at-risk minority students. J. At-Risk Issues 14, 23–32.
Newman, R. (2002). How self-regulated learners cope with academic difficulty:the role of adaptive help seeking. Theory Pract. 41, 132–138. doi:10.1207/s15430421tip4102_10
Newman, T., and Blackburn, S. (2002). Transitions in the Lives of Children andYoung People: Resilience Factors. Edinburgh: Scottish Executive.
O’Brien, E. J., and Epstein, S. (1988). The Multidimensional Self-Esteem Inventory.Odessa, FL: Psychological Assessment Resources.
Office for National Statistics (2013). Statistical Bulletin. Suicides in theUnited Kingdom, 2011. Available at: http://www.ons.gov.uk/ons/dcp171778_295718.pdf
Oppenheim, A. N. (1992). Questionnaire Design, Interviewing and AttitudeMeasurement. London: Pinter Publishers.
Ricketts, S. N., Engelhard, G. Jr., and Chang, M. –L. (2015). Development andvalidation of a scale to measure academic resilience in mathematics. Eur. J.Psychol. Assess. 1–8. doi: 10.1027/1015-5759/a000274
Riley, J. R., and Masten, A. S. (2005). “Resilience in context,” in Resiliencein Children, Families, and Communities: Linking Context to Practice andPolicy, eds R. D. Peters, B. Leadbeater, and R. McMahon (New York: KluwerAcademic/Plenum), 13–25.
Sánchez-López, M. P., and Dresch, V. (2008). The 12-Item General HealthQuestionnaire (GHQ-12): reliability, external validity and factor structure inthe Spanish population. Psicothema 20, 839–843.
Sautelle, E., Bowles, T., Hattie, J., and Arifin, D. N. (2015). Personality, Resilience,self-regulation and cognitive ability relevant to teacher selection. Aust. J. Teach.Educ. 40. doi: 10.14221/ajte.2015v40n4.4
Smith, B. W., Dalen, J., Wiggins, K., Tooley, E., Christopher, P., and Bernard, J.(2008). The brief resilience scale: assessing the ability to bounce back. Int. J.Behav. Med. 15, 194–200. doi: 10.1080/10705500802222972
Stevens, J. P. (2002). Applied Multivariate Statistics for the Social Sciences, 4th Edn.Hillsdale, NJ: Erlbaum.
Topham, P., and Moller, N. P. (2011). New students’ psychological well-beingand its relation to first year academic performance in a UK university. Couns.Psychother. Res. 11, 196–203. doi: 10.1080/14733145.2010.519043
Universities and Colleges Admissions Service [UCAS] (2016). UCASData Reveals the Numbers of Men and Women Placed in Over150 Higher Education Subjects. Available at: https://www.ucas.com/corporate/news-and-key-documents/news/ucas-data-reveals-numbers-men-and-women-placed-over-150-higher
Wagnild, G. M., and Young, H. M. (1993). Development and psychometricevaluation of the resilience scale. J. Nurs. Meas. 1, 165–178.
Waxman, H. C., Gray, J. P., and Padron, Y. N. (2003). Review of Researchon Educational Resilience: Research Report. Washington, DC: Institute ofEducation Sciences.
Zimmerman, B. J., and Schunk, D. H. (eds) (2001). Self-Regulated Learningand Academic Achievement: Theoretical Perspectives, 2nd Edn. Mahwah, NJ:Erlbaum.
Conflict of Interest Statement: The author declares that the research wasconducted in the absence of any commercial or financial relationships that couldbe construed as a potential conflict of interest.
Copyright © 2016 Cassidy. This is an open-access article distributed under the termsof the Creative Commons Attribution License (CC BY). The use, distribution orreproduction in other forums is permitted, provided the original author(s) or licensorare credited and that the original publication in this journal is cited, in accordancewith accepted academic practice. No use, distribution or reproduction is permittedwhich does not comply with these terms.
Frontiers in Psychology | www.frontiersin.org 11 November 2016 | Volume 7 | Article 1787