the 7-year cumulative incidence of cornea guttata and morphological changes in the corneal...
TRANSCRIPT

Introduction
Primary central cornea guttata (CG)is associated with abnormal excres-cences of basement membrane andfibrillar collagens produced by dis-tressed endothelial cells. The excres-cences appear as beaten metal atDescemet’s membrane in slit lampexamination and are seen as darkareas on specular microscopy images(Kenyon et al. 2002).
Primary central CG increases therisk for endothelial decompensationafter intraocular surgery (Klyce et al.2008) and can occasionally progressto Fuchs¢ endothelial dystrophy withcorneal swelling (Adamis et al. 1993).A few case series and case reportshave described endothelial cell lossand loss of best corrected visual acuity(Moshirfar et al. 2005) as well as cor-neal decompensation (Vroman et al.2002; Dastjerdi & Sugar 2003) afterlaser in situ keratomileusis in patientswith mild CG or Fuchs endothelialdystrophy. Primary central CG is thusa significant clinical sign that increasesthe risk of sight-threatening cornealdecompensation after corneal andintraocular surgery.
Primary central CG is a relatively com-mon finding, although the prevalence
The 7-year cumulative incidenceof cornea guttata andmorphological changes in thecorneal endothelium in theReykjavik Eye Study
Gunnar M. Zoega,1 Arsaell Arnarsson,2 Hiroshi Sasaki,3
Per G. Soderberg1 and Fridbert Jonasson4
1Gullstrand Lab, Ophthalmology, Department of Neuroscience, Uppsala University,Uppsala, Sweden2Neuroscience Research, University of Akureyri, Akureyri, Iceland3Department of Ophthalmology, Kanazawa Medical University, Uchinada, Japan4Department of Ophthalmology, University of Iceland, Reykjavik, Iceland
ABSTRACT.
Purpose: To examine the corneal endothelium and establish the 7-year cumula-
tive incidence of cornea guttata (CG).
Methods: Population-based prospective cohort study with 573 participants
(third wave of the Reykjavik Eye Study (RES) in 2008). Four hundred and
thirty-seven subjects had either right or left eyes available for analysis after
excluding confounding eye conditions. The baseline for eyes at risk for devel-
oping CG is the second wave of the RES in 2001. Participants underwent
specular microscopy and a standardized eye examination.
Results: The cumulative 7-year incidence of CG in either eye was estimated as
a 95% confidence interval for the expected value for both genders combined
(15–23%), for males (8–18%) and for females (19–29%). In right eye only,
the 7-year cumulative incidence for both genders combined was estimated to
be 6–11%. For genders combined and for males only, the data indicated no
correlation between 7-year cumulated incidence and age at baseline. In women,
however, the change of 7-year incidence for CG in at least one eye appeared
to be correlated to age at baseline. Reduction of endothelial cell density for
corneas with CG at baseline was found [CI (0.95))132 ± 94].
Conclusion: The cumulative 7-year incidence of primary central CG for a mid-
dle-aged and older Caucasian population without history of potentially con-
founding eye disease has been established. Women tend to have higher
incidence if onset occurs at middle age. If CG is present, the cell density and
the cell size variation decrease within a 7-year period.
Key words: cornea guttata – endothelium – incidence – morphology – population based –
specular microscopy
Acta Ophthalmol.ª 2012 The Authors
Acta Ophthalmologica ª 2012 Acta Ophthalmologica Scandinavica Foundation
doi: 10.1111/j.1755-3768.2011.02360.x
Acta Ophthalmologica 2012
1
varies between different ethnicitiesand locations. Cornea guttata wasfound in 4% of cataract patients inJapan, where all of those afflictedwere women (Nagaki et al. 1996). In astudy comparing the prevalence in anonclinical sample of Singaporeansand Japanese, the prevalence was sig-nificantly higher in Singaporeans(6.7% versus 3.7%) and higher inwomen in both racial groups (Kitaga-wa et al. 2002). A cross-sectional pop-ulation-based study in KumejimaIsland, Japan, using only specularmicroscopy for diagnosis found aprevalence of 4.1% for primary cen-tral CG. Old age, female gender andthin central cornea were associatedwith an increased risk of CG (Higaet al. 2011). The prevalence in Iceland,a Caucasian population, was found tobe 7% for men and 11% for women(Zoega et al. 2006). In the same study,smoking was associated with anapproximately twofold risk for CG.We could not find population-basedincidence data on corneal guttata inthe literature.
The purpose of this study was tomake an estimate of cumulated inci-dence of primary central CG in aCaucasian population without historyof potentially confounding eye disease.It was further intended to establishwhether there is a gender difference inincidence of CG and whether occur-
rence of CG is associated withchanges in specular microscopy andcorneal thickness.
Methods
The Reykjavık Eye Study (RES) is apopulation-based prospective cohortstudy. The cohort was randomly sam-pled from persons 50 years and olderfrom the national census. The cohort(1045 participants, 75.8% responserate) was first examined in 1996.However, none of the measurementspresented in this study was gatheredat this time point. The methodologyincluding the examination protocolhas been reported elsewhere (Jonassonet al. 2003a,b). Written informed con-sent was obtained from all partici-pants after the nature of the studyhad been explained to them. Appro-priate ethical approvals were obtainedfrom the Data Protection Commissionand the Ministry of Health EthicsCommittee following the guidelines ofthe Helsinki declaration.
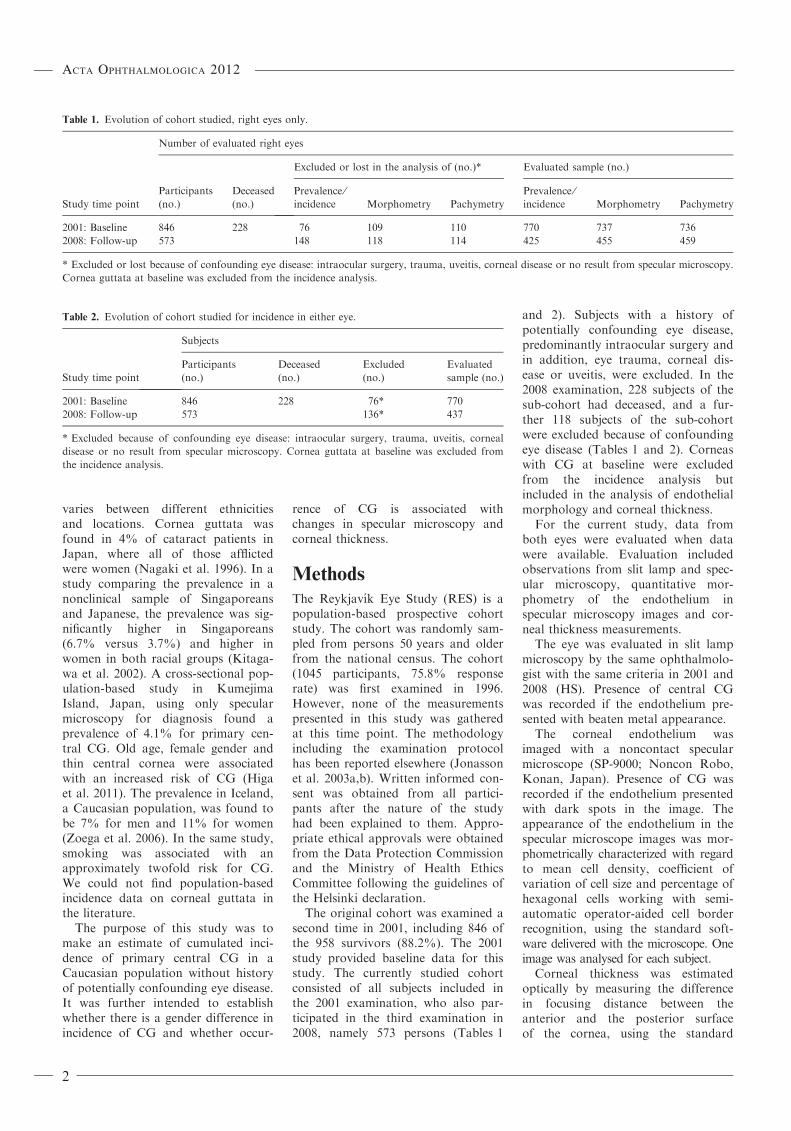
The original cohort was examined asecond time in 2001, including 846 ofthe 958 survivors (88.2%). The 2001study provided baseline data for thisstudy. The currently studied cohortconsisted of all subjects included inthe 2001 examination, who also par-ticipated in the third examination in2008, namely 573 persons (Tables 1
and 2). Subjects with a history ofpotentially confounding eye disease,predominantly intraocular surgery andin addition, eye trauma, corneal dis-ease or uveitis, were excluded. In the2008 examination, 228 subjects of thesub-cohort had deceased, and a fur-ther 118 subjects of the sub-cohortwere excluded because of confoundingeye disease (Tables 1 and 2). Corneaswith CG at baseline were excludedfrom the incidence analysis butincluded in the analysis of endothelialmorphology and corneal thickness.
For the current study, data fromboth eyes were evaluated when datawere available. Evaluation includedobservations from slit lamp and spec-ular microscopy, quantitative mor-phometry of the endothelium inspecular microscopy images and cor-neal thickness measurements.
The eye was evaluated in slit lampmicroscopy by the same ophthalmolo-gist with the same criteria in 2001 and2008 (HS). Presence of central CGwas recorded if the endothelium pre-sented with beaten metal appearance.
The corneal endothelium wasimaged with a noncontact specularmicroscope (SP-9000; Noncon Robo,Konan, Japan). Presence of CG wasrecorded if the endothelium presentedwith dark spots in the image. Theappearance of the endothelium in thespecular microscope images was mor-phometrically characterized with regardto mean cell density, coefficient ofvariation of cell size and percentage ofhexagonal cells working with semi-automatic operator-aided cell borderrecognition, using the standard soft-ware delivered with the microscope. Oneimage was analysed for each subject.
Corneal thickness was estimatedoptically by measuring the differencein focusing distance between theanterior and the posterior surfaceof the cornea, using the standard
Table 1. Evolution of cohort studied, right eyes only.
Study time point
Number of evaluated right eyes
Participants
(no.)
Deceased
(no.)
Excluded or lost in the analysis of (no.)* Evaluated sample (no.)
Prevalence ⁄incidence Morphometry Pachymetry
Prevalence ⁄incidence Morphometry Pachymetry
2001: Baseline 846 228 76 109 110 770 737 736
2008: Follow-up 573 148 118 114 425 455 459
* Excluded or lost because of confounding eye disease: intraocular surgery, trauma, uveitis, corneal disease or no result from specular microscopy.
Cornea guttata at baseline was excluded from the incidence analysis.
Table 2. Evolution of cohort studied for incidence in either eye.
Study time point
Subjects
Participants
(no.)
Deceased
(no.)
Excluded
(no.)
Evaluated
sample (no.)
2001: Baseline 846 228 76* 770
2008: Follow-up 573 136* 437
* Excluded because of confounding eye disease: intraocular surgery, trauma, uveitis, corneal
disease or no result from specular microscopy. Cornea guttata at baseline was excluded from
the incidence analysis.
Acta Ophthalmologica 2012
2

module of the specular microscopeused.
A cornea was classified as present-ing CG if either the clinical evaluationor the specular microscopy, or both,indicated CG.
Absence of CG was defined as noCG as judged by both slit lamp andspecular microscopy. Presence of CGin the central area of the cornea wasgraded in five severity grades accord-ing to dark area in specular micros-copy in relation to area with cellappearance (%), as follows (Fig. 1):Grade 1 (0% but CG evident by slitlamp), Grade 2 (<10%), Grade 3(10–25%), Grade 4 (25–50%) andGrade 5 (more than 50%) (Zoegaet al. 2006).
For each subject, both eyes wereexamined, but only one eye was con-sidered in the statistical analysis.Cumulative incidence was analysedseparately for appearance in either ofthe two eyes and for appearance inright eyes only. For each strategy, theoverall incidence for all ages and bothgenders was analysed in total and sep-arately for different age intervals. For
each gender, the overall cumulativeincidence was analysed in total andfor all ages, and separately for differ-ent age intervals. The baseline ageintervals were set to 55–64, 65–74 and75–84 years.
For morphometric analysis and cor-neal thickness measurements, onlyright eyes were included.
At baseline, there was one groupwith CG and one without. If CG wasabsent at baseline, that cornea mayhave presented with guttata or not at7-year follow-up. For each subject,the same cornea was measured atbaseline and at 7-year follow-up,respectively. At each time interval, thevariable was measured once. Thechange between 7-year follow-up andbaseline was recorded as the differencebetween the two time points on thesame cornea in the same subject.
The confidence coefficient and thesignificance level were set to 0.95 and0.05, respectively, considering the sam-ple size available, expected variabilityand contrasts considered clinically rele-vant. Incidence for CG was estimatedas a 95% confidence interval for the
expected outcome assuming a binomialdistribution (Zar 1999).
Results
Characteristics of cohort studied
The evolution of the cohort studied isprovided in Tables 1 and 2. The med-ian age of the evaluated sub-cohortwas 72 years in 2008. Age and genderdistribution were similar within thetwo groups, those with incidence ofCG and those without. Altogether,437 subjects (either eye) and 425 righteyes without any history of intraocu-lar trauma, surgery, corneal diseaseand uveitis were included for analysisof incidence. No participant was diag-nosed with Fuchs¢dystrophy.
Cumulative incidence of cornea guttata
Cumulative incidence of CG in atleast one eye is given in Table 3 andin right eyes only is given in Table 4.To investigate the robustness of thecriterion for presence of CG based onone image from specular microscopy
Fig. 1. Grading of cornea guttata as seen on specular microscopy and based on total area of dark areas. From left to right: Grade 1 (0% but evi-
dent by slit lamp), Grade 2 (<10%), Grade 3 (10–25%), Grade 4 (25–50%) and Grade 5 (more than 50%) (Reprinted with permission from Else-
vier Ltd, Oxford, UK; Zoega et al. 2006).
Table 3. Seven-year cumulative incidence of cornea guttata in at least one eye.
Age at
baseline
(years)
Genders combined Males Females
At risk at
baseline (No.)
Cumulative
incidence of
cornea guttata at
7-year follow-upAt risk at
baseline (No.)
Cumulative
incidence of
cornea guttata at
7-year follow-upAt risk at
baseline (No)
Cumulative
incidence of
cornea guttata at
7-year follow-up
(no.) (%)* (no.) (%)* (no.) (%)*
55–84 437 83 15–23 194 25 8–18 243 58 19–29
55–64 219 50 17–28 103 10 4–16 116 40 26–43
65–74 165 25 10–21 71 10 6–22 94 15 8–24
75–84 53 8 5–25 20 5 4–46 33 3 0–19
* 95% Confidence interval for expected cumulative incidence.
Acta Ophthalmologica 2012
3

only, the incidence of CG was addi-tionally estimated based on specularmicroscopy only, thus classifyingGrade 1 CG as no CG. The cumula-tive incidence of CG for the age inter-val 55–84 years in at least one eye,genders combined, was 6.5–11.9%,and in right eyes only, genders com-bined, the cumulative incidence was3.9–8.5%.
The similarity of incidence of CGduring the 7-year follow-up period,between genders, with regard to ageat baseline, was analysed with a 2 · 2contingency table. For this, the twoage intervals 65–74 and 75–84 werecollapsed into one high age groupbecause the incidence in the higherage group was lower than 5. The anal-ysis indicated a difference of distribu-tion of age at baseline between menand women for CG in at least one eye(Test statistic = 4.97, v21;0:95 = 3.84)but not for CG in right eyes only.
A possible correlation between ageat baseline and 7-year incidence ofguttata was examined with homogene-ity tests applying 2 · 3 contingencytables or if the incidence was <5,reduced to 2 · 2 contingency tables bycollapsing the age intervals 65–74 and
75–84 into one because of low inci-dence. For genders combined and formales only, the data indicated no cor-relation between 7-year cumulatedincidence and age at baseline, neitherfor guttata in at least one eye(Table 3), nor for right eyes only(Table 4). Similarly, the data indicatedno correlation between 7-year inci-dence of CG and age at baseline inright eye only for women. However,for women, the data for CG in atleast one eye indicated that there is achange of 7-year incidence, with ageat baseline (Table 3, Test statistic:12.67, v21;0:95 = 3.84).
Conditional probability for grades of
cornea guttata
Table 5 shows the prevalence (95%confidence interval) of different gradesof CG at follow-up compared tograde at baseline for the same eye.Considering the low prevalence at7-year follow-up for Grade 3–5, thesegroups were analysed together. Then,the independence of grading at base-line and grading at 7-year follow-up(Table 5) was evaluated with a 3 · 3contingency table. The analysis indi-
cated that grading at baseline and thegrading at 7 years follow-up weredependent (Table 5, Test statis-tic = 271.8 v24;0:95 = 9.49).
Quantitative morphometry
The corneal morphometric indices atbaseline and at 7-year follow-up incorneas with no CG and corneas withCG, respectively, are given in Table 6.The annual endothelial cell loss,assuming a linear decline during the7 years, was 0.1% for corneas with noCG and corneas with CG.
Considering the difference between7-year follow-up and baseline for cor-neas with no CG neither at baselinenor at 7-year follow-up, the data indi-cated a minute or no loss of cell den-sity, a loss of cell size variation andan increase in hexagonality (Table 7).
Considering the difference between7-year follow-up and baseline for cor-neas with no CG at baseline but withCG at 7-year follow-up, the data indi-cated no loss of cell density, adecrease in cell size variation but nochange of hexagonality (Table 7).
Considering the difference between7-year follow-up and baseline for cor-neas with CG at baseline, the dataindicated a loss of cell density, adecrease in cell size variation but nochange of hexagonality (Table 7).
When comparing the changes dur-ing the follow-up period between cor-neas with CG at baseline and CG at7-year follow-up, and corneas with noCG at baseline but with guttata at 7-year follow-up, the data indicated nodifferences.
Finally, when comparing changesduring the follow-up period betweencorneas with CG (both incident casesand CG at baseline) and corneas withno CG neither at baseline nor at
Table 4. Seven-year cumulative incidence of cornea guttata in right eyes only.
Age at
baseline
(years)
Genders combined Males Females
At risk at
baseline
(no.)
Cumulative
incidence of
cornea guttata at
7-year follow-up At risk at
baseline
(No.)
Cumulative
incidence of
cornea guttata at
7-year follow-up At risk at
baseline
(no.)
Cumulative
incidence of
cornea guttata at
7-year follow-up
(no.) (%)* (no.) (%)* (no.) (%)*
55–84 424 36 6–11 189 15 4–12 235 21 5–13
55–64 215 23 7–15 101 9 3–15 114 14 6–18
65–74 156 9 2–10 68 3 0–10 88 6 1–12
75–84 53 4 0–15 20 3 0–32 33 1 0–10
* 95% Confidence interval for expected cumulative incidence.
Table 5. Conditional probability that cornea guttata is expressed at a certain grade at 7-year
follow-up, the condition being the grade at baseline.
Grade at baseline
95% confidence interval for prevalence of grade at 7-year follow-up
(%)
No cornea
guttata Grade 1 Grade 2 Grade 3 Grade 4 Grade 5
No cornea guttata 79–86 0.9–3.6 3.1–7.3 0.1–1.9 0.0–1.2
Grade 1 0.1–1.5 0.2–2.2 0.0–1.2 0.0–1.2 0.0–1.2
Grade 2 0.7–3.3 0.1–1.9 0.0–1.2
Grade 3 0.0–1.2 0.1–1.5 0.1–1.5 0.3–2.5 0.0–1.2
Grade 4 0.0–1.2 0.1–1.9 0.0–1.2 0.1–1.5
Grade 5 0.0–1.2 0.1–1.5 0.1–1.9
Empty cells: no incidence recorded.
Acta Ophthalmologica 2012
4

7-year follow-up, the data indicatedno difference in change of cell density,that the difference of cell size varia-tion for corneas without guttata wasbigger than in corneas with guttataand that there was no change of frac-tion of hexagonal cells (Table 7).
Corneal thickness
The corneas appeared thicker at7-year follow-up as compared to base-line, both considering corneas with noguttata and corneas with guttata.
The data indicated an increase incorneal thickness from baseline to7-year follow-up in corneas withoutguttata (Tables 6 and 7).
Discussion
In the current population-based study,we intended to estimate the cumulatedincidence of primary CG in a Cauca-sian population and to elucidate a
possible association of occurrence ofCG with changes in specular micros-copy and corneal thickness. To thebest of our knowledge, such data arenot available in the literature.
The main strengths of this study areits relatively large population-basedsample, high participation rate andmodern diagnostic methods. It is,however, important to analyse thepotential impact on the outcomecaused by subjects excluded. Theexclusion of subjects who wereexposed to trauma including intraocu-lar surgery or developed uveitisand ⁄or corneal disease limits the pop-ulation observed. The exclusion ofsubjects that had undergone or under-went cataract surgery during theobservation period may have changedthe outcome if early cataract is associ-ated with baseline levels or changes inthe variables studied.
The fact that subjects with no quan-titative morphometry from specular
microscopy were excluded should nothave impacted on the outcome if thelack of specular microscopy was ran-dom. However, if lack of quantitativemorphometry from specular micros-copy images was because of difficultiesin recording good images, as was thecase in Grade 5 CG, the outcome islimited to a population where a betterendothelial status (cell density, ratioof hexagonal cells and coefficient ofvariation of cell size) may be overrep-resented.
The current study was limited toone measurement for each of the dif-ferent variables measured. It is there-fore not possible to analyse whetherlarge confidence intervals for expectedparameters are because of variabilityamong subjects or measurements.
When observing the specularmicroscopy images, we realized thatthe proportion of image surfaceafflicted by CG varied between sub-jects. For this reason, we attempted to
Table 6. Corneal endothelial morphometric indices and corneal thickness at baseline and at 7-year follow-up.
Study time
point
Cell density (cells per mm2)
Coefficient of variation
of cell size
Fraction of hexagonal
cells (%) Corneal thickness (lm)
No guttata
present
Guttata
present
No guttata
present
Guttata
present
No guttata
present
Guttata
present
No guttata
present
Guttata
present
d.f. CI(0.95)* d.f. CI(0.95)* d.f. CI(0.95)* d.f. CI(0.95)* d.f. CI(0.95)* d.f. CI(0.95)* d.f. CI(0.95)* d.f. CI(0.95)*
Baseline 673 2495 ± 29 63 2338 ± 104 672 36 ± 0.6 63 41 ± 3 671 58.4 ± 0.7 63 57.2 ± 3.0 671 548 ± 3 63 552 ± 10
7-year
follow-up
379 2476 ± 46 75 2324 ± 97 379 32 ± 0.8 75 33 ± 2 379 59.8 ± 1.2 75 56.4 ± 2.9 379 559 ± 4 79 557 ± 9
d.f. = degrees of freedom.
* 95% Confidence interval for the mean.
Table 7. Difference of endothelial morphometric indices and corneal thickness between 7-year follow-up and baseline.
Presence of guttata
Cell density
(cells per mm2)
Coefficient of
variation of cell size
Fraction of
hexagonal cells (%)
Corneal thickness
(lm)
d.f. CI(0.95)* d.f. CI(0.95)* d.f. CI(0.95)* d.f. CI(0.95)*
Neither at baseline nor at 7-year follow-up 282 )38 ± 44 282 )3.9 ± 1.2� 282 2.3 ± 1.7� 280 9 ± 3�
Not at baseline but at 7-year follow-up 35 )29 ± 98 35 )5.9 ± 3.1� 35 0.4 ± 4.7 35 3 ± 11
At baseline and at 7-year follow-up 38 )132 ± 94� 38 )8.4 ± 3.1� 38 )1.5 ± 4.9 40 3 ± 7
Difference between ‘At baseline and
at 7-year follow-up’
versus
‘Not at baseline but at 7-year follow-up’
73 )103 ± 134 73 )2.5 ± 4.3 73 )1.9 ± 6.7 60� 0 ± 13
Difference between ‘Not at baseline but
at 7-year follow-up
and
At baseline and at 7-year follow-up’
versus
‘Neither at baseline nor at 7-year follow-up’
145� )45 ± 80 356 )3.2 ± 2.7� 356 )2.9 ± 3.7 356 )5 ± 7
* 95% Confidence interval for the mean.� Confidence excludes zero.� Approximation of d.f. (degrees of freedom) due to inequality of variances.
Acta Ophthalmologica 2012
5

use proportion of surface afflicted byguttata as a basis for an ordinal grad-ing scale. Based on expected preva-lence of CG (Zoega et al. 2006), werealized that unless a certain grade ofCG is dominant, the numbers in eachgrade would be low, but the preva-lence in each grade was unknown atthe stage of planning the analysis.
Higa et al. (2011) used only specu-lar microscopy in their prevalencestudy, thereby omitting Grade 1, CGseen by slit lamp microscopy but notby specular microscopy. Grade 1 CGis included in both our previouslypublished prevalence study (Zoegaet al. 2006) and the current study. Thefinding that the estimated cumulativeincidence of CG was lower if the crite-rion for the presence of CG was basedon one image of specular microscopyonly, Grade 1 classified as no CG,than if Grade 1 was included in thecriterion for CG indicates that thesensitivity for detection of CGincreases if slit lamp microscopy andsingle image specular microscopy arecombined.
In specular microscopy, only asmall central part of the endothelium,for the current instrument 0.24 mm by0.4 mm, is recorded in one image. Ithas been demonstrated that the celldensity recorded with specular micros-copy increases with increasing distancefrom the centre of the cornea, whilethe coefficient of variation and thefraction of hexagonal cells remainunchanged (Amann et al. 2003).Therefore, if specular microscopy isbased on a single specular microscopeimage, the precision in evaluation ofchange in variables obtained fromspecular microscopy is limited bythe difficulty to re-measure the samesurface element of the corneal endo-thelium in subsequent measurementoccasions. In slit lamp microscopy,the field of view is much wider, thusallowing classification of a much lar-ger area of endothelium. But, concur-rently, slit lamp microscopy isassociated with less resolution andtherefore limited morphometric classi-fication. Furthermore, slit lampmicroscopy classification is subjective.Averaging several images couldincrease the precision of estimates ofmeasurement variables available inspecular microscopy. However, thesemi-automatic measurement is tootime-consuming for image averaging
to be used clinically. Software for sim-ulation of corneal endothelial imagescaptured by specular microscopy hasbeen developed by Bucht et al. (2011).This method allows the estimation ofmeasurement errors associated withthe semi-automatic measurement andobjective calibration of the sensitivityof any specular microscope. This willallow calibration of specular micro-scopes among research centres andfacilitate the development of fullyautomatic analysis of the cornealendothelium (Bucht et al. 2011).
In the current study, corneal thick-ness was estimated optically as the dif-ference in focusing distance betweenthe anterior and the posterior surfaceof the cornea. We did also measurecentral corneal thickness with ultra-sound and found no differencebetween the two types of measure-ments.
Statistical inference was used in thecurrent study as an objective tool toevaluate changes monitored. The factthat all statistical inference was basedon the same sample makes all the out-comes dependent.
The finding that the 7-year inci-dence of CG in at least one eyeappears to decrease with age at base-line differently for genders (Table 3)indicates that in women, the onset ofCG in at least one eye has a prefer-ence to middle age as compared tolate in life. There was a similar trendfor 7-year incidence of CG in righteyes only in women (Table 4), but theincidences recorded were low. The lowincidences for men (Tables 3 and 4)were reflected in the incidence for gen-ders combined (Tables 3 and 4) andmade estimates for both categoriesinconclusive. Thus, the current dataindicate that considering the later halfof female life, CG is primarilyexpected early on.
The very low incidence recorded forGrade 3–5 (Table 5) indicates thatvery large samples are required toresolve changes for these grades, whenexamining natural history and exclud-ing eyes that have had cataract sur-gery, a common event in old age. Theapparent regress of grade of CG inthe same subjects from baseline to 7-year follow-up (Table 5) can be a trueeffect but is probably an artefactbecause of variable positioning of thespecular microscope fields on the cor-nea at baseline and at 7-year follow-
up. A study on four Fuchs cornealdystrophy patients, using retro-illumi-nation photography, showed that veryfew CG disappeared and that theirrelative positions persisted during a23- to 30-month period (Gottsch et al.2006).
The observation that grade at base-line and grade at 7-year follow-upwere not independent (Table 5) indi-cates that there was a change frombaseline. As the grades at 7-year fol-low-up almost consistently increased(Table 5), the outcome suggests thatoverall there is an increase in gradeof CG during the 7-year follow-upperiod.
The current finding that in corneaswithout CG comparing baseline andat 7-year follow-up, endothelial celldensity decreases minutely, polyme-gethism measured as coefficient ofvariation decreases slightly, and hex-agonality increases (Table 6) differsfrom previously published findings,indicating a 0.5–0.6% yearly drop ofcell density, and increasing polyme-gethism and polymorphism (Bourneet al. 1997; Niederer et al. 2007). Thefact that eyes with intraocular surgery,trauma, uveitis and corneal diseasewere excluded in the current studylimits the sub-population of corneasthat did not develop CG (Table 7,first row) to healthy corneas. Ourfinding that, in corneas presenting noCG at baseline but developing CGduring the 7-year follow-up, cell den-sity decreases minutely or not at allwhile cell size variability decreases(Table 7, second row) indicates that inslightly compromised cells, there is lit-tle or no impact on cell density but aslight decrease in size regularity.When the cells become more compro-mised (Table 7, third row), there is adecrease in cell density and a morepronounced loss of irregularity. Thus,it is possible that if the cornea ishealthy, there is a limited loss ofendothelial cells, but if the endothe-lium is subjected to intrinsic or extrin-sic stress, there is a more extensiveloss of endothelial cells leading todecreased density. This is supportedby the finding that decrease in endo-thelial cell density does not occur in alinear fashion (Bigar 1982). Further,our finding that loss of irregularityincreases with increasing signs ofCG (Table 7, third column) indicatesthat the more compromised the
Acta Ophthalmologica 2012
6

endothelium is, the more regular thecells become. This is supported by theprevious finding in a study of 121healthy corneas showing a decrease inendothelial cell density with age if theendothelial cells were regular in sizeand arrangement but no cell loss ifthe endothelial cells were irregular insize (Blatt et al. 1979). Thus, it appearsthat heterogeneity in size requires morebiological effort than homogeneity,which is thermodynamically expected ifthe central endothelial cells are ahomogenous population.
The current finding that cornealthickness only increased minutely, ifat all, during the observation periodboth in subjects developing CG and insubjects with CG at baseline indicatesthat CG within a 7-year observationperiod is not per se a threat againstwater balance in the cornea, unless achange of radius of curvature and ⁄orwater content of the cornea changedconcomitantly.
It is concluded that the cumulative7-year incidence of primary centralCG for a middle-aged and older Cau-casian population without history ofpotentially confounding eye disease,estimated as a 95% confidence inter-val for the expected value, is (15–23)%. Women tend to have higherincidence if onset occurs at middleage. Grading based on afflicted sur-face as recorded with specular micros-copy results in very low incidence ofhigh grade within a 7-year period. IfCG is present, the cell density and thecell size variation decreases within a7-year period possibly without changeof corneal thickness.
Acknowledgements
The Helga Jonsdottir and SigurlidiKristjansson Memorial ResearchFund supported this study. Presentedin part at the 17th Congress of theEuropean Society of Ophthalmology,Amsterdam, the Netherlands, inJune 2009 and at the XXXIX Nordic
Congress of Ophthalmology, Reykja-vik, Iceland, in August 2010.
ReferencesAdamis AP, Fiatov V, Tripathi BJ & Tripathi
RC (1993): Fuchs¢ endothelial dystrophy of
the cornea. Surv Ophthalmol 38: 149–168.
Amann J, Holley GP, Lee S-B & Edelhauser
HF (2003): Increased endothelial cell den-
sity in the paracentral and peripheral
regions of the human cornea. Am J Oph-
thalmol 135: 584–590.
Bigar F (1982): Specular microscopy of the
corneal endothelium. Optical solutions and
clinical results. Dev Ophthalmol 6: 1–94.
Blatt HL, Rao GN & Aquavella JV (1979):
Endothelial cell density in relation to mor-
phology. Invest Ophthalmol Vis Sci 18:
856–859.
Bourne WM, Nelson LR & Hodge DO
(1997): Central corneal endothelial cell
changes over a ten-year period. Invest
Ophthalmol Vis Sci 38: 779–782.
Bucht C, Soderberg P & Manneberg G
(2011): Simulation of specular microscopy
images of corneal endothelium, a tool for
control of measurement errors. Acta Oph-
thalmol 89: e242–e250.
Dastjerdi MH & Sugar A (2003): Corneal
decompensation after laser in situ keratom-
ileusis in fuchs’ endothelial dystrophy. Cor-
nea 22: 379–381.
Gottsch JD, Sundin OH, Rencs EV, Emmert
DG, Stark WJ, Cheng CJ & Schmidt GW
(2006): Analysis and documentation of pro-
gression of Fuchs corneal dystrophy with
retroillumination photography. Cornea 25:
485–489.
Higa A, Sakai H, Sawaguchi S, Iwase A, Tom-
idokoro A, Amano S & Araie M (2011):
Prevalence of and risk factors for cornea
guttata in a population-based study in a
southwestern island of Japan: the kumejima
study. Arch Ophthalmol 129: 332–336.
Jonasson F, Arnarsson A, Sasaki H, Peto T,
Sasaki K & Bird AC (2003a): The preva-
lence of age-related maculopathy in Ice-
land: Reykjavik eye study. Arch
Ophthalmol 121: 379–385.
Jonasson F, Damji KF, Arnarsson A, Sver-
risson T, Wang L, Sasaki H & Sasaki K
(2003b): Prevalence of open-angle glau-
coma in Iceland: Reykjavik Eye Study. Eye
17: 747–753.
Kenyon K, Hersh P, Starck T & Fogle J
(2002): Corneal dysgeneses, dystrophies,
and degenerations. In: Tasman W (ed.).
Duane¢s ophthalmology, CD-ROM ver-
sion. Philadelphia: Lippincott Williams &
Wilkins Publishers.
Kitagawa K, Kojima M, Sasaki H et al.
(2002): Prevalence of primary cornea gutta-
ta and morphology of corneal endothelium
in aging Japanese and Singaporean sub-
jects. Ophthalmic Res 34: 135–138.
Klyce SD, Dohlman CH & Martinez CE
(2008): Corneal form and function: clinical
perspective. In: Albert D & Miller JW
(eds) Albert & Jakobiec¢s principles and
practice of ophthalmology. Philadelphia:
Saunders Elsevier 447–474.
Moshirfar M, Feiz V, Feilmeier MR & Kang
PC (2005): Laser in situ keratomileusis in
patients with corneal guttata and family
history of Fuchs’ endothelial dystrophy.
J Cataract Refract Surg 31: 2281–2286.
Nagaki Y, Hayasaka S, Kitagawa K & Ya-
mamoto S (1996): Primary cornea guttata
in Japanese patients with cataract: specular
microscopic observations. Jpn J Ophthal-
mol 40: 520–525.
Niederer RL, Perumal D, Sherwin T &
McGhee CN (2007): Age-related differ-
ences in the normal human cornea: a laser
scanning in vivo confocal microscopy
study. Br J Ophthalmol 91: 1165–1169.
Vroman DT, Solomon KD, Holzer MP, Peng
Q, Apple DJ & Bowie EM (2002): Endo-
thelial decompensation after laser in situ
keratomileusis. J Cataract Refract Surg 28:
2045–2049.
Zar J (1999): Confidence limits for popula-
tion proportions. In: Biostatistical analysis.
Upper Saddle River, NJ: Prentice-Hall
527–530.
Zoega GM, Fujisawa A, Sasaki H, Kubota
A, Sasaki K, Kitagawa K & Jonasson F
(2006): Prevalence and risk factors for cor-
nea guttata in the Reykjavik Eye Study.
Ophthalmology 113: 565–569.
Received on August 11th, 2011.
Accepted on December 11th, 2011.
Correspondence:
Fridbert Jonasson, MD
Department of Ophthalmology
University of Iceland
Landspitalinn
101 Reykjavik
Iceland
Tel: + (354) 543 7217
Fax:+ (354) 543 4831
Email: [email protected]
Acta Ophthalmologica 2012
7