the 55th annual report€¦ · · 2017-04-03the 55th annual report ... 2003 jan sign contract for...
TRANSCRIPT

The 55th Annual Report
(Jan 1, 2016 – Dec 31, 2016)
Ssangyong Motor Company

History of Ssangyong Motors
1954 Jan Ha Dong-Hwan Motor Workshop was established 1975 May Initial Public Offering 1976 Sep Started to produce a variety of special purpose vehicles 1977 Feb The company name changed to Donga Motor Co., Ltd. 1979 Dec Completed construction of the Pyungtaek Plant 1984 Dec Acquired Geohwa Co., Ltd., and participate Jeep production 1985 Aug Geohwa’s Pusan Plant moved to the Pyungtaek site 1986 Nov Ssangyong Group took over Donga Motor Co., Ltd. 1988 Mar The company name changed to Ssangyong Motor. Co., Ltd. 1988 Jul Acquired English automaker Panther Car Co. 1988 Dec Launched a station wagon type Vehicle “Korando Family” 1991 Feb Entered into the technical partnership with Mercedes Benz AG for developing light commercial
vehicles and diesel engine. 1992 Jun Established “Central R&D Center” 1992 Oct Entered into technical partnership with Mercedes Benz AG for developing gasoline engine 1993 Jan Signed joint capital investment (5%) with Mercedes Benz AG. 1993 Feb Entered into technical partnership with Mercedes Benz AG for luxury passenger vehicle. 1993 Jul Launched a wagon type 4WD vehicle “MUSSO” 1993 Nov Entered into the technical partnership with Mercedes Benz AG for developing large size diesel
engines. 1994 Apr Opened “the After-Sales Service Technical Center” in Daejeon” 1994 Jun Established “Changwon Engine Plant” 1994 Aug Started to produce “Korando New Family” vehicle 1995 Jun Established “Parts Logistics Center” in Choenan, Korea 1995 Jul Launched a Light Commercial Vehicle “Istana” 1996 Jul Launched Box style 4WD, “Korando” 1997 Oct Launched luxury sedan “The Chairman”

3
1998 Jan Merged into Daewoo Group 1998 Jun Launched “New Musso” 1998 Nov Launched 1999 model year of “Chairman” 1999 Jun Launched 7-seater model “New Musso” 1999 Dec Underwent corporate restructuring program 2000 Jan Established independent sales network 2000 Mar Released “Chairman [CM500] and [CM400] series” 2000 Apr Separated from Daewoo Group Released 2000 model year of “Korando” 2000 Jun Launched 2001 model year of “Musso” 2001 Feb Launched “Musso”, “Korando”, “Istana” New lineup 2001 Dec Signed a contract for Normalization of Management 2002 Sep Launched first SUT in Korea “Musso Sports” 2003 Jan Sign contract for CKD Business with Shanghai Huizhong Automobile Manufacturing Company
(SHAC), China 2003 Sep Launched “New Chairman” 2003 Dec Launched “New Rexton” 2004 May Launched “Rodius” 2004 Sep Completed construction of Changwon 2nd Plant 2004 Oct SAIC Motor Corporation Ltd. signed a contract for transfer of creditors’ security holdings. 2005 Jan Became a subsidiary company of SAIC Motor Corporation Ltd. 2005 Feb Started to provide Telematics service “Everway” 2005 Jun Launched “Kyron” 2005 Oct Launched “Actyon” 2006 Mar Launched “Rexton II” 2006 Apr Launched “Actyon Sports” 2006 Dec Major shareholder has been changed from SAIC Motor Corporation Ltd. to Shanghai Automotive
Company Ltd. 2007 Apr Launched “New Kyron” 2007 Jul Launched “New Rodius”

4
2007 Oct Launched “Rexton II Euro” 2007 Dec Launched 2008 Year Model of “New Kyron”, “Actyon” and “Actyon Sport” 2008 Jan Launched “Chairman H” 2008 Feb Launched “Chairman W” 2008 Jul Established EU Representative office in Spain Launched 2009 model year of Rexton II, New Kyron, Actyon, Actyon Sports Completed the extension work of the “After-Sales Service Technical Center” in Daejeon
Actyon won “Energy Winner Award”
2008 Sep Launched 2009 model year of “Chairman W 3.2”
2008 Nov Awarded “Safest Warehouse of the Netherlands 2008” in the Netherland
2009 Jan Launched “Chairman H VIP” Applied for Company Rehabilitation Procedure
2009 Feb Started Company Rehabilitation Procedure
2009 Dec Company Rehabilitation plan was approved 2010 Jan Launched 2010 model year of “Rexton”, “Kyron” and “Actyon Sports” 2010 Aug Launched “Rexton RX4” 2010 Nov Ssangyong and Mahindra signed definitive agreement on investment – takeover price KRW522.5 billion (Subscription of new stocks – KRW427.1 billion, takeover of
corporate bond – KRW95.4 billion)
2011 Feb Mahindra & Mahindra took over Ssangyong Motor Company Launched “Korando C”
2011 Mar Completed Company Rehabilitation Procedure
2011 May Launched “Rexton Out-Door Edition Model”
2011 May Launched “Chairman H New Classic”
2011 Jul Launched “New Chairman W”
2012 Jan Launched “Korando Sports”
2012 Mar Launched “Rexton Euro V”
Launched “Korando C CHIC M/T”
2012 Apr Launched 2013 Model year of “Chairman H” and “Chairman W”
2012 May Launched “Rexton W (3rd generation)”
2012 Jul Launched “Rodius Euro”
2012 Aug Launched “Korando Sports Mania (4WD 6 speed M/T)”
2013 Feb Launched “Korando Turismo”
2013 Apr Launched “Chairman W Summit”
2013 May Launched 2014 model year of “Korando Sports”
2013 Jun Launched “Korando Turismo Chateau”
2013 Aug Launched “New Korando C”
5
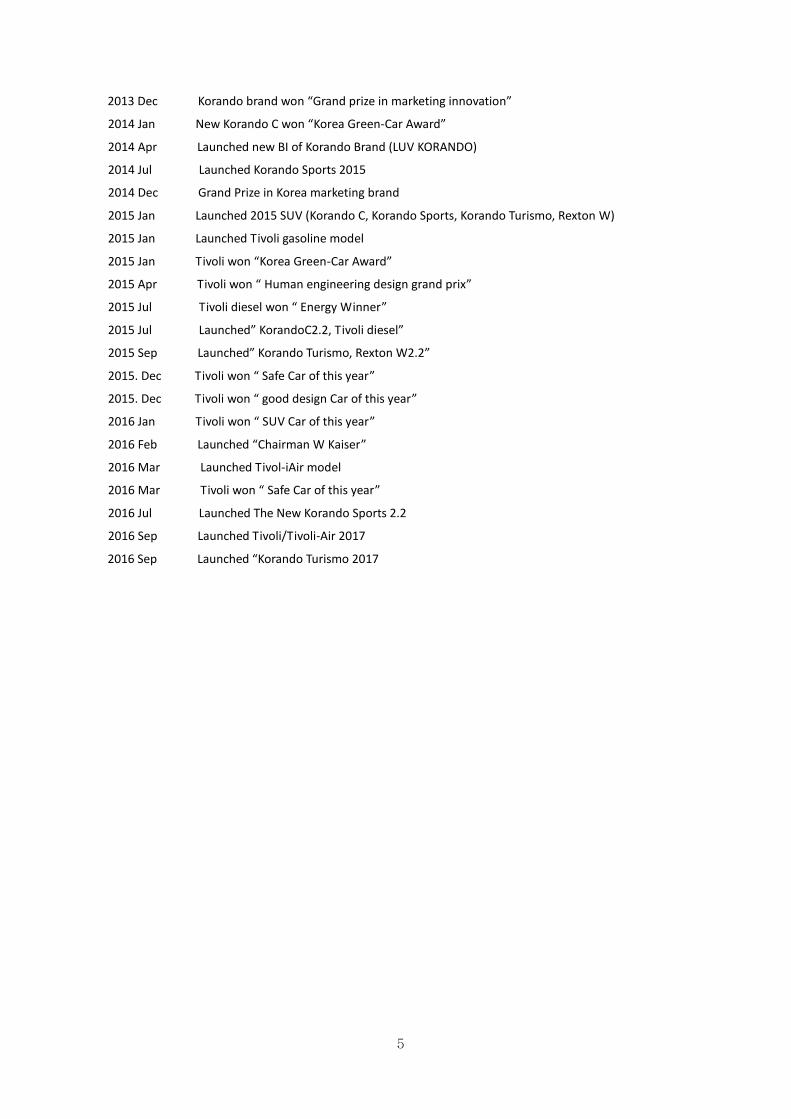
2013 Dec Korando brand won “Grand prize in marketing innovation”
2014 Jan New Korando C won “Korea Green-Car Award”
2014 Apr Launched new BI of Korando Brand (LUV KORANDO)
2014 Jul Launched Korando Sports 2015
2014 Dec Grand Prize in Korea marketing brand
2015 Jan Launched 2015 SUV (Korando C, Korando Sports, Korando Turismo, Rexton W)
2015 Jan Launched Tivoli gasoline model
2015 Jan Tivoli won “Korea Green-Car Award”
2015 Apr Tivoli won “ Human engineering design grand prix”
2015 Jul Tivoli diesel won “ Energy Winner”
2015 Jul Launched” KorandoC2.2, Tivoli diesel”
2015 Sep Launched” Korando Turismo, Rexton W2.2”
2015. Dec Tivoli won “ Safe Car of this year”
2015. Dec Tivoli won “ good design Car of this year”
2016 Jan Tivoli won “ SUV Car of this year”
2016 Feb Launched “Chairman W Kaiser”
2016 Mar Launched Tivol-iAir model
2016 Mar Tivoli won “ Safe Car of this year”
2016 Jul Launched The New Korando Sports 2.2
2016 Sep Launched Tivoli/Tivoli-Air 2017
2016 Sep Launched “Korando Turismo 2017

6
[55 th Annual Shareholders’ Meeting]
Opening Remarks
Distinguished shareholders!
I would like to extend my sincere gratitude to all of you for attending the 55th Annual
Shareholders’ Meeting of Ssangyong Motor Company out of your busy schedule.
Under the economic uncertainties last year, SYMC succeeded in returning to the surplus
thanks to the sales of Tivoli brand.
Tivoli, as the No.1 SUV in B-segment, has led the sales growth of the Company, recording
sales of 100,000 units within the shortest time in history.
Domestic sales which have recorded continued growth over the past 7 years exceeded
100,000 units in 13 years, driving record-high sales and surplus in 9 years.
Moreover, stable production of Tivoli based on the cooperative labor and management
relationship contributed to break the vicious circle of deficit.
In particular, win-win relationship between labor and management and 7-year no-strike have
helped us to improve business performance.
SYMC can rebuild the trust and come back to the normal track thanks to the endless passion
of all the executives and employees and the constant interests and support of all the
shareholders.
Once again, let me extend my deepest gratitude.
Distinguished shareholders!

7
This year, SYMC starts Promise 2019, a new mid-long-term strategies.
For the next 3 years, SYMC will launch major new products which will lead us to new future.
If we have proven our capacities for re-takeoff through the business performance
improvement, now we will show our potentiality for sustainable development by keeping a
firm turnaround.
In 2017, with the launch of premium SUV ‘G4 Rexton’, our global sales target has been
increased to more than 160,000units.
‘G4 Rexton’ upholds the legacy and authenticity of rear-wheel drive SUV based on frame-
body that SYMC has boasted.
If Tivoli has laid the ground for business turnaround, ‘G4 Rexton’, as the flagship vehicle of
SUV Line-up, will allow us to recover the name of SUV specialist and to secure profitability.
Together with Tivoli platform having capacity of 100,000 units or more, ‘G4 Rexton’, which is
the representative platform of SYMC, will play a key role in realizing the mid-long-term
development goal.
SYMC is going on a journey to achieve our long-term development goal to create new
growth engine.
First and foremost, development of new technologies to respond to future market demands
and entering into new export market through the expansion of global sales will be our top
priorities in securing key mechanism for future growth.
My fellow shareholders!
SYMC has led the Korea’s SUV markets with Korando and Tivoli brands.
Newly launched ‘G4 Rexton’ will make sensation in premium SUV markets, helping us to
restore our pride as SUV leader.
SYMC will complete SUV full line-up by introducing new products including premium pick-up

8
truck every year.
Furthermore, we will devote all our energies to create new driving power through the
development of future and eco-friendly cars such as EV and connected car, and will
continuously proceed with our ambitious overseas expansion plan to jump to the next level.
Please be our companion in marching towards global SUV leader and support us.
SYMC will definitely recover the customer confidence, and win positive sympathy and make
change through the persistent innovation.
Your continued supports and encouragement will be very much appreciated and I wish you
and your family very health and happiness.
Thank you.
March 31, 2017
C.E.O Johng-Sik, Choi
Ssangyong Motor Company

9
Ⅰ. Annual Report
1. Corporate Overview
1) The objective of the company
(1) Manufacture and sale of various automobiles and parts thereof
(2) Manufacture and sale of various heavy equipment and parts thereof
(3) Repair of various automobiles and heavy equipment
(4) Agency of automobile inspection (5) Manufacture of fire-fighting equipment (6) Export and import and agency thereof (7) Wholesale of automobile parts (8) Issue of offer sheets for sale of goods (9) Manufacture and production of various
engines and related parts (10) Agency of automobile registration (11) Sales and consignment sale of good
imported or exported
(12) Sale and lease of real estate, equipment and facilities
(13) Management of automobiles (used car sale; car scrapping agency; automobile lease)
(14) Manufacture and sale of various molds (15) E-commerce and internet-related business (16) Various types of valued-added
telecommunication business and specially-designated telecommunication business including an automobile information business, and sale and lease business of related equipment
(17) Other businesses incidental to any of the foregoing
2) Core business
Manufacturing and sales of various automobiles and parts
10
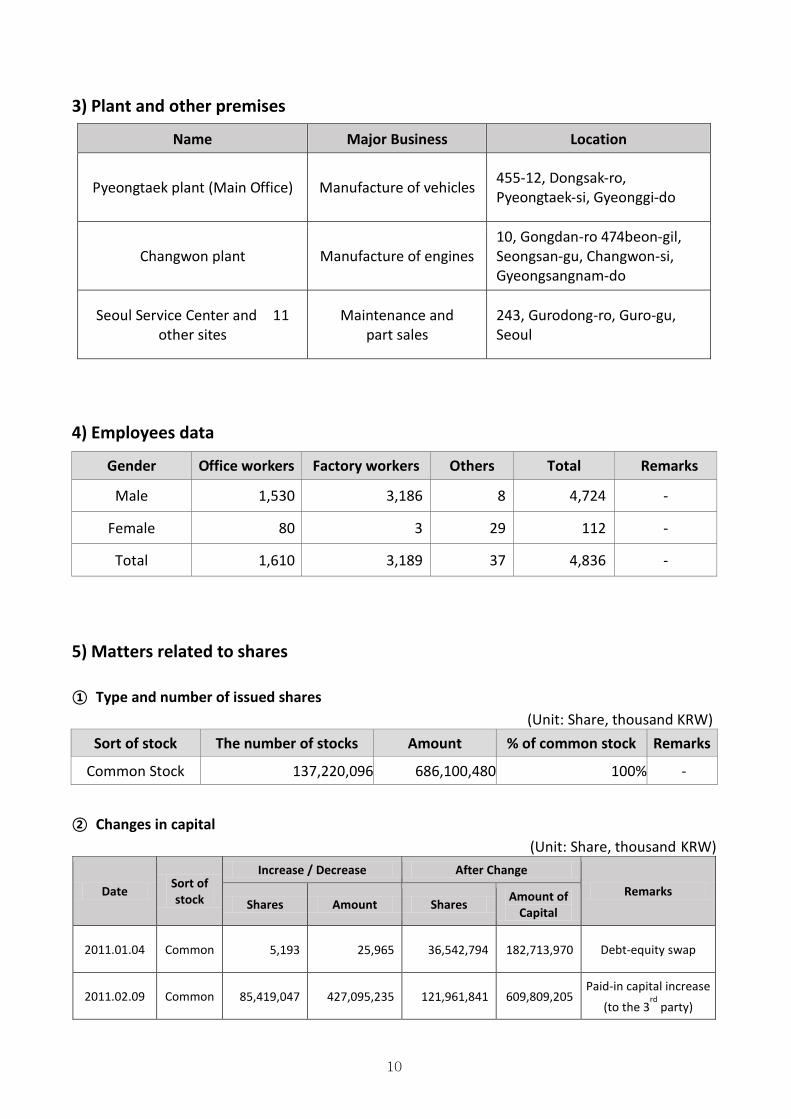
3) Plant and other premises
Name Major Business Location
Pyeongtaek plant (Main Office) Manufacture of vehicles 455-12, Dongsak-ro, Pyeongtaek-si, Gyeonggi-do
Changwon plant Manufacture of engines 10, Gongdan-ro 474beon-gil, Seongsan-gu, Changwon-si, Gyeongsangnam-do
Seoul Service Center and 11 other sites
Maintenance and part sales
243, Gurodong-ro, Guro-gu, Seoul
4) Employees data
Gender Office workers Factory workers Others Total Remarks
Male 1,530 3,186 8 4,724 -
Female 80 3 29 112 -
Total 1,610 3,189 37 4,836 -
5) Matters related to shares
① Type and number of issued shares
(Unit: Share, thousand KRW) Sort of stock The number of stocks Amount % of common stock Remarks
Common Stock 137,220,096 686,100,480 100% -
② Changes in capital
(Unit: Share, thousand KRW)
Date Sort of stock
Increase / Decrease After Change
Remarks Shares Amount Shares
Amount of Capital
2011.01.04 Common 5,193 25,965 36,542,794 182,713,970 Debt-equity swap
2011.02.09 Common 85,419,047 427,095,235 121,961,841 609,809,205 Paid-in capital increase
(to the 3rd
party)

11
2012.05.19 Common 644,550 3,222,750 122,606,391 613,031,955 Paid-in capital increase
(to the 3rd
party)
2012.08.15 Common 68,250 341,250 122,674,641 613,373,205 Paid-in capital increase
(to the 3rd
party)
2013.05.23 Common 14,545,455 72,727,275 137,220,096 686,100,480 Paid-in capital increase
(to the 3rd
party)
③ General affairs on shares
Closing date December 31st
Period of closing shareholders’ registry January 1
st - January 10
th Base date December 31st
Public notice SYMC’s Website (http://www. smotor.com) or Kukmin IlBo
Type of share certificates
Eight types : One (1), Five (5), Ten (10), Fifty (50), One Hundred (100),
Five Hundred (500), One Thousand (1,000), and Ten Thousand (10,000)
Agent Name Korea Securities Depository
Location 23, Yeouinaru-ro 4-gil, Yeongdeungpo-gu, Seoul, Korea
6) Corporate bond
(Unit: thousand KRW)
Type of bond Date of issue Issue
amount Interest
rate
Outstanding
amount
Repayment date
Payment guaranteed
by
- - - - - - -

12
2. Sales Performance
1) Overall outlook
① Domestic market
The domestic automotive market in 2016 increased by 0.7% YoY thanks to new models launch and extended individual consumption tax policy. The domestic automotive market managed to record 1,600,154 units of sales in 2016.
PC : PC market showed 3.0% of sales increase in 2016 with various new-model launch and timely product refresh of automotive makers. Introduction of middle and large PC especially played a bigger role in expansion of PC market.
RV : RV market, in spite of continuous product development and marketing activities of auto makers, showed 1.2% of sales decrease in 2016.
SUV: Increased by 0.5% YoY with the introduction of new models such as Tivoli Air and QM6.
CDV: Decreased by 9.5% YoY due to absence of new models.
SYMC recorded 103,554 units of sales in 2016, the highest in 13 years and showed 3.9% of sales increase with successful launch of Tivoli Air and continuous popularity for Korando Sports.
(Unit: Vehicle - CBU only)
Classification 2016 2015 2014 Tivoli 37,540 45,021 -
Tivoli Air 19,395 - -
Rexton 5,260 6,087 7,132
Korando C 8,951 15,677 21,840
Korando Sports 26,141 25,905 28,292
Chairman H - 1 1,117
Chairman W 957 1,290 1,580
Korando Turismo 5,310 5,683 9,075
Total 103,554 99,664 69,036

13
② Overseas market
The European auto market sold 15.13 million units in 2016, up 6.4 percent compared tocompared
to the last year. Overall Europe market continues to expand growth, but Brexit risk still exists.
The Chinese auto market sold 24.38 million units, up 15.5 percent compared the last year,
boosted by purchase tax cut effect. On the other hand, emerging markets such as Russia and
Brazil have been sluggish in sales due to the economic recession and political instability.
SYMC sold 52,200 units, excluding CKD, in 2016. Sales volume is expected to keep increasing,
as a new model, XLV (Domestic name: Tivoli Air) was launched in H2 2016. In 2017, we will boost
our sales sales in the global market by launching another new model (Rexton follow-up model).
(Unit: Vehicle - CBU only) Classification 2016 2015 2014
Rexton W 5,992 4,360 6,225
Korando C 5,616 9,421 37,863
Tivoli 22,932 18,672 -
XLV 5,954 - -
Korando Sports 8,229 8,399 9,427
Actyon 5 388 2,683
Kyron - - 8,880
Chairman W 12 15 38
Korando Turismo 3,460 3,622 5,731
Total 52,200 44,877 70,847

14
2) Production performance (Unit: Vehicle)
Category 55th 54
th Remarks
Passenger car 919 1,359 Chairman W
RV 154,681 144,274 Korando C, Korando Sports, Rexton W, Korando
Turismo ,Actyon,Tivoli, XLV
Total 155,600 145,633
3) Sales performance
(Unit: Mil. KRW, Vehicle)
Category 55th 54th
Remarks Volume Amount Volume Amount
Passenger car 969 50,415 1,306 67,794 Chairman W
RV (Including CKD) 154,875 3,156,250 143,458 2,954,214
Korando C, Korando Sports, Korando Turismo, Rexton W, Actyon, Tivoli, XLV
Others (Parts) - 419,675 - 363,548
Total 155,844 3,626,340 144,764 3,385,556
4) Major asset increase and their financing status
(Unit: Mil. KRW)
Investment areas Amount Financing details
Land -
-
Building, Structures 3,888
Vehicle Transport Equipment -
Machines 16,782
Tools 45,489
Equipment etc. 3,619
Total 69,778

15
3. Parent company, subsidiary company and company combinations
1) Parent company status
Parent company name Mahindra & Mahindra Ltd.
Parent company address Gateway Building, Apollo Bunder, Mumbai 400 001, India
Capital stock INR 2,966.5mm Major business
areas Vehicle manufacturing and related business
Number of shares in SYMC
99,964,502 shares % shareholding 72.85%
Major business with parent company
Revenue etc. : 49,492 million won
Purchasing etc. : 2,672 million won
※ The above capital stock is as of Sep 30, 2016. 2) Subsidiary company etc status
(Unit: Share)
Subsidiary company Relationship with SYMC
Company name Location Capital Core business
areas Number of
shares owned % of shares
owned
Business relations with
SYMC
Ssangyong(Shangha
i) Automotive Co.,
Ltd. China
30,000,000 (CNY)
Sale of vehicles and
vehicle parts
No stock issued
100% -
Ssangyong
European Parts
Center BV
Netherla
nds 700,000
(EUR) Sale of
vehicle parts 7,000 100%
Import & sale
of
vehicle parts
SY Auto Capital Co.,
Ltd. Korea
20,000,000,
000(WON)
Sales Finance
company of vehicle
2,040,000 51% Sales Finance
company of vehicle

16
3) Concurrent posts in subsidiary companies etc.
Directors Concurrent office
Name Position in
SYMC Company
Position in concurrent
office
Responsible area
Remarks
Choi, Johng Sik
President Ssangyong(Shanghai) Automotive Co., Ltd.
Representative Director
- -
Chung, Yong Won
Managing Director
Ssangyong(Shanghai) Automotive Co., Ltd.
Director - -
Lee, Jong Dae
Assistant Managing Director
Ssangyong European Parts Center BV
Director - -
Vasudev
Tumbe Vice President
SY Auto Capital Co.,
Ltd. Director - -
Song,
Young Han
Executive
Director
SY Auto Capital Co.,
Ltd. Director - -
4. Business performance and financial condition for the past 3 years
1) Income Statement
(Unit: Mil. KRW)
Title of account 55
th 54
th 53
rd
(Jan 1, 2016 –
Dec 31, 2016) (Jan 1, 2015 –
Dec 31, 2015) (Jan 1, 2014 –
Dec 31, 2014)
Ⅰ. Sales 3,626,340 3,385,556 3,314,896
Ⅱ. Cost of sales 3,035,871 2,868,338 2,867,899
Ⅲ. Gross profit 590,469 517,218 446,997
Ⅳ. Selling and administrative expenses 559,954 550,411 524,842
Ⅴ. Operating profit (Loss) 30,515 (33,193) (77,845)
Ⅵ. Non operating income 57,806 31,830 47,614
Ⅶ. Non operating expenses 38,569 29,825 54,096
Ⅷ. Financial income 28,244 17,731 50,717
Ⅸ. Financial expenses 21,226 45,202 17,026

17
Ⅹ. PBT 56,770 (58,659) (50,636)
XI. Corporate tax - - -
XII. Net income (loss) 56,770 (58,659) (50,636)
※ Above financial statements are drawn up based on K-IFRS(Separate)

18
2) Financial Statement
(Unit: Mil. KRW)
Title of Account 55
th 54
th 53
rd
(as of Dec 31, 2016) (as of Dec 31, 2015) (as of Dec 31, 2014)
Ⅰ. Current assets 679,573 605,694 594,352
Ⅱ. Non - Current assets 1,491,211 1,441,896 1,379,493
Total assets 2,170,784 2,047,590 1,973,845
Ⅰ. Current liabilities 944,945 878,408 821,307
Ⅱ. Non - current liabilities 405,669 443,373 369,442
Total liabilities 1,350,614 1,321,781 1,190,749
Ⅰ. Capital stock 686,100 686,100 686,100
Ⅱ. Other capital surplus 131,678 131,678 129,383
Ⅲ. Other capital adjustment -2,574 227 (14,167)
Ⅳ. Retained earnings(Deficit) 4,966 (92,196) (18,220)
Total equity 820,170 725,809 783,096
Total liabilities and equity 2,170,784 2,047,590 1,973,845
※ Above financial statements are drawn up based on K-IFRS(Separate).
5. Issues to be addressed
N/A

19
6. Board & Audit Committee status
Name Position Responsible area/ Major role
Transaction with company Remarks
Choi, Johng Sik President and
C.E.O. (Director)
- None -
Pawan Kumar Goenka Director Chairman of Board None -
Rajeev Dubey Director - None -
Chang, Dae Ryun Member of audit
committee (Outside director)
Chairman of audit committee None -
Dominic DiMarco
Member of audit committee
(Outside director) Chairman of ODCRC None -
Won, Bong Hee Member of audit
committee (Outside director)
- None -
Park, Yong Hwan Member of audit
committee (Outside director)
- None -
7. Major shareholder status (Unit: Share)
Name of shareholders Number of
shares owned Percentage
of shares Business relations with
SYMC Remarks
Mahindra & Mahindra Ltd. 99,964,502 72.85% Part sales, etc Largest
shareholder
KB Asset Management 3,941,919 2.87% - -
National Pension Service 2,050,193 1.49% - -
VANGUARD TOTAL
INTERNATIONAL STOCK INDEX 512,213 0.37% - -
Byeong-Chang Choi 509,500 0.37% - -
Halla Holdings 469,663 0.34% - -

20
8. Investment in other companies by SYMC and its subsidiaries (solely or collectively)
(Unit: Share)
Name of other company* Investment
company
Investment in other companies Other companies’
investment in SYMC
Number of shares owned
Percentage of shares owned
(%)
Number of shares owned
Percentage of shares
(%)
Ssangyong (Shanghai) Automotive Co., Ltd.
SYMC - 100% - -
Ssangyong European Parts Center BV
SYMC 7,000 100% - -
SY Auto Capital Co., Ltd. SYMC
& KB Capital 2,040,000 51%
SY Auto
Capital Co.,
Ltd.
SYMC & KB
Capital * The companies where SYMC has more than 10% of total shares.
9. Major creditors (Unit: Mil. KRW, Share)
Creditor name Credit amount Number of
shares owned Percentage of shares owned
Remarks
Bank of America Merrill Lynch 41,582 0 0.00% -
WOORI BANK 37,500 0 0.00% -
KDB Bank 30,000 0 0.00% -
JPMorgan Chase Bank 29,931 0 0.00% -
BNP PARIBAS 21,873 0 0.00% -
Australia and New Zealand
Bank 14,807 0 0.00% -
Deutsche Bank 12,783 0 0.00% -
Citibank 4,168 0 0.00% -
KEB Hana Bank 1,824 0 0.00% -
10. Important issues after closing date N/A

21
11. Other important matters related to Business
1) Consolidated Income Statement
(Unit: Mil.KRW)
Income statement 55
th 54
th 53
rd
(Jan 1, 2016 – Dec 31, 2016)
(Jan 1, 2015 – Dec 31, 2015)
(Jan 1, 2014 – Dec 31, 2014)
Ⅰ. Sales 3,628,537 3,390,065 3,326,589
Ⅱ. Cost of sales 3,036,759 2,868,750 2,869,466
Ⅲ. Gross profit 591,778 521,315 457,123
Ⅴ. Selling and administrative expenses 563,784 557,127 534,061
Ⅳ. Operating profit (Loss) 27,994 (35,812) (76,938)
Ⅴ. Non-operating income 57,808 31,871 47,254
Ⅶ. Non-operating expense 38,569 29,825 54,098
Ⅷ. Financial income 28,327 17,403 50,130
Ⅸ. Financial expense 21,241 45,215 17,042
X. Joint enterprise profit(loss) 3,814 (332) -
XI. PBT 58,133 (61,910) (50,693)
XII. Corporate tax 30 32 226
XIII. Net income (loss) 58,103 (61,942) (50,919)
※ Above financial statements are drawn up based on the K-IFRS(Consolidated).
22
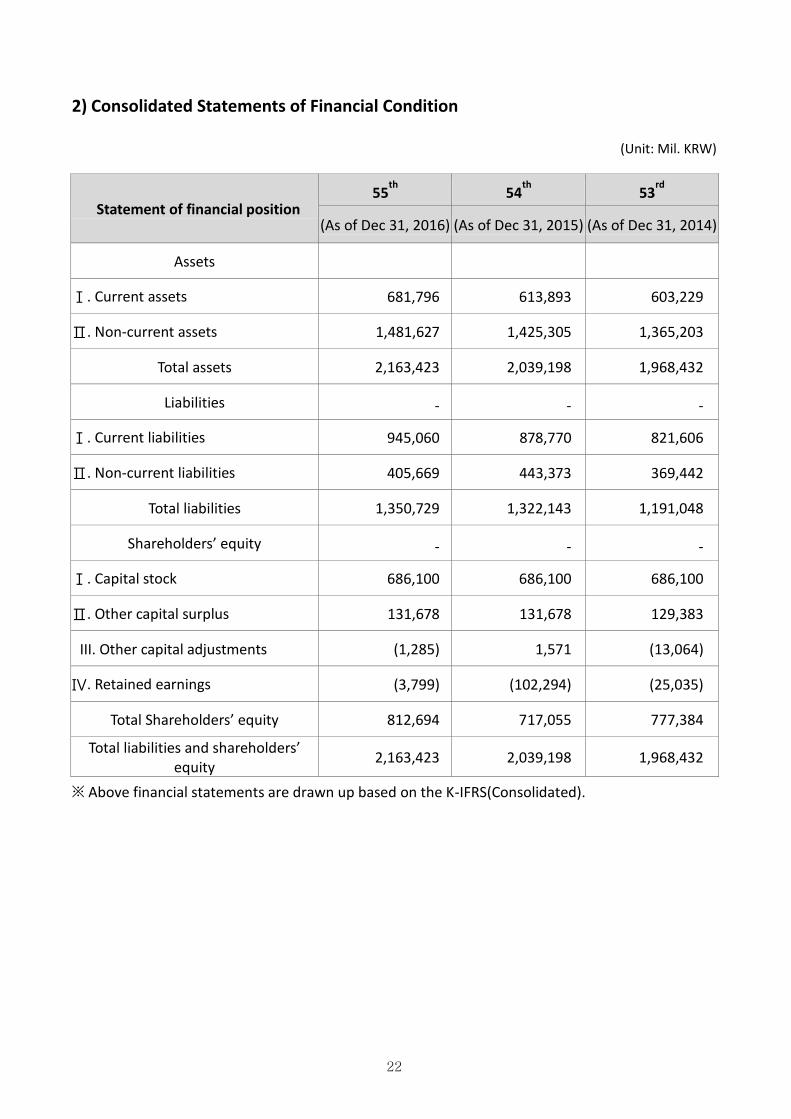
2) Consolidated Statements of Financial Condition
(Unit: Mil. KRW)
Statement of financial position 55
th 54
th 53
rd
(As of Dec 31, 2016) (As of Dec 31, 2015) (As of Dec 31, 2014)
Assets
Ⅰ. Current assets 681,796 613,893 603,229
Ⅱ. Non-current assets 1,481,627 1,425,305 1,365,203
Total assets 2,163,423 2,039,198 1,968,432
Liabilities - - -
Ⅰ. Current liabilities 945,060 878,770 821,606
Ⅱ. Non-current liabilities 405,669 443,373 369,442
Total liabilities 1,350,729 1,322,143 1,191,048
Shareholders’ equity - - -
Ⅰ. Capital stock 686,100 686,100 686,100
Ⅱ. Other capital surplus 131,678 131,678 129,383
III. Other capital adjustments (1,285) 1,571 (13,064)
Ⅳ. Retained earnings (3,799) (102,294) (25,035)
Total Shareholders’ equity 812,694 717,055 777,384
Total liabilities and shareholders’ equity
2,163,423 2,039,198 1,968,432
※ Above financial statements are drawn up based on the K-IFRS(Consolidated).
23
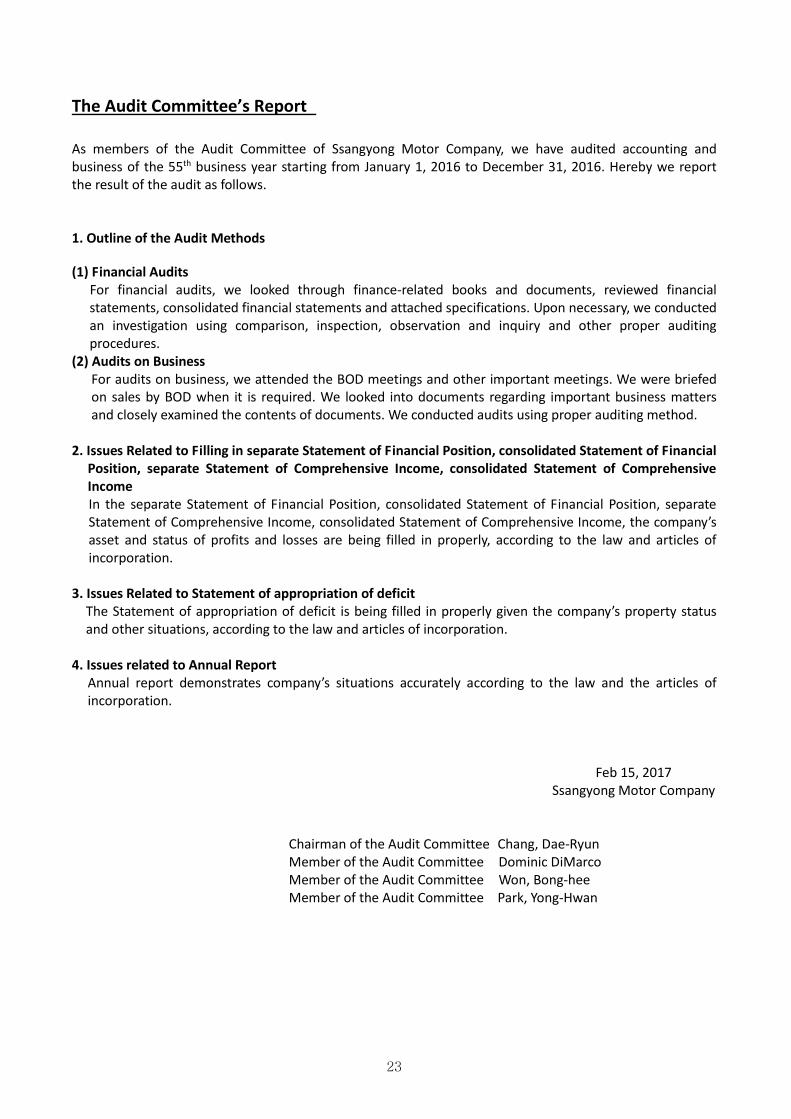
The Audit Committee’s Report
As members of the Audit Committee of Ssangyong Motor Company, we have audited accounting and business of the 55th business year starting from January 1, 2016 to December 31, 2016. Hereby we report the result of the audit as follows. 1. Outline of the Audit Methods
(1) Financial Audits For financial audits, we looked through finance-related books and documents, reviewed financial statements, consolidated financial statements and attached specifications. Upon necessary, we conducted an investigation using comparison, inspection, observation and inquiry and other proper auditing procedures.
(2) Audits on Business For audits on business, we attended the BOD meetings and other important meetings. We were briefed on sales by BOD when it is required. We looked into documents regarding important business matters and closely examined the contents of documents. We conducted audits using proper auditing method.
2. Issues Related to Filling in separate Statement of Financial Position, consolidated Statement of Financial Position, separate Statement of Comprehensive Income, consolidated Statement of Comprehensive Income In the separate Statement of Financial Position, consolidated Statement of Financial Position, separate Statement of Comprehensive Income, consolidated Statement of Comprehensive Income, the company’s asset and status of profits and losses are being filled in properly, according to the law and articles of incorporation.
3. Issues Related to Statement of appropriation of deficit
The Statement of appropriation of deficit is being filled in properly given the company’s property status and other situations, according to the law and articles of incorporation.
4. Issues related to Annual Report
Annual report demonstrates company’s situations accurately according to the law and the articles of incorporation.
Feb 15, 2017 Ssangyong Motor Company
Chairman of the Audit Committee Chang, Dae-Ryun Member of the Audit Committee Dominic DiMarco Member of the Audit Committee Won, Bong-hee Member of the Audit Committee Park, Yong-Hwan

24
Independent Auditors’ Report (Consolidated)
To the Shareholders and Board of Directors of
Ssangyong Motor Company:
Report on the Consolidated Financial Statements
We have audited the accompanying consolidated financial statements of Ssangyong Motor Company (the “Company”)
and its subsidiaries, which comprise the consolidated statements of financial position as of December 31, 2016 and
December 31, 2015, respectively, and the consolidated statements of comprehensive income, consolidated statements
of changes in stockholders’ equity and consolidated statements of cash flows, all expressed in Korean won, for the
years ended, and a summary of significant accounting policies and other explanatory information.
Management’s Responsibility for the Consolidated Financial Statements
Management is responsible for the preparation and fair presentation of these consolidated financial statements in
accordance with Korean International Financial Reporting Standards (“K-IFRS”) and for such internal control as
management determines is necessary to enable the preparation of consolidated financial statements that are free
from material misstatement, whether due to fraud or error.
Auditors’ Responsibility
Our responsibility is to express an audit opinion on these financial statements based on our audit. We conducted our
audit in accordance with Korean Standards on Auditing (“KSAs”). Those standards require that we comply with ethical
requirements and plan and perform the audit to obtain reasonable assurance about whether the consolidated financial
statements are free from material misstatement.
An audit involves performing procedures to obtain audit evidence about the amounts and disclosures in the
consolidated financial statements. The procedures selected depend on the auditor’s judgment, including the
assessment of the risks of material misstatement of the consolidated financial statements, whether due to fraud or
error. In making those risk assessments, the auditor considers internal control relevant to the entity’s preparation and
fair presentation of the consolidated financial statements in order to design audit procedures that are appropriate in
the circumstances, but not for the purpose of expressing an opinion on the effectiveness of the entity’s internal control.
An audit also includes evaluating the appropriateness of accounting policies used and the reasonableness of
accounting estimates made by management, as well as evaluating the overall presentation of the consolidated
financial statements.
We believe that the audit evidence we have obtained is sufficient and appropriate to provide a basis for our audit
opinion.
Opinion
In our opinion, the consolidated financial statements present fairly, in all material respects, the financial position of the
Company and its subsidiaries as of December 31, 2016, and December 31, 2015, respectively, and its financial
performance and its cash flows for the years then ended in accordance with K-IFRS.
Others
We conducted our audit of consolidated financial statements of the Company and its subsidiaries as of December 31,
2016 in accordance with the former KSAs, known as auditing standards generally accepted in Korea.

25
Our audit also comprehended the translation of Korean Won amounts into Indian rupee amounts and, in our opinion,
such translation has been made in conformity with the basis in Note 2. Such Indian rupee amounts are presented
solely for the convenience of readers.
March 16, 2017 Jong-Ho Ham
Deloitte Anjin LLC 10, Gukjegeumyung-ro, Yeongdeungpo-gu, Seoul

26
Independent Auditors’ Report (Separate)
To the Shareholders and Board of Directors of
Ssangyong Motor Company:
Report on the Financial Statements
We have audited the accompanying separate financial statements of Ssangyong Motor Company (the
“Company”), which comprise the separate statements of financial position as of December 31, 2016 and
December 31, 2015, respectively, and the separate statements of comprehensive income, separate
statements of changes in stockholders’ equity and separate statements of cash flows, for the years ended,
and a summary of significant accounting policies and other explanatory information.
Management’s Responsibility for the Separate Financial Statements
Management is responsible for the preparation and fair presentation of these separate financial statements
in accordance with Korean International Financial Reporting Standards (“K-IFRS”) and for such internal
control as management determines is necessary to enable the preparation of separate financial statements
that are free from material misstatement, whether due to fraud or error.
Auditors’ Responsibility
Our responsibility is to express an audit opinion on these financial statements based on our audit. We
conducted our audit in accordance with Korean Standards on Auditing (“KSAs”). Those standards require
that we comply with ethical requirements and plan and perform the audit to obtain reasonable assurance
about whether the financial statements are free from material misstatement.
An audit involves performing procedures to obtain audit evidence about the amounts and disclosures in the
financial statements. The procedures selected depend on the auditor’s judgment, including the assessment
of the risks of material misstatement of the financial statements, whether due to fraud or error. In making
those risk assessments, the auditor considers internal control relevant to the entity’s preparation and fair
presentation of the financial statements in order to design audit procedures that are appropriate in the
circumstances, but not for the purpose of expressing an opinion on the effectiveness of the entity’s internal
control. An audit also includes evaluating the appropriateness of accounting policies used and the
reasonableness of accounting estimates made by management, as well as evaluating the overall
presentation of the financial statements.
We believe that the audit evidence we have obtained is sufficient and appropriate to provide a basis for our
audit opinion.
Opinion
In our opinion, the separate financial statements present fairly, in all material respects, the financial
position of the Company as of December 31, 2016, and December 31, 2015, respectively and its financial
performance and its cash flows for the years then ended in accordance with K-IFRS.
Others
We conducted our audit of separate financial statements of the Company as of December 31, 2015 in
accordance with the former KSAs, known as auditing standards generally accepted in Korea.

27
Our audit also comprehended the translation of Korean Won amounts into Indian rupee amounts and, in our opinion, such translation has been made in conformity with the basis in Note 2. Such Indian rupee amounts are presented solely for the convenience of readers
March 16, 2017 Jong-Ho Ham
Deloitte Anjin LLC 10, Gukjegeumyung-ro, Yeongdeungpo-gu, Seoul

28
Consolidated Financial Statements 1) Consolidated statements of financial position
55th term (as of 2016.12.31)
54th term (as of 2015.12.31) (Unit : KRW)
Title of Account 55th 54th
Assets - -
I. Current assets 681,796,355,349 613,893,131,704
1. Cash and cash equivalents 238,401,707,090 197,881,903,860
2. Trade receivables 212,394,952,021 150,989,625,643
3. Non-trade receivables 7,454,962,455 6,452,810,073
4. Other current receivables 10,471,126,954 2,620,029,945
5. Derivatives assets 756,035,467 1,707,694,762
6. Inventories 204,979,631,991 247,673,244,137
7. Other current assets 7,337,939,371 6,567,823,284
II. Non-current assets 1,481,626,824,370 1,425,304,581,581
1. Non-current financial instruments 6,000,000 6,000,000
2. Other non-current receivables 33,754,663,015 39,728,011,612
3. Non-current available for sale financial assets 560,000,000 560,000,000
4. Property, plant and equipment 1,199,006,449,675 1,187,844,822,582
5. Intangible assets 234,344,497,954 186,944,584,522
6. Deferred income tax assets - -
7. Join enterprise investment 13,681,894,414 9,868,177,766
8. Other non-current assets 273,319,312 352,985,099
Total assets 2,163,423,179,719 2,039,197,713,285
Liabilities - -
I. Current Liabilities 945,059,630,316 878,769,617,825
1. Trade payables 482,391,329,855 432,432,182,499
2. Non-trade payables 152,572,053,251 172,897,876,291
3. Short-term borrowings 181,967,721,200 153,224,546,132
4. Derivatives Liability 5,798,806,301 24,073,997
5. Current debentures - -
6. Other current payables 34,519,616,413 32,484,210,527
7. Provision for product warranties 53,153,294,239 56,861,221,537

29
Title of Account 55th 54th
8. Other long-term employees benefit obligation 1,330,939,340 1,960,778,250
9. Other current liabilities 33,325,869,717 28,884,728,592
II. Non-current liabilities 405,669,623,189 443,372,917,928
1. Long term borrowings 12,500,000,000 37,500,000,000
2. Other non-current payables 5,507,071,099 12,612,613,877
3. Retirement benefit obligation 279,609,199,761 292,005,725,485
4. Other long-term employees benefit obligation 15,357,662,601 14,321,821,345
5. Provision for long-term product warranties 92,695,689,728 86,932,757,221
6. Other long-term accounts payable - -
7. Other long-term liabilities - -
Total liabilities 1,350,729,253,505 1,322,142,535,753
Shareholders' equity - -
Owner of the company 812,693,926,214 717,055,177,532
I. Capital stock 686,100,480,000 686,100,480,000
II. Other capital surplus 131,678,359,632 131,678,359,632
III. Other capital adjustments (1,285,812,572) 1,570,930,453
IV. Accumulated deficit (Retained earnings) (3,799,100,846) (102,294,592,553)
Non-controlling interests - -
Total shareholders' equity 812,693,926,214 717,055,177,532
Total liabilities and shareholders' equity 2,163,423,179,719 2,039,197,713,285

30
2) Consolidated statements of comprehensive loss
55th term (2016.01.01 - 2016.12.31)
54th term (2015.01.01 - 2015.12.31)
(Unit : KRW)
Title of Account 55th 54th
I. Sales 3,628,536,546,385 3,390,065,197,470
1. Goods 3,206,664,893,588 3,014,054,040,132
2. Merchandise 346,847,511,519 350,581,563,776
3. Other sales 75,554,378,939 25,953,387,219
4. Sales discounts (530,237,661) (523,793,657)
II. Cost of sales 3,036,758,966,582 2,868,750,169,376
1. Goods 2,830,001,672,868 2,652,038,473,285
2. Merchandise 179,859,288,645 193,322,215,415
3. Other costs of sales 26,898,005,069 23,389,480,676
III. Gross profit 591,777,579,803 521,315,028,094
IV. Selling and administrative expenses 563,783,510,244 557,126,822,189
1. Selling expenses 385,060,256,726 382,646,861,772
2. Administrative expenses 178,723,253,518 174,479,960,417
V. Operating income(loss) 27,994,069,559 (35,811,794,095)
VI. non-operating income 57,808,123,354 31,870,877,893
VII. non-operating expenses 38,569,434,947 29,824,782,882
VIII. Financial income 28,326,880,989 17,402,501,531
IX. Financial expense 21,240,116,777 45,215,209,014
X. Join venture investment income(loss) 3,813,716,648 (331,822,234)
XI. PBT(loss) 58,133,238,826 (61,910,228,801)
XII. Corporate tax 30,737,602 31,945,075
XIII. Net income (loss) 58,102,501,224 (61,942,173,876)
Owner of the company 58,102,501,224 (61,942,173,876)
Non-controlling interests - -
XIV. Other comprehensive income(loss) 37,536,247,458 (681,571,857)
1. Not to be reclassified as profit or loss in future 40,392,990,483 (15,317,733,274)
1) DBO gains/losses 40,392,990,483 (15,317,733,274)
2. To be reclassified as profit or loss in future (2,856,743,025) 14,636,161,417
1) Gain on valuation of derivatives (2,802,040,025) 14,394,640,000

31
Title of Account 55th 54th
2) Gain on overseas operations translation credit (54,703,000) 241,521,417
XV. Total comprehensive income (loss) 95,638,748,682 (62,623,745,733)
Owner of the company 95,638,748,682 (62,623,745,733)
Non-controlling interests - -
XVI. Loss per share - -
1. Basic and diluted loss per share 423 (452)

32
3) Consolidated statements of changes in shareholders' equity
55th term (2016.01.01 - 2016.12.31)
54th term (2015.01.01 - 2015.12.31) (Unit : KRW)
Title of Account Capital stock
Other Capital Surplus
Other Capital adjustments
(Deficit) Retained earnings
Non-controlling interests
Total Paid-in capital in excess of par
Gain on capital reduction
Debt to be swapped for
equity Treasury stock
Gain from sales of treasury
stock others
Balance at Jan 1, 2015 686,100,480,000 11,452,712,819 118,189,001,064 931,508,409 (1,189,820,000) - - (13,065,230,964) (25,034,685,403) - 777,383,965,925
Net loss - - - - - - - - (61,942,173,876) - (61,942,173,876)
Actuary of defined benefit - - - - - - - - (15,317,733,274) - (15,317,733,274)
Acquisition of treasury stock - - - - 1,189,820,000 1,105,137,340 - - - - 2,294,957,340
Gain on valuation of derivatives - - - - - - - 14,394,640,000 - - 14,394,640,000
Overseas operations translation credit - - - - - - - 241,521,417 - - 241,521,417
Balance at Dec 31, 2015 686,100,480,000 11,452,712,819 118,189,001,064 931,508,409 - 1,105,137,340 - 1,570,930,453 (102,294,592,553) - 717,055,177,532
Balance at Jan 1, 2016 686,100,480,000 11,452,712,819 118,189,001,064 931,508,409 - 1,105,137,340 - 1,570,930,453 (102,294,592,553) - 717,055,177,532
Net Income - - - - - - - - 58,102,501,224 - 58,102,501,224
Actuary of defined benefit - - - - - - - - 40,392,990,483 - 40,392,990,483
Gain on valuation of derivatives - - - - - - - (2,802,040,025) - - (2,802,040,025)
Overseas operations translation credit - - - - - - - (54,703,000) - - (54,703,000)
Balance at Dec 31, 2016 686,100,480,000 11,452,712,819 118,189,001,064 931,508,409 - 1,105,137,340 - (1,285,812,572) (3,799,100,846) - 812,693,926,214

33
4) Consolidated statements of cash flows
55th term (2016.01.01 - 2016.12.31)
54th term (2015.01.01 - 2015.12.31) (Unit : KRW)
Title of Account 55th 54th
I. Net cash provided by operating activities 244,369,118,172 201,547,228,533
1. Cash flows from operating activities 245,297,049,510 201,798,160,082
(1) Net income (loss) 58,102,501,224 (61,942,173,876)
(2)Adjustments 221,160,396,165 217,574,021,485
(3)Changes in net working capital (33,965,847,879) 46,166,312,473
2. Interests received 2,709,910,853 3,281,173,895
3. Interests paid (3,648,842,191) (3,532,372,711)
4. Dividend income received 11,000,000 11,000,000
5. Corporate income tax - (10,732,733)
II. Net cash provided by investing activities (210,693,643,815) (227,994,580,003)
1. Cash inflows from investing activities 5,010,236,869 8,668,107,055
(1) Decrease in other receivables 2,999,563,996 7,836,121,065
(2) Disposal of property, plant and equipment 2,010,394,163 718,827,343
(3) Disposal of intangible assets - -
(4) Disposal of subsidiary company stocks - -
(5) Decrease in other assets 278,710 113,158,647
2. Cash outflows from investing activities (215,703,880,684) (236,662,687,058)
(1) Increase in other receivables 5,430,000,000 8,493,404,205
(2) Acquisition of property, plant and equipment 127,494,011,871 151,095,940,246
(3) Acquisition of intangible assets 82,779,868,813 66,873,342,607
(4) Acquisition of sub & joint venture stocks - 10,200,000,000
III. Net cash provided by financing activities 6,959,882,274 67,528,400,147
1. Cash inflows from financing activities 24,459,882,274 72,528,400,147
(1)Increase in borrowings 24,030,389,144 70,163,042,023
(2)Capital increase with consideration 429,493,130 70,400,784
(3)Government grant - 2,294,957,340
2. Cash outflows from financing activities (17,500,000,000) (5,000,000,000)
(1)Redemption of borrowings 17,500,000,000 5,000,000,000
(2)Stock issuance cost - -
IV. Effect of exchange rate changes on cash and cash equivalents
(115,553,401) 35,548,064
V. Net increase in cash and cash equivalents 40,519,803,230 41,116,596,741
VI. Cash and cash equivalents at the beginning of the period 197,881,903,860 156,765,307,119

34
Title of Account 55th 54th
VII. Cash and cash equivalents at the end of the period 238,401,707,090 197,881,903,860

35
Separate Financial Statements
1) Statements of financial position
55th term (as of 2016.12.31)
54th term (as of 2015.12.31) (Unit : KRW)
Title of Account 55th 54th
Assets - -
I. Current assets 679,572,861,017 605,693,863,337
1. Cash and cash equivalents 234,657,416,084 192,773,290,414
2. Trade receivables 218,645,303,615 151,755,651,700
3. Non-trade receivables 7,658,754,110 6,716,048,126
4. Other current receivables 10,428,086,319 2,572,505,080
5. Derivatives assets 756,035,467 1,707,694,762
6. Inventories 200,132,722,692 243,631,535,824
7. Other current assets 7,294,542,730 6,537,137,431
II. Non-current assets 1,491,211,314,998 1,441,896,619,827
1. Non-current financial instruments 6,000,000 6,000,000
2. Other non-current receivables 41,036,984,873 50,222,268,256
3. Non-current available for sale financial assets 560,000,000 560,000,000
4. Property, plant and equipment 1,198,961,456,707 1,187,781,725,798
5. Intangible assets 234,344,497,954 186,944,584,522
6. Investments in subsidiaries 5,829,056,152 5,829,056,152
7. Investments in Joint ventures 10,200,000,000 10,200,000,000
8. Other non-current assets 273,319,312 352,985,099
Total assets 2,170,784,176,015 2,047,590,483,164
Liabilities - -
I. Current Liabilities 944,944,592,566 878,408,363,253
1. Trade payables 482,375,279,702 432,415,648,781
2. Non-trade payables 152,502,510,151 172,582,354,735
3. Short-term borrowings 181,967,721,200 153,224,546,132
4. Derivative liability 5,798,806,301 24,073,997
5. Current debentures - -
6. Other current payables 34,519,616,413 32,484,210,527
7. Provision for product warranties 53,153,294,239 56,861,221,537

36
Title of Account 55th 54th
8. Current other long-term employees benefit obligation 1,330,939,340 1,960,778,250
9. Other current liabilities 33,296,425,220 28,855,529,294
II. Non-current liabilities 405,669,623,189 443,372,917,928
1. Long term borrowings 12,500,000,000 37,500,000,000
2. Other non-current payables 5,507,071,099 12,612,613,877
3. Other long-term liabilities - -
4. Retirement benefit obligation 279,609,199,761 292,005,725,485
5. Other long-term employees benefit obligation 15,357,662,601 14,321,821,345
6. Provision for long-term product warranties 92,695,689,728 86,932,757,221
Total liabilities 1,350,614,215,755 1,321,781,281,181
Shareholders' equity - -
I. Capital stock 686,100,480,000 686,100,480,000
II. Other capital surplus 131,678,359,632 131,678,359,632
III. Other capital adjustments (2,574,700,025) 227,340,000
IV. Retained earnings (accumulated deficit) 4,965,820,653 (92,196,977,649)
Total shareholders' equity 820,169,960,260 725,809,201,983
Total liabilities and shareholders' equity 2,170,784,176,015 2,047,590,483,164

37
2) Statements of comprehensive loss
55th term (2016.01.01 - 2016.12.31)
54th term (2015.01.01 - 2015.12.31)
(Unit : KRW)
Title of Account 55th 54th
I. Sales 3,626,340,467,068 3,385,555,598,276
1. Goods 3,206,664,893,588 3,014,054,040,132
2. Merchandise 345,822,592,216 348,189,336,648
3. Other sales 74,383,218,925 23,836,015,153
4. Sales discounts (530,237,661) (523,793,657)
II. Cost of sales 3,035,871,860,775 2,868,337,736,419
1. Goods 2,830,001,672,868 2,652,038,473,285
2. Merchandise 181,635,357,626 194,951,192,602
3. Other costs of sales 24,234,830,281 21,348,070,532
III. Gross profit 590,468,606,293 517,217,861,857
IV. Selling and administrative expenses 559,953,922,599 550,410,785,278
1. Selling expenses 384,838,957,096 379,860,810,431
2. Administrative expenses 175,114,965,503 170,549,974,847
V. Operating profit(loss) 30,514,683,694 (33,192,923,421)
VI. Non-operating income 57,806,492,679 31,829,987,950
VII. Non-operating expenses 38,569,094,169 29,824,657,210
VIII. Financial income 28,244,307,074 17,730,731,850
IX. Financial expenses 21,226,581,459 45,202,319,058
X. PBT 56,769,807,819 (58,659,179,889)
XI. Corporate tax - -
XII. Net income (loss) 56,769,807,819 (58,659,179,889)
XIII. Other comprehensive income(loss) 37,590,950,458 (923,093,274)
1. Not to be reclassified as profit or loss in future 40,392,990,483 (15,317,733,274)
1) DBO gains/losses 40,392,990,483 (15,317,733,274)
2. To be reclassified as profit or loss in future (2,802,040,025) 14,394,640,000
1) Gain on valuation of derivatives (2,802,040,025) 14,394,640,000
XIV. Total comprehensive income (loss) 94,360,758,277 (59,582,273,163)
XV. Loss per share - -
1. Basic and diluted loss per share 414 (428)

38
4) Statements of changes in shareholders' equity
55th term (2016.01.01 - 2016.12.31) 54th term (2015.01.01 - 2015.12.31)
(Unit : KRW)
Title of Account Capital stock
Other Capital Surplus
Other Capital adjustments
(Deficit) Retained earnings
Total Paid-in capital in
excess of par Gain on capital
reduction
Debt to be swapped for
equity Treasury stock
Gain from sales of treasury stock
other capital surplus
Balance at Jan 1, 2015 686,100,480,000 11,452,712,819 118,189,001,064 931,508,409 (1,189,820,000) - - (14,167,300,000) (18,220,064,486) 783,096,517,806
Net loss - - - - - - - - (58,659,179,889) (58,659,179,889)
Actuary of defined benefit - - - - - - - - (15,317,733,274) (15,317,733,274)
Dispose of treasury stock - - - - 1,189,820,000 1,105,137,340 - - - 2,294,957,340
Gain on valuation of derivatives - - - - - - - 14,394,640,000 - 14,394,640,000
Balance at Dec 31, 2015 686,100,480,000 11,452,712,819 118,189,001,064 931,508,409 0 1,105,137,340 - 227,340,000 (92,196,977,649) 725,809,201,983
Balance at Jan 1, 2016 686,100,480,000 11,452,712,819 118,189,001,064 931,508,409 0 1,105,137,340 - 227,340,000 (92,196,977,649) 725,809,201,983
Net income(loss) - - - - - - - - 56,769,807,819 56,769,807,819
Actuary of defined benefit - - - - - - - - 40,392,990,483 40,392,990,483
Gain on valuation of derivatives - - - - - - - (2,802,040,025)
(2,802,040,025)
Balance at Dec 31, 2016 686,100,480,000 11,452,712,819 118,189,001,064 931,508,409 - 1,105,137,340 - (2,574,700,025) 4,965,820,653 820,169,960,260

5) Statements of cash flows
55th term (2016.01.01 - 2016.12.31)
54th term (2015.01.01 - 2015.12.31)
(Unit : KRW)
Title of Account 55th 54th
I. Net cash provided by operating activities 245,616,556,539 204,142,602,828
1. Cash flows from operating activities 246,601,797,348 204,031,272,016
(1) Net income (loss) 56,769,807,819 (58,659,179,889)
(2)Adjustments 225,017,703,842 216,863,010,056
(3)Changes in net working capital (35,185,714,313) 45,827,441,849
2. Interests received 2,640,050,477 3,151,629,466
3. Interests paid (3,636,291,286) (3,520,527,415)
4. Dividend income received 11,000,000 480,228,761
II. Net cash provided by investing activities (210,692,313,143) (227,988,944,953)
1. Cash inflows from investing activities 5,010,236,869 8,668,107,055
(1) Decrease in other receivables 2,999,563,996 7,836,121,065
(2) Disposal of property, plant and equipment 2,010,394,163 718,827,343
(3) Disposal of intangible assets - -
(4) Disposal of investments on subsidiary - -
(5) Decrease in other assets 278,710 113,158,647
2. Cash outflows from investing activities (215,702,550,012) (236,657,052,008)
(1) Increase in other receivables 5,430,000,000 8,493,404,205
(2) Acquisition of property, plant and equipment 127,492,681,199 151,090,305,196
(3) Acquisition of intangible assets 82,779,868,813 66,873,342,607
(4) Acquisition of investments on subsidiary - 10,200,000,000
III. Net cash provided by financing activities 6,959,882,274 67,528,400,147
1. Cash inflows from financing activities 24,459,882,274 72,528,400,147
(1)Increase in borrowings 24,030,389,144 70,163,042,023
(2)Government Grant 429,493,130 70,400,784
(3)Capital increase with consideration - 2,294,957,340
2. Cash outflows from financing activities (17,500,000,000) (5,000,000,000)
(1)Redemption of borrowings 17,500,000,000 5,000,000,000
(2)Stock issuance cost - -
IV. Effect of exchange rate changes on cash and cash equivalents
- -
V. Net increase in cash and cash equivalents 41,884,125,670 43,682,058,022
VI. Cash and cash equivalents at the beginning of the period
192,773,290,414 149,091,232,392
VII. Cash and cash equivalents at the end of the period 234,657,416,084 192,773,290,414

40
5) Statement of appropriation of deficit
55th term (2016.01.01 - 2016.12.31)
54th term (2015.01.01 - 2015.12.31) Expected appropriation date: Mar. 31, 2017 Finalized disposition date: Mar.31, 2016
(Unit : KRW)
Title of Account 55th 54th
I. Unappropriated retained earnings (deficit) 4,965,820,653 (92,196,977,649)
1. Undisposed retained earnings(deficit) carried over from prior year
(92,196,977,649) (18,220,064,486)
2. Net income (loss) 56,769,807,819 (58,659,179,889)
3. Actuarial income(loss) 40,392,990,483 (15,317,733,274)
II. Appropriation earnings(deficit) - -
III. Unappropriated earnings(deficit) to be carried forward to the subsequent year
4,965,820,653 (92,196,977,649)