the 4 th seminar on promoting services trade in asean ... · - 20 fastest growing travel...
TRANSCRIPT

The 4th Seminar on Promoting Services Trade in ASEAN Trade in Tourism Services
TRADE SERVICESININDONESIAGeneral Information
3
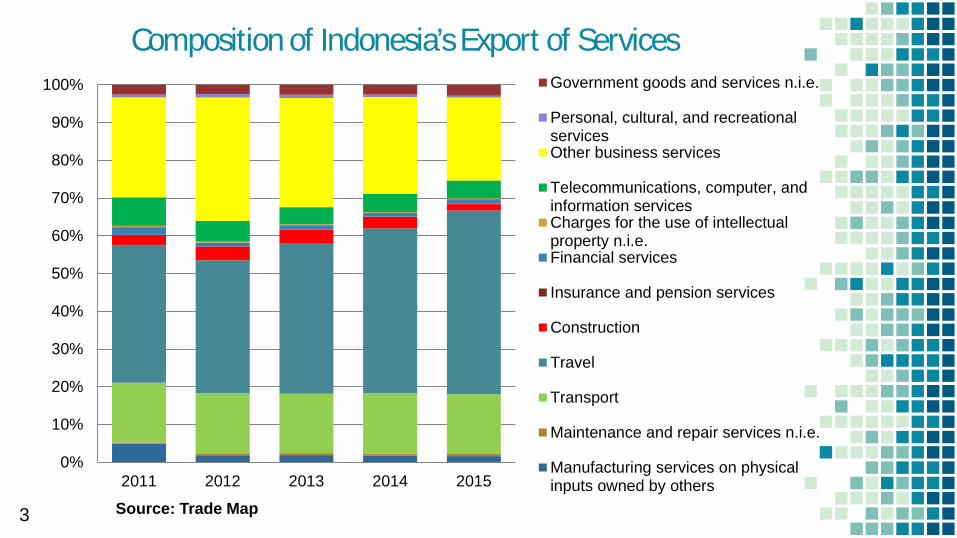
Composition of Indonesiarsquos Export of Services
Source Trade Map
0
10
20
30
40
50
60
70
80
90
100
2011 2012 2013 2014 2015
Government goods and services nie
Personal cultural and recreationalservicesOther business services
Telecommunications computer andinformation servicesCharges for the use of intellectualproperty nieFinancial services
Insurance and pension services
Construction
Travel
Transport
Maintenance and repair services nie
Manufacturing services on physicalinputs owned by others
4
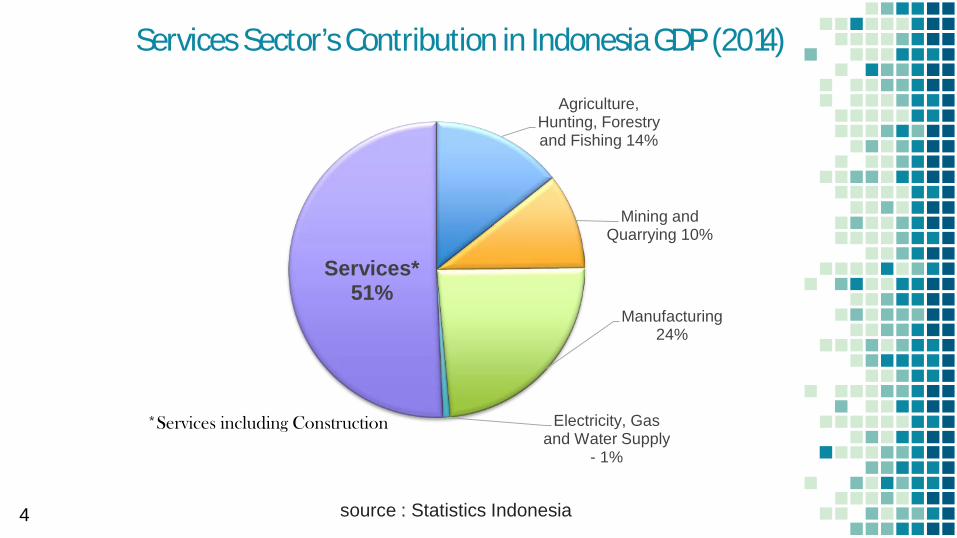
Services Sectorrsquos Contribution in Indonesia GDP (2014)
Agriculture Hunting Forestry and Fishing 14
Mining and Quarrying 10
Manufacturing24
Electricity Gas and Water Supply
- 1
Services 51
Services including Construction
source Statistics Indonesia
Directorateof Trade In ServicesDirectorate General of International Trade Negotiation
5
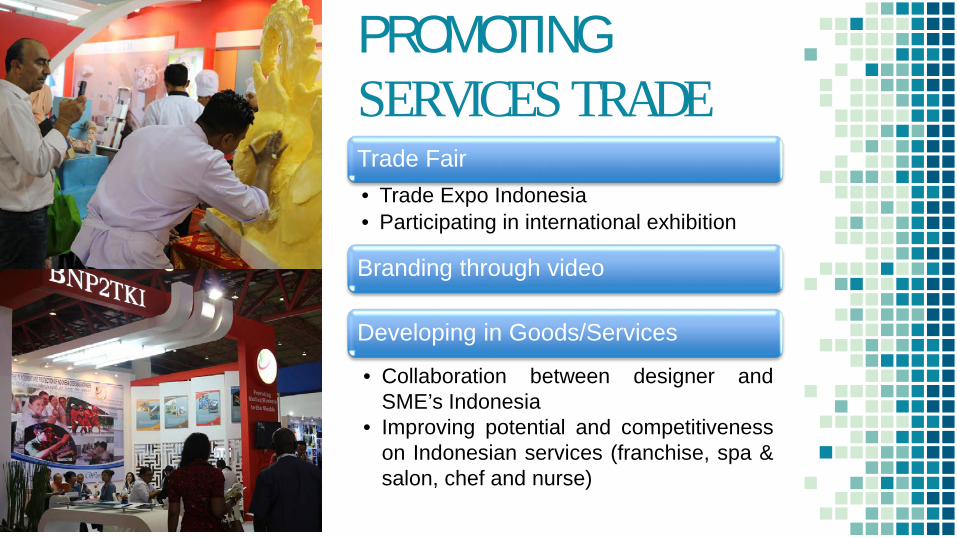
PROMOTING SERVICES TRADE
6
Trade Fairbull Trade Expo Indonesiabull Participating in international exhibition
Branding through video
Developing in GoodsServices
bull Collaboration between designer andSMErsquos Indonesia
bull Improving potential and competitivenesson Indonesian services (franchise spa ampsalon chef and nurse)
TRADE IN TOURISM SERVICES
88
9
OUTLINE
A Marketing PerformanceB Digital TourismC Investment Opportunity
10
A Marketing Performance
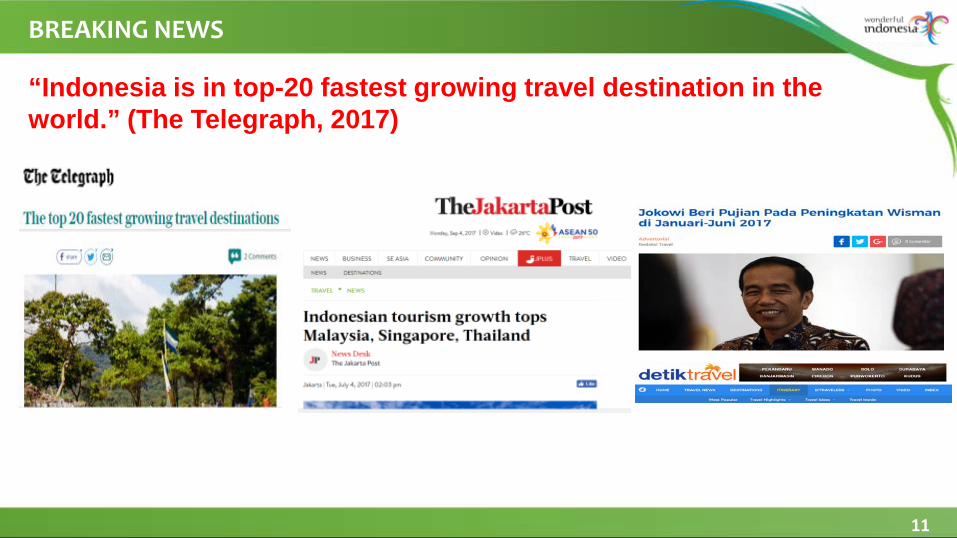
BREAKING NEWS
11
ldquoIndonesia is in top-20 fastest growing travel destination in the worldrdquo (The Telegraph 2017)
12Source Statistics of each countries
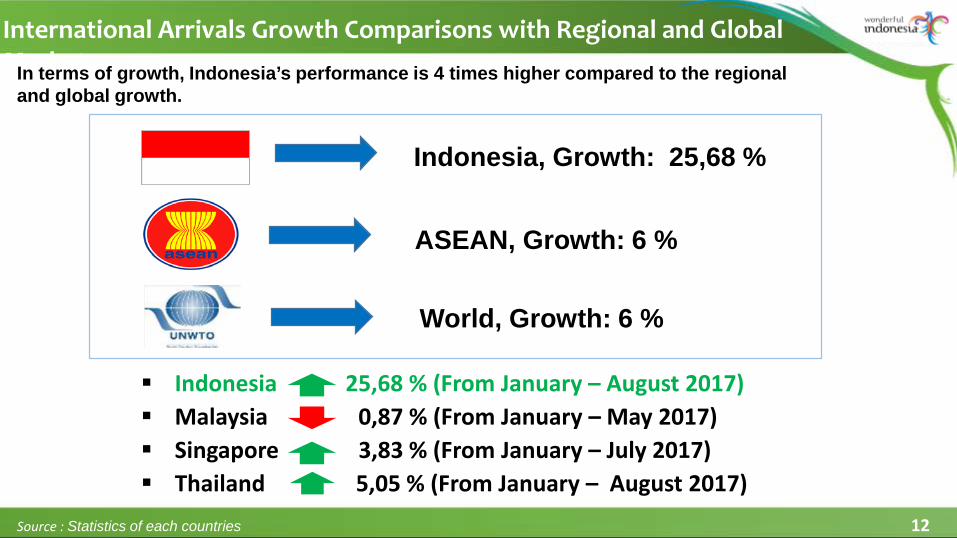
Indonesia 2568 (From January ndash August 2017) Malaysia 087 (From January ndash May 2017) Singapore 383 (From January ndash July 2017) Thailand 505 (From January ndash August 2017)
International Arrivals Growth Comparisons with Regional and Global Market
ASEAN Growth 6
World Growth 6
Indonesia Growth 2568
In terms of growth Indonesiarsquos performance is 4 times higher compared to the regional and global growth
Sumber BPS dan Pusdatin Kemenpar 2015 (estimasi)
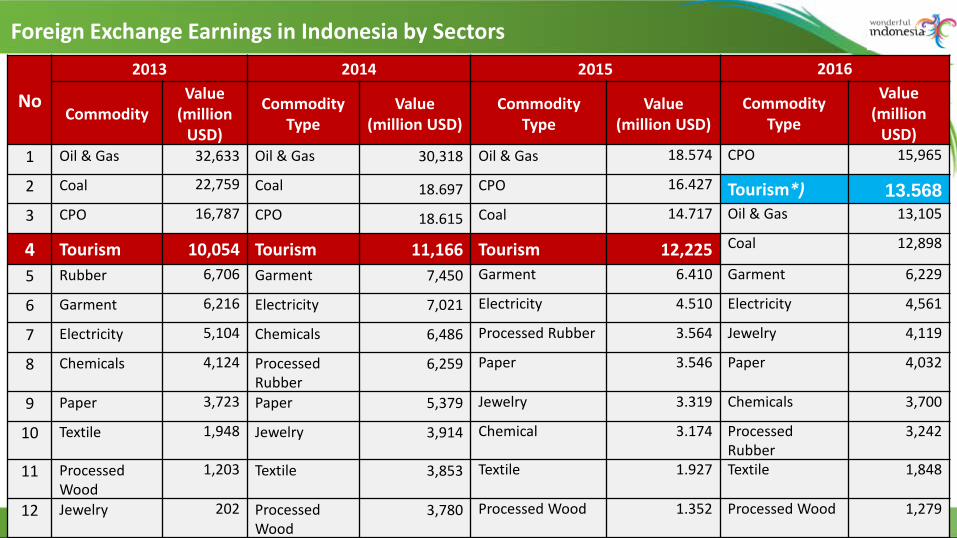
Foreign Exchange Earnings in Indonesia by Sectors
13
No
2013 2014 2015 2016
CommodityValue
(million USD)
Commodity Type
Value (million USD)
Commodity Type
Value (million USD)
Commodity Type
Value (million
USD)1 Oil amp Gas 32633 Oil amp Gas 30318 Oil amp Gas 18574 CPO 15965
2 Coal 22759 Coal 18697 CPO 16427 Tourism) 135683 CPO 16787 CPO 18615 Coal 14717 Oil amp Gas 13105
4 Tourism 10054 Tourism 11166 Tourism 12225 Coal 12898
5 Rubber 6706 Garment 7450 Garment 6410 Garment 6229
6 Garment 6216 Electricity 7021 Electricity 4510 Electricity 4561
7 Electricity 5104 Chemicals 6486 Processed Rubber 3564 Jewelry 4119
8 Chemicals 4124 ProcessedRubber
6259 Paper 3546 Paper 4032
9 Paper 3723 Paper 5379 Jewelry 3319 Chemicals 3700
10 Textile 1948 Jewelry 3914 Chemical 3174 Processed Rubber
3242
11 Processed Wood
1203 Textile 3853 Textile 1927 Textile 1848
12 Jewelry 202 ProcessedWood
3780 Processed Wood 1352 Processed Wood 1279
14
During 2016 Wonderful Indonesia received46 awards at various events in 22 countries
ACKNOWLEDGEMENT OF WONDERFUL INDONESIA BRANDING
15
ACKNOWLEDGEMENT OF WONDERFUL INDONESIA BRANDING15 September 2017UNWTO Video Competition 2017 Chengdu China1 Peoplersquos Choice Award2 Winner East Asia and Pacific Region
16
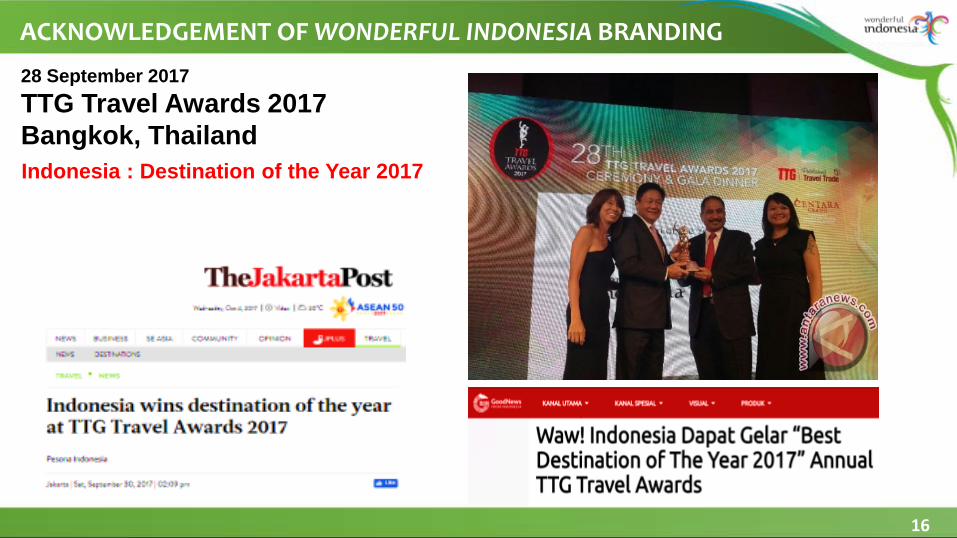
ACKNOWLEDGEMENT OF WONDERFUL INDONESIA BRANDING
28 September 2017TTG Travel Awards 2017Bangkok ThailandIndonesia Destination of the Year 2017
17
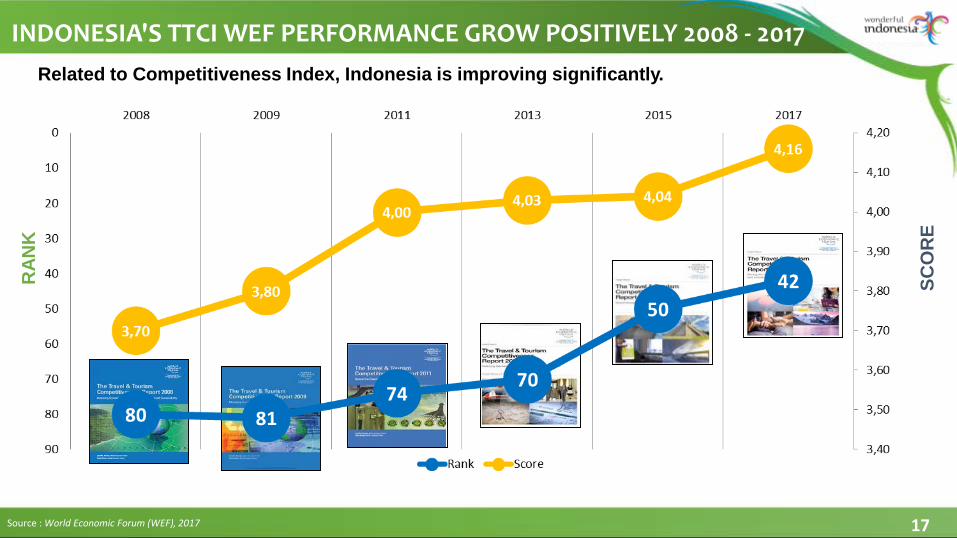
INDONESIAS TTCI WEF PERFORMANCE GROW POSITIVELY 2008 - 2017
Source World Economic Forum (WEF) 2017
RAN
K
SCO
RE
Related to Competitiveness Index Indonesia is improving significantly

TRADE SERVICESININDONESIAGeneral Information
3
Composition of Indonesiarsquos Export of Services
Source Trade Map
0
10
20
30
40
50
60
70
80
90
100
2011 2012 2013 2014 2015
Government goods and services nie
Personal cultural and recreationalservicesOther business services
Telecommunications computer andinformation servicesCharges for the use of intellectualproperty nieFinancial services
Insurance and pension services
Construction
Travel
Transport
Maintenance and repair services nie
Manufacturing services on physicalinputs owned by others
4
Services Sectorrsquos Contribution in Indonesia GDP (2014)
Agriculture Hunting Forestry and Fishing 14
Mining and Quarrying 10
Manufacturing24
Electricity Gas and Water Supply
- 1
Services 51
Services including Construction
source Statistics Indonesia
Directorateof Trade In ServicesDirectorate General of International Trade Negotiation
5
PROMOTING SERVICES TRADE
6
Trade Fairbull Trade Expo Indonesiabull Participating in international exhibition
Branding through video
Developing in GoodsServices
bull Collaboration between designer andSMErsquos Indonesia
bull Improving potential and competitivenesson Indonesian services (franchise spa ampsalon chef and nurse)
TRADE IN TOURISM SERVICES
88
9
OUTLINE
A Marketing PerformanceB Digital TourismC Investment Opportunity
10
A Marketing Performance
BREAKING NEWS
11
ldquoIndonesia is in top-20 fastest growing travel destination in the worldrdquo (The Telegraph 2017)
12Source Statistics of each countries
Indonesia 2568 (From January ndash August 2017) Malaysia 087 (From January ndash May 2017) Singapore 383 (From January ndash July 2017) Thailand 505 (From January ndash August 2017)
International Arrivals Growth Comparisons with Regional and Global Market
ASEAN Growth 6
World Growth 6
Indonesia Growth 2568
In terms of growth Indonesiarsquos performance is 4 times higher compared to the regional and global growth
Sumber BPS dan Pusdatin Kemenpar 2015 (estimasi)
Foreign Exchange Earnings in Indonesia by Sectors
13
No
2013 2014 2015 2016
CommodityValue
(million USD)
Commodity Type
Value (million USD)
Commodity Type
Value (million USD)
Commodity Type
Value (million
USD)1 Oil amp Gas 32633 Oil amp Gas 30318 Oil amp Gas 18574 CPO 15965
2 Coal 22759 Coal 18697 CPO 16427 Tourism) 135683 CPO 16787 CPO 18615 Coal 14717 Oil amp Gas 13105
4 Tourism 10054 Tourism 11166 Tourism 12225 Coal 12898
5 Rubber 6706 Garment 7450 Garment 6410 Garment 6229
6 Garment 6216 Electricity 7021 Electricity 4510 Electricity 4561
7 Electricity 5104 Chemicals 6486 Processed Rubber 3564 Jewelry 4119
8 Chemicals 4124 ProcessedRubber
6259 Paper 3546 Paper 4032
9 Paper 3723 Paper 5379 Jewelry 3319 Chemicals 3700
10 Textile 1948 Jewelry 3914 Chemical 3174 Processed Rubber
3242
11 Processed Wood
1203 Textile 3853 Textile 1927 Textile 1848
12 Jewelry 202 ProcessedWood
3780 Processed Wood 1352 Processed Wood 1279
14
During 2016 Wonderful Indonesia received46 awards at various events in 22 countries
ACKNOWLEDGEMENT OF WONDERFUL INDONESIA BRANDING
15
ACKNOWLEDGEMENT OF WONDERFUL INDONESIA BRANDING15 September 2017UNWTO Video Competition 2017 Chengdu China1 Peoplersquos Choice Award2 Winner East Asia and Pacific Region
16
ACKNOWLEDGEMENT OF WONDERFUL INDONESIA BRANDING
28 September 2017TTG Travel Awards 2017Bangkok ThailandIndonesia Destination of the Year 2017
17
INDONESIAS TTCI WEF PERFORMANCE GROW POSITIVELY 2008 - 2017
Source World Economic Forum (WEF) 2017
RAN
K
SCO
RE
Related to Competitiveness Index Indonesia is improving significantly
17
INDONESIAS TTCI WEF PERFORMANCE GROW POSITIVELY 2008 - 2017
Source World Economic Forum (WEF) 2017
RAN
K
SCO
RE
Related to Competitiveness Index Indonesia is improving significantly

Chart1
Sheet1
Sheet2
Sheet3
Sheet3
Sheet4
Sheet5
Sheet6
Sheet7
Sheet7
18
B Digital Tourism
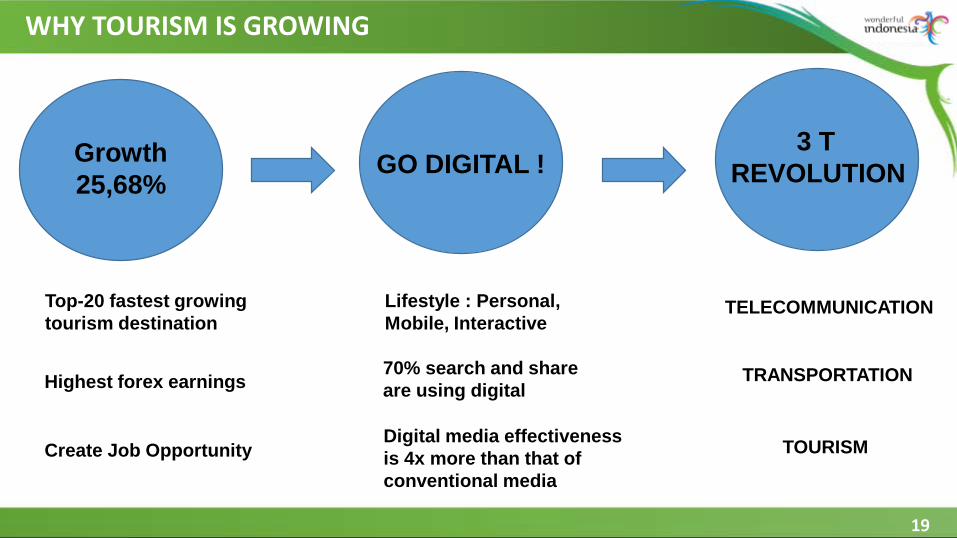
WHY TOURISM IS GROWING
Growth 2568
GO DIGITAL 3 T
REVOLUTION
Top-20 fastest growing tourism destination
Lifestyle Personal Mobile Interactive
70 search and share are using digital
Digital media effectiveness is 4x more than that of conventional media
TELECOMMUNICATION
TRANSPORTATION
TOURISM
Highest forex earnings
Create Job Opportunity
19
3T REVOLUTION
TELECOMUNICATION + DIGITALCOMMON PLATFORM
SHARING ECONOMY
Google Facebook Whatsapp
TRANSPORTATION + DIGITALCOMMON PLATFORM
SHARING ECONOMY
Uber LCC Gojek
TOURISM + DIGITALCOMMON PLATFORM
SHARING ECONOMY
Tripadvisor Traveloka Travelio
Digital Tourism Revolution is the Natural Revolution
20
CHALLENGES AHEAD
INCUMBENT RESISTANCE
ldquoWhatrsquos in it for merdquo
COST OF DOING NOTHING
21
22
DEVELOPMENT OF DIGITAL WORLD
Social media
January 2017 74 Billion worldrsquos population 37 Billion internet users 27 Billion active social media users 8 Billion mobile users 25 Billion active social mobile users
January 2017 262 Million Indonesiarsquos population
132 Million internet users 106 Million active social media users 371 Million mobile users 92 Million active social mobile users
Source We Are Social Hootsuite 2017
TREND INDUSTRI
23
24
C Investment Opportunity
BREAKING NEWS
25
Ease of Doing Business in Indonesia has improved due to government efforts to simplify regulations
26
Indonesia investment grade is reaffirmed by all major agencies
No Company 2016 Ratings Investment Value 2017 Ratings Investment Value
1 Standard and Poorrsquos BB+ Negative BBB- Positive
2 Moodyrsquos Investor Service Baa3 Positive Baa3 Positive
3 Fitch BBB- Stable BBB- Positive
WONDERFUL INDONESIA IS A WORTH TO INVEST COUNTRY
27
TOURISM INVESTMENT REALIZATION
53of Target in 2017
Source Indonesia Investment Coordinating Board (BKPM) 2017
) year 2017 (January ndash September)
Growth 2013 - 2014 2014 - 2015 2015 ndash 2016
PMA 1066 4311 6286
PMDN 2347 8293 -4948
Total 1364 5317 2896
Tourism Investment Realization Growth
| Score | Rank | ||||||||
| 2008 | 370 | 80 | |||||||
| 2009 | 380 | 81 | |||||||
| 2011 | 400 | 74 | |||||||
| 2013 | 403 | 70 | |||||||
| 2015 | 404 | 50 | |||||||
| 2017 | 416 | 42 | 324 | 37 |
| No | Sub Index Pillar | Indonesia | |||
| Travel and Tourism Competitiveness Index 2015 | 50 | ||||
| I | ENABLING ENVIRONMENT | 80 | |||
| 1 | Business Environment | 63 | |||
| 2 | Safety and Security | 83 | |||
| 3 | Health and Hygiene | 109 | |||
| 4 | Human Resources and Labour Market | 53 | |||
| 5 | ICT Readiness | 85 | |||
| II | TRAVEL AND TOURISM POLICY AND ENABLING CONDITION | 9 | |||
| 6 | Prioritization of Travel and Tourism | 15 | |||
| 7 | International Openness | 55 | |||
| 8 | Price Competitiveness | 3 | |||
| 9 | Environmental Sustainability | 134 | |||
| III | INFRASTRUCTURE | 75 | |||
| 10 | Air Transport Infrsatructure | 39 | |||
| 11 | Ground and Port Infrastructure | 77 | |||
| 12 | Tourist Service Infrastructure | 101 | |||
| IV | NATURAL AND CULTURAL RESOURCES | 17 | |||
| 13 | Natural Resources | 19 | |||
| 14 | Cultural Resources and Business Travel | 25 |
| PILAR | 2015 | +- | |||
| Price Competitiveness | 3 | 6 | |||
| Prioritization of Travel and Tourism | 15 | 4 | |||
| Natural Resources | 19 | -13 | |||
| Cultural Resources and Business Travel | 25 | 13 | |||
| Air Transport Infrastructure | 39 | 15 | |||
| Human Resources and Labour Market | 53 | 8 | |||
| International Openness | 55 | 59 | |||
| Business Environment | 63 | 30 | |||
| Ground Port and Infrastructure | 77 | 10 | |||
| Safety and Security | 83 | 2 | |||
| ICT Readiness | 85 | 2 | |||
| Tourist Service Infrastructure | 101 | 12 | |||
| Health and Hygiene | 109 | 3 | |||
| Environmental Sustainability | 134 | -9 |
| Business environment | Business environment | ||
| Safety and security | Safety and security | ||
| Health and hygiene | Health and hygiene | ||
| Human resources and labour market | Human resources and labour market | ||
| ICT readiness | ICT readiness | ||
| Prioritization of Travel amp Tourism | Prioritization of Travel amp Tourism | ||
| International Openness | International Openness | ||
| Price competitiveness | Price competitiveness | ||
| Environmental sustainability | Environmental sustainability | ||
| Air transport infrastructure | Air transport infrastructure | ||
| Ground and port infrastructure | Ground and port infrastructure | ||
| Tourist service infrastructure | Tourist service infrastructure | ||
| Natural resources | Natural resources | ||
| Cultural resources and business travel | Cultural resources and business travel |
| TTCI 2015 | SIMULASI 1 - 2017 | SIMULASI 2 - 2017 | |||||||||||||||||||||||||
| The Travel amp Tourism Competitiveness Index | 4045 | 4216 | 0171 | 4250 | 0205 | ||||||||||||||||||||||
| Enabling Environment | 4461 | 4577 | 0116 | 4626 | 0166 | ||||||||||||||||||||||
| Business environment | 4481 | 6000 | 4880 | 4000 | 0399 | 5025 | 4000 | 0544 | RANK | TTCI 2015 | SIMULASI 1 - 2017 | SIMULASI 2 - 2017 | |||||||||||||||
| Safety and security | 5156 | 3000 | 5159 | 3000 | 0003 | 5229 | 3000 | 0073 | 1 | Price competitiveness | Price competitiveness | Price competitiveness | |||||||||||||||
| Health and hygiene | 4245 | 8000 | 4244 | 9000 | -0001 | 4244 | 9000 | -0001 | 2 | Prioritization of Travel amp Tourism | Prioritization of Travel amp Tourism | Prioritization of Travel amp Tourism | |||||||||||||||
| Human resources and labour market | 4697 | 4000 | 4712 | 5000 | 0015 | 4734 | 5000 | 0037 | 3 | Safety and security | Safety and security | Safety and security | |||||||||||||||
| ICT readiness | 3726 | 11000 | 3889 | 10000 | 0163 | 3899 | 10000 | 0173 | 4 | Human resources and labour market | Business environment | Business environment | |||||||||||||||
| TampT Policy and Enabling Conditions | 4595 | 4569 | -0026 | 4642 | 0047 | 5 | Business environment | Human resources and labour market | Human resources and labour market | ||||||||||||||||||
| Prioritization of Travel amp Tourism | 5608 | 2000 | 5607 | 2000 | -0001 | 5899 | 2000 | 0291 | 6 | Natural resources | Air transport infrastructure | Air transport infrastructure | |||||||||||||||
| International Openness | 3551 | 12000 | 3559 | 14000 | 0008 | 3559 | 14000 | 0008 | 7 | Health and hygiene | Natural resources | Natural resources | |||||||||||||||
| Price competitiveness | 6109 | 1000 | 5988 | 1000 | -0121 | 5988 | 1000 | -0121 | 8 | Air transport infrastructure | Health and hygiene | Health and hygiene | |||||||||||||||
| Environmental sustainability | 3111 | 16000 | 3120 | 17000 | 0009 | 3122 | 17000 | 0011 | 9 | ICT readiness | ICT readiness | ICT readiness | |||||||||||||||
| Infrastructure | 3384 | 3833 | 0449 | 3846 | 0462 | 10 | Tourist service infrastructure | Environmental sustainability | Environmental sustainability | ||||||||||||||||||
| Air transport infrastructure | 3806 | 9000 | 4346 | 7000 | 0540 | 4346 | 7000 | 0540 | 11 | Environmental sustainability | Ground and port infrastructure | Ground and port infrastructure | |||||||||||||||
| Ground and port infrastructure | 3273 | 14000 | 3275 | 16000 | 0002 | 3314 | 16000 | 0041 | 12 | Cultural resources and business travel | Cultural resources and business travel | Cultural resources and business travel | |||||||||||||||
| Tourist service infrastructure | 3072 | 17000 | 3878 | 12000 | 0806 | 3878 | 12000 | 0806 | 13 | Ground and port infrastructure | International Openness | International Openness | |||||||||||||||
| Natural and Cultural Resources | 3739 | 3885 | 0146 | 3885 | 0146 | 14 | International Openness | Tourist service infrastructure | Tourist service infrastructure | ||||||||||||||||||
| Natural resources | 4362 | 7000 | 4246 | 8000 | -0116 | 4246 | 8000 | -0116 | |||||||||||||||||||
| Cultural resources and business travel | 3116 | 15000 | 3524 | 15000 | 0408 | 3524 | 15000 | 0408 |
| INDONESIA | |||||||||||||||||||||||||||||||||||||
| TTCI 2015 | SIMULASI 17 | KETERANGAN | |||||||||||||||||||||||||||||||||||
| Placement | Dataset | Edition | GLOBAL ID | Code | Series | Series unindented | Type | Metode | (+-) | value | v-check | min | max | TTCI 2015 | SIMULASI 1 - 2017 | SIMULASI 2 - 2017 | S3 | S4 | |||||||||||||||||||
| 1 | TampT Competitiveness Index | 2015 | TTCI | ttci | all | Enabling environment subindex 1-7 (best) | index | 4045 | 4045 | 243 | 531 | 4045 | 4216 | 4250 | |||||||||||||||||||||||
| 2 | TampT Competitiveness Index | 2015 | TTCIA | A | Enabling environment subindex 1-7 (best) | Enabling environment subindex 1-7 (best) | Sub-index | 44607 | 44600 | 274 | 608 | 44607 | 45769 | 4626 | |||||||||||||||||||||||
| 3 | TampT Competitiveness Index | 2015 | TTCIA01 | A01 | Business environment | Business environment 1-7 (best) | Pillar | 4481 | 4480 | 236 | 613 | 4481 | 4880 | 5025 | |||||||||||||||||||||||
| 4 | TampT Competitiveness Index | 2015 | EOSQ051 | 101 | Property rights 1-7 | Property rights 1-7 | Indicator | E | 2 | 4287 | 4287 | 152 | 639 | 4287 | 4287 | 4400 | |||||||||||||||||||||
| 5 | TampT Competitiveness Index | 2015 | EOSQ095 | 102 | Business impact of rules on FDI 1-7 | Business impact of rules on FDI 1-7 | Indicator | E | 2 | 4580 | 4580 | 141 | 659 | 4580 | 4580 | 5500 | |||||||||||||||||||||
| 6 | TampT Competitiveness Index | 2015 | EOSQ040 | 103 | Efficiency of legal framework in settling disputes 1-7 | Efficiency of legal framework in settling disputes 1-7 | Indicators | E | 2 | 4139 | 4139 | 155 | 616 | 4139 | 4139 | 4139 | |||||||||||||||||||||
| 7 | TampT Competitiveness Index | 2015 | EOSQ039 | 104 | Efficiency of legal framework in challenging regs 1-7 | Efficiency of legal framework in challenging regs 1-7 | Indicators | E | 2 | 3849 | 3849 | 122 | 557 | 3849 | 3849 | 4000 | |||||||||||||||||||||
| 8 | Indicator | 3994 | 3994 | 3994 | 3994 | 4069 | |||||||||||||||||||||||||||||||
| 9 | TampT Competitiveness Index | 2015 | CONSTPERMDAYS | 105 | Time required to deal with construction permits | Time required to deal with construction permits | Indicators | S | 1 | 211000 | 3864 | 2600 | 38000 | 3500 | 6847 | 6847 | Usulan BKPM | ||||||||||||||||||||
| 10 | TampT Competitiveness Index | 2015 | CONSTPERMCOST | 106 | Cost ( construction cost) to deal with construction permits | Cost ( construction cost) to deal with construction permits | Indicators | S | 1 | 4300 | 6085 | 000 | 2820 | 3800 | 6191 | 6191 | |||||||||||||||||||||
| 11 | Indicator | 4975 | 6519 | 6519 | |||||||||||||||||||||||||||||||||
| 12 | TampT Competitiveness Index | 2015 | EOSQ105 | 107 | Extent of market dominance 1-7 | Extent of market dominance 1-7 | Indicator | E | 2 | 4081 | 4081 | 218 | 597 | 4081 | 4081 | 4100 | |||||||||||||||||||||
| 13 | TampT Competitiveness Index | 2015 | STARTBUSDAYS | 108 | No days to start a business | No days to start a business | Indicators | S | 1 | 52500 | 3767 | 050 | 9700 | 5000 | 6720 | 6720 | |||||||||||||||||||||
| 14 | TampT Competitiveness Index | 2015 | STARTBUSCOST | 109 | Cost ( GNI per capita) to start a business | Cost ( GNI per capita) to start a business | Indicators | S | 1 | 21100 | 5655 | 000 | 9410 | 19900 | 5731 | 5731 | |||||||||||||||||||||
| 15 | Indicator | 4711 | 6226 | 6226 | |||||||||||||||||||||||||||||||||
| 16 | TampT Competitiveness Index | 2015 | EOSQ397 | 110 | Effect of taxation on incentives to work 1-7 | Effect of taxation on incentives to work 1-7 | Indicators | E | 2 | 4112 | 4112 | 188 | 631 | 4112 | 4112 | 4112 | |||||||||||||||||||||
| 17 | TampT Competitiveness Index | 2015 | EOSQ398 | 111 | Effect of taxation on incentives to invest 1-7 | Effect of taxation on incentives to invest 1-7 | Indicators | E | 2 | 4237 | 4237 | 198 | 649 | 4237 | 4237 | 4300 | |||||||||||||||||||||
| 18 | Indicator | 4175 | 4175 | 4206 | |||||||||||||||||||||||||||||||||
| 19 | TampT Competitiveness Index | 2015 | CORPTAXRATE | 112 | Total tax rate profits | Total tax rate profits | Indicator | S | 1 | 31400 | 5041 | 740 | 8090 | 29700 | 5180 | 5180 | |||||||||||||||||||||
| 20 | TampT Competitiveness Index | 2015 | LABORTAXRATE | 112a | Labour and contributions tax rate ( profits) | Labour and contributions tax rate ( profits) | Indicators | S | 1 | 11300 | 5734 | 050 | 5170 | 9200 | 5980 | 5980 | |||||||||||||||||||||
| 21 | TampT Competitiveness Index | 2015 | PROFTAXRATE | 112b | Profit tax rate ( profits) | Profit tax rate ( profits) | Indicators | S | 1 | 16700 | 4426 | 130 | 3720 | 17200 | 4343 | 4343 | |||||||||||||||||||||
| 22 | TampT Competitiveness Index | 2015 | OTHTAXRATE | 112c | Rate of other taxes () of profits | Rate of other taxes () of profits | Indicators | S | 1 | 3400 | 6575 | 000 | 4800 | 3300 | 6588 | 6588 | |||||||||||||||||||||
| 23 | TampT Competitiveness Index | 2015 | TTCIA02 | A02 | Safety and security | Safety and security 1-7 (best) | Pillar | 5156 | 5156 | 265 | 670 | 5156 | 5159 | 5229 | |||||||||||||||||||||||
| 24 | TampT Competitiveness Index | 2015 | EOSQ034 | 201 | Business costs of crime and violence 1-7 | Business costs of crime and violence 1-7 | Indicator | E | 2 | 4273 | 4273 | 189 | 653 | 4273 | 4273 | 4273 | |||||||||||||||||||||
| 25 | TampT Competitiveness Index | 2015 | EOSQ055 | 202 | Reliability of police services 1-7 | Reliability of police services 1-7 | Indicator | E | 2 | 4132 | 4132 | 173 | 673 | 4132 | 4132 | 4300 | |||||||||||||||||||||
| 26 | TampT Competitiveness Index | 2015 | EOSQ033 | 203 | Business costs of terrorism 1-7 | Business costs of terrorism 1-7 | Indicator | E | 2 | 4616 | 4616 | 232 | 668 | 4616 | 4616 | 4800 | |||||||||||||||||||||
| 27 | TampT Competitiveness Index | 2015 | TERRORISMINCIDENCE | 204 | Index of terrorism incidence 1-7 | Index of terrorism incidence 1-7 | Indicator | E | 2 | 5847 | 5847 | 100 | 700 | 5847 | 5847 | 5847 | |||||||||||||||||||||
| 28 | TampT Competitiveness Index | 2015 | HOMICIDERT | 205 | Homicide cases100000 population | Homicide cases100000 population | Indicator | S | 1 | 0600 | 6913 | 000 | 4120 | 0500 | 6927 | 6927 | |||||||||||||||||||||
| 29 | TampT Competitiveness Index | 2015 | TTCIA03 | A03 | Health and hygiene | Health and hygiene 1-7 (best) | Pillar | 4245 | 4246 | 197 | 697 | 4245 | 4244 | 4244 | |||||||||||||||||||||||
| 30 | TampT Competitiveness Index | 2015 | PHYSDENS | 301 | Number of physician1000 pop | Number of physician1000 pop | Indicator | S | 2 | 0204 | 1244 | 001 | 483 | 0398 | 1485 | 1485 | |||||||||||||||||||||
| 31 | TampT Competitiveness Index | 2015 | SANITACES | 302 | pop with access to improved sanitation | pop with access to improved sanitation | Indicators | S | 2 | 59000 | 4267 | 1000 | 10000 | 65000 | 4667 | 4667 | |||||||||||||||||||||
| 32 | TampT Competitiveness Index | 2015 | WATERACES | 303 | pop with access to improved drinking water | pop with access to improved drinking water | Indicators | S | 2 | 85000 | 5235 | 4900 | 10000 | 70970 | 3585 | 3585 | |||||||||||||||||||||
| 33 | Indicator | 4751 | 4126 | 4126 | |||||||||||||||||||||||||||||||||
| 34 | TampT Competitiveness Index | 2015 | HOSPBED | 304 | Hospital beds10000 pop | Hospital beds10000 pop | Indicator | S | 2 | 9000 | 1676 | 100 | 7200 | 12070 | 1935 | 1935 | |||||||||||||||||||||
| 35 | TampT Competitiveness Index | 2015 | HIVPREV | 305 | HIV prevalence adult pop | HIV prevalence adult pop | Indicator | S | 1 | 0400 | 6914 | 002 | 2650 | 0360 | 6923 | 6923 | |||||||||||||||||||||
| 36 | TampT Competitiveness Index | 2015 | MALARIAPC | 306 | Malaria cases100000 pop | Malaria cases100000 pop | Indicator | S | 1 | 2268454 | 6646 | 000 | 3842368 | 1599247 | 6750 | 6750 | |||||||||||||||||||||
| 37 | TampT Competitiveness Index | 2015 | TTCIA04 | A04 | Human resources and labour market | Human resources and labour market 1-7 (best) | Pillar | 4697 | 4693 | 230 | 564 | 4697 | 4712 | 4734 | |||||||||||||||||||||||
| 38 | TampT Competitiveness Index | 2015 | TTCIA0401 | A0401 | Qualification of the labour force 1-7 (best) | Qualification of the labour force 1-7 (best) | Sub-pillar | 5385 | 5383 | 191 | 641 | 5385 | 5396 | 5396 | |||||||||||||||||||||||
| 39 | TampT Competitiveness Index | 2015 | ENROL1NET | 401 | Primary education enrollment net | Primary education enrollment net | Indicator | S | 2 | 92218 | 5776 | 6186 | 10000 | 93380 | 5959 | 5959 | |||||||||||||||||||||
| 40 | TampT Competitiveness Index | 2015 | ENROL2GR | 402 | Secondary education enrollment gross | Secondary education enrollment gross | Indicator | S | 2 | 82539 | 6069 | 2279 | 9351 | 81010 | 5939 | 5939 | |||||||||||||||||||||
| 41 | TampT Competitiveness Index | 2015 | EOSQ139 | 403 | Extent of staff training 1-7 | Extent of staff training 1-7 | Indicator | E | 2 | 4664 | 4664 | 260 | 569 | 4664 | 4664 | 4664 | |||||||||||||||||||||
| 42 | TampT Competitiveness Index | 2015 | EOSQ122 | 404 | Treatment of customers 1-7 | Treatment of customers 1-7 | Indicator | E | 2 | 5022 | 5022 | 239 | 626 | 5022 | 5022 | 5022 | |||||||||||||||||||||
| 43 | TampT Competitiveness Index | 2015 | TTCIA0402 | A0402 | Labour market 1-7 (best) | Labour market 1-7 (best) | Sub-pillar | 4009 | 4002 | 254 | 514 | 4009 | 4028 | 4073 | |||||||||||||||||||||||
| 44 | TampT Competitiveness Index | 2015 | EOSQ134 | 405 | Hiring and firing practices 1-7 | Hiring and firing practices 1-7 | Indicator | E | 2 | 4290 | 4290 | 141 | 573 | 4290 | 4290 | 4290 | |||||||||||||||||||||
| 45 | TampT Competitiveness Index | 2015 | EOSQ403 | 406 | Ease of finding skilled employees 1-7 (best) | Ease of finding skilled employees 1-7 (best) | Indicator | E | 2 | 4298 | 4298 | 197 | 561 | 4298 | 4298 | 4400 | |||||||||||||||||||||
| 46 | TampT Competitiveness Index | 2015 | EOSQ138 | 407 | Ease of hiring foreign labour 1-7 | Ease of hiring foreign labour 1-7 | Indicator | E | 2 | 4377 | 4377 | 236 | 557 | 4377 | 4377 | 4500 | |||||||||||||||||||||
| 47 | TampT Competitiveness Index | 2015 | EOSQ137 | 408 | Pay and productivity 1-7 | Pay and productivity 1-7 | Indicator | E | 2 | 4489 | 4489 | 234 | 552 | 4489 | 4489 | 4489 | |||||||||||||||||||||
| 48 | TampT Competitiveness Index | 2015 | FEMLABOR | 409 | Women in labor force ratio to men | Women in labor force ratio to men | Indicator | S | 2 | 0618 | 2558 | 047 | 104 | 0630 | 2684 | 2684 | |||||||||||||||||||||
| 49 | TampT Competitiveness Index | 2015 | TTCIA05 | A05 | ICT readiness | ICT readiness 1-7 (best) | Pillar | 3726 | 3725 | 131 | 637 | 3726 | 3889 | 3899 | |||||||||||||||||||||||
| 50 | TampT Competitiveness Index | 2015 | EOSQ365 | 501 | ICT use for business-to-business transactions 1-7 | ICT use for business-to-business transactions 1-7 | Indicators | E | 2 | 5083 | 5083 | 273 | 636 | 5083 | 5083 | 5083 | |||||||||||||||||||||
| 51 | TampT Competitiveness Index | 2015 | EOSQ366 | 502 | Internet use for business-to-consumer transactions 1-7 | Internet use for business-to-consumer transactions 1-7 | Indicators | E | 2 | 5371 | 5371 | 220 | 630 | 5371 | 5371 | 5500 | |||||||||||||||||||||
| 52 | Indicator | 5227 | 5227 | 5291 | |||||||||||||||||||||||||||||||||
| 53 | TampT Competitiveness Index | 2015 | NETUSERPCT | 503 | Individuals using Internet | Individuals using Internet | Indicator | S | 2 | 15820 | 1920 | 120 | 9655 | 32760 | 2986 | 2986 | |||||||||||||||||||||
| 54 | TampT Competitiveness Index | 2015 | BBSUBPC | 504 | Fixed broadband Internet subscriptions100 pop | Fixed broadband Internet subscriptions100 pop | Indicator | S | 2 | 1301 | 1184 | 000 | 4252 | 1300 | 1183 | 1183 | |||||||||||||||||||||
| 55 | TampT Competitiveness Index | 2015 | MOBSUBPC | 505 | Mobile phone subscriptions100 pop | Mobile phone subscriptions100 pop | Indicator | S | 2 | 125358 | 4132 | 1283 | 22840 | 125936 | 4148 | 4148 | |||||||||||||||||||||
| 56 | TampT Competitiveness Index | 2015 | MOBBBSUBPC | 506 | Active mobile broadband Internet subscriptions100 population | Active mobile broadband Internet subscriptions100 population | Indicator | S | 2 | 24225 | 2271 | 104 | 11051 | 25500 | 2341 | 2341 | |||||||||||||||||||||
| 57 | TampT Competitiveness Index | 2015 | MOBILENETWORKCOVERAGE | 507 | Mobile network coverage rate of pop | Mobile network coverage rate of pop | Indicator | S | 2 | 100000 | 7000 | 000 | 10000 | 100000 | 7000 | 7000 | |||||||||||||||||||||
| 58 | TampT Competitiveness Index | 2015 | EOSQ064 | 508 | Quality of electricity supply 1-7 | Quality of electricity supply 1-7 | Indicator | E | 2 | 4340 | 4340 | 129 | 678 | 4340 | 4340 | 4340 | |||||||||||||||||||||
| 59 | TampT Competitiveness Index | 2015 | TTCIB | B | TampT policy and enabling conditions subindex 1-7 (best) | TampT policy and enabling conditions subindex 1-7 (best) | Sub-index | 45948 | 45950 | 319 | 483 | 45948 | 45688 | 4642 | |||||||||||||||||||||||
| 60 | TampT Competitiveness Index | 2015 | TTCIB06 | B06 | Prioritization of Travel amp Tourism | Prioritization of Travel amp Tourism 1-7 (best) | Pillar | 5608 | 5607 | 245 | 603 | 5608 | 5607 | 5899 | |||||||||||||||||||||||
| 61 | TampT Competitiveness Index | 2015 | EOSQ157 | 601 | Government prioritization of travel and tourism industry 1-7 | Government prioritization of travel and tourism industry 1-7 | Indicator | E | 2 | 5138 | 5138 | 232 | 671 | 5138 | 5138 | 5500 | |||||||||||||||||||||
| 62 | TampT Competitiveness Index | 2015 | TTGOVEXP | 602 | TampT government expenditure | TampT government expenditure | Indicator | S | 2 | 9182 | 6639 | 000 | 977 | 9182 | 6639 | 6639 | |||||||||||||||||||||
| 63 | TampT Competitiveness Index | 2015 | EOSQ158 | 603 | Effectiveness of marketing and branding to attract tourists 1-7 | Effectiveness of marketing and branding to attract tourists 1-7 | Indicator | E | 2 | 4906 | 4906 | 183 | 660 | 4906 | 4906 | 6000 | |||||||||||||||||||||
| 64 | TampT Competitiveness Index | 2015 | COMPTTDATA | 604 | Comprehensiveness of annual TampT data | Comprehensiveness of annual TampT data | Indicators | S | 2 | 92000 | 6633 | 000 | 9800 | 92000 | 6633 | 6633 | |||||||||||||||||||||
| 65 | TampT Competitiveness Index | 2015 | TMTTDATA | 605 | Timeliness of providing monthlyquarterly TampT data | Timeliness of providing monthlyquarterly TampT data | Indicators | S | 2 | 19000 | 7000 | 000 | 1900 | 19000 | 7000 | 7000 | |||||||||||||||||||||
| 66 | Indicator | 6816 | 6816 | 6816 | |||||||||||||||||||||||||||||||||
| 67 | TampT Competitiveness Index | 2015 | CNTRYBRANDIDX | 606 | Country brand strategy rating | Country brand strategy rating | Indicator | S | 2 | 74800 | 4537 | 3860 | 10000 | 74800 | 4537 | 4537 | |||||||||||||||||||||
| 68 | TampT Competitiveness Index | 2015 | TTCIB07 | B07 | International Openness | International Openness 1-7 (best) | Pillar | 3551 | 3559 | 129 | 525 | 3551 | 3559 | 3559 | |||||||||||||||||||||||
| 69 | TampT Competitiveness Index | 2015 | VISAREQ | 701 | Visa requirements | Visa requirements | Indicator | S | 2 | 53000 | 4184 | 100 | 9900 | 53000 | 4184 | 4184 | |||||||||||||||||||||
| 70 | TampT Competitiveness Index | 2015 | OPENBILAIR | 702 | Openness of bilateral Air Service Agreements | Openness of bilateral Air Service Agreements | Indicator | S | 2 | 14327 | 4028 | 063 | 2777 | 14327 | 4028 | 4028 | |||||||||||||||||||||
| 71 | TampT Competitiveness Index | 2015 | FTAWTO | 703 | Number of regional trade agreements in force | Number of regional trade agreements in force | Indicator | S | 2 | 12000 | 2467 | 100 | 4600 | 12000 | 2467 | 2467 | |||||||||||||||||||||
| 72 | TampT Competitiveness Index | 2015 | TTCIB08 | B08 | Price competitiveness | Price competitiveness 1-7 (best) | Pillar | 6109 | 6102 | 257 | 662 | 6109 | 5988 | 5988 | |||||||||||||||||||||||
| 73 | TampT Competitiveness Index | 2015 | TAXAIRCHARGE | 801 | Ticket taxes and airport charges | Ticket taxes and airport charges | Indicator | S | 2 | 92667 | 6250 | 4136 | 10000 | 92667 | 6250 | 6250 | |||||||||||||||||||||
| 74 | TampT Competitiveness Index | 2015 | HOTELCPI | 802 | Hotel price index | Hotel price index | Indicator | S | 1 | 93899 | 5926 | 7049 | 20127 | 93899 | 5926 | 5926 | |||||||||||||||||||||
| 75 | TampT Competitiveness Index | 2015 | PPP | 803 | Purchasing power parity | Purchasing power parity | Indicator | S | 1 | 0364 | 6589 | 028 | 155 | 0364 | 6589 | 6589 | |||||||||||||||||||||
| 76 | TampT Competitiveness Index | 2015 | FUELPRICE | 804 | Fuel price levels | Fuel price levels | Indicator | S | 1 | 47000 | 5643 | 230 | 20000 | 62000 | 5188 | 5188 | |||||||||||||||||||||
| 77 | TampT Competitiveness Index | 2015 | TTCIB09 | B09 | Environmental sustainability | Environmental sustainability 1-7 (best) | Pillar | 3111 | 3111 | 282 | 563 | 3111 | 3120 | 3122 | |||||||||||||||||||||||
| 78 | TampT Competitiveness Index | 2015 | EOSQ160 | 901 | Stringency of environmental regulations 1-7 | Stringency of environmental regulations 1-7 | Indicators | E | 2 | 3987 | 3987 | 183 | 634 | 3987 | 3987 | 3987 | |||||||||||||||||||||
| 79 | TampT Competitiveness Index | 2015 | EOSQ161 | 902 | Enforcement of environmental regulations 1-7 | Enforcement of environmental regulations 1-7 | Indicators | E | 2 | 3871 | 3871 | 172 | 626 | 3871 | 3871 | 3900 | |||||||||||||||||||||
| 80 | Indicator | 3929 | 3929 | 3943 | |||||||||||||||||||||||||||||||||
| 81 | TampT Competitiveness Index | 2015 | EOSQ159 | 903 | Sustainability of travel and tourism industry development 1-7 | Sustainability of travel and tourism industry development 1-7 | Indicator | E | 2 | 4649 | 4649 | 199 | 649 | 4649 | 4649 | 4649 | |||||||||||||||||||||
| 82 | TampT Competitiveness Index | 2015 | PM25 | 904 | Particulate matter (25) concentration | Particulate matter (25) concentration | Indicator | S | 1 | 9210 | 1071 | 000 | 932 | 9210 | 1071 | 1071 | |||||||||||||||||||||
| 83 | TampT Competitiveness Index | 2015 | ENVTREATY | 905 | Environmental treaty ratification | Environmental treaty ratification | Indicator | S | 2 | 20000 | 5000 | 1000 | 2500 | 20000 | 5000 | 5000 | |||||||||||||||||||||
| 84 | TampT Competitiveness Index | 2015 | WATERSTRS | 906 | Baseline water stress | Baseline water stress | Indicator | S | 1 | 3265 | 3082 | 000 | 500 | 3265 | 3082 | 3082 | |||||||||||||||||||||
| 85 | TampT Competitiveness Index | 2015 | THRSPECIES | 907 | Threatened species | Threatened species | Indicator | S | 1 | 13083 | 1000 | 040 | 1308 | 19330 | 1000 | 1000 | |||||||||||||||||||||
| 86 | TampT Competitiveness Index | 2015 | FORCH | 908 | Forest cover change | Forest cover change | Indicator | S | 2 | -5500 | 1482 | -790 | 2200 | -5500 | 1482 | 1482 | |||||||||||||||||||||
| 87 | TampT Competitiveness Index | 2015 | WASTERWATER | 909 | Wastewater treatment | Wastewater treatment | Indicator | S | 2 | 0018 | 1001 | 000 | 9965 | 0020 | 1001 | 1001 | |||||||||||||||||||||
| 88 | TampT Competitiveness Index | 2015 | TCEEZ | 910 | Costal shelf fishing pressure | Costal shelf fishing pressure | Indicator | S | 1 | 0241 | 6788 | 000 | 682 | 0150 | 6868 | 6868 | |||||||||||||||||||||
| 89 | TampT Competitiveness Index | 2015 | TTCIC | C | Infrastructure subindex 1-7 (best) | Infrastructure subindex 1-7 (best) | Sub-index | 33837 | 33861 | 186 | 579 | 33837 | 38329 | 3846 | |||||||||||||||||||||||
| 90 | TampT Competitiveness Index | 2015 | TTCIC10 | C10 | Air transport infrastructure | Air transport infrastructure 1-7 (best) | Pillar | 3806 | 3807 | 142 | 675 | 3806 | 4346 | 4346 | |||||||||||||||||||||||
| 91 | TampT Competitiveness Index | 2015 | EOSQ061 | 1001 | Quality of air transport infrastructure 1-7 | Quality of air transport infrastructure 1-7 | Indicator | E | 2 | 4519 | 4519 | 211 | 676 | 4519 | 4519 | 4519 | |||||||||||||||||||||
| 92 | TampT Competitiveness Index | 2015 | DAIRSEATKM | 1002 | Available seat kilometres domestic | Available seat kilometres domestic | Indicators | S | 2 | 1677952 | 5411 | 005 | 228238 | 1677952 | 5411 | 5411 | |||||||||||||||||||||
| 93 | TampT Competitiveness Index | 2015 | FAIRSEATKM | 1003 | Available seat kilometres international | Available seat kilometres international | Indicators | S | 2 | 980709 | 2213 | 001 | 484949 | 980709 | 2213 | 2213 | |||||||||||||||||||||
| 94 | 1002-1003 | Indicator | 2658661 | 5674 | 001 | 341276 | 2658661 | 5674 | 5674 | ||||||||||||||||||||||||||||
| 95 | TampT Competitiveness Index | 2015 | DEPPOP | 1004 | Aircraft Departures | Aircraft Departures | Indicator | S | 2 | 2658 | 1810 | 002 | 1958 | 3427 | 2046 | 2046 | |||||||||||||||||||||
| 96 | TampT Competitiveness Index | 2015 | AIRPTDENS | 1005 | Airport density airportsmillion pop | Airport density airportsmillion pop | Indicator | S | 2 | 0735 | 1784 | 009 | 501 | 2860 | 4379 | 4379 | |||||||||||||||||||||
| 97 | TampT Competitiveness Index | 2015 | AIRLINES | 1006 | Number of operating airlines | Number of operating airlines | Indicator | S | 2 | 64000 | 5247 | 100 | 9000 | 62000 | 5112 | 5112 | |||||||||||||||||||||
| 98 | TampT Competitiveness Index | 2015 | TTCIC11 | C11 | Ground and port infrastructure | Ground and port infrastructure 1-7 (best) | Pillar | 3273 | 3273 | 196 | 645 | 3273 | 3275 | 3314 | |||||||||||||||||||||||
| 99 | TampT Competitiveness Index | 2015 | EOSQ057 | 1101 | Quality of roads 1-7 | Quality of roads 1-7 | Indicator | E | 2 | 3926 | 3926 | 194 | 661 | 3926 | 3926 | 4000 | |||||||||||||||||||||
| 100 | TampT Competitiveness Index | 2015 | EOSQ058 | 1102 | Quality of railroad infrastructure 1-7 | Quality of railroad infrastructure 1-7 | Indicator | E | 2 | 3687 | 3687 | 113 | 670 | 3687 | 3687 | 3700 | |||||||||||||||||||||
| 101 | TampT Competitiveness Index | 2015 | EOSQ353 | 1103 | Quality of port infrastructure 1-7 | Quality of port infrastructure 1-7 | Indicator | E | 2 | 3975 | 3975 | 128 | 681 | 3975 | 3975 | 3975 | |||||||||||||||||||||
| 102 | TampT Competitiveness Index | 2015 | EOSQ063 | 1104 | Quality of domestic transport network 1-7 | Quality of domestic transport network 1-7 | Indicator | E | 2 | 4350 | 4350 | 213 | 648 | 4350 | 4350 | 4500 | |||||||||||||||||||||
| 103 | TampT Competitiveness Index | 2015 | RAILDENS | 1105 | Railroad density | Railroad density | Indicator | S | 2 | 0245 | 1111 | 002 | 1201 | 0270 | 1123 | 1123 | |||||||||||||||||||||
| 104 | Road and Paved Road | Indicator | 2587 | 2587 | 2587 | 2587 | 2587 | ||||||||||||||||||||||||||||||
| 105 | |||||||||||||||||||||||||||||||||||||
| 106 | TampT Competitiveness Index | 2015 | TTCIC12 | C12 | Tourist service infrastructure | Tourist service infrastructure 1-7 (best) | Pillar | 3072 | 3079 | 190 | 683 | 3072 | 3878 | 3878 | |||||||||||||||||||||||
| 107 | TampT Competitiveness Index | 2015 | HOTELROOM | 1201 | Hotel rooms | Hotel rooms | Indicator | S | 2 | 0172 | 1401 | 001 | 250 | 0172 | 1401 | 1401 | |||||||||||||||||||||
| 108 | TampT Competitiveness Index | 2015 | EOSQ155 | 1202 | Extension of business trips recommended 1-7 | Extension of business trips recommended 1-7 | Indicator | E | 2 | 5337 | 5337 | 198 | 652 | 5337 | 5337 | 5337 | |||||||||||||||||||||
| 109 | TampT Competitiveness Index | 2015 | CARRENTAL | 1203 | Presence of major car rental companies 1-7 (best) | Presence of major car rental companies 1-7 (best) | Indicator | S | 2 | 2000 | 2000 | 000 | 700 | 4000 | 4429 | 4429 | |||||||||||||||||||||
| 110 | TampT Competitiveness Index | 2015 | ATMVISA | 1204 | ATMs accepting Visa cards | ATMs accepting Visa cards | Indicator | S | 2 | 301019 | 3576 | 690 | 69183 | 388650 | 4344 | 4344 | |||||||||||||||||||||
| 111 | TampT Competitiveness Index | 2015 | TTCID | D | Natural and cultural resources subindex 1-7 (best) | Natural and cultural resources subindex 1-7 (best) | Sub-index | 37390 | 37385 | 130 | 574 | 37390 | 38851 | 3885 | |||||||||||||||||||||||
| 112 | TampT Competitiveness Index | 2015 | TTCID13 | D13 | Natural resources | Natural resources 1-7 (best) | Pillar | 4362 | 4362 | 146 | 601 | 4362 | 4246 | 4246 | |||||||||||||||||||||||
| 113 | TampT Competitiveness Index | 2015 | NATHERITGSITE | 1301 | Number of World Heritage natural sites | Number of World Heritage natural sites | Indicator | S | 2 | 4000 | 4429 | 000 | 700 | 4000 | 4429 | 4429 | |||||||||||||||||||||
| 114 | TampT Competitiveness Index | 2015 | KNOWSPECIES | 1302 | Total known species | Total known species | Indicator | S | 2 | 2660000 | 7000 | 9600 | 266000 | 2660000 | 7000 | 7000 | |||||||||||||||||||||
| 115 | TampT Competitiveness Index | 2015 | SUMPROTAREA | 1303 | Total protected areas | Total protected areas | Indicator | S | 2 | 9050 | 2721 | 003 | 3148 | 6010 | 2141 | 2141 | |||||||||||||||||||||
| 116 | TampT Competitiveness Index | 2015 | NATOURDEM | 1304 | Natural tourism digital demand | Natural tourism digital demand | Indicator | S | 2 | 22927 | 3457 | 011 | 5581 | 22927 | 3457 | 3457 | |||||||||||||||||||||
| 117 | TampT Competitiveness Index | 2015 | EOSQ162 | 1305 | Quality of natural environment 1-7 | Quality of natural environment 1-7 | Indicator | E | 2 | 4205 | 4205 | 214 | 661 | 4205 | 4205 | 4205 | |||||||||||||||||||||
| 118 | TampT Competitiveness Index | 2015 | TTCID14 | D14 | Cultural resources and business travel | Cultural resources and business travel 1-7 (best) | Pillar | 3116 | 3115 | 102 | 669 | 3116 | 3524 | 3524 | |||||||||||||||||||||||
| 119 | TampT Competitiveness Index | 2015 | CULTHERITGSITE | 1401 | Number of World Heritage cultural sites | Number of World Heritage cultural sites | Indicators | S | 2 | 4000 | 1522 | 000 | 4600 | 4000 | 1522 | 1522 | |||||||||||||||||||||
| 120 | TampT Competitiveness Index | 2015 | INTANGHERITAGE | 1402 | Oral and intangible cultural heritage | Oral and intangible cultural heritage | Indicators | S | 2 | 6000 | 2636 | 000 | 2200 | 8000 | 3182 | 3182 | |||||||||||||||||||||
| 121 | 1401-11402 | Indicator | 10000 | 3222 | 000 | 2700 | 12000 | 3667 | 3667 | ||||||||||||||||||||||||||||
| 122 | TampT Competitiveness Index | 2015 | STADIUM | 1403 | Sports stadiums | Sports stadiums | Indicator | S | 2 | 29000 | 4867 | 000 | 4500 | 43000 | 6059 | 6059 | |||||||||||||||||||||
| 123 | TampT Competitiveness Index | 2015 | NRFAIREX | 1404 | Number of international association meetings | Number of international association meetings | Indicator | S | 2 | 90000 | 2620 | 033 | 33233 | 90000 | 2620 | 2620 | |||||||||||||||||||||
| 124 | TampT Competitiveness Index | 2015 | CULTOURDEM | 1405 | Cultural and entertainment tourism digital demand | Cultural and entertainment tourism digital demand | Indicator | S | 2 | 12537 | 1750 | 005 | 10000 | 12537 | 1750 | 1750 |
| 2008 | 2008 | ||
| 2009 | 2009 | ||
| 2011 | 2011 | ||
| 2013 | 2013 | ||
| 2015 | 2015 | ||
| 2017 | 2017 |
Sheet1
Sheet2
Sheet3
Sheet3
Sheet4
Sheet5
Sheet6
Sheet7
Sheet7
18
B Digital Tourism
WHY TOURISM IS GROWING
Growth 2568
GO DIGITAL 3 T
REVOLUTION
Top-20 fastest growing tourism destination
Lifestyle Personal Mobile Interactive
70 search and share are using digital
Digital media effectiveness is 4x more than that of conventional media
TELECOMMUNICATION
TRANSPORTATION
TOURISM
Highest forex earnings
Create Job Opportunity
19
3T REVOLUTION
TELECOMUNICATION + DIGITALCOMMON PLATFORM
SHARING ECONOMY
Google Facebook Whatsapp
TRANSPORTATION + DIGITALCOMMON PLATFORM
SHARING ECONOMY
Uber LCC Gojek
TOURISM + DIGITALCOMMON PLATFORM
SHARING ECONOMY
Tripadvisor Traveloka Travelio
Digital Tourism Revolution is the Natural Revolution
20
CHALLENGES AHEAD
INCUMBENT RESISTANCE
ldquoWhatrsquos in it for merdquo
COST OF DOING NOTHING
21
22
DEVELOPMENT OF DIGITAL WORLD
Social media
January 2017 74 Billion worldrsquos population 37 Billion internet users 27 Billion active social media users 8 Billion mobile users 25 Billion active social mobile users
January 2017 262 Million Indonesiarsquos population
132 Million internet users 106 Million active social media users 371 Million mobile users 92 Million active social mobile users
Source We Are Social Hootsuite 2017
TREND INDUSTRI
23
24
C Investment Opportunity
BREAKING NEWS
25
Ease of Doing Business in Indonesia has improved due to government efforts to simplify regulations
26
Indonesia investment grade is reaffirmed by all major agencies
No Company 2016 Ratings Investment Value 2017 Ratings Investment Value
1 Standard and Poorrsquos BB+ Negative BBB- Positive
2 Moodyrsquos Investor Service Baa3 Positive Baa3 Positive
3 Fitch BBB- Stable BBB- Positive
WONDERFUL INDONESIA IS A WORTH TO INVEST COUNTRY
27
TOURISM INVESTMENT REALIZATION
53of Target in 2017
Source Indonesia Investment Coordinating Board (BKPM) 2017
) year 2017 (January ndash September)
Growth 2013 - 2014 2014 - 2015 2015 ndash 2016
PMA 1066 4311 6286
PMDN 2347 8293 -4948
Total 1364 5317 2896
Tourism Investment Realization Growth
| Score | Rank | ||||||||
| 2008 | 370 | 80 | |||||||
| 2009 | 380 | 81 | |||||||
| 2011 | 400 | 74 | |||||||
| 2013 | 403 | 70 | |||||||
| 2015 | 404 | 50 | |||||||
| 2017 | 416 | 42 | 324 | 37 |
| No | Sub Index Pillar | Indonesia | |||
| Travel and Tourism Competitiveness Index 2015 | 50 | ||||
| I | ENABLING ENVIRONMENT | 80 | |||
| 1 | Business Environment | 63 | |||
| 2 | Safety and Security | 83 | |||
| 3 | Health and Hygiene | 109 | |||
| 4 | Human Resources and Labour Market | 53 | |||
| 5 | ICT Readiness | 85 | |||
| II | TRAVEL AND TOURISM POLICY AND ENABLING CONDITION | 9 | |||
| 6 | Prioritization of Travel and Tourism | 15 | |||
| 7 | International Openness | 55 | |||
| 8 | Price Competitiveness | 3 | |||
| 9 | Environmental Sustainability | 134 | |||
| III | INFRASTRUCTURE | 75 | |||
| 10 | Air Transport Infrsatructure | 39 | |||
| 11 | Ground and Port Infrastructure | 77 | |||
| 12 | Tourist Service Infrastructure | 101 | |||
| IV | NATURAL AND CULTURAL RESOURCES | 17 | |||
| 13 | Natural Resources | 19 | |||
| 14 | Cultural Resources and Business Travel | 25 |
| PILAR | 2015 | +- | |||
| Price Competitiveness | 3 | 6 | |||
| Prioritization of Travel and Tourism | 15 | 4 | |||
| Natural Resources | 19 | -13 | |||
| Cultural Resources and Business Travel | 25 | 13 | |||
| Air Transport Infrastructure | 39 | 15 | |||
| Human Resources and Labour Market | 53 | 8 | |||
| International Openness | 55 | 59 | |||
| Business Environment | 63 | 30 | |||
| Ground Port and Infrastructure | 77 | 10 | |||
| Safety and Security | 83 | 2 | |||
| ICT Readiness | 85 | 2 | |||
| Tourist Service Infrastructure | 101 | 12 | |||
| Health and Hygiene | 109 | 3 | |||
| Environmental Sustainability | 134 | -9 |
| Business environment | Business environment | ||
| Safety and security | Safety and security | ||
| Health and hygiene | Health and hygiene | ||
| Human resources and labour market | Human resources and labour market | ||
| ICT readiness | ICT readiness | ||
| Prioritization of Travel amp Tourism | Prioritization of Travel amp Tourism | ||
| International Openness | International Openness | ||
| Price competitiveness | Price competitiveness | ||
| Environmental sustainability | Environmental sustainability | ||
| Air transport infrastructure | Air transport infrastructure | ||
| Ground and port infrastructure | Ground and port infrastructure | ||
| Tourist service infrastructure | Tourist service infrastructure | ||
| Natural resources | Natural resources | ||
| Cultural resources and business travel | Cultural resources and business travel |
| Business environment | Business environment | ||
| Safety and security | Safety and security | ||
| Health and hygiene | Health and hygiene | ||
| Human resources and labour market | Human resources and labour market | ||
| ICT readiness | ICT readiness | ||
| Prioritization of Travel amp Tourism | Prioritization of Travel amp Tourism | ||
| International Openness | International Openness | ||
| Price competitiveness | Price competitiveness | ||
| Environmental sustainability | Environmental sustainability | ||
| Air transport infrastructure | Air transport infrastructure | ||
| Ground and port infrastructure | Ground and port infrastructure | ||
| Tourist service infrastructure | Tourist service infrastructure | ||
| Natural resources | Natural resources | ||
| Cultural resources and business travel | Cultural resources and business travel |
| TTCI 2015 | SIMULASI 1 - 2017 | SIMULASI 2 - 2017 | |||||||||||||||||||||||||
| The Travel amp Tourism Competitiveness Index | 4045 | 4216 | 0171 | 4250 | 0205 | ||||||||||||||||||||||
| Enabling Environment | 4461 | 4577 | 0116 | 4626 | 0166 | ||||||||||||||||||||||
| Business environment | 4481 | 6000 | 4880 | 4000 | 0399 | 5025 | 4000 | 0544 | RANK | TTCI 2015 | SIMULASI 1 - 2017 | SIMULASI 2 - 2017 | |||||||||||||||
| Safety and security | 5156 | 3000 | 5159 | 3000 | 0003 | 5229 | 3000 | 0073 | 1 | Price competitiveness | Price competitiveness | Price competitiveness | |||||||||||||||
| Health and hygiene | 4245 | 8000 | 4244 | 9000 | -0001 | 4244 | 9000 | -0001 | 2 | Prioritization of Travel amp Tourism | Prioritization of Travel amp Tourism | Prioritization of Travel amp Tourism | |||||||||||||||
| Human resources and labour market | 4697 | 4000 | 4712 | 5000 | 0015 | 4734 | 5000 | 0037 | 3 | Safety and security | Safety and security | Safety and security | |||||||||||||||
| ICT readiness | 3726 | 11000 | 3889 | 10000 | 0163 | 3899 | 10000 | 0173 | 4 | Human resources and labour market | Business environment | Business environment | |||||||||||||||
| TampT Policy and Enabling Conditions | 4595 | 4569 | -0026 | 4642 | 0047 | 5 | Business environment | Human resources and labour market | Human resources and labour market | ||||||||||||||||||
| Prioritization of Travel amp Tourism | 5608 | 2000 | 5607 | 2000 | -0001 | 5899 | 2000 | 0291 | 6 | Natural resources | Air transport infrastructure | Air transport infrastructure | |||||||||||||||
| International Openness | 3551 | 12000 | 3559 | 14000 | 0008 | 3559 | 14000 | 0008 | 7 | Health and hygiene | Natural resources | Natural resources | |||||||||||||||
| Price competitiveness | 6109 | 1000 | 5988 | 1000 | -0121 | 5988 | 1000 | -0121 | 8 | Air transport infrastructure | Health and hygiene | Health and hygiene | |||||||||||||||
| Environmental sustainability | 3111 | 16000 | 3120 | 17000 | 0009 | 3122 | 17000 | 0011 | 9 | ICT readiness | ICT readiness | ICT readiness | |||||||||||||||
| Infrastructure | 3384 | 3833 | 0449 | 3846 | 0462 | 10 | Tourist service infrastructure | Environmental sustainability | Environmental sustainability | ||||||||||||||||||
| Air transport infrastructure | 3806 | 9000 | 4346 | 7000 | 0540 | 4346 | 7000 | 0540 | 11 | Environmental sustainability | Ground and port infrastructure | Ground and port infrastructure | |||||||||||||||
| Ground and port infrastructure | 3273 | 14000 | 3275 | 16000 | 0002 | 3314 | 16000 | 0041 | 12 | Cultural resources and business travel | Cultural resources and business travel | Cultural resources and business travel | |||||||||||||||
| Tourist service infrastructure | 3072 | 17000 | 3878 | 12000 | 0806 | 3878 | 12000 | 0806 | 13 | Ground and port infrastructure | International Openness | International Openness | |||||||||||||||
| Natural and Cultural Resources | 3739 | 3885 | 0146 | 3885 | 0146 | 14 | International Openness | Tourist service infrastructure | Tourist service infrastructure | ||||||||||||||||||
| Natural resources | 4362 | 7000 | 4246 | 8000 | -0116 | 4246 | 8000 | -0116 | |||||||||||||||||||
| Cultural resources and business travel | 3116 | 15000 | 3524 | 15000 | 0408 | 3524 | 15000 | 0408 |
| INDONESIA | |||||||||||||||||||||||||||||||||||||
| TTCI 2015 | SIMULASI 17 | KETERANGAN | |||||||||||||||||||||||||||||||||||
| Placement | Dataset | Edition | GLOBAL ID | Code | Series | Series unindented | Type | Metode | (+-) | value | v-check | min | max | TTCI 2015 | SIMULASI 1 - 2017 | SIMULASI 2 - 2017 | S3 | S4 | |||||||||||||||||||
| 1 | TampT Competitiveness Index | 2015 | TTCI | ttci | all | Enabling environment subindex 1-7 (best) | index | 4045 | 4045 | 243 | 531 | 4045 | 4216 | 4250 | |||||||||||||||||||||||
| 2 | TampT Competitiveness Index | 2015 | TTCIA | A | Enabling environment subindex 1-7 (best) | Enabling environment subindex 1-7 (best) | Sub-index | 44607 | 44600 | 274 | 608 | 44607 | 45769 | 4626 | |||||||||||||||||||||||
| 3 | TampT Competitiveness Index | 2015 | TTCIA01 | A01 | Business environment | Business environment 1-7 (best) | Pillar | 4481 | 4480 | 236 | 613 | 4481 | 4880 | 5025 | |||||||||||||||||||||||
| 4 | TampT Competitiveness Index | 2015 | EOSQ051 | 101 | Property rights 1-7 | Property rights 1-7 | Indicator | E | 2 | 4287 | 4287 | 152 | 639 | 4287 | 4287 | 4400 | |||||||||||||||||||||
| 5 | TampT Competitiveness Index | 2015 | EOSQ095 | 102 | Business impact of rules on FDI 1-7 | Business impact of rules on FDI 1-7 | Indicator | E | 2 | 4580 | 4580 | 141 | 659 | 4580 | 4580 | 5500 | |||||||||||||||||||||
| 6 | TampT Competitiveness Index | 2015 | EOSQ040 | 103 | Efficiency of legal framework in settling disputes 1-7 | Efficiency of legal framework in settling disputes 1-7 | Indicators | E | 2 | 4139 | 4139 | 155 | 616 | 4139 | 4139 | 4139 | |||||||||||||||||||||
| 7 | TampT Competitiveness Index | 2015 | EOSQ039 | 104 | Efficiency of legal framework in challenging regs 1-7 | Efficiency of legal framework in challenging regs 1-7 | Indicators | E | 2 | 3849 | 3849 | 122 | 557 | 3849 | 3849 | 4000 | |||||||||||||||||||||
| 8 | Indicator | 3994 | 3994 | 3994 | 3994 | 4069 | |||||||||||||||||||||||||||||||
| 9 | TampT Competitiveness Index | 2015 | CONSTPERMDAYS | 105 | Time required to deal with construction permits | Time required to deal with construction permits | Indicators | S | 1 | 211000 | 3864 | 2600 | 38000 | 3500 | 6847 | 6847 | Usulan BKPM | ||||||||||||||||||||
| 10 | TampT Competitiveness Index | 2015 | CONSTPERMCOST | 106 | Cost ( construction cost) to deal with construction permits | Cost ( construction cost) to deal with construction permits | Indicators | S | 1 | 4300 | 6085 | 000 | 2820 | 3800 | 6191 | 6191 | |||||||||||||||||||||
| 11 | Indicator | 4975 | 6519 | 6519 | |||||||||||||||||||||||||||||||||
| 12 | TampT Competitiveness Index | 2015 | EOSQ105 | 107 | Extent of market dominance 1-7 | Extent of market dominance 1-7 | Indicator | E | 2 | 4081 | 4081 | 218 | 597 | 4081 | 4081 | 4100 | |||||||||||||||||||||
| 13 | TampT Competitiveness Index | 2015 | STARTBUSDAYS | 108 | No days to start a business | No days to start a business | Indicators | S | 1 | 52500 | 3767 | 050 | 9700 | 5000 | 6720 | 6720 | |||||||||||||||||||||
| 14 | TampT Competitiveness Index | 2015 | STARTBUSCOST | 109 | Cost ( GNI per capita) to start a business | Cost ( GNI per capita) to start a business | Indicators | S | 1 | 21100 | 5655 | 000 | 9410 | 19900 | 5731 | 5731 | |||||||||||||||||||||
| 15 | Indicator | 4711 | 6226 | 6226 | |||||||||||||||||||||||||||||||||
| 16 | TampT Competitiveness Index | 2015 | EOSQ397 | 110 | Effect of taxation on incentives to work 1-7 | Effect of taxation on incentives to work 1-7 | Indicators | E | 2 | 4112 | 4112 | 188 | 631 | 4112 | 4112 | 4112 | |||||||||||||||||||||
| 17 | TampT Competitiveness Index | 2015 | EOSQ398 | 111 | Effect of taxation on incentives to invest 1-7 | Effect of taxation on incentives to invest 1-7 | Indicators | E | 2 | 4237 | 4237 | 198 | 649 | 4237 | 4237 | 4300 | |||||||||||||||||||||
| 18 | Indicator | 4175 | 4175 | 4206 | |||||||||||||||||||||||||||||||||
| 19 | TampT Competitiveness Index | 2015 | CORPTAXRATE | 112 | Total tax rate profits | Total tax rate profits | Indicator | S | 1 | 31400 | 5041 | 740 | 8090 | 29700 | 5180 | 5180 | |||||||||||||||||||||
| 20 | TampT Competitiveness Index | 2015 | LABORTAXRATE | 112a | Labour and contributions tax rate ( profits) | Labour and contributions tax rate ( profits) | Indicators | S | 1 | 11300 | 5734 | 050 | 5170 | 9200 | 5980 | 5980 | |||||||||||||||||||||
| 21 | TampT Competitiveness Index | 2015 | PROFTAXRATE | 112b | Profit tax rate ( profits) | Profit tax rate ( profits) | Indicators | S | 1 | 16700 | 4426 | 130 | 3720 | 17200 | 4343 | 4343 | |||||||||||||||||||||
| 22 | TampT Competitiveness Index | 2015 | OTHTAXRATE | 112c | Rate of other taxes () of profits | Rate of other taxes () of profits | Indicators | S | 1 | 3400 | 6575 | 000 | 4800 | 3300 | 6588 | 6588 | |||||||||||||||||||||
| 23 | TampT Competitiveness Index | 2015 | TTCIA02 | A02 | Safety and security | Safety and security 1-7 (best) | Pillar | 5156 | 5156 | 265 | 670 | 5156 | 5159 | 5229 | |||||||||||||||||||||||
| 24 | TampT Competitiveness Index | 2015 | EOSQ034 | 201 | Business costs of crime and violence 1-7 | Business costs of crime and violence 1-7 | Indicator | E | 2 | 4273 | 4273 | 189 | 653 | 4273 | 4273 | 4273 | |||||||||||||||||||||
| 25 | TampT Competitiveness Index | 2015 | EOSQ055 | 202 | Reliability of police services 1-7 | Reliability of police services 1-7 | Indicator | E | 2 | 4132 | 4132 | 173 | 673 | 4132 | 4132 | 4300 | |||||||||||||||||||||
| 26 | TampT Competitiveness Index | 2015 | EOSQ033 | 203 | Business costs of terrorism 1-7 | Business costs of terrorism 1-7 | Indicator | E | 2 | 4616 | 4616 | 232 | 668 | 4616 | 4616 | 4800 | |||||||||||||||||||||
| 27 | TampT Competitiveness Index | 2015 | TERRORISMINCIDENCE | 204 | Index of terrorism incidence 1-7 | Index of terrorism incidence 1-7 | Indicator | E | 2 | 5847 | 5847 | 100 | 700 | 5847 | 5847 | 5847 | |||||||||||||||||||||
| 28 | TampT Competitiveness Index | 2015 | HOMICIDERT | 205 | Homicide cases100000 population | Homicide cases100000 population | Indicator | S | 1 | 0600 | 6913 | 000 | 4120 | 0500 | 6927 | 6927 | |||||||||||||||||||||
| 29 | TampT Competitiveness Index | 2015 | TTCIA03 | A03 | Health and hygiene | Health and hygiene 1-7 (best) | Pillar | 4245 | 4246 | 197 | 697 | 4245 | 4244 | 4244 | |||||||||||||||||||||||
| 30 | TampT Competitiveness Index | 2015 | PHYSDENS | 301 | Number of physician1000 pop | Number of physician1000 pop | Indicator | S | 2 | 0204 | 1244 | 001 | 483 | 0398 | 1485 | 1485 | |||||||||||||||||||||
| 31 | TampT Competitiveness Index | 2015 | SANITACES | 302 | pop with access to improved sanitation | pop with access to improved sanitation | Indicators | S | 2 | 59000 | 4267 | 1000 | 10000 | 65000 | 4667 | 4667 | |||||||||||||||||||||
| 32 | TampT Competitiveness Index | 2015 | WATERACES | 303 | pop with access to improved drinking water | pop with access to improved drinking water | Indicators | S | 2 | 85000 | 5235 | 4900 | 10000 | 70970 | 3585 | 3585 | |||||||||||||||||||||
| 33 | Indicator | 4751 | 4126 | 4126 | |||||||||||||||||||||||||||||||||
| 34 | TampT Competitiveness Index | 2015 | HOSPBED | 304 | Hospital beds10000 pop | Hospital beds10000 pop | Indicator | S | 2 | 9000 | 1676 | 100 | 7200 | 12070 | 1935 | 1935 | |||||||||||||||||||||
| 35 | TampT Competitiveness Index | 2015 | HIVPREV | 305 | HIV prevalence adult pop | HIV prevalence adult pop | Indicator | S | 1 | 0400 | 6914 | 002 | 2650 | 0360 | 6923 | 6923 | |||||||||||||||||||||
| 36 | TampT Competitiveness Index | 2015 | MALARIAPC | 306 | Malaria cases100000 pop | Malaria cases100000 pop | Indicator | S | 1 | 2268454 | 6646 | 000 | 3842368 | 1599247 | 6750 | 6750 | |||||||||||||||||||||
| 37 | TampT Competitiveness Index | 2015 | TTCIA04 | A04 | Human resources and labour market | Human resources and labour market 1-7 (best) | Pillar | 4697 | 4693 | 230 | 564 | 4697 | 4712 | 4734 | |||||||||||||||||||||||
| 38 | TampT Competitiveness Index | 2015 | TTCIA0401 | A0401 | Qualification of the labour force 1-7 (best) | Qualification of the labour force 1-7 (best) | Sub-pillar | 5385 | 5383 | 191 | 641 | 5385 | 5396 | 5396 | |||||||||||||||||||||||
| 39 | TampT Competitiveness Index | 2015 | ENROL1NET | 401 | Primary education enrollment net | Primary education enrollment net | Indicator | S | 2 | 92218 | 5776 | 6186 | 10000 | 93380 | 5959 | 5959 | |||||||||||||||||||||
| 40 | TampT Competitiveness Index | 2015 | ENROL2GR | 402 | Secondary education enrollment gross | Secondary education enrollment gross | Indicator | S | 2 | 82539 | 6069 | 2279 | 9351 | 81010 | 5939 | 5939 | |||||||||||||||||||||
| 41 | TampT Competitiveness Index | 2015 | EOSQ139 | 403 | Extent of staff training 1-7 | Extent of staff training 1-7 | Indicator | E | 2 | 4664 | 4664 | 260 | 569 | 4664 | 4664 | 4664 | |||||||||||||||||||||
| 42 | TampT Competitiveness Index | 2015 | EOSQ122 | 404 | Treatment of customers 1-7 | Treatment of customers 1-7 | Indicator | E | 2 | 5022 | 5022 | 239 | 626 | 5022 | 5022 | 5022 | |||||||||||||||||||||
| 43 | TampT Competitiveness Index | 2015 | TTCIA0402 | A0402 | Labour market 1-7 (best) | Labour market 1-7 (best) | Sub-pillar | 4009 | 4002 | 254 | 514 | 4009 | 4028 | 4073 | |||||||||||||||||||||||
| 44 | TampT Competitiveness Index | 2015 | EOSQ134 | 405 | Hiring and firing practices 1-7 | Hiring and firing practices 1-7 | Indicator | E | 2 | 4290 | 4290 | 141 | 573 | 4290 | 4290 | 4290 | |||||||||||||||||||||
| 45 | TampT Competitiveness Index | 2015 | EOSQ403 | 406 | Ease of finding skilled employees 1-7 (best) | Ease of finding skilled employees 1-7 (best) | Indicator | E | 2 | 4298 | 4298 | 197 | 561 | 4298 | 4298 | 4400 | |||||||||||||||||||||
| 46 | TampT Competitiveness Index | 2015 | EOSQ138 | 407 | Ease of hiring foreign labour 1-7 | Ease of hiring foreign labour 1-7 | Indicator | E | 2 | 4377 | 4377 | 236 | 557 | 4377 | 4377 | 4500 | |||||||||||||||||||||
| 47 | TampT Competitiveness Index | 2015 | EOSQ137 | 408 | Pay and productivity 1-7 | Pay and productivity 1-7 | Indicator | E | 2 | 4489 | 4489 | 234 | 552 | 4489 | 4489 | 4489 | |||||||||||||||||||||
| 48 | TampT Competitiveness Index | 2015 | FEMLABOR | 409 | Women in labor force ratio to men | Women in labor force ratio to men | Indicator | S | 2 | 0618 | 2558 | 047 | 104 | 0630 | 2684 | 2684 | |||||||||||||||||||||
| 49 | TampT Competitiveness Index | 2015 | TTCIA05 | A05 | ICT readiness | ICT readiness 1-7 (best) | Pillar | 3726 | 3725 | 131 | 637 | 3726 | 3889 | 3899 | |||||||||||||||||||||||
| 50 | TampT Competitiveness Index | 2015 | EOSQ365 | 501 | ICT use for business-to-business transactions 1-7 | ICT use for business-to-business transactions 1-7 | Indicators | E | 2 | 5083 | 5083 | 273 | 636 | 5083 | 5083 | 5083 | |||||||||||||||||||||
| 51 | TampT Competitiveness Index | 2015 | EOSQ366 | 502 | Internet use for business-to-consumer transactions 1-7 | Internet use for business-to-consumer transactions 1-7 | Indicators | E | 2 | 5371 | 5371 | 220 | 630 | 5371 | 5371 | 5500 | |||||||||||||||||||||
| 52 | Indicator | 5227 | 5227 | 5291 | |||||||||||||||||||||||||||||||||
| 53 | TampT Competitiveness Index | 2015 | NETUSERPCT | 503 | Individuals using Internet | Individuals using Internet | Indicator | S | 2 | 15820 | 1920 | 120 | 9655 | 32760 | 2986 | 2986 | |||||||||||||||||||||
| 54 | TampT Competitiveness Index | 2015 | BBSUBPC | 504 | Fixed broadband Internet subscriptions100 pop | Fixed broadband Internet subscriptions100 pop | Indicator | S | 2 | 1301 | 1184 | 000 | 4252 | 1300 | 1183 | 1183 | |||||||||||||||||||||
| 55 | TampT Competitiveness Index | 2015 | MOBSUBPC | 505 | Mobile phone subscriptions100 pop | Mobile phone subscriptions100 pop | Indicator | S | 2 | 125358 | 4132 | 1283 | 22840 | 125936 | 4148 | 4148 | |||||||||||||||||||||
| 56 | TampT Competitiveness Index | 2015 | MOBBBSUBPC | 506 | Active mobile broadband Internet subscriptions100 population | Active mobile broadband Internet subscriptions100 population | Indicator | S | 2 | 24225 | 2271 | 104 | 11051 | 25500 | 2341 | 2341 | |||||||||||||||||||||
| 57 | TampT Competitiveness Index | 2015 | MOBILENETWORKCOVERAGE | 507 | Mobile network coverage rate of pop | Mobile network coverage rate of pop | Indicator | S | 2 | 100000 | 7000 | 000 | 10000 | 100000 | 7000 | 7000 | |||||||||||||||||||||
| 58 | TampT Competitiveness Index | 2015 | EOSQ064 | 508 | Quality of electricity supply 1-7 | Quality of electricity supply 1-7 | Indicator | E | 2 | 4340 | 4340 | 129 | 678 | 4340 | 4340 | 4340 | |||||||||||||||||||||
| 59 | TampT Competitiveness Index | 2015 | TTCIB | B | TampT policy and enabling conditions subindex 1-7 (best) | TampT policy and enabling conditions subindex 1-7 (best) | Sub-index | 45948 | 45950 | 319 | 483 | 45948 | 45688 | 4642 | |||||||||||||||||||||||
| 60 | TampT Competitiveness Index | 2015 | TTCIB06 | B06 | Prioritization of Travel amp Tourism | Prioritization of Travel amp Tourism 1-7 (best) | Pillar | 5608 | 5607 | 245 | 603 | 5608 | 5607 | 5899 | |||||||||||||||||||||||
| 61 | TampT Competitiveness Index | 2015 | EOSQ157 | 601 | Government prioritization of travel and tourism industry 1-7 | Government prioritization of travel and tourism industry 1-7 | Indicator | E | 2 | 5138 | 5138 | 232 | 671 | 5138 | 5138 | 5500 | |||||||||||||||||||||
| 62 | TampT Competitiveness Index | 2015 | TTGOVEXP | 602 | TampT government expenditure | TampT government expenditure | Indicator | S | 2 | 9182 | 6639 | 000 | 977 | 9182 | 6639 | 6639 | |||||||||||||||||||||
| 63 | TampT Competitiveness Index | 2015 | EOSQ158 | 603 | Effectiveness of marketing and branding to attract tourists 1-7 | Effectiveness of marketing and branding to attract tourists 1-7 | Indicator | E | 2 | 4906 | 4906 | 183 | 660 | 4906 | 4906 | 6000 | |||||||||||||||||||||
| 64 | TampT Competitiveness Index | 2015 | COMPTTDATA | 604 | Comprehensiveness of annual TampT data | Comprehensiveness of annual TampT data | Indicators | S | 2 | 92000 | 6633 | 000 | 9800 | 92000 | 6633 | 6633 | |||||||||||||||||||||
| 65 | TampT Competitiveness Index | 2015 | TMTTDATA | 605 | Timeliness of providing monthlyquarterly TampT data | Timeliness of providing monthlyquarterly TampT data | Indicators | S | 2 | 19000 | 7000 | 000 | 1900 | 19000 | 7000 | 7000 | |||||||||||||||||||||
| 66 | Indicator | 6816 | 6816 | 6816 | |||||||||||||||||||||||||||||||||
| 67 | TampT Competitiveness Index | 2015 | CNTRYBRANDIDX | 606 | Country brand strategy rating | Country brand strategy rating | Indicator | S | 2 | 74800 | 4537 | 3860 | 10000 | 74800 | 4537 | 4537 | |||||||||||||||||||||
| 68 | TampT Competitiveness Index | 2015 | TTCIB07 | B07 | International Openness | International Openness 1-7 (best) | Pillar | 3551 | 3559 | 129 | 525 | 3551 | 3559 | 3559 | |||||||||||||||||||||||
| 69 | TampT Competitiveness Index | 2015 | VISAREQ | 701 | Visa requirements | Visa requirements | Indicator | S | 2 | 53000 | 4184 | 100 | 9900 | 53000 | 4184 | 4184 | |||||||||||||||||||||
| 70 | TampT Competitiveness Index | 2015 | OPENBILAIR | 702 | Openness of bilateral Air Service Agreements | Openness of bilateral Air Service Agreements | Indicator | S | 2 | 14327 | 4028 | 063 | 2777 | 14327 | 4028 | 4028 | |||||||||||||||||||||
| 71 | TampT Competitiveness Index | 2015 | FTAWTO | 703 | Number of regional trade agreements in force | Number of regional trade agreements in force | Indicator | S | 2 | 12000 | 2467 | 100 | 4600 | 12000 | 2467 | 2467 | |||||||||||||||||||||
| 72 | TampT Competitiveness Index | 2015 | TTCIB08 | B08 | Price competitiveness | Price competitiveness 1-7 (best) | Pillar | 6109 | 6102 | 257 | 662 | 6109 | 5988 | 5988 | |||||||||||||||||||||||
| 73 | TampT Competitiveness Index | 2015 | TAXAIRCHARGE | 801 | Ticket taxes and airport charges | Ticket taxes and airport charges | Indicator | S | 2 | 92667 | 6250 | 4136 | 10000 | 92667 | 6250 | 6250 | |||||||||||||||||||||
| 74 | TampT Competitiveness Index | 2015 | HOTELCPI | 802 | Hotel price index | Hotel price index | Indicator | S | 1 | 93899 | 5926 | 7049 | 20127 | 93899 | 5926 | 5926 | |||||||||||||||||||||
| 75 | TampT Competitiveness Index | 2015 | PPP | 803 | Purchasing power parity | Purchasing power parity | Indicator | S | 1 | 0364 | 6589 | 028 | 155 | 0364 | 6589 | 6589 | |||||||||||||||||||||
| 76 | TampT Competitiveness Index | 2015 | FUELPRICE | 804 | Fuel price levels | Fuel price levels | Indicator | S | 1 | 47000 | 5643 | 230 | 20000 | 62000 | 5188 | 5188 | |||||||||||||||||||||
| 77 | TampT Competitiveness Index | 2015 | TTCIB09 | B09 | Environmental sustainability | Environmental sustainability 1-7 (best) | Pillar | 3111 | 3111 | 282 | 563 | 3111 | 3120 | 3122 | |||||||||||||||||||||||
| 78 | TampT Competitiveness Index | 2015 | EOSQ160 | 901 | Stringency of environmental regulations 1-7 | Stringency of environmental regulations 1-7 | Indicators | E | 2 | 3987 | 3987 | 183 | 634 | 3987 | 3987 | 3987 | |||||||||||||||||||||
| 79 | TampT Competitiveness Index | 2015 | EOSQ161 | 902 | Enforcement of environmental regulations 1-7 | Enforcement of environmental regulations 1-7 | Indicators | E | 2 | 3871 | 3871 | 172 | 626 | 3871 | 3871 | 3900 | |||||||||||||||||||||
| 80 | Indicator | 3929 | 3929 | 3943 | |||||||||||||||||||||||||||||||||
| 81 | TampT Competitiveness Index | 2015 | EOSQ159 | 903 | Sustainability of travel and tourism industry development 1-7 | Sustainability of travel and tourism industry development 1-7 | Indicator | E | 2 | 4649 | 4649 | 199 | 649 | 4649 | 4649 | 4649 | |||||||||||||||||||||
| 82 | TampT Competitiveness Index | 2015 | PM25 | 904 | Particulate matter (25) concentration | Particulate matter (25) concentration | Indicator | S | 1 | 9210 | 1071 | 000 | 932 | 9210 | 1071 | 1071 | |||||||||||||||||||||
| 83 | TampT Competitiveness Index | 2015 | ENVTREATY | 905 | Environmental treaty ratification | Environmental treaty ratification | Indicator | S | 2 | 20000 | 5000 | 1000 | 2500 | 20000 | 5000 | 5000 | |||||||||||||||||||||
| 84 | TampT Competitiveness Index | 2015 | WATERSTRS | 906 | Baseline water stress | Baseline water stress | Indicator | S | 1 | 3265 | 3082 | 000 | 500 | 3265 | 3082 | 3082 | |||||||||||||||||||||
| 85 | TampT Competitiveness Index | 2015 | THRSPECIES | 907 | Threatened species | Threatened species | Indicator | S | 1 | 13083 | 1000 | 040 | 1308 | 19330 | 1000 | 1000 | |||||||||||||||||||||
| 86 | TampT Competitiveness Index | 2015 | FORCH | 908 | Forest cover change | Forest cover change | Indicator | S | 2 | -5500 | 1482 | -790 | 2200 | -5500 | 1482 | 1482 | |||||||||||||||||||||
| 87 | TampT Competitiveness Index | 2015 | WASTERWATER | 909 | Wastewater treatment | Wastewater treatment | Indicator | S | 2 | 0018 | 1001 | 000 | 9965 | 0020 | 1001 | 1001 | |||||||||||||||||||||
| 88 | TampT Competitiveness Index | 2015 | TCEEZ | 910 | Costal shelf fishing pressure | Costal shelf fishing pressure | Indicator | S | 1 | 0241 | 6788 | 000 | 682 | 0150 | 6868 | 6868 | |||||||||||||||||||||
| 89 | TampT Competitiveness Index | 2015 | TTCIC | C | Infrastructure subindex 1-7 (best) | Infrastructure subindex 1-7 (best) | Sub-index | 33837 | 33861 | 186 | 579 | 33837 | 38329 | 3846 | |||||||||||||||||||||||
| 90 | TampT Competitiveness Index | 2015 | TTCIC10 | C10 | Air transport infrastructure | Air transport infrastructure 1-7 (best) | Pillar | 3806 | 3807 | 142 | 675 | 3806 | 4346 | 4346 | |||||||||||||||||||||||
| 91 | TampT Competitiveness Index | 2015 | EOSQ061 | 1001 | Quality of air transport infrastructure 1-7 | Quality of air transport infrastructure 1-7 | Indicator | E | 2 | 4519 | 4519 | 211 | 676 | 4519 | 4519 | 4519 | |||||||||||||||||||||
| 92 | TampT Competitiveness Index | 2015 | DAIRSEATKM | 1002 | Available seat kilometres domestic | Available seat kilometres domestic | Indicators | S | 2 | 1677952 | 5411 | 005 | 228238 | 1677952 | 5411 | 5411 | |||||||||||||||||||||
| 93 | TampT Competitiveness Index | 2015 | FAIRSEATKM | 1003 | Available seat kilometres international | Available seat kilometres international | Indicators | S | 2 | 980709 | 2213 | 001 | 484949 | 980709 | 2213 | 2213 | |||||||||||||||||||||
| 94 | 1002-1003 | Indicator | 2658661 | 5674 | 001 | 341276 | 2658661 | 5674 | 5674 | ||||||||||||||||||||||||||||
| 95 | TampT Competitiveness Index | 2015 | DEPPOP | 1004 | Aircraft Departures | Aircraft Departures | Indicator | S | 2 | 2658 | 1810 | 002 | 1958 | 3427 | 2046 | 2046 | |||||||||||||||||||||
| 96 | TampT Competitiveness Index | 2015 | AIRPTDENS | 1005 | Airport density airportsmillion pop | Airport density airportsmillion pop | Indicator | S | 2 | 0735 | 1784 | 009 | 501 | 2860 | 4379 | 4379 | |||||||||||||||||||||
| 97 | TampT Competitiveness Index | 2015 | AIRLINES | 1006 | Number of operating airlines | Number of operating airlines | Indicator | S | 2 | 64000 | 5247 | 100 | 9000 | 62000 | 5112 | 5112 | |||||||||||||||||||||
| 98 | TampT Competitiveness Index | 2015 | TTCIC11 | C11 | Ground and port infrastructure | Ground and port infrastructure 1-7 (best) | Pillar | 3273 | 3273 | 196 | 645 | 3273 | 3275 | 3314 | |||||||||||||||||||||||
| 99 | TampT Competitiveness Index | 2015 | EOSQ057 | 1101 | Quality of roads 1-7 | Quality of roads 1-7 | Indicator | E | 2 | 3926 | 3926 | 194 | 661 | 3926 | 3926 | 4000 | |||||||||||||||||||||
| 100 | TampT Competitiveness Index | 2015 | EOSQ058 | 1102 | Quality of railroad infrastructure 1-7 | Quality of railroad infrastructure 1-7 | Indicator | E | 2 | 3687 | 3687 | 113 | 670 | 3687 | 3687 | 3700 | |||||||||||||||||||||
| 101 | TampT Competitiveness Index | 2015 | EOSQ353 | 1103 | Quality of port infrastructure 1-7 | Quality of port infrastructure 1-7 | Indicator | E | 2 | 3975 | 3975 | 128 | 681 | 3975 | 3975 | 3975 | |||||||||||||||||||||
| 102 | TampT Competitiveness Index | 2015 | EOSQ063 | 1104 | Quality of domestic transport network 1-7 | Quality of domestic transport network 1-7 | Indicator | E | 2 | 4350 | 4350 | 213 | 648 | 4350 | 4350 | 4500 | |||||||||||||||||||||
| 103 | TampT Competitiveness Index | 2015 | RAILDENS | 1105 | Railroad density | Railroad density | Indicator | S | 2 | 0245 | 1111 | 002 | 1201 | 0270 | 1123 | 1123 | |||||||||||||||||||||
| 104 | Road and Paved Road | Indicator | 2587 | 2587 | 2587 | 2587 | 2587 | ||||||||||||||||||||||||||||||
| 105 | |||||||||||||||||||||||||||||||||||||
| 106 | TampT Competitiveness Index | 2015 | TTCIC12 | C12 | Tourist service infrastructure | Tourist service infrastructure 1-7 (best) | Pillar | 3072 | 3079 | 190 | 683 | 3072 | 3878 | 3878 | |||||||||||||||||||||||
| 107 | TampT Competitiveness Index | 2015 | HOTELROOM | 1201 | Hotel rooms | Hotel rooms | Indicator | S | 2 | 0172 | 1401 | 001 | 250 | 0172 | 1401 | 1401 | |||||||||||||||||||||
| 108 | TampT Competitiveness Index | 2015 | EOSQ155 | 1202 | Extension of business trips recommended 1-7 | Extension of business trips recommended 1-7 | Indicator | E | 2 | 5337 | 5337 | 198 | 652 | 5337 | 5337 | 5337 | |||||||||||||||||||||
| 109 | TampT Competitiveness Index | 2015 | CARRENTAL | 1203 | Presence of major car rental companies 1-7 (best) | Presence of major car rental companies 1-7 (best) | Indicator | S | 2 | 2000 | 2000 | 000 | 700 | 4000 | 4429 | 4429 | |||||||||||||||||||||
| 110 | TampT Competitiveness Index | 2015 | ATMVISA | 1204 | ATMs accepting Visa cards | ATMs accepting Visa cards | Indicator | S | 2 | 301019 | 3576 | 690 | 69183 | 388650 | 4344 | 4344 | |||||||||||||||||||||
| 111 | TampT Competitiveness Index | 2015 | TTCID | D | Natural and cultural resources subindex 1-7 (best) | Natural and cultural resources subindex 1-7 (best) | Sub-index | 37390 | 37385 | 130 | 574 | 37390 | 38851 | 3885 | |||||||||||||||||||||||
| 112 | TampT Competitiveness Index | 2015 | TTCID13 | D13 | Natural resources | Natural resources 1-7 (best) | Pillar | 4362 | 4362 | 146 | 601 | 4362 | 4246 | 4246 | |||||||||||||||||||||||
| 113 | TampT Competitiveness Index | 2015 | NATHERITGSITE | 1301 | Number of World Heritage natural sites | Number of World Heritage natural sites | Indicator | S | 2 | 4000 | 4429 | 000 | 700 | 4000 | 4429 | 4429 | |||||||||||||||||||||
| 114 | TampT Competitiveness Index | 2015 | KNOWSPECIES | 1302 | Total known species | Total known species | Indicator | S | 2 | 2660000 | 7000 | 9600 | 266000 | 2660000 | 7000 | 7000 | |||||||||||||||||||||
| 115 | TampT Competitiveness Index | 2015 | SUMPROTAREA | 1303 | Total protected areas | Total protected areas | Indicator | S | 2 | 9050 | 2721 | 003 | 3148 | 6010 | 2141 | 2141 | |||||||||||||||||||||
| 116 | TampT Competitiveness Index | 2015 | NATOURDEM | 1304 | Natural tourism digital demand | Natural tourism digital demand | Indicator | S | 2 | 22927 | 3457 | 011 | 5581 | 22927 | 3457 | 3457 | |||||||||||||||||||||
| 117 | TampT Competitiveness Index | 2015 | EOSQ162 | 1305 | Quality of natural environment 1-7 | Quality of natural environment 1-7 | Indicator | E | 2 | 4205 | 4205 | 214 | 661 | 4205 | 4205 | 4205 | |||||||||||||||||||||
| 118 | TampT Competitiveness Index | 2015 | TTCID14 | D14 | Cultural resources and business travel | Cultural resources and business travel 1-7 (best) | Pillar | 3116 | 3115 | 102 | 669 | 3116 | 3524 | 3524 | |||||||||||||||||||||||
| 119 | TampT Competitiveness Index | 2015 | CULTHERITGSITE | 1401 | Number of World Heritage cultural sites | Number of World Heritage cultural sites | Indicators | S | 2 | 4000 | 1522 | 000 | 4600 | 4000 | 1522 | 1522 | |||||||||||||||||||||
| 120 | TampT Competitiveness Index | 2015 | INTANGHERITAGE | 1402 | Oral and intangible cultural heritage | Oral and intangible cultural heritage | Indicators | S | 2 | 6000 | 2636 | 000 | 2200 | 8000 | 3182 | 3182 | |||||||||||||||||||||
| 121 | 1401-11402 | Indicator | 10000 | 3222 | 000 | 2700 | 12000 | 3667 | 3667 | ||||||||||||||||||||||||||||
| 122 | TampT Competitiveness Index | 2015 | STADIUM | 1403 | Sports stadiums | Sports stadiums | Indicator | S | 2 | 29000 | 4867 | 000 | 4500 | 43000 | 6059 | 6059 | |||||||||||||||||||||
| 123 | TampT Competitiveness Index | 2015 | NRFAIREX | 1404 | Number of international association meetings | Number of international association meetings | Indicator | S | 2 | 90000 | 2620 | 033 | 33233 | 90000 | 2620 | 2620 | |||||||||||||||||||||
| 124 | TampT Competitiveness Index | 2015 | CULTOURDEM | 1405 | Cultural and entertainment tourism digital demand | Cultural and entertainment tourism digital demand | Indicator | S | 2 | 12537 | 1750 | 005 | 10000 | 12537 | 1750 | 1750 |
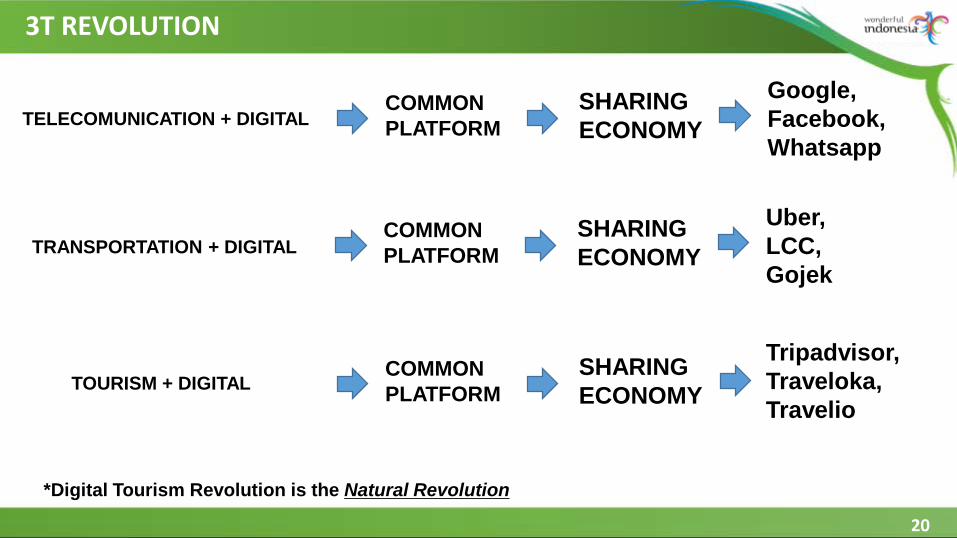
Sheet2
Sheet3
Sheet3
Sheet4
Sheet5
Sheet6
Sheet7
Sheet7
18
B Digital Tourism
WHY TOURISM IS GROWING
Growth 2568
GO DIGITAL 3 T
REVOLUTION
Top-20 fastest growing tourism destination
Lifestyle Personal Mobile Interactive
70 search and share are using digital
Digital media effectiveness is 4x more than that of conventional media
TELECOMMUNICATION
TRANSPORTATION
TOURISM
Highest forex earnings
Create Job Opportunity
19
3T REVOLUTION
TELECOMUNICATION + DIGITALCOMMON PLATFORM
SHARING ECONOMY
Google Facebook Whatsapp
TRANSPORTATION + DIGITALCOMMON PLATFORM
SHARING ECONOMY
Uber LCC Gojek
TOURISM + DIGITALCOMMON PLATFORM
SHARING ECONOMY
Tripadvisor Traveloka Travelio
Digital Tourism Revolution is the Natural Revolution
20
CHALLENGES AHEAD
INCUMBENT RESISTANCE
ldquoWhatrsquos in it for merdquo
COST OF DOING NOTHING
21
22
DEVELOPMENT OF DIGITAL WORLD
Social media
January 2017 74 Billion worldrsquos population 37 Billion internet users 27 Billion active social media users 8 Billion mobile users 25 Billion active social mobile users
January 2017 262 Million Indonesiarsquos population
132 Million internet users 106 Million active social media users 371 Million mobile users 92 Million active social mobile users
Source We Are Social Hootsuite 2017
TREND INDUSTRI
23
24
C Investment Opportunity
BREAKING NEWS
25
Ease of Doing Business in Indonesia has improved due to government efforts to simplify regulations
26
Indonesia investment grade is reaffirmed by all major agencies
No Company 2016 Ratings Investment Value 2017 Ratings Investment Value
1 Standard and Poorrsquos BB+ Negative BBB- Positive
2 Moodyrsquos Investor Service Baa3 Positive Baa3 Positive
3 Fitch BBB- Stable BBB- Positive
WONDERFUL INDONESIA IS A WORTH TO INVEST COUNTRY
27
TOURISM INVESTMENT REALIZATION
53of Target in 2017
Source Indonesia Investment Coordinating Board (BKPM) 2017
) year 2017 (January ndash September)
Growth 2013 - 2014 2014 - 2015 2015 ndash 2016
PMA 1066 4311 6286
PMDN 2347 8293 -4948
Total 1364 5317 2896
Tourism Investment Realization Growth
| Score | Rank | ||||||||
| 2008 | 370 | 80 | |||||||
| 2009 | 380 | 81 | |||||||
| 2011 | 400 | 74 | |||||||
| 2013 | 403 | 70 | |||||||
| 2015 | 404 | 50 | |||||||
| 2017 | 416 | 42 | 324 | 37 |
| No | Sub Index Pillar | Indonesia | |||
| Travel and Tourism Competitiveness Index 2015 | 50 | ||||
| I | ENABLING ENVIRONMENT | 80 | |||
| 1 | Business Environment | 63 | |||
| 2 | Safety and Security | 83 | |||
| 3 | Health and Hygiene | 109 | |||
| 4 | Human Resources and Labour Market | 53 | |||
| 5 | ICT Readiness | 85 | |||
| II | TRAVEL AND TOURISM POLICY AND ENABLING CONDITION | 9 | |||
| 6 | Prioritization of Travel and Tourism | 15 | |||
| 7 | International Openness | 55 | |||
| 8 | Price Competitiveness | 3 | |||
| 9 | Environmental Sustainability | 134 | |||
| III | INFRASTRUCTURE | 75 | |||
| 10 | Air Transport Infrsatructure | 39 | |||
| 11 | Ground and Port Infrastructure | 77 | |||
| 12 | Tourist Service Infrastructure | 101 | |||
| IV | NATURAL AND CULTURAL RESOURCES | 17 | |||
| 13 | Natural Resources | 19 | |||
| 14 | Cultural Resources and Business Travel | 25 |
| PILAR | 2015 | +- | |||
| Price Competitiveness | 3 | 6 | |||
| Prioritization of Travel and Tourism | 15 | 4 | |||
| Natural Resources | 19 | -13 | |||
| Cultural Resources and Business Travel | 25 | 13 | |||
| Air Transport Infrastructure | 39 | 15 | |||
| Human Resources and Labour Market | 53 | 8 | |||
| International Openness | 55 | 59 | |||
| Business Environment | 63 | 30 | |||
| Ground Port and Infrastructure | 77 | 10 | |||
| Safety and Security | 83 | 2 | |||
| ICT Readiness | 85 | 2 | |||
| Tourist Service Infrastructure | 101 | 12 | |||
| Health and Hygiene | 109 | 3 | |||
| Environmental Sustainability | 134 | -9 |
| Business environment | Business environment | ||
| Safety and security | Safety and security | ||
| Health and hygiene | Health and hygiene | ||
| Human resources and labour market | Human resources and labour market | ||
| ICT readiness | ICT readiness | ||
| Prioritization of Travel amp Tourism | Prioritization of Travel amp Tourism | ||
| International Openness | International Openness | ||
| Price competitiveness | Price competitiveness | ||
| Environmental sustainability | Environmental sustainability | ||
| Air transport infrastructure | Air transport infrastructure | ||
| Ground and port infrastructure | Ground and port infrastructure | ||
| Tourist service infrastructure | Tourist service infrastructure | ||
| Natural resources | Natural resources | ||
| Cultural resources and business travel | Cultural resources and business travel |
| Business environment | Business environment | ||
| Safety and security | Safety and security | ||
| Health and hygiene | Health and hygiene | ||
| Human resources and labour market | Human resources and labour market | ||
| ICT readiness | ICT readiness | ||
| Prioritization of Travel amp Tourism | Prioritization of Travel amp Tourism | ||
| International Openness | International Openness | ||
| Price competitiveness | Price competitiveness | ||
| Environmental sustainability | Environmental sustainability | ||
| Air transport infrastructure | Air transport infrastructure | ||
| Ground and port infrastructure | Ground and port infrastructure | ||
| Tourist service infrastructure | Tourist service infrastructure | ||
| Natural resources | Natural resources | ||
| Cultural resources and business travel | Cultural resources and business travel |
| TTCI 2015 | SIMULASI 1 - 2017 | SIMULASI 2 - 2017 | |||||||||||||||||||||||||
| The Travel amp Tourism Competitiveness Index | 4045 | 4216 | 0171 | 4250 | 0205 | ||||||||||||||||||||||
| Enabling Environment | 4461 | 4577 | 0116 | 4626 | 0166 | ||||||||||||||||||||||
| Business environment | 4481 | 6000 | 4880 | 4000 | 0399 | 5025 | 4000 | 0544 | RANK | TTCI 2015 | SIMULASI 1 - 2017 | SIMULASI 2 - 2017 | |||||||||||||||
| Safety and security | 5156 | 3000 | 5159 | 3000 | 0003 | 5229 | 3000 | 0073 | 1 | Price competitiveness | Price competitiveness | Price competitiveness | |||||||||||||||
| Health and hygiene | 4245 | 8000 | 4244 | 9000 | -0001 | 4244 | 9000 | -0001 | 2 | Prioritization of Travel amp Tourism | Prioritization of Travel amp Tourism | Prioritization of Travel amp Tourism | |||||||||||||||
| Human resources and labour market | 4697 | 4000 | 4712 | 5000 | 0015 | 4734 | 5000 | 0037 | 3 | Safety and security | Safety and security | Safety and security | |||||||||||||||
| ICT readiness | 3726 | 11000 | 3889 | 10000 | 0163 | 3899 | 10000 | 0173 | 4 | Human resources and labour market | Business environment | Business environment | |||||||||||||||
| TampT Policy and Enabling Conditions | 4595 | 4569 | -0026 | 4642 | 0047 | 5 | Business environment | Human resources and labour market | Human resources and labour market | ||||||||||||||||||
| Prioritization of Travel amp Tourism | 5608 | 2000 | 5607 | 2000 | -0001 | 5899 | 2000 | 0291 | 6 | Natural resources | Air transport infrastructure | Air transport infrastructure | |||||||||||||||
| International Openness | 3551 | 12000 | 3559 | 14000 | 0008 | 3559 | 14000 | 0008 | 7 | Health and hygiene | Natural resources | Natural resources | |||||||||||||||
| Price competitiveness | 6109 | 1000 | 5988 | 1000 | -0121 | 5988 | 1000 | -0121 | 8 | Air transport infrastructure | Health and hygiene | Health and hygiene | |||||||||||||||
| Environmental sustainability | 3111 | 16000 | 3120 | 17000 | 0009 | 3122 | 17000 | 0011 | 9 | ICT readiness | ICT readiness | ICT readiness | |||||||||||||||
| Infrastructure | 3384 | 3833 | 0449 | 3846 | 0462 | 10 | Tourist service infrastructure | Environmental sustainability | Environmental sustainability | ||||||||||||||||||
| Air transport infrastructure | 3806 | 9000 | 4346 | 7000 | 0540 | 4346 | 7000 | 0540 | 11 | Environmental sustainability | Ground and port infrastructure | Ground and port infrastructure | |||||||||||||||
| Ground and port infrastructure | 3273 | 14000 | 3275 | 16000 | 0002 | 3314 | 16000 | 0041 | 12 | Cultural resources and business travel | Cultural resources and business travel | Cultural resources and business travel | |||||||||||||||
| Tourist service infrastructure | 3072 | 17000 | 3878 | 12000 | 0806 | 3878 | 12000 | 0806 | 13 | Ground and port infrastructure | International Openness | International Openness | |||||||||||||||
| Natural and Cultural Resources | 3739 | 3885 | 0146 | 3885 | 0146 | 14 | International Openness | Tourist service infrastructure | Tourist service infrastructure | ||||||||||||||||||
| Natural resources | 4362 | 7000 | 4246 | 8000 | -0116 | 4246 | 8000 | -0116 | |||||||||||||||||||
| Cultural resources and business travel | 3116 | 15000 | 3524 | 15000 | 0408 | 3524 | 15000 | 0408 |
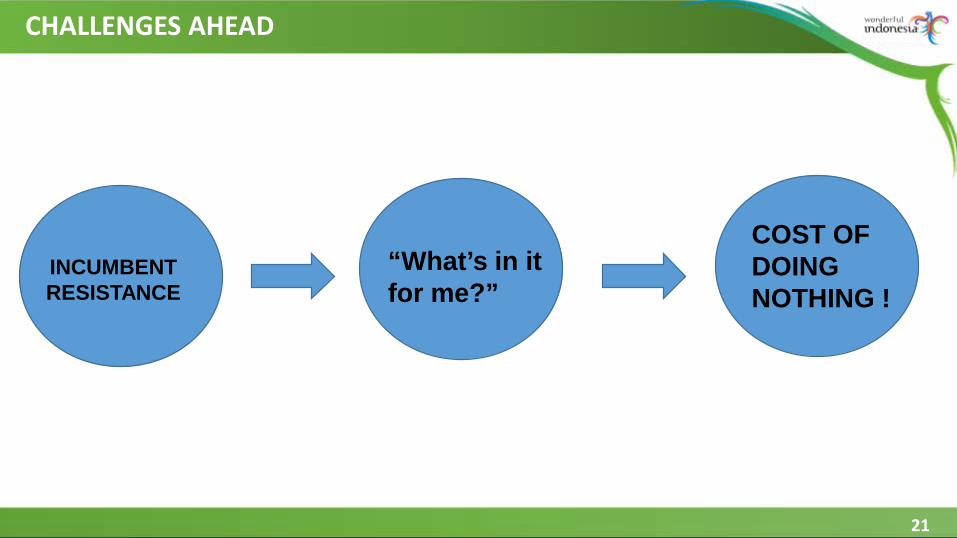
Sheet3
Sheet3
Sheet4
Sheet5
Sheet6
Sheet7
Sheet7
18
B Digital Tourism
WHY TOURISM IS GROWING
Growth 2568
GO DIGITAL 3 T
REVOLUTION
Top-20 fastest growing tourism destination
Lifestyle Personal Mobile Interactive
70 search and share are using digital
Digital media effectiveness is 4x more than that of conventional media
TELECOMMUNICATION
TRANSPORTATION
TOURISM
Highest forex earnings
Create Job Opportunity
19
3T REVOLUTION
TELECOMUNICATION + DIGITALCOMMON PLATFORM
SHARING ECONOMY
Google Facebook Whatsapp
TRANSPORTATION + DIGITALCOMMON PLATFORM
SHARING ECONOMY
Uber LCC Gojek
TOURISM + DIGITALCOMMON PLATFORM
SHARING ECONOMY
Tripadvisor Traveloka Travelio
Digital Tourism Revolution is the Natural Revolution
20
CHALLENGES AHEAD
INCUMBENT RESISTANCE
ldquoWhatrsquos in it for merdquo
COST OF DOING NOTHING
21
22
DEVELOPMENT OF DIGITAL WORLD
Social media
January 2017 74 Billion worldrsquos population 37 Billion internet users 27 Billion active social media users 8 Billion mobile users 25 Billion active social mobile users
January 2017 262 Million Indonesiarsquos population
132 Million internet users 106 Million active social media users 371 Million mobile users 92 Million active social mobile users
Source We Are Social Hootsuite 2017
TREND INDUSTRI
23
24
C Investment Opportunity
BREAKING NEWS
25
Ease of Doing Business in Indonesia has improved due to government efforts to simplify regulations
26
Indonesia investment grade is reaffirmed by all major agencies
No Company 2016 Ratings Investment Value 2017 Ratings Investment Value
1 Standard and Poorrsquos BB+ Negative BBB- Positive
2 Moodyrsquos Investor Service Baa3 Positive Baa3 Positive
3 Fitch BBB- Stable BBB- Positive
WONDERFUL INDONESIA IS A WORTH TO INVEST COUNTRY
27
TOURISM INVESTMENT REALIZATION
53of Target in 2017
Source Indonesia Investment Coordinating Board (BKPM) 2017
) year 2017 (January ndash September)
Growth 2013 - 2014 2014 - 2015 2015 ndash 2016
PMA 1066 4311 6286
PMDN 2347 8293 -4948
Total 1364 5317 2896
Tourism Investment Realization Growth
| Score | Rank | ||||||||
| 2008 | 370 | 80 | |||||||
| 2009 | 380 | 81 | |||||||
| 2011 | 400 | 74 | |||||||
| 2013 | 403 | 70 | |||||||
| 2015 | 404 | 50 | |||||||
| 2017 | 416 | 42 | 324 | 37 |
| No | Sub Index Pillar | Indonesia | |||
| Travel and Tourism Competitiveness Index 2015 | 50 | ||||
| I | ENABLING ENVIRONMENT | 80 | |||
| 1 | Business Environment | 63 | |||
| 2 | Safety and Security | 83 | |||
| 3 | Health and Hygiene | 109 | |||
| 4 | Human Resources and Labour Market | 53 | |||
| 5 | ICT Readiness | 85 | |||
| II | TRAVEL AND TOURISM POLICY AND ENABLING CONDITION | 9 | |||
| 6 | Prioritization of Travel and Tourism | 15 | |||
| 7 | International Openness | 55 | |||
| 8 | Price Competitiveness | 3 | |||
| 9 | Environmental Sustainability | 134 | |||
| III | INFRASTRUCTURE | 75 | |||
| 10 | Air Transport Infrsatructure | 39 | |||
| 11 | Ground and Port Infrastructure | 77 | |||
| 12 | Tourist Service Infrastructure | 101 | |||
| IV | NATURAL AND CULTURAL RESOURCES | 17 | |||
| 13 | Natural Resources | 19 | |||
| 14 | Cultural Resources and Business Travel | 25 |
| PILAR | 2015 | +- | |||
| Price Competitiveness | 3 | 6 | |||
| Prioritization of Travel and Tourism | 15 | 4 | |||
| Natural Resources | 19 | -13 | |||
| Cultural Resources and Business Travel | 25 | 13 | |||
| Air Transport Infrastructure | 39 | 15 | |||
| Human Resources and Labour Market | 53 | 8 | |||
| International Openness | 55 | 59 | |||
| Business Environment | 63 | 30 | |||
| Ground Port and Infrastructure | 77 | 10 | |||
| Safety and Security | 83 | 2 | |||
| ICT Readiness | 85 | 2 | |||
| Tourist Service Infrastructure | 101 | 12 | |||
| Health and Hygiene | 109 | 3 | |||
| Environmental Sustainability | 134 | -9 |
| Business environment | Business environment | ||
| Safety and security | Safety and security | ||
| Health and hygiene | Health and hygiene | ||
| Human resources and labour market | Human resources and labour market | ||
| ICT readiness | ICT readiness | ||
| Prioritization of Travel amp Tourism | Prioritization of Travel amp Tourism | ||
| International Openness | International Openness | ||
| Price competitiveness | Price competitiveness | ||
| Environmental sustainability | Environmental sustainability | ||
| Air transport infrastructure | Air transport infrastructure | ||
| Ground and port infrastructure | Ground and port infrastructure | ||
| Tourist service infrastructure | Tourist service infrastructure | ||
| Natural resources | Natural resources | ||
| Cultural resources and business travel | Cultural resources and business travel |
| Business environment | Business environment | ||
| Safety and security | Safety and security | ||
| Health and hygiene | Health and hygiene | ||
| Human resources and labour market | Human resources and labour market | ||
| ICT readiness | ICT readiness | ||
| Prioritization of Travel amp Tourism | Prioritization of Travel amp Tourism | ||
| International Openness | International Openness | ||
| Price competitiveness | Price competitiveness | ||
| Environmental sustainability | Environmental sustainability | ||
| Air transport infrastructure | Air transport infrastructure | ||
| Ground and port infrastructure | Ground and port infrastructure | ||
| Tourist service infrastructure | Tourist service infrastructure | ||
| Natural resources | Natural resources | ||
| Cultural resources and business travel | Cultural resources and business travel |
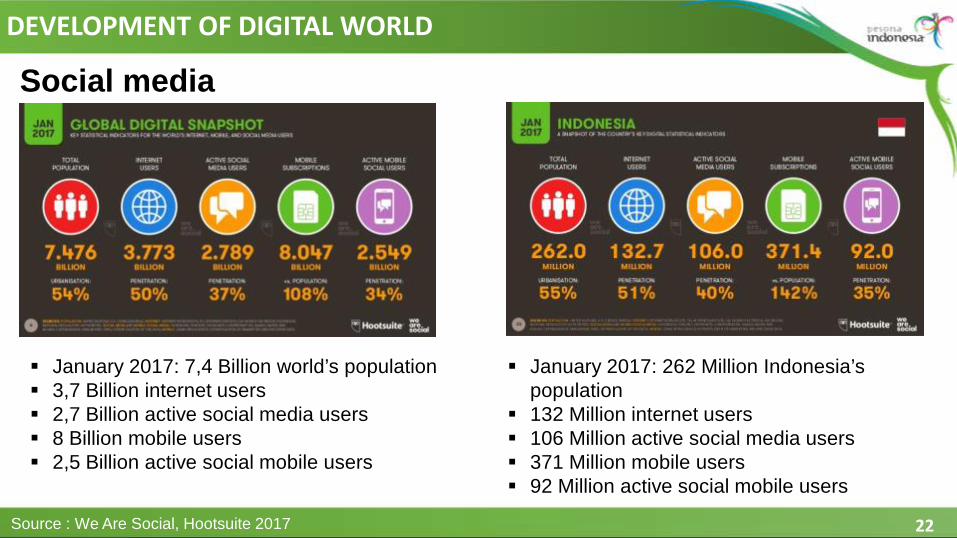
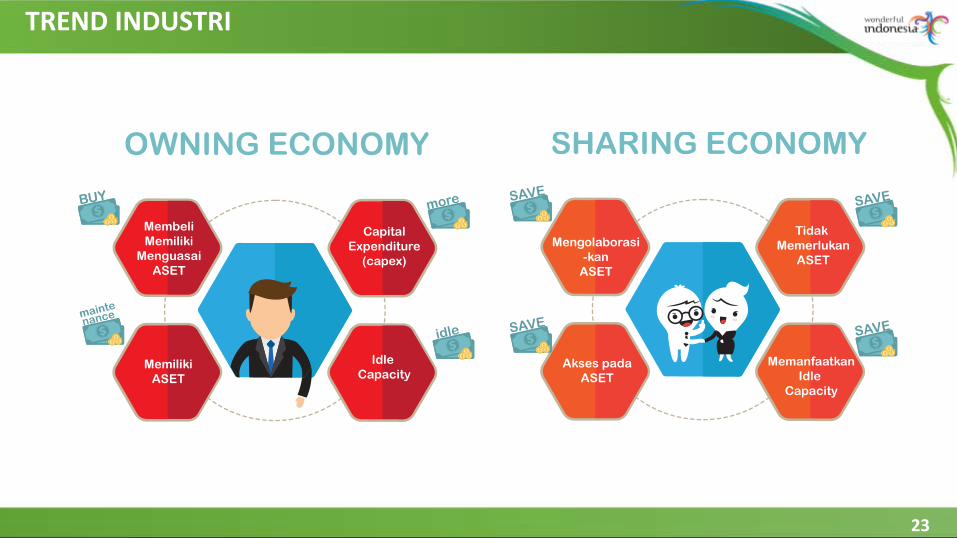
Sheet4
Sheet5
Sheet6
Sheet7
Sheet7
18
B Digital Tourism
WHY TOURISM IS GROWING
Growth 2568
GO DIGITAL 3 T
REVOLUTION
Top-20 fastest growing tourism destination
Lifestyle Personal Mobile Interactive
70 search and share are using digital
Digital media effectiveness is 4x more than that of conventional media
TELECOMMUNICATION
TRANSPORTATION
TOURISM
Highest forex earnings
Create Job Opportunity
19
3T REVOLUTION
TELECOMUNICATION + DIGITALCOMMON PLATFORM
SHARING ECONOMY
Google Facebook Whatsapp
TRANSPORTATION + DIGITALCOMMON PLATFORM
SHARING ECONOMY
Uber LCC Gojek
TOURISM + DIGITALCOMMON PLATFORM
SHARING ECONOMY
Tripadvisor Traveloka Travelio
Digital Tourism Revolution is the Natural Revolution
20
CHALLENGES AHEAD
INCUMBENT RESISTANCE
ldquoWhatrsquos in it for merdquo
COST OF DOING NOTHING
21
22
DEVELOPMENT OF DIGITAL WORLD
Social media
January 2017 74 Billion worldrsquos population 37 Billion internet users 27 Billion active social media users 8 Billion mobile users 25 Billion active social mobile users
January 2017 262 Million Indonesiarsquos population
132 Million internet users 106 Million active social media users 371 Million mobile users 92 Million active social mobile users
Source We Are Social Hootsuite 2017
TREND INDUSTRI
23
24
C Investment Opportunity
BREAKING NEWS
25
Ease of Doing Business in Indonesia has improved due to government efforts to simplify regulations
26
Indonesia investment grade is reaffirmed by all major agencies
No Company 2016 Ratings Investment Value 2017 Ratings Investment Value
1 Standard and Poorrsquos BB+ Negative BBB- Positive
2 Moodyrsquos Investor Service Baa3 Positive Baa3 Positive
3 Fitch BBB- Stable BBB- Positive
WONDERFUL INDONESIA IS A WORTH TO INVEST COUNTRY
27
TOURISM INVESTMENT REALIZATION
53of Target in 2017
Source Indonesia Investment Coordinating Board (BKPM) 2017
) year 2017 (January ndash September)
Growth 2013 - 2014 2014 - 2015 2015 ndash 2016
PMA 1066 4311 6286
PMDN 2347 8293 -4948
Total 1364 5317 2896
Tourism Investment Realization Growth
| Score | Rank | ||||||||
| 2008 | 370 | 80 | |||||||
| 2009 | 380 | 81 | |||||||
| 2011 | 400 | 74 | |||||||
| 2013 | 403 | 70 | |||||||
| 2015 | 404 | 50 | |||||||
| 2017 | 416 | 42 | 324 | 37 |
| No | Sub Index Pillar | Indonesia | |||
| Travel and Tourism Competitiveness Index 2015 | 50 | ||||
| I | ENABLING ENVIRONMENT | 80 | |||
| 1 | Business Environment | 63 | |||
| 2 | Safety and Security | 83 | |||
| 3 | Health and Hygiene | 109 | |||
| 4 | Human Resources and Labour Market | 53 | |||
| 5 | ICT Readiness | 85 | |||
| II | TRAVEL AND TOURISM POLICY AND ENABLING CONDITION | 9 | |||
| 6 | Prioritization of Travel and Tourism | 15 | |||
| 7 | International Openness | 55 | |||
| 8 | Price Competitiveness | 3 | |||
| 9 | Environmental Sustainability | 134 | |||
| III | INFRASTRUCTURE | 75 | |||
| 10 | Air Transport Infrsatructure | 39 | |||
| 11 | Ground and Port Infrastructure | 77 | |||
| 12 | Tourist Service Infrastructure | 101 | |||
| IV | NATURAL AND CULTURAL RESOURCES | 17 | |||
| 13 | Natural Resources | 19 | |||
| 14 | Cultural Resources and Business Travel | 25 |
| PILAR | 2015 | +- | |||
| Price Competitiveness | 3 | 6 | |||
| Prioritization of Travel and Tourism | 15 | 4 | |||
| Natural Resources | 19 | -13 | |||
| Cultural Resources and Business Travel | 25 | 13 | |||
| Air Transport Infrastructure | 39 | 15 | |||
| Human Resources and Labour Market | 53 | 8 | |||
| International Openness | 55 | 59 | |||
| Business Environment | 63 | 30 | |||
| Ground Port and Infrastructure | 77 | 10 | |||
| Safety and Security | 83 | 2 | |||
| ICT Readiness | 85 | 2 | |||
| Tourist Service Infrastructure | 101 | 12 | |||
| Health and Hygiene | 109 | 3 | |||
| Environmental Sustainability | 134 | -9 |
| Business environment | Business environment | ||
| Safety and security | Safety and security | ||
| Health and hygiene | Health and hygiene | ||
| Human resources and labour market | Human resources and labour market | ||
| ICT readiness | ICT readiness | ||
| Prioritization of Travel amp Tourism | Prioritization of Travel amp Tourism | ||
| International Openness | International Openness | ||
| Price competitiveness | Price competitiveness | ||
| Environmental sustainability | Environmental sustainability | ||
| Air transport infrastructure | Air transport infrastructure | ||
| Ground and port infrastructure | Ground and port infrastructure | ||
| Tourist service infrastructure | Tourist service infrastructure | ||
| Natural resources | Natural resources | ||
| Cultural resources and business travel | Cultural resources and business travel |
Sheet5
Sheet6
Sheet7
Sheet7
18
B Digital Tourism
WHY TOURISM IS GROWING
Growth 2568
GO DIGITAL 3 T
REVOLUTION
Top-20 fastest growing tourism destination
Lifestyle Personal Mobile Interactive
70 search and share are using digital
Digital media effectiveness is 4x more than that of conventional media
TELECOMMUNICATION
TRANSPORTATION
TOURISM
Highest forex earnings
Create Job Opportunity
19
3T REVOLUTION
TELECOMUNICATION + DIGITALCOMMON PLATFORM
SHARING ECONOMY
Google Facebook Whatsapp
TRANSPORTATION + DIGITALCOMMON PLATFORM
SHARING ECONOMY
Uber LCC Gojek
TOURISM + DIGITALCOMMON PLATFORM
SHARING ECONOMY
Tripadvisor Traveloka Travelio
Digital Tourism Revolution is the Natural Revolution
20
CHALLENGES AHEAD
INCUMBENT RESISTANCE
ldquoWhatrsquos in it for merdquo
COST OF DOING NOTHING
21
22
DEVELOPMENT OF DIGITAL WORLD
Social media
January 2017 74 Billion worldrsquos population 37 Billion internet users 27 Billion active social media users 8 Billion mobile users 25 Billion active social mobile users
January 2017 262 Million Indonesiarsquos population
132 Million internet users 106 Million active social media users 371 Million mobile users 92 Million active social mobile users
Source We Are Social Hootsuite 2017
TREND INDUSTRI
23
24
C Investment Opportunity
BREAKING NEWS
25
Ease of Doing Business in Indonesia has improved due to government efforts to simplify regulations
26
Indonesia investment grade is reaffirmed by all major agencies
No Company 2016 Ratings Investment Value 2017 Ratings Investment Value
1 Standard and Poorrsquos BB+ Negative BBB- Positive
2 Moodyrsquos Investor Service Baa3 Positive Baa3 Positive
3 Fitch BBB- Stable BBB- Positive
WONDERFUL INDONESIA IS A WORTH TO INVEST COUNTRY
27
TOURISM INVESTMENT REALIZATION
53of Target in 2017
Source Indonesia Investment Coordinating Board (BKPM) 2017
) year 2017 (January ndash September)
Growth 2013 - 2014 2014 - 2015 2015 ndash 2016
PMA 1066 4311 6286
PMDN 2347 8293 -4948
Total 1364 5317 2896
Tourism Investment Realization Growth
| Score | Rank | ||||||||
| 2008 | 370 | 80 | |||||||
| 2009 | 380 | 81 | |||||||
| 2011 | 400 | 74 | |||||||
| 2013 | 403 | 70 | |||||||
| 2015 | 404 | 50 | |||||||
| 2017 | 416 | 42 | 324 | 37 |
| No | Sub Index Pillar | Indonesia | |||
| Travel and Tourism Competitiveness Index 2015 | 50 | ||||
| I | ENABLING ENVIRONMENT | 80 | |||
| 1 | Business Environment | 63 | |||
| 2 | Safety and Security | 83 | |||
| 3 | Health and Hygiene | 109 | |||
| 4 | Human Resources and Labour Market | 53 | |||
| 5 | ICT Readiness | 85 | |||
| II | TRAVEL AND TOURISM POLICY AND ENABLING CONDITION | 9 | |||
| 6 | Prioritization of Travel and Tourism | 15 | |||
| 7 | International Openness | 55 | |||
| 8 | Price Competitiveness | 3 | |||
| 9 | Environmental Sustainability | 134 | |||
| III | INFRASTRUCTURE | 75 | |||
| 10 | Air Transport Infrsatructure | 39 | |||
| 11 | Ground and Port Infrastructure | 77 | |||
| 12 | Tourist Service Infrastructure | 101 | |||
| IV | NATURAL AND CULTURAL RESOURCES | 17 | |||
| 13 | Natural Resources | 19 | |||
| 14 | Cultural Resources and Business Travel | 25 |
| PILAR | 2015 | +- | |||
| Price Competitiveness | 3 | 6 | |||
| Prioritization of Travel and Tourism | 15 | 4 | |||
| Natural Resources | 19 | -13 | |||
| Cultural Resources and Business Travel | 25 | 13 | |||
| Air Transport Infrastructure | 39 | 15 | |||
| Human Resources and Labour Market | 53 | 8 | |||
| International Openness | 55 | 59 | |||
| Business Environment | 63 | 30 | |||
| Ground Port and Infrastructure | 77 | 10 | |||
| Safety and Security | 83 | 2 | |||
| ICT Readiness | 85 | 2 | |||
| Tourist Service Infrastructure | 101 | 12 | |||
| Health and Hygiene | 109 | 3 | |||
| Environmental Sustainability | 134 | -9 |
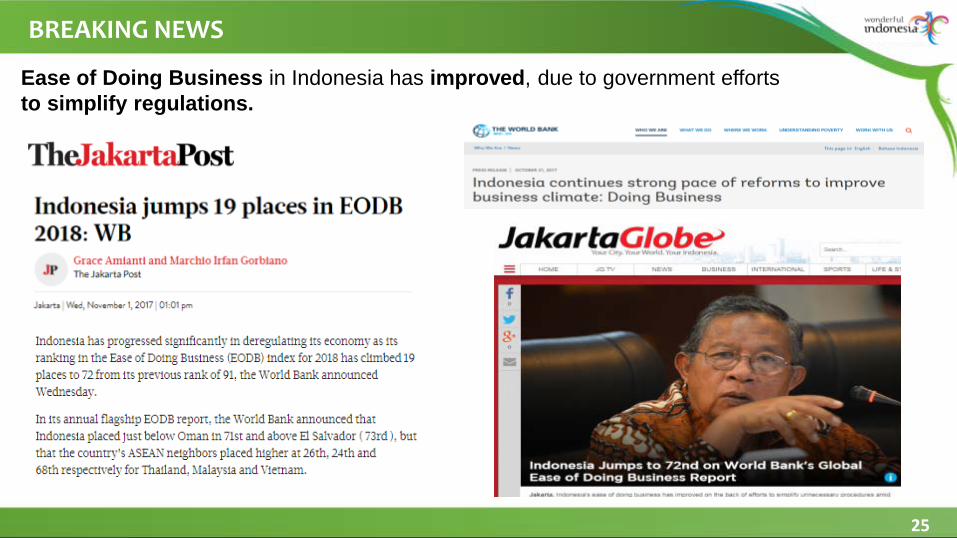
Sheet6
Sheet7
Sheet7
18
B Digital Tourism
WHY TOURISM IS GROWING
Growth 2568
GO DIGITAL 3 T
REVOLUTION
Top-20 fastest growing tourism destination
Lifestyle Personal Mobile Interactive
70 search and share are using digital
Digital media effectiveness is 4x more than that of conventional media
TELECOMMUNICATION
TRANSPORTATION
TOURISM
Highest forex earnings
Create Job Opportunity
19
3T REVOLUTION
TELECOMUNICATION + DIGITALCOMMON PLATFORM
SHARING ECONOMY
Google Facebook Whatsapp
TRANSPORTATION + DIGITALCOMMON PLATFORM
SHARING ECONOMY
Uber LCC Gojek
TOURISM + DIGITALCOMMON PLATFORM
SHARING ECONOMY
Tripadvisor Traveloka Travelio
Digital Tourism Revolution is the Natural Revolution
20
CHALLENGES AHEAD
INCUMBENT RESISTANCE
ldquoWhatrsquos in it for merdquo
COST OF DOING NOTHING
21
22
DEVELOPMENT OF DIGITAL WORLD
Social media
January 2017 74 Billion worldrsquos population 37 Billion internet users 27 Billion active social media users 8 Billion mobile users 25 Billion active social mobile users
January 2017 262 Million Indonesiarsquos population
132 Million internet users 106 Million active social media users 371 Million mobile users 92 Million active social mobile users
Source We Are Social Hootsuite 2017
TREND INDUSTRI
23
24
C Investment Opportunity
BREAKING NEWS
25
Ease of Doing Business in Indonesia has improved due to government efforts to simplify regulations
26
Indonesia investment grade is reaffirmed by all major agencies
No Company 2016 Ratings Investment Value 2017 Ratings Investment Value
1 Standard and Poorrsquos BB+ Negative BBB- Positive
2 Moodyrsquos Investor Service Baa3 Positive Baa3 Positive
3 Fitch BBB- Stable BBB- Positive
WONDERFUL INDONESIA IS A WORTH TO INVEST COUNTRY
27
TOURISM INVESTMENT REALIZATION
53of Target in 2017
Source Indonesia Investment Coordinating Board (BKPM) 2017
) year 2017 (January ndash September)
Growth 2013 - 2014 2014 - 2015 2015 ndash 2016
PMA 1066 4311 6286
PMDN 2347 8293 -4948
Total 1364 5317 2896
Tourism Investment Realization Growth
| Score | Rank | ||||||||
| 2008 | 370 | 80 | |||||||
| 2009 | 380 | 81 | |||||||
| 2011 | 400 | 74 | |||||||
| 2013 | 403 | 70 | |||||||
| 2015 | 404 | 50 | |||||||
| 2017 | 416 | 42 | 324 | 37 |
| No | Sub Index Pillar | Indonesia | |||
| Travel and Tourism Competitiveness Index 2015 | 50 | ||||
| I | ENABLING ENVIRONMENT | 80 | |||
| 1 | Business Environment | 63 | |||
| 2 | Safety and Security | 83 | |||
| 3 | Health and Hygiene | 109 | |||
| 4 | Human Resources and Labour Market | 53 | |||
| 5 | ICT Readiness | 85 | |||
| II | TRAVEL AND TOURISM POLICY AND ENABLING CONDITION | 9 | |||
| 6 | Prioritization of Travel and Tourism | 15 | |||
| 7 | International Openness | 55 | |||
| 8 | Price Competitiveness | 3 | |||
| 9 | Environmental Sustainability | 134 | |||
| III | INFRASTRUCTURE | 75 | |||
| 10 | Air Transport Infrsatructure | 39 | |||
| 11 | Ground and Port Infrastructure | 77 | |||
| 12 | Tourist Service Infrastructure | 101 | |||
| IV | NATURAL AND CULTURAL RESOURCES | 17 | |||
| 13 | Natural Resources | 19 | |||
| 14 | Cultural Resources and Business Travel | 25 |
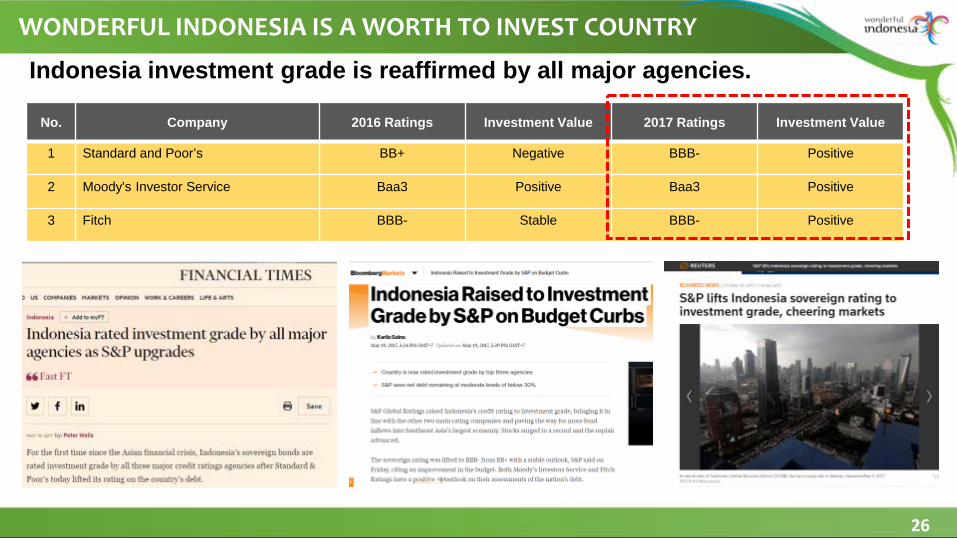
Sheet7
Sheet7
18
B Digital Tourism
WHY TOURISM IS GROWING
Growth 2568
GO DIGITAL 3 T
REVOLUTION
Top-20 fastest growing tourism destination
Lifestyle Personal Mobile Interactive
70 search and share are using digital
Digital media effectiveness is 4x more than that of conventional media
TELECOMMUNICATION
TRANSPORTATION
TOURISM
Highest forex earnings
Create Job Opportunity
19
3T REVOLUTION
TELECOMUNICATION + DIGITALCOMMON PLATFORM
SHARING ECONOMY
Google Facebook Whatsapp
TRANSPORTATION + DIGITALCOMMON PLATFORM
SHARING ECONOMY
Uber LCC Gojek
TOURISM + DIGITALCOMMON PLATFORM
SHARING ECONOMY
Tripadvisor Traveloka Travelio
Digital Tourism Revolution is the Natural Revolution
20
CHALLENGES AHEAD
INCUMBENT RESISTANCE
ldquoWhatrsquos in it for merdquo
COST OF DOING NOTHING
21
22
DEVELOPMENT OF DIGITAL WORLD
Social media
January 2017 74 Billion worldrsquos population 37 Billion internet users 27 Billion active social media users 8 Billion mobile users 25 Billion active social mobile users
January 2017 262 Million Indonesiarsquos population
132 Million internet users 106 Million active social media users 371 Million mobile users 92 Million active social mobile users
Source We Are Social Hootsuite 2017
TREND INDUSTRI
23
24
C Investment Opportunity
BREAKING NEWS
25
Ease of Doing Business in Indonesia has improved due to government efforts to simplify regulations
26
Indonesia investment grade is reaffirmed by all major agencies
No Company 2016 Ratings Investment Value 2017 Ratings Investment Value
1 Standard and Poorrsquos BB+ Negative BBB- Positive
2 Moodyrsquos Investor Service Baa3 Positive Baa3 Positive
3 Fitch BBB- Stable BBB- Positive
WONDERFUL INDONESIA IS A WORTH TO INVEST COUNTRY
27
TOURISM INVESTMENT REALIZATION
53of Target in 2017
Source Indonesia Investment Coordinating Board (BKPM) 2017
) year 2017 (January ndash September)
Growth 2013 - 2014 2014 - 2015 2015 ndash 2016
PMA 1066 4311 6286
PMDN 2347 8293 -4948
Total 1364 5317 2896
Tourism Investment Realization Growth
| Score | Rank | ||||||||
| 2008 | 370 | 80 | |||||||
| 2009 | 380 | 81 | |||||||
| 2011 | 400 | 74 | |||||||
| 2013 | 403 | 70 | |||||||
| 2015 | 404 | 50 | |||||||
| 2017 | 416 | 42 | 324 | 37 |
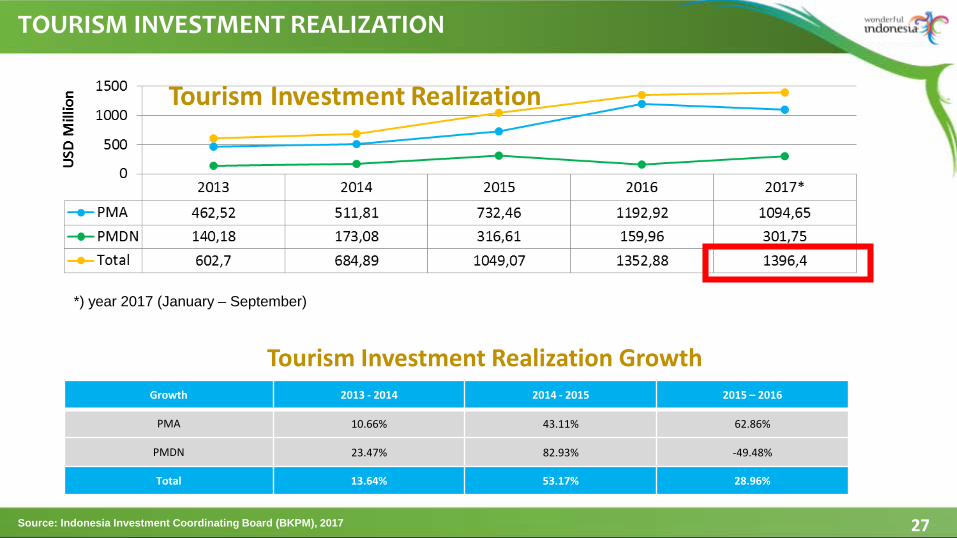
Sheet7
18
B Digital Tourism
WHY TOURISM IS GROWING
Growth 2568
GO DIGITAL 3 T
REVOLUTION
Top-20 fastest growing tourism destination
Lifestyle Personal Mobile Interactive
70 search and share are using digital
Digital media effectiveness is 4x more than that of conventional media
TELECOMMUNICATION
TRANSPORTATION
TOURISM
Highest forex earnings
Create Job Opportunity
19
3T REVOLUTION
TELECOMUNICATION + DIGITALCOMMON PLATFORM
SHARING ECONOMY
Google Facebook Whatsapp
TRANSPORTATION + DIGITALCOMMON PLATFORM
SHARING ECONOMY
Uber LCC Gojek
TOURISM + DIGITALCOMMON PLATFORM
SHARING ECONOMY
Tripadvisor Traveloka Travelio
Digital Tourism Revolution is the Natural Revolution
20
CHALLENGES AHEAD
INCUMBENT RESISTANCE
ldquoWhatrsquos in it for merdquo
COST OF DOING NOTHING
21
22
DEVELOPMENT OF DIGITAL WORLD
Social media
January 2017 74 Billion worldrsquos population 37 Billion internet users 27 Billion active social media users 8 Billion mobile users 25 Billion active social mobile users
January 2017 262 Million Indonesiarsquos population
132 Million internet users 106 Million active social media users 371 Million mobile users 92 Million active social mobile users
Source We Are Social Hootsuite 2017
TREND INDUSTRI
23
24
C Investment Opportunity
BREAKING NEWS
25
Ease of Doing Business in Indonesia has improved due to government efforts to simplify regulations
26
Indonesia investment grade is reaffirmed by all major agencies
No Company 2016 Ratings Investment Value 2017 Ratings Investment Value
1 Standard and Poorrsquos BB+ Negative BBB- Positive
2 Moodyrsquos Investor Service Baa3 Positive Baa3 Positive
3 Fitch BBB- Stable BBB- Positive
WONDERFUL INDONESIA IS A WORTH TO INVEST COUNTRY
27
TOURISM INVESTMENT REALIZATION
53of Target in 2017
Source Indonesia Investment Coordinating Board (BKPM) 2017
) year 2017 (January ndash September)
Growth 2013 - 2014 2014 - 2015 2015 ndash 2016
PMA 1066 4311 6286
PMDN 2347 8293 -4948
Total 1364 5317 2896
Tourism Investment Realization Growth
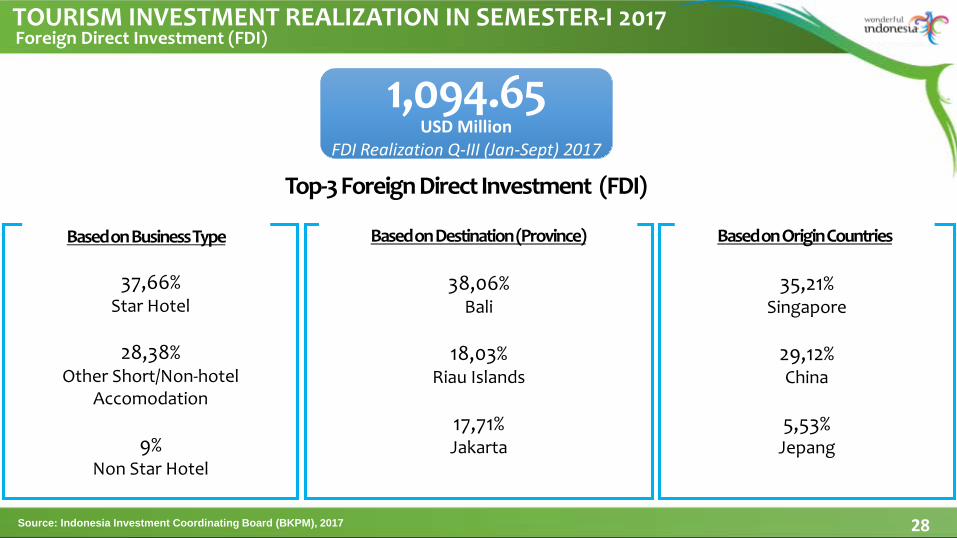
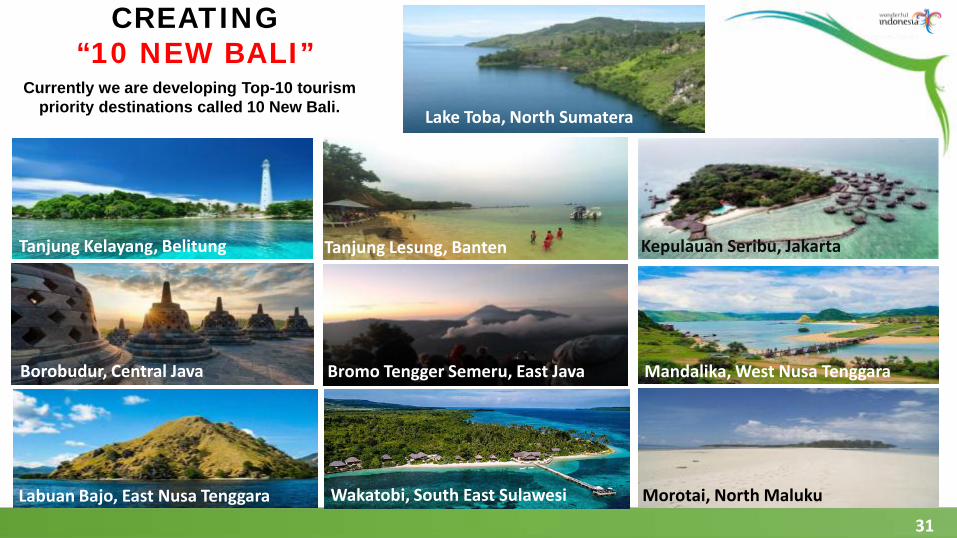
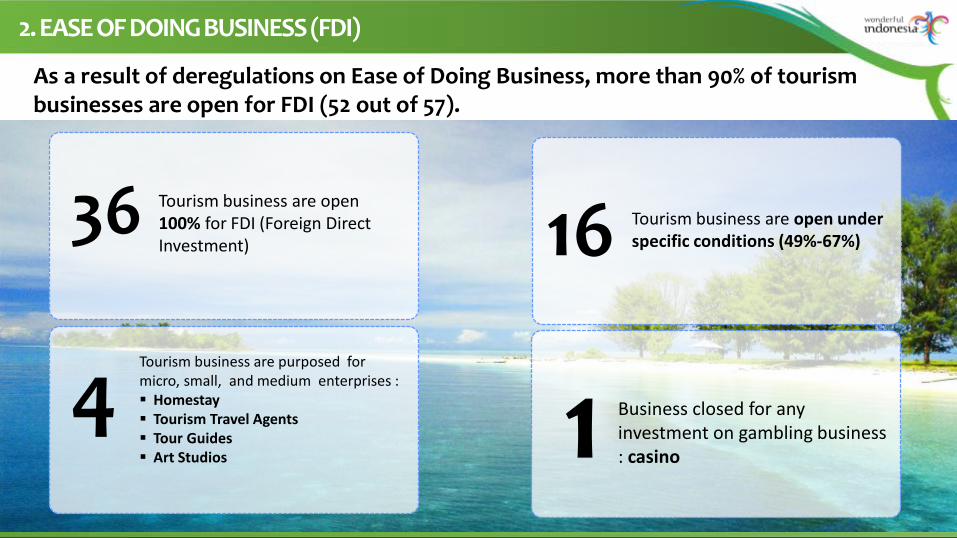
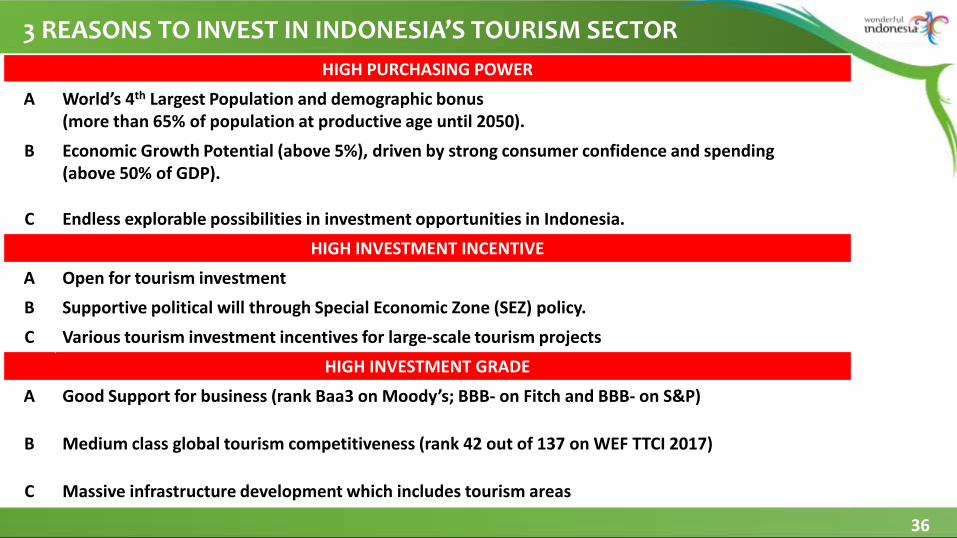

27
TOURISM INVESTMENT REALIZATION
53of Target in 2017
Source Indonesia Investment Coordinating Board (BKPM) 2017
) year 2017 (January ndash September)
Growth 2013 - 2014 2014 - 2015 2015 ndash 2016
PMA 1066 4311 6286
PMDN 2347 8293 -4948
Total 1364 5317 2896
Tourism Investment Realization Growth

Chart1
Sheet1
28
109465USD Million
FDI Realization Q-III (Jan-Sept) 2017
Foreign Direct Investment (FDI)
Top-3 Foreign Direct Investment (FDI)
Based on Business Type Based on Destination (Province) Based on Origin Countries
3766Star Hotel
2838Other ShortNon-hotel
Accomodation
9Non Star Hotel
3806Bali
1803Riau Islands
1771Jakarta
3521Singapore
2912China
553Jepang
TOURISM INVESTMENT REALIZATION IN SEMESTER-I 2017
Source Indonesia Investment Coordinating Board (BKPM) 2017
29
30175USD Million
DDI Realization Q-III (Jan-Sept) 2017
Top-3 Domestic Direct Investment (DDI)
Based on Business Type Based on Destination (Province)
7672Star Hotel
1268Theme Park
452Entertainment amp Recreation
Activities
26West Java
1527Central Java
1307East Java
Source Indonesia Investment Coordinating Board (BKPM) 2017
Domestic Direct Investment (DDI)TOURISM INVESTMENT REALIZATION IN SEMESTER-I 2017
30
TOURISM INVESTMENT NEEDS IN INDONESIA
By 2019 we have the target to add tourism facilities as follows
120000Hotel Rooms
15000Restaurants
100International
Recreational Parks
100Diving Operators
100Marinas
CREATINGldquo10 NEW BALIrdquo
Lake Toba North Sumatera
Tanjung Kelayang Belitung Tanjung Lesung Banten Kepulauan Seribu Jakarta
Borobudur Central Java Bromo Tengger Semeru East Java Mandalika West Nusa Tenggara
Wakatobi South East Sulawesi Morotai North MalukuLabuan Bajo East Nusa Tenggara
31
Currently we are developing Top-10 tourism priority destinations called 10 New Bali
32
NO DESTINATION
PROJECTION 2019
INVESTMENT (USD MILLION)
INTERNATrsquoL TOURIST ARRIVAL (PEOPLE)
FOREIGN EXCHANGE
(USD MILLION)
1 Lake Toba 1600 1000000 1000 2 Tanjung Kelayang 1400 500000 500 3 Tanjung Lesung 4000 1000000 1000
4 Kepulauan Seribu amp Kota Tua Jakarta 1500 1000000 1000
5 Borobudur 1500 2000000 2000
6 Bromo-Tengger-Semeru 1400 1000000 1000
7 Mandalika 3000 2000000 2000 8 Labuan Bajo 1200 500000 500 9 Wakatobi 1500 500000 500 10 Morotai 2900 500000 500
TOTAL USD 20000 10 Million USD 10 Billion
INVESTMENT PROFILE OF TOP 10 PRIORITY TOURISM DESTINATIONSTotal Investment needed is USD 20 Billion
(USD 10 Billion Public Infrastructures Investment and USD 10 Billion Private Investment)
33
DEREGULATION IN INDONESIA
1 Ease of Entering Indonesia
2 Ease of Doing Business (FDI)
In order to attract tourists and investorsIndonesia Deregulations efforts focused on two things
34
1 Visa FreePresidential Regulation No 212016 regarding Visa Free from 15 countries in 2013 to 169 countries in 2016
1 EASE OF ENTERING INDONESIA
2 Simplifying Yacht Arrivals
3 Abolition of Cruise Cabotage PrincipleTo allow passengers of foreign cruise ships embark and disembark in 5Indonesiarsquos main ports
Waiving Clearance Approval for Indonesia Territory (CAIT) Policy entry permit from 3 weeks to 3 hours
There are 3 deregulations regarding the ease of entering Indonesia
35
2 EASE OF DOING BUSINESS (FDI)
As a result of deregulations on Ease of Doing Business more than 90 of tourism businesses are open for FDI (52 out of 57)
1 Business closed for any investment on gambling business casino
4Tourism business are purposed for micro small and medium enterprises Homestay Tourism Travel Agents Tour Guides Art Studios
16 Tourism business are open under specific conditions (49-67)
36 Tourism business are open 100 for FDI (Foreign Direct Investment)
36
3 REASONS TO INVEST IN INDONESIArsquoS TOURISM SECTORHIGH PURCHASING POWER
A Worldrsquos 4th Largest Population and demographic bonus(more than 65 of population at productive age until 2050)
B Economic Growth Potential (above 5) driven by strong consumer confidence and spending(above 50 of GDP)
C Endless explorable possibilities in investment opportunities in Indonesia
HIGH INVESTMENT INCENTIVE
A Open for tourism investment
B Supportive political will through Special Economic Zone (SEZ) policy
C Various tourism investment incentives for large-scale tourism projects
HIGH INVESTMENT GRADE
A Good Support for business (rank Baa3 on Moodyrsquos BBB- on Fitch and BBB- on SampP)
B Medium class global tourism competitiveness (rank 42 out of 137 on WEF TTCI 2017)
C Massive infrastructure development which includes tourism areas
37
THANK YOU
- The 4th Seminar on Promoting Services Trade in ASEAN Trade in Tourism Services
- TRADE SERVICESIN INDONESIA
- Composition of Indonesiarsquos Export of Services
- Services Sectorrsquos Contribution in Indonesia GDP (2014)
- Directorate of Trade In Services Directorate General of International Trade Negotiation
- PROMOTING SERVICES TRADE
- TRADE IN TOURISM SERVICES
- スライド番号 8
- スライド番号 9
- スライド番号 10
- スライド番号 11
- スライド番号 12
- スライド番号 13
- スライド番号 14
- スライド番号 15
- スライド番号 16
- スライド番号 17
- スライド番号 18
- WHY TOURISM IS GROWING
- 3T REVOLUTION
- CHALLENGES AHEAD
- DEVELOPMENT OF DIGITAL WORLD
- TREND INDUSTRI
- スライド番号 24
- スライド番号 25
- スライド番号 26
- スライド番号 27
- スライド番号 28
- スライド番号 29
- スライド番号 30
- スライド番号 31
- スライド番号 32
- スライド番号 33
- スライド番号 34
- スライド番号 35
- スライド番号 36
- スライド番号 37
-
| PMA | PMDN | Total | |||||
| 2013 | 46252 | 14018 | 6027 | ||||
| 2014 | 51181 | 17308 | 68489 | ||||
| 2015 | 73246 | 31661 | 104907 | ||||
| 2016 | 119292 | 15996 | 135288 | ||||
| 2017 | 109465 | 30175 | 13964 | ||||
| To resize chart data range drag lower right corner of range |
| 2013 | 2013 | 2013 | |||
| 2014 | 2014 | 2014 | |||
| 2015 | 2015 | 2015 | |||
| 2016 | 2016 | 2016 | |||
| 2017 | 2017 | 2017 |

Sheet1
28
109465USD Million
FDI Realization Q-III (Jan-Sept) 2017
Foreign Direct Investment (FDI)
Top-3 Foreign Direct Investment (FDI)
Based on Business Type Based on Destination (Province) Based on Origin Countries
3766Star Hotel
2838Other ShortNon-hotel
Accomodation
9Non Star Hotel
3806Bali
1803Riau Islands
1771Jakarta
3521Singapore
2912China
553Jepang
TOURISM INVESTMENT REALIZATION IN SEMESTER-I 2017
Source Indonesia Investment Coordinating Board (BKPM) 2017
29
30175USD Million
DDI Realization Q-III (Jan-Sept) 2017
Top-3 Domestic Direct Investment (DDI)
Based on Business Type Based on Destination (Province)
7672Star Hotel
1268Theme Park
452Entertainment amp Recreation
Activities
26West Java
1527Central Java
1307East Java
Source Indonesia Investment Coordinating Board (BKPM) 2017
Domestic Direct Investment (DDI)TOURISM INVESTMENT REALIZATION IN SEMESTER-I 2017
30
TOURISM INVESTMENT NEEDS IN INDONESIA
By 2019 we have the target to add tourism facilities as follows
120000Hotel Rooms
15000Restaurants
100International
Recreational Parks
100Diving Operators
100Marinas
CREATINGldquo10 NEW BALIrdquo
Lake Toba North Sumatera
Tanjung Kelayang Belitung Tanjung Lesung Banten Kepulauan Seribu Jakarta
Borobudur Central Java Bromo Tengger Semeru East Java Mandalika West Nusa Tenggara
Wakatobi South East Sulawesi Morotai North MalukuLabuan Bajo East Nusa Tenggara
31
Currently we are developing Top-10 tourism priority destinations called 10 New Bali
32
NO DESTINATION
PROJECTION 2019
INVESTMENT (USD MILLION)
INTERNATrsquoL TOURIST ARRIVAL (PEOPLE)
FOREIGN EXCHANGE
(USD MILLION)
1 Lake Toba 1600 1000000 1000 2 Tanjung Kelayang 1400 500000 500 3 Tanjung Lesung 4000 1000000 1000
4 Kepulauan Seribu amp Kota Tua Jakarta 1500 1000000 1000
5 Borobudur 1500 2000000 2000
6 Bromo-Tengger-Semeru 1400 1000000 1000
7 Mandalika 3000 2000000 2000 8 Labuan Bajo 1200 500000 500 9 Wakatobi 1500 500000 500 10 Morotai 2900 500000 500
TOTAL USD 20000 10 Million USD 10 Billion
INVESTMENT PROFILE OF TOP 10 PRIORITY TOURISM DESTINATIONSTotal Investment needed is USD 20 Billion
(USD 10 Billion Public Infrastructures Investment and USD 10 Billion Private Investment)
33
DEREGULATION IN INDONESIA
1 Ease of Entering Indonesia
2 Ease of Doing Business (FDI)
In order to attract tourists and investorsIndonesia Deregulations efforts focused on two things
34
1 Visa FreePresidential Regulation No 212016 regarding Visa Free from 15 countries in 2013 to 169 countries in 2016
1 EASE OF ENTERING INDONESIA
2 Simplifying Yacht Arrivals
3 Abolition of Cruise Cabotage PrincipleTo allow passengers of foreign cruise ships embark and disembark in 5Indonesiarsquos main ports
Waiving Clearance Approval for Indonesia Territory (CAIT) Policy entry permit from 3 weeks to 3 hours
There are 3 deregulations regarding the ease of entering Indonesia
35
2 EASE OF DOING BUSINESS (FDI)
As a result of deregulations on Ease of Doing Business more than 90 of tourism businesses are open for FDI (52 out of 57)
1 Business closed for any investment on gambling business casino
4Tourism business are purposed for micro small and medium enterprises Homestay Tourism Travel Agents Tour Guides Art Studios
16 Tourism business are open under specific conditions (49-67)
36 Tourism business are open 100 for FDI (Foreign Direct Investment)
36
3 REASONS TO INVEST IN INDONESIArsquoS TOURISM SECTORHIGH PURCHASING POWER
A Worldrsquos 4th Largest Population and demographic bonus(more than 65 of population at productive age until 2050)
B Economic Growth Potential (above 5) driven by strong consumer confidence and spending(above 50 of GDP)
C Endless explorable possibilities in investment opportunities in Indonesia
HIGH INVESTMENT INCENTIVE
A Open for tourism investment
B Supportive political will through Special Economic Zone (SEZ) policy
C Various tourism investment incentives for large-scale tourism projects
HIGH INVESTMENT GRADE
A Good Support for business (rank Baa3 on Moodyrsquos BBB- on Fitch and BBB- on SampP)
B Medium class global tourism competitiveness (rank 42 out of 137 on WEF TTCI 2017)
C Massive infrastructure development which includes tourism areas
37
THANK YOU
- The 4th Seminar on Promoting Services Trade in ASEAN Trade in Tourism Services
- TRADE SERVICESIN INDONESIA
- Composition of Indonesiarsquos Export of Services
- Services Sectorrsquos Contribution in Indonesia GDP (2014)
- Directorate of Trade In Services Directorate General of International Trade Negotiation
- PROMOTING SERVICES TRADE
- TRADE IN TOURISM SERVICES
- スライド番号 8
- スライド番号 9
- スライド番号 10
- スライド番号 11
- スライド番号 12
- スライド番号 13
- スライド番号 14
- スライド番号 15
- スライド番号 16
- スライド番号 17
- スライド番号 18
- WHY TOURISM IS GROWING
- 3T REVOLUTION
- CHALLENGES AHEAD
- DEVELOPMENT OF DIGITAL WORLD
- TREND INDUSTRI
- スライド番号 24
- スライド番号 25
- スライド番号 26
- スライド番号 27
- スライド番号 28
- スライド番号 29
- スライド番号 30
- スライド番号 31
- スライド番号 32
- スライド番号 33
- スライド番号 34
- スライド番号 35
- スライド番号 36
- スライド番号 37
-
| PMA | PMDN | Total | |||||
| 2013 | 46252 | 14018 | 6027 | ||||
| 2014 | 51181 | 17308 | 68489 | ||||
| 2015 | 73246 | 31661 | 104907 | ||||
| 2016 | 119292 | 15996 | 135288 | ||||
| 2017 | 109465 | 30175 | 13964 | ||||
| To resize chart data range drag lower right corner of range |

28
109465USD Million
FDI Realization Q-III (Jan-Sept) 2017
Foreign Direct Investment (FDI)
Top-3 Foreign Direct Investment (FDI)
Based on Business Type Based on Destination (Province) Based on Origin Countries
3766Star Hotel
2838Other ShortNon-hotel
Accomodation
9Non Star Hotel
3806Bali
1803Riau Islands
1771Jakarta
3521Singapore
2912China
553Jepang
TOURISM INVESTMENT REALIZATION IN SEMESTER-I 2017
Source Indonesia Investment Coordinating Board (BKPM) 2017
29
30175USD Million
DDI Realization Q-III (Jan-Sept) 2017
Top-3 Domestic Direct Investment (DDI)
Based on Business Type Based on Destination (Province)
7672Star Hotel
1268Theme Park
452Entertainment amp Recreation
Activities
26West Java
1527Central Java
1307East Java
Source Indonesia Investment Coordinating Board (BKPM) 2017
Domestic Direct Investment (DDI)TOURISM INVESTMENT REALIZATION IN SEMESTER-I 2017
30
TOURISM INVESTMENT NEEDS IN INDONESIA
By 2019 we have the target to add tourism facilities as follows
120000Hotel Rooms
15000Restaurants
100International
Recreational Parks
100Diving Operators
100Marinas
CREATINGldquo10 NEW BALIrdquo
Lake Toba North Sumatera
Tanjung Kelayang Belitung Tanjung Lesung Banten Kepulauan Seribu Jakarta
Borobudur Central Java Bromo Tengger Semeru East Java Mandalika West Nusa Tenggara
Wakatobi South East Sulawesi Morotai North MalukuLabuan Bajo East Nusa Tenggara
31
Currently we are developing Top-10 tourism priority destinations called 10 New Bali
32
NO DESTINATION
PROJECTION 2019
INVESTMENT (USD MILLION)
INTERNATrsquoL TOURIST ARRIVAL (PEOPLE)
FOREIGN EXCHANGE
(USD MILLION)
1 Lake Toba 1600 1000000 1000 2 Tanjung Kelayang 1400 500000 500 3 Tanjung Lesung 4000 1000000 1000
4 Kepulauan Seribu amp Kota Tua Jakarta 1500 1000000 1000
5 Borobudur 1500 2000000 2000
6 Bromo-Tengger-Semeru 1400 1000000 1000
7 Mandalika 3000 2000000 2000 8 Labuan Bajo 1200 500000 500 9 Wakatobi 1500 500000 500 10 Morotai 2900 500000 500
TOTAL USD 20000 10 Million USD 10 Billion
INVESTMENT PROFILE OF TOP 10 PRIORITY TOURISM DESTINATIONSTotal Investment needed is USD 20 Billion
(USD 10 Billion Public Infrastructures Investment and USD 10 Billion Private Investment)
33
DEREGULATION IN INDONESIA
1 Ease of Entering Indonesia
2 Ease of Doing Business (FDI)
In order to attract tourists and investorsIndonesia Deregulations efforts focused on two things
34
1 Visa FreePresidential Regulation No 212016 regarding Visa Free from 15 countries in 2013 to 169 countries in 2016
1 EASE OF ENTERING INDONESIA
2 Simplifying Yacht Arrivals
3 Abolition of Cruise Cabotage PrincipleTo allow passengers of foreign cruise ships embark and disembark in 5Indonesiarsquos main ports
Waiving Clearance Approval for Indonesia Territory (CAIT) Policy entry permit from 3 weeks to 3 hours
There are 3 deregulations regarding the ease of entering Indonesia
35
2 EASE OF DOING BUSINESS (FDI)
As a result of deregulations on Ease of Doing Business more than 90 of tourism businesses are open for FDI (52 out of 57)
1 Business closed for any investment on gambling business casino
4Tourism business are purposed for micro small and medium enterprises Homestay Tourism Travel Agents Tour Guides Art Studios
16 Tourism business are open under specific conditions (49-67)
36 Tourism business are open 100 for FDI (Foreign Direct Investment)
36
3 REASONS TO INVEST IN INDONESIArsquoS TOURISM SECTORHIGH PURCHASING POWER
A Worldrsquos 4th Largest Population and demographic bonus(more than 65 of population at productive age until 2050)
B Economic Growth Potential (above 5) driven by strong consumer confidence and spending(above 50 of GDP)
C Endless explorable possibilities in investment opportunities in Indonesia
HIGH INVESTMENT INCENTIVE
A Open for tourism investment
B Supportive political will through Special Economic Zone (SEZ) policy
C Various tourism investment incentives for large-scale tourism projects
HIGH INVESTMENT GRADE
A Good Support for business (rank Baa3 on Moodyrsquos BBB- on Fitch and BBB- on SampP)
B Medium class global tourism competitiveness (rank 42 out of 137 on WEF TTCI 2017)
C Massive infrastructure development which includes tourism areas
37
THANK YOU
- The 4th Seminar on Promoting Services Trade in ASEAN Trade in Tourism Services
- TRADE SERVICESIN INDONESIA
- Composition of Indonesiarsquos Export of Services
- Services Sectorrsquos Contribution in Indonesia GDP (2014)
- Directorate of Trade In Services Directorate General of International Trade Negotiation
- PROMOTING SERVICES TRADE
- TRADE IN TOURISM SERVICES
- スライド番号 8
- スライド番号 9
- スライド番号 10
- スライド番号 11
- スライド番号 12
- スライド番号 13
- スライド番号 14
- スライド番号 15
- スライド番号 16
- スライド番号 17
- スライド番号 18
- WHY TOURISM IS GROWING
- 3T REVOLUTION
- CHALLENGES AHEAD
- DEVELOPMENT OF DIGITAL WORLD
- TREND INDUSTRI
- スライド番号 24
- スライド番号 25
- スライド番号 26
- スライド番号 27
- スライド番号 28
- スライド番号 29
- スライド番号 30
- スライド番号 31
- スライド番号 32
- スライド番号 33
- スライド番号 34
- スライド番号 35
- スライド番号 36
- スライド番号 37
-