the 3rd contributor to occupational pension plans · the 3rd contributor to occupational pension...
TRANSCRIPT

February 2017
The 3rd contributor to occupational pension plansProposals for optimisationA study by the SBA «Occupational Pension Plans» task force and the Asset Management Platform

General information
This document and the information contained herein was compiled by the Swiss
Bankers Association’s (SBA) «Occupational Pension Plans» task force based on the
information available when this publication was drafted. The information contained
in this document is provided without any guarantee or assurance, and is intended
solely for information purposes.
This document contains forward-looking statements, in particular also statements
regarding future market developments. While these forward-looking statements
reflect the views and expectations of the SBA «Occupational Pension Plans» task
force, a number of risks, uncertainties and other important factors can result in a
discrepancy between the expectations expressed in this document and actual future
developments and outcomes.
This document may not be reproduced or reprinted without the permission of
the SBA.
3Swiss Bankers Association | The 3rd contributor to occupational pension plans

Table of contents
1 Introduction – Pension funds: the road to a future oriented,
return focused asset management 6
2 Abstract 8
3 Occupational pension plans – objectives and current challenges 20
3.1 The three contributors 21
3.2 Challenges: biometrics and the capital market 23
3.3 Stable asset allocation despite a changed environment 25
4 Expected and required capital market returns 27
4.1 Lower expected returns 28
4.2 Expected future returns based on the Pictet LPP indices 33
4.3 Foreseeable yield-related problems 33
5 Optimal asset management at pension funds 34
5.1 Strategic asset allocation 35
5.2 Optimisation of asset allocation under OOB2 38
5.3 Optimisation of asset allocation: empirical evidence 39
5.4 Unused return potential due to lack of alternative investments 42
5.5 Secured liquidity thanks to a growing capital base 43
5.6 Ideal basis thanks to long investment horizon 45
5.7 Stability through a longer recovery period 47
6 Alternative investments: demystified and viewed from a new angle 50
6.1 Higher returns thanks to additional risk premia 52
6.2 Demystification of alternative investments 55
6.3 Optimisation potential for pension funds 58
6.4 Due diligence process for alternative investments 63
7 Better performance possible with an OOB2 revision 70
7.1 A proposal for revised OOB2 guidelines 71
7.2 Support required from business and government 76
8 Prudent Investor Rule as the next (but one) step 78
8.1 The concept of pension fund portfolio management using the US and the
UK as an example 79
8.2 Basic principles of the Prudent Investor Rule 80
8.3 Up-to-date formulation of the guidelines for asset management at
pension funds 82
9 Comparison with other countries: Switzerland lags behind 84
9.1 Regulatory environment and performance 87
9.2 Asset allocation and performance 90
9.3 Financial market developments and performance 92
10 Conclusions and recommended action 94
5Swiss Bankers Association | The 3rd contributor to occupational pension plans
4 Swiss Bankers Association | The 3rd contributor to occupational pension plans

chief investment officers and pension fund boards have become accustomed to this
reality and appreciate the security that, even if often only illusory, this brings with it.
But the success of asset management should not only be measured in terms of
adherence to rules. Instead, it should be measured much more in terms of delivering
the most efficient and return-oriented execution possible in the interests of the
beneficiaries.
This study shows that the pension funds cannot achieve an efficient portfolio alloca-
tion under the restrictive guidelines set out under OOB2. The findings indicate that
despite historically low interest rates and an unfavourable outlook, there have been
no fundamental changes to asset allocation since the 1980s.
The authors of the study have identified the widespread resistance to non-traditional
investments as the key obstacle to such change. In light of this reality, this document
also attempts to demystify non-traditional investments, without which a realignment
of the 2nd Pillar will hardly be possible. The insistence on adhering to traditional
structures entails missed opportunities to generate returns, which the 2nd Pillar and
its individual beneficiaries in particular can no longer afford.
The SBA and Asset Management Platform study should therefore be considered a
plea for modernised investment policies that are in line with the current needs of
the 2nd Pillar institutions. The authors of the study are aware that this is not possible
without a change of thinking at all levels; from the individual pension funds and
their committees, the industry associations, experts and advisers, through to the
government and the media. This study aims to provide the necessary first step to
this end.
I hope you find the insights it provides stimulating and look forward to a broad
range of reactions.
Herbert J. Scheidt
Chairman of the Swiss Bankers Association
1 Introduction – Pension funds: the road to a future oriented, return focused asset management
Despite the fact that expectations and demands on pension funds are high, their
room for manoeuvre is limited. Though people still often like to talk about the
Federal Law on Occupational Old-Age, Survivors’ and Disability Pension Plan (LPP) as
a framework law, the level of regulatory intervention in the activities of pension
funds is immense and continues to increase.
This applies in particular to the investment guidelines set out in the Ordinance on
Occupational Old-Age, Survivors’ and Disability Benefit Plans (OOB2). These guide-
lines are based on a traditional asset classification into categories with designated
limits. In principle, the possibility of deviating from these limits exists if there is
sufficient justification. However, this possibility is rarely utilised. It would appear that
76 Swiss Bankers Association | The 3rd contributor to occupational pension plansSwiss Bankers Association | The 3rd contributor to occupational pension plans

The share of investment returns on the retirement capital of the beneficiaries of the
occupational pension plans over the last ten years was just under 40 percent. The
ongoing low interest rate environment and macroeconomic developments suggest
that this share will decrease in future. Both a study commissioned by the Federal
Social Insurance Office (FSIO) and conducted by the research institute BAK Basel in
2014, as well as more recent calculations by the SBA «Occupational Pension Plans»
task force suggest that in the medium-term, the pension funds should expect lower
investment performance for their investments. The so-called risk-free interest rate
has at times fallen to below zero. Despite the fact that due to this environment,
target returns have for several years now been significantly lowered (since 2006 from
5 percent to only 3.4 percent at the end of 2015), the pension funds continue to face
major challenges in successfully delivering the regulatory benefits; this not least due
to the very far-reaching benefits guarantee in Switzerland for pension benefits that
have been promised.
This situation is compounded by the continuous rise in life expectancy coupled with
a retirement age that has remained unchanged. Since 1984, the life expectancy of a
65 year-old man has risen by 4.5 years, for a woman of the same age it has risen by
3.4 years. This is a significant and historically unprecedented increase. In the past,
one favourable factor for occupational pension plans was that with the exception of
the early 1990s, interest rates on pension assets were higher than the trend in
wages during the same period. Pensions thus increased more than expected when
LPP came into force in 1985.
However, the pension funds have often not succeeded in adequately addressing the
strong fall in interest rates, with the result that retirement capital is now compound-
ed at a much higher rate than the pension assets of the current pension fund con-
tributors. This situation is unsatisfactory and is one of the reasons for the widespread
and justified criticism of the redistribution between generations.
Although the investment environment has changed significantly in the last few
decades, a remarkable constancy can be observed in terms of asset allocation. The
asset allocation of Swiss pension funds continues to be dominated by bonds, equi-
ties and – a Swiss speciality – domestic real estate.
2 Abstract
Chapter 3 – Occupational pension plans – Objectives and current challenges
In the past, over one-third of pension assets were generated through
investment returns. The developments in financial markets will make it
increasingly difficult to maintain the level of contribution made by the
so-called 3rd contributor in future. Notwithstanding, the investment
strategy (asset allocation) of the pension funds has to date barely reacted
to the new realities. It has remained largely unchanged since the 1980s.
98 Swiss Bankers Association | The 3rd contributor to occupational pension plansSwiss Bankers Association | The 3rd contributor to occupational pension plans

Chapter 5 – Optimal asset management for pension funds
Markowitz’ portfolio theory highlights how returns can be maximised at a
given level of risk, or how risk can be minimized while maintaining the
same level of returns. This theory is important because it determines strate-
gic asset allocation and therefore has the biggest influence on the perfor-
mance of an investment portfolio. An analysis of existing Swiss pension
fund portfolios reveals that in terms of asset allocation, the majority there-
of are not structured efficiently. One key reason for this is that – with the
exception of real estate – non-traditional investments are largely underrep-
resented. The asset allocation lies below the OOB2 efficient frontier, which
points to existing potential for optimisation in asset management.
The insights provided by portfolio theory continue to form the basis for an optimal
investment portfolio. This takes advantage of the fact of that there is no perfect
correlation between the returns from different asset classes, nor is there a perfect
correlation between elements within a specific asset class. As a result, it is possible
for a pension fund to reduce the volatility of a portfolio’s returns and therefore the
portfolio risk by diversifying using different investments. Because asset allocation is
the key determinant for the success of asset management, this fact together with
the expected returns should be taken into account when establishing strategic asset
allocation.
An analysis of existing Swiss pension fund portfolios conducted by Credit Suisse
shows that the vast majority thereof have a suboptimal asset allocation. This means
that within the scope of the investment guidelines set out under the OOB2 ordi-
nance, it would be possible to achieve better performance without taking additional
risk. It is of note that the permitted exemption limits for asset classes, in particular
for non-traditional investments, are generally only exploited in small part, even
though doing so could result in portfolios that are more efficient. In practice, the
actual efficient frontier is built primarily using the traditional asset classes equities,
bonds and Swiss real estate, and therefore lies below the efficient frontier that could
be achieved under the OOB2 provisions if they were fully exploited.
Chapter 4 – Expected and required capital market returns
Many government bond yields have fallen to below zero. No inflationary
tendencies are in sight. Although equities continue to deliver positive
performance, for the medium-term, this performance is likely to fall below
past levels.
Capital markets have been affected by the weaker global growth observed since the
outbreak of the 2008 financial crisis. Global growth has fallen from the long-term
average of 3.5 to 2.5 percent. According to a study by Pictet, this is primarily attrib-
utable to the decline in productivity growth, the high debt levels and China’s eco-
nomic transformation into a service economy.
The authors of this study do not anticipate a significant rise in inflation. Annual
inflation rates of 1 to 2 percent are expected over the next five years for developed
countries. An interest rate increase in Switzerland is therefore currently not in sight.
Over the next ten years, government bonds from developed countries are expected
to yield around zero percent. When this publication was being drafted, 28 percent of
all bonds from developed countries were negative-yielding. This is a historic high.
Positive yields are only expected for emerging market government bonds. The equity
markets paint a more positive picture, although forecasts for equities are likely to be
even more difficult and uncertain over the next ten years.
The SBA «Occupational Pension Plans» task force’s forecasts are not good news for
Swiss pension funds. They suggest that for traditional asset classes such as Swiss
government bonds as well as government bonds from developed countries, negative
or at least very low yields in historical comparison should be expected. If the pension
funds do not adjust their asset allocation, they will most likely face problems in the
coming years caused by low government bond yields.
1110 Swiss Bankers Association | The 3rd contributor to occupational pension plansSwiss Bankers Association | The 3rd contributor to occupational pension plans
2 Abstract

Alternative or non-traditional investments are given a hard time when it comes to
pension funds. They are generally considered to be opaque, illiquid, expensive and
speculative. The regulator has also rejected a number of parliamentary initiatives for
an amendment of the highly restrictive guidelines, with the indication that in the
vast majority of cases, the existing limits are rarely utilised. In these instances, refer-
ence was also made to the possibility of exceeding the limits with an appropriate
justification.
It is important to note here that adhering to the existing limits gives portfolio man-
agers, and in particular also boards of trustees, the feeling of remaining within the
scope of the accepted rules while not taking unnecessary risks, all the while meeting
their responsibilities. This may also be the reason why demands are rarely heard from
pension funds for a realignment of the investment guidelines by way of an amend-
ment or broadening of the limits. Not even the outlook for returns, which is becom-
ing visibly and increasingly dissatisfactory, appears to be grounds enough for making
such demands.
A new definition of non-traditional investments could be helpful in dispelling the
widespread reservations about these investments. This can be achieved by highlight-
ing, among other things, the risk and illiquidity premia that exist in the market for
non-traditional investments in contrast to traditional investments. This study also
undertakes to demystify the non-traditional segment based on the reality that many
non-traditional investments share the same risk factors as traditional asset classes.
A little known fact is that according to the accepted financial definition, real estate,
due to its illiquidity, is considered a non-traditional investment. Viewed from this
perspective, at 28 percent as at year-end 2015, the Swiss pension funds already have
a large share of non-traditional investments in international comparison. More
important, however, is that thanks to their real estate investments, pension funds
have gained in-depth expertise and experience in dealing with investments with low
liquidity spanning decades, and this can be applied in other areas.
Compared to traditional investments, the illiquidity of non-traditional investments is
one of the most important sources of returns. This compensates the investor for the
fact that this type of investment cannot be divested as quickly as publicly listed
There are a number of reasons for the discrepancy between the efficient frontier
determined by OOB2 and the portfolios being managed today. Efficient portfolios
are characterised by their large share of investments with particularly attractive
risk-return ratios and correlation properties. These include, for example, real assets
such as real estate investments and infrastructure, but also private equity (unlisted
equity) or private debt (private loans). Surprisingly, however, today’s already strict
limit of maximum 15 percent non-traditional investments is only exploited in the very
rarest of cases. The reasons for this are: low risk appetite on the part of portfolio
managers, higher costs, and a lack of transparency and insufficient expertise for
these investments.
Risk appetite in particular, however, could be higher, as risk capacity is very high due
to the long investment horizon of pension funds. Even though the liabilities side of a
pension fund can impose certain constraints in terms of liquidity, on aggregate and
overall, liquidity requirements are not an issue for pension funds.
The coverage ratio, on the other hand, is a critical factor. The target coverage ratio
of 100 percent and the short time frame from an investment perspective for rectify-
ing a potential shortfall are probably another reason that pension funds have to
deviate from an optimal strategic asset allocation. A corresponding adjustment of
the permitted shorftall period would be expedient. This would allow for a longer
investment horizon, which is the primary advantage of pension funds compared to
most other investor groups, to be preserved and exploited.
Chapter 6 – Non-traditional investments: demystified and viewed from a
new angle
A significantly greater share of non-traditional investments is required in
order to enhance the efficiency of portfolios and improve performance
within the framework of the OOB2 guidelines. However, there is substan-
tial resistance to this approach. The pension funds’ boards of trustees
shy away from the purportedly higher risks, preferring instead to forfeit
returns. What is needed is a new attitude towards non-traditional
investments.
1312 Swiss Bankers Association | The 3rd contributor to occupational pension plansSwiss Bankers Association | The 3rd contributor to occupational pension plans
2 Abstract

A greater inclusion of non-traditional investments is also reflected in performance
figures. Comparative analyses show that the expected difference in returns between
a standard present-day pension fund portfolio and a diversified version thereof is
around 0.7 percent annually after costs. According to analyses conducted for this
study, an excess return compared to the standard present-day allocation was also
achieved in the past. In an historical comparison spanning 15 years, the diversified
portfolio achieved just over 0.4 percent higher annual returns after costs. In both
cases, historical and expected, the excess return is achieved with comparatively
lower risk.
Chapter 7 – Better performance possible with a OOB2 revision
A revision of the OOB2 ordinance is necessary if the efficient frontier is
to be increased beyond the efficient frontier achievable under today’s
OOB2 guidelines. The approach to non-traditional investments explored in
this study could serve as the basis for this. However, in order to take such
a step, the support of business and the government is imperative.
In order to truly utilise the potential that lies in increasing the efficiency of pension
fund portfolios, it is necessary to amend the current investment guidelines; this in
the knowledge that the existing guidelines are rarely fully exploited and in addition,
may be exceeded if certain criteria are met.
securities. Limited liquidity is not, however, necessarily only a disadvantage. Particu-
larly in periods of crisis, it can often make sense to remain invested in long-term
investments. In extreme cases, trading can be temporarily fully restricted due to
gating, which means that a sale at an inopportune time, often emotionally driven,
can be averted.
The acceptance of non-traditional investments can be improved by putting the
different types into a context that is analogous to the different forms of financing for
the various stages in the life cycle of a company (Figure 2.1). Viewed in terms of their
intended purpose, listed and unlisted investments within the debt and equity cate-
gories should be considered largely equivalent, so irrespective of whether they are
made on private markets (private equity or private debt) or on the stock market
(listed equities and bonds). This line of thinking becomes more important as the
investment horizon increases, because it means that the differentiating characteris-
tics of illiquidity and tradability become less relevant.
Timeline
Source: The Swiss Bankers Association’s (SBA) «Occupational Pension Plans» task force, 2016
Company value
Start-up GrowthSaturation
restructuring
Equity
Debt Private debt
Private equity(Venture & Growth)
Listed bonds
Listed stocks
Private debt
Private equity(buyout)
Figure 2.1
Categorising asset classes under economic purpose
1514 Swiss Bankers Association | The 3rd contributor to occupational pension plansSwiss Bankers Association | The 3rd contributor to occupational pension plans
2 Abstract

A fundamental change in investment mentality as well as an adjustment of the OOB2
guidelines requires the support of business and the government. Although the
investment guidelines are primarily governed at the ordinance level and amendments
through the Federal Council would be relatively easy to initiate, only moderate
changes have been undertaken to date. Calls for amendments are increasingly being
made, however, by business and by pension funds themselves. It is likely that this
pressure will increase, and, depending on financial market developments, even more
than expected. The good news is that the issue is timely and it is being discussed.
The hope is that occupational pension plan stakeholders will assert themselves in a
coordinated manner, with the result that the framework conditions for asset man-
agement are improved as soon as possible and the existing potential for optimisation
can be exploited.
Chapter 8 – Prudent Investor Rule as the next (but one) step
A comparison of pension fund regulation in Switzerland and comparable
countries shows that the traditional categorisation using individual limits,
as is the practice in Switzerland, no longer exists in many countries. In
recent years, these have all taken a clear step towards the Prudent Investor
Rule. According to this rule, the responsibilities of portfolio managers are
not fulfilled by adhering to restrictive rules, but rather by executing the
investment mandate professionally on behalf of the beneficiaries.
The line of reasoning taken in this study follows this development in three steps. The
majority of existing pension fund portfolios, most of which remain below the poten-
tial efficient frontier set by the current OOB2 guidelines, have shortcomings. In a first
step, therefore, efficiency must be increased using the limited freedom afforded by
the current set of investment guidelines under OOB2. The second step is to intro-
duce the amendments described and redefine the investment guidelines. The third
step comes as a result of the second step: greater latitude arising from the departure
from the traditional category limits also signifies increased accountability, and there-
fore necessitates the appropriate expertise. These requirements correspond with a
stronger and internationally already widely recognised Prudent Investor Rule.
The proposal is based on the idea of changing the asset class categorisation to debt,
equity, real asset investments and trading & resources. These are then divided in a
way that puts them on a level with their listed counterparts and more closely aligns
them with the intended financial purpose of the investment. Further to this, the
category limits are adjusted or relaxed on the basis of the changes outlined.
The objective is clear: more room for manoeuvre will give pension funds the oppor-
tunity to generate higher returns on their portfolios as well as improve diversifica-
tion. This is achieved primarily through the addition of non-traditional investments as
a result of their attractive investment characteristics.
Figure 2.2
Proposal for an update to the categorisation and limits for investments in
accordance with OOB2
Sub-investment classes Limit OOB2- Articlenew existing
Debt 100 % –
Listed Bonds CHF and foreign currency 100 % 100 % 55
PrivateMortgage titles CHPrivate debt (new)
50 %15 %
50 %–*
55 a.55 d.
Equity 75 % –
Listed Equities domestic and foreign 75 % 50 % 55 b.
Private Private equity (new) 15 % –* 55 d.
Real asset investments (equity capital) 50 % –
Listed Real estate domestic and foreign 50 % 30 % /10 % 55 c.
PrivateReal estate domestic and foreignInfrastructure (new)
50 %15 %
30 %/10 % –*
55 c.55 d.
Trading & resources 15 % –
TradingResourcesOther
Hedge fundsCommoditiesInsurance linked securities etc.
–––
15 %*15 %*15 %*
55 d.55 d.55 d.
Unhedged foreign currencies 30 % 30 % 55 e.
*Asset class subject to the current total 15 % limit for alternative investments under OOB2.
Source: The SBA «Occupational Pension Plans» task force, 2016
1716 Swiss Bankers Association | The 3rd contributor to occupational pension plansSwiss Bankers Association | The 3rd contributor to occupational pension plans
2 Abstract

A look at the investment performance of the pension funds in various OECD coun-
tries over the past five and ten years shows that both nominally and adjusted for
inflation, Switzerland ranks in the middle to lower end of the spectrum. In the last
five years, Switzerland ranked a modest 16th out of 26 countries examined in terms
of nominal values. In real terms, it performed slightly better, ranking 10th. Looking
at the values for the last ten years, Switzerland’s 17th place (nominal) and 10th place
(real) rankings are no better.
If Switzerland is compared only to countries where pension assets are in similar
proportion to economic output, it emerges that in the last five years, each of these
countries outperformed Switzerland in nominal terms. The pension funds in the UK
generated annual returns that were more than twice as high as Switzerland’s. In real
terms, all of the comparison countries with the exception of the US also outper-
formed Switzerland. A similar picture emerges over a ten-year horizon.
It appears, therefore, that asset allocation, in particular as regards non-traditional
investments, was a decisive factor for performance. Both Canada and the Nether-
lands, for example, increasingly reallocated assets to non-traditional investments.
OOB2 has already embedded the basic concept of rules of conduct for pension
funds at the ordinance level. The possibility thus exists for supervision to be conduct-
ed more on the basis of the pension fund, its committees, and its organisational
set-up, and less on the adherence to the legal investment guidelines. The organisa-
tion-specific supervisory approach as already applied by the Swiss Financial Market
Supervisory Authority (FINMA) for fund management companies could also be
applied to pension funds and endowment funds.
In order for the governing bodies to be able to meet their responsibilities and invest
the assets of the beneficial owners in a targeted, prudent manner and using up-to-
date portfolio theories, legislation is required that regulates not the portfolios, invest-
ments, vehicles or products, but the pension funds and their committees. According-
ly, investment guidelines and restrictions should be replaced by clear requirements
for the governing bodies of a pension fund and its organisational set-up. This re-
quires pension funds to establish structures and extend expertise, which offer a
guarantee of irreproachable business conduct. In Switzerland, this approach is al-
ready being successfully applied for banks, fund management companies and asset
managers. As a result, pension fund committees also become more accountable,
because with this kind of approach, it is no longer possible to shift the responsibility
for not reaching targets or meeting requirements to the investment guidelines.
Chapter 9 – Comparison with other countries: Switzerland lags behind
The question arises of whether, in comparison to other countries, the regu-
lation for asset management within Swiss pension funds results in a forfeit
in terms of performance. The answer is that Switzerland is, in fact, lagging
behind. The causes for this can be attributed to a number of factors, how-
ever, asset allocation, which is highly influenced by the guidelines, is a
critical one.
The fact that the Swiss pension funds are subject to much stricter investment restric-
tions than pension funds in comparable countries raises the question of how the
pension funds perform in international comparison. To come straight to the point:
the result is sobering.
1918 Swiss Bankers Association | The 3rd contributor to occupational pension plansSwiss Bankers Association | The 3rd contributor to occupational pension plans
2 Abstract

3.1 The three contributors
In contrast to the 1st Pillar, which is financed through a defined benefit plan (inter-
generational contract), the employees in the 2nd Pillar save capital individually for
their future pensions. The retirement capital is composed of wage contributions from
employees, employer contributions, which must at least match the employee’s
contribution, and the returns generated on the accumulated savings. Both a singular-
ity and advantage of the so-called defined contribution plan system is that each
employee saves for him or herself, and that unlike for AHV, the system is not directly
dependent on demographic developments.
Between 2005 and 2014, investment returns accounted for almost 40 percent of the
total contributions to pension funds. In the longer-term, this share is expected to be
about one-third. When performance decreased significantly in 2015, this share
accounted for only 17 percent. The significant importance of the so-called 3rd con-
tributor, however, also underscores the fact that even a return contribution of just
0.1 percent on pension fund assets of over CHF 800 bn result in capital growth of
approx. CHF 800 m.
3 Occupational pension plans – objectives and current challengesThe occupational pension plan system is based on the cumulative saving of individual pension assets, which are managed by pension funds. The system currently faces two main challenges: rising life expectancy coupled with an unchanged retirement age, and the historically low interest rates on assets. As a consequence, the pension funds are obliged to adjust the technical interest and conversion rates to the changed conditions. But a realignment is also necessary on the investment side if the level of benefits is to be maintained.
In combination with Old Age and Survivors’ Insurance (AHV), the occupational
pension system aims to ensure that pensioners are able to maintain their accus-
tomed standard of living to a reasonable extent. The terms «accustomed standard of
living» and «reasonable», are not specified in the law. The general view is that a
pension of around 60 percent of the last annual salary is necessary in order to be
able to maintain the accustomed standard of living.
Employees Employers Net returns on investment capital
25.3 %
35.4 %
39.3 %
250
200
150
100
50
0
Fig. 3.1
Source: Federal Statistical Office (FSO)
The three contributors 2005–2014
in bn CHF
2120 Swiss Bankers Association | The 3rd contributor to occupational pension plansSwiss Bankers Association | The 3rd contributor to occupational pension plans

3.2 Challenges: biometrics and the capital market
Biometric trends (rising life expectancy at the time of retirement) affecting employ-
ees and the ongoing low interest rate environment in capital markets present chal-
lenges for pension funds. Figure 3.3 clearly illustrates the trend in life expectancy of
our 65-year-old population. Thanks to medical advancements, healthier lifestyles and
the high level of prosperity, our life expectancy is steadily increasing. For example,
the life expectancy of a 65 year-old man rose by 4.5 years between 1984 and 2014.
For a woman the increase was 3.4 years. In light of this reality, pensioners want to
ensure their vested rights are preserved.
If the retirement age is not increased, this trend alone results in the need to continu-
ously grow pension assets. The level of disbursement for current pensions can only
be reduced under very restrictive conditions. The increase in life expectancy requires
reserves of between 0.3 percent and 0.5 percent of retirement capital.
Second Pillar retirement credits are based on the current salary at that point in time.
However, as long as the interest rate on pension assets at least corresponds with
wage growth, an earlier retirement credit on a lower salary will maintain the same
value as a later retirement credit on a higher salary. The assumption that interest
rates correspond with wage growth is called the «golden rule». This rule held true
for only a short period at the beginning of the 1990s (Figure 3.2). Since then, inter-
est rates have regularly exceeded wage growth, which has led to higher than ex-
pected retirement benefits.
A historical comparison of nominal wage growth with the development of the LPP
minimum interest rate shows that with the exception of the early 1990s, interest
rates on pension assets rose more than wage growth. Pensions therefore increased
more than was initially foreseen.
Source: Federal Statistical Office (FSO)
Fig. 3.2
Nominal wage growth compared to LPP minimum interest rate 1985–2016
(2016 = estimate)
1986 2016201420122010200820062004200220001996 19981994199219901988
LPP minimum interest rate
Nominal wage growth
8 %
7 %
6 %
5 %
4 %
3 %
2 %
1 %
0 %
1985 2015201320112009200720052003200119991995 19971993199119891987
24
22
20
18
16
14
12
65 year-old woman 65 year-old man
Fig. 3.3
Source: Federal Statistical Office (FSO)
Life expectancy 1985 to 2015
in years
2322 Swiss Bankers Association | The 3rd contributor to occupational pension plansSwiss Bankers Association | The 3rd contributor to occupational pension plans
3 Occupational pension plans – objectives and current challenges

Today’s capital markets environment resulting from the negative interest rates places
additional demands on asset management. In recent years, the outlook for target
returns has increasingly decoupled from risk-free interest rates. The difference is now
high at 3.4 percent. This trend means, therefore, that to achieve the target return on
the investment side, significantly more risk would have be taken than to date.
3.3 Stable asset allocation despite a changed environment
On the investment side, the pension funds have to date reacted very little to the new
conditions. A slight reduction in bond positions can be observed. The average asset
allocation as at year-end 2015, however, differs strikingly little from past allocations
(Figure 3.6). The questions and opportunities this brings with it are the focus of the
following chapter.
Due to current interest rate levels, it is, however, becoming increasingly difficult to
generate an adequate return. The investment returns achieved in the past will likely
be very difficult to achieve in future. Despite significant turbulence in the capital
markets, for example the 2008 financial crisis, in recent years, the 3rd contributor has
delivered an annual average return of 4.25 percent. The rate is likely to be signifi-
cantly lower in future (see explanations in Chapter 4).
As a result, the target return has been significantly lowered over the last ten years
(Figure 3.5). Demanding higher contributions to offset this would be very difficult to
push through. In the interests of safeguarding the financial equilibrium, the pension
funds therefore lower the technical interest rate and the conversion rate. Lowering
the technical interest rate means that the amount of retirement capital required to
achieve a defined pension benefit increases, which results in a lower coverage ratio.
2005
10.89
6.2
1.94
-12,59
10.31
2.94
-0.34
7.17 6.26 7.31
1.13
2006 2007 2008 2009 2010 2011 2012 2013 2014 2015
30 %
20 %
10 %
0 %
-10 %
-20 %
-30 %
Average
Fig. 3.4
Source: Swisscanto Schweizer Pensionskassenstudie 2016
Average return generated by the Swiss pension funds
Performance in percent
Fig. 3.5
Source: Swisscanto Schweizer Pensionskassenstudie 2016
Target returns decoupled from the risk-free interest rate
Interest rate in percent
2006 2007 2008 2009 2010 2011 2012 2013 2014 2015
5.0
3.4
3.93.94.0
4.64.64.74.84.9
6.0 %
5.0 %
4.0 %
3.0 %
2.0 %
1.0 %
0.0 %
-1.0 %
2.49
0.36
1.07
0.530.66
1.671.97
2.15
3.11
-0.04
Target return
10-year Swiss federal bond yield (year-end)
2524 Swiss Bankers Association | The 3rd contributor to occupational pension plansSwiss Bankers Association | The 3rd contributor to occupational pension plans
3 Occupational pension plans – objectives and current challenges

4 Expected and required capital market returnsThe SBA «Occupational Pension Plans» task force and BAK Basel have both made forecasts for capital market performance, which is a decisive factor for the pension funds. The SBA «Occupational Pension Plans» task force’s most recent data indicate that even lower returns should be expected than those forecast by BAK Basel. The reason for this is the ongoing low interest rate level. Weakening global economic growth and low to in some cases negative inflation rates are fuelling this trend. For Switzerland, this is compounded by the effect of the strong franc. The conclusion is that if the Swiss pension funds do not change their asset allocation, they will face yield-related problems in the coming years caused by low government bond yields.
Pictet Asset Management has been publishing indices that measure the average
theoretical performance of representative pension fund portfolios since 1985. These
indices are calculated for three target equity allocations with a 25 percent, 40 per-
cent and 60 percent equity component (LPP-25, LPP-40, LPP-60), and were expand-
ed in 2005 and 2015:
Fig. 3.6
Source: Swisscanto Schweizer Pensionskassenstudie 2016
Asset allocation Swiss pension funds 2007–2015
Shares in percent
Cash
Employer investments
Bonds
Equities
Real estate
Mortgages
Alternative investments
Other
2007 2008 2009 2010 2011 2012 2013 2014 2015
17.1 19.9 18.5 19.6 20.7 20.3 19.9 20.4 21.9
29.322.9 26.9 27.4 26.0 27.6 29.4 29.4 30.1
37.840.2
38.5 36.7 37.2 35.8 34.5 34.733.3
7.0 7.9 6.9 7.3 7.5 7.4 7.6 7.0 5.6
4.3 4.8 4.7 5.0 5.1 5.5 5.0 5.4 6.1100 %
90 %
80 %
70 %
60 %
50 %
40 %
30 %
20 %
10 %
0 %
0.36
0.7 0.6 1.5 1.2 0.9 0.7 0.9 0.7 1.0
2.3 2.5 1.9 1.8 1.6 1.6 1.6 1.2 1.1
1.3 0.91.11.11.10.91.11.21.1
2726 Swiss Bankers Association | The 3rd contributor to occupational pension plansSwiss Bankers Association | The 3rd contributor to occupational pension plans
3 Occupational pension plans – objectives and current challenges

In a recent study, Pictet Asset Management forecasts a structural weakening of
global growth potential and suggests that this trend will continue far beyond the
next five years. This results in a weak growth outlook both for developed and
emerging countries in historical comparison.
Key reasons for this slowdown in growth are:
• Declining productivity growth
In the US, labour productivity has risen only 0.5 percent in the last five years; such
low-level growth has not been seen since the 1980s. This trend can be observed
in most economies. This is primarily attributable to the low level of investment
activity in the private sector since 2008.
• High debt levels
The global economy is more indebted today than it was at the end of the finan-
cial crisis in 2008. Developed economies and companies in emerging markets in
• 2005: expansion to include real estate, hedge funds and private equity; currency
risk hedging
• 2015: expansion to include emerging market bonds, corporate bonds, small caps
and absolute return strategies; currency risk hedging
Figure 4.1 clearly shows that the returns on portfolios with a greater equity alloca-
tion (LPP-60) were higher. The higher volatility of such investments, however, re-
quires an increased risk appetite.
4.1 Lower expected returns
The global economy has not yet found its way back to its pre-2008 financial crisis
growth path. Over the last five years, the global economy grew a mere 2.5 percent
per year, which is significantly below the long-term average of 3.5 percent. This
growth slowdown occurred in all major economies and was also seen in Switzerland.
Fig. 4.1
Historical 10-year returns LPP Indices
Historical risks and returns LPP indices, january 1994–december 2014, in percent
Index LPP-25 LPP-40 LPP-60
Year 2000 2005 2015 2000 2005 2015 2000 2005 2015
Return 4.75 4.90 4.84 5.15 5.35 5.33 5.56 5.86 5.82
Risk 4.62 4.55 4.96 6.71 6.80 7.10 9.77 9.95 10.20
Risk / Return 1.03 1.08 0.98 0.77 0.79 0.75 0.57 0.59 0.57
Maximum drawdown -14.14 -16.69 -15.92 -23.36 -28.55 -25.13 -34.49 -41.32 -36.50
Recovery period,in months
12 13 13 42 41 41 50 56 49
Lowest annual return -9.88 -11.51 -11.30 -17.28 -20.67 -18.57 -26.63 -31.05 -27.78
Source: Pictet LPP Indices, Pictet Asset Management, January 2015 (10-year monthly rolling)
Outlook until year-end 2020, change compared to last outlook in brackets
0 % 1 % 2 % 3 % 4 % 5 % 6 %
2.8 (-0.2)
5.4 (-0.5)
5.6 (-0.9)
1.9 (-0.1)
2.0 (-0.2)
1.8 (-0.4)
4.5 (-0.2)
1.0 (-0.2)
1.5 (-0.2)
2.2 (-0.3)US
Eurozone
Japan
Emerging markets
Germany
UK
Switzerland
China
Asia ex-Japan
Latin America
Fig. 4.2
Source: A Secular Outlook, Pictet Asset Management, June 2016
Average real GDP growth rate over the next 5 years
in percent
2928 Swiss Bankers Association | The 3rd contributor to occupational pension plansSwiss Bankers Association | The 3rd contributor to occupational pension plans
4 Expected and required capital market returns

growth outlined previously, the structural excess supply of commodities as well as
ongoing low energy prices. A sustainable rise in interest rates is currently not in sight
in Switzerland. The low economic growth below potential will result in a continua-
tion of the expansive monetary policy of most central banks.
The results of the economic framework outlined are modest expected returns in
historical comparison and a significant difference on the one hand between returns
on equities and government bonds, and between the returns from emerging econo-
mies and developed economies on the other. This is confirmed by the ten-year
return outlook published by UBS AG at the end of June 2016. The long-term return
forecasts made by the UBS economists are significantly below past levels.
Over the next ten years, UBS expects to see very low yields of around 0.0–0.5
percent on government bonds from developed countries. When this publication was
being drafted, 28 percent of all bonds from developed countries were negative
yielding. Positive yields are only expected for emerging market government bonds.
Attractive returns are expected for the equity markets that the Swiss pension funds
traditionally invest in. For the Swiss equity market, UBS economists predict a return
of +7.6 percent annually. The outlook for global equities is also positive (+7.5 %). A
strong rebound for commodities appears unlikely in the next few years. The expect-
ed modest global economic growth will primarily take place in the service sector and
will provide little momentum for commodities markets (+2.3 %). Clearly positive
ten-year returns are expected for private equity (+9.9 %), which comes under the
alternative investment category. This asset class has historically generated additional
returns of around 5 percent per year compared to listed stocks. Real estate continues
to be an attractive alternative asset class, in particular compared to bonds from
developed markets (global real estate +3.4 %).
particular have further increased their debt levels. This indebtedness and the debt
service that comes as a consequence thereof have a dampening effect on eco-
nomic momentum.
• China’s economic transformation into a service economy
The Chinese economy has developed from a virtually insatiable consumer of
commodities into a producer of goods and services. The infrastructure boom in
2003, for example, accounted for 40 percent of gross domestic product (GDP)
growth. Although the service sector in particular continues to record high growth
rates, the assumption is that China will in future no longer be able to act as a
global growth engine.
The authors of the study do not expect to see a significant rise in inflation. Annual
inflation rates of only 1 to 2 percent are expected over the next five years for devel-
oped countries. The forecasts for emerging economies are slightly higher (approx.
3.5 percent). These outlooks are primarily attributable to the low level of global
Outlook until year-end 2020, change compared to last outlook in brackets
0 % 0.5 % 1 % 1.5 % 2 % 2.5 % 3 % 3.5 % 4 % 4.5 %
4.1 (-5.7)
2.8 (-0.1)
2.2 (-0.3)
1.0 (-0.2)
2.3 (0.2)
2.2 (0.4)
3.5 (-1.1)
1.4 (-0.1)
1.6 (-0.4)
2.0 (-0.4) US
Eurozone
Japan
Emerging markets
Germany
UK
Switzerland
China
Asia ex-Japan
Latin America
Source: A Secular Outlook, Pictet Asset Management, June 2016
Fig. 4.3
Average inflation rates over the next 5 years
in percent
3130 Swiss Bankers Association | The 3rd contributor to occupational pension plansSwiss Bankers Association | The 3rd contributor to occupational pension plans
4 Expected and required capital market returns

4.2 Expected future returns based on the Pictet LPP indices
Applying UBS’ expected ten-year returns to the current, representative LPP indices
Pictet LPP-25 and Pictet LPP-40, results in expected annual returns of 2.2 percent
and 3.2 percent respectively over the next ten years.
If costs are taken into account, in particular the asset management fees of 0.44
percent per year1, a net return of around 1.7 percent can be expected over the next
ten years for the LPP-25 portfolio and 2.7 percent per year for the LPP-40 portfolio.
Irrespective of the inclusion of fees, there is a significant difference between these
expectations and historical returns.
4.3 Foreseeable yield-related problems
At the heart of the upcoming LPP revision is the reduction of the minimum conver-
sion rate from 6.8 percent to 6.0 percent. The latter rate is based on the assumption
of around 4 percent annual investment returns (technical interest rate), which is not
realistic based on the expected capital market returns.
The SBA «Occupational Pension Plans» task force’s growth forecasts and expected
returns are not good news for Swiss pension funds. They mean that for fundamental
asset classes such as Swiss franc-denominated government bonds as well as govern-
ment bonds from developed countries, negative or at least very low yields in histori-
cal comparison are to be expected. If the pension funds do not adjust their asset
allocation, they will most likely face yield-related problems in the coming years.
1 Mean asset management fees 2015 in % of investments with transparent costs according to Swisscanto Schweizer Pensionskassenstudie 2016.
Fig. 4.4
Pictet LPP-25: expected returns 2016-2026 in CHF
Asset class LPP-25 allocation %
Expected annualreturn 2016–26
Contribution to annual return
Equities Switzerland 10.0 % 7.6 % 0.8 %
Equities global 13.5 % 7.5 % 1.0 %
Equities emerging markets 1.5 % 8.3 % 0.1 %
Bonds CHF 60.0 % 0.5 % 0.3 %
Bonds EUR 10.0 % 0.3 % 0.0 %
Bonds global 5.00 % 0.0 % 0.0 %
Total 100.0 % 2.2 %
Return net of asset management fees of 0.5 % p.a. 1.7 %
Source: Based on UBS AG’s expected returns, 2016
Fig. 4.5
Pictet LPP-40: expected returns 2016-2026 in CHF
Asset class LPP-40 allocation %
Expected annualreturn 2016–26
Contribution to annual return
Equities Switzerland 15.0 % 7.6 % 1.1 %
Equities global 22.5 % 7.5 % 1.7 %
Equities emerging markets 2.5 % 8.3 % 0.2 %
Bonds CHF 45.0 % 0.5 % 0.2 %
Bonds EUR 10.0 % 0.3 % 0.0 %
Bonds global 5.0 % 0.0 % 0.0 %
Total 100.0 % 3.2 %
Return net of asset management fees of 0.5 % p.a. 2.7 %
Source: Based on UBS AG's expected returns, 2016
3332 Swiss Bankers Association | The 3rd contributor to occupational pension plansSwiss Bankers Association | The 3rd contributor to occupational pension plans
4 Expected and required capital market returns

The size of the liabilities for existing and future pensioners depends to a high degree
on politically-influenced parameters. Accordingly, a number of political initiatives for
an appropriate definition of liability structures for pension funds have been submit-
ted in recent years.
However, this study focusses primarily on asset management-related aspects. Biome-
tric factors such as longevity, the structure of the pension fund with regards to the
age of its members and political processes, which also influence the coverage ratio,
are only taken into account insofar as they have a direct influence on asset manage-
ment. This study highlights the asset management-related factors that pension funds
can influence themselves. To this end, it makes sense to revisit the key principles of
asset management and examine them from a new angle.
5.1 Strategic asset allocation
Asset allocation is the most important aspect when creating new investment portfo-
lios or optimising existing portfolios. The key principles for developing an allocation
strategy are therefore explained hereafter. This section also presents future expecta-
tions for returns, risk and the correlation between the major asset classes.
One of the singularities of asset management for the 2nd Pillar is the OOB2 Ordi-
nance, which among other things, defines which asset classes are permitted and sets
out their limits. Although these restrictions interfere with optimal asset manage-
ment, the problem is a more fundamental one, as many pension funds interpret the
OOB2 limits as a recommendation or benchmark. As a result, they do not utilise the
room for manoeuvre that is foreseen. Even if the specific requirements of the individ-
ual pension funds, in particular the liquidity requirements, are taken into considera-
tion, there is still potential for optimisation.
Among other factors, strategic asset allocation establishes which asset classes,
regions and currencies the assets should be invested in for the longer-term. It is of
key importance, which is reflected in the influence it has on performance. In com-
parison to the share of returns generated by stock selection and tactical allocation
(short-term deviations from strategic allocation), strategic asset allocation accounts
for around 80 percent and more of portfolio returns. Concrete asset allocation is
determined primarily based on the target return and risk tolerance of a pension
5 Optimal asset management at pension fundsStrategic asset allocation is the key determinant for the expected return on a portfolio. The insights provided by Markowitz’ portfolio theory are central when determining optimal asset allocation. This theory shows that maximum return can be achieved at a given risk capacity, and how a targeted return can be achieved with a lower level of risk. An examination of the existing portfolios of Swiss pension funds shows that the level of risk taken is generally too high for the returns generated, or that with the existing level of risk, they could achieve higher returns. This means that there is potential for optimisation. Even higher returns could be achieved through an amendment to the restrictions in place under OOB2. Undertaking such a revision, however, only makes sense if the pension funds are prepared to take advantage of the potential that already exists today. This could in particular be accomplished through a greater inclusion of non-traditional investments in their portfolios.
3534 Swiss Bankers Association | The 3rd contributor to occupational pension plansSwiss Bankers Association | The 3rd contributor to occupational pension plans

fund. The tolerable level of risk can largely be derived from the investment horizon
and liquidity requirements.
When establishing strategic asset allocation, it is necessary to take the future liabili-
ties and therefore the liabilities side of the balance sheet into account. Asset liability
management aims to achieve the greatest possible return at a given risk capacity
(often measured in terms of a pension fund’s coverage ratio), while at the same time
ensuring that all liquidity requirements can be met.
There is general consensus on the principles according to which assets must be
invested if (liquidity) constraints are set aside. For an optimal investment portfolio,
the conclusions reached by Nobel Prize winner Harry Markowitz in his portfolio
theory continue to form an important foundation for achieving the most efficient
portfolio possible. This kind of portfolio minimises the risk at a given return or max-
imises the return at a given level of risk.
Figures 5.1 and 5.2 illustrate the current expectations of the SBA «Occupational
Pension Plans» task force in terms of return, risk and correlation for the major asset
classes over the next ten years per year. The combination of investments with a low
correlation (green to yellow) increase the effect of diversification in a portfolio, as
the overall portfolio risk is lower than the sum of the risks of the individual asset
classes. This makes it possible for an investor to reduce the volatility of a portfolio’s
return and mitigate the portfolio risk. How future returns and thereby also correla-
tions and risks will effectively develop cannot be known beforehand.
-0.1 -0.1 0.1 0.1 0.1 0.3 0.0 0.0 0.4 0.3 0.4 1.0
0.0 0.0 0.5 0.6 0.2 0.7 0.1 0.1 0.6 0.4 1.0
0.0 0.0 0.4 0.4 0.0 0.4 0.1 0.0 0.4 1.0
0.0 0.0 0.6 0.6 0.1 0.7 0.1 0.0 1.0
0.0 -0.1 0.0 0.1 0.0 0.2 0.1 1.0
0.0 0.0 0.2 0.2 0.0 0.2 1.0
0.1 0.2 0.6 0.7 0.2 1.0
0.1 0.1 0.1 0.1 1.0
0.0 0.0 0.9 1.0
0.0 0.0 1.0
0.7 1.0
1.0
0 % 5 % 10 % 15 % 20 % 25 %
10 %
5 %
0 %
-5 %
Return
Risk
Bonds CHF
Bonds foreign currency (hCHF)
Equities Switzerland Equities global
Real estate Switzerland listed
Real estate global listed (hCHF)
Real estate Switzerland unlisted
Real estate global unlisted (hCHF) Hedge Funds (hCHF)
Private Equity (hCHF)
Infrastructure (hCHF)
Commodities (hCHF)
Fig. 5.1
Expected risk and return by asset class for the next 10 years
Source: The SBA «Occupational Pension Plans» task force, data as at 30 June 2016
hCHF = CHF hedged
1 2 3 4 5 6 7 8 9 10 11 12
1 – Bonds CHF
2 – Bonds foreign currency (hCHF)
3 – Equities Switzerland
4 – Equities global
5 – Real estate Switzerland listed
6 – Real estate global listed (hCHF)
7 – Real estate Switzerland unlisted
8 – Real estate global unlisted (hCHF)
9 – Hedge funds (hCHF)
10 – Private equity (hCHF)
11 – Infrastructure (hCHF)
12 – Commodities (hCHF)
The SBA «Occupational Pension Plans» task force, data as at 30 June 2016
Fig. 5.2
Matrix of expected correlations between asset classes for the next 10 yars
3736 Swiss Bankers Association | The 3rd contributor to occupational pension plansSwiss Bankers Association | The 3rd contributor to occupational pension plans
5 Optimal asset management at pension funds

Investment portfolios (Current portfolio) generally have potential for improvement.
The potential for optimisation that exists here can be exploited by pension funds
primarily by means of asset allocation (portfolio construction) in accordance with the
OOB2 guidelines. This shifts portfolios from Level 1 to the Current OOB2 efficient
frontier, thus optimising them. Without the OOB2 guidelines, additional potential
opens up for optimal asset allocation from Level 2 towards the Target efficient
frontier.
The second step in optimising asset management for occupational pension plans is
to further increase the attainable efficient frontier (shift from Current OOB2 efficient
frontier to Target). This requires a loosening or complete lifting of the OOB2 invest-
ment guidelines. In order for the potential that this creates to be utilised, however,
there must be a change in the way investors think.
5.3 Optimisation of asset allocation: empirical evidence
As the foundation of optimal asset management, Markowitz’ portfolio theory
should be the norm for pension funds. Credit Suisse examined to what extent pen-
sion fund portfolios apply this efficiency approach. The results (see Figure 5.4) clearly
5.2 Optimisation of asset allocation under OOB2
This study defines two different levels of potential for optimisation from a portfolio
theory perspective, which are illustrated in the risk-return diagram in Figure 5.3. The
first level relates to strategic asset allocation, which should aim to achieve the great-
est efficiency possible under the current regulatory requirements (Level 1: on and
below the «Current OOB2 efficient frontier»). The second level indicates the possible
optimised efficient frontier without OOB2 restrictions (Target efficient frontier).
Even though it is possible to exceed the limits in the OOB2 guidelines (see Figure 2.2)
with proper justification, in reality this potential is only rarely utilised. In practice, the
OOB2 guidelines represent the existing parameters and the efficient frontier within
these parameters (Current OOB2 efficient frontier). The best possible portfolios
within these parameters achieve this efficient frontier. Using the risk profile of the
pension funds as a basis, the objective must be to bring the portfolios as close as
possible to this efficient frontier (arrow 1). Not doing so means returns are forfeited
or unnecessary risk is taken.
The permitted exemption limits for asset classes, particularly for non-traditional
investments, are seldom utilised, despite the fact that if they were exploited, portfo-
lios would become more efficient. In practice, the actual efficient frontier is built
primarily using the traditional asset classes equities, bonds and Swiss real estate (see
Figure 3.6), and therefore lies below the «Current OOB2 efficient frontier».
Figure 5.3 shows a clear difference between the «Current portfolio» and the «Target
OOB2 portfolio». This can occur as a result of suboptimal asset allocation or portfo-
lio construction, for example due to the choice and weighting of asset classes,
foreign currency management or management style. The SBA «Occupational Pen-
sion Plans» task force works on the assumption that as a result of not utilising the
existing OOB2 exemption limits, in particular for alternative investments, portfolios
fall below the «Current OOB2 efficient frontier».
Return
Target portfolio
Target OOB2 portfolio
Current portfolio1
2
Current OOB2 efficient frontier
Target efficient frontier
Fig. 5.3
Source: The SBA «Occupational Pension Plans» task force, 2016
Portfolios and efficient frontiers
Level 1
Level 2
Risk
3938 Swiss Bankers Association | The 3rd contributor to occupational pension plansSwiss Bankers Association | The 3rd contributor to occupational pension plans
5 Optimal asset management at pension funds

However, everything is much simpler in theory than it is in practice for pension
funds, because the effective efficient frontier on which efficient portfolios lie is not
known in advance. The future return, the risk and the correlation between the
individual investments must be estimated. This is often done using historical data
spanning a longer period of time and in the hope that the risk-return ratio will
develop similarly in future. In a rapidly-changing market environment, however, this
approach is problematic. Due to the capital market expectations outlined in this
study, there are many indications that future returns on equities, bonds and real
estate are likely to be lower than in the past.
show that pension funds have potential for improvement in the portfolio construc-
tion process. This confirms the difference between the Current portfolio and the
Current OOB2 efficient frontier in Figure 5.3.
If and to what extent the OOB2 restrictions hinder optimal asset management (Level
2: Current OOB2 and Target efficient frontiers), is illustrated in Figure 5.5. The fact
that an unrestricted choice of asset classes and their allocations (including permitted
short selling) holds significant potential for optimisation is confirmed here as well.
Chart reflects a 10-year period.The expected returns are estimated using the risk premium approach.Volatilities and correlations are based on the period from 2004–2016.
Expected return in percent p.a.
1 % 2 % 3 % 4 % 5 % 6 % 7 % 8 %
2015
Risk(standard deviation)in percent p.a.
Fig. 5.4
Source: The SBA «Occupational Pension Plans» task force based on Credit Suisse analyses contained in «Schweizer Pensionskassen 2014»
The efficient frontier and pension fund portfolios
5 %
4 %
3 %
2 %
1 %
0 %
0 %
With OOB2 restrictions
Swiss pension fund portfolios 2006–2015
Fig. 5.5
Efficient frontiers and diversification effects
10 %
8 %
6 %
4 %
2 %
0 %
Chart reflects a 10-year period.The expected returns are estimated using the risk premium approach.Volatilities and correlations are based on the period from 2004–2016
Source: The SBA «Occupational Pension Plans» task force, based on Credit Suisse analyses contained in «Schweizer Pensionskassen 2014».
Return
Risk
Without restrictions
Without shortselling
With OOB2 restrictions
1 % 2 % 3 % 4 % 5 % 6 % 7 % 8 %0 %
4140 Swiss Bankers Association | The 3rd contributor to occupational pension plansSwiss Bankers Association | The 3rd contributor to occupational pension plans
5 Optimal asset management at pension funds

5.5 Secured liquidity thanks to a growing capital base
Due to their investment horizon, pension funds would seem predestined to optimally
exploit the return potential in financial markets. In reality, however, the situation is
not so clear-cut. The actual length of the investment horizon depends in particular
on liabilities and therefore on structural and pension fund-specific factors (e.g. age
structure and coverage ratio). This differs from pension fund to pension fund and
must therefore be assessed on an individual basis.
Asset liability management, which is the balancing of liabilities and the existing
assets, represents one of the characteristics of the 2nd Pillar that can significantly
restrict the investment horizon. The financial solidity of the employer plays a central
role here. For example, the pension funds of cyclical companies are subject to sub-
stantially greater workforce fluctuations than pension funds that are expected to
have a long-term or so-called perennial workforce. Generally speaking, the latter are
public sector employees. This reality can mean that the situation on the liabilities side
and thus also for the investment horizon can differ, and each pension fund must
therefore ultimately decide on the right balance between investment horizon and
safeguarding their assets.
A report by the Federal Council, however, highlights that for the pension fund
market as a whole, it expects that in the long-term (beyond 2035), the expenditures
of occupational pension plans will on average not exceed the employee and employ-
er contributions, and the capital of occupational pension plans will further accrue2.
Figure 5.6 shows the most probable scenario contained in the report by the Federal
Council, which explores a variety of possible developments. Migration flows are
important for understanding these figures. According to estimates, net migration in
2030 will be around 60,000 and in 2045 around 30,000 people per year (reference
scenario)3. The key insight provided by these forecasts is that for a majority of pen-
sion funds, liabilities are expected to represent little to no restrictions for liquidity,
and therefore little to no restrictions for a long investment horizon.
2 Federal Council report: Gesamtsicht über die Finanzierungsperspektiven der Sozialversicherungen bis 2035; November 2013.
3 BFS Aktuell: Szenarien zur Bevölkerungsentwicklung der Schweiz 2015–2045; June 2015.
5.4 Unused return potential due to lack of alternative investments
There are a number of reasons for the difference between the efficient frontier (incl.
the OOB2 restrictions) and today’s portfolios seen in Figure 5.3 (Level 1) and Figure
5.4. Efficient portfolios are characterised by their high share of investments with
particularly attractive risk-return ratios and correlation properties. These include
alternative investments, for example real assets such as real estate investments and
infrastructure, but also private equity (unlisted equity) and private debt (private
loans / bonds). Surprisingly, however, today’s already strict 15 percent cap on non-tra-
ditional investments is utilised only in the rarest of cases. This is often explained as
follows:
• low risk appetite on the part of chief investment officers
• lack of transparency and insufficient expertise for these investments
• high costs
• limited liquidity
Real estate is an asset class that Swiss pension funds typically invest in. They have
longstanding experience in this area, and are thus familiar with it. In contrast, there
is an absence of familiarity with non-traditional investments. One of the reasons for
this is probably the lack of investment opportunities within Switzerland itself, such as
a Swiss private equity market.
Increasing the allocation of non-traditional investments is a decisive factor when
looking to optimise pension fund portfolios. The opening of Level 2 illustrated in
figures 5.3 and 5.5 that creates potential for more efficient portfolios, among other
things through the elimination of the OOB2 restrictions, would likely have no effect
under the present circumstances. Only when pension funds recognise the potential
for improvement through changes in strategic asset allocation and the greater
inclusion of non-traditional investments does it make sense to raise the potential
efficient frontier.
4342 Swiss Bankers Association | The 3rd contributor to occupational pension plansSwiss Bankers Association | The 3rd contributor to occupational pension plans
5 Optimal asset management at pension funds

5.6 Ideal basis thanks to long investment horizon
The value of a long investment horizon can be highlighted by simulating investment
performance over various periods of time. Using Monte Carlo simulations4, figures
5.7 and 5.8 show that for both equity and bond-heavy portfolios, the risk of loss
decreases as the investment period progresses. While, for example, the equity-heavy
portfolio will generate annual returns above negative 1.2 percent after ten years
with a likelihood of 95 percent, after 30 years this figure becomes plus 1.2 percent
per year with the same level of probability. After around 16 years, the more aggres-
sive of the two portfolios achieves the statistical point in time when in all likelihood,
performance will not be negative. In comparison, the same point in time for the
more defensive portfolio is around 12 years.
However, a long investment period not only generally reduces the risk of an invest-
ment portfolio, it also leads to an alignment between more aggressive and more
defensive allocations. In the event of an extremely negative development (5 %
confidence interval), the bond-heavy portfolio performs significantly better at minus
5 percent after ten years than the equity-heavy portfolio at minus 11 percent. After
30 years, however, both portfolios exhibit almost the same return for their negative
scenarios (1.3 percent and 1.2 percent per year respectively).
4 The Monte Carlo simulation generates random asset developments based on assumed key risk and return figures. The simulation of a variety of developments provides an approximation of the bandwidth and thus the probability of future developments and final outcomes.
This revenue and expense account may not, however, be considered an assessment
of the financial situation of each individual pension fund. One way to determine
financial solidity is by looking at the coverage ratio. However, a coverage ratio of
above but also below 100 percent does not provide fundamental information re-
garding a pension fund’s liquidity situation. If sufficient liquidity is at hand, it can
make sense to take advantage of the liquidity premium by investing in illiquid invest-
ments in the interests of improving the coverage ratio, even in the case of a shortfall.
This, however, requires a long-term horizon, also as regards shortfall periods.
Fig. 5.6
Accounts and outlook for occupational pension plans 1995–2035
in CHF m 1995 2005 2015* 2020* 2025* 2030* 2035*
Revenues 40,807 49,805 69,228 77,408 83,965 90,450 97,090
Employee and em-ployer contributions
25,637 35,721 50,952 56,598 60,618 64,565 68,581
Government contributions
– – – – – – –
Investment returns** 15,171 13,894 18,131 20,666 23,202 25,740 28,364
Other revenues – 190 145 145 145 145 145
Expenditures 24,330 34,760 47,505 52,933 58,578 64,613 68,656
Social security benefits
14,139 25,357 35,666 41,165 47,561 54,422 58,793
Other expenditures 10,192 9,403 11,838 11,768 11,017 10,191 9,864
Balance 16,477 15,045 21,723 24,475 25,386 25,836 28,434
Capital 311,100 545,500 754,209 859,364 962,729 1,065,720 1,174,332
Historical data is based on current prices. Years with * refer to the base scenario A-17-2010 and are based on 2013 prices.
** no further breakdown
Source: Federal Council Report: «Gesamtsicht über die Finanzierungsperspektiven der Sozialversicherungen bis 2035»; November 2013.
4544 Swiss Bankers Association | The 3rd contributor to occupational pension plansSwiss Bankers Association | The 3rd contributor to occupational pension plans
5 Optimal asset management at pension funds
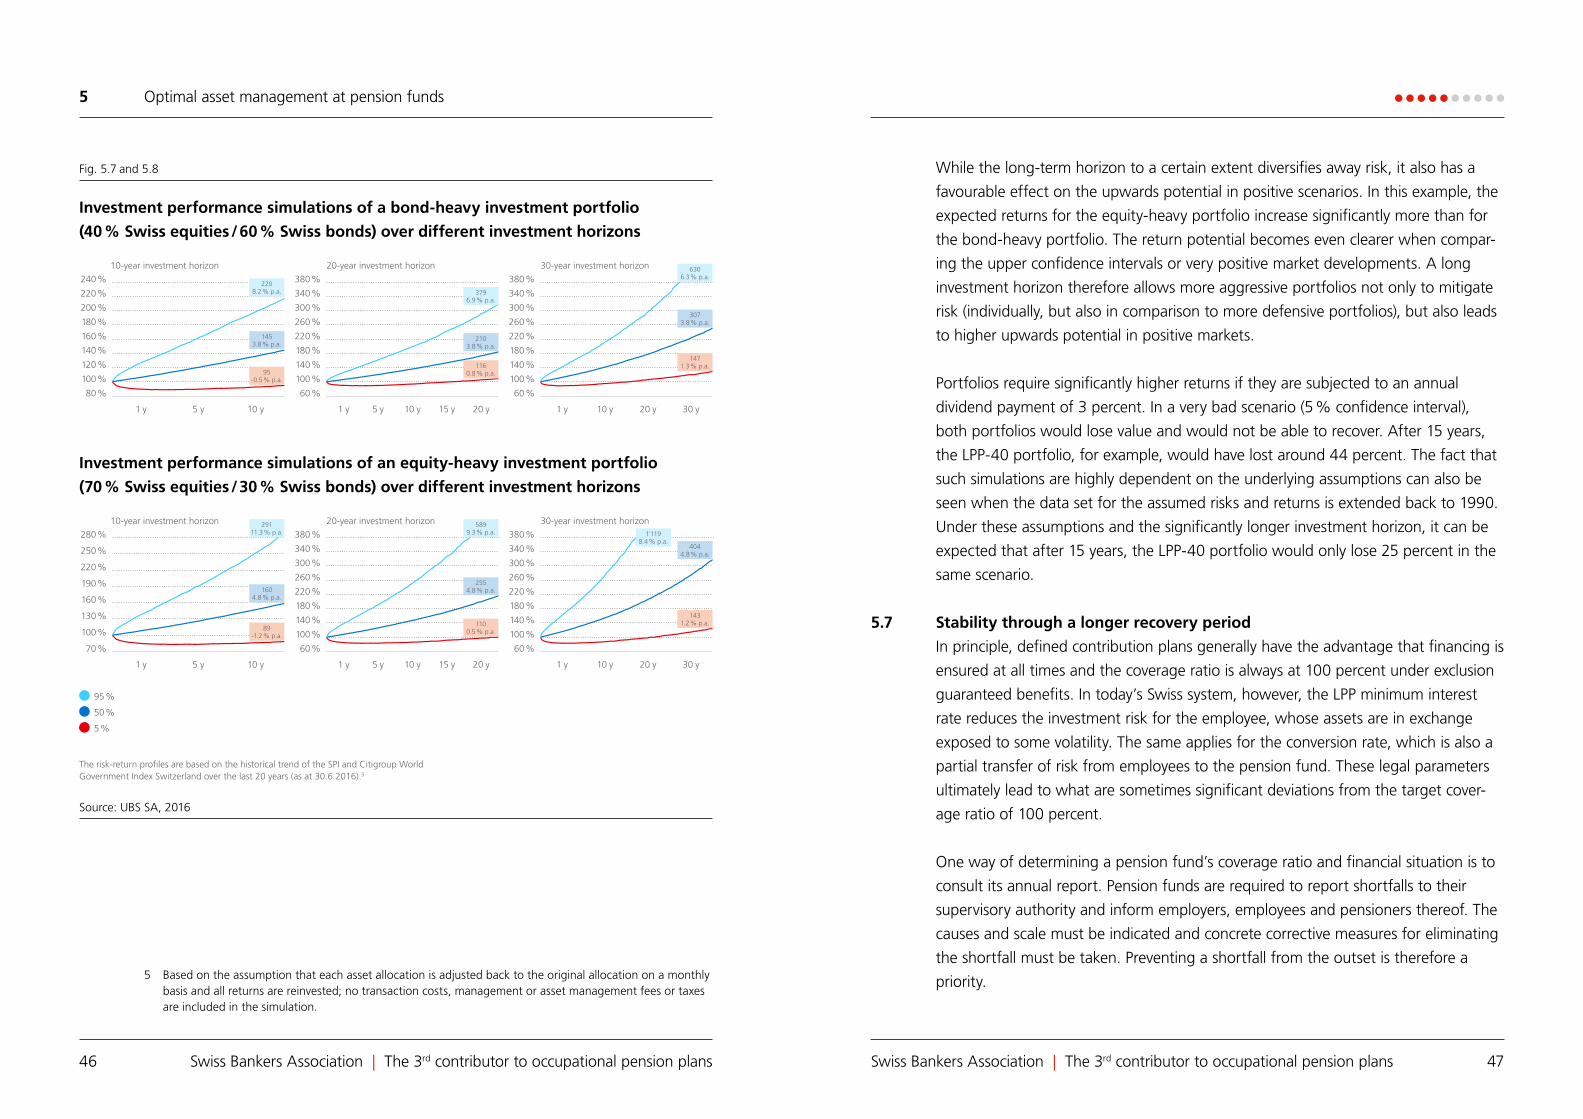
While the long-term horizon to a certain extent diversifies away risk, it also has a
favourable effect on the upwards potential in positive scenarios. In this example, the
expected returns for the equity-heavy portfolio increase significantly more than for
the bond-heavy portfolio. The return potential becomes even clearer when compar-
ing the upper confidence intervals or very positive market developments. A long
investment horizon therefore allows more aggressive portfolios not only to mitigate
risk (individually, but also in comparison to more defensive portfolios), but also leads
to higher upwards potential in positive markets.
Portfolios require significantly higher returns if they are subjected to an annual
dividend payment of 3 percent. In a very bad scenario (5 % confidence interval),
both portfolios would lose value and would not be able to recover. After 15 years,
the LPP-40 portfolio, for example, would have lost around 44 percent. The fact that
such simulations are highly dependent on the underlying assumptions can also be
seen when the data set for the assumed risks and returns is extended back to 1990.
Under these assumptions and the significantly longer investment horizon, it can be
expected that after 15 years, the LPP-40 portfolio would only lose 25 percent in the
same scenario.
5.7 Stability through a longer recovery period
In principle, defined contribution plans generally have the advantage that financing is
ensured at all times and the coverage ratio is always at 100 percent under exclusion
guaranteed benefits. In today’s Swiss system, however, the LPP minimum interest
rate reduces the investment risk for the employee, whose assets are in exchange
exposed to some volatility. The same applies for the conversion rate, which is also a
partial transfer of risk from employees to the pension fund. These legal parameters
ultimately lead to what are sometimes significant deviations from the target cover-
age ratio of 100 percent.
One way of determining a pension fund’s coverage ratio and financial situation is to
consult its annual report. Pension funds are required to report shortfalls to their
supervisory authority and inform employers, employees and pensioners thereof. The
causes and scale must be indicated and concrete corrective measures for eliminating
the shortfall must be taken. Preventing a shortfall from the outset is therefore a
priority.5 Based on the assumption that each asset allocation is adjusted back to the original allocation on a monthly basis and all returns are reinvested; no transaction costs, management or asset management fees or taxes are included in the simulation.
Fig. 5.7 and 5.8
Investment performance simulations of a bond-heavy investment portfolio
(40 % Swiss equities / 60 % Swiss bonds) over different investment horizons
10-year investment horizon
1 y
95-0.5 % p.a.
1453.8 % p.a.
2208.2 % p.a.
5 y 10 y
240 %
220 %
200 %
180 %
160 %
140 %
120 %
100 %
80 %
20-year investment horizon
1160.8 % p.a.
2103.8 % p.a.
3796.9 % p.a.
1 y 5 y 10 y 15 y 20 y
380 %
340 %
300 %
260 %
220 %
180 %
140 %
100 %
60 %
30-year investment horizon
1471.3 % p.a.
3073.8 % p.a.
6306.3 % p.a.
1 y 10 y 20 y 30 y
380 %
340 %
300 %
260 %
220 %
180 %
140 %
100 %
60 %
Source: UBS SA, 2016
10-year investment horizon 20-year investment horizon 30-year investment horizon
Investment performance simulations of an equity-heavy investment portfolio
(70 % Swiss equities / 30 % Swiss bonds) over different investment horizons
1 y
89-1.2 % p.a.
1100.5 % p.a.
1431.2 % p.a.
1604.8 % p.a.
2554.8 % p.a.
4044.8 % p.a.
29111.3 % p.a.
5899.3 % p.a. 1’119
8.4 % p.a.
5 y 10 y
280 %
250 %
220 %
190 %
160 %
130 %
100 %
70 %
1 y 1 y 10 y 20 y 30 y5 y 10 y 15 y 20 y
380 %
340 %
300 %
260 %
220 %
180 %
140 %
100 %
60 %
380 %
340 %
300 %
260 %
220 %
180 %
140 %
100 %
60 %
95 %
50 %
5 %
The risk-return profiles are based on the historical trend of the SPI and Citigroup World Government Index Switzerland over the last 20 years (as at 30.6.2016).5
4746 Swiss Bankers Association | The 3rd contributor to occupational pension plansSwiss Bankers Association | The 3rd contributor to occupational pension plans
5 Optimal asset management at pension funds

In addition to the extension of the recovery period, a fundamental change in think-
ing is required in order to encourage greater acceptance of temporary shortfalls on
the condition, however, that the problem is not due to an insufficient financial base
or a structural problem, but rather a shortfall caused by financial market develop-
ments. The assessment of a shortfall as well as the quality of the asset allocation
during a shortfall would continue to be the individual remit of the pension funds and
the occupational pension plan experts.
Today’s guidelines make sense insofar as the greatest priority must be to sustainably
guarantee occupational benefits. The intention behind the urgency created by the
five to seven years for eliminating a shortfall is certainly also to underscore the
importance of financially sound pension funds. However, upon closer inspection, it is
precisely this aspect that should be questioned. Because the term «sustainable»
would suggest taking a step away from the short-term need for control towards a
longer-term approach. A high level of professionalism and expertise are indispensa-
ble, fundamental requirements to this end.
The connection between this factor and asset allocation lies primarily in the risk that
as a result, pension funds limit their investment horizon more than necessary when
defining their asset allocation, and therefore also their risk capacity. This is likely also
one of the reasons why the pension funds’ investment portfolios are often not on,
but below the efficient frontier. Experience and the calculations of the SBA «Occupa-
tional Pension Plans» task force show that particularly in the first ten years, losses
should be expected for riskier investment portfolios (see Chapter 5.6). In practice,
however, it can be seen that a strong focus on the coverage ratio creates incentives
for preventing such losses and therefore also a potential coverage ratio shortfall. This
is an issue, because exploiting the return potential in financial markets is one of the
key elements of long-term oriented asset management.
Experience shows that shortfall periods or negative equity markets often lead to
active interventions in strategic allocation, which in the majority of cases results in
penalties in terms of target returns. Riskier investments are divested when a certain
level of (usually bigger) losses arise. This often happens at an inopportune time, prior
to or during a recovery. However, particularly in crisis situations, it is important to
continue to follow the strategic and tactical allocation and not make emotional-
ly-driven decisions.
Although there is no legal maximum duration for a shortfall, the LPP requires pen-
sion funds to introduce measures in such an event to resolve the issue within a
reasonable period of time. Pursuant to a Federal Council directive, this period is five
to seven, but maximum ten years6. However, the period over which 19 of 20 LPP-40
portfolios would record no losses is approximately 12 years (see Chapter 5.6). Based
on this benchmark, the current period for eliminating a shortfall is insufficient, in
particular taking into consideration the required target return, which is one of the
parameters used to determine the coverage ratio. A doubling of the five-to-seven
years currently envisaged for eliminating a shortfall would therefore be preferable
from an investment perspective.
6 «Weisungen über Massnahmen zur Behebung von Unterdeckungen in der beruflichen Vorsorge; 27. Oktober 2004.»
4948 Swiss Bankers Association | The 3rd contributor to occupational pension plansSwiss Bankers Association | The 3rd contributor to occupational pension plans
5 Optimal asset management at pension funds

The previous chapter examines how alternative investments (including real estate) are
an important component of portfolios with high risk-adjusted returns. The primary
reason for this lies in the low correlation to traditional investments and comparatively
attractive returns. These characteristics are generally well-known. Notwithstanding,
only a very small number of investors can benefit from them, because they either do
not have the necessary investment horizon or the discipline to stick to it. Thanks to
their risk capacity, long investment horizon and liquidity requirements (which are
probably generally overestimated), the necessary conditions are in place at the
majority of pension funds. They should therefore make increased efforts to put these
advantages to use.
At present, pension funds utilise less than half of the OOB2 allocation limit of 15
percent for alternative investments. As outlined, this is one of the primary reasons
for which portfolios are significantly below the potential efficient frontier. However,
an increase of the efficient frontier through an adjustment of the recommended
allocation under OOB2 alone is not likely to result in the permitted share of alterna-
tive investments actually being exploited. This chapter focuses on further measures
that could lead to a less rigid approach and a more objective attitude towards
alternative investments.
This study undertakes to redefine alternative investments to this end. This can be
achieved by highlighting, among other things, the risk and liquidity premia that exist
in the market for non-traditional investments in contrast to traditional investments.
This study also aims to demystify alternative investments based on the reality that
many non-traditional investments share the same risk factors as traditional asset
classes. Following the theoretical segment of this chapter, two practical examples are
provided. A typical pension fund portfolio is used to illustrate the historical and
expected added value that can be achieved through a diversification away from
traditional investments. At the end of the chapter, the idea that alternative invest-
ments hold many and often not evident risks is relativised by providing an example
of a clearly defined due diligence process.
6 Alternative investments: demystified and viewed from a new angleWhen it comes to alternative investments, Swiss pension funds are in a unique international position in two respects. The have by far the largest share of real estate investments measured in terms of their total investments. At the same time, however, they rank among the lowest in terms of investments in other categories of alternative investments. It should be added that according to financial terminology, real estate is considered an alternative investment due to its low liquidity. This opens up new perspectives, because it means that the pension funds already have decades of experience with illiquid investments, experience that can by all means be carried over to other categories. What is needed is a demystification of alternative investment in order to dispel the reigning unease about this segment, which results in both the loss of potential returns for the pension funds and unutilised diversification benefits. It goes without saying that sufficient expertise and a suitable structure are necessary for an expansion into this segment.
5150 Swiss Bankers Association | The 3rd contributor to occupational pension plansSwiss Bankers Association | The 3rd contributor to occupational pension plans
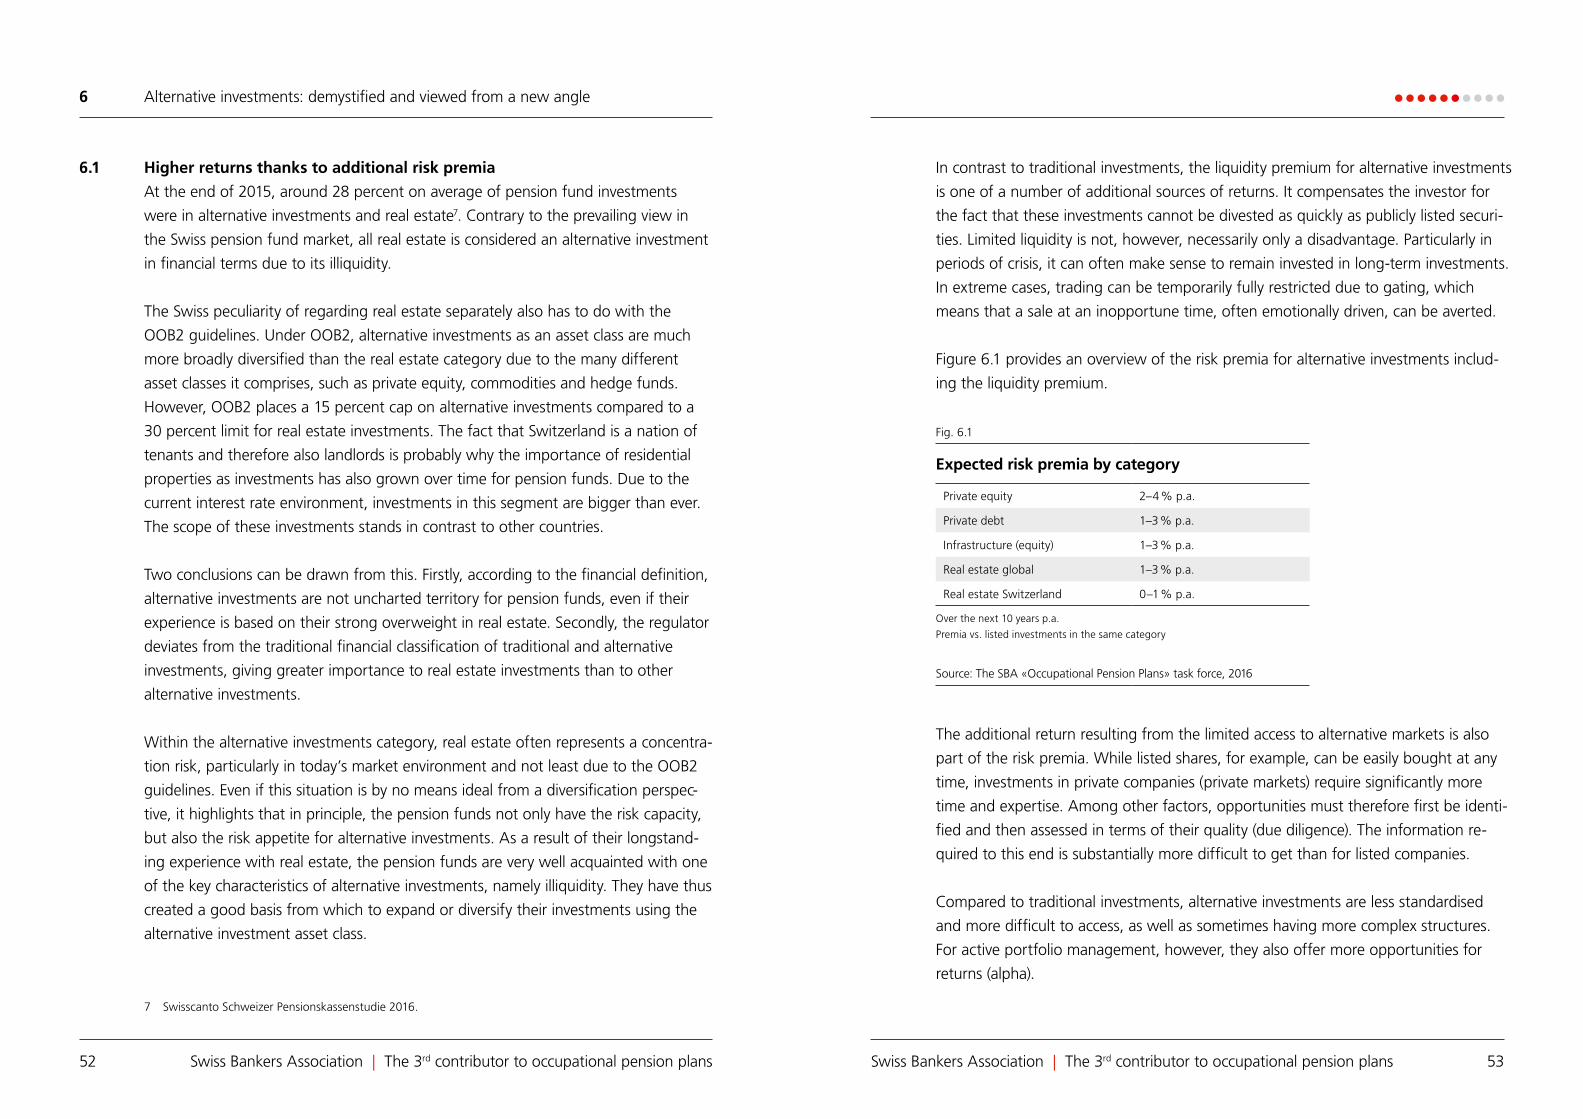
In contrast to traditional investments, the liquidity premium for alternative investments
is one of a number of additional sources of returns. It compensates the investor for
the fact that these investments cannot be divested as quickly as publicly listed securi-
ties. Limited liquidity is not, however, necessarily only a disadvantage. Particularly in
periods of crisis, it can often make sense to remain invested in long-term investments.
In extreme cases, trading can be temporarily fully restricted due to gating, which
means that a sale at an inopportune time, often emotionally driven, can be averted.
Figure 6.1 provides an overview of the risk premia for alternative investments includ-
ing the liquidity premium.
The additional return resulting from the limited access to alternative markets is also
part of the risk premia. While listed shares, for example, can be easily bought at any
time, investments in private companies (private markets) require significantly more
time and expertise. Among other factors, opportunities must therefore first be identi-
fied and then assessed in terms of their quality (due diligence). The information re-
quired to this end is substantially more difficult to get than for listed companies.
Compared to traditional investments, alternative investments are less standardised
and more difficult to access, as well as sometimes having more complex structures.
For active portfolio management, however, they also offer more opportunities for
returns (alpha).
6.1 Higher returns thanks to additional risk premia
At the end of 2015, around 28 percent on average of pension fund investments
were in alternative investments and real estate7. Contrary to the prevailing view in
the Swiss pension fund market, all real estate is considered an alternative investment
in financial terms due to its illiquidity.
The Swiss peculiarity of regarding real estate separately also has to do with the
OOB2 guidelines. Under OOB2, alternative investments as an asset class are much
more broadly diversified than the real estate category due to the many different
asset classes it comprises, such as private equity, commodities and hedge funds.
However, OOB2 places a 15 percent cap on alternative investments compared to a
30 percent limit for real estate investments. The fact that Switzerland is a nation of
tenants and therefore also landlords is probably why the importance of residential
properties as investments has also grown over time for pension funds. Due to the
current interest rate environment, investments in this segment are bigger than ever.
The scope of these investments stands in contrast to other countries.
Two conclusions can be drawn from this. Firstly, according to the financial definition,
alternative investments are not uncharted territory for pension funds, even if their
experience is based on their strong overweight in real estate. Secondly, the regulator
deviates from the traditional financial classification of traditional and alternative
investments, giving greater importance to real estate investments than to other
alternative investments.
Within the alternative investments category, real estate often represents a concentra-
tion risk, particularly in today’s market environment and not least due to the OOB2
guidelines. Even if this situation is by no means ideal from a diversification perspec-
tive, it highlights that in principle, the pension funds not only have the risk capacity,
but also the risk appetite for alternative investments. As a result of their longstand-
ing experience with real estate, the pension funds are very well acquainted with one
of the key characteristics of alternative investments, namely illiquidity. They have thus
created a good basis from which to expand or diversify their investments using the
alternative investment asset class.
7 Swisscanto Schweizer Pensionskassenstudie 2016.
Fig. 6.1
Expected risk premia by category
Private equity 2–4 % p.a.
Private debt 1–3 % p.a.
Infrastructure (equity) 1–3 % p.a.
Real estate global 1–3 % p.a.
Real estate Switzerland 0–1 % p.a.
Over the next 10 years p.a.
Premia vs. listed investments in the same category
Source: The SBA «Occupational Pension Plans» task force, 2016
5352 Swiss Bankers Association | The 3rd contributor to occupational pension plansSwiss Bankers Association | The 3rd contributor to occupational pension plans
6 Alternative investments: demystified and viewed from a new angle

6.2 Demystification of alternative investments
Alternative investments (excluding real estate) play a secondary role in the asset
allocations of today’s pension fund portfolios, despite a scarcity of investment op-
portunities and the insufficient expected returns. A survey conducted by Swisscanto
(see Figure 6.3), suggests that this is not going to change in the near future. Only
just under one-quarter of all pension funds surveyed expect to increase their share
of alternative investments in the coming years.
In Figure 6.4, the asset classes are broken down into four categories according to
their intended purpose. Debt and equity are categorized according to a company’s
forms of financing and are part of the liabilities side of the balance sheet. In a sec-
ond step, the capital is broken down into listed or private. This is important because
it represents the primary difference between traditional asset classes (listed or regu-
larly traded equities and bonds), and their alternative counterparts private equity and
private debt (unlisted or private). The distinction between listed and unlisted capital
can be illustrated by putting the two categories in the context of the different forms
Portfolio managers often have a variety of possibilities for outperforming the market
or peers. They can take advantage of opportunities such as the fact that pricing for
non-public markets can be less efficient, or the manager is subject to fewer restric-
tions, for example when financing debt. Such opportunities, however, also hold
significant risks and a professional selection of alpha-oriented investments is impor-
tant for achieving success. An example of how such a process could be carried out is
outlined in Figure 6.9.
Compared to traditional investments, alternative investments are more complex and
hold additional risks. One other fact, however, is just as important: as one would
expect, these additional risks are compensated for by the higher returns arising from
the additional risk and liquidity premia. In the end, the question that must be asked
is whether or not these investments can be of benefit to the investor. For example:
even if a private equity investment has a much higher Sharpe Ratio (risk-adjusted
return) than all other asset classes, a pension fund with a high percentage of pen-
sioners, a limited lifespan, high liquidity outflows and a lack of expert knowledge
about alternative investments cannot take advantage of such an investment.
Fig. 6.2
Risk premia by market
Risk premium public markets
Returns generated through public, easily accessible marketsExample: investments in the US equity market(S&P 500 stock index)
Risk premium alternative markets
Returns generated through alternative marketsLess accessible markets (private markets or hedge funds)Example: investments in private US companies
Risk premium (ill)iquidity
Returns generated through less liquid marketsInvestments with a long investment horizon and limited tradabilty Example: equity or debt-funded investments in infrastructure projects
Alpha Returns generated through the abilities of the portfolio managerSelection of the best investmentsExample: investments in the best private equity funds
Source: The SBA «Occupational Pension Plans» task force, 2016
Higher Lower Unchanged Don’t know
29
5 4
60
51
6
23
60 %
50 %
40 %
30 %
20 %
10 %
0 %
22
2015
in the coming years
Fig. 6.3
Source: Swisscanto Pensionskassen Studie 2016
Change in allocation to alternative investments
5554 Swiss Bankers Association | The 3rd contributor to occupational pension plansSwiss Bankers Association | The 3rd contributor to occupational pension plans
6 Alternative investments: demystified and viewed from a new angle

Listed companies, however, often move between the growth and saturation phases,
while investments in private companies are primarily made during the start-up phase
(venture capital8 in the case of equity), the initial growth phase that follows, and the
saturation / restructuring phase (buyout9 / distressed securities10).
Viewed in terms of their intended purpose, listed and unlisted investments within
the debt and equity categories should be considered largely equivalent, so irrespec-
tive of whether they are made on private markets (private equity or private debt) or
on the stock market (listed equities and regularly traded bonds). This line of thinking
becomes more important as the investment horizon increases, because it means that
the differentiating characteristics illiquidity and tradability become less relevant.
The next category in Figure 6.4 is so-called real asset investments, which include
investments in real estate and infrastructure. Strictly speaking, the latter also belongs
to «real estate investments» and includes roads, bridges, electricity plants, airports
and hospitals. Under OOB2, however, it is defined as a separate asset class. Like real
estate, infrastructure investments are necessary for the proper functioning of an
economy. Water, electricity, hygiene and healthcare are indispensable and form the
basis of every society’s hierarchy of needs. It therefore makes sense to round out the
real estate category with infrastructure investments and to designate the stand-
alone group «real asset investments», for example.
The last category comprises trading strategies (in particular hedge funds) as well as
commodities. As it is difficult to assign an economic purpose to these areas, they
should actually be regarded as the real alternative asset class(es). Further types of
investments that are not contained in the other categories could be ascribed to this
category. «Insurance-linked securities» would be such a sub-category. Theoretically,
this niche category could also be classified under debt or equity, because sooner or
later, almost every investment appears on a company’s balance sheet. In this case,
however, only a specific area of business (e.g. reinsurance for natural disasters) within
8 Start-up capital for a company that involves increased risk due to its early stage in the business life cycle.9 Takeover of a company or parts thereof either by taking a public company private or by means of a private
to private takeover. There are a number of different reasons for such a takeover, for example the new owners have better opportunities for raising or restructuring capital, existing potential for improving a company’s management or how the business is managed.
10 Securities or strategies that finance companies in economic difficulty either using equity, debt or both.
of financing used during the various stages in the life cycle of a company. Every
company is founded with private capital and then generally transitions into a period
of growth. From a certain size onwards, it is either traded on the stock market or
remains privately-owned. In principle, the typical life cycle from start-up to growth
and then saturation / restructuring, applies to both listed companies as well as com-
panies that remain privately-owned.
Fig. 6.4
Source: The SBA «Occupational Pension Plans» task force, 2016
Demystification of alternative investments
Current importance in pension fund asset management
Trading &Ressourcen
Realwerte
Private debt
Real estate an Infrastruktur
Private equity(venture & growth)
Hedge fund strategies and Commodities
Listed bonds
Listed equities
Private debt
Private equity(Buyout)
Low
Well-established
Timeline
Company value
Start-up GrowthSaturation /
restructuring
Equity
Debt
5756 Swiss Bankers Association | The 3rd contributor to occupational pension plansSwiss Bankers Association | The 3rd contributor to occupational pension plans
6 Alternative investments: demystified and viewed from a new angle

12 The asset classes are approximated with the following indices / portfolios (current portfolio / target portfo-lio): 31.5 % / 20 % SBI AAA-BBB TR, 11 % / 12 % Barclays Global Aggregate (hCHF), 0 % / 7.5 % Infrastruc-ture (hCHF), 17 % / 21 % MSCI World, 13.5 % / 7 % SPI, 1.5 % / 7.5 % CAPE US Private Equity Index (hCHF), 2 % / 5 % HFRI Fund of Funds Composite (hCHF), 10 % / 7.5 % KGAST Immo Schweiz TR (corresponds to half of the Swiss real estate share), 10 % / 7.5 % SIX Real Estate Funds (ditto), 1.5 % / 5 % NCREIF Property Index (hCHF), 3 % / 0 % Dow Jones UBS Commodity Index.
an individual sector (insurance) using special purpose vehicles is financed. It therefore
has too many characteristics for it to be assigned to one of the major categories
outlined.
The idea behind the classification of the asset classes as depicted in Figure 6.4 is that
seen from an economic standpoint, a large part of the investments currently desig-
nated as alternative are on par with traditional asset classes and therefore just as
relevant for the continuity of the economic cycle. Significant potential lies in better
understanding private debt, private equity, infrastructure and hedge fund strategies
in particular (see crosses), as this means that the opportunities in these areas can be
better leveraged in parallel with the remaining investments (see check marks).
This approach can help to make clear that the purpose of most alternative invest-
ments does not differ from traditional asset classes, in particular for the first three
categories debt, equity and real assets. However, what must be taken into consider-
ation is the fact that as investments, they have differing characteristics that give rise
to the risk premia outlined previously.
6.3 Optimisation potential for pension funds
Figure 6.5 quantifies the added value of non-traditional asset classes for a well-diver-
sified pension fund by comparing two portfolio allocations using the key risk-return
figures forecast by the SBA «Occupational Pension Plans» task force for the next ten
years per year. The «current» portfolio reflects the current average pension fund
asset allocation according to Swisscanto11. By means of comparison, the «target»
portfolio represents a recommendation for a broadly-diversified asset allocation with
a stronger focus on unlisted investments as well as real asset investments.
11 Swisscanto Schweizer Pensionskassenstudie 2016.
Fig. 6.5
Pension fund allocations today (current) and
recommended (target) with expected key figures12
Current portfolio Target portfolio
Bonds 42.5 % 32.0 %
Bonds CHF 31.5 % 20.0 %
Bonds foreign currency* 11.0 % 12.0 %
Equities 32.0 % 35.5 %
Equities Switzerland 13.5 % 7.0 %
Equities global 17.0 % 21.0 %
Private equity* 1.5 % 7.5 %
Real assets 21.5 % 27.5 %
Real estate Switzerland 20.0 % 15.0 %
Real estate global* 1.5 % 5.0 %
Infrastructure investments* 0.0 % 7.5 %
Trading & resources 4.0 % 5.0 %
Hedge funds* 2.0 % 5.0 %
Commodities 2.0 % 0.0 %
Total 100.0 % 100.0 %
Expected 10-year return p.a. 3.0 % 3.9 %
Expected 10-year volatility p.a. 5.5 % 6.1 %
Expected Sharpe Ratio 0.48 0.58
*CHF hedged
Source: The SBA «Occupational Pension Plans» task force, 2016
5958 Swiss Bankers Association | The 3rd contributor to occupational pension plansSwiss Bankers Association | The 3rd contributor to occupational pension plans
6 Alternative investments: demystified and viewed from a new angle

defensive current portfolio. This is attributable to the higher expected returns that
can be achieved with relatively low additional risk.
The current average target return of 3.4 percent15 is more likely to be achieved with
the target portfolio than with the current portfolio. While for the current portfolio,
the expected return is below the target return, the target portfolio benefits from its
expected return of almost 4 percent, in particular with the increase of the invest-
ment horizon.
If the asset management fees of 0.44 percent per year on the expected returns are
also included in the calculation, the expected net return of 2.5 percent on the cur-
rent portfolio is significantly below the target return of 3.4 percent. Even if the costs
for the target portfolio are likely to be higher than the 0.44 percent for traditional
pension fund portfolios due to the greater share of non-traditional investments, this
changes only very little in terms of the final outcome16: the likelihood of achieving
the target return with the target portfolio is significantly higher than with the cur-
rent portfolio.
The historical development of the current and target portfolios between 2000 and
2016 corresponds to the expected characteristics of the investments. Figures 6.7 and
6.8 illustrate the excess return generated by the target portfolio compared to the
current portfolio over different periods of time. Figure 6.7 shows that these excess
returns arising from the interest rate effect are generated primarily over a longer
period of time. The historical calculations, however, also highlight that the target
portfolio was subject to greater fluctuations (risk), which is also reflected in the
maximum losses during the respective periods. What must also be taken into ac-
count is that for the more illiquid investments, volatility as the measure of risk re-
flects the additional risk characteristics of the more illiquid investments only in part
(including limited tradability and possibilities for valuation).
15 Swisscanto Schweizer Pensionskassenstudie 2016.16 Examples of additional costs for the target portfolio due to the 13 % higher allocation in non-traditional
investments (assumed total expense ratio (TER) for traditional investments 0.25 %, TER for non-traditional investments 2.5 %, both average values): 13 % x 2.25 % = 0.29 % p.a.
The private equity, infrastructure and global real estate allocations have in particular
been increased in comparison to the current allocation. The allocation to Swiss
bonds and Swiss real estate were decreased. Although this results in a reduction of
more defensive asset classes, the expected risk for the target portfolio increases to a
lesser degree than the target rise in expected returns thanks to improved diversifica-
tion of the overall portfolio. This should result in a higher risk-adjusted return (Sharpe
Ratio) and thus a more efficient portfolio.
If one looks at the possible developments of the two portfolios over a longer period
of ten years as illustrated in Figure 6.6, it can be seen that, despite the higher level
of risk, even in a pessimistic development scenario (lower limit of the 90 % confi-
dence interval of a Monte Carlo simulation14, meaning 95 percent of all the other
scenarios considered are better), the target portfolio performs better than the more
13 The Monte Carlo simulation produces random investment scenarios based on assumed key risk and return figures. The simulation of a variety of developments provides an approximation of the bandwidth and thus the probability of future developments and final outcomes.
14 Based on the assumption that each asset allocation is adjusted back to the original allocation on a monthly basis and all returns are reinvested; no transaction costs, management or asset management fees or taxes are included in the simulation.
Fig. 6.6
Source: The SBA «Occupational Pension Plans» task force, 2016
Monte Carlo simulation for the next 10 years13, 14
5 years 10 years1 year
200 %
180 %
160 %
140 %
120 %
100 %
80 %
133 vs. 1453.0 % vs. 3.9 % p.a.
100 vs. 1060 % vs. 0.6 % p.a.
177 vs. 2005.9 % vs. 7.2 % p.a.
Current portfolio 5 %
Target portfolio 5 %
Current portfolio 50 %
Target portfolio 50 %
Current portfolio 95 %
Target portfolio 95 %
Target return (3.4 %)
6160 Swiss Bankers Association | The 3rd contributor to occupational pension plansSwiss Bankers Association | The 3rd contributor to occupational pension plans
6 Alternative investments: demystified and viewed from a new angle

The positive characteristics of unlisted, less liquid investments are confirmed both by
the expectations of the SBA «Occupational Pension Plans» task force as well as by
the historical simulations. Because the findings indicate that the additional risk
premia for investments from alternative markets do in fact pay off, it is very impor-
tant that this be taken into account when determining or optimising an investment
strategy.
6.4 Due diligence process for alternative investments
The investment triangle consisting of security, liquidity and return is the basis of all
asset management. It also forms the basis for the management of pension fund
assets in articles 50 to 52 of OOB2. The return potential of various investments has
been demonstrated using different examples. The fact that alternative investments
Fig. 6.8
Historical simulation of current and target pension fund
allocations since 2000; historical data12, 15
Current portfolio Target portfolio
31.12.2000 – 31.10.2016
Return p.a. 3.8 % 4.5 %
Risk p.a. 4.9 % 5.3 %
Sharpe Ratio 0.62 0.71
Maximum loss -18.3 % -21.1 %
31.10.2006 – 31.10.2016
Return p.a. 3.6 % 4.4 %
Risk p.a. 5.0 % 5.5 %
Sharpe Ratio 0.63 0.72
Maximum loss -18.3 % -21.1 %
31.10.2011 – 31.10.2016
Return p.a. 6.3 % 7.2 %
Risk p.a. 3.7 % 3.6 %
Sharpe Ratio 1.81 2.11
Maximum loss -3.1 % -3.2 %
Source: The SBA «Occupational Pension Plans» task force, 2016
Dec. 2000 Dec. 2010 Dec. 2015June 2003 June 2008 June 2013Dec. 2005
250 %
200 %
150 %
100 %
50 %
Fig. 6.7
Source: The SBA «Occupational Pension Plans» task force, 2016
Historical simulation of current and target pension fund allocations
since 2000; historical data12, 15
Target portfolio
Current portfolio
6362 Swiss Bankers Association | The 3rd contributor to occupational pension plansSwiss Bankers Association | The 3rd contributor to occupational pension plans
6 Alternative investments: demystified and viewed from a new angle
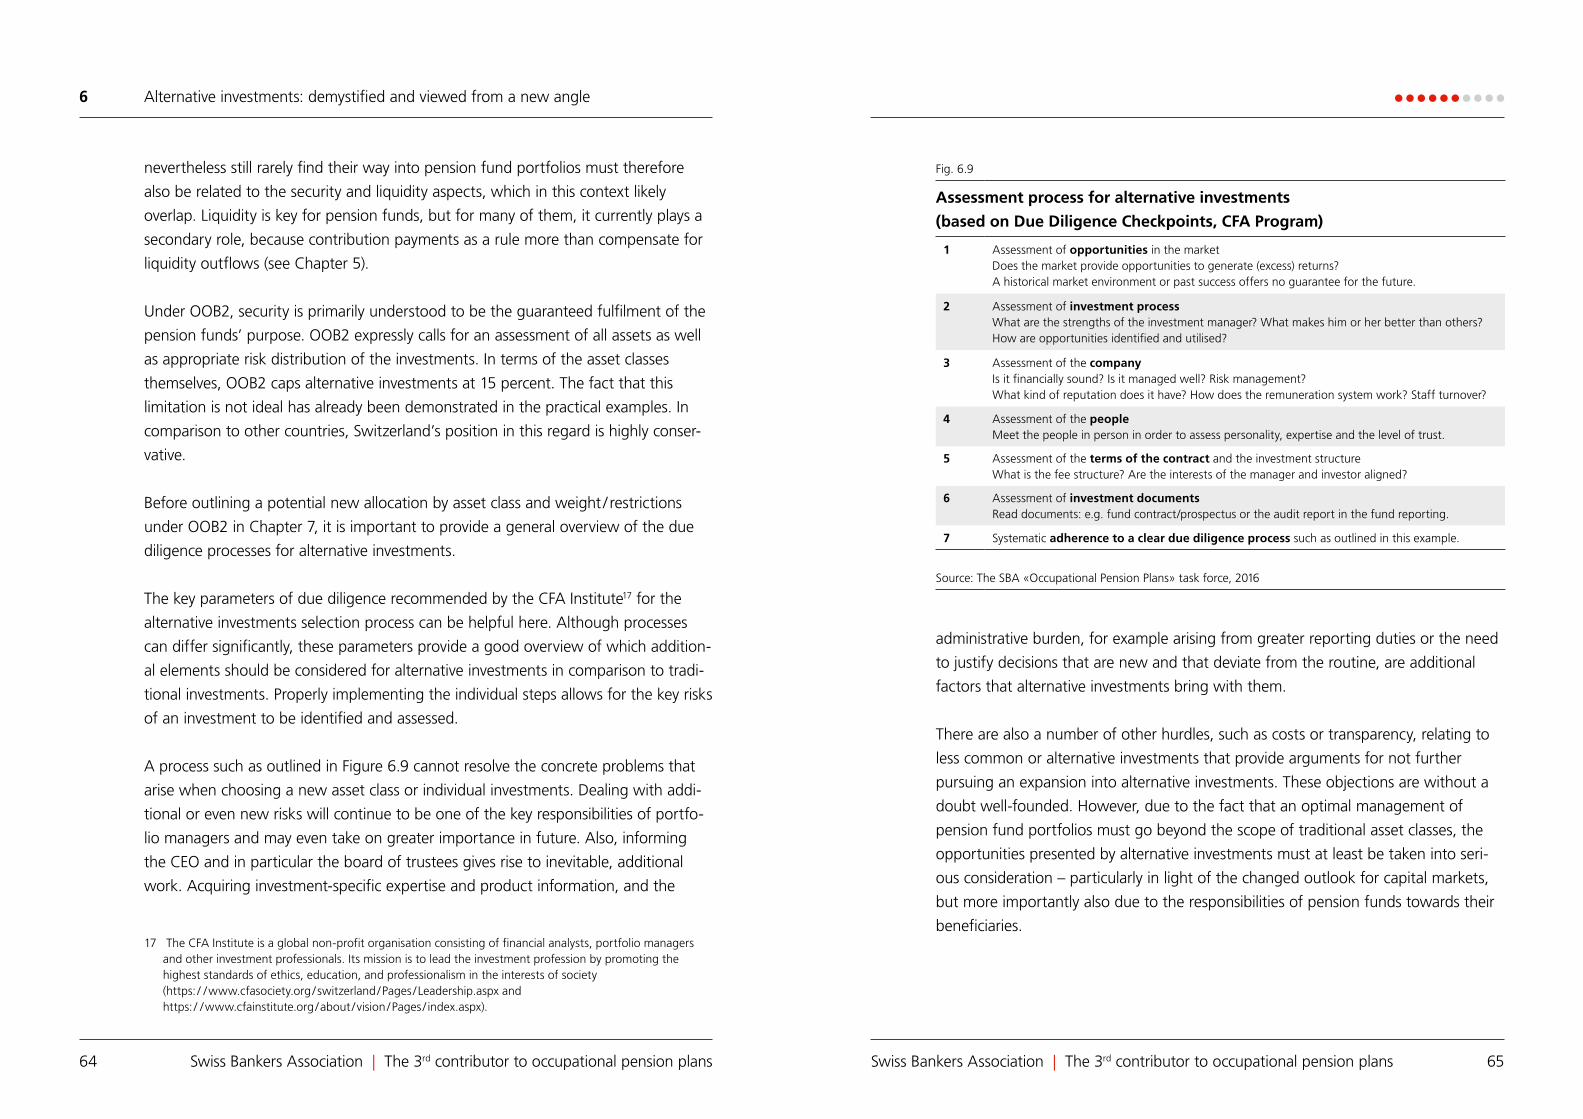
administrative burden, for example arising from greater reporting duties or the need
to justify decisions that are new and that deviate from the routine, are additional
factors that alternative investments bring with them.
There are also a number of other hurdles, such as costs or transparency, relating to
less common or alternative investments that provide arguments for not further
pursuing an expansion into alternative investments. These objections are without a
doubt well-founded. However, due to the fact that an optimal management of
pension fund portfolios must go beyond the scope of traditional asset classes, the
opportunities presented by alternative investments must at least be taken into seri-
ous consideration – particularly in light of the changed outlook for capital markets,
but more importantly also due to the responsibilities of pension funds towards their
beneficiaries.
nevertheless still rarely find their way into pension fund portfolios must therefore
also be related to the security and liquidity aspects, which in this context likely
overlap. Liquidity is key for pension funds, but for many of them, it currently plays a
secondary role, because contribution payments as a rule more than compensate for
liquidity outflows (see Chapter 5).
Under OOB2, security is primarily understood to be the guaranteed fulfilment of the
pension funds’ purpose. OOB2 expressly calls for an assessment of all assets as well
as appropriate risk distribution of the investments. In terms of the asset classes
themselves, OOB2 caps alternative investments at 15 percent. The fact that this
limitation is not ideal has already been demonstrated in the practical examples. In
comparison to other countries, Switzerland’s position in this regard is highly conser-
vative.
Before outlining a potential new allocation by asset class and weight / restrictions
under OOB2 in Chapter 7, it is important to provide a general overview of the due
diligence processes for alternative investments.
The key parameters of due diligence recommended by the CFA Institute17 for the
alternative investments selection process can be helpful here. Although processes
can differ significantly, these parameters provide a good overview of which addition-
al elements should be considered for alternative investments in comparison to tradi-
tional investments. Properly implementing the individual steps allows for the key risks
of an investment to be identified and assessed.
A process such as outlined in Figure 6.9 cannot resolve the concrete problems that
arise when choosing a new asset class or individual investments. Dealing with addi-
tional or even new risks will continue to be one of the key responsibilities of portfo-
lio managers and may even take on greater importance in future. Also, informing
the CEO and in particular the board of trustees gives rise to inevitable, additional
work. Acquiring investment-specific expertise and product information, and the
17 The CFA Institute is a global non-profit organisation consisting of financial analysts, portfolio managers and other investment professionals. Its mission is to lead the investment profession by promoting the highest standards of ethics, education, and professionalism in the interests of society (https: / / www.cfasociety.org / switzerland / Pages / Leadership.aspx and https: / / www.cfainstitute.org / about / vision / Pages / index.aspx).
Fig. 6.9
Assessment process for alternative investments
(based on Due Diligence Checkpoints, CFA Program)
1 Assessment of opportunities in the marketDoes the market provide opportunities to generate (excess) returns?A historical market environment or past success offers no guarantee for the future.
2 Assessment of investment processWhat are the strengths of the investment manager? What makes him or her better than others?How are opportunities identified and utilised?
3 Assessment of the companyIs it financially sound? Is it managed well? Risk management?What kind of reputation does it have? How does the remuneration system work? Staff turnover?
4 Assessment of the peopleMeet the people in person in order to assess personality, expertise and the level of trust.
5 Assessment of the terms of the contract and the investment structureWhat is the fee structure? Are the interests of the manager and investor aligned?
6 Assessment of investment documentsRead documents: e.g. fund contract/prospectus or the audit report in the fund reporting.
7 Systematic adherence to a clear due diligence process such as outlined in this example.
Source: The SBA «Occupational Pension Plans» task force, 2016
6564 Swiss Bankers Association | The 3rd contributor to occupational pension plansSwiss Bankers Association | The 3rd contributor to occupational pension plans
6 Alternative investments: demystified and viewed from a new angle

As the person in charge, what can you do for your approximately 12,000
beneficiaries? Are there measures for improvement that you can intro-
duce on your own account, in other words, without the involvement of
business and the government?
Our 2nd Pillar is subject to many political parameters: the minimum interest rate,
convergence rate, coverage ratio and the investment guidelines. Changing these
is difficult. In light of these restrictions, as managing director I therefore place a
strong focus on asset management in order to take the best possible advantage
of the financial markets as the 3rd contributor.
In concrete terms, I am concerned that the traditional asset classes that the
pension funds invest in, so equities, bonds and Swiss real estate, will no longer
generate high enough returns to achieve our required net 2.8 percent annual
target return. A substantial addition of alternative sources of returns can and
must be part of the solution to the extent that the liquidity requirements allow
for this and the necessary investment horizon exists. For me it’s clear that with a
recommended upper limit of 15 percent for alternative investments, the OOB2
guidelines are no longer in line with the times. What’s more is that asset classes
such as private equity, infrastructure investments or selected hedge fund strate-
gies, for example, have become far too important to be tossed together into
one big pot labelled «alternative investments».
In your view, what are the advantages of alternative investments?
What are the disadvantages?
Alternative investments are usually unlisted investments, which means they
cannot be traded on publicly accessible markets. This limitation is compensated
for in the long-term by higher returns. The limited tradability also has a positive
side effect, which is that these investments are subject to less fluctuation than
listed securities. This has a positive effect on the risk-return characteristics of the
overall portfolio.
Interview with Martin Roth, Managing Director of the Manor pension fund
«The OOB2 guidelines are no longer up to date»
SBA: Mr. Roth, in your opinion, what are the biggest challenges right
now for the 2nd Pillar overall and for the individual pension funds?
Martin Roth: The demographic developments with the baby boomer genera-
tion and the continuous rise in life expectancy are without a doubt very big
challenges. This is compounded by the fact that we cannot assume that future
financial and capital market returns will solve the problem. On the contrary, I
expect investments to contribute less in the coming years than what we have
been accustomed to until now.
6766 Swiss Bankers Association | The 3rd contributor to occupational pension plansSwiss Bankers Association | The 3rd contributor to occupational pension plans
6 Alternative investments: demystified and viewed from a new angle

OOB2 calls for the conscientious management of pension assets. In my opinion,
that means not only that liquidity and security aspects have to be observed, but
also that pension benefits must be secured sustainably. Pension funds are
responsible for ensuring that the return potential in financial markets is exploited
for their beneficiaries.
Better incentives on the OOB2 side are also very important. The big pot of
alternative investments is often still taboo. Clarity and transparency could dis-
entangle the contents of this pot, for example by separating private investments
along the lines of traditional investments or even categorising them under
traditional investments and giving them higher limits. In my opinion, this would
send a very strong signal.
About Martin Roth
Martin Roth has been responsible for the Manor pension fund for three years.
Combined with his earlier role as a portfolio manager at UBS, he has over 20
years of experience in asset management. Roth is also a financial analyst and
portfolio manager / CIIA® (AZEK). He completed his Diploma of Advanced Stud-
ies in Pension Fund Management at the Lucerne University of Applied Sciences
and Arts, and his CAS in General Management at the University of St. Gallen.
About the Manor pension fund
The Manor pension fund manages around CHF 1.7 bn in assets. Its coverage
ratio is currently 111 percent and has increased an average of 2 percent over the
last five years. The pension fund covers 8,900 employees and 3,300 pension
recipients. The average age of employees is 41. As at 30.9.2016, the asset alloca-
tion consisted of 14.5 percent fixed income investments, 31 percent equities, 26
percent real estate and 16.5 percent alternative investments.
These investments also have the advantage that the investment characteristics
are better reflected and are not subject to the influences of a listing on the
stock exchange. This gives rise to attractive correlation properties in addition to
lower volatility, both compared to traditional as well as other alternative invest-
ments.
However, many pension funds are concerned about the limited tradability and
liquidity. This is not a problem in our case, as we manage and monitor the
overall liquidity of the assets systematically. We also hold a large share of liquid
investments that could be divested at any time.
Despite the difficult framework conditions and the advantages of alter-
native investments, the latter are currently generally of secondary
importance for pension funds. Why is this?
The bad experiences in the past are probably still an issue. As a result, there is a
lot of scepticism towards more complex products with higher costs. Also, it’s
easier to justify negative developments in traditional asset classes than it is for
individual hedge fund strategies or private equity fund of funds, for example.
The fact that the regulator throws alternative investments into one collective pot
and puts a 15 percent cap on them is probably also not very helpful in terms of
encouraging trust.
What will it take to change or improve the status quo?
First and foremost, there needs to be awareness about the fact that investment
returns make an important contribution to the growth of the 2nd Pillar assets.
They play a key role in helping to overcome the problems created by the struc-
tural changes. And these investment returns, at least in part, are in the hands of
the pension funds themselves.
6968 Swiss Bankers Association | The 3rd contributor to occupational pension plansSwiss Bankers Association | The 3rd contributor to occupational pension plans
6 Alternative investments: demystified and viewed from a new angle

The necessary change in thinking due to current developments put forward here
means that in a further step, an adjustment of OOB2 is necessary. The support of
the government and business is an important prerequisite for this. The broader
guidelines proposed in this chapter can serve as a basis to this end for OOB2 stake-
holders.
Similar proposals have been submitted on several occasions in the past by the gov-
ernment and business, and can be used as points of reference. The recommenda-
tions put forward in this study that are dependent on political decisions are likely to
find support at least in these circles.
7.1 A proposal for revised OOB2 guidelines
Under OOB2, investments that cannot be attributed to the typical asset classes
equities, bonds or real estate are categorised as alternative investments. At present,
these may not exceed 15 percent of total assets. This results in the following two key
specifications: on the one hand, which investments are permitted and how they are
categorised (OOB2, Art. 53), and on the other hand, their respective limits (OOB2,
Art. 55). Both of these elements are important because they are key for the strategic
allocation of a portfolio and therefore have the greatest influence on the success of
asset management.
Figure 7.1 presents a basis for realigning articles 53 and 55 OOB2. These are orien-
tated along the categorisation of asset classes proposed in Chapter 6.2. The recom-
mended amendments are based on previously outlined measures according to which
a) asset classes are categorised as debt, equity, real asset investments, and trading &
resources (reorganisation within Article 53 OOB2). These are then broken down in
a way that brings them closer to their listed counterparts, thus creating a greater
alignment with the intended financial purpose of the investment and
b) the category limits (Article 55 OOB2) are amended or relaxed in line with the
adjustments in a).
7 Better performance possible with an OOB2 revisionAlthough the investment guidelines under OOB2 offer as yet unexploited potential for improved efficiency for the majority of pension fund portfolios, amendments to the guidelines are urgently needed in light of the growing need for higher returns. Such amendments should focus on more liberal parameters for the use of non-traditional investments. To this effect, the following chapter proposes and examines a broadened version of the guidelines contained in OOB2.
The earlier chapters on Markowitz’ portfolio theory and alternative investments
highlight the optimisation potential for the pension funds that would allow them to
make better use of the financial markets as the 3rd contributor. Most of these oppor-
tunities for improvement can be assessed and implemented with a reasonable
amount of effort. The proposed measures can to a large extent be implemented by
the pension funds without the involvement of the government or business, as they
generally relate only to portfolio management.
This study has shown that in portfolio construction, there is a level that can be
achieved under the OOB2 guidelines and a second level that exceeds this (see Chap-
ter 5). In a next step, the key differences and similarities between traditional and
non-traditional investments were outlined and an attempt was made to demystify
alternative asset classes. This step is important because a broadening of the OOB2
guidelines only makes sense if the room for manoeuvre that is created is also utilised.
A change in thinking would already be beneficial today, because many pension
funds could construct their portfolios in a more efficient manner under the existing
OOB2 parameters.
7170 Swiss Bankers Association | The 3rd contributor to occupational pension plansSwiss Bankers Association | The 3rd contributor to occupational pension plans

commodities. The infrastructure category and real estate would be classified together
under «real asset investments», for example under the letter c), which today covers
only real estate. As a final example, private equity would be accepted under d) «equi-
ty». At present, participations in unlisted companies are categorised as «alternative
investments» under e).
Figure 7.1 implies further adjustments to OOB2 similar to the previous examples.
However, a more detailed exploration thereof is beyond the scope of this study.
The objective is nevertheless clear: more room for manoeuvre will give pension funds
the opportunity to generate higher returns on their portfolios as well as improve
diversification (Chapter 5). This is achieved primarily through the addition of non-tradi-
tional investments as a result of their attractive investment characteristics (Chapter 6).
Under the proposed new guidelines, a portfolio could theoretically consist of 60
percent investments that at present are designated as alternative investments (e.g.
15 % private debt, 15 % private equity, 15 % infrastructure, 15 % hedge funds). This
may appear to be going too far, and it is indeed an extreme example. However, even
though it could be absolutely viable, pension funds would hardly be able to imple-
ment such an allocation immediately. The revised exemption limits have an added
advantage that they would send a signal that would promote equality between
traditional and what are today alternative investments.
Adjusting the investment guidelines has been discussed for some time, and due to the
situation in capital markets and the developments in the 2nd Pillar, these discussions
are intensifying. Opinions about the elimination of the guidelines are increasingly
moving in the direction of a strong Prudent Investor Rule (see Chapter 8), that is to
say, a call for greater direct responsibility for the pension funds18. This proposal for
restructuring OOB2 is an attempt to initiate an important intermediate step in order
to reduce the investment restrictions step-by-step.
18 For example Roland Kriemler: Anlagestiftungen: Investieren nach BVV2 und ASV (Investment foundations: investing according to OOB2 and the Ordinance on Investment Foundations); 2016.
The restrictions for single positions under OOB2 (Article 54), which would be the
final step in the amendments to the investment guidelines, are not explored here, as
they are of secondary importance for strategic asset allocation and could largely be
adopted in their current form.
A realignment based on Figure 7.1 would have concrete implications for the OOB2
guidelines, in particular for Article 53. For example, letter e) of Article 53 «alternative
investments» would have to be redefined as «trading & resources», and of its current
categories, would then only contain hedge funds, insurance linked securities and
Figure 7.1
Proposal for an update to the categorisation and limits for investments in
accordance with OOB2
Sub-investment classes Limit OOB2- Articlenew existing
Debt 100 % –
Listed Bonds CHF and foreign currency 100 % 100 % 55
PrivateMortgage titles CHPrivate debt (new)
50 %15 %
50 %–*
55 a.55 d.
Equity 75 % –
Listed Equities domestic and foreign 75 % 50 % 55 b.
Private Private equity (new) 15 % –* 55 d.
Real asset investments (equity capital) 50 % –
Listed Real estate domestic and foreign 50 % 30 % /10 % 55 c.
PrivateReal estate domestic and foreignInfrastructure (new)
50 %15 %
30 %/10 % –*
55 c.55 d.
Trading & resources 15 % –
TradingResourcesOther
Hedge fundsCommoditiesInsurance linked securities etc.
–––
15 %*15 %*15 %*
55 d.55 d.55 d.
Unhedged foreign currencies 30 % 30 % 55 e.
*Asset class subject to the current total 15 % limit for alternative investments under OOB2.
Source: The SBA «Occupational Pension Plans» task force, 2016
7372 Swiss Bankers Association | The 3rd contributor to occupational pension plansSwiss Bankers Association | The 3rd contributor to occupational pension plans
7 Better performance possible with an OOB2 revision

The chart shows the endowment fund’s asset allocation in recent years. In
1985, the share of domestic (US) equities and bonds was 80 percent. Today
these account for only 12.5 percent. In contrast, Yale significantly increased
some of the categories that it calls Foreign Equity, Natural Resources (e.g. oil,
gas, wood and coal), Leveraged Buyouts (debt financed, often private company
takeovers), Venture Capital (financing for start-ups) Absolute Return (primarily
event-driven and value-driven strategies that generate returns through mergers,
the restructuring of companies or undervalued companies, among others) and
Real Estate.
The long-term asset allocation target for illiquid investments is currently around
50 percent. Over 90 percent of the allocation targets equity-like returns. The
share of fixed income investments as at June 2015 was only 4.9 percent19.
19 The Yale Investments Office: The Yale Endowment 2015
Case study: best in class – the Yale Investments Office
This study highlights numerous advantages of adding or increasing the alloca-
tion of alternative investments in a traditional pension fund portfolio. The
authors are, however, aware that this measure cannot be the sole solution for
the situation currently faced by the 2nd Pillar, and that there are certainly also
reasons that speak against this asset class. Especially important is awareness of
the risk factors, particularly in comparison to traditional investments.
Ultimately, however, this study seeks to find possibilities for optimising asset
management, with the final goal of increasing the expected returns of current
pension fund portfolios. Alternative investments are definitely one of those
possibilities, in particular for pension funds with a long investment horizon. The
fact that pension funds in other countries are already benefitting significantly
from alternative investments is explained in Chapter 9.
A useful comparison can be made with investment foundations of a perennial
nature, and which, in addition to seeking to preserve value, may also have to
generate income for specific purposes. These characteristics make such founda-
tions comparable to pension funds in the most important aspects.
Many of the best-known foundations of this type are affiliated with top-ranking
universities around the world and therefore also have enormous financial and
investment expertise. Yale University in the US has one of the most successful of
these endowment funds. As at mid-2015, the fund managed over USD 25 bn
and generated returns over the last ten years up to and including June 2015 of
10 percent per year. In other words, the endowment fund’s assets increased by a
factor of around 2.6 despite the financial crisis. During the same period, global
equities (MSCI World, in USD) achieved 7 percent annual returns and global
bonds (Barclays Global Aggregate, in USD) 3.5 percent per year, presumably with
significantly higher risk (volatility).
Fig. 7.2
Source: The Yale Investments Office: The Yale Endowment 2015
Change in asset allocation Yale Endowment Fund since 1985
1985 1990 20152010200520001995
100 %
90 %
80 %
70 %
60 %
50 %
40 %
30 %
20 %
10 %
0 %
Leveraged Buyouts
Venture Capital
Natural Resources
Real Estate
Absolute Return
Foreign Equity
Domestic Equity
Fixed Income
Cash and Equivalent
7574 Swiss Bankers Association | The 3rd contributor to occupational pension plansSwiss Bankers Association | The 3rd contributor to occupational pension plans
7 Better performance possible with an OOB2 revision

The Federal Council saw no need to make any changes in any of these instances.
The arguments were identical in each case, and it purported that on the one hand,
the current guidelines provide sufficient room for manoeuvre for investments in the
asset classes outlined and on the other hand, the risks were too big to justify giving
the asset classes greater significance.
Calls for amendments are increasingly being made, however, by business and by
pension funds themselves23. It is likely that this pressure will increase, and, depending
on financial market developments, even more than expected. The issue is therefore
timely and offers plenty of material for discussion. The hope is that occupational
pension plan stakeholders will assert themselves in a coordinated manner, with the
result that the framework conditions for asset management are improved as soon as
possible.
23 See Case study: Interview with Martin Roth, Managing Director of the Manor pension fund.
According to Yale, the current allocation has a higher current and expected
return while maintaining the same level of volatility as in 1985 due to the higher
return potential that at the same time has improved diversification characteris-
tics. In concrete terms, the Yale portfolio managers expect a long-term return of
6.7 percent per year at a volatility of 13.3 percent per year.
The example of the Yale Endowment Fund in the US should not and can in no
way be applied one-to-one to the Swiss pension funds. Differences in terms of
mentality, specific characteristics of the pension fund markets and the situations
of the individual pension funds mean that the possibility for a generalisation is
limited. This comparison should, however, provide an impetus to place increased
focus on addressing a departure from traditional investments towards alterna-
tive asset classes and more importantly, to do so in a timely manner. The Yale
example shows that the world’s best portfolio managers already initiated this
process some time ago.
7.2 Support required from business and government
A fundamental change in the investment mentality and an adjustment of the
OOB2 guidelines require the support of business and the government. Although
the investment guidelines are primarily governed at the ordinance level and
amendments through the Federal Council would be relatively easy to initiate,
only moderate changes have been undertaken to date.
The last OOB2 revision was conducted in 2014. Although the role of alternative
investments was discussed, no major changes were made, as the primary focus
of the revision was risk. There have been a number of motions put forward by
members of the parliament in recent years to promote investments in unlisted
companies20, infrastructure investments21 and venture capital (private equity)22.
20 Motion put forward on 9.6.2016, Claude Béglé: Investitionen von Pensionskassen in nichtbörsenkoti-erte Unternehmen (Pension fund investments in unlisted companies).
21 Motion put forward on 23.9.2015, Thomas Weibel: Infrastrukturanlagen für Pensionskassen attrakti-ver machen (Making infrastructure investments more attractive for pension funds).
22 Motion put forward on 12.12.2013, Konrad Graber: Langfristanlagen von Pensionskassen in zukunft-strächtige Technologien und Schaffung eines Zukunftsfonds Schweiz (Long-term investments by pension funds in viable future technologies and creation of a venture capital fund for Switzerland).
7776 Swiss Bankers Association | The 3rd contributor to occupational pension plansSwiss Bankers Association | The 3rd contributor to occupational pension plans
7 Better performance possible with an OOB2 revision

8.1 The concept of pension fund portfolio management using the US and the
UK as an example
Over the last few decades, both the US and the UK have amended the laws for the
management of pension fund assets in line with the changed conditions. As part of
this process, they did away with specific investment guidelines and restrictions and
replaced them with rules of conduct (Prudent Investor Rule). These rules of conduct
apply for the managers of the pension funds as well as any external asset managers
working for them.
In the US, for example, the fiduciary duties of pension fund committees are set out
in the Employee Retirement Income Security Act (ERISA). Complementary to this is
the Uniform Prudent Investor Act (UPIA), which governs asset management. In the
UK, pension funds are governed by the Pension Fund Law, while foundations are
subject to Trust Law. The guidelines in place for pension fund committees set out
rules of conduct according to which their responsibilities must be met and duties
carried out.
The Prudent Investor Rule is based on the concept that the people responsible for
investing the assets of the pension fund manage these as if they were their own.
The guidelines contained in the regulation therefore focus on the quality of the
organisational and operational structures of the pension funds and less on the actual
product. FINMA’s efforts for the regulation of Swiss pension funds are also moving
in this direction.
8 Prudent Investor Rule as the next (but one) stepThe quantitative regulation of investments according to OOB2 that has applied since LPP entered into force is no longer up to date. The US, the UK and other countries have amended their guidelines to the changed conditions and more closely aligned them with the Prudent Investor Rule. The measures for optimisation recommended in this study take a similar approach. Defining an optimal strategic asset allocation requires a fundamental change in thinking and increased freedoms with regards to OOB2. Fewer restrictions and more room for manoeuvre, however, also mean more responsibility. OOB2 does contain such elements, but the guidelines should be fundamentally expanded in terms of responsibilities and the necessity for more efficient portfolios.
The regulatory framework for pension fund asset management continues to build for
the most part on listing the permitted investments, setting investment restrictions and
safeguarding these restrictions. According to the explanations for the revision of
articles 49 to 59 OOB2, which came into force on 1 January 2009, a stronger empha-
sis on individual responsibility and the principle of prudence in line with the Prudent
Investor Rule were also objectives of the revision. The detailed investment guidelines,
however, strongly limit the practical implementation of the Prudent Investor Rule,
meaning that the legislator’s objectives were only achieved in part.
7978 Swiss Bankers Association | The 3rd contributor to occupational pension plansSwiss Bankers Association | The 3rd contributor to occupational pension plans

Loyalty
The pension fund’s governing body must ensure that asset management in conduct-
ed in the interests of the pension fund and its beneficial owners (beneficiaries,
employees and recipients). Own interests and third party interests must be treated as
secondary to the interests of the beneficial owners. Proprietary trading by the com-
mittees, persons related to them or by third parties with a mandate from the pen-
sion fund may not lead to conflicts of interest with the investment activities or the
investments of the pension fund (e.g. front running, insider trading). The execution
of investment decisions in the market must be conducted at standard market condi-
tions.
Protection of interests
The pension fund’s assets must be managed in such a way that ensures the interests
of all beneficial owners to the same degree. The interests of an individual beneficial
owner or a group of beneficial owners may not be placed above the interests of the
others.
Investment fees
The fees for the management of the pension fund’s assets and the individual invest-
ments must be in line with standard market prices. The governing bodies are obliged
to keep the costs that are passed on to the beneficial owners to a minimum. Exces-
sive costs incurred through the management of the assets at the expense of the
beneficial owners are considered an unfaithful execution of duties.
Verification and monitoring of adherence
Adherence to the code of conduct and the asset allocation strategy as well as the
risk-return guidelines are to be monitored in an appropriate manner.
Delegation of tasks to third parties
Asset management and other tasks may be delegated to third parties. The selection
and ongoing monitoring of service providers must be conducted in a diligent, com-
petent and careful manner. The governing body remains responsible vis-à-vis the
beneficial owners for any work that has been outsourced.
8.2 Basic principles of the Prudent Investor Rule
The following elements form the basic principles of the Prudent Investor Rule (based
on the Uniform Prudent Investor Act, drafted by the National Conference of Com-
missioners on Uniform State Laws for the United States of America in 1994 and the
Trustee Guidance):
Due diligence guidelines
Pension fund assets are to be invested carefully. The pension fund’s financial situa-
tion must form the basis for investments. Implementation of investment decisions is
to be conducted diligently, professionally and carefully.
Asset allocation
Investments must not be made on an individual basis, but should instead be made
taking into consideration the overall portfolio. Further to this, asset allocation must
be in line with the pension fund’s asset liability management.
Risk and return guidelines
The assets must be managed in accordance with modern portfolio theory. Risk and
return guidelines are to be defined and must be in line with asset allocation. Invest-
ment restrictions are set according to the investment objective. The success of invest-
ment activities is regularly assessed and monitored, deviations from the guidelines
are reviewed and if necessary, escalated. Activity reports are produced regularly.
Diversification of assets
An appropriate diversification must be striven for in order to reduce investment risk.
Implementation in the portfolio depends on the asset allocation, the potential
investment restrictions as well as the risk and return guidelines. No quantitative
guidelines are contained in the standard, only indications regarding diversification
and the qualitative requirements thereof.
Responsibilities
The governing body is responsible for the management of the assets. Targeted,
prudent investing within the framework of asset allocation and the risk-reward
guidelines are just as much a part of these responsibilities as ensuring the appropri-
ate monitoring of investments and activities. The governing body is liable for any
potential misconduct in the exercise of its responsibilities.
8180 Swiss Bankers Association | The 3rd contributor to occupational pension plansSwiss Bankers Association | The 3rd contributor to occupational pension plans
8 Prudent Investor Rule as the next (but one) step

The organisational requirements should be set in a way that minimises operational
risk when responsibilities are allocated appropriately within the pension fund. A clear
division between those individuals who define the asset allocation, those who invest
the assets of the beneficial owners, and those who oversee the investment activities
and adherence to the investment guidelines should be striven for. Whenever possi-
ble, conflicts of interest must be avoided or minimised. If this is not possible, they
must be disclosed both internally and externally. Delegations to third parties must be
conducted according to standard practices (e.g. such as at fund management com-
panies) and the service provider must be bound by contract to adhere to the same
rules of conduct that the delegator is subject to. In order for the pension funds in
Switzerland to continue to operate successfully and thus be able to generate long-
term added value for the beneficial owner, an up-to-date regulation and modern
supervision is needed.
OOB2 has already embedded the basic concept of rules of conduct for pension
funds at the ordinance level. The possibility thus exists for supervision to be conduct-
ed more on the basis of the pension fund, its committees, and its organisational
set-up, and less on adherence to the legal investment guidelines. The organisa-
tion-specific supervisory approach as already applied by FINMA for fund manage-
ment companies could also be applied to pension funds and investment foundations.
The elements of the Prudent Investor Rule can also be found in OOB2. Swiss law
does not, however, lay down any explicit, definitive rules of conduct, but rather gives
a certain amount of room for interpretation. In comparison to the US and the UK,
Switzerland’s necessary guarantee of diligent, competent and careful management
of the business combined with guidelines for permitted investments and investment
restrictions goes much further. In addition to this, there is a risk that the guarantee
cannot be sufficiently met by the governing bodies because the limits or restrictions
do not allow for it. For example, a targeted asset allocation that is carefully aligned
with the asset liability management cannot be implemented.
8.3 Up-to-date formulation of the guidelines for asset management at pension
funds
In order for the governing bodies to be able to meet their responsibilities and invest
the assets of the beneficial owners in a targeted, prudent manner and using up-to-
date portfolio theories, legislation is required that regulates not the portfolios, invest-
ments, vehicles or products, but the pension funds and their committees. For pen-
sion funds with limited professional expertise, it can therefore make sense to
establish standardised requirements for portfolio construction that define investment
restrictions. Such a concept already exists in banking legislation, where for example,
for the identification of risks, standardised calculations or model-based calculations
can be applied.
Accordingly, investment guidelines and restrictions should be replaced by clear
requirements for the governing bodies of a pension fund and its organisational
set-up. This requires pension funds to establish structures and extend expertise,
which offer a guarantee of irreproachable business conduct. In Switzerland, this
approach is already being successfully applied for banks, fund management compa-
nies and asset managers. The result is that pension fund committees also become
more accountable, because with this kind of approach, it is no longer possible to
shift the responsibility for not reaching targets or not meeting requirements to the
legal investment guidelines.
8382 Swiss Bankers Association | The 3rd contributor to occupational pension plansSwiss Bankers Association | The 3rd contributor to occupational pension plans
8 Prudent Investor Rule as the next (but one) step

A look at the investment performance of the pension funds in various OECD coun-
tries over the past five and ten years shows that both nominally and adjusted for
inflation, Switzerland ranks in the middle to lower end of the spectrum (Figure 9.1).
In the last five years, Switzerland ranked a modest 16th out of 26 countries exam-
ined in terms of nominal values. In real terms, it performed slightly better, ranking
10th. Looking at the values for the last ten years, the result was comparable.
Whether the reported returns are presented in a way that allows for a meaningful
comparison between the countries, and how pension fund performance would
generally best be measured, is something that experts have long sought to establish.
Discrepancies in reporting and the regulatory requirements as well as different
applicable periods and the varying characteristics of the individual pension fund
systems make comparisons difficult. For example, a difference in retirement age can
lead to longer or shorter periods of cumulative saving and therefore have a strong
influence on performance. Further to this, regulatory requirements such as the
achievement of a minimum guaranteed return make an optimal, balanced portfolio
allocation more difficult. Also not to be underestimated are the varying methods
used for calculating returns as well as the difference in how management fees are
taken into account.
In terms of giving an initial impression, however, the reported investment returns
provide important insights.
9 Comparison with other countries: Switzerland lags behindInternational comparisons of the performance of occupational pension plans should be treated with some caution. Nevertheless, such comparison is useful in that it shows that Switzerland lags behind in comparison to other countries with similarly well-developed 2nd Pillars. A detailed analysis highlights the significant differences in regulatory requirements between the individual countries. Although their effect on performance is not easy to determine, a number of characteristics that influence the targeted returns can be identified. In addition to real estate, these include in particular the investment guidelines and the share of non-traditional investments.
8584 Swiss Bankers Association | The 3rd contributor to occupational pension plansSwiss Bankers Association | The 3rd contributor to occupational pension plans

For this analysis, the study limits itself to countries with pension fund assets of
comparable size as a percentage of GDP. According to OECD data, for 2014, pension
fund assets in Switzerland as a percentage of GDP were 120 percent.24 Comparable
are the Netherlands (159 %), Australia (110 %), the UK (96 %), the US (83 %) and
Canada (76 %). Due to their relatively small size of pension fund assets, countries
such as Denmark (48 %), New Zealand (20 %), Norway (8.8 %) and Belgium (5.7 %)
are not taken into further consideration.
A ranking of this comparison group according to nominal values shows that each of
these countries outperformed Switzerland in the last five years. The pension funds in
the UK generated annual returns that were more than twice as high as Switzer-
land’s. In real terms, all of the comparison countries with the exception of the US
outperformed Switzerland. A similar picture emerges over a ten-year horizon.
Three areas are of key importance when looking for the causes of these discrepan-
cies: the differences in performance between the various countries can primarily be
attributed to the varying developments in the domestic bond, equity and real estate
markets, and secondly to differences in asset allocation. Thirdly, asset allocation is in
part determined by regulatory guidelines as well as the characteristics of the differ-
ent pension fund systems.25
9.1 Regulatory environment and performance
Investment restrictions can either follow the Prudent Investor Rule, come in the form
of quantitative rules for portfolios, or be based on a combination of the two. Estab-
lishing quantitative rules can limit the choice of asset classes as well as their weight-
ing for asset allocation.
Pension funds in Anglo-Saxon countries generally follow the Prudent Investor Rule,
while Latin American and Central and Eastern European countries tend to opt for a
quantitative approach as the regulatory mechanism.26 In addition to restrictions
relating to instruments and maximum allocations, the latter countries often have
defined minimum guaranteed returns. Experts have identified a connection between
24 Source: OECD Global Pension Statistics.25 A comparison of returns should not be viewed in isolation from the risks taken. There are, however, no
internationally comparable data available for this.26 The World Bank, 2010, Evaluating the Financial Performance of Pension Funds, pg. 29 et seq.
Abb. 9.1
Comparison of nominal and real 5 and 10-year performance in
local currency in percent
Country 5-year average 10-year average
Nominal Real Nominal Real
UK 11.8 8.4 9.5 6.5
Netherlands 9.8 7.8 6.6 4.8
Denmark 8.9 7.1 7.3 5.4
Australia 8.8 6.0 6.6 3.7
Canada 8.7 6.9 6.5 4.7
New Zealand 8.6 6.3 5.9 3.3
Mexico 8.2 4.1 7.2 2.9
Iceland 8.0 4.5 7.6 1.7
Chile 7.1 3.7 7.1 3.5
Belgium 6.9 5.0 6.0 4.0
Norway 6.6 4.9 6.2 4.2
Israel 6.5 4.8 6.3 4.1
US 5.7 3.9 2.6 0.5
Luxembourg 4.7 2.8 * *
Austria 4.6 2.4 3.4 1.4
Switzerland 4.6 4.8 3.6 3.3
Spain 4.4 2.9 * *
Germany 4.3 2.9 4.2 2.6
Slovenia 4.2 2.7 * *
Korea 4.2 2.1 3.8 1.2
Italy 4.0 2.4 3.8 2.0
Estonia 3.6 0.9 1.9 -1.7
Portugal 2.9 1.3 3.9 2.3
Japan 2.5 1.8 0.6 0.3
Czech Republic 2.3 0.6 2.5 0.3
Slovak Republic 2.1 0.3 * *
* means not available
Source: OECD Global Pension Statistics; data: December 2005 (2010) – December 2014
8786 Swiss Bankers Association | The 3rd contributor to occupational pension plansSwiss Bankers Association | The 3rd contributor to occupational pension plans
9 Comparison with other countries: Switzerland lags behind

The remaining five countries do not limit investments in traditional or non-traditional
asset classes. Nevertheless, in all countries with the exception of Canada, sufficient
diversification in terms of asset classes is required. In addition, there are separate
concentration limits for individual counterparties in Canada and Switzerland, and
lending by employers is not permitted in the UK or US in order to avoid potential
conflicts of interest.
Switzerland is also the only country to limit foreign investments (foreign assets). In
the case of real estate, only 10 percent of total assets may be foreign. Canada had a
limit of 30 percent for total foreign assets, but did away with this in 2005. The
picture is similar for foreign currency-related guidelines. Investments in foreign
currency are also only limited in Switzerland, by a cap of 30 percent. None of the
other countries under review has defined floors (minimum limits). Switzerland is
the development of capital markets and investment regulation. Pension funds in
countries with better-developed capital markets tend to have a more flexible regula-
tory framework (Prudent Investor Rule). In countries where cumulative saving for
retirement is mandatory and more responsibility therefore lies with the state or a
company (as in the case for occupational pensions), a stricter regulatory framework
tends to be in place. Pension funds with defined contribution plans for which the
pension income depends to a high degree on performance are also more strictly reg-
ulated.
Figure 9.2 compares the investment guidelines of the countries under review. It
shows that only Switzerland has defined maximum limits at the asset class level.
However, it should be mentioned that in the case of Switzerland, the investment
guidelines are not fully binding. With appropriate justification, pension funds can
exceed the maximum limits. Security and the diversification of risk must, however,
continue to be adhered to and the deviation from the limits must be disclosed in the
annual report.
Fig. 9.2
Investment restrictions
Equities Real estate Bonds Retail investment funds
Private investment funds
Mortgages/loans
Cash Alternative investments
Comments Foreign assets
Foreign currency exposure
Derivative exposure
Switzerland 50 % (total exposure, incl. indirect investments)
30 % (total exposure)
100% (receivable for fixed amount)
Not appli-cable (asset class limit relevant)
Not appli-cable (asset class limit relevant)
50 % (max. 80 % of market value of property)
100 % 15 % Individual concen-tration limits; new investment guide-lines since 2009
10% for real estate
30 % n/a
Australia 100 % 100 % 100 % 100 % 100 % 100 % 100 % 100 % Granting credit to employees not permitted; diversifi-cation required; no amendments since 2002
No limit n/a n/a
Canada 100 % 100 % 100 % 100 % 100 % 100 % 100 % 100 % Individual concen-tration limits (10 %)
No limit (30% limit abolished in 2005)
100% n/a
Netherlands 100 % 100 % 100 % 100 % 100 % 100 % 100 % 100 % Max. 5 % in shares of employer; diversi-fication required
No limit n/a n/a
UK 100 % 100 % 100 % 100 % 100 % 100 % 100 % 100 % Granting credit to employees not permitted; diversifi-cation and suitability required
No limit n/a n/a
US 100 % 100 % 100 % 100 % 100 % 100 % 100 % 100 % Granting credit to employees not permitted; limit for employer-re-lated investments; diversification and suitability required
No limit n/a n/a
Note: limits in the table relate only to direct investments unless otherwise indicated
Annual Survey of Investment Regulation of Pension Funds, OECD 2014
8988 Swiss Bankers Association | The 3rd contributor to occupational pension plansSwiss Bankers Association | The 3rd contributor to occupational pension plans
9 Comparison with other countries: Switzerland lags behind

Figure 9.3 shows the asset allocation for the equity and alternative investments asset
classes in 2014. Switzerland had a below average allocation for both classes. Once
again, no clear connection between the allocation to individual asset classes and
performance can be identified here. Certain tendencies do exist, however. Figure 9.3
shows that countries with a relatively high component of alternative investments also
tend to report higher returns (see Figure 9.1). For this assessment, it must be men-
tioned that according to the OECD definition, alternative investments comprise
primarily lending, land and real estate, mutual funds, insurance contracts, hedge
funds, private equity and structured products. To facilitate comparison, the graph
shows the share of alternative investments excluding real estate and lending, which
are not normally considered alternative investments in Switzerland. It is also ques-
tionable whether the mutual funds class is part of the alternative investments cate-
gory. Due to the lack of a more in-depth description, however, this study does not
attempt to further separate them.
again an exception in terms of requirements for achieving a specific return. Accord-
ing to a comparison conducted in 2008, pension funds in the US, the UK, the Neth-
erlands, Australia and Canada do not have to provide any minimum guarantee.27
There is no clear-cut answer to the question of whether there is a connection be-
tween regulatory requirements and performance. With the exception of the US, all
of the countries in the comparison group that do not have regulatory investment
restrictions outperformed Switzerland. Countries outside the comparison group with
relatively high returns, such as Denmark, also only have low to no investment restric-
tions. There is therefore reason to assume that a certain relationship exists between
the lack of restrictions on investments and performance.
9.2 Asset allocation and performance
Investment performance is determined to a large extent by the combination and
weighting in the asset allocation. Because regulatory restrictions cannot fully explain
differences in asset allocation, it is clear that in the US, the UK, the Netherlands,
Australia and Canada, investment decisions and not portfolio restrictions resulted in
added-value in the investment strategy. In the case of Switzerland, the effects can-
not be separated, as it is unclear to what extent asset allocation was influenced by
portfolio restrictions.
In a study published in 2015, the OECD explored how asset allocation changed in
individual countries between 2004 and 2014, and how this was influenced by regu-
latory measures.28
27 Tapia, Waldo. 2008. Comparing Aggregate Investment Returns in Privately Managed Pension Funds. OECD Working Paper on Insurance and Private Pensions, No. 21.
28 OECD, Pension Markets in Focus, 2015.
Alternative investments (AI)
Equities
Average equities
Average AI
CH AUS CAD NED1 UK2 US
9
16
22
16
35
14
29
50
30
39
22
49
60 %
50 %
40 %
30 %
20 %
10 %
0 %
1 Including real estate and lending2 Data 2013
Fig. 9.3
Source: OECD Global Pension Statistics
Total allocations 2014
Component of total allocation in percent
9190 Swiss Bankers Association | The 3rd contributor to occupational pension plansSwiss Bankers Association | The 3rd contributor to occupational pension plans
9 Comparison with other countries: Switzerland lags behind

ranks at the bottom of the comparison group. Despite a high equity component and
above average performance, the US pension fund market is lagging behind. The
reason for the weak performance must therefore lie in other asset classes.
The returns in the UK cannot be explained only by the equity (around 25 %) and
bond components (around 35 %) in the asset allocation. It is likely that alternative
asset classes (real estate, hedge funds, private equity, insurance linked securities) led
to this performance thanks to a high excess return.
Due to the lack of data, it is very difficult to conduct analyses that compare the
individual alternative investment markets to the corresponding alternative investment
allocations. However, the previous statements would indicate that the combination
of alternative investments in a portfolio have a significant influence on the perfor-
mance of the domestic pension fund markets.
The UK enjoyed the highest real and nominal returns over the last five and ten years,
and at the end of 2014, had allocated 35 percent to alternative investments. It thus
had the highest share of non-traditional assets within the comparison group. From
2004 until 2014, the biggest reallocations (just under 13 %) were made in favour of
alternative investments, which led to a reduction primarily in the equity allocation.
Countries such as Canada and Australia, which have a relatively high quota of alter-
native investments, also enjoyed above average performance. The US and Switzer-
land brought up the rear, both in terms of returns as well as the share of alternative
investments. Within the comparison group, only Switzerland is subject to regulatory
restrictions for alternative investments.
The combination of alternative investments plays an important role here, which is
also self-evident due to the heterogeneity of the asset class. Many investments are
bundled into the «other investments» category, making the identification of a clear
relationship between asset class and performance very difficult.
On the other hand, the equity components per se had a mixed impact on perfor-
mance. With a share of equity of just under 50 percent at the end of 2014, the US
reported significantly weaker performance than for example Australia, which had a
similarly high allocation to equities. At 29 percent, Switzerland’s equity component
was relatively low. Even if one goes back further in time, the equity allocation of the
various countries changes very little. This raises the question of how much influence
the differing developments in domestic financial markets had on the performance of
the pension funds.
9.3 Financial market developments and performance
Figure 9.4 shows the ten-year real returns of the pension funds in the countries
under review and compares these to the local equity and bond markets. A number
of trends can be identified here as well. Strong equity market performance had a
positive impact on pension fund performance in the case of Australia, Canada, the
Netherlands and the UK. Switzerland and the US, on the other hand, are the anom-
alies. Despite good returns on equities and bonds in Switzerland, its total return is
lower than that of other countries. This trend is even more extreme in the US, which
Pensions markets
Equities
Bonds
AUS CAD NED CH UK USA
3.7
0.5
6.4
3.3
4.8
4.7
7 %
6 %
5 %
4 %
3 %
2 %
1 %
0 %
Fig. 9.4
Source: The SBA «Occupational Pension Plans» task force, 2016
Vergleich reale Renditen auf Pensionskassen- und Finanzmärkten (10 Jahre)
9392 Swiss Bankers Association | The 3rd contributor to occupational pension plansSwiss Bankers Association | The 3rd contributor to occupational pension plans
9 Comparison with other countries: Switzerland lags behind

3. Asset allocation is a key factor in the level of contribution made by
asset management
• At present, the majority of pension funds are not invested efficiently. This means
they could achieve a higher return at the current level of risk, or they could take
less risk for the same return.
• In order to take advantage of the potential for returns, the significance attributed
to asset allocation as the primary driver for successful investing, and thus the
importance of determining the risk-return profile of a pension fund must be taken
better into account.
• By virtue of their nature, pension funds have a long investment horizon, which,
despite asset-liability restrictions is not limited by excessive liquidity requirements.
This fact should be taken advantage of when investing.
• Significantly more relevant than the impediment to the investment horizon posed
by the liabilities side is the current coverage ratio requirement and the prescribed
periods for eliminating shortfalls. These are based on parameters set by the
government and cannot be influenced by the pension funds. Analysis shows that
an extension of the recovery period would give the pension funds a significantly
greater ability to take advantage of investment opportunities.
4. The importance of non-traditional investments is underestimated
• The greater inclusion of asset classes that go beyond the traditional categories in
order to increase the risk-adjusted return (Sharpe Ratio) is a central factor for the
optimisation of a portfolio, in particular considering the current outlook for capital
markets.
• At present, it is primarily the widespread scepticism, often however, also the lack
of transparency, the presumed high costs as well as the lack of willingness to deal
with non-traditional investments that prevents the greater inclusion of such
investments.
• Taking into consideration an investment’s intended economic purpose can open
new horizons for the use of non-traditional investments. The financing of a compa-
ny across a typical life cycle can serve as a basis for this: for example, while equity
often comes from private sources at the beginning and towards the end of a life
cycle, financing between these two phases usually comes in the form of listed
shares. Using equity to grow the company, however, does not depend on whether
it’s at the beginning, in the middle or at the end of the company’s life cycle.
10 Conclusions and recommended action
1. The returns from asset management as the 3rd contributor play a
key role in securing occupational pension benefits
• The financial contribution generated by asset management above and beyond the
contributions paid by employees and employers reached almost 40 percent over
the last ten years. It is therefore important to ensure efficient and return-focused
asset management.
• Achieving an investment return that is commensurate with the level of risk is one
of the factors that largely falls within the remit of the pension funds It is impor-
tant to the authors of the study that they receive continued support in their
activities to this end.
2. In the long-term, it will likely become difficult for pension funds to
achieve the desired target returns using traditional investments.
• The changed economic reality (incl. stagnating productivity growth and high
levels of debt) are leading to lower expected returns.
• The circumstances in financial and capital markets have also changed fundamen-
tally. Some buzzwords here are low interest rate policies and the dominance of
the central banks in economic policy. The majority of pension funds have to date
hardly reacted to these challenges. Their portfolios have changed very little since
the 1980s.
• Continuing to generate the same returns as to date in financial markets is be-
coming a challenge. Willingness to tap new sources of returns by means of new
asset classes and forms of investment, and thus break new ground, is therefore
necessary.
9594 Swiss Bankers Association | The 3rd contributor to occupational pension plansSwiss Bankers Association | The 3rd contributor to occupational pension plans

7. A comparison with other countries confirms these findings and
corroborates the recommendations for action presented in this study
• In terms of returns, the Swiss market for occupational pension plans ranks in the
lower middle range.
• A look at allocations shows that Swiss pension funds hold a significant share of
bonds vis-à-vis comparable countries, but relatively few equities.
• In terms of non-traditional investments, the Swiss pension funds are the clear
leaders in real estate, while they are at the bottom end in terms of the other
non-traditional investments.
• Switzerland remains one of the few countries with a restriction on non-traditional
investments.
• Notwithstanding the limited comparability, the disadvantage of the Swiss invest-
ment model vis-à-vis other countries is evidenced by the tendencies it displays.
5. Amendments to the OOB2 investment guidelines are necessary for
optimal asset allocation
• In a first step, implementation of the proposals for optimisation outlined in this
study require that the pension funds better utilise the potential that exists under
the current investment guidelines.
• Further to this, the possible amendment of these guidelines must be seriously
considered, as they collide fundamentally with the asset allocation of those pen-
sion funds that intend to broaden their investment horizon by means of non-tra-
ditional investments. The strategy-related OOB2 articles that contain the category
limits must in particular be adjusted.
6. Greater direct responsibility in the form of the Prudent Investor Rule
leads to more room for manoeuvre, but also increased demands
• The existing OOB2 guidelines allow for the limits to be exceeded if justification is
provided. This means that room for manoeuvre exists, even though in practice, it
is rarely utilised.
• It is undeniable that the existing system offers seeming security for the pension
fund committees, and that this would only be relinquished with reluctance.
• It should be noted that responsibility towards the beneficiaries applies not only to
risk aspects, but also to opportunities.
• Realising these opportunities ultimately requires a departure from the existing
system of categories and limits, and replacing this with defined responsibilities as
set out in the Prudent Investor Rule.
• One of the consequences of such a step is that the duties of the boards of trus-
tees, executive boards and chief investment officers become more demanding.
Practical experience, theoretical knowledge and thus basic training and further
education will become even more important in future.
9796 Swiss Bankers Association | The 3rd contributor to occupational pension plansSwiss Bankers Association | The 3rd contributor to occupational pension plans
10 Conclusions and recommended action

9998 Swiss Bankers Association | The 3rd contributor to occupational pension plansSwiss Bankers Association | The 3rd contributor to occupational pension plans
9 Vergleich mit dem Ausland: Die Schweiz liegt zurück

Schweizerische BankiervereinigungAssociation suisse des banquiersAssociazione Svizzera dei BanchieriSwiss Bankers Association
Aeschenplatz 7Postfach 4182CH-4002 Basel
+41 61 295 93 [email protected]