the 2015 wisconsin deer hunting summary -...
TRANSCRIPT

The 2015 Wisconsin Deer Hunting Summary By Brian Dhuey and Kevin Wallenfang
2015 Season Highlights
Bow Totals
Deer Management Zone Antlered Antlerless Unknown Total
Central Farmland 17,394 14,367 0 31,761 Central Forest 1,610 520 0 2,130 Northern Forest 4,628 1,123 0 5,751 Southern Farmland 7,597 5,765 0 13,362 Unknown 0 0 0 0 Total 31,229 21,775 0 53,004
Crossbow Totals
Deer Management Zone Antlered Antlerless Unknown Total
Central Farmland 11,112 9,208 0 20,320 Central Forest 1,184 428 0 1,612 Northern Forest 4,723 1,227 0 5,950 Southern Farmland 3,575 2,637 0 6,212 Unknown 0 0 0 0 Total 20,594 13,500 0 34,094
Gun Totals
Deer Management Zone Antlered Antlerless Unknown Totala
Central Farmland 52,136 78,840 0 130,976 Central Forest 5,497 3,563 0 9,060 Northern Forest 19,528 9,266 0 28,794 Southern Farmland 22,596 31,279 2 53,877 Unknown 0 24 0 24 Total 99,757 122,972 2 222,731 a Includes damage deer
Tribal Totals
Antlered Antlerless Unknown Total
491 787 0 1,278

2
Abstract This report summarizes the results of the 2015 Wisconsin bow, crossbow, youth, 9-day gun, muzzleloader, and December antlerless-only deer seasons. All statistics are from kill registration data. Since 1953, the Department of Natural Resources has required that Wisconsin hunters register all deer harvested. Permit information was provided by the Bureau of Customer Service and Licensing and the Bureau of Information Management of the Wisconsin Department of Natural Resources. Daniel Storm of the Bureau of Science Services summarized data collected from deer aging stations and Brenda Von Rueden of the Bureau of Law Enforcement provided the hunting accident report. The Great Lakes Indian Fish & Wildlife Commission (GLIFWC) provided all Chippewa deer harvest data. This report is possible due to Pittman-Robertson funds. Registration A pilot to test the electronic registration of deer by hunters was offered to 14,000 deer hunters in 2014. Much was learned, and a system for all hunters to register deer electronically, known as GameReg, was initiated in September 2015. While hunters were still required to register all deer harvested, they were no longer required to bring them in person to a registration station. Methods included a phone-in, internet, or “smart phone” to collect registration data. Over 200 stations that had been in-person registration stations in the past still allowed hunters to register deer and provided them with one or more of the methods that were available to do so. Season Structure Following recommendations from the Deer Trustee Report, major changes were made to the deer management system in Wisconsin in 2014. The state is divided into four deer management zones (DMZ) from north to south, Northern Forest, Central Forest, Central Farmland, and Southern Farmland (Figure 1). Deer management units in these new management zones are based on county boundaries inside the zone. Most counties are now their own management unit with a few exceptions for areas where DMZs cross county boundaries or tribal reservation boundaries were used to develop their own units. Metro areas within these new unit boundaries are now sub-units of the larger county management unit. These sub-units were subject to longer seasons and may have been eligible for additional antlerless permits that were not valid in the rest of the unit. A continuous bow and crossbow season ran from September through early January. Gun seasons included a statewide youth gun deer season in October, a traditional 9-day gun deer season in November, a 10-day statewide muzzleloader season, and a statewide antlerless-only 4-day hunt in mid-December. There was no late December holiday hunt or October antlerless-only gun season as there had been in previous years. Permits All hunters were allowed to harvest one buck statewide per weapon authority purchased. Bow and crossbow hunters that purchased an upgrade authority to use either weapon were only allowed to harvest one buck with either weapon per season. A free antlerless permit was issued with each weapon authority purchased. These permits allowed the harvest of antlerless deer in any unit in the farmland DMZs. At the time of issuance the license purchaser had to declare a farmland DMZ, unit and landownership type (public or

3
private) for which they wanted the tag to be valid. Additional antlerless permits could be purchased for both the farmland and forested DMZs. These permits were sold over-the-counter on a first-come, first- served basis at a cost of $12 each. The purchaser had to designate the zone, unit and landtype (private or public) for which they were purchasing the permit. Permits available were limited in many zone, unit, and land types, with many units in the Northern Forest DMZ and some in the Central Forest DMZ having no antlerless permits available (Tables 1&2). Deer hunters who were hunting under a youth license were issued an additional antlerless tag with each license purchased that allowed the harvest of an antlerless deer statewide, even if the unit had no antlerless tags available to the general public. The Southern Farmland DMZ bonus buck rules were no longer in effect and hunters were only allowed to harvest one antlered buck per license type. All bonus buck authorizations that had been issued in prior deer seasons expired on 31 March 2015. Bow/Crossbow Season The bow and crossbow seasons were held from 12 September - 3 January, 114 consecutive days of hunting. As had begun in 2014, crossbows were legal for all ages of hunters, but required a separate license. Prior to 2014 only hunters who could document a disability or were 65 years or older were eligible to use a crossbow. Hunters were allowed to use both vertical bows and crossbows during the season if they purchased an “upgrade” license for $3. They were still limited to one buck per hunter regardless of weapon type used to harvest it. Bow and crossbow season remained open during all concurrent firearm hunts, and all hunters, regardless of weapon being used, are required to wear blaze orange clothing during any open firearm deer season. In most management units, bow and crossbow hunters were allowed to harvest one antlered and one antlerless deer during the season. As in recent years, bow and crossbow hunters were restricted to “Bucks Only” in units that want to increase the number of deer in the unit and restricted gun hunters to “Bucks Only” as well. Bow and crossbow hunters were allowed to harvest additional antlerless deer using free Farmland Zone antlerless deer permit(s), or purchased addition antlerless deer permits in units that allowed the taking of extra antlerless deer. Six metropolitan sub-units were designated in the state that allowed bow and crossbow hunters additional opportunity to kill deer by keeping the season open until 31 January. Hunters in most sub-units used the same Farmland Zone or bonus antlerless permits that were available in the larger deer management unit. One of these metro sub-units (Superior in Douglas County) had antlerless permits available, even though the unit overall was “Buck Only” unit. Bow and crossbow hunters could purchase additional antlerless permits throughout the season or until all were sold. Wisconsin bowhunters killed 53,004 deer in 2015. Crossbow hunters killed 34,094 deer. The combined harvest was 87,098; this is up from the combined harvest of 81,701 killed in 2014. Normal amounts of precipitation and above normal temperatures greeted hunters during the first month of the season. October brought more normal temperatures and drier than average conditions. November and December were much above average for both precipitation and temperature. Weather events during the rut were fairly limited and short and alone should not have affected the hunters during most of the rut in Wisconsin. However, temperatures during late October and first week of November were above average, and may have affected rutting activity leading to reduced deer movement. Regardless, many successful hunts occured during

4
this period. Overall conditions for hunting were quite good throughout most of the season for bow and crossbow hunters and should have not adversely affected success. A summary of the bow and crossbow deer harvest by deer management unit is contained in Figures 6-9 and Tables 13-16. Firearm Season October A statewide youth deer hunt was held on the 10-11th of October. All persons from 10-15 years of age were eligible to hunt. Mentored hunting was introduced to the state in 2009; this allowed anyone age 10 or older to hunt without a Hunter’s Education certification as long as they hunted with an 18-year-old or older mentor. All youth who were mentored or possessed a Hunter’s Education certification card and a Gun Deer License were eligible to hunt. The bag limit was one buck and additional antlerless deer with the appropriate carcass tag(s). All youth deer license holders were issued a free antlerless permit, which was valid statewide, even in “Buck Only” units. A total of 7,211 deer were killed by youth during these two days (Table 7 and Figure 4). A special gun hunt for disabled hunters was held on sponsor landowners’ properties, a deer of either sex was legal from 3-11 October.
November Wisconsin held the 2015 regular 9-day firearm deer season during 21-29 November. Rifles were no longer prohibited in most of the state, but local governments could still restrict their discharge in their jurisdictions. Firearm license holders were issued one antlered deer tag valid statewide and one antlerless deer tag that was restricted to use in the Farmland DMZ deer unit and land type of their choice (public and private). Many units in all DMZs offered additional antlerless tags that were specific to land type and were sold for $12 on a first-come-first-served basis. The southern 1/3rd of the state received snow the evening before and most of the morning of opening day. Amounts varied west to east with higher amounts in the west of 10-12 inches. Snowfall ended mid-morning but visibility may still have been hampered by snow hanging on trees and brush. Most of the northern 2/3rds of the state had no snow cover on the ground. Temperatures were in the high 20’s and low 30’s in the morning and rose above freezing by afternoon, causing the hanging snow to melt and fall. Sunday morning’s weather saw even warmer temperatures into the 40’s, resulting in much of the areas that still had snow to see significant declines in snow cover with much of it melted by the end of the day. Temperatures stayed above average during the early part of the week with little or no precipitation. Friday saw precipitation return with rain throughout much of the state with some accumulating snow in the far north. Temperatures returned to normal the second weekend of the season with sun in the south and central portions of the state. Generally, temperatures were above average to average with most precipitation occurring during the first Saturday and Friday of the 9-day hunting season. Snow early in the season may have hung in the trees and reduced hunter visibility in the southern 1/3rd of the state during opening weekend. This hanging snow may have made “finding and seeing” deer more difficult in some cases, or improved visibility in others. The statewide corn harvest was much above average in most of the state with all parts of the state having little standing corn. Most of the ground was unfrozen for opening day of the gun season, and remained so with above average temperatures, this may have inhibited hunters from accessing remote hunting areas and wetlands. Sales of gun deer licenses in 2015 were up from the previous year. Overall hunting conditions ranked a qualitative 7 on a scale of 1 to 10. This is in comparison to a 5 in 2014.

5
Starting in 2009, deer hunters were asked at the time of registration to rate the weather conditions, deer seen, and hours hunted on the day they killed their deer. Hunters rated the weather on a scale of 1 to 10 with 1 being the worst. Mean weather ranking for the opening day of the 9-day gun season was 6.7, similar to last years 6.5., only second to the 7.1 of 2012. Prior years have varied from 4 to 7 with 4.2 in 2013, 7.1 in 2012, 6.0 in 2011, 6.6 in 2010, and 6.1 in 2009; all years were different at the p < 0.05 level. The weather ranking for the rest of the season was 7.2, which was above the 6.2 of 2014 and higher than the 5.4 in 2013, 6.9 in 2012, 6.3 in 2011, 6.0 in 2010 and 6.2 in 2009; all years except 2012 and 2014 were different at the p ≤ 0.05 level. The number of deer seen per hour hunted for opening day was 1.18. This was significantly (p ≤ .05) higher than the 1.10 in 2014, 1.09 in 2013, 1.02 in 2012, 0.96 in 2011, 1.08 in 2010, and 0.79 in 2009. Deer seen per hour for the rest of the 9-day season was also 1.18 in 2015. This is in comparison to the 1.20 in 2014, 1.08 in 2013, 1.02 in 2012, 0.96 in 2011, 1.03 in 2010 and 0.80 in 2009; all years were different (p ≤ .05). Please note that these rankings are for successful hunters only, and are probably biased by that fact. Metro deer sub-units’ gun deer season opened on 21 November and was open for 21 days (running through 9 December). The bag limit was one deer of either sex for the length of the season. Additional antlerless deer permits were available for purchase that allowed hunters to bag additional antlerless deer. December All DMZs in the state were open for muzzleloader-only hunting from 30 November - 9 December. Any unused carcass tag, both buck and antlerless, could be used during this time. Only hunters possessing or accompanying someone with an unused carcass tag could take part in the muzzleloader season. Muzzleloaders were allowed to have scopes with a magnification of greater than 1X, which became legal prior to the 2010 muzzleloader season. Wisconsin held a statewide antlerless only gun season from 10-13 December. All hunters with an unfilled antlerless deer permit could take part in the season. This season allowed hunters who were unable to fill their antlerless permits during the 9-day and muzzleloader seasons another chance to kill an antlerless deer. No holiday hunt was held in units in the Southern Farmland DMZ as had been done in the past. County Deer Advisory Councils (CDAC) will have the ability to recommend a holiday hunt starting in 2016. Hunting conditions for the December season(s) were above average. Most of December had average to above temperatures with little snowfall. Large portions of the state were snowless for much of December with consistent snow not arriving till late in the month. While this may have made seeing deer more difficult, hunters’ ability to access hunting areas was enhanced and should have helped them to find deer. Warmer temperatures may have also increased hunter activity and the length of time in the woods. Hunters killed the 26th highest kill total in the last 82 years (309,829; 1st 2000 = 615,293, 2nd 2007 = 518,573) during the bow, crossbow, youth, 9-day, muzzleloader, and December antlerless seasons combined. Only once in the past 25 years has the total deer harvest for Wisconsin fallen below 300,000 (1993). A summary of youth, 9-day, muzzleloader, December

6
antlerless, and holiday deer harvest by deer management unit is contained in Table 5-7, and Figures 2-4, respectively. Agricultural Damage Shooting Program Wisconsin's agricultural damage deer shooting program was in effect for 2015. In 2015, the Department issued 542 agriculture damage deer shooting permits in 64 counties. The number of deer shooting permits issued in 2015 decreased from 2014 when 617 permits were issued in 67 counties. There are two types of deer shooting permits agriculture producers can choose from: permits that require the producer to allow public hunting access during the state deer hunting season, under this option producers are eligible for deer damage compensations; and permits that do not require the producer to allow public hunting access but producers are not eligible for deer damage compensation. Of the two permits types, 275 deer shooting permits were issued where public deer hunting access was required on property the producer owns or leases and 267 deer shooting permits were issued where public hunting access was not required on the property the producer owns or leases. The number of shooting permits issued each year for the last 10 years are as follows:
2006 - 709 permits in 63 counties 2011 - 484 permits in 64 counties 2007 - 698 permits in 62 counties 2012 - 521 permits in 67 counties 2008 - 713 permits in 66 counties 2013 - 618 permits in 65 counties 2009 - 611 permits in 66 counties 2014 - 617 Permits in 67 counties
2010 - 501 permits in 62 counties 2015 - 542 Permits in 64 counties Damage permits were primarily valid for harvesting antlerless deer using a gun (occasional exceptions are made to harvest antlered deer or to use archery equipment for harvest). A total of 4,377 deer were harvested under authority of this program; nearly all (4,104) were antlerless. Data from past years has shown that less than 5% of the damage deer are killed with archery tackle. Because of this, all damage deer are assumed to be killed by gun hunters. Tables 9 & 10 summarize deer harvest in the agricultural damage shooting program. Chippewa Deer Harvest Deer hunting in the ceded territory by the tribes of the Lake Superior Chippewa took place from 1 September to 31 December. The Tribes harvested 1,278 deer in 2015. Tribal totals are not included in the statewide gun harvest totals in this report, but used in calculating population estimates for each of the units that have tribal harvest. The total Tribal deer harvest by year is in Table 11. A summary of the 2015 Tribal deer harvest by management unit is contained in Table 12. Other off-reservation treaty harvest information can be obtained by contacting the Great Lakes Indian Fish & Wildlife Commission, P.O. Box 9, Odanah, WI 54861. CWD Harvest With the Deer Trustee Report implementation, the Chronic Wasting Disease (CWD) management zone has been eliminated and is now referred to as CWD-affected areas. These boundaries match the counties that prohibit baiting and feeding (38 counties in 2015). A county is included if a wild or captive animal has been tested and confirmed to be positive for CWD in the county or if a portion of the county that is within a 10-mile radius of where the animal that had been tested and confirmed to be positive for CWD. Special seasons or extensions of seasons no longer exist as they had in the past. Season length and bagging rates were similar to the rest of the state. The “bonus buck” provision that

7
had allowed the taking of additional antlered deer if an antlerless deer was killed first was discontinued in 2015, with all prior issued bonus buck stickers expiring on 31 March 2015.

8
Table 1. Antlerless permit availability and issuance by deer management zone, unit and landtype for 2015.
Deer Management Zone County Land Type
Bonus Permits
Available
Bonus Permits
Sold Date Sold
Out
Farmland Antlerless
Issued
Total Antlerless Issued
Central Farmland Adams Private 1,800 505 N/A 7,421 7,926 Central Farmland Adams Public 50 50 09/03/2015 2,621 2,671
Central Farmland Barron Private 1,325 1,325 11/17/2015 12,195 13,520
Central Farmland Barron Public 0 0 N/A 3,728 3,728
Central Farmland Brown Private 800 525 N/A 7,585 8,110
Central Farmland Brown Public 200 200 11/03/2015 1,907 2,107
Central Farmland Buffalo Private 4,000 1,934 N/A 11,656 13,590
Central Farmland Buffalo Public 500 326 N/A 836 1,162
Central Farmland Calumet Private 425 277 N/A 3,455 3,732 Central Farmland Calumet Public 125 125 11/10/2015 1,067 1,192
Central Farmland Chippewa Private 575 575 09/11/2015 12,837 13,412
Central Farmland Chippewa Public 0 0 N/A 3,948 3,948
Central Farmland Clark Private 1,325 1,325 11/20/2015 12,136 13,461
Central Farmland Clark Public 50 50 08/18/2015 3,629 3,679
Central Farmland Door Private 1,800 689 N/A 7,525 8,214
Central Farmland Door Public 200 200 11/18/2015 1,204 1,404
Central Farmland Dunn Private 2,300 1,863 N/A 11,799 13,662
Central Farmland Dunn Public 200 200 09/04/2015 2,580 2,780
Central Farmland Eau Claire Private 1,075 841 N/A 7,159 8,000
Central Farmland Eau Claire Public 75 75 09/06/2015 2,357 2,432
Central Farmland Fond du Lac Private 850 850 11/23/2015 9,291 10,141 Central Farmland Fond du Lac Public 325 325 09/12/2015 4,131 4,456
Central Farmland Green Lake Private 8,000 762 N/A 6,447 7,209
Central Farmland Green Lake Public 1,000 340 N/A 1,224 1,564
Central Farmland Jackson Private 1,325 1,089 N/A 10,263 11,352
Central Farmland Jackson Public 0 0 N/A 3,057 3,057
Central Farmland Juneau Private 1,300 783 N/A 8,381 9,164
Central Farmland Juneau Public 25 25 08/23/2015 2,248 2,273
Central Farmland Kewaunee Private 1,100 432 N/A 6,003 6,435
Central Farmland Kewaunee Public 200 133 N/A 667 800
Central Farmland La Crosse Private 650 650 11/21/2015 7,935 8,585
Central Farmland La Crosse Public 100 100 10/02/2015 1,143 1,243
Central Farmland Manitowoc Private 2,000 722 N/A 9,709 10,431 Central Farmland Manitowoc Public 150 150 10/19/2015 2,105 2,255
Central Farmland Marathon Private 3,375 2,308 N/A 26,089 28,397
Central Farmland Marathon Public 450 450 09/10/2015 7,538 7,988
Central Farmland Marinette Private 3,400 767 N/A 12,972 13,739
Central Farmland Marinette Public 175 175 09/04/2015 5,440 5,615
Central Farmland Marquette Private 8,000 1,175 N/A 11,587 12,762
Central Farmland Marquette Public 2,000 524 N/A 1,965 2,489
Central Farmland Monroe Private 1,350 1,103 N/A 12,591 13,694
Central Farmland Monroe Public 400 400 11/20/2015 2,913 3,313
Central Farmland Oconto Private 2,075 923 N/A 14,117 15,040
Central Farmland Oconto Public 200 200 09/12/2015 5,990 6,190
Central Farmland Outagamie Private 1,075 787 N/A 10,428 11,215 Central Farmland Outagamie Public 350 350 12/11/2015 2,429 2,779
Central Farmland Pepin Private 800 680 N/A 3,581 4,261
Central Farmland Pepin Public 75 75 09/30/2015 445 520
Central Farmland Pierce Private 2,000 1,337 N/A 8,290 9,627

9
Table 1. Antlerless permit availability and issuance by deer management zone, unit and landtype for 2015.
Deer Management Zone County Land Type
Bonus Permits
Available
Bonus Permits
Sold Date Sold
Out
Farmland Antlerless
Issued
Total Antlerless Issued
Central Farmland Pierce Public 300 300 11/25/2015 962 1,262
Central Farmland Polk Private 3,100 2,202 N/A 14,512 16,714
Central Farmland Polk Public 500 500 09/17/2015 4,511 5,011
Central Farmland Portage Private 2,375 1,431 N/A 13,099 14,530 Central Farmland Portage Public 275 275 09/19/2015 2,892 3,167
Central Farmland Shawano Private 3,500 1,519 N/A 20,078 21,597
Central Farmland Shawano Public 750 500 N/A 3,065 3,565
Central Farmland Sheboygan Private 1,025 863 N/A 6,781 7,644
Central Farmland Sheboygan Public 100 100 08/18/2015 3,945 4,045
Central Farmland St. Croix Private 1,400 1,193 N/A 8,160 9,353
Central Farmland St. Croix Public 150 150 09/14/2015 2,158 2,308
Central Farmland Trempealeau Private 500 500 09/22/2015 12,197 12,697
Central Farmland Trempealeau Public 0 0 N/A 1,261 1,261
Central Farmland Waupaca Private 7,200 1,825 N/A 22,543 24,368
Central Farmland Waupaca Public 300 300 11/06/2015 2,365 2,665
Central Farmland Waushara Private 1,200 1,148 N/A 13,857 15,005 Central Farmland Waushara Public 600 600 11/20/2015 3,004 3,604
Central Farmland Winnebago Private 375 375 11/20/2015 6,135 6,510
Central Farmland Winnebago Public 125 125 09/25/2015 1,735 1,860
Central Farmland Wood Private 775 775 11/19/2015 9,380 10,155
Central Farmland Wood Public 25 25 08/18/2015 2,852 2,877
Central Farmland Total 84,150 43,406 472,116 515,522
Central Forest Adams Private 5,150 5,150 11/17/2015 0 5,150
Central Forest Adams Public 850 850 08/17/2015 0 850
Central Forest Clark Private 800 800 08/17/2015 0 800
Central Forest Clark Public 650 650 08/17/2015 0 650
Central Forest Eau Claire Private 875 875 11/14/2015 0 875
Central Forest Eau Claire Public 150 150 08/17/2015 0 150 Central Forest Jackson Private 0 0 N/A 0 0
Central Forest Jackson Public 0 0 N/A 0 0
Central Forest Juneau Private 825 825 08/20/2015 0 825
Central Forest Juneau Public 100 100 08/17/2015 0 100
Central Forest Monroe Private 100 100 08/17/2015 0 100
Central Forest Monroe Public 0 0 N/A 0 0
Central Forest Wood Private 300 300 08/17/2015 0 300
Central Forest Wood Public 75 75 08/17/2015 0 75
Central Forest Total 9,875 9,875 0 9,875
Northern Forest Ash.-Madeline Isl Private 0 0 N/A 0 0
Northern Forest Ash.-Madeline Isl Public 0 0 N/A 0 0
Northern Forest Ashland Private 0 0 N/A 0 0 Northern Forest Ashland Public 0 0 N/A 0 0
Northern Forest Bad River Res. Private 0 0 N/A 0 0
Northern Forest Bad River Res. Public 0 0 N/A 0 0
Northern Forest Bayfield Private 0 0 N/A 0 0
Northern Forest Bayfield Public 0 0 N/A 0 0
Northern Forest Burnett Private 1,075 1,075 08/17/2015 0 1,075
Northern Forest Burnett Public 0 0 N/A 0 0
Northern Forest Douglas Private 0 0 N/A 0 0
Northern Forest Douglas Public 0 0 N/A 0 0

10
Table 1. Antlerless permit availability and issuance by deer management zone, unit and landtype for 2015.
Deer Management Zone County Land Type
Bonus Permits
Available
Bonus Permits
Sold Date Sold
Out
Farmland Antlerless
Issued
Total Antlerless Issued
Northern Forest Florence Private 0 0 N/A 0 0
Northern Forest Florence Public 0 0 N/A 0 0
Northern Forest Forest Private 0 0 N/A 0 0
Northern Forest Forest Public 0 0 N/A 0 0 Northern Forest Iron Private 0 0 N/A 0 0
Northern Forest Iron Public 0 0 N/A 0 0
Northern Forest LCO Res Private 0 0 N/A 0 0
Northern Forest LCO Res Public 0 0 N/A 0 0
Northern Forest Langlade Private 0 0 N/A 0 0
Northern Forest Langlade Public 0 0 N/A 0 0
Northern Forest LdF Res Private 0 0 N/A 0 0
Northern Forest LdF Res Public 0 0 N/A 0 0
Northern Forest Lincoln Private 750 750 08/17/2015 0 750
Northern Forest Lincoln Public 250 250 08/17/2015 0 250
Northern Forest Marinette Private 725 725 08/17/2015 0 725
Northern Forest Marinette Public 225 225 08/17/2015 0 225 Northern Forest Menominee Private 0 0 N/A 0 0
Northern Forest Menominee Public 0 0 N/A 0 0
Northern Forest Oconto Private 500 500 09/12/2015 0 500
Northern Forest Oconto Public 200 200 08/17/2015 0 200
Northern Forest Oneida Private 0 0 N/A 0 0
Northern Forest Oneida Public 0 0 N/A 0 0
Northern Forest Price Private 0 0 N/A 0 0
Northern Forest Price Public 0 0 N/A 0 0
Northern Forest Red Cliff Res Private 0 0 N/A 0 0
Northern Forest Red Cliff Res Public 0 0 N/A 0 0
Northern Forest Rusk Private 1,225 1,225 08/17/2015 0 1,225
Northern Forest Rusk Public 0 0 N/A 0 0 Northern Forest Sawyer Private 0 0 N/A 0 0
Northern Forest Sawyer Public 0 0 N/A 0 0
Northern Forest Superior metro Private 50 50 08/23/2015 0 50
Northern Forest Superior metro Public 150 150 08/21/2015 0 150
Northern Forest Taylor Private 3,525 3,525 08/21/2015 0 3,525
Northern Forest Taylor Public 0 0 N/A 0 0
Northern Forest Vilas Private 0 0 N/A 0 0
Northern Forest Vilas Public 0 0 N/A 0 0
Northern Forest Washburn Private 3,375 3,375 11/12/2015 0 3,375
Northern Forest Washburn Public 825 825 08/20/2015 0 825
Northern Forest Total 12,875 12,875 0 12,875
Southern Farmland Columbia Private 1,675 1,083 N/A 11,591 12,674 Southern Farmland Columbia Public 800 660 N/A 2,644 3,304
Southern Farmland Crawford Private 2,000 991 N/A 8,270 9,261
Southern Farmland Crawford Public 200 200 11/12/2015 1,287 1,487
Southern Farmland Dane Private 2,700 990 N/A 10,387 11,377
Southern Farmland Dane Public 500 500 12/03/2015 2,657 3,157
Southern Farmland Dodge Private 1,325 1,154 N/A 10,085 11,239
Southern Farmland Dodge Public 125 125 09/09/2015 2,933 3,058
Southern Farmland Grant Private 2,550 1,289 N/A 11,356 12,645
Southern Farmland Grant Public 250 250 11/20/2015 1,275 1,525

11
Table 1. Antlerless permit availability and issuance by deer management zone, unit and landtype for 2015.
Deer Management Zone County Land Type
Bonus Permits
Available
Bonus Permits
Sold Date Sold
Out
Farmland Antlerless
Issued
Total Antlerless Issued
Southern Farmland Green Private 1,450 624 N/A 5,062 5,686
Southern Farmland Green Public 125 125 11/15/2015 797 922
Southern Farmland Iowa Private 3,000 1,075 N/A 9,257 10,332
Southern Farmland Iowa Public 400 400 11/26/2015 1,295 1,695 Southern Farmland Jefferson Private 875 862 N/A 6,801 7,663
Southern Farmland Jefferson Public 50 50 08/21/2015 2,445 2,495
Southern Farmland Kenosha Private 50 50 08/27/2015 1,827 1,877
Southern Farmland Kenosha Public 25 25 08/20/2015 1,007 1,032
Southern Farmland Lafayette Private 1,050 750 N/A 4,308 5,058
Southern Farmland Lafayette Public 25 25 08/24/2015 634 659
Southern Farmland Milwaukee Private 600 121 N/A 400 521
Southern Farmland Milwaukee Public 75 21 N/A 85 106
Southern Farmland Ozaukee Private 850 486 N/A 3,245 3,731
Southern Farmland Ozaukee Public 150 150 11/20/2015 666 816
Southern Farmland Racine Private 0 0 N/A 2,512 2,512
Southern Farmland Racine Public 0 0 N/A 1,014 1,014 Southern Farmland Richland Private 2,650 1,254 N/A 10,001 11,255
Southern Farmland Richland Public 350 283 N/A 689 972
Southern Farmland Rock Private 1,550 697 N/A 5,662 6,359
Southern Farmland Rock Public 250 250 11/18/2015 1,683 1,933
Southern Farmland Sauk Private 3,200 1,423 N/A 12,765 14,188
Southern Farmland Sauk Public 500 500 11/20/2015 2,288 2,788
Southern Farmland Vernon Private 3,700 1,649 N/A 12,257 13,906
Southern Farmland Vernon Public 300 300 11/13/2015 1,593 1,893
Southern Farmland Walworth Private 375 375 11/18/2015 3,749 4,124
Southern Farmland Walworth Public 150 150 09/14/2015 2,058 2,208
Southern Farmland Washington Private 1,350 935 N/A 8,111 9,046
Southern Farmland Washington Public 350 350 10/17/2015 3,020 3,370 Southern Farmland Waukesha Private 925 826 N/A 6,076 6,902
Southern Farmland Waukesha Public 375 375 11/14/2015 3,322 3,697
Southern Farmland Total Private 36,875 21,373 177,114 198,487
Grand Total 143,775 87,529 649,230 736,759

12
Table 2. Antlerless deer quota, permits available, permits issued, harvest, and percent of quota killed by Deer Management Zone and Unit for the 2015 season.
Deer Management Zone County
Antlerless Quota
Permits Available
(Bonus+Farmland) Permits Issued
Antlerless Harvest
% of Quota
Central Farmland Adams 1,525 1,850 10,597 967 63.41%
Central Farmland Barron 2,780 1,325 17,248 3,716 133.67%
Central Farmland Brown 2,700 1,000 10,217 1,608 59.56%
Central Farmland Buffalo 9,000 4,500 14,752 4,626 51.40%
Central Farmland Calumet 1,520 550 4,924 768 50.53%
Central Farmland Chippewa 1,087 575 17,360 3,316 305.06%
Central Farmland Clark 2,500 1,375 17,140 2,904 116.16%
Central Farmland Door 5,000 2,000 9,618 2,001 40.02%
Central Farmland Dunn 550 2,500 16,442 4,358 792.36%
Central Farmland Eau Claire 220 1,150 10,432 1,579 717.73%
Central Farmland Fond Du Lac 2,500 1,175 14,597 2,476 99.04%
Central Farmland Green Lake 4,220 9,000 8,773 2,468 58.48%
Central Farmland Jackson 3,525 1,375 14,409 2,528 71.72%
Central Farmland Juneau 2,400 1,325 11,437 1,528 63.67%
Central Farmland Kewaunee 3,400 1,300 7,235 1,552 45.65%
Central Farmland La Crosse 2,100 750 9,828 2,317 110.33%
Central Farmland Manitowoc 5,000 2,150 12,686 2,272 45.44%
Central Farmland Marathon 6,500 3,825 36,385 6,933 106.66%
Central Farmland Marinette 5,000 3,575 19,354 2,000 40.00%
Central Farmland Marquette 6,360 10,000 15,251 3,498 55.00%
Central Farmland Monroe 5,000 1,750 17,007 3,407 68.14%
Central Farmland Oconto 5,860 2,425 21,230 2,932 50.03%
Central Farmland Outagamie 4,620 1,425 13,994 2,524 54.63%
Central Farmland Pepin 2,000 875 4,781 1,567 78.35%
Central Farmland Pierce 4,117 2,300 10,889 2,890 70.20%
Central Farmland Polk 7,670 3,600 21,725 5,198 67.77%
Central Farmland Portage 5,540 2,650 17,697 3,632 65.56%
Central Farmland Shawano 15,000 4,250 25,162 5,539 36.93%
Central Farmland Sheboygan 1,830 1,125 11,689 1,879 102.68%
Central Farmland St Croix 3,000 1,550 11,661 2,311 77.03%
Central Farmland Trempealeau 4,000 500 13,958 4,075 101.88%
Central Farmland Waupaca 12,300 7,500 27,033 6,133 49.86%
Central Farmland Waushara 4,290 1,800 18,609 3,040 70.86%
Central Farmland Winnebago 1,600 500 8,370 1,254 78.38%
Central Farmland Wood 1,800 775 13,032 2,207 122.61%
Central Forest Adams 3,000 6,000 6,000 2,003 66.77%
Central Forest Clark 700 1,450 1,450 953 136.14%
Central Forest Eau Claire 625 1,025 1,025 362 57.92%
Central Forest Jackson 0 0 0 193 N/A
Central Forest Juneau 470 925 925 510 108.51%
Central Forest Monroe 50 100 100 150 300.00%
Central Forest Wood 200 375 375 340 170.00%
Northern Forest Ashland 0 0 0 130 N/A
Northern Forest Bayfield 0 0 0 333 N/A

13
Table 2. Antlerless deer quota, permits available, permits issued, harvest, and percent of quota killed by Deer Management Zone and Unit for the 2015 season.
Deer Management Zone County
Antlerless Quota
Permits Available
(Bonus+Farmland) Permits Issued
Antlerless Harvest
% of Quota
Northern Forest Burnett 500 1,075 1,075 939 187.80%
Northern Forest Douglas (Superior Subzone) 0 200 200 74 N/A
Northern Forest Florence 0 0 0 277 N/A
Northern Forest Forest 0 0 0 233 N/A
Northern Forest Iron 0 0 0 52 N/A
Northern Forest Langlade 0 0 0 397 N/A
Northern Forest Lincoln 380 1,000 1,000 790 207.89%
Northern Forest Marinette 350 950 950 933 266.57%
Northern Forest Menominee 0 0 0 1 N/A
Northern Forest Oconto 100 300 700 420 420.00%
Northern Forest Oneida 0 0 0 494 N/A
Northern Forest Price 0 0 0 384 N/A
Northern Forest Rusk 500 1,225 1,225 1,071 214.20%
Northern Forest Sawyer 0 0 0 280 N/A
Northern Forest Taylor 1,550 3,525 3,525 2,137 137.87%
Northern Forest Vilas 0 0 0 345 N/A
Northern Forest Washburn 1,600 4,200 4,200 1,826 114.13%
Southern Farmland Columbia 5,200 2,475 15,978 3,317 63.79%
Southern Farmland Crawford 4,840 2,200 10,748 2,818 58.22%
Southern Farmland Dane 5,030 3,200 14,534 2,270 45.13%
Southern Farmland Dodge 2,725 1,500 14,297 2,740 100.55%
Southern Farmland Grant 6,170 2,800 14,170 3,894 63.11%
Southern Farmland Green 2,000 1,575 6,608 1,334 66.70%
Southern Farmland Iowa 3,800 3,400 12,027 2,706 71.21%
Southern Farmland Jefferson 1,500 925 10,158 1,460 97.33%
Southern Farmland Kenosha 50 75 2,909 199 398.00%
Southern Farmland Lafayette 1,820 1,075 5,717 1,469 80.71%
Southern Farmland Milwaukee 280 675 627 121 43.21%
Southern Farmland Ozaukee 1,290 1,000 4,547 760 58.91%
Southern Farmland Racine 0 0 3,526 254 N/A
Southern Farmland Richland 5,000 3,000 12,227 3,133 62.66%
Southern Farmland Rock 1,460 1,800 8,292 1,147 78.56%
Southern Farmland Sauk 7,160 3,700 16,976 4,049 56.55%
Southern Farmland Vernon 8,000 4,000 15,799 4,417 55.21%
Southern Farmland Walworth 580 525 6,332 670 115.52%
Southern Farmland Washington 2,730 1,700 12,416 1,713 62.75%
Southern Farmland Waukesha 1,300 1,300 10,599 1,210 93.08%

14
Table 3. Nine-day gun season opening day deer hunting pressure expressed as hunters per square mile of deer range, with current deer range densities 2014-15.
Deer Management Zone
County Deer
Range 2014
a 2015
a
Central Farmland Adams 72.07 31.4 25.1
Central Farmland Barron 530.99 14.2 18
Central Farmland Brown 113.47 37.3 34.1
Central Farmland Buffalo 559.95 15.4 18.2
Central Farmland Calumet 68.6 33.0 58.3
Central Farmland Chippewa 665.88 10.0 15.1
Central Farmland Clark 273.17 13.3 18.4
Central Farmland Door 272.16 20.0 20.9
Central Farmland Dunn 585.77 12.9 13.4
Central Farmland Eau Claire 287.72 13.1 12.1
Central Farmland Fond Du Lac 214.43 32.4 34.3
Central Farmland Green Lake 179.13 26.1 26.7
Central Farmland Jackson 374.28 21.0 15.9
Central Farmland Juneau 231.29 18.9 15.6
Central Farmland Kewaunee 97.56 52.6 43.6
Central Farmland La Crosse 320.14 20.3 17.7
Central Farmland Manitowoc 174.95 30.2 53.1
Central Farmland Marathon 1000.16 18.0 23.2
Central Farmland Marinette 345.96 13.5 16
Central Farmland Marquette 342.73 20.3 31.2
Central Farmland Monroe 539.21 17.9 15.6
Central Farmland Oconto 413.03 25.2 30.9
Central Farmland Outagamie 192.9 27.4 32.8
Central Farmland Pepin 165.04 20.1 17.2
Central Farmland Pierce 266.77 20.4 24.2
Central Farmland Polk 623.37 17.9 21.3
Central Farmland Portage 502.89 23.4 18.2
Central Farmland St. Croix 239.24 23.3 18.9
Central Farmland Shawano 579.7 24.0 27.4
Central Farmland Sheboygan 190.74 27.7 30.4
Central Farmland Trempealeau 541.65 17.8 17.6
Central Farmland Waupaca 480.64 33.3 41.3
Central Farmland Waushara 383.45 28.3 27.3
Central Farmland Winnebago 112.94 26.7 35.4
Central Farmland Wood 263.13 18.4 25
Central Forest Adams 430.39 23.2 24.9
Central Forest Clark 474.71 22.6 18.2
Central Forest Eau Claire 173.23 14.8 10.4
Central Forest Jackson 452.88 9.0 7.7
Central Forest Juneau 380.52 13.9 12.9
Central Forest Monroe 108.57 12.5 7.1
Central Forest Wood 294.58 13.8 9.6
Northern Forest Ashland 821.69 5.3 5.3
Northern Forest Bayfield 1409.69 7.8 8.9
Northern Forest Burnett 762.68 12.5 13.2
Northern Forest Douglas 1238.2 6.1 7.9
Northern Forest Florence 477.22 18.0 17.6
Northern Forest Forest 996.54 9.2 9.7
Northern Forest Iron 711.55 4.7 5.6
Northern Forest Langlade 748.59 11.7 13.8

15
Table 3. Nine-day gun season opening day deer hunting pressure expressed as hunters per square mile of deer range, with current deer range densities 2014-15.
Deer Management Zone
County Deer
Range 2014
a 2015
a
Northern Forest Lincoln 797.12 14.2 13.3
Northern Forest Marinette 920.62 16.7 20.3
Northern Forest Menominee . .
Northern Forest Oconto 336.93 21.1 14.2
Northern Forest Oneida 1072.2 10.0 11.9
Northern Forest Price 1199.87 10.3 11.5
Northern Forest Rusk 818.11 11.1 11.2
Northern Forest Sawyer 1113.47 9.2 7.5
Northern Forest Taylor 814.2 16.5 14.7
Northern Forest Vilas 769.09 12.4 12.1
Northern Forest Washburn 745.84 11.9 14.4
Southern Farmland Columbia 370.92 33.0 29.9
Southern Farmland Crawford 455.33 12.9 15
Southern Farmland Dane 428.74 14.4 13.8
Southern Farmland Dodge 272.75 22.7 26
Southern Farmland Grant 547.09 16.0 16.7
Southern Farmland Green 179.79 12.6 20.1
Southern Farmland Iowa 417.64 21.3 17.3
Southern Farmland Jefferson 196.83 29.9 17.7
Southern Farmland Kenosha 92.74 6.5 7
Southern Farmland Lafayette 146.29 26.8 23.8
Southern Farmland Milwaukee 46.42 . .
Southern Farmland Ozaukee 78.21 13.5 21.4
Southern Farmland Racine 100.29 12.0 5.1
Southern Farmland Richland 415.11 20.0 19.9
Southern Farmland Rock 138.42 15.3 19.6
Southern Farmland Sauk 525.39 15.8 20.6
Southern Farmland Vernon 525.85 16.1 22.3
Southern Farmland Walworth 177.47 10.2 13.8
Southern Farmland Washington 187.83 17.7 17.9
Southern Farmland Waukesha 245.97 9.2 7.9
a Opening day pressure is obtained from a survey sent to 10,000 Gun Deer and Sports license holders every year. The survey asks
hunters to list the unit they hunted in each day of the season. Results from this survey are expanded to estimate the total hunters in each unit. Sampling problems can affect the estimates. Quota permit allocation and season structure may also shift hunting pressure. Questions or comments should be directed to Brian Dhuey.

16
GUN HARVEST
Wisconsin hunters killed 222,731 deer with a firearm during the 2015 Youth, 9-day gun, muzzleloader, December antlerless only, and holiday deer seasons. Summaries of the harvest by deer management zone and unit are found in Tables 4-8 and Figures 1-4, respectively. Table 4. The total 2015 gun deer harvest by deer management zone.
Deer Management Zone Antlered Antlerless Unknown Total Damagea
Central Farmland Zone 52,136 78,840 0 130,976 2,477
Central Forest Zone 5,497 3,563 0 9,060 152
Northern Forest Zone 19,528 9,266 0 28,794 470
Southern Farmland Zone 22,596 31,279 2 53,877 1,254
Unknown Zone 0 24 0 24 24
Total 99,757 122,972 2 222,731 4,377 a Included in antlered and antlerless totals
Figure 1. The 2015 gun deer harvest by deer management zone.

17
Total Gun Deer Harvest = 222,731
Figure 2. The 2015 gun harvest by deer management unit, youth, 9-day, muzzleloader, and December antlerless seasons.

18
Total Muzzleloader Harvest = 5,478 Figure 3. The 2015 muzzleloader harvest by deer management unit.
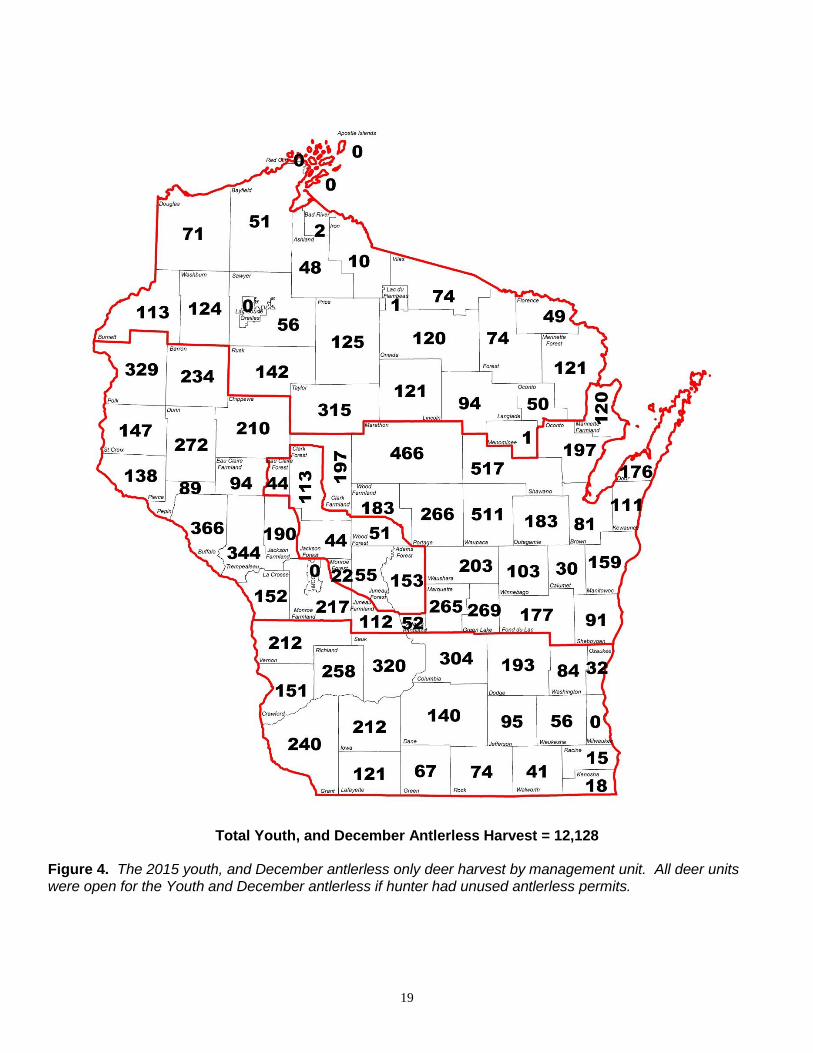
19
Total Youth, and December Antlerless Harvest = 12,128 Figure 4. The 2015 youth, and December antlerless only deer harvest by management unit. All deer units were open for the Youth and December antlerless if hunter had unused antlerless permits.

20
Table 5. Summary of the 2015 9-day gun deer harvest by zone and unit.
County
Deer Management Zone
9-Day Antlered
9-Day Antlerless
9-Day Unks
9-Day Total County
Deer Management Zone
9-Day Antlered
9-Day Antlerless
9-Day Unks
9-Day Total
Adams Central Farmland 348 676 0 1,024 Ashland Northern Forest 412 84 0 496
Barron Central Farmland 1,718 2,828 0 4,546 Apostle Islands Northern Forest 0 2 0 2
Brown Central Farmland 700 838 0 1,538 Bad River Northern Forest 35 11 0 46
Buffalo Central Farmland 1,736 3,146 0 4,882 Madeline Island Northern Forest 47 7 0 54
Calumet Central Farmland 391 539 0 930 Bayfield Northern Forest 1,360 256 0 1,616
Chippewa Central Farmland 1,416 2,373 0 3,789 Burnett Northern Forest 1,471 687 0 2,158
Clark Central Farmland 1,231 2,090 0 3,321 Douglas Northern Forest 1,276 352 0 1,628
Door Central Farmland 1,372 1,361 0 2,733 Florence Northern Forest 624 228 0 852
Dunn Central Farmland 2,004 3,325 0 5,329 Forest Northern Forest 618 158 0 776
Eau Claire Central Farmland 702 1,018 0 1,720 Iron Northern Forest 190 35 0 225
Fond du Lac Central Farmland 1,174 1,615 0 2,789 Lac Corte Oreilles Northern Forest 6 1 0 7
Green Lake Central Farmland 1,283 1,617 0 2,900 Lac du Flambeau Northern Forest 3 2 0 5
Jackson Central Farmland 1,231 1,791 0 3,022 Langlade Northern Forest 1,036 288 0 1,324
Juneau Central Farmland 775 1,137 0 1,912 Lincoln Northern Forest 972 521 0 1,493
Kewaunee Central Farmland 990 1,121 0 2,111 Marinette Northern Forest 1,840 639 0 2,479
La Crosse Central Farmland 1,152 1,643 0 2,795 Menominee Northern Forest 1 0 0 1
Manitowoc Central Farmland 1,236 1,552 0 2,788 Oconto Northern Forest 712 259 0 971
Marathon Central Farmland 3,201 4,965 0 8,166 Oneida Northern Forest 995 322 0 1,317
Marinette Central Farmland 1,030 1,247 0 2,277 Price Northern Forest 973 250 0 1,223
Marquette Central Farmland 1,745 2,404 0 4,149 Red Cliff Northern Forest 2 0 0 2
MCCoy Central Farmland 214 303 0 517 Rusk Northern Forest 1,309 729 0 2,038
Monroe Central Farmland 1,855 2,524 0 4,379 Sawyer Northern Forest 949 221 0 1,170
Oconto Central Farmland 1,455 1,879 0 3,334 Taylor Northern Forest 1,547 1,292 0 2,839
Outagamie Central Farmland 1,201 1,572 0 2,773 Vilas Northern Forest 687 236 0 923
Pepin Central Farmland 691 1,142 0 1,833 Washburn Northern Forest 1,287 1,324 0 2,611
Pierce Central Farmland 1,205 2,142 0 3,347 Northern Forest Total 18,352 7,904 0 26,256
Polk Central Farmland 2,212 3,990 0 6,202 Columbia Southern Farmland 1,883 2,279 1 4,163
Portage Central Farmland 1,833 2,644 0 4,477 Crawford Southern Farmland 1,587 2,336 0 3,923
St Croix Central Farmland 967 1,549 0 2,516 Dane Southern Farmland 1,192 1,494 1 2,687
Shawano Central Farmland 3,043 3,698 0 6,741 Dodge Southern Farmland 1,282 1,911 0 3,193
Sheboygan Central Farmland 781 1,295 0 2,076 Grant Southern Farmland 2,364 3,116 0 5,480
Trempealeau Central Farmland 1,974 3,005 0 4,979 Green Southern Farmland 694 979 0 1,673
Waupaca Central Farmland 3,095 4,068 0 7,163 Iowa Southern Farmland 1,736 1,958 0 3,694
Waushara Central Farmland 1,556 2,088 0 3,644 Jefferson Southern Farmland 662 1,004 0 1,666
Winnebago Central Farmland 589 706 0 1,295 Kenosha Southern Farmland 96 80 0 176
Wood Central Farmland 944 1,479 0 2,423 Lafayette Southern Farmland 782 1,114 0 1,896
Central Farmland Total 49,050 71,370 0 120,420 Milwaukee Southern Farmland 49 46 0 95
Adams Central Forest 1,224 1,384 0 2,608 Ozaukee Southern Farmland 225 351 0 576
Clark Central Forest 1,341 709 0 2,050 Racine Southern Farmland 167 154 0 321
Eau Claire Central Forest 406 239 0 645 Richland Southern Farmland 2,091 2,385 0 4,476
Jackson Central Forest 599 143 0 742 Rock Southern Farmland 552 739 0 1,291
Juneau Central Forest 687 366 0 1,053 Sauk Southern Farmland 2,496 2,976 0 5,472
Monroe Central Forest 354 101 0 455 Vernon Southern Farmland 2,442 3,554 0 5,996
Wood Central Forest 641 246 0 887 Walworth Southern Farmland 322 403 0 725
Central Forest Total 5,252 3,188 0 8,440 Washington Southern Farmland 612 975 0 1,587
Waukesha Southern Farmland 380 515 0 895
Southern Farmland Total 21,614 28,369 2 49,985
Unknown Unknown 0 24 24
Unknown Total 0 24 0 24
Grand Total 94,268 110,855 2 205,125
21
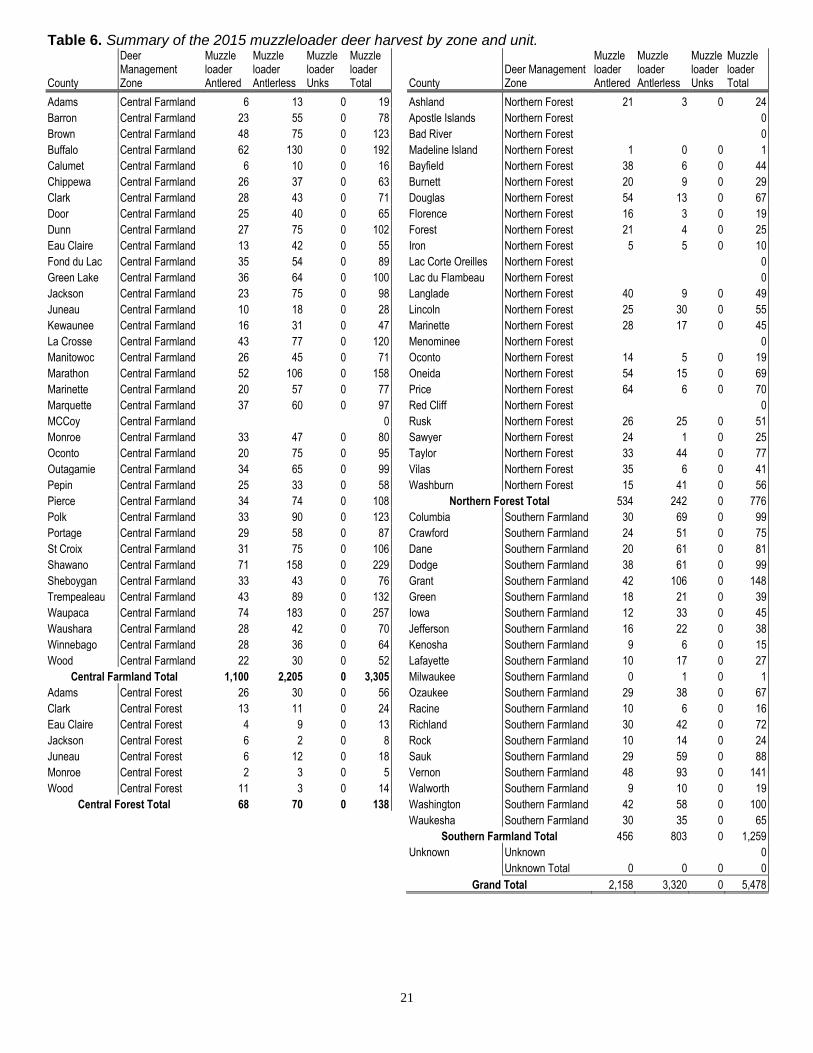
Table 6. Summary of the 2015 muzzleloader deer harvest by zone and unit.
County
Deer Management Zone
Muzzle loader Antlered
Muzzle loader Antlerless
Muzzle loader Unks
Muzzle loader Total County
Deer Management Zone
Muzzle loader Antlered
Muzzle loader Antlerless
Muzzle loader Unks
Muzzle loader Total
Adams Central Farmland 6 13 0 19 Ashland Northern Forest 21 3 0 24
Barron Central Farmland 23 55 0 78 Apostle Islands Northern Forest 0
Brown Central Farmland 48 75 0 123 Bad River Northern Forest 0
Buffalo Central Farmland 62 130 0 192 Madeline Island Northern Forest 1 0 0 1
Calumet Central Farmland 6 10 0 16 Bayfield Northern Forest 38 6 0 44
Chippewa Central Farmland 26 37 0 63 Burnett Northern Forest 20 9 0 29
Clark Central Farmland 28 43 0 71 Douglas Northern Forest 54 13 0 67
Door Central Farmland 25 40 0 65 Florence Northern Forest 16 3 0 19
Dunn Central Farmland 27 75 0 102 Forest Northern Forest 21 4 0 25
Eau Claire Central Farmland 13 42 0 55 Iron Northern Forest 5 5 0 10
Fond du Lac Central Farmland 35 54 0 89 Lac Corte Oreilles Northern Forest 0
Green Lake Central Farmland 36 64 0 100 Lac du Flambeau Northern Forest 0
Jackson Central Farmland 23 75 0 98 Langlade Northern Forest 40 9 0 49
Juneau Central Farmland 10 18 0 28 Lincoln Northern Forest 25 30 0 55
Kewaunee Central Farmland 16 31 0 47 Marinette Northern Forest 28 17 0 45
La Crosse Central Farmland 43 77 0 120 Menominee Northern Forest 0
Manitowoc Central Farmland 26 45 0 71 Oconto Northern Forest 14 5 0 19
Marathon Central Farmland 52 106 0 158 Oneida Northern Forest 54 15 0 69
Marinette Central Farmland 20 57 0 77 Price Northern Forest 64 6 0 70
Marquette Central Farmland 37 60 0 97 Red Cliff Northern Forest 0
MCCoy Central Farmland 0 Rusk Northern Forest 26 25 0 51
Monroe Central Farmland 33 47 0 80 Sawyer Northern Forest 24 1 0 25
Oconto Central Farmland 20 75 0 95 Taylor Northern Forest 33 44 0 77
Outagamie Central Farmland 34 65 0 99 Vilas Northern Forest 35 6 0 41
Pepin Central Farmland 25 33 0 58 Washburn Northern Forest 15 41 0 56
Pierce Central Farmland 34 74 0 108 Northern Forest Total 534 242 0 776
Polk Central Farmland 33 90 0 123 Columbia Southern Farmland 30 69 0 99
Portage Central Farmland 29 58 0 87 Crawford Southern Farmland 24 51 0 75
St Croix Central Farmland 31 75 0 106 Dane Southern Farmland 20 61 0 81
Shawano Central Farmland 71 158 0 229 Dodge Southern Farmland 38 61 0 99
Sheboygan Central Farmland 33 43 0 76 Grant Southern Farmland 42 106 0 148
Trempealeau Central Farmland 43 89 0 132 Green Southern Farmland 18 21 0 39
Waupaca Central Farmland 74 183 0 257 Iowa Southern Farmland 12 33 0 45
Waushara Central Farmland 28 42 0 70 Jefferson Southern Farmland 16 22 0 38
Winnebago Central Farmland 28 36 0 64 Kenosha Southern Farmland 9 6 0 15
Wood Central Farmland 22 30 0 52 Lafayette Southern Farmland 10 17 0 27
Central Farmland Total 1,100 2,205 0 3,305 Milwaukee Southern Farmland 0 1 0 1
Adams Central Forest 26 30 0 56 Ozaukee Southern Farmland 29 38 0 67
Clark Central Forest 13 11 0 24 Racine Southern Farmland 10 6 0 16
Eau Claire Central Forest 4 9 0 13 Richland Southern Farmland 30 42 0 72
Jackson Central Forest 6 2 0 8 Rock Southern Farmland 10 14 0 24
Juneau Central Forest 6 12 0 18 Sauk Southern Farmland 29 59 0 88
Monroe Central Forest 2 3 0 5 Vernon Southern Farmland 48 93 0 141
Wood Central Forest 11 3 0 14 Walworth Southern Farmland 9 10 0 19
Central Forest Total 68 70 0 138 Washington Southern Farmland 42 58 0 100
Waukesha Southern Farmland 30 35 0 65
Southern Farmland Total 456 803 0 1,259
Unknown Unknown 0
Unknown Total 0 0 0 0
Grand Total 2,158 3,320 0 5,478

22
Table 7. Summary of the 2015 Youth and December antlerless season deer harvest by zone and unit.
County
Deer Management Zone Antlered Antlerless Unks Total Kill County
Deer Management Zone Antlered Antlerless Unks Total
Adams Central Farmland 6 46 0 52 Ashland Northern Forest 28 20 0 48
Barron Central Farmland 85 149 0 234 Apostle Islands Northern Forest 0 0 0 0
Brown Central Farmland 18 63 0 81 Bad River Northern Forest 1 1 0 2
Buffalo Central Farmland 71 295 0 366 Madeline Island Northern Forest 0 0 0 0
Calumet Central Farmland 5 25 0 30 Bayfield Northern Forest 26 25 0 51
Chippewa Central Farmland 74 136 0 210 Burnett Northern Forest 42 71 0 113
Clark Central Farmland 64 133 0 197 Douglas Northern Forest 24 47 0 71
Door Central Farmland 49 127 0 176 Florence Northern Forest 25 24 0 49
Dunn Central Farmland 83 189 0 272 Forest Northern Forest 28 46 0 74
Eau Claire Central Farmland 19 75 0 94 Iron Northern Forest 2 8 0 10
Fond du Lac Central Farmland 33 144 0 177 Lac Corte Oreilles Northern Forest 0 0 0 0
Green Lake Central Farmland 52 217 0 269 Lac du Flambeau Northern Forest 1 0 0 1
Jackson Central Farmland 50 140 0 190 Langlade Northern Forest 37 57 0 94
Juneau Central Farmland 29 83 0 112 Lincoln Northern Forest 32 89 0 121
Kewaunee Central Farmland 36 75 0 111 Marinette Northern Forest 47 74 0 121
La Crosse Central Farmland 28 124 0 152 Menominee Northern Forest 0 1 0 1
Manitowoc Central Farmland 51 108 0 159 Oconto Northern Forest 21 29 0 50
Marathon Central Farmland 149 317 0 466 Oneida Northern Forest 43 77 0 120
Marinette Central Farmland 24 96 0 120 Price Northern Forest 48 77 0 125
Marquette Central Farmland 62 203 0 265 Red Cliff Northern Forest 0 0 0 0
MCCoy Central Farmland 0 0 0 0 Rusk Northern Forest 51 91 0 142
Monroe Central Farmland 54 163 0 217 Sawyer Northern Forest 24 32 0 56
Oconto Central Farmland 49 148 0 197 Taylor Northern Forest 100 215 0 315
Outagamie Central Farmland 49 134 0 183 Vilas Northern Forest 25 49 0 74
Pepin Central Farmland 24 65 0 89 Washburn Northern Forest 37 87 0 124
Pierce Central Farmland 25 113 0 138 Northern Forest Total 642 1,120 0 1,762
Polk Central Farmland 87 242 0 329 Columbia Southern Farmland 62 242 0 304
Portage Central Farmland 88 178 0 266 Crawford Southern Farmland 39 112 0 151
St Croix Central Farmland 41 106 0 147 Dane Southern Farmland 21 119 0 140
Shawano Central Farmland 155 362 0 517 Dodge Southern Farmland 34 159 0 193
Sheboygan Central Farmland 16 75 0 91 Grant Southern Farmland 48 192 0 240
Trempealeau Central Farmland 112 232 0 344 Green Southern Farmland 7 60 0 67
Waupaca Central Farmland 147 364 0 511 Iowa Southern Farmland 37 175 0 212
Waushara Central Farmland 63 140 0 203 Jefferson Southern Farmland 15 80 0 95
Winnebago Central Farmland 22 81 0 103 Kenosha Southern Farmland 4 14 0 18
Wood Central Farmland 66 117 0 183 Lafayette Southern Farmland 22 99 0 121
Central Farmland Total 1,986 5,265 0 7,251 Milwaukee Southern Farmland 0 0 0 0
Adams Central Forest 37 116 0 153 Ozaukee Southern Farmland 4 28 0 32
Clark Central Forest 46 67 0 113 Racine Southern Farmland 1 14 0 15
Eau Claire Central Forest 12 32 0 44 Richland Southern Farmland 62 196 0 258
Jackson Central Forest 17 27 0 44 Rock Southern Farmland 15 59 0 74
Juneau Central Forest 30 25 0 55 Sauk Southern Farmland 72 248 0 320
Monroe Central Forest 8 14 0 22 Vernon Southern Farmland 54 158 0 212
Wood Central Forest 27 24 0 51 Walworth Southern Farmland 6 35 0 41
Central Forest Total 177 305 0 482 Washington Southern Farmland 15 69 0 84
Waukesha Southern Farmland 8 48 0 56
Southern Farmland Total 526 2,107 0 2,633
Unknown Unknown 0 0 0 0
Unknown Total 0 0 0 0
Grand Total 3,331 8,797 0 12,128

23
Table 8. Summary of the 2015 gun deer harvest by zone and unit (includes Youth, 9-day, damage, muzzleloader, and December antlerless seasons).
County
Deer Management Zone Antlered Antlerless Unknown Total Kill County
Deer Management Zone Antlered Antlerless Unknown Total Kill
Adams Central Farmland 360 735 0 1,095 Ashland Northern Forest 461 107 0 568
Barron Central Farmland 1,826 3,032 0 4,858 Apostle Islands Northern Forest 0 2 0 2
Brown Central Farmland 766 976 0 1,742 Bad River Northern Forest 36 12 0 48
Buffalo Central Farmland 1,869 3,571 0 5,440 Madeline Island Northern Forest 48 7 0 55
Calumet Central Farmland 402 574 0 976 Bayfield Northern Forest 1,424 287 0 1,711
Chippewa Central Farmland 1,516 2,546 0 4,062 Burnett Northern Forest 1,533 767 0 2,300
Clark Central Farmland 1,323 2,266 0 3,589 Douglas Northern Forest 1,354 412 0 1,766
Door Central Farmland 1,446 1,528 0 2,974 Florence Northern Forest 665 255 0 920
Dunn Central Farmland 2,114 3,589 0 5,703 Forest Northern Forest 667 208 0 875
Eau Claire Central Farmland 734 1,135 0 1,869 Iron Northern Forest 197 48 0 245
Fond du Lac Central Farmland 1,242 1,813 0 3,055 Lac Corte Oreilles Northern Forest 6 1 0 7
Green Lake Central Farmland 1,371 1,898 0 3,269 Lac du Flambeau Northern Forest 4 2 0 6
Jackson Central Farmland 1,304 2,006 0 3,310 Langlade Northern Forest 1,113 354 0 1,467
Juneau Central Farmland 814 1,238 0 2,052 Lincoln Northern Forest 1,029 640 0 1,669
Kewaunee Central Farmland 1,042 1,227 0 2,269 Marinette Northern Forest 1,915 730 0 2,645
La Crosse Central Farmland 1,223 1,844 0 3,067 Menominee Northern Forest 1 1 0 2
Manitowoc Central Farmland 1,313 1,705 0 3,018 Oconto Northern Forest 747 293 0 1,040
Marathon Central Farmland 3,402 5,388 0 8,790 Oneida Northern Forest 1,092 414 0 1,506
Marinette Central Farmland 1,074 1,400 0 2,474 Price Northern Forest 1,085 333 0 1,418
Marquette Central Farmland 1,844 2,667 0 4,511 Red Cliff Northern Forest 2 0 0 2
MCCoy Central Farmland 214 303 0 517 Rusk Northern Forest 1,386 845 0 2,231
Monroe Central Farmland 1,942 2,734 0 4,676 Sawyer Northern Forest 997 254 0 1,251
Oconto Central Farmland 1,524 2,102 0 3,626 Taylor Northern Forest 1,680 1,551 0 3,231
Outagamie Central Farmland 1,284 1,771 0 3,055 Vilas Northern Forest 747 291 0 1,038
Pepin Central Farmland 740 1,240 0 1,980 Washburn Northern Forest 1,339 1,452 0 2,791
Pierce Central Farmland 1,264 2,329 0 3,593 Northern Forest Total 19,528 9,266 0 28,794
Polk Central Farmland 2,332 4,322 0 6,654 Columbia Southern Farmland 1,975 2,590 1 4,566
Portage Central Farmland 1,950 2,880 0 4,830 Crawford Southern Farmland 1,650 2,499 0 4,149
St Croix Central Farmland 1,039 1,730 0 2,769 Dane Southern Farmland 1,233 1,674 1 2,908
Shawano Central Farmland 3,269 4,218 0 7,487 Dodge Southern Farmland 1,354 2,131 0 3,485
Sheboygan Central Farmland 830 1,413 0 2,243 Grant Southern Farmland 2,454 3,414 0 5,868
Trempealeau Central Farmland 2,129 3,326 0 5,455 Green Southern Farmland 719 1,060 0 1,779
Waupaca Central Farmland 3,316 4,615 0 7,931 Iowa Southern Farmland 1,785 2,166 0 3,951
Waushara Central Farmland 1,647 2,270 0 3,917 Jefferson Southern Farmland 693 1,106 0 1,799
Winnebago Central Farmland 639 823 0 1,462 Kenosha Southern Farmland 109 100 0 209
Wood Central Farmland 1,032 1,626 0 2,658 Lafayette Southern Farmland 814 1,230 0 2,044
Central Farmland Total 52,136 78,840 0 130,976 Milwaukee Southern Farmland 49 47 0 96
Adams Central Forest 1,287 1,530 0 2,817 Ozaukee Southern Farmland 258 417 0 675
Clark Central Forest 1,400 787 0 2,187 Racine Southern Farmland 178 174 0 352
Eau Claire Central Forest 422 280 0 702 Richland Southern Farmland 2,183 2,623 0 4,806
Jackson Central Forest 622 172 0 794 Rock Southern Farmland 577 812 0 1,389
Juneau Central Forest 723 403 0 1,126 Sauk Southern Farmland 2,597 3,283 0 5,880
Monroe Central Forest 364 118 0 482 Vernon Southern Farmland 2,544 3,805 0 6,349
Wood Central Forest 679 273 0 952 Walworth Southern Farmland 337 448 0 785
Central Forest Total 5,497 3,563 0 9,060 Washington Southern Farmland 669 1,102 0 1,771
Waukesha Southern Farmland 418 598 0 1,016
Southern Farmland Total 22,596 31,279 2 53,877
Unknown Unknown 0 24 0 24
Unknown Total 0 24 0 24
Grand Total 99,757 122,972 2 222,731

24
Hot-Spot Damage Summaries of Wisconsin’s hot-spot damage deer harvest by deer management zone, and deer management unit in Tables 9 & 10. Table 9. The 2015 damage deer harvest summary by deer management zone.
Deer management zone Antlered Antlerless Unknown Total
Central Farmland 132 2,345 0 2,477
Central Forest 4 148 0 152
Northern Forest 22 448 0 470
Southern Farmland 113 1,139 2 1,254
Unknown 0 24 0 24
Total 271 4,104 2 4,377
Figure 5. The 2015 damage deer harvest by deer management zone.

25
Table 10. Summary of the 2015 damage/nuisance deer harvest by unit and deer management zone.
County
Deer Management Zone Antlered Antlerless Unks Total
County
Deer Management Zone Antlered Antlerless Unks Total
Adams Central Farmland 0 5 0 5
Bayfield Northern Forest 1 8 0 9
Barron Central Farmland 5 27 0 32
Burnett Northern Forest 0 21 0 21
Brown Central Farmland 32 110 0 142
Florence Northern Forest 1 93 0 94
Buffalo Central Farmland 5 63 0 68
Forest Northern Forest 1 4 0 5
Calumet Central Farmland 0 6 0 6
Langlade Northern Forest 0 34 0 34
Chippewa Central Farmland 2 15 0 17
Lincoln Northern Forest 2 42 0 44
Clark Central Farmland 1 6 0 7
Marinette Northern Forest 2 44 0 46
Door Central Farmland 1 24 0 25
Oconto Northern Forest 1 2 0 3
Dunn Central Farmland 5 35 0 40
Oneida Northern Forest 0 40 0 40
Eau Claire Central Farmland 2 2 0 4
Price Northern Forest 2 13 0 15
Fond Du Lac Central Farmland 1 20 0 21
Rusk Northern Forest 4 26 0 30
Green Lake Central Farmland 2 200 0 202
Sawyer Northern Forest 1 30 0 31
Jackson Central Farmland 2 57 0 59
Taylor Northern Forest 5 36 0 41
Juneau Central Farmland 0 7 0 7
Vilas Northern Forest 2 25 0 27
Kewaunee Central Farmland 0 17 0 17
Washburn Northern Forest 0 30 0 30
La Crosse Central Farmland 11 63 0 74
Northern Forest Total 22 448 0 470
Manitowoc Central Farmland 5 34 0 39
Columbia Southern Farmland 2 176 1 179
Marathon Central Farmland 7 217 0 224
Crawford Southern Farmland 3 36 0 39
Marinette Central Farmland 3 148 0 151
Dane Southern Farmland 20 53 1 74
Marquette Central Farmland 2 134 0 136
Dodge Southern Farmland 2 22 0 24
Monroe Central Farmland 3 35 0 38
Grant Southern Farmland 0 148 0 148
Oconto Central Farmland 4 40 0 44
Green Southern Farmland 5 5 0 10
Outagamie Central Farmland 5 157 0 162
Iowa Southern Farmland 5 108 0 113
Pepin Central Farmland 0 5 0 5
Jefferson Southern Farmland 1 6 0 7
Pierce Central Farmland 4 8 0 12
Lafayette Southern Farmland 0 29 0 29
Polk Central Farmland 5 118 0 123
Milwaukee Southern Farmland 49 46 0 95
Portage Central Farmland 2 82 0 84
Ozaukee Southern Farmland 2 36 0 38
St. Croix Central Farmland 2 33 0 35
Racine Southern Farmland 1 11 0 12
Shawano Central Farmland 10 190 0 200
Richland Southern Farmland 2 132 0 134
Sheboygan Central Farmland 0 4 0 4
Rock Southern Farmland 0 2 0 2
Trempealeau Central Farmland 3 93 0 96
Sauk Southern Farmland 5 62 0 67
Waupaca Central Farmland 5 208 0 213
Vernon Southern Farmland 2 138 0 140
Waushara Central Farmland 2 80 0 82
Walworth Southern Farmland 0 14 0 14
Winnebago Central Farmland 1 17 0 18
Washington Southern Farmland 5 56 0 61
Wood Central Farmland 0 85 0 85
Waukesha Southern Farmland 9 59 0 68
Central Farmland Total 132 2,345 0 2,477
Southern Farmland Total 113 1,139 2 1,254
Adams Central Forest 1 91 0 92
Adams Unknown 0 17 0 17
Clark Central Forest 0 27 0 27
Jackson Unknown 0 1 0 1
Eau Claire Central Forest 0 2 0 2
Marinette Unknown 0 6 0 6
Jackson Central Forest 2 10 0 12
Unknown Total 0 24 0 24
Juneau Central Forest 0 8 0 8
Grand Total 271 4,104 2 4,377
Monroe Central Forest 0 6 0 6
Wood Central Forest 1 4 0 5
Central Forest Total 4 148 0 152

26
Chippewa Deer Harvest Summary The Lake Superior Chippewa Bands began a negotiated deer season with the State of Wisconsin in 1983. The total harvest for 2015 and past years is given in Table 11. The 2015 Chippewa deer harvest by deer management zone and unit are listed in Table 12. Table 11. Chippewa deer harvest summary, 1983-2015.
Year Antlered Kill Antlerless Kill Unknown Kill Total Kill
1983 235 403 5 643
1984 213 447 28 688
1985 435 945 0 1,380
1986 615 1,530 0 2,145
1987 730 2,099 0 2,829
1988 902 2,468 0 3,370
1989 1,016 2,727 1 3,744
1990 1,101 2,739 2 3,842
1991 1,095 3,844 0 4,939
1992 690 1,850 0 2,540
1993 677 1,787 0 2,464
1994 1,163 2,469 5 3,637
1995 1,584 3,340 1 4,925
1996 1,100 2,224 23 3,347
1997 1,120 2,227 0 3,347
1998 1,529 2,435 0 3,964
1999 1,349 1,896 18 3,263
2000 1,351 1,630 0 2,981
2001 1,047 1,526 0 2,573
2002 861 1,044 0 1,905
2003 1,162 1,524 0 2,686
2004 954 1,068 0 2,022
2005 852 1,305 6 2,163
2006 956 1,354 2 2,312
2007 828 1,015 0 1,843
2008 695 900 0 1,595
2009 540 842 0 1,382
2010 646 847 0 1,493
2011 508 831 1 1,340
2012 666 943 0 1,609
2013 542 817 0 1,359
2014 423 702 0 1,125
2015 491 787 0 1,278

27
Table 12. Summary of the 2015 Chippewa harvest by deer management zone and unit.
Deer Management Zone County Antlered Antlerless Grand Total
Northern Forest Ashland 4 6 10
Northern Forest Barron 1 2 3
Northern Forest Bayfield 68 91 159
Northern Forest Burnett 168 161 329
Central Farmland Chippewa 3 3 6
Northern Forest Douglas 40 91 131
Central Forest Eau Claire 1
1
Northern Forest Florence 1 16 17
Northern Forest Forest 28 60 88
Northern Forest Iron 11 33 44
Northern Forest Langlade 5 13 18
Northern Forest Lincoln 1 1 2
Central Farmland Marathon 1
1
Northern Forest Marinette 2 5 7
Northern Forest Oconto 1 1 2
Northern Forest Oneida 21 50 71
Central Farmland Polk 11 3 14
Northern Forest Price 9 20 29
Northern Forest Rusk 15 10 25
Northern Forest Sawyer 35 86 121
Central Farmland St. Croix
2 2
Northern Forest Taylor 1 1 2
Northern Forest Vilas 38 99 137
Northern Forest Washburn 23 31 54
Unknown 3 2 5
Total 491 787 1,278

28
Bow Harvest Wisconsin bow hunters killed 53,004 deer during the bow deer seasons (Table 14). Table 13. The 2015 bow deer harvest by deer management zone.
Deer Management Zone Antlered Antlerless Unknown Total
Central Farmland 17,394 14,367 0 31,761
Central Forest 1,610 520 0 2,130
Northern Forest 4,628 1,123 0 5,751
Southern Farmland 7,597 5,765 0 13,362
Unknown 0 0 0 0
Total 31,229 21,775 0 53,004
Figure 6. The 2015 bow deer harvest by deer management zone.

29
Total Bow Harvest = 53,004
Figure 7. The 2015 bow deer harvest by deer management zone and unit.

30
Table 14. Summary of the 2015 bow deer harvest by zone and unit (vertical bows).
County Deer Management Zone
Bow Antlered
Bow Antlerless
Bow Unknown
Bow Total Kill County
Deer Management Zone
Bow Antlered
Bow Antlerless
Bow Unknown
Bow Total Kill
Adams Central Farmland 126 144 0 270 Ashland Northern Forest 95 11 0 106
Barron Central Farmland 522 406 0 928 Apostle Islands Northern Forest 0 0 0 0
Brown Central Farmland 369 366 0 735 Bad River Northern Forest 6 0 0 6
Buffalo Central Farmland 945 722 0 1,667 Madeline Island Northern Forest 9 1 0 10
Calumet Central Farmland 157 112 0 269 Bayfield Northern Forest 277 13 0 290
Chippewa Central Farmland 527 452 0 979 Burnett Northern Forest 352 112 0 464
Clark Central Farmland 349 373 0 722 Douglas Northern Forest 301 79 0 380
Door Central Farmland 324 240 0 564 Florence Northern Forest 103 11 0 114
Dunn Central Farmland 646 480 0 1,126 Forest Northern Forest 113 9 0 122
Eau Claire Central Farmland 235 271 0 506 Iron Northern Forest 20 1 0 21
Fond du Lac Central Farmland 534 431 0 965 Lac Corte Oreilles Northern Forest 1 0 0 1
Green Lake Central Farmland 430 352 0 782 Lac du Flambeau Northern Forest 1 0 0 1
Jackson Central Farmland 434 340 0 774 Langlade Northern Forest 263 16 0 279
Juneau Central Farmland 204 196 0 400 Lincoln Northern Forest 304 75 0 379
Kewaunee Central Farmland 299 181 0 480 Marinette Northern Forest 353 98 0 451
La Crosse Central Farmland 413 316 0 729 Menominee Northern Forest 1 0 0 1
Manitowoc Central Farmland 464 327 0 791 Oconto Northern Forest 201 49 0 250
Marathon Central Farmland 1,101 844 0 1,945 Oneida Northern Forest 313 26 0 339
Marinette Central Farmland 214 320 0 534 Price Northern Forest 288 27 0 315
Marquette Central Farmland 603 530 0 1,133 Red Cliff Northern Forest 0 0 0 0
MCCoy Central Farmland 68 85 0 153 Rusk Northern Forest 390 105 0 495
Monroe Central Farmland 517 468 0 985 Sawyer Northern Forest 266 12 0 278
Oconto Central Farmland 402 428 0 830 Taylor Northern Forest 468 269 0 737
Outagamie Central Farmland 579 451 0 1,030 Vilas Northern Forest 198 26 0 224
Pepin Central Farmland 199 195 0 394 Washburn Northern Forest 305 183 0 488
Pierce Central Farmland 395 361 0 756 Northern Forest Total 4,628 1,123 0 5,751
Polk Central Farmland 700 570 0 1,270 Columbia Southern Farmland 649 462 0 1,111
Portage Central Farmland 576 456 0 1,032 Crawford Southern Farmland 402 217 0 619
St Croix Central Farmland 440 410 0 850 Dane Southern Farmland 531 441 0 972
Shawano Central Farmland 1,006 809 0 1,815 Dodge Southern Farmland 545 410 0 955
Sheboygan Central Farmland 390 303 0 693 Grant Southern Farmland 577 360 0 937
Trempealeau Central Farmland 706 499 0 1,205 Green Southern Farmland 248 187 0 435
Waupaca Central Farmland 1,184 902 0 2,086 Iowa Southern Farmland 498 404 0 902
Waushara Central Farmland 666 447 0 1,113 Jefferson Southern Farmland 314 243 0 557
Winnebago Central Farmland 300 269 0 569 Kenosha Southern Farmland 84 62 0 146
Wood Central Farmland 370 311 0 681 Lafayette Southern Farmland 224 162 0 386
Central Farmland Total 17,394 14,367 0 31,761 Milwaukee Southern Farmland 43 46 0 89
Adams Central Forest 386 260 0 646 Ozaukee Southern Farmland 196 203 0 399
Clark Central Forest 397 92 0 489 Racine Southern Farmland 103 45 0 148
Eau Claire Central Forest 135 47 0 182 Richland Southern Farmland 541 354 0 895
Jackson Central Forest 190 9 0 199 Rock Southern Farmland 270 234 0 504
Juneau Central Forest 171 53 0 224 Sauk Southern Farmland 669 554 0 1,223
Monroe Central Forest 100 19 0 119 Vernon Southern Farmland 621 441 0 1,062
Wood Central Forest 231 40 0 271 Walworth Southern Farmland 188 146 0 334
Central Forest Total 1,610 520 0 2,130 Washington Southern Farmland 450 399 0 849
Waukesha Southern Farmland 444 395 0 839
Southern Farmland Total 7,597 5,765 0 13,362
Unknown Unknown 0 0 0 0
Unknown Total 0 0 0 0
Grand Total 31,229 21,775 0 53,004

31
Crossbow Harvest Wisconsin crossbow hunters killed 34,094 deer during the crossbow deer seasons (Table 16). Table 15. The 2015 crossbow deer harvest by deer management zone.
Deer Management Zone Antlered Antlerless Unknown Total
Central Farmland 11,112 9,208 0 20,320
Central Forest 1,184 428 0 1,612
Northern Forest 4,723 1,227 0 5,950
Southern Farmland 3,575 2,637 0 6,212
Unknown 0 0 0 0
Total 20,594 13,500 0 34,094
Figure 8. The 2015 crossbow deer harvest by deer management zone.

32
Total Crossbow Harvest = 34,094
Figure 9. The 2015 crossbow harvest by deer management zone and unit

33
Table 16. Summary of the 2015 Crossbow deer harvest by zone and unit.
County
Deer Management Zone
XBow Antlered
XBow Antlerless
XBow Unknown
XBow Total Kill County
Deer Management Zone
XBow Antlered
XBow Antlerless
XBow Unknown
XBow Total Kill
Adams Central Farmland 95 88 0 183 Ashland Northern Forest 136 12 0 148
Barron Central Farmland 307 278 0 585 Apostle Islands Northern Forest 0 0 0 0
Brown Central Farmland 301 266 0 567 Bad River Northern Forest 4 0 0 4
Buffalo Central Farmland 375 333 0 708 Madeline Island Northern Forest 7 0 0 7
Calumet Central Farmland 93 82 0 175 Bayfield Northern Forest 260 33 0 293
Chippewa Central Farmland 376 318 0 694 Burnett Northern Forest 248 60 0 308
Clark Central Farmland 247 265 0 512 Douglas Northern Forest 304 57 0 361
Door Central Farmland 288 233 0 521 Florence Northern Forest 113 11 0 124
Dunn Central Farmland 364 289 0 653 Forest Northern Forest 133 16 0 149
Eau Claire Central Farmland 166 173 0 339 Iron Northern Forest 38 3 0 41
Fond du Lac Central Farmland 335 232 0 567 Lac Corte Oreilles Northern Forest 0 0 0 0
Green Lake Central Farmland 252 218 0 470 Lac du Flambeau Northern Forest 3 1 0 4
Jackson Central Farmland 248 182 0 430 Langlade Northern Forest 327 27 0 354
Juneau Central Farmland 102 94 0 196 Lincoln Northern Forest 314 75 0 389
Kewaunee Central Farmland 248 144 0 392 Marinette Northern Forest 417 105 0 522
La Crosse Central Farmland 196 157 0 353 Menominee Northern Forest 0 0 0 0
Manitowoc Central Farmland 358 240 0 598 Oconto Northern Forest 195 78 0 273
Marathon Central Farmland 788 701 0 1,489 Oneida Northern Forest 403 54 0 457
Marinette Central Farmland 240 280 0 520 Price Northern Forest 310 24 0 334
Marquette Central Farmland 390 301 0 691 Red Cliff Northern Forest 0 0 0 0
MCCoy Central Farmland 23 24 0 47 Rusk Northern Forest 301 121 0 422
Monroe Central Farmland 275 205 0 480 Sawyer Northern Forest 228 14 0 242
Oconto Central Farmland 388 402 0 790 Taylor Northern Forest 483 317 0 800
Outagamie Central Farmland 382 302 0 684 Vilas Northern Forest 259 28 0 287
Pepin Central Farmland 139 132 0 271 Washburn Northern Forest 240 191 0 431
Pierce Central Farmland 211 200 0 411 Northern Forest Total 4,723 1,227 0 5,950
Polk Central Farmland 397 306 0 703 Columbia Southern Farmland 417 265 0 682
Portage Central Farmland 402 296 0 698 Crawford Southern Farmland 165 102 0 267
St Croix Central Farmland 230 171 0 401 Dane Southern Farmland 214 155 0 369
Shawano Central Farmland 672 512 0 1,184 Dodge Southern Farmland 277 199 0 476
Sheboygan Central Farmland 199 163 0 362 Grant Southern Farmland 209 120 0 329
Trempealeau Central Farmland 327 250 0 577 Green Southern Farmland 115 87 0 202
Waupaca Central Farmland 795 616 0 1,411 Iowa Southern Farmland 215 136 0 351
Waushara Central Farmland 425 323 0 748 Jefferson Southern Farmland 172 111 0 283
Winnebago Central Farmland 203 162 0 365 Kenosha Southern Farmland 42 37 0 79
Wood Central Farmland 275 270 0 545 Lafayette Southern Farmland 98 77 0 175
Central Farmland Total 11,112 9,208 0 20,320 Milwaukee Southern Farmland 33 28 0 61
Adams Central Forest 331 213 0 544 Ozaukee Southern Farmland 114 140 0 254
Clark Central Forest 255 74 0 329 Racine Southern Farmland 57 35 0 92
Eau Claire Central Forest 120 35 0 155 Richland Southern Farmland 228 156 0 384
Jackson Central Forest 120 12 0 132 Rock Southern Farmland 122 101 0 223
Juneau Central Forest 147 54 0 201 Sauk Southern Farmland 326 212 0 538
Monroe Central Forest 62 13 0 75 Vernon Southern Farmland 270 171 0 441
Wood Central Forest 149 27 0 176 Walworth Southern Farmland 78 76 0 154
Central Forest Total 1,184 428 0 1,612 Washington Southern Farmland 214 212 0 426
Waukesha Southern Farmland 209 217 0 426
Southern Farmland Total 3,575 2,637 0 6,212
Unknown Unknown 0 0 0 0
Unknown Total 0 0 0 0
Grand Total 20,594 13,500 0 34,094

34
Table 17. Wisconsin deer harvest and hunters 1966-2015 Gun Season Bow Season Crossbow Season
Year Antlered Antlerless Total Licensed Hunters Antlered Antlerless Total
Licensed Hunters1 Antlered Antlerless Total
Licensed Hunters2
1966 67,362 42,700 110,062 432,111 1,357 4,629 5,986 85,114 1967 71,032 57,295 128,527 470,782 1,714 5,878 7,592 101,573 1968 62,521 57,465 119,986 503,190 1,924 5,010 6,934 114,975 1969 52,655 45,353 98,008 506,526 1,576 4,411 5,987 106,669 1970 50,308 22,536 72,844 501,799 1,775 4,745 6,520 101,573 1971 48,994 21,841 70,835 509,447 1,696 4,826 6,522 100,206 1972 49,416 25,411 74,827 517,724 1,956 5,131 7,087 98,720 1973 57,364 24,741 82,105 514,626 2,594 5,862 8,456 105,875 1974 67,313 33,092 100,405 556,815 3,390 9,124 12,514 119,960 1975 73,373 44,005 117,378 582,113 4,439 9,149 13,588 133,775 1976 69,510 52,999 122,509 589,590 4,775 8,861 13,636 133,318 1977 82,762 49,148 131,910 617,823 5,993 10,797 16,790 146,760 1978 87,397 63,448 150,845 644,594 6,472 11,641 18,113 157,838 1979 76,550 49,020 125,570 617,109 6,203 9,815 16,018 144,511 1980 81,041 58,583 139,624 618,333 8,950 12,004 20,954 155,386 1981 99,034 67,639 166,673 629,034 11,867 17,216 29,083 173,874 1982 97,534 85,181 182,715 637,320 12,854 17,996 30,850 189,524 1983 96,628 100,672 197,600 649,972 14,208 18,668 32,876 194,367 1984 117,197 138,726 255,726 657,969 17,049 21,842 38,891 205,132 1985 112,701 161,601 274,302 670,329 19,396 21,348 40,744 215,900 1986 117,886 140,882 259,240 662,771 19,126 21,256 40,490 216,472 1987 116,881 133,393 250,530 660,400 21,278 21,253 42,651 208,675 1988 121,536 141,888 263,424 653,790 22,213 20,180 42,393 210,518 1989 139,651 170,282 310,192 661,713 25,249 20,994 46,394 210,912 1990 140,726 209,005 350,040 699,275 26,263 22,860 49,291 216,981 1991 120,009 232,330 352,520 674,422 29,739 37,110 67,097 216,559 1992 111,476 177,245 288,820 666,570 29,992 30,324 60,478 220,872 1993 116,507 100,977 217,584 652,491 30,661 22,274 53,008 224,008 1994 135,574 171,945 307,629 670,776 36,772 29,419 66,254 234,077 1995 171,891 225,846 398,002 684,944 39,379 29,790 69,269 244,262 1996 138,622 250,011 388,791 677,072 33,625 39,224 72,941 235,780 1997 121,050 171,296 292,513 671,706 36,812 30,264 67,115 237,991 1998 151,575 180,601 332,254 668,958 42,010 33,251 75,301 241,391 1999 159,296 242,908 402,204 690,194 45,562 46,641 92,203 252,322 2000 171,753 356,741 528,494 694,712 40,579 46,220 86,799 258,002 2001 141,942 219,322 361,264 688,540 40,867 42,217 83,120 260,239 2002 126,470 191,418 317,888 618,945 29,322 24,831 54,133 227,124 2003 147,436 240,908 388,344 644,818 45,498 50,109 95,607 247,211 2004 133,223 280,571 413,794 649,955 33,635 69,937 103,572 252,602 2005 147,622 239,688 387,310 641,771 35,935 42,515 78,450 247,309 2006 137,278 256,028 393,306 644,906 40,081 73,837 113,918 258,394 2007 133,131 269,432 402,563 641,432 38,011 77,999 116,010 258,854 2008 103,845 248,756 352,601 643,266 34,662 64,622 99,284 266,435 2009 92,754 149,108 241,862 638,842 41,402 45,839 87,241 261,964 2010 106,263 146,775 253,038 622,542 42,115 41,718 83,833 254,014 2011 106,396 151,115 257,511 622,860 44,443 45,757 90,200 255,426 2012 119,469 154,578 274,047 634,821 45,988 48,279 94,267 263,860 2013 102,221 152,782 255,003 634,655 41,517 46,111 87,628 266,380 2014 97,196 125,392 222,588 609,816 30,433 24,377 54,810 232,629 15,768 11,123 26,891 113,293
2015a 99,757 122,974 222,731 613,165 31,229 21,775 53,004 227,700 20,594 13,500 34,094 131,623 a Numbers are preliminary
1 Includes bow, conservation patron, and crossbow authorities that purchased bow upgrade 2 Includes crossbow, conservation patron, and bow authorities that purchased crossbow upgrade

35
Figure 10. Total deer harvest by weapon type, 1966-2015.
0
100,000
200,000
300,000
400,000
500,000
600,000
700,000
19
66
19
67
19
68
19
69
19
70
19
71
19
72
19
73
19
74
19
75
19
76
19
77
19
78
19
79
19
80
19
81
19
82
19
83
19
84
19
85
19
86
19
87
19
88
19
89
19
90
19
91
19
92
19
93
19
94
19
95
19
96
19
97
19
98
19
99
20
00
20
01
20
02
20
03
20
04
20
05
20
06
20
07
20
08
20
09
20
10
20
11
20
12
20
13
20
14
20
15
Kill
Year
Total Kill by Weapon Type 1966-2015
Crossbow Total
Bow Total
Gun Total

36
Figure 11. Antlered deer harvest by weapon type, 1966-2015.
0
50,000
100,000
150,000
200,000
250,000
19
66
19
67
19
68
19
69
19
70
19
71
19
72
19
73
19
74
19
75
19
76
19
77
19
78
19
79
19
80
19
81
19
82
19
83
19
84
19
85
19
86
19
87
19
88
19
89
19
90
19
91
19
92
19
93
19
94
19
95
19
96
19
97
19
98
19
99
20
00
20
01
20
02
20
03
20
04
20
05
20
06
20
07
20
08
20
09
20
10
20
11
20
12
20
13
20
14
20
15
Kill
Year
Antlered Kill by Weapon Type 1966-2015
Crossbow Antlered
Bow Antlered
Gun Antlered

37
Figure 12. Antlerless deer harvest by weapon type, 1966-2015.
0
50,000
100,000
150,000
200,000
250,000
300,000
350,000
400,000
450,000
19
66
19
67
19
68
19
69
19
70
19
71
19
72
19
73
19
74
19
75
19
76
19
77
19
78
19
79
19
80
19
81
19
82
19
83
19
84
19
85
19
86
19
87
19
88
19
89
19
90
19
91
19
92
19
93
19
94
19
95
19
96
19
97
19
98
19
99
20
00
20
01
20
02
20
03
20
04
20
05
20
06
20
07
20
08
20
09
20
10
20
11
20
12
20
13
20
14
20
15
Kill
Year
Antlerless Kill by Weapon Type 1966-2015
Crossbow Antlerless
Bow Antlerless
Gun Antlerless

38
Hunting Accident Report
By Brenda Von Rueden
Bureau of Law Enforcement
2015 Bow Season, 12 September - 3 January 2015 Crossbow Season, 12 September - 3 January 2015 Youth Deer Season, 10 - 11 October 2015 9-Day Gun Deer Season, 21 - 29 November 2015 Muzzleloader Deer Season, 30 November - 9 December 2015 December Antlerless Only Gun Deer Season, 10 - 13 December Table 18. The 9-day gun deer season accident summary by DNR region.
DNR Region Fatal Non-Fatal Total
Central Farmland 2 3 5
Central Forest 0 1 1
Northern Forest 0 0 0
Southern Farmland 1 1 2
Total 3 5 8
Table 19. The bow, crossbow, December antlerless only, and muzzleloader hunt deer seasons accident summary by DNR region.
DNR Region Fatal Non-Fatal Total
Central Farmland 0 0 0
Central Forest 0 0 0
Northern Forest 0 0 0
Southern Farmland 0 1 1
Total 0 1 1
4 accidents (44%) were a result of hunters shooting themselves.
4 accidents (44%) involved victim and shooter being members of the same hunting party.
1 accident occurred outside the 9-day gun deer season.
3 accidents were fatal.

39
2015 Hunting Accident Synopsis Type of Accident SI = Self Inflected Injury M = Male SP = Shooter and Victim in Same Party F = Female
Table 20. Summary of the 2015 deer hunter accidents by indident.
# Date/Time Location Injury Description Fatal Self Inflicted (SI) or Same Party
(SP)
Shooter Age / Sex / Hunter
Safety Certified
Victim Age / Sex / Hunter Safety
Certified Type of Firearm
1 10/17/2015 Waukesha Public
Cross bow bolt penetrated through right foot, entered top of foot between the bones on first and second toe
No SI – Self Inflicted 42yr M Yes Same as Shooter Crossbow
Synopsis: Shooter was stalking antlerless deer. Shooter was carrying crossbow in a high ready position and lost sight of deer. During the transition from the high ready carry back to a one handed side carry the crossbow discharged.
2 11/21/2015 12:00pm
Rock Private
Gunshot wound to left leg just above knee
No SI - Self Inflicted 16yr M Yes Same as Shooter 20 Gauge Unknown Action Shotgun
Synopsis: Shooter was hunting deer. Shooter was seated along field and began to fall asleep. Gun discharged striking shooter/victim in left leg.
3 11/22/2015 08:00am
Marathon Private
Gunshot wound through left arm, grazed chest, and entered right arm where it lodged
No SP - Same Party 14yr M Yes 26yr M Yes .30-30 Lever Action Rifle
Synopsis: Shooter was hunting deer. Shooter was reloading firearm when attempting to de-cock the hammer, it slipped, and the rifle discharged striking victim approximately 3 feet away.
4 11/22/2015 08:59am
Columbia Private
Gunshot wound entering near armpit
Yes SP - Same Party 35yr F Yes 39yr M Yes .308 Lever Action Rifle
Synopsis: Shooter was hunting deer. Shooter was already in treestand while victim was on ladder handing up a loaded rifle to the shooter. Gun went off striking the victim.

40
5 11/23/2015 04:20pm
Manitowoc Private
Gunshot wound to the left leg, femur area
No SP - Same Party 17yr M Yes 18yr M Yes .308 Bolt Action Rifle
Synopsis: Shooter was hunting deer. Victim walking towards shooters location attempting to push deer to shooter. Shooter saw two deer at approximately 140 yards and shot at deer hitting victim in leg.
6 11/23/2015 04:20pm
Waushara Private
Gunshot wound to sternum area, exiting the side
Yes Neither Unknown 56yr M Yes Unknown
Synopsis: Victim was walking through pines, hunting deer. Victim heard two shots and was hit in the lower chest area.
7 11/27/2015 09:49am
Jackson Public
Gunshot wound to right foot near toes
No SI - Self Inflicted 35yr M Yes Same as Shooter .308 Semi-Automatic Rifle
Synopsis: Shooter was on a deer drive while walking through some brush. Shooter/victim lowered his rifle to get through brush when the firearm discharged twice hitting foot.
8 11/29/2015 unknown
Marathon Private
Gunshot wound entering chest and exiting through back
Yes SI - Self Inflicted 50yr M No Same as Shooter 25-06 Bolt Action Rifle
Synopsis: Gunshot wound entering chest and exiting through back, unknown at this time.
9 11/29/2015 unknown
Polk Public Gunshot wound striking victim in forearm
No SP - Same Party 16yr M Yes 16yr M Yes .270 Bolt Action Rifle
Synopsis: After just shooting a deer, the victim and shooter were travelling down a county road with multiple loaded firearms in vehicle, the loaded .270 rifle was between driver and passenger when it discharged hitting victim.

41
2015 Deer Ages and Condition
By: Daniel J. Storm
Abstract
Harvest age-structure provides information on the dynamics of the deer herd. Yearling doe percentages are an indicator of herd recruitment, which generally were similar to 5-year and long-term means in Farmland regions. Due to 0-quota hunting seasons in Forest regions, sample sizes in those regions are too small to provide useful yearling doe percentage data. Yearling buck percentages in 2015 were near or slightly above 5-year means in all county groups, and were closer to long-term means than has been observed in recent years. The long-term decrease in yearling buck percentages reflects reduced buck exploitation over time, and reduced over-winter survival of young-of-the-year. The percentages of yearling bucks with forked antlers were similar to 5-year and long-term averages in Farmland county groupings, but somewhat above 5-year and long-term averages in Forest county groupings.
Introduction
Sampling age-composition of Wisconsin’s deer herd using hunter-killed deer is an essential component of Wisconsin's deer population monitoring program. Age composition data by deer management unit (DMU) supports population modeling used to estimate DMU deer herd sizes and to set annual harvest quotas. Age samples also help when interpreting harvest changes.
Methods
Deer were aged using the molariform tooth wear and replacement method. Yearling antler development was recorded as “sub-legal” or short spikes (< 3” antler), legal spikes (≥ 3” spikes), and forked bucks (forked antlers and larger). Trends in yearling buck percent, yearling doe percent and antler development were estimated by pooling DMUs (now counties) across groupings of adjacent counties. The 2015 data were compared to 5-year and long-term (1997 -2015) averages. County age samples for 1997-2013 were approximated from groupings of deer management units that included the county.
Results and Discussion
In 2015, field staff aged 13,537 deer (including animals sampled for CWD). The number of deer aged in 2015 was 16% fewer than the number of deer aged in 2014 (n = 16,193). The number of bucks aged decreased by 24% (Figure 1), while the number of does aged decreased by 1% (Figure 2).
Buck ages
Yearling bucks comprised between 53-63% of the total buck harvest in the forest zone county groups during 2015, slightly above both 5-year and long-term means (Table 1). The higher-than-average yearling percentages may reflect increased deer recruitment, following a relatively mild winter. Yearling buck percents in the Northern Forest show significant annual variation, most likely due to the variable recruitment that occurs there. Nevertheless, variation in hunter pressure and weather conditions in this region during the 9-day firearm season could cause similar variation in buck harvest rates.
In farmland zone county groups, yearling buck percentages were above average in 3 of the 5 farmland zone county groups and near average in 2 county groups (Table 1). In general, there has been a long-term decline in yearling buck percentages. In the Farmlands, reduced yearling buck percents could be due to increased deer populations relative to hunter numbers, which would reduce buck harvest rates. Reduced recruitment could also contribute to lower yearling buck percentages. Yearling doe percentages have generally declined in the Farmlands as well (discussed below),

42
supporting the notion that recruitment could be declining. However, yearling buck percentages have declined at a faster rate than yearling doe percentages, suggesting that reduced exploitation is at least partially driving this trend.
Table 1. Regional trends in percent yearling bucks in the buck harvest, 2011-2015.
Yearling Buck Percentages Percent
2015 is off 5-yr. Mean Region
5 Year Mean (%)
Long-term Mean (%)
2011 2012 2013 2014 2015
Northwest Forest 51 53 53 50 55 45 53 5 Northcentral Forest 54 52 59 56 53 49 55 2
Northeast Forest 57 61 65 64 51 48 63 11
Central Forest 56 55 55 60 58 49 59 6
Central Farmland 54 59 56 56 56 47 58 8
Lake Michigan Farmland 57 63 58 56 60 54 56 -2
Western Farmland 52 57 52 56 53 48 59 13
Southeastern Farmland 52 54 47 50 55 56 53 2
Southwestern Farmland 40 48 38 42 42 38 43 8
*1997-2015
Doe ages
Yearling doe percentage data was inadequate to make inferences in the forest zone counties, due to antlerless quotas of 0 there. While yearling doe percentages in farmland zone county groups have declined over time, 2015 values were near the 5-year average (Table 2). Long-term decreases in yearling doe percentages across the farmland regions may be attributed to decreased reproduction and survival to 1 year of age resulting from a legacy of past high deer populations and over-browsed woodlands and reduced nutrition. Predator populations may play a role in these changes; however, our research using collared deer shows that predation increases when deer are in poor nutritional condition.
Table 2. Regional trends in percent yearling does in the doe harvest, 2011-2015.
Yearling Doe Percentages Percent
2015 is off 5-yr. Mean Region
5 Year Mean (%)
Long-term
Mean (%) 2011 2012 2013 2014 2015
Northwest Forest † 31 28 33 27 24 40 28 -9 Northcentral Forest † 24 27 29 27 25 13 23 -2
Northeast Forest † 27 27 37 32 19 21 27 -1
Central Forest † 27 28 26 29 29 25 36 32
Central Farmland 31 35 30 33 32 30 30 -4
Lake Michigan Farmland † 37 39 36 37 38 35 30 -18
Western Farmland 33 35 38 32 30 33 36 8
Southeastern Farmland 36 36 36 34 39 34 35 -2
Southwestern Farmland 28 33 27 30 27 28 29 4
*1997-2015
†Sample size inadequate to interpret

43
Antler development
Estimates of the percentage of bucks with forked antlers in 2015 were slightly-to-substantially higher than 5-year means in Forest Zone county groups). The largest increase occurred in the Northwest Forest County Group, which was 24% above the 5-year mean, and higher than the long-term mean. Percentage of fork bucks in Farmland Zone county groups were similar to 5-year averages. The relatively mild 2014-2015 winter is reflected than better-than-average antler development in yearling bucks.
Notable differences in antler development continue to occur between heavily forested and farmland regions, and is likely explained by habitat productivity, winter weather, and deer herd densities relative to biological carrying capacity. Less severe winter conditions and distribution of high quality food resources (e.g., agricultural crops) throughout the farmland regions allow for increased carrying capacity and buffer deer herds against winter impacts on spring/summer body conditions and yearling antler development.
Table 3. Trends in antler development of yearling bucks, 2011-2015.
% of Yearling Forked Buck in
Harvest Percent
2015 is off 5-yr. Mean
Region 5 Year Mean (%)
Long-term Mean (%)*
2011 2012 2013 2014 2015
Northwest Forest 53 59 56 63 41 40 66 24 Northcentral Forest 55 57 53 61 49 53 61 10
Northeast Forest 60 62 55 61 63 58 64 6
Central Forest 68 61 68 71 64 63 73 8
Central Farmland 84 87 83 90 82 80 86 2
Lake Michigan Farmland 90 91 90 93 88 89 89 -1
Western Farmland 87 88 88 92 84 87 84 -4
Southeastern Farmland 92 94 92 96 89 90 91 -1
Southwestern Farmland 93 94 90 96 90 96 91 -2
*1997-2015
Acknowledgements
Thanks to Robert Rolley and Keith McCaffery for reviewing this report and to DNR personnel and
volunteers for collecting deer age and antler data.

44
Figure 1. The number of adult bucks aged, 1959–2015.
Figure 2. The number of adult does aged, 1960–2015.
0
5000
10000
15000
20000
25000
19
59
19
61
19
63
19
65
19
67
19
69
19
71
19
73
19
75
19
77
19
79
19
81
19
83
19
85
19
87
19
89
19
91
19
93
19
95
19
97
19
99
20
01
20
03
20
05
20
07
20
09
20
11
20
13
20
15
Nu
mb
er o
f B
uck
s
0
5000
10000
15000
20000
25000
30000
19
60
19
62
19
64
19
66
19
68
19
70
19
72
19
74
19
76
19
78
19
80
19
82
19
84
19
86
19
88
19
90
19
92
19
94
19
96
19
98
20
00
20
02
20
04
20
06
20
08
20
10
20
12
20
14
Nu
mb
er o
f D
oe
s