the 2011 economy: what exactly does a recovery look like? r. christopher jones, ph.d
Post on 20-Dec-2015
216 views
TRANSCRIPT

The 2011 Economy:What Exactly Does a Recovery Look Like?
R. Christopher Jones, Ph.D.

2
So, where are we?
We’re actually in a recovery that isn’t strong enough to make up the massive job loss Recession technically over June 2009 6 consecutive quarters Real GDP growth Decent growth in retail sales Industrial production of business equipment up Inflation and interest rates remain low, but food
& fuel prices are rising S & P 500 up 12 percent

3
So, where are we?
BUT.. We’ve only created 1.2 million jobs this year We lost 8.6 million jobs in 2008 and 2009 GDP needs to grow at 3.5% or more to see
significant improvement in unemployment rate Industrial production of consumer goods and
durable goods still anemic Increasing Federal debt and expansive
monetary policy creates inflation concerns Housing sector still pathetic

4
What about Florida?
Still bad, worse than the nation as a whole Real estate, tourism continue to suffer Stimulus may be a “paper tiger” for Florida Anti-growth supporters haven’t helped the cause
The horse’s back is cracked Growth & vacations carried us to prosperity The recession stopped both Tourist sector will rebound before real estate We’re not really affordable anymore

5
How Bad Is It?
The “Good” News We are recovering, yet modestly We’ve had recessions of similar magnitude in the
past, and we’ve recovered from them Mid 70’s & early 80’s recessions 72% of economic growth positive since WWII U.S. per capita GDP growth since 1890 has
averaged just under 2% per year Our ability to innovate has served as the
cornerstone for prolonged economic growth
6
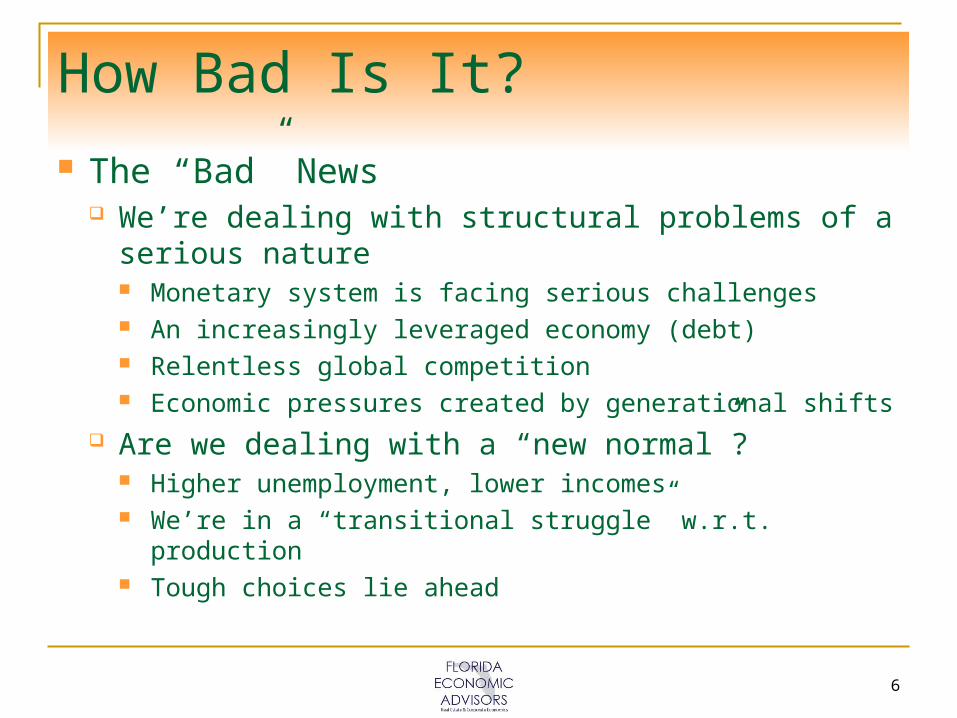
How Bad Is It?
The “Bad” News We’re dealing with structural problems of a
serious nature Monetary system is facing serious challenges An increasingly leveraged economy (debt) Relentless global competition Economic pressures created by generational shifts
Are we dealing with a “new normal”? Higher unemployment, lower incomes We’re in a “transitional struggle” w.r.t. production Tough choices lie ahead
7
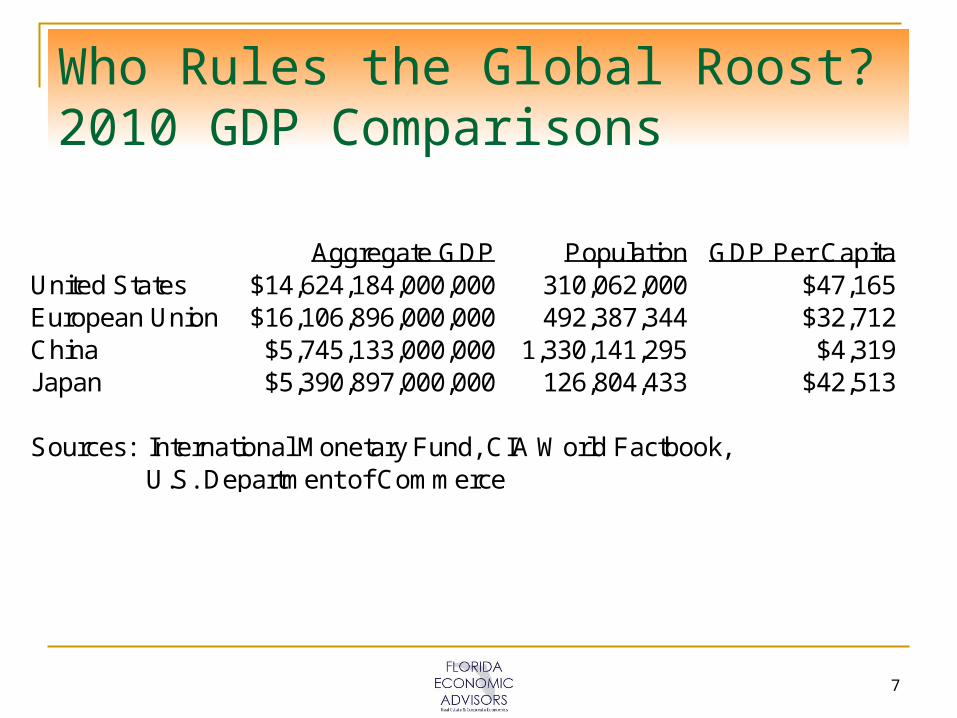
Who Rules the Global Roost?2010 GDP Comparisons
Aggregate GDP Population GDP Per CapitaUnited States $14,624,184,000,000 310,062,000 $47,165European Union $16,106,896,000,000 492,387,344 $32,712China $5,745,133,000,000 1,330,141,295 $4,319Japan $5,390,897,000,000 126,804,433 $42,513
Sources: International Monetary Fund, CIA World Factbook, U.S. Department of Commerce

8
Long-Term GDP Growth 1890-2006

9
U.S. Real GDP 1947-2010
$1,000
$2,000
$3,000
$4,000
$5,000
$6,000
$7,000
$8,000
$9,000
$10,000
$11,000
$12,000
$13,000
$14,000
Q3
47
Q2
50
Q1
53
Q4
55
Q3
58
Q2
61
Q1
64
Q4
66
Q3
69
Q2
72
Q1
75
Q4
77
Q3
80
Q2
83
Q1
86
Q4
88
Q3
91
Q2
94
Q1
97
Q4
99
Q3
02
Q2
05
Q1
08
Q4
10
Bill
ion
s

10
U.S. Real GDP Annualized % Growth
1947-2010
-15.0%
-10.0%
-5.0%
0.0%
5.0%
10.0%
15.0%
20.0%Q
3 47
Q2
50
Q1
53
Q4
55
Q3
58
Q2
61
Q1
64
Q4
66
Q3
69
Q2
72
Q1
75
Q4
77
Q3
80
Q2
83
Q1
86
Q4
88
Q3
91
Q2
94
Q1
97
Q4
99
Q3
02
Q2
05
Q1
08
Q4
10

11
U.S. Unemployment Rate 1948-2010
2.03.0
4.05.06.0
7.08.09.0
10.011.0
Jun
-48
Jul-
50A
ug
-52
Sep
-54
Oct
-56
No
v-58
Dec
-60
Jan
-63
Feb
-65
Mar
-67
Ap
r-69
May
-71
Jun
-73
Jul-
75A
ug
-77
Sep
-79
Oct
-81
No
v-83
Dec
-85
Jan
-88
Feb
-90
Mar
-92
Ap
r-94
May
-96
Jun
-98
Jul-
00A
ug
-02
Sep
-04
Oct
-06
No
v-08
Dec
-10
Per
cen
t
12
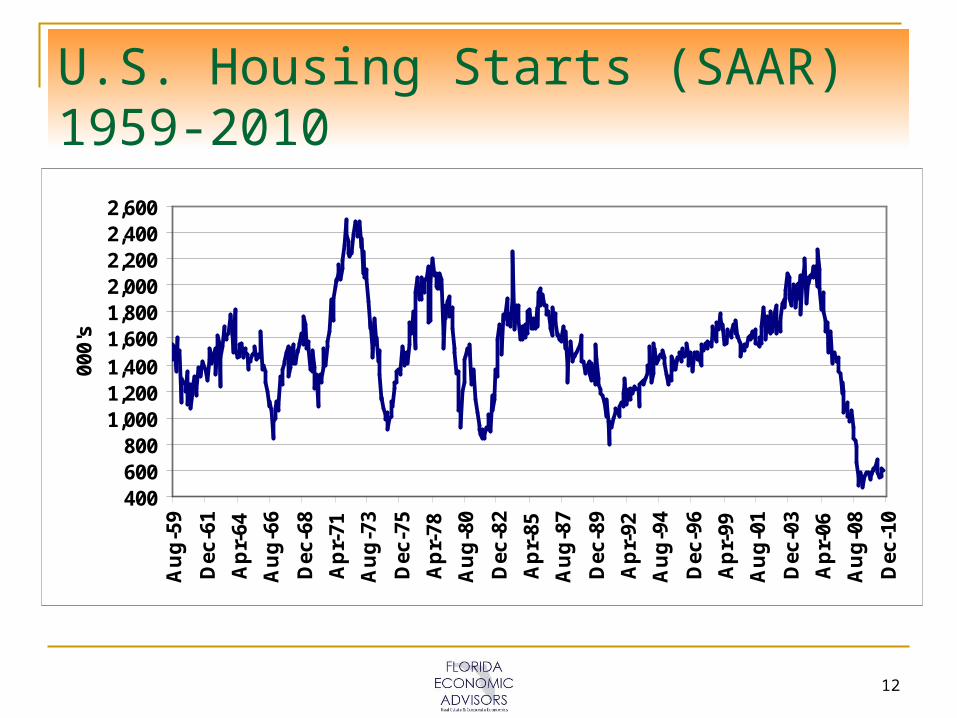
U.S. Housing Starts (SAAR) 1959-2010
400600800
1,0001,2001,4001,6001,8002,0002,2002,4002,600
Au
g-5
9
Dec
-61
Ap
r-64
Au
g-6
6
Dec
-68
Ap
r-71
Au
g-7
3
Dec
-75
Ap
r-78
Au
g-8
0
Dec
-82
Ap
r-85
Au
g-8
7
Dec
-89
Ap
r-92
Au
g-9
4
Dec
-96
Ap
r-99
Au
g-0
1
Dec
-03
Ap
r-06
Au
g-0
8
Dec
-10
000'
s
13
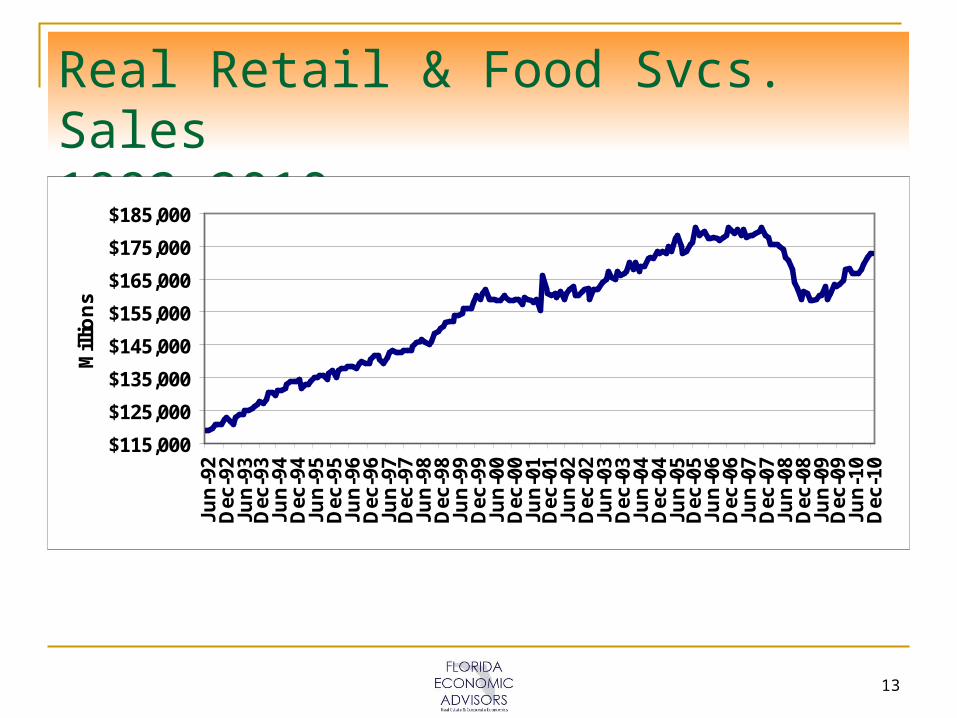
Real Retail & Food Svcs. Sales 1992-2010
$115,000
$125,000
$135,000
$145,000
$155,000
$165,000
$175,000
$185,000Ju
n-9
2D
ec-9
2Ju
n-9
3D
ec-9
3Ju
n-9
4D
ec-9
4Ju
n-9
5D
ec-9
5Ju
n-9
6D
ec-9
6Ju
n-9
7D
ec-9
7Ju
n-9
8D
ec-9
8Ju
n-9
9D
ec-9
9Ju
n-0
0D
ec-0
0Ju
n-0
1D
ec-0
1Ju
n-0
2D
ec-0
2Ju
n-0
3D
ec-0
3Ju
n-0
4D
ec-0
4Ju
n-0
5D
ec-0
5Ju
n-0
6D
ec-0
6Ju
n-0
7D
ec-0
7Ju
n-0
8D
ec-0
8Ju
n-0
9D
ec-0
9Ju
n-1
0D
ec-1
0
Mill
ion
s
14
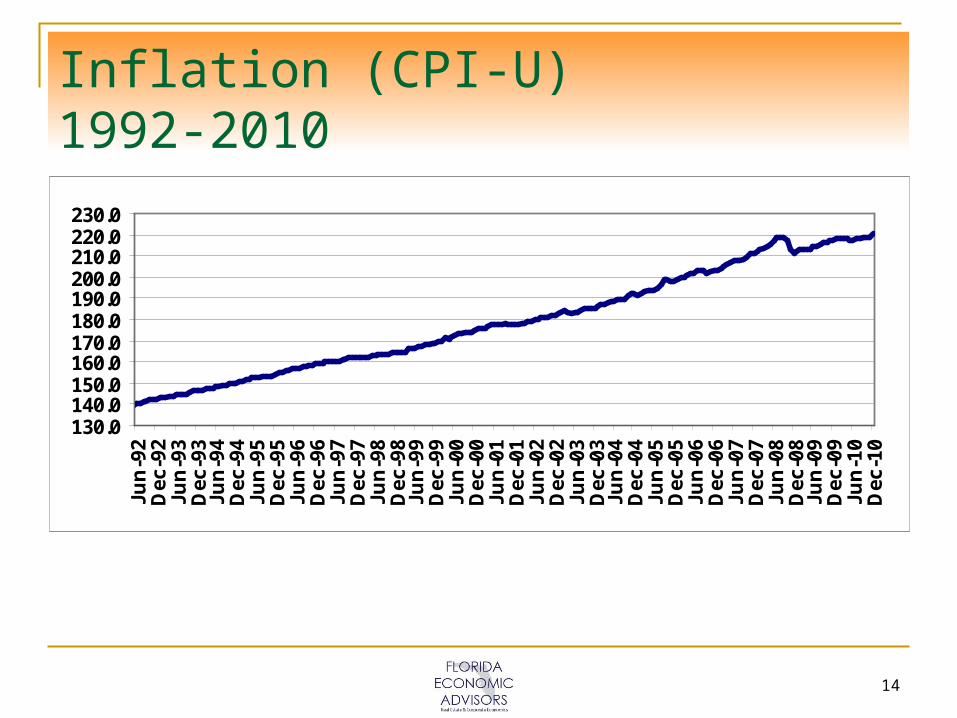
Inflation (CPI-U) 1992-2010
130.0140.0150.0160.0170.0180.0190.0200.0210.0220.0230.0
Jun
-92
Dec
-92
Jun
-93
Dec
-93
Jun
-94
Dec
-94
Jun
-95
Dec
-95
Jun
-96
Dec
-96
Jun
-97
Dec
-97
Jun
-98
Dec
-98
Jun
-99
Dec
-99
Jun
-00
Dec
-00
Jun
-01
Dec
-01
Jun
-02
Dec
-02
Jun
-03
Dec
-03
Jun
-04
Dec
-04
Jun
-05
Dec
-05
Jun
-06
Dec
-06
Jun
-07
Dec
-07
Jun
-08
Dec
-08
Jun
-09
Dec
-09
Jun
-10
Dec
-10

15
Real Per Capita Disposable Personal Income 1959-2010
$8,000$10,000$12,000$14,000$16,000$18,000$20,000$22,000$24,000$26,000$28,000$30,000$32,000$34,000
Jul-
59Ja
n-6
1Ju
l-62
Jan
-64
Jul-
65Ja
n-6
7Ju
l-68
Jan
-70
Jul-
71Ja
n-7
3Ju
l-74
Jan
-76
Jul-
77Ja
n-7
9Ju
l-80
Jan
-82
Jul-
83Ja
n-8
5Ju
l-86
Jan
-88
Jul-
89Ja
n-9
1Ju
l-92
Jan
-94
Jul-
95Ja
n-9
7Ju
l-98
Jan
-00
Jul-
01Ja
n-0
3Ju
l-04
Jan
-06
Jul-
07Ja
n-0
9Ju
l-10
16
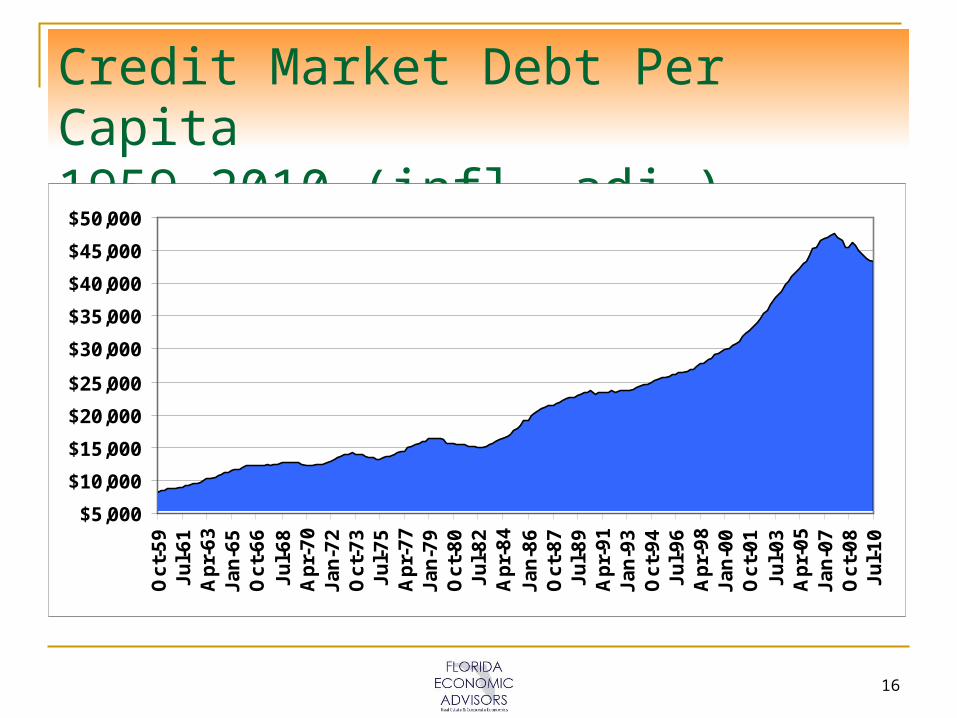
Credit Market Debt Per Capita 1959-2010 (infl. adj.)
$5,000
$10,000
$15,000
$20,000
$25,000
$30,000
$35,000
$40,000
$45,000
$50,000
Oc
t-5
9J
ul-
61
Ap
r-6
3J
an
-65
Oc
t-6
6J
ul-
68
Ap
r-7
0J
an
-72
Oc
t-7
3J
ul-
75
Ap
r-7
7J
an
-79
Oc
t-8
0J
ul-
82
Ap
r-8
4J
an
-86
Oc
t-8
7J
ul-
89
Ap
r-9
1J
an
-93
Oc
t-9
4J
ul-
96
Ap
r-9
8J
an
-00
Oc
t-0
1J
ul-
03
Ap
r-0
5J
an
-07
Oc
t-0
8J
ul-
10
17
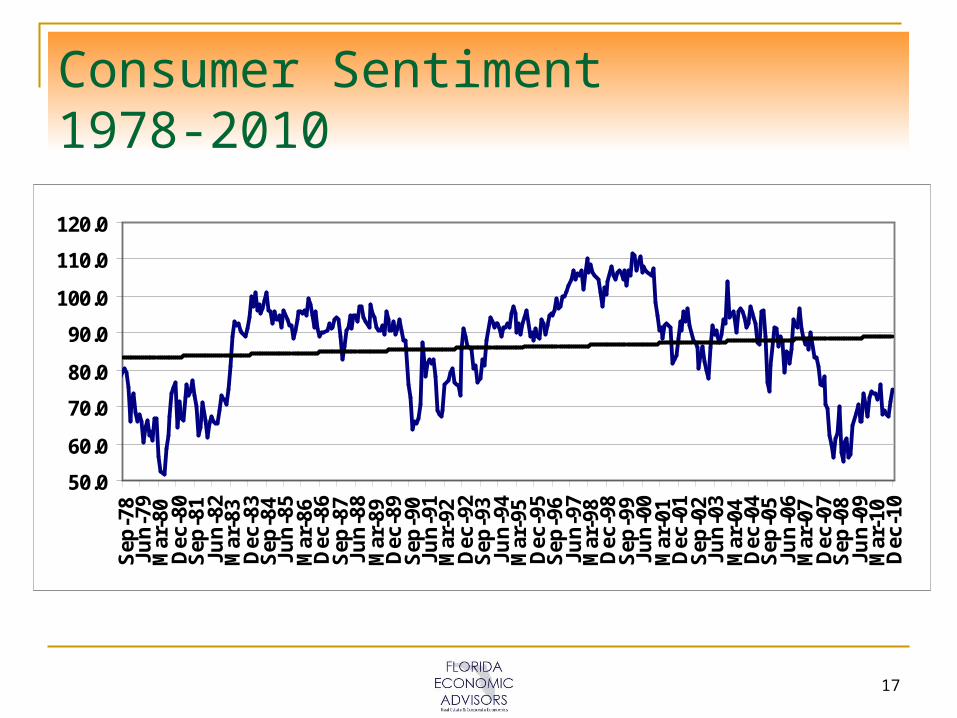
Consumer Sentiment 1978-2010
50.0
60.0
70.0
80.0
90.0
100.0
110.0
120.0
Sep
-78
Jun
-79
Mar
-80
Dec
-80
Sep
-81
Jun
-82
Mar
-83
Dec
-83
Sep
-84
Jun
-85
Mar
-86
Dec
-86
Sep
-87
Jun
-88
Mar
-89
Dec
-89
Sep
-90
Jun
-91
Mar
-92
Dec
-92
Sep
-93
Jun
-94
Mar
-95
Dec
-95
Sep
-96
Jun
-97
Mar
-98
Dec
-98
Sep
-99
Jun
-00
Mar
-01
Dec
-01
Sep
-02
Jun
-03
Mar
-04
Dec
-04
Sep
-05
Jun
-06
Mar
-07
Dec
-07
Sep
-08
Jun
-09
Mar
-10
Dec
-10
18
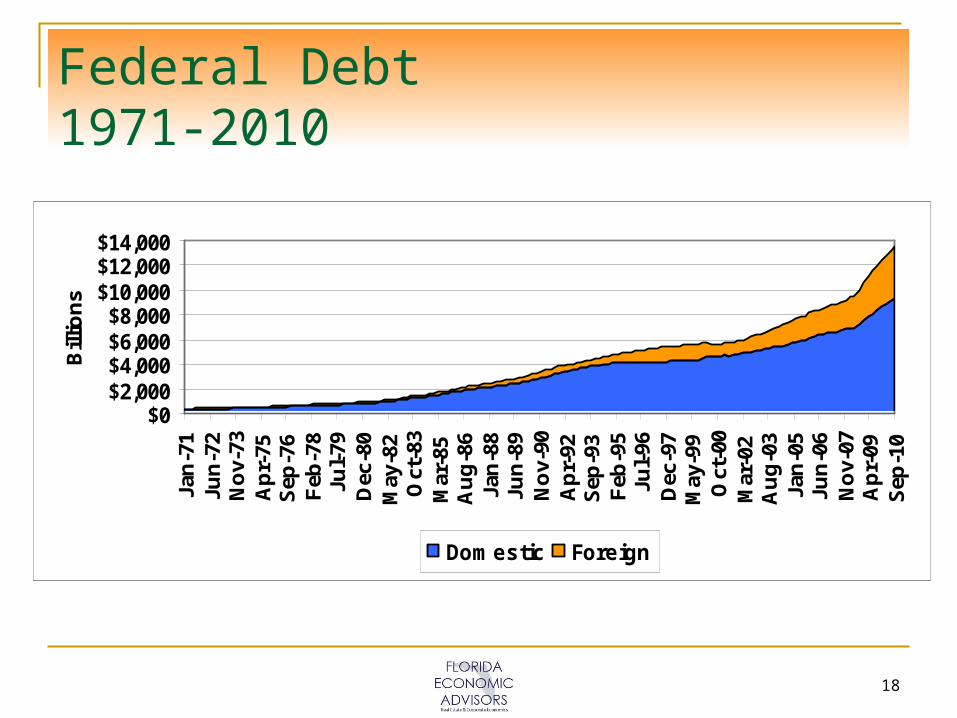
Federal Debt 1971-2010
$0$2,000$4,000$6,000$8,000
$10,000$12,000$14,000
Jan
-71
Jun
-72
No
v-73
Ap
r-75
Sep
-76
Feb
-78
Jul-
79D
ec-8
0M
ay-8
2O
ct-8
3M
ar-8
5A
ug
-86
Jan
-88
Jun
-89
No
v-90
Ap
r-92
Sep
-93
Feb
-95
Jul-
96D
ec-9
7M
ay-9
9O
ct-0
0M
ar-0
2A
ug
-03
Jan
-05
Jun
-06
No
v-07
Ap
r-09
Sep
-10
Bill
ion
s
Domestic Foreign
19
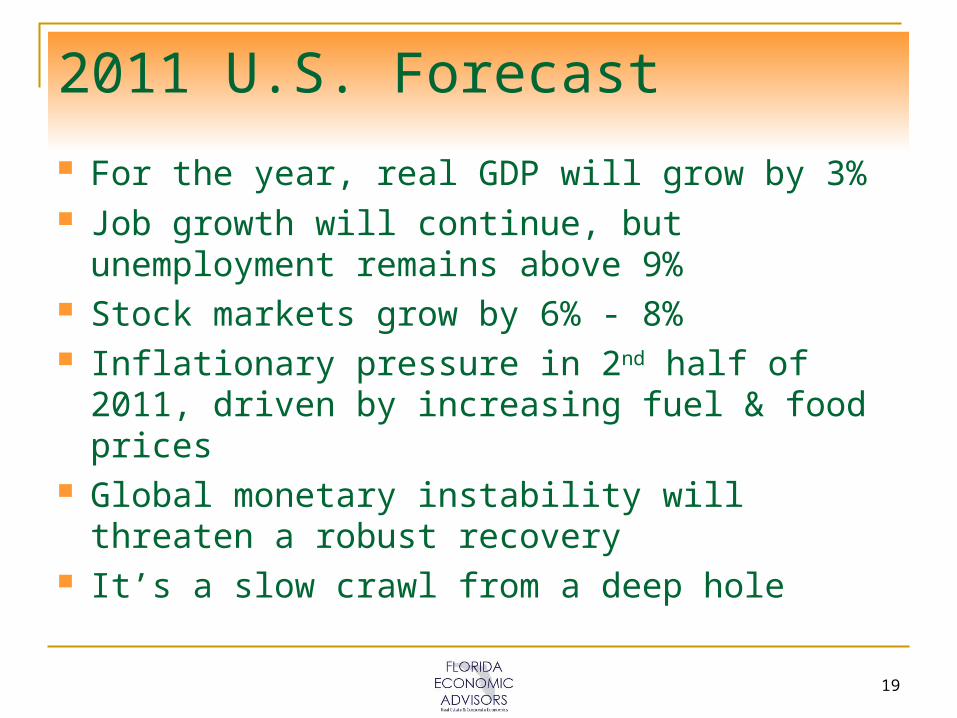
2011 U.S. Forecast
For the year, real GDP will grow by 3% Job growth will continue, but unemployment
remains above 9% Stock markets grow by 6% - 8% Inflationary pressure in 2nd half of 2011, driven
by increasing fuel & food prices Global monetary instability will threaten a
robust recovery It’s a slow crawl from a deep hole

20
Florida: The Facts
Dec. 2007 to Jul. 2010: Lost 930,800 jobs Equivalent to losing 92% of Orlando MSA, or
83% of Tampa-St. Pete-Clearwater MSA Jul. – Nov. 2010: Gained 131,500 jobs 11.6% unemployment (Dec. 2010) 14,346 housing starts from Aug. – Dec. ’10,
compared to 20,934 starts Aug. – Dec. ’08 Home prices are down 35.6% from their Q4
2006 peak – comparable with early 2004 prices

21
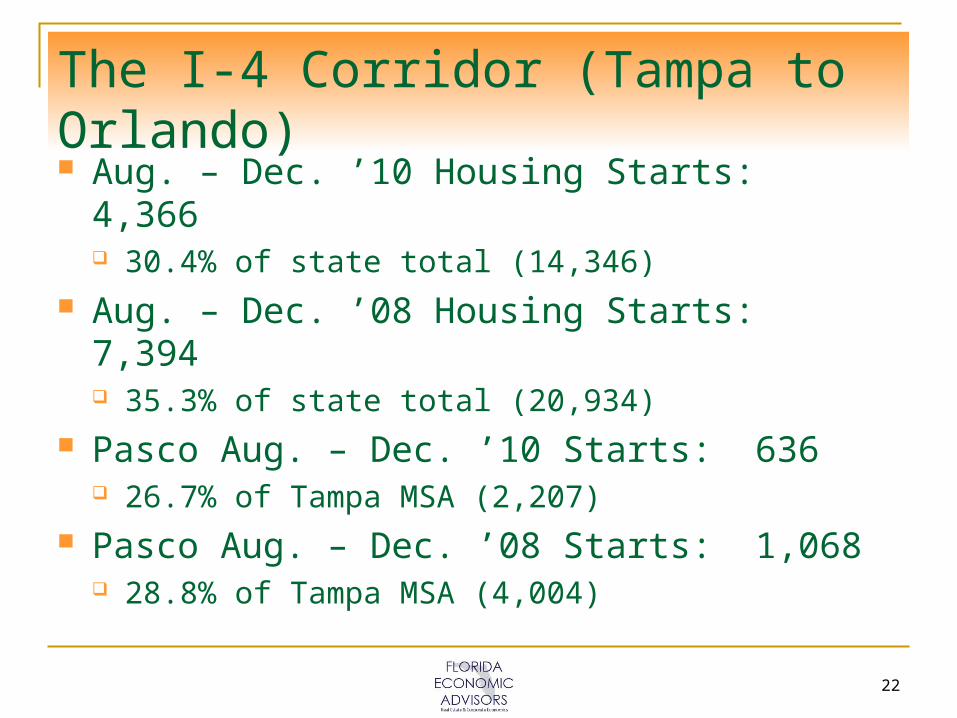
The I-4 Corridor (Tampa to Orlando)
Dec. 2007 to Jul. 2010: Lost 283,200 jobs Equivalent to losing all of Seminole County,
1.6x Pasco County, or 1.3x Polk County Jul. – Nov. 2010: Gained 49,100 jobs Unemployment (Dec.): Tampa MSA 12.0%,
Orlando MSA 11.3%, Lakeland MSA 12.5% Pasco: Lost 7,969 jobs Dec. ’07 to Jul. ’10 Jul. – Nov. 2010, Pasco: Lost 2,922 jobs Pasco (Dec.): 13.0% unemployment
22
The I-4 Corridor (Tampa to Orlando)
Aug. – Dec. ’10 Housing Starts: 4,366 30.4% of state total (14,346)
Aug. – Dec. ’08 Housing Starts: 7,394 35.3% of state total (20,934)
Pasco Aug. – Dec. ’10 Starts: 636 26.7% of Tampa MSA (2,207)
Pasco Aug. – Dec. ’08 Starts: 1,068 28.8% of Tampa MSA (4,004)

23
Florida Metro Economic Activity 2008-2010
FLORIDA INDICATORSBY MSA 2010 2009 2008
Aug. Sep. Oct. Nov. Dec. Aug. Sep. Oct. Nov. Dec. Aug. Sep. Oct. Nov. Dec.Housing Starts (Permits)
Florida 3,196 2,772 2,630 2,710 3,038 2,802 3,040 2,881 3,002 3,495 5,825 5,245 3,634 3,052 3,178Tampa-St. Pete 436 490 434 501 346 491 524 434 1,074 1,054 1,189 858 694 699 564Orlando 384 321 300 360 310 327 284 387 324 363 626 850 435 452 364Jacksonville MSA 277 242 204 215 165 293 354 328 266 285 293 354 337 301 283Miami-Ft. Laud-PB 438 348 527 478 324 248 309 312 200 249 824 558 447 255 735Lakeland 123 88 122 86 65 92 112 106 68 92 188 121 145 123 86
Employment (000's)Florida 7,179.1 7,181.6 7,208.5 7,253.9 n.a 7,168.6 7,162.0 7,183.5 7,216.9 7,237.3 7,657.8 7,629.2 7,600.6 7,607.9 7,607.2Tampa-St. Pete 1,118.2 1,121.9 1,120.7 1,127.9 n.a 1,123.8 1,124.3 1,123.8 1,126.4 1,128.2 1,195.3 1,190.2 1,184.6 1,183.9 1,185.8Orlando 997.5 995.7 1,007.9 1,013.5 n.a 998.1 995.6 999.6 1,001.9 1,005.7 1,070.7 1,064.1 1,060.1 1,058.0 1,056.0Jacksonville MSA 576.3 576.5 578.8 582.7 n.a 578.1 577.2 579.0 584.3 585.7 616.2 615.5 614.2 615.6 613.0Miami-Ft. Laud-PB 2,162.9 2,171.0 2,175.7 2,192.1 n.a 2,166.4 2,168.3 2,174.3 2,186.8 2,200.1 2,319.2 2,315.0 2,308.2 2,320.4 2,328.8Lakeland 192.2 192.6 193.6 194.5 n.a 193.2 193.4 194.1 195.3 196.3 206.2 206.7 205.2 205.7 205.8
Unemployment (%)Florida 12.4 12.0 11.6 12.2 11.6 11.2 11.4 11.5 11.4 11.6 7.1 7.1 7.2 7.5 8.0Tampa-St. Pete 12.6 12.4 11.9 12.6 12.0 11.6 11.8 11.9 12.2 12.4 7.3 7.3 7.5 8.0 8.4Orlando 12.0 11.8 11.3 11.9 11.3 11.1 11.5 11.5 11.7 11.8 6.5 6.5 6.8 7.4 7.7Jacksonville MSA 11.9 11.5 11.0 11.6 11.0 10.7 10.8 10.9 11.1 11.2 6.6 6.4 6.4 6.8 7.2Miami-Ft. Laud-PB 12.8 12.1 11.8 12.1 11.8 11.1 11.0 11.2 10.7 11.1 7.0 6.9 7.1 7.1 7.7Lakeland 13.5 13.3 12.6 13.3 12.5 12.4 12.7 12.6 12.7 12.7 7.8 7.8 7.8 8.2 8.5
n.a.: Data not available as of 1/27/11Sources: U.S. Dept. of Commerce, U.S. Dept. of Labor, Florida Agency for Workforce Innovation

24
Florida Home Price Index (Q1 1980 = 100)
0
50
100
150
200
250
300
350
400
450
500
Ap
r-75
Jan
-76
Oct
-76
Jul-7
7A
pr-
78Ja
n-7
9O
ct-7
9Ju
l-80
Ap
r-81
Jan
-82
Oct
-82
Jul-8
3A
pr-
84Ja
n-8
5O
ct-8
5Ju
l-86
Ap
r-87
Jan
-88
Oct
-88
Jul-8
9A
pr-
90Ja
n-9
1O
ct-9
1Ju
l-92
Ap
r-93
Jan
-94
Oct
-94
Jul-9
5A
pr-
96Ja
n-9
7O
ct-9
7Ju
l-98
Ap
r-99
Jan
-00
Oct
-00
Jul-0
1A
pr-
02Ja
n-0
3O
ct-0
3Ju
l-04
Ap
r-05
Jan
-06
Oct
-06
Jul-0
7A
pr-
08Ja
n-0
9O
ct-0
9Ju
l-10

25
The Question of Florida Recovery When?
We may just be hitting bottom now Some signs of stabilization/uptick
How? Yesterday’s model won’t work tomorrow (growth
fueled by low-cost housing and loose mortgages) Central Florida Especially Vulnerable
Less economically diverse than S. Florida 30% of the state’s job losses in I-4 corridor I-4 is the only major artery linking the Tampa and
Orlando markets
26
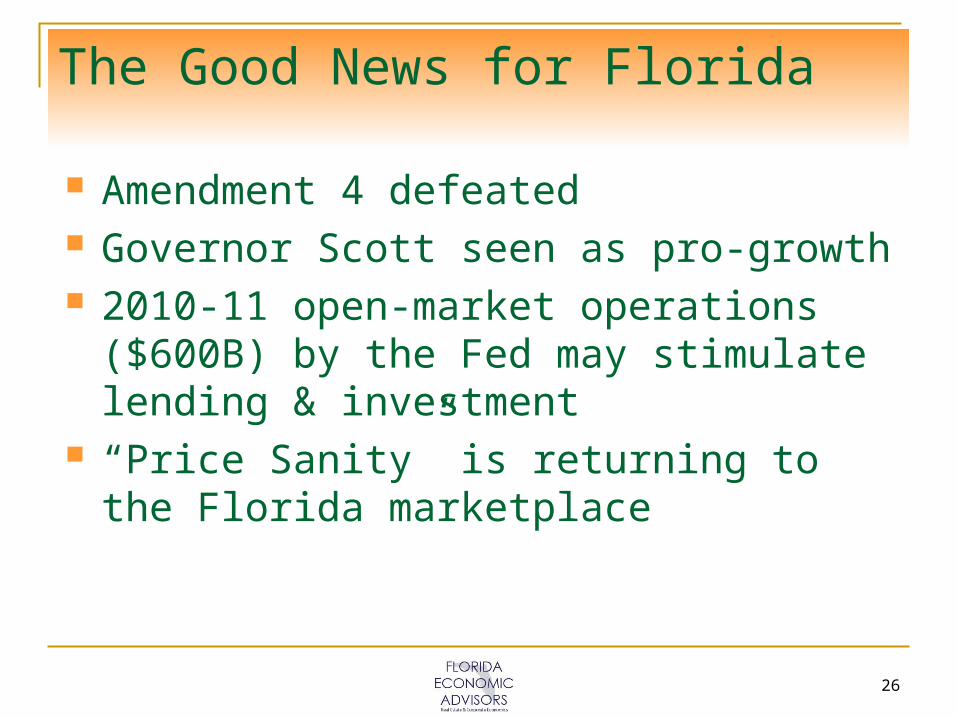
The Good News for Florida
Amendment 4 defeated Governor Scott seen as pro-growth 2010-11 open-market operations ($600B) by
the Fed may stimulate lending & investment “Price Sanity” is returning to the Florida
marketplace
27
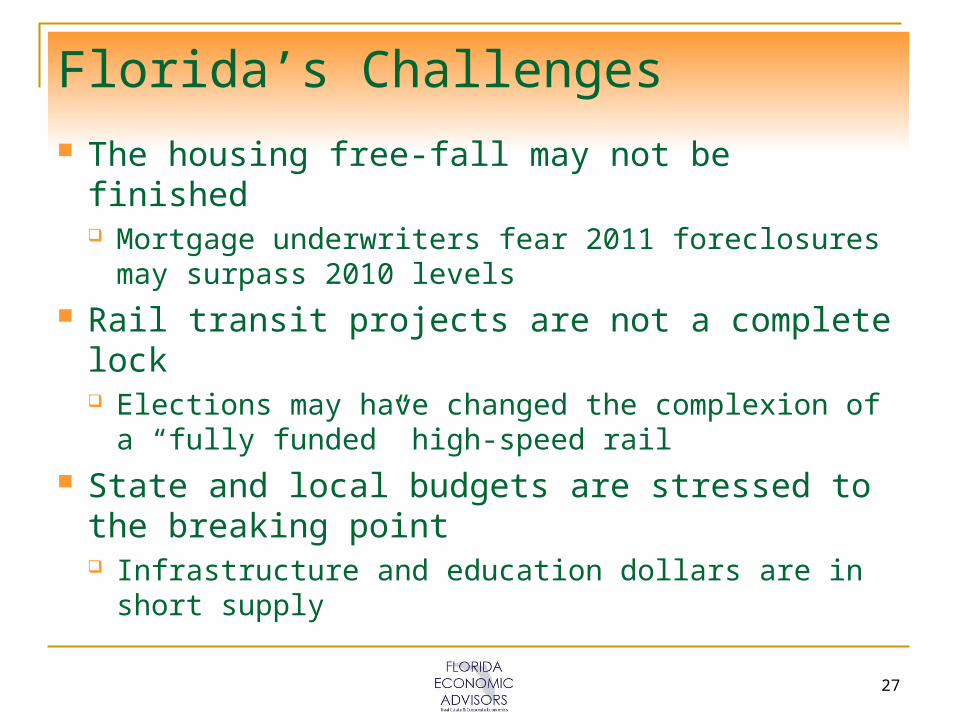
Florida’s Challenges
The housing free-fall may not be finished Mortgage underwriters fear 2011 foreclosures
may surpass 2010 levels Rail transit projects are not a complete lock
Elections may have changed the complexion of a “fully funded” high-speed rail
State and local budgets are stressed to the breaking point Infrastructure and education dollars are in short
supply
28
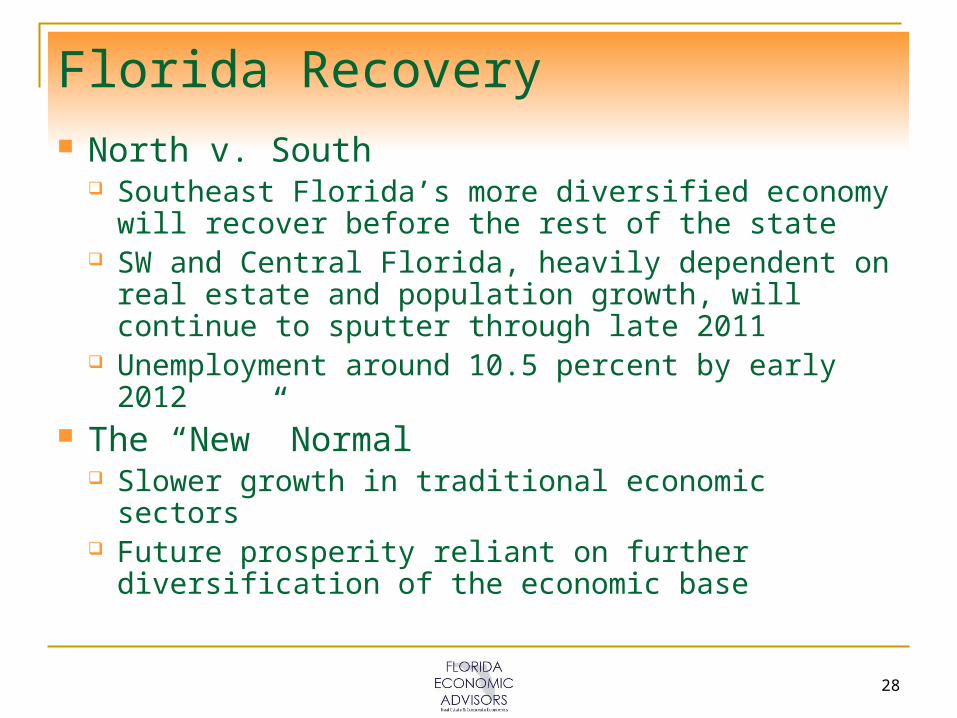
Florida Recovery North v. South
Southeast Florida’s more diversified economy will recover before the rest of the state
SW and Central Florida, heavily dependent on real estate and population growth, will continue to sputter through late 2011
Unemployment around 10.5 percent by early 2012 The “New” Normal
Slower growth in traditional economic sectors Future prosperity reliant on further diversification
of the economic base