the 2007-2009 financial crisis: an economic perspective · 2018-09-14 · at brookings the...
TRANSCRIPT
at BROOKINGS
THE 2007-2009 FINANCIAL CRISIS: AN ECONOMIC PERSPECTIVE
Nellie Liang and Andrew MetrickSeptember 11, 2018

ARC OF THE CRISIS
0
50
100
150
200
250
200820052000199519901985198019751970
%
Insurers
GSEs
ABS
MMF
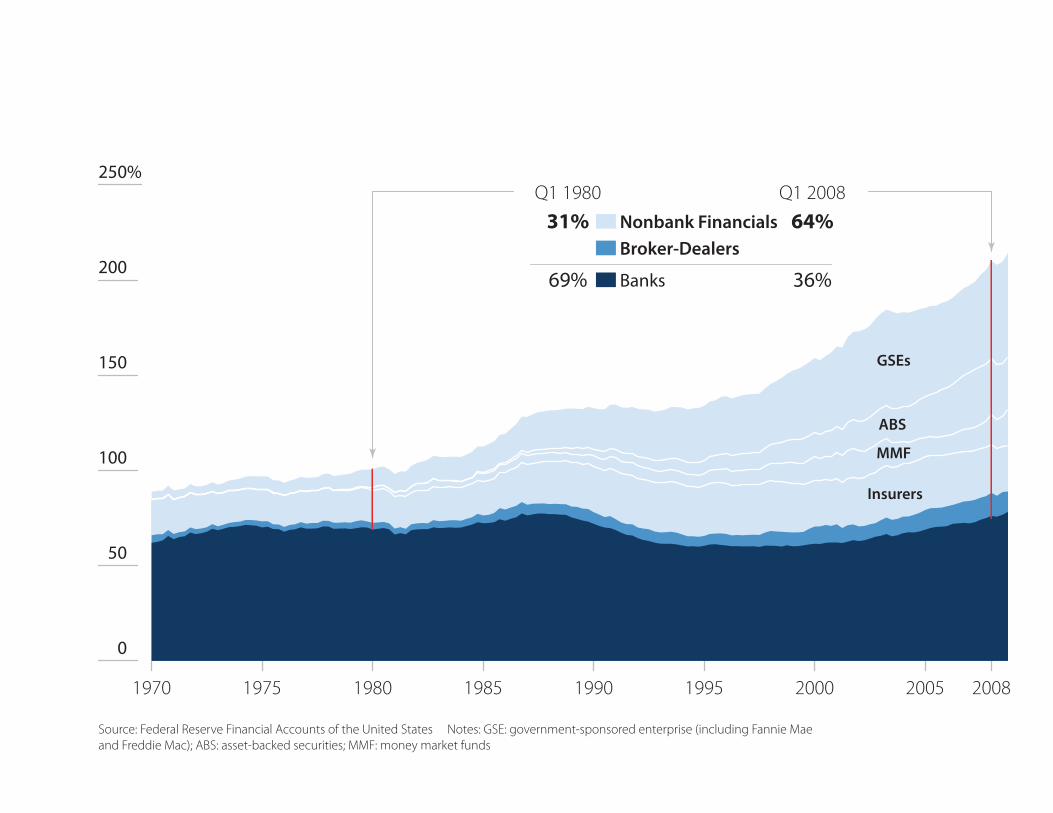
Source: Federal Reserve Financial Accounts of the United States Notes: GSE: government-sponsored enterprise (including Fannie Mae and Freddie Mac); ABS: asset-backed securities; MMF: money market funds
Q1 1980
31%
69%
Q1 2008
64%
36%
Nonbank FinancialsBroker-Dealers
Banks
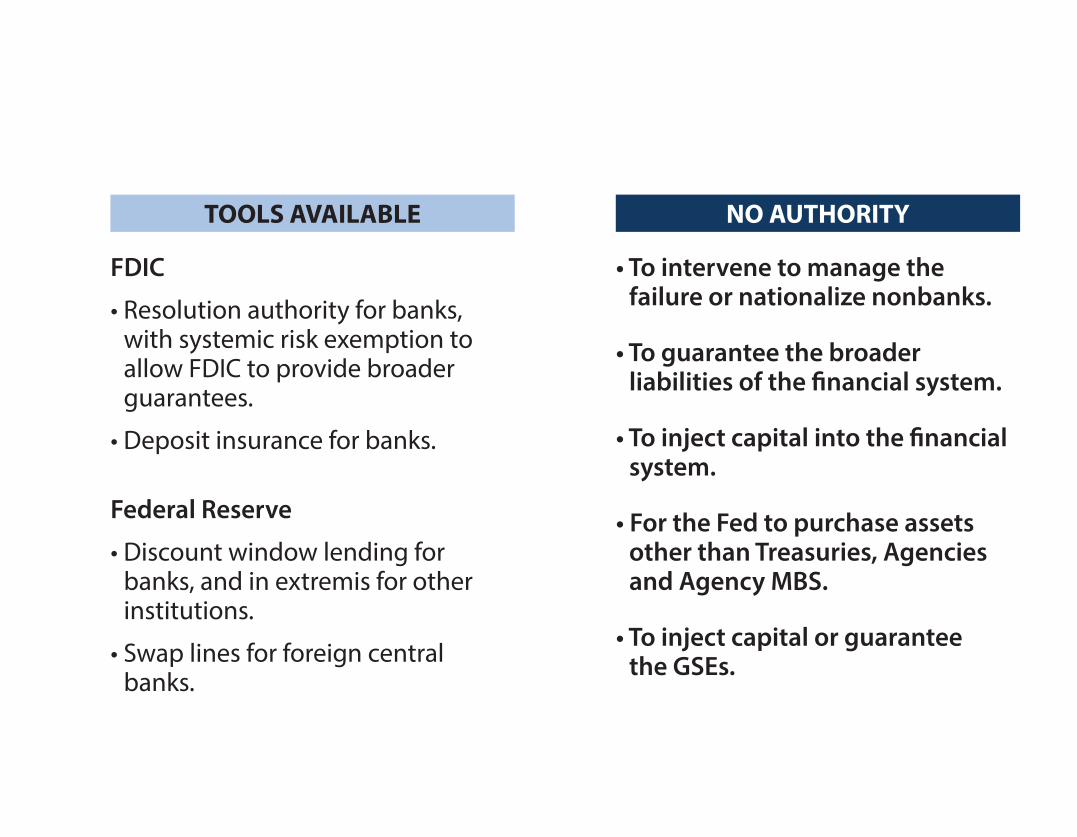
FDIC
• Resolution authority for banks, with systemic risk exemption to allow FDIC to provide broader guarantees.
• Deposit insurance for banks.
Federal Reserve
• Discount window lending for banks, and in extremis for other institutions.
• Swap lines for foreign central banks.
TOOLS AVAILABLE
• To intervene to manage the failure or nationalize nonbanks.
• To guarantee the broader liabilities of the nancial system.
• To inject capital into the nancial system.
• For the Fed to purchase assets other than Treasuries, Agencies and Agency MBS.
• To inject capital or guaranteethe GSEs.
NO AUTHORITY
0
100
200
300
400
500 basis points
200920082007
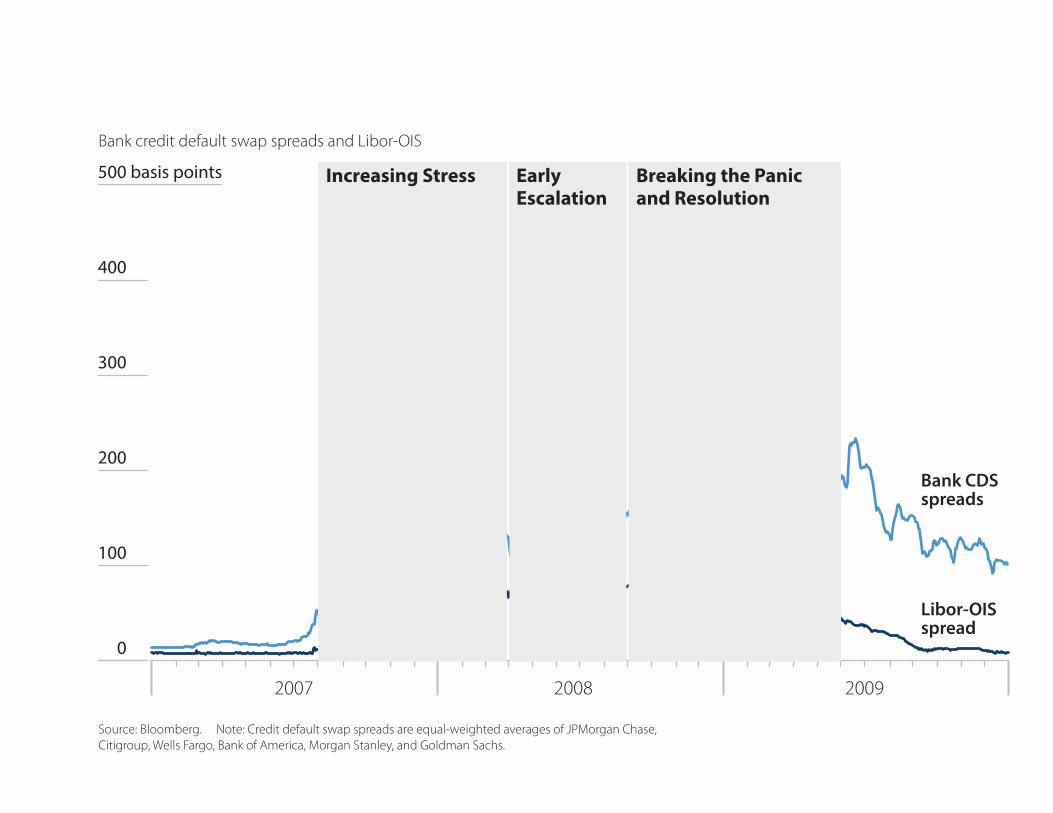
Bank CDSspreads
Source: Bloomberg. Note: Credit default swap spreads are equal-weighted averages of JPMorgan Chase, Citigroup, Wells Fargo, Bank of America, Morgan Stanley, and Goldman Sachs.
Bank credit default swap spreads and Libor-OIS
Libor-OISspread
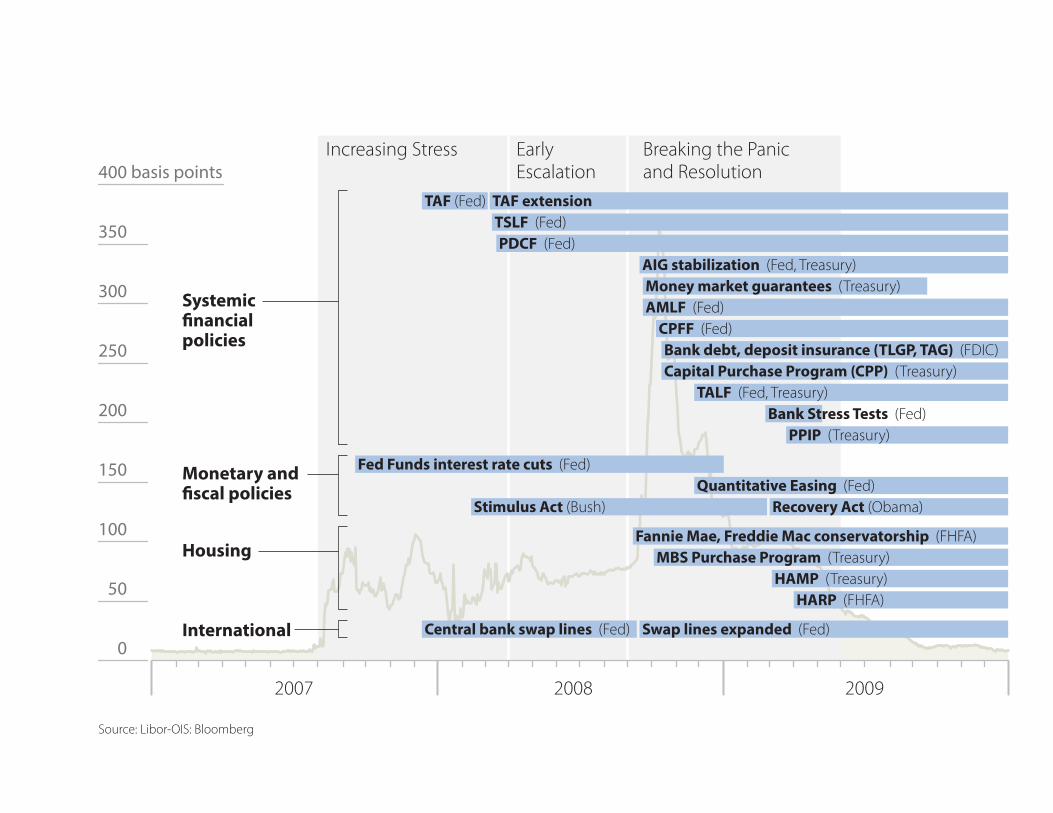
Increasing Stress EarlyEscalation
Breaking the Panicand Resolution

POLICY RESPONSES
basis points
0
50
100
150
200
250
300
350
400
200920082007
Fannie Mae, Freddie Mac conservatorship (FHFA)
PPIP (Treasury)
Capital Purchase Program (CPP) (Treasury)
MBS Purchase Program (Treasury)
AIG stabilization (Fed, Treasury)
Bank debt, deposit insurance (TLGP, TAG) (FDIC)
HAMP (Treasury)HARP (FHFA)
Bank Stress Tests (Fed)
CPFF (Fed)
TALF (Fed, Treasury)
Money market guarantees (Treasury)AMLF (Fed)
TSLF (Fed)PDCF (Fed)
Recovery Act (Obama)Stimulus Act (Bush)
TAF (Fed) TAF extension
Central bank swap lines (Fed) Swap lines expanded (Fed)
Quantitative Easing (Fed)Fed Funds interest rate cuts (Fed)
Source: Libor-OIS: Bloomberg
Increasing Stress EarlyEscalation
Breaking the Panicand Resolution
Systemicnancial
policies
Monetary andscal policies
Housing
International

billion
0
100
200
300
400
500
$600 billion
0
100
200
300
400
500
$600
2010200920082007 2010200920082007
Sources: Federal Reserve Board; internal calculations
Federal Reserve discount window usage Term Auction Credit Facility (TAF) usage
Use of theFed’s discountwindow
Term AuctionCredit Facility
Banks were reluctant to borrow from the Fed’s discount window over fear it would signal they were in
nancial trouble . . .
. . . so the Fed initiated TAF in a similar role, and opened it to both domestic and foreign banks.
Foreign banks
U.S. banks

0
50
100
150
200
250
$300 billion
0
50
100
150
200
250
300 basis points
201120102009200820072006
GSE MBS Left scale
Agency MBS spread Right scalePrivate market MBS Left scale
Sources: MBS issuance: Securities Industry and Financial Markets Association; agency MBS spread: Bloomberg
Mortgage-related securities issuance Spread between FNMA 30-year current coupon MBS and 10-year Treasury
Fannie Mae, Freddie Macconservatorship Sept. 6, 2008
Senior Preferred Stock Purchase Agreements (SPSPAs)GSEs receive capital backstop of up to $100 billion, Sept. 26
Fed QE 1 Fed announces it will buyGSE debt and GSE-backed MBS, Nov. 25, 2008
First SPSPA Amendment increases commitmentto $200 billion per GSE, May 6, 2009
Second SPSPA Amendmentincreases commitmentagain, Dec. 24, 2009

0
3
6
9
12
15%
200920082007
Asset-BackedCommercial Paper(ABCP)
Commercial Paper
Source: Federal Reserve
Overnight issuance as a share of outstanding commercial paper
Commercial Paper Funding Facility (CPFF)established by Fed, Oct. 7, 2008
Anxious investors demanded ultra-short terms for commercial paper as concerns their holdings were tainted by troubled MBS caused liquidity to evaporate.
Master Liquidity Enhancement Conduit (MLEC)On Oct. 15, 2007, Treasury facilitates plan for private banks to support the ABCP market; it is never implemented
BNP Paribas freezes three funds over MBS concerns,
Aug. 9, 2007
AMLF and money market guarantees Sept. 19, 2008
Fed establishes ABCP Money Market Mutual Fund Liquidity
Facility; Treasury announces temporary guarantee program
for money market mutual funds
Lehman BankruptcySept. 15, 2008

0
20
40
60
80
100
$120 billion
201620152014201320122011201020092008
Capital raised each year
Source: Goldman Sachs
U.S. Banks~90% of 2008-16 capital was raised 2008-10
European Banks~50% of 2008-16 capital was raised 2008-10
0
50
100
150
200
250
300
350
$400 billion
20122011201020092008 200920082007
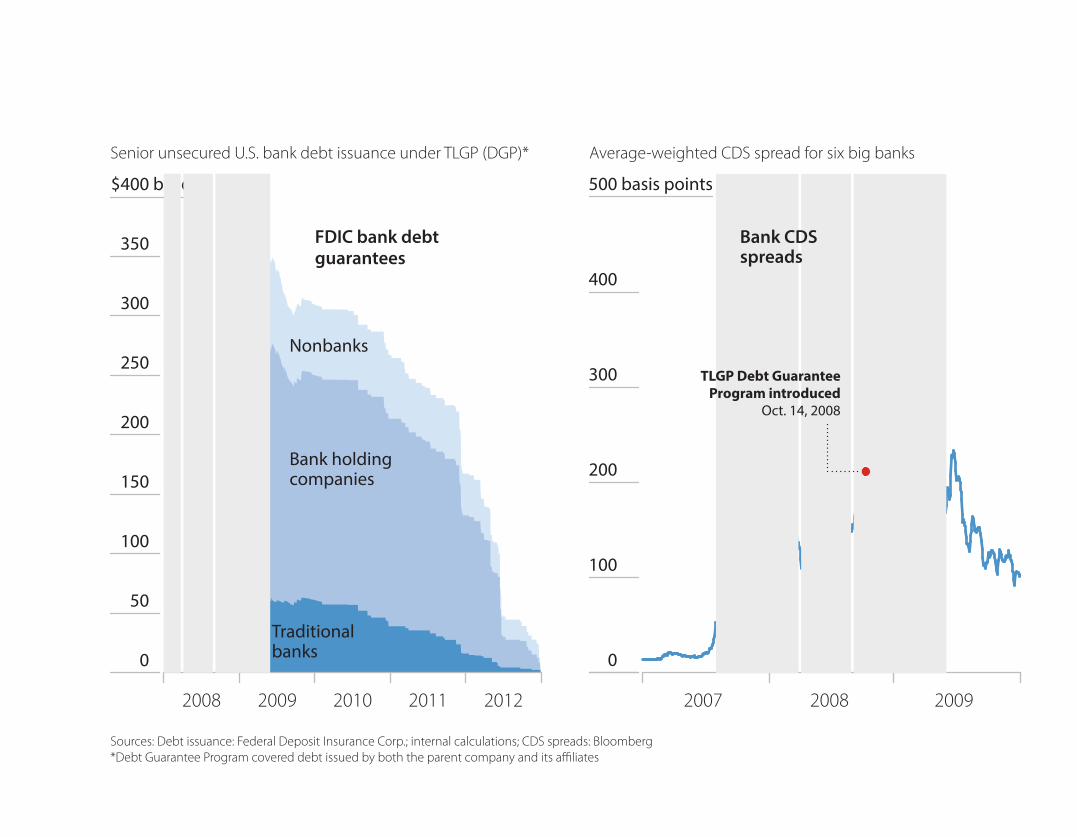
Nonbanks
Bank holdingcompanies
Traditionalbanks 0
100
200
300
400
500 basis points
Bank CDSspreads
FDIC bank debtguarantees
Sources: Debt issuance: Federal Deposit Insurance Corp.; internal calculations; CDS spreads: Bloomberg*Debt Guarantee Program covered debt issued by both the parent company and its a liates
Senior unsecured U.S. bank debt issuance under TLGP (DGP)* Average-weighted CDS spread for six big banks
TLGP Debt Guarantee Program introduced
Oct. 14, 2008
MACRO POLICIES
20122011201020092008 200720062005
0
1
2
3
4
5
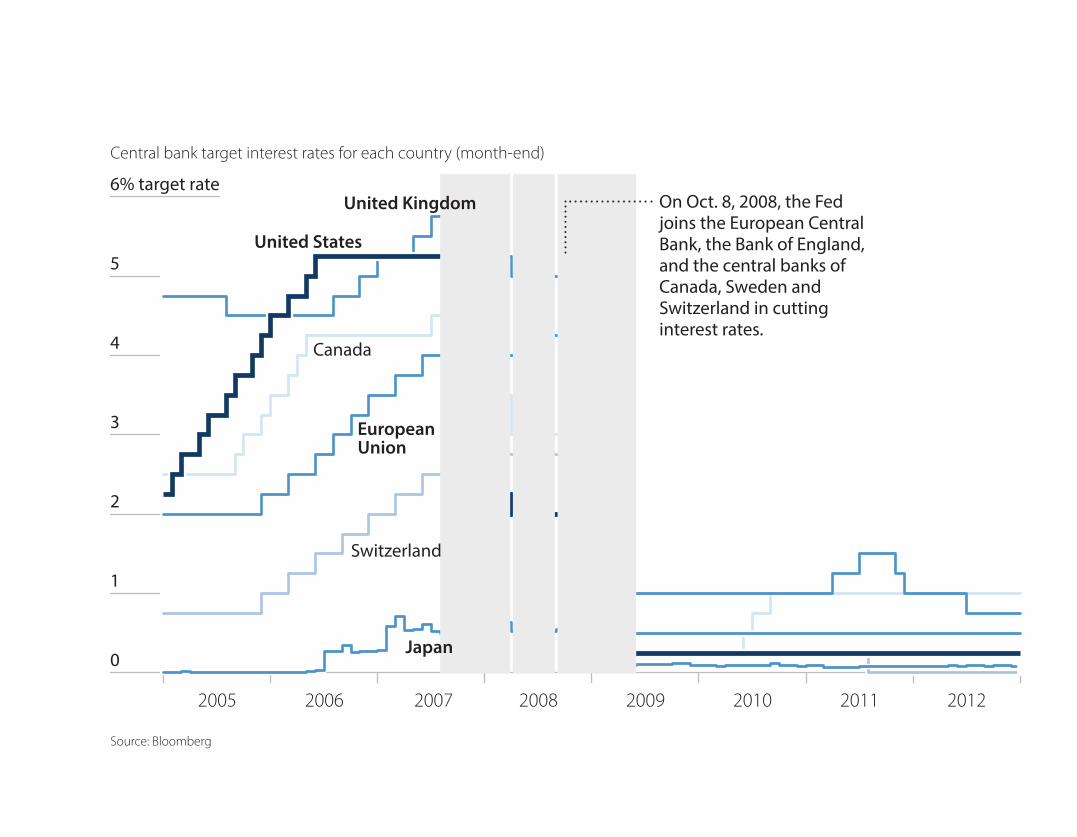
6% target rate
United States
United Kingdom
Switzerland
Canada
EuropeanUnion
Japan
Source: Bloomberg
Central bank target interest rates for each country (month-end)
On Oct. 8, 2008, the Fed joins the European Central Bank, the Bank of England, and the central banks of Canada, Sweden and Switzerland in cutting interest rates.
0
+0.5
+1.0
+1.5
+2.0
+2.5
+3.0
+3.5
+4.0%
201220112010200920082007
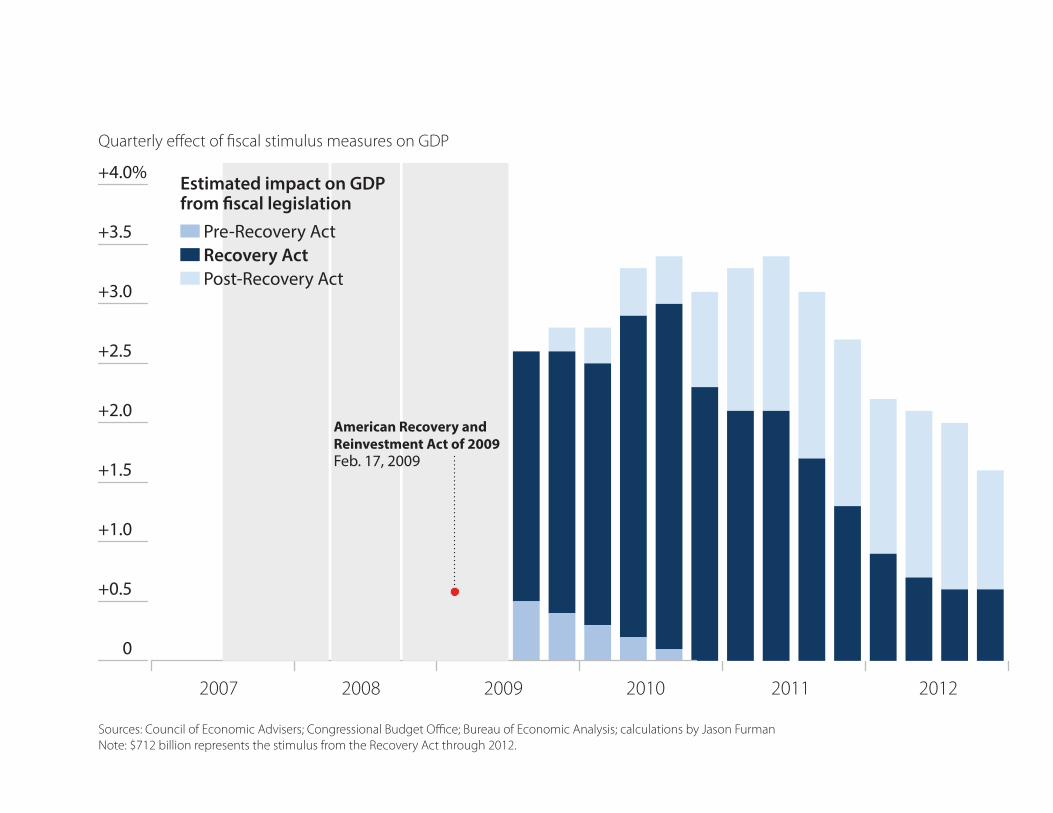
Sources: Council of Economic Advisers; Congressional Budget O ce; Bureau of Economic Analysis; calculations by Jason Furman Note: $712 billion represents the stimulus from the Recovery Act through 2012.
Quarterly e ect of scal stimulus measures on GDP
American Recovery and Reinvestment Act of 2009Feb. 17, 2009
Estimated impact on GDPfrom scal legislation
Post-Recovery ActRecovery ActPre-Recovery Act

OUTCOMES
0
1
2
3
4
5
6
$7 trillion
201020092008
–6
–4
–2
0
+2
+4
+6%
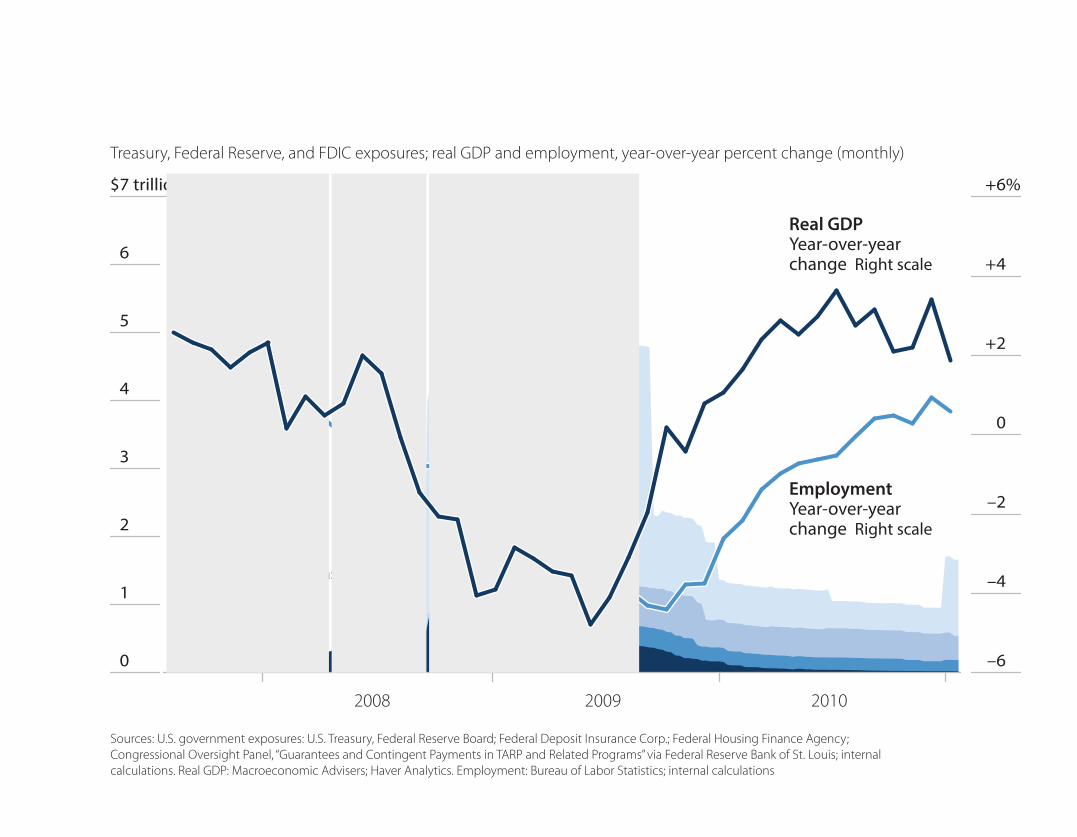
Treasury, Federal Reserve, and FDIC exposures; real GDP and employment, year-over-year percent change (monthly)
Sources: U.S. government exposures: U.S. Treasury, Federal Reserve Board; Federal Deposit Insurance Corp.; Federal Housing Finance Agency; Congressional Oversight Panel, “Guarantees and Contingent Payments in TARP and Related Programs” via Federal Reserve Bank of St. Louis; internal calculations. Real GDP: Macroeconomic Advisers; Haver Analytics. Employment: Bureau of Labor Statistics; internal calculations
GovernmentcommitmentsLeft scale
GuaranteesOther programsTARPFed liquidity
Real GDPYear-over-yearchange Right scale
EmploymentYear-over-yearchange Right scale

Sources: National Bureau of Economic Research, “Recovery from Financial Crises: Evidence from 100 Episodes”; Bureau of Economic Analysis via Federal Reserve Economic Data, internal calculations
Decline in output peak to trough(real GDP per capita)
How bad was the drop in GDP?
63 nancial crises inadvanced economies,1857 to 2013
–9.6%
U.S. nancial crisis
Duration of recessionHow long was the recession?
2.9years
1.5years
Recovery of output toprevious peak
How fast was the recovery?
7.3years
5.5years
–5.25%
–10
– 8
– 6
– 4
– 2
0
+ 2
+ 4
+ 6%
201320122011201020092008
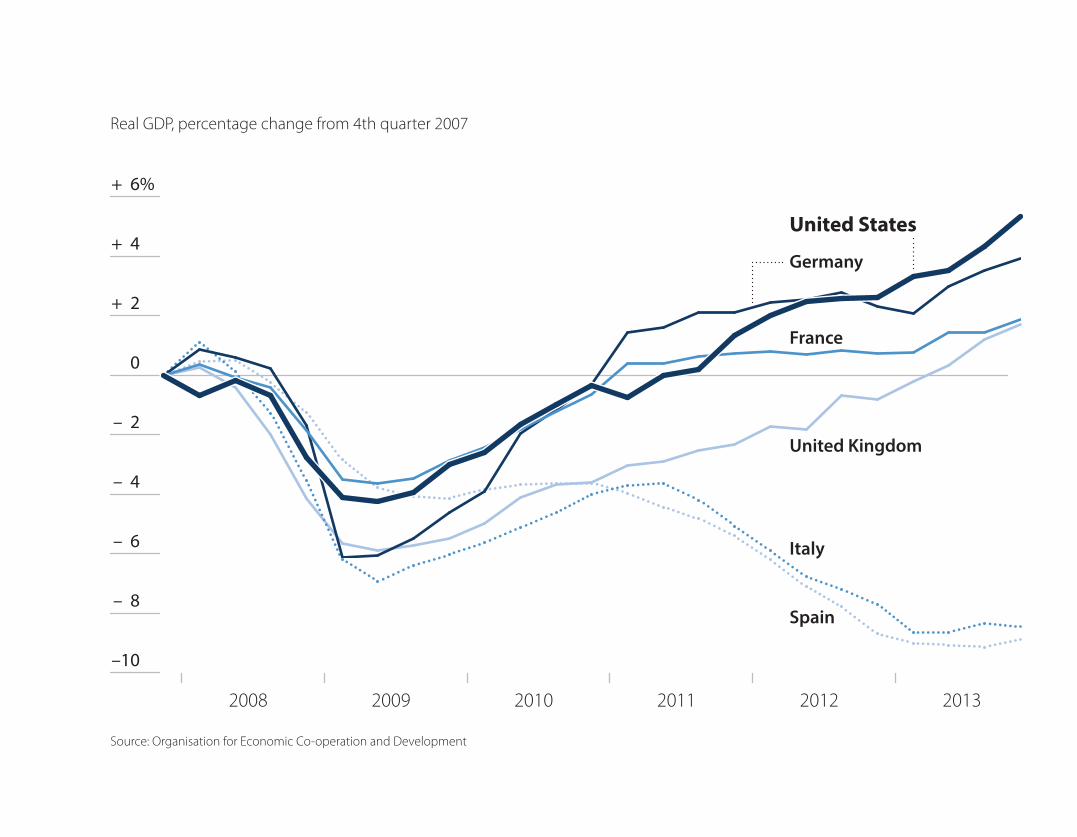
Germany
United Kingdom
Italy
Spain
France
Real GDP, percentage change from 4th quarter 2007
Source: Organisation for Economic Co-operation and Development
United States