the 2006 healthy food access basket (hfab) survey - queensland health
TRANSCRIPT

HFAB 2006The 2006
Healthy Food A
ccess Basket (H
FAB
) Survey
Key fi ndings and recommendations The cost of the Healthy Food Access Basket (HFAB), which feeds a family of six for •two weeks, has increased throughout Queensland since 2004. This difference was signifi cant in all of the remoteness categories except major cities.
In 2006 the mean cost of the HFAB statewide was $457.46. From 2004 to 2006 the •cost of the HFAB has increased statewide by almost $51 (12.6%).
The cost of the HFAB continues to be considerably higher in • very remote stores throughout Queensland, especially in those towns more than 2000 kilometres from Brisbane. In 2006 the mean cost of the HFAB was $107.81 (24.2%) higher in very remote stores in Queensland but $145.57 (32.6%) higher in very remote stores more than 2000 kilometres from Brisbane compared with the same basket in major cities.
The cost of healthy food has increased more than the cost of less nutritious •alternatives.
Inter-sectoral partnerships are needed to better understand food supply issues and to •generate sustainable targeted strategies to address the high cost of healthy foods.
National monitoring of food supply, as one component of a comprehensive nutrition •surveillance system for Australia, is vital for coordinated strategic planning, priority setting and resource allocation.
Figure 1 : The 2006 Healthy Food Access Basket (HFAB) contents
IntroductionThe 2006 Healthy Food Access Basket (HFAB) survey is the fi fth statewide cross-sectional survey of the costs and availability of a standard basket of basic healthy food items throughout Queensland.
The range and types of foods included in the HFAB represent commonly available and popular foods (Figure 1) consistent with the Australian Guide to Healthy Eating.1 The foods selected provide 70% of the nutritional requirements and 95% of the estimated energy requirements of a hypothetical family of six people for a two-week period.2 For cost comparison purposes, a number of less nutritious food items and tobacco items were also surveyed.
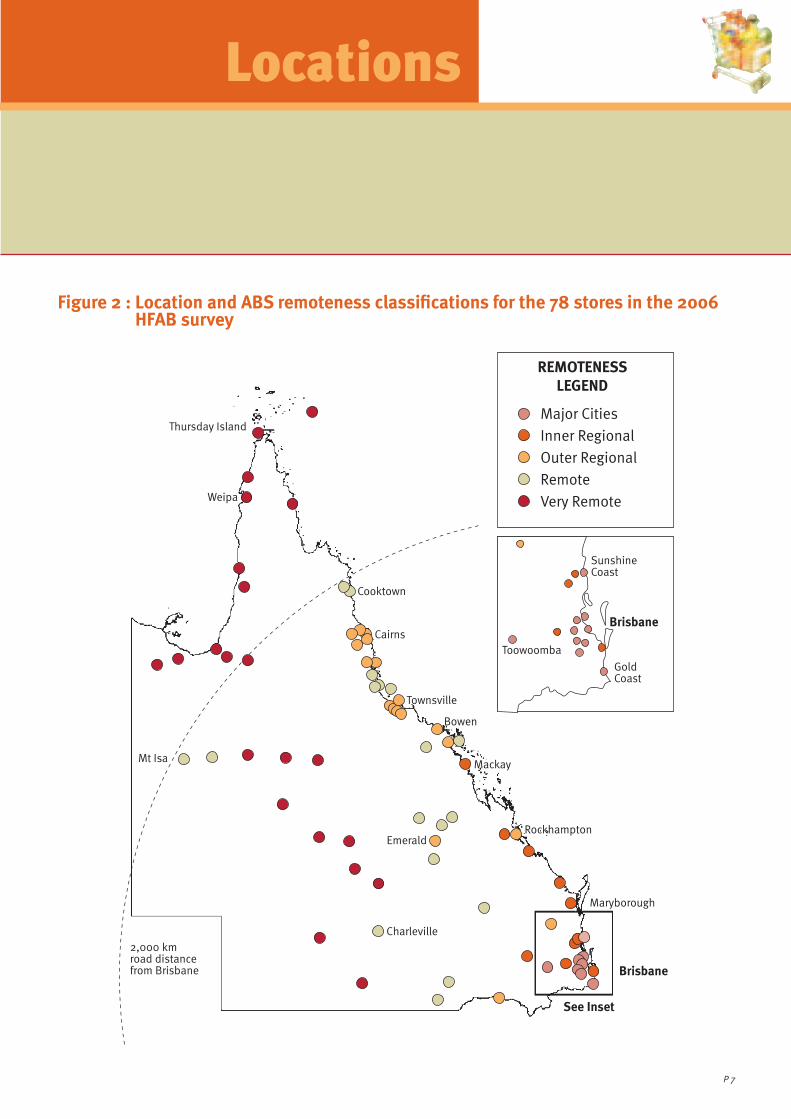
The variation in costs and availability of food in the basket is presented by the ABS Remoteness Structure3 using ARIA+4 by populated localities as the basis for the defi nition of remoteness (Figure 2). ARIA+ is the updated Accessibility/Remoteness Index of Australia categories and defi nes localities in terms of remoteness of geographical location as well as access to services.
Eighty nine stores in the fi ve remoteness categories across Queensland were surveyed during May 2006. This report presents the cost comparison by remoteness category in 78 stores for the current HFAB survey year. The 11 additional stores in the 2006 HFAB survey were included to enhance comparison with the results of previous HFAB surveys.
MethodsSample Selection and Data CollectionThe 2006 HFAB survey included changes to its sample design. Unlike the previous HFAB surveys, towns for the 2006 HFAB were randomly selected based on their population size and one store for each town was then selected based on where most people would shop. The Urban Centre/Locality (UC/L) list5 produced by the Australian Bureau of Statistics (ABS) was used to obtain a distribution of where people live and to exclude towns that were very small. This list includes towns where population clusters are 200 people or greater. In
P 2
HFAB survey
this report all urban centres and localities will be referred to as towns.
The towns were stratifi ed to enable over-sampling in the remote areas and to limit the number of islands that were selected to control for survey costs. The towns were stratifi ed by remoteness category. The remoteness categories include major cities, inner regional, outer regional, remote and very remote. The very remote category was further split into three strata - towns less than 2000 km from Brisbane, towns more than 2000 km from Brisbane, and islands. The sample sizes were chosen so that differences of 10% between remoteness categories could be detected at p<0.05 and 90% power. Through this process a total of seventy eight towns were selected for the 2006 HFAB survey. These seventy eight towns included some towns sampled in previous HFAB surveys.
In 2006 the HFAB survey was conducted by the Offi ce of Economic and Statistical Research whilst completing their Spatial Price Index (SPI) survey.6 The SPI survey was conducted in 61 Queensland regional centres to determine the price of a “basket of goods and services” based on Consumer Price Index (CPI) categories. As the SPI survey was conducted in 11 previously HFAB surveyed towns it was agreed to also conduct the HFAB survey in these towns to improve the sample size for crossover reporting purposes with the results of previous HFAB surveys. This resulted in a total of eighty nine towns surveyed during 2006 with a 100% response rate.
Stores were not advised of the specifi c date and time of surveys so that results refl ect usual availability and cost for consumers. The survey is conducted at the same time each year in an endeavour to control for seasonality. Data collected included the prices of the cheapest brand available (including generic brands if no brand available) for the forty four HFAB food items, the six less nutritious food items (cream-fi lled biscuits, plain milk chocolate, ice cream, a packet of potato crisps, a soft drink and a meat pie) and the two tobacco items. As there were four additional less nutritious food items in 2006, only the 2 items surveyed since 1998 were used for crossover comparisons. The
P 3
six less nutritious food items and the two tobacco items are referred to as “unhealthy” items in this report.
Information regarding missing HFAB food items, the availability of fresh food items (vegetables and fruit) and the availability of “better nutritional choices” items was also collected. This data was collected and compared from 2000 onwards. Methods, including the complete list of the HFAB foods, are detailed in the 2000 HFAB Survey Full Report.7
Cost ComparisonsThe mean cost of the total HFAB, the fruit, vegetables and legumes in the basket, the “unhealthy” items and the basic healthy food groups1 were compared by remoteness category for the 78 stores surveyed in 2006. Changes in cost and availability of foods since the previous three surveys (2000, 2001 and 2004) were also analysed by remoteness category for the 47 stores included in all four surveys. Further comparisons of food prices were made for the 36 stores that were included in all fi ve surveys (1998, 2000, 2001, 2004 and 2006), and increases were compared with the increase in the CPI for food in Brisbane over the same period.8 In a couple of cases the store surveyed changed to refl ect changes in shopping behaviour. Because the product description for ham and cabbage changed after the 1998 survey, the total basket could only be compared from 2000 onwards.
The CPI for food is based on a wide range of commonly purchased items (including soft drinks, cakes, biscuits, confectionary, take-away and fast food) some of which incur the Goods and Services Tax (GST). Basic food items (such as those in the HFAB) that are required to support and maintain health are mostly exempt from this tax. All CPI fi gures, including price data for individual foods used to calculate the CPI, are available from the ABS for capital cities only.
Data AnalysisResults were analysed using Microsoft Access9 and SPSS.10 For missing items, the mean cost for the item in the corresponding remoteness category was used as the default price for that year. The
2006
differences in mean costs of the HFAB contents were assessed by one-way analysis of variance and the differences in mean costs over time were assessed by paired t-tests. Kendall’s Tau was used to test for correlations between remoteness and cost.
To adjust for the different sampling fractions in the different strata, stores were weighted for the analysis. Weights were proportional to the population size for each stratum for the analysis of the 78 random stores surveyed in 2006. For comparisons with previous surveys, weights were proportional to population size for strata divided by the number of stores surveyed in that stratum.
To compare changes between consecutive HFAB surveys, only those stores previously surveyed were included. As the time intervals between the fi ve successive HFAB surveys were different, the percent change was “annualised” to allow for comparable time frames for assessing price change. This was done by calculating the square root of the ratio of the prices for the 1998 and 2000 surveys, the cube root of the ratio of the prices between the 2001 and 2004 surveys and the square root of the ratio of the prices between the 2004 and 2006 surveys. However, the cost change in dollars was not “annualised” and was shown as an average cost.
The 95% confi dence interval (95% CI) of the mean is shown on the graphs and tables in this report. A 95% confi dence interval of the mean is interpreted as a 95% chance that the confi dence interval contains the true population mean. If confi dence intervals do not overlap then the observed means are signifi cantly different at the 95% confi dence level.
ResultsCosts in 2006The 2006 HFAB survey results highlight the extra expenditure needed to purchase basic healthy food by families living in outer regional, remote and very remote areas compared to those living in major cities and inner regional centres. Figure 3 shows a trend of increasing food prices with increasing remoteness categories, with the exception of

the remote category. The cost of the HFAB in the remote category was marginally lower than the outer regional category, but the difference was not signifi cant.
In the very remote category the cost of the HFAB was 24.2% ($107.81) higher and the cost of fruit, vegetables and legumes in the basket was 20.6% ($41.29) higher compared with the major cities category (Table 1 and Figures 3a & 3b). Furthermore, there were signifi cant differences within the very remote category. For very remote stores greater than 2000 km from Brisbane (n=12), the cost of the HFAB was 32.6% ($145.57) higher and the cost of fruit, vegetables and legumes in the basket was 29.5% ($59.25) higher compared with the major cities category. For very remote stores less than 2000 km from Brisbane (n=10) the cost of the HFAB was 14.0% ($62.50) higher and the cost of fruit, vegetables and legumes in the basket was 9.8% ($19.74) higher compared with the major cities category (Figures 3a & 3b).
There were signifi cant differences in the cost of all the basic healthy food groups by remoteness category as shown in Figure 4. The bread and cereals and the dairy groups were found to have greater differences between remoteness categories than the fruit and the vegetable and legumes groups.
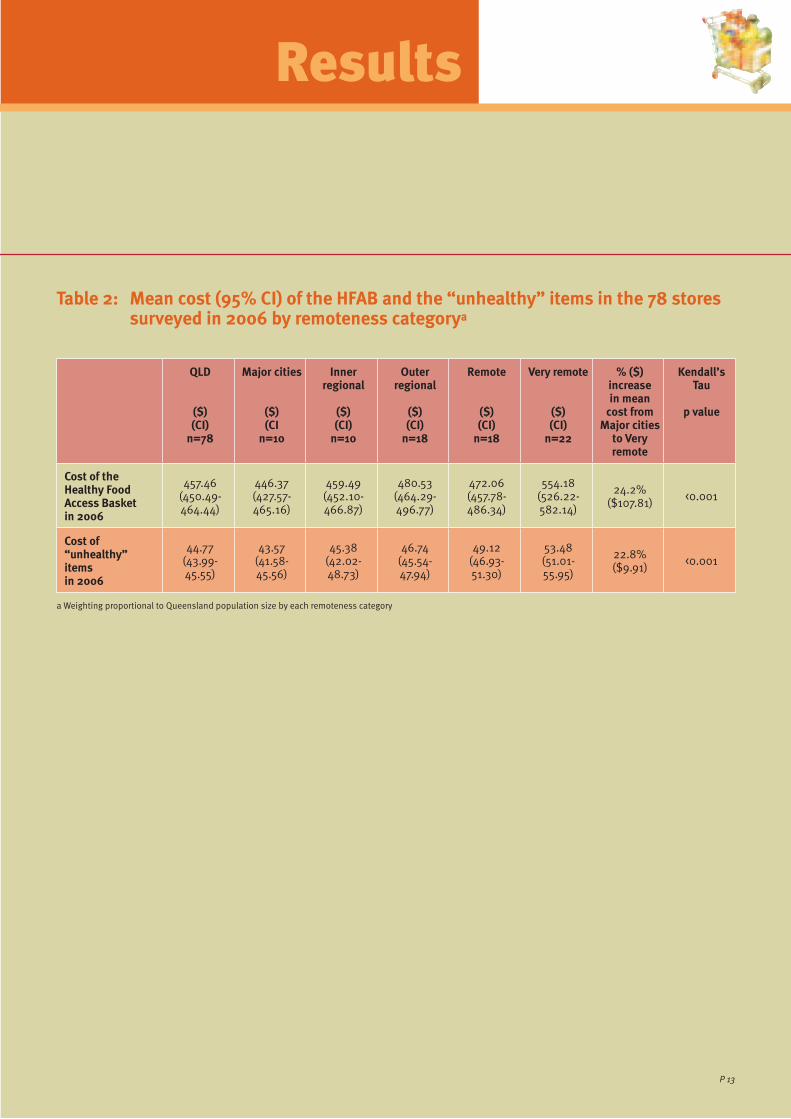
To compare the price of the HFAB items with unhealthy alternatives, the cost of tobacco and some commonly purchased high fat/high sugar food items were also recorded.7 The cost disparity across remoteness categories for the “unhealthy” items surveyed was slightly less than for the total HFAB, with the costs of the “unhealthy” items in the very remote category being 22.8% higher than in the major cities category (Table 2).
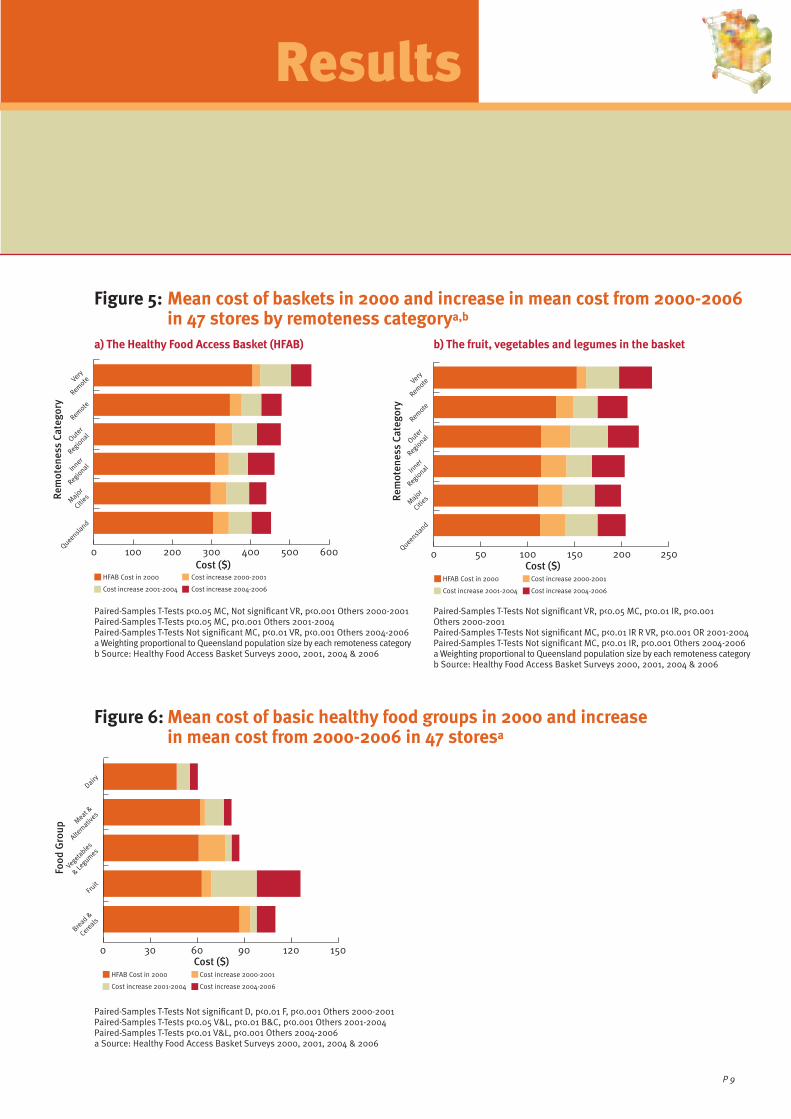
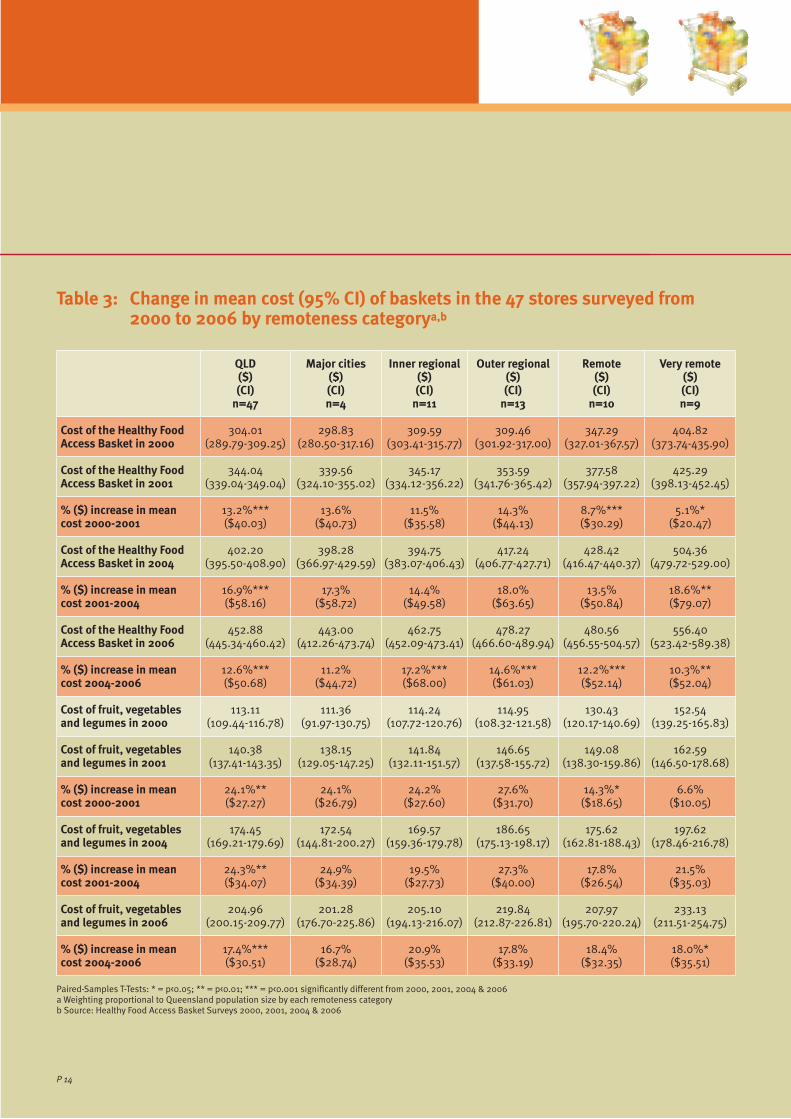
Cost increasesThere has been a signifi cant increase in the price of basic healthy food in the 47 stores that have been surveyed since 2000 (Table 3 and Figure 5). Between 2004 and 2006, the Queensland average price of the HFAB increased by 12.6% ($50.68). The inner regional category experienced the greatest cost increase for the HFAB (17.2%, $68.00).
P 4
On an annual basis, the increase in the Queensland average price of the HFAB from 2004 to 2006 (6.1%, $25.34 per annum) is comparable to the increase between 2001 and 2004 (5.3%, $19.39 per annum) but remains marginal compared to the 13.2% ($40.03 per annum) increase experienced for the HFAB between 2000 and 2001.
The Queensland average price of the fruit, vegetables and legumes in the basket increased by 17.4% ($30.51) between 2004 and 2006 (Table 3 and Figure 5b). Differences in the price of the fruit, vegetables and legumes in the basket across the remoteness categories were greater than those seen for the total HFAB. As in the 2004 survey, price increases in 2006 were found to be the greatest for the fruit group (Figure 6).
The HFAB study attempts to control for seasonal infl uences by surveying at the same time of year (May). While the CPI data for food in Brisbane suggests fruits and vegetables are susceptible to price fl uctuations, other fresh foods such as meat, milk and bread do not appear to be so variable (Table 4).
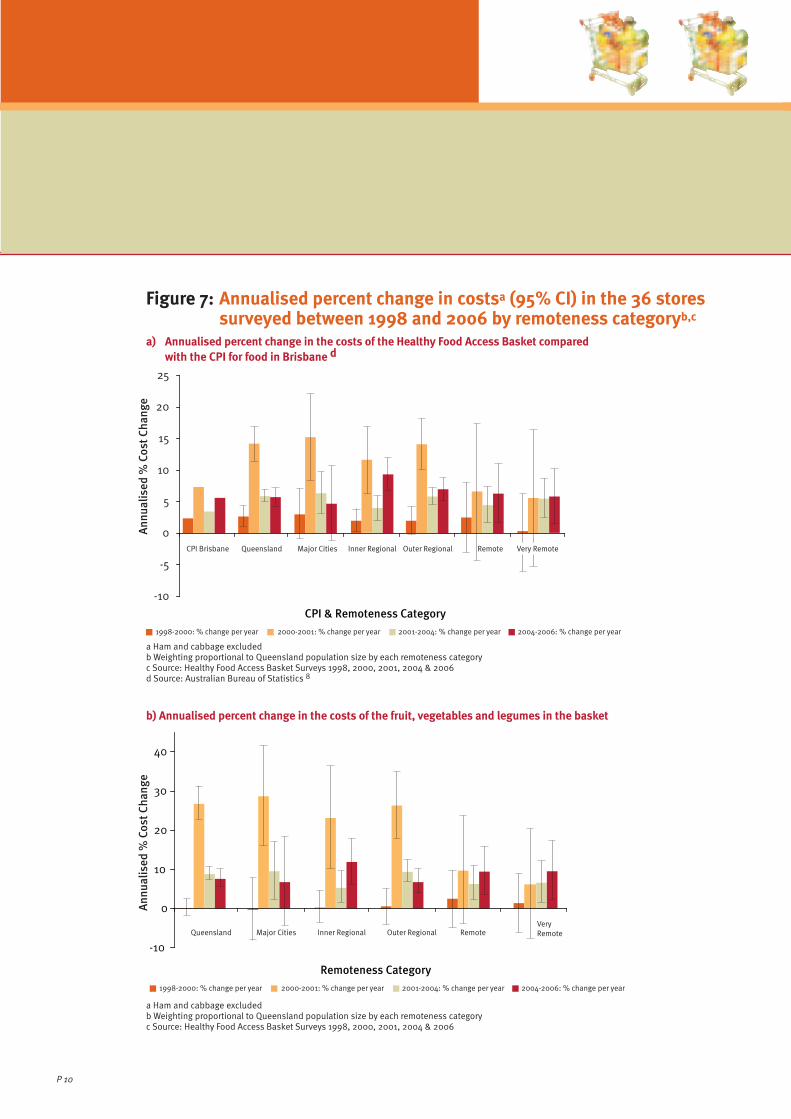
Annualised percent increases in costs for the 36 stores surveyed from 1998 to 2006 compared with the change in the CPI for food in Brisbane over the same period are shown in Figure 7a. While the largest change in food costs was observed between 2000 and 2001 when the New Tax System (NTS) was introduced, the cost of healthier foods has continued to increase more than the CPI for food in Brisbane in the majority of the remoteness categories. The 2004 – 2006 price changes for CPI for food in Brisbane were slightly higher than those for Australia as a whole (5.7% and 5.0% respectively).8
The 2005-2006 Brisbane food price increases are within the basic healthy food groups, driven mainly by the surge in fruit and vegetable prices according to the ABS (Table 4). Bananas accounted for most of the increase in fruit prices due to shortages created by Cyclone Larry in March 2006. Prices also rose for other fruit, in part refl ecting increased demand for alternative fruit as consumers looked for a substitute for bananas. Transportation costs, through higher automotive fuel prices, may have
P 5
contributed to food price increases in general, as may have increasing distribution and packaging costs.8
AvailabilityTo determine the access to healthy foods, the HFAB survey also measured the availability of fi fteen of each of the most commonly consumed fruit and vegetables in addition to food items considered to be “better nutrition choices” (Table 5).7 To assess the number of basic healthy food items that were not available for purchase on the day of the HFAB survey, the number of missing HFAB items were also counted.7
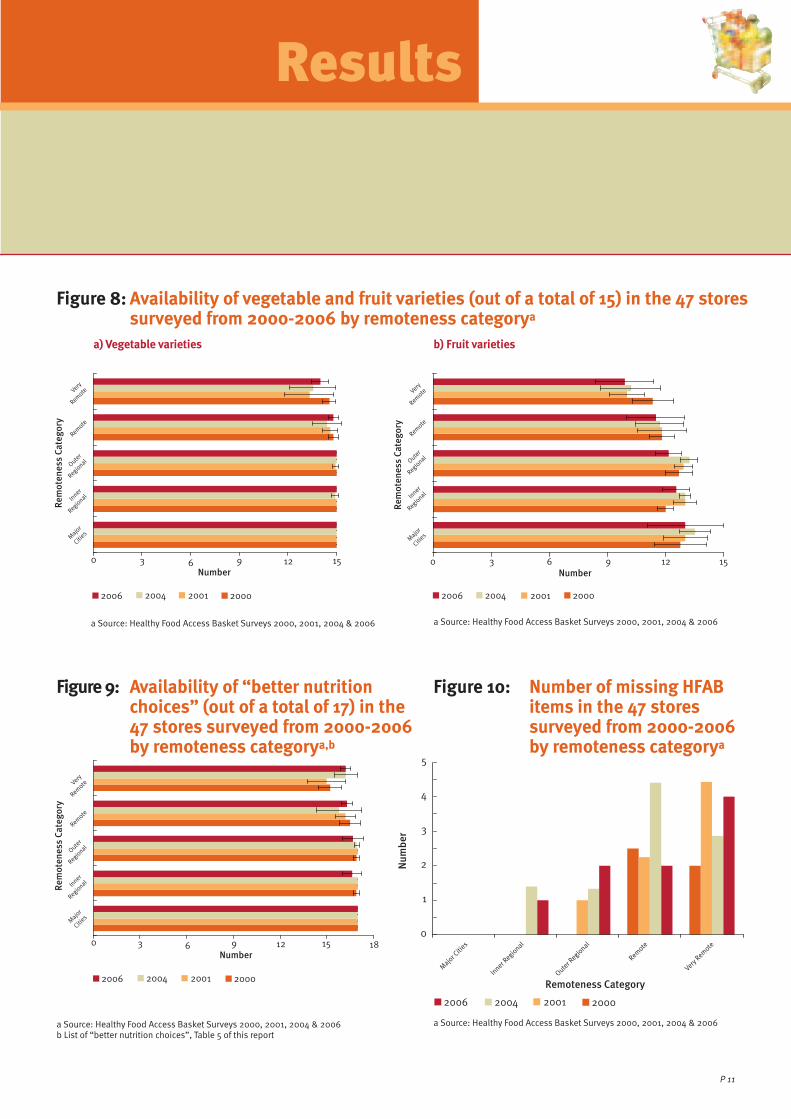
Availability data are illustrated in Figures 8a, 8b, 9 and 10. Less variety of fruit and vegetables were available in the very remote compared to the major cities category, despite a modest (non-signifi cant) improvement in the availability of vegetables in the remote and very remote categories (Figure 8a and 8b). Overall there was a wider variety of vegetables available compared to fruit, with a drop (non-signifi cant) in the availability of fruit recorded in all remoteness categories. Availability of “better nutrition choices” declined with remoteness, although slight (non-signifi cant) improvements were registered for the remote stores since 2004 and for very remote stores since 2001 (Figure 9).
The number of missing basic healthy food items continued to be high in 2006, in particular among stores in the outer regional, remote and very remote categories (Figure 10), with almost 9% of HFAB food items not available for purchase in stores from the very remote category. The most frequently missing HFAB items in all stores were bananas, wholemeal fl our, powdered skimmed milk, tinned ham and dry biscuits. The most frequently missing ‘better nutritional choice’ items were 100% orange juice and wholemeal bread.
Implications of fi ndingsPrice increases recorded in all the remoteness categories since 2004 raise concerns about healthy food access for all Queenslanders. Higher prices and limited availability of healthy foods are barriers to healthy eating that can compromise
nutritional and health status and add to the burden of obesity and chronic disease.11 Environmental infl uences, such as food access, remain major contributors to the higher death rates experienced by persons from more socioeconomically disadvantaged areas and remote regions.12 Extreme socioeconomic disadvantaged areas are found across Queensland.13
This inequality in access to healthy food is greatest in the most remote towns but exists throughout the state and refl ects the lower cost of energy dense, nutrient poor food and drinks compared to healthy options in developed countries around the world.11 With cost identifi ed as the key factor in determining the purchasing choices of socially disadvantaged families,14 effective strategies to address this issue in all towns can only be developed by addressing the price differential between healthy food and unhealthy food at state-wide and national levels.15
Distance from food supply source appears to be a major factor contributing to the higher prices paid by the very remote communities located greater than 2000 km from Brisbane. Increasing transportation and distribution costs have been cited as factors contributing to this cost disparity.8 The substantially higher costs associated with distance from major centres exacerbate the diffi culties for families in remote areas in making healthier choices. This is particularly an issue for socially disadvantaged families and Aboriginal and Torres Strait Islander peoples who suffer a disproportionate burden of poor health.13
The inequity in food price across the state is supported by the 2006 SPI results.6 The SPI survey results highlight the higher food prices in remote and very remote centres as a common feature with the fi ndings of the 2006 HFAB survey.
The price of the “unhealthy” items is affected by remoteness category to a comparable level as the HFAB items (Table 2). This would imply that with increasing remoteness people simply pay more for food, no matter their choices.
The magnitude of food price increases since 1998 is captured in Figure 7a. The substantial cost
increase recorded between 2000 and 2001 remains the greatest impact on basic food items (as found in the HFAB) despite predictions of cost reductions secondary to the introduction of the NTS.16 Labour-intensive services such as transport, handling, distribution and retailing were previously cited as contributing to these cost increases.17 Recent adverse weather conditions in major fruit and vegetable growing areas in addition to increased fuel and packaging costs have been cited as contributing to latest price increases.8
The increase in the CPI for food in Brisbane in 2005-2006 was primarily secondary to fruit price increases (Table 4).8 While this has also had an impact on food costs of the 36 stores surveyed since 1998 (Figure 7), the HFAB cost increase continued to be higher than the CPI for food in Brisbane across all remoteness categories except major cities (Figure 7a). If CPI is the statewide economic benchmark this implies that the cost of foods for good health continues to be more expensive than less nutritious alternatives across the majority of Queensland. With price an important factor when deciding what food items to buy,18 the health of all Queenslanders, but particularly people of lower socioeconomic status and other vulnerable groups, may be compromised as a result.
Availability data refl ects a decline in access to healthy food with remoteness (Figures 8a, 8b, 9 & 10). This fall is more apparent in the fruit compared to the vegetable varieties. The decline in fruit availability across all the remoteness categories since 2004 was associated with the banana shortages experienced during the 2006 survey period (Figure 8b). The improved vegetable variety since 2004 could be due to fruit and vegetable social marketing campaigns such as “Go for 2 & 5” (Figure 8a). Improvements in access to “better nutrition choices” in the remote and very remote stores may also be due to health promotion strategies such as store nutrition policies (Figure 9).
The decline in availability of basic healthy food items with increasing remoteness illustrates that
P 6
poor food security reduces the capacity of people living in remote locations to maintain good health.
ConclusionThe cost of healthy food has increased for all Queenslanders and, where data is available, by more than the cost of less nutritious alternatives.
Factors affecting the cost and availability of food are complex and largely lie outside of the health sector but impact upon nutrition and health. Solutions require joint commitment and partnerships across a range of sectors and at a range of levels (local, state and national).
Some current national initiatives to address food supply issues include:
the national Remote Indigenous Stores and •Take-away Project (RIST) which is developing and piloting a suite of tools designed to support the supply, promotion and sale of healthy food and drinks in remote stores and take-aways; and
the Outback Stores initiative (OS) which aims •to provide a retail management service for sustainable and “healthy” remote community stores across Australia. It is anticipated that OS will use the products of the RIST project.
In Queensland the joint Queensland Health and Aboriginal and Torres Strait Islander Policy (ATSIP) Nutrition Policy for ATSIP Community Stores and Take-Aways has recently been revised.
Work is currently underway to develop a national market basket survey.
The material for the Implications of Findings and the Conclusion sections was contributed by Queensland Health.
P 7
Figure 2 : Location and ABS remoteness classifi cations for the 78 stores in the 2006 HFAB survey
Locations
REMOTENESSLEGEND
Major Cities
Inner Regional
Outer Regional
Remote
Very Remote
Toowoomba
SunshineCoast
GoldCoast
Brisbane
Bowen
Townsville
Cairns
Mackay
Rockhampton
Maryborough
Brisbane
See Inset
Emerald
Charleville
Mt Isa
Cooktown
Thursday Island
Weipa
2,000 kmroad distancefrom Brisbane

P 8
0
100
200
300
400
500
600
Cost
($)
$457
.46
$446
.37
$459
.49
$480
.53
$472
.06
$554
.18
$508
.87
$591
.94
Queensland
Major Citi
es
Inner R
egional
Outer R
egional
Remote
Very Remote
Very Rem
ote >2
000km
Very Rem
ote <2
000km
Remoteness Category
Bread &Cereals
Fruit VeV getables& Legumes
Meat &Alternatives
Dairy
Food GroupMajaa or Cities Inner Regional Outer Regional Remote VeVV ry Remote
Cos
t($)
t
140
160
120
100
80
60
40
20
0
Figure 3: Mean cost (95% CI) of baskets in the 78 stores surveyed in 2006 by remoteness categorya
Figure 4: Mean cost (95% CI) of basic healthy food groups in the 78 stores surveyed in 2006 by remoteness category
a) The Healthy Food Access Basket (HFAB)
ANOVA p<0.001a Weighting proportional to Queensland population size by each remoteness category
b) The fruit, vegetables and legumes in the basket
ANOVA p<0.05a Weighting proportional to Queensland population size by each remoteness category
0
50
100
150
200
250
300
Cost
($)
$204
.99
$200
.93
$201
.03
$216
.59
$206
.33
$242
.22
$220
.67
$260
.18
Queensland
Major Citi
es
Inner R
egional
Remote
Very Rem
ote
Very Rem
ote >2
000km
Very Rem
ote <2
000km
Remoteness Category
Outer R
egional
ANOVA p<0.001 Bread & Cereals, Fruit, Meat & Alternatives, DairyANOVA p<0.01 Vegetables & Legumes
P 9
Results
HFAB Cost in 2000 Cost increase 2000-2001
Cost increase 2001-2004 Cost increase 2004-2006
0 100 200 300 400 500 600Queensland
Major
Cities
Inner
Regional
Remote
Very
Remote
Outer
Regional
Rem
oten
ess
Cate
gory
Cost ($)HFAB Cost in 2000 Cost increase 2000-2001
Cost increase 2001-2004 Cost increase 2004-2006
0 50 100 150 200 250Queensla
nd
Major
Cities
Inner
Regional
Remote
Very
Remote
Outer
Regional
Rem
oten
ess
Cate
gory
Cost ($)
HFAB Cost in 2000 Cost increase 2000-2001
Cost increase 2001-2004 Cost increase 2004-2006
Bread &
Cereals
Fruit
Meat &
Altern
atives
Dairy
Vegetables
& Legum
es
Food
Gro
up
Cost ($)0 30 60 90 120 150
Figure 6: Mean cost of basic healthy food groups in 2000 and increase in mean cost from 2000-2006 in 47 storesa
Paired-Samples T-Tests Not signifi cant D, p<0.01 F, p<0.001 Others 2000-2001Paired-Samples T-Tests p<0.05 V&L, p<0.01 B&C, p<0.001 Others 2001-2004Paired-Samples T-Tests p<0.01 V&L, p<0.001 Others 2004-2006a Source: Healthy Food Access Basket Surveys 2000, 2001, 2004 & 2006
Figure 5: Mean cost of baskets in 2000 and increase in mean cost from 2000-2006 in 47 stores by remoteness categorya,b
a) The Healthy Food Access Basket (HFAB)
Paired-Samples T-Tests p<0.05 MC, Not signifi cant VR, p<0.001 Others 2000-2001Paired-Samples T-Tests p<0.05 MC, p<0.001 Others 2001-2004Paired-Samples T-Tests Not signifi cant MC, p<0.01 VR, p<0.001 Others 2004-2006a Weighting proportional to Queensland population size by each remoteness category b Source: Healthy Food Access Basket Surveys 2000, 2001, 2004 & 2006
b) The fruit, vegetables and legumes in the basket
Paired-Samples T-Tests Not signifi cant VR, p<0.05 MC, p<0.01 IR, p<0.001 Others 2000-2001Paired-Samples T-Tests Not signifi cant MC, p<0.01 IR R VR, p<0.001 OR 2001-2004Paired-Samples T-Tests Not signifi cant MC, p<0.01 IR, p<0.001 Others 2004-2006a Weighting proportional to Queensland population size by each remoteness categoryb Source: Healthy Food Access Basket Surveys 2000, 2001, 2004 & 2006
P 10
Figure 7: Annualised percent change in costsa (95% CI) in the 36 stores surveyed between 1998 and 2006 by remoteness categoryb,c
a) Annualised percent change in the costs of the Healthy Food Access Basket compared with the CPI for food in Brisbane d
a Ham and cabbage excludedb Weighting proportional to Queensland population size by each remoteness categoryc Source: Healthy Food Access Basket Surveys 1998, 2000, 2001, 2004 & 2006d Source: Australian Bureau of Statistics 8
b) Annualised percent change in the costs of the fruit, vegetables and legumes in the basket
a Ham and cabbage excludedb Weighting proportional to Queensland population size by each remoteness categoryc Source: Healthy Food Access Basket Surveys 1998, 2000, 2001, 2004 & 2006
-10
-5
0
5
10
15
20
25
CPI Brisbane Queensland Major Cities Inner Regional Outer Regional Remote
Annu
alis
ed %
Cos
t Cha
nge
Very Remote
CPI & Remoteness Category1998-2000: % change per year 2000-2001: % change per year 2001-2004: % change per year 2004-2006: % change per year
Queensland Major Cities Inner Regional Outer Regional RemoteVeryRemote
Remoteness Category1998-2000: % change per year 2000-2001: % change per year 2001-2004: % change per year 2004-2006: % change per year
Annu
alis
ed %
Cos
t Cha
nge
-10
0
10
20
30
40
P 11
Results
0 3 6 9 12 15
2006 2004 2001 2000
Number
Major
Cities
Inner
Regional
Remote
Very
Remote
Outer
Regional
Rem
oten
ess
Cate
gory
18
2006 2004 2001 2000
0
1
2
3
4
5
Major Citi
es
Inner R
egional
Remote
Very Remote
Outer R
egional
Remoteness Category
Num
ber
Figure 8: Availability of vegetable and fruit varieties (out of a total of 15) in the 47 stores surveyed from 2000-2006 by remoteness categorya
Figure 10: Number of missing HFAB items in the 47 stores surveyed from 2000-2006 by remoteness categorya
a Source: Healthy Food Access Basket Surveys 2000, 2001, 2004 & 2006
b) Fruit varieties
a Source: Healthy Food Access Basket Surveys 2000, 2001, 2004 & 2006
a) Vegetable varieties
a Source: Healthy Food Access Basket Surveys 2000, 2001, 2004 & 2006
Figure 9: Availability of “better nutrition choices” (out of a total of 17) in the 47 stores surveyed from 2000-2006 by remoteness categorya,b
a Source: Healthy Food Access Basket Surveys 2000, 2001, 2004 & 2006b List of “better nutrition choices”, Table 5 of this report
0 3 6 9 12 15
2006 2004 2001 2000
Number
Major
Cities
Inner
Regional
Remote
Very
Remote
Outer
Regional
Rem
oten
ess
Cate
gory
0 3 6 9 12 15
2006 2004 2001 2000
Number
Major
Cities
Inner
Regional
Remote
Very
Remote
Outer
Regional
Rem
oten
ess
Cate
gory
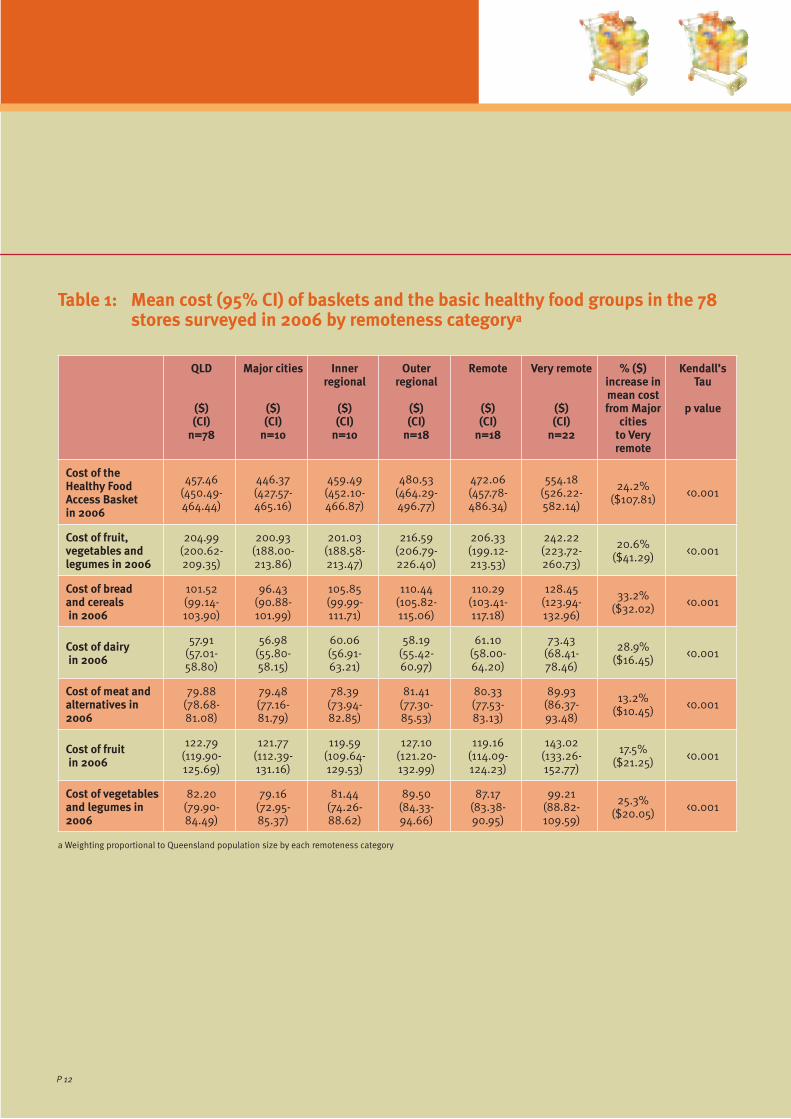
Table 1: Mean cost (95% CI) of baskets and the basic healthy food groups in the 78 stores surveyed in 2006 by remoteness categorya
QLD
($)(CI)
n=78
Major cities
($)(CI)
n=10
Inner regional
($)(CI)
n=10
Outer regional
($)(CI)
n=18
Remote
($)(CI)
n=18
Very remote
($)(CI)
n=22
% ($) increase in mean cost from Major
cities to Very remote
Kendall’s Tau
p value
Cost of the Healthy Food Access Basket in 2006
457.46(450.49-464.44)
446.37 (427.57-465.16)
459.49 (452.10-466.87)
480.53 (464.29-496.77)
472.06 (457.78-486.34)
554.18 (526.22-582.14)
24.2%($107.81) <0.001
Cost of fruit, vegetables and legumes in 2006
204.99 (200.62-209.35)
200.93 (188.00-213.86)
201.03 (188.58-213.47)
216.59 (206.79-226.40)
206.33 (199.12-213.53)
242.22 (223.72-260.73)
20.6%($41.29) <0.001
Cost of bread and cereals in 2006
101.52(99.14-103.90)
96.43 (90.88-101.99)
105.85 (99.99-111.71)
110.44 (105.82-115.06)
110.29 (103.41-117.18)
128.45 (123.94-132.96)
33.2%($32.02) <0.001
Cost of dairy in 2006
57.91(57.01-58.80)
56.98 (55.80-58.15)
60.06 (56.91-63.21)
58.19 (55.42-60.97)
61.10 (58.00-64.20)
73.43 (68.41-78.46)
28.9%($16.45) <0.001
Cost of meat and alternatives in 2006
79.88(78.68-81.08)
79.48 (77.16-81.79)
78.39 (73.94-82.85)
81.41 (77.30-85.53)
80.33 (77.53-83.13)
89.93 (86.37-93.48)
13.2%($10.45) <0.001
Cost of fruit in 2006
122.79(119.90-125.69)
121.77 (112.39-131.16)
119.59 (109.64-129.53)
127.10 (121.20-132.99)
119.16 (114.09-124.23)
143.02 (133.26-152.77)
17.5%($21.25) <0.001
Cost of vegetables and legumes in 2006
82.20(79.90-84.49)
79.16 (72.95-85.37)
81.44 (74.26-88.62)
89.50 (84.33-94.66)
87.17 (83.38-90.95)
99.21 (88.82-109.59)
25.3%($20.05) <0.001
a Weighting proportional to Queensland population size by each remoteness category
P 12
P 13
Results
Table 2: Mean cost (95% CI) of the HFAB and the “unhealthy” items in the 78 stores surveyed in 2006 by remoteness categorya
QLD
($)(CI)
n=78
Major cities
($)(CI
n=10
Inner regional
($)(CI)
n=10
Outer regional
($)(CI)
n=18
Remote
($)(CI)
n=18
Very remote
($)(CI)
n=22
% ($) increase in mean
cost from Major cities
to Very remote
Kendall’s Tau
p value
Cost of the Healthy Food Access Basket in 2006
457.46(450.49-464.44)
446.37 (427.57-465.16)
459.49 (452.10-466.87)
480.53 (464.29-496.77)
472.06 (457.78-486.34)
554.18 (526.22-582.14)
24.2%($107.81) <0.001
Cost of “unhealthy” items in 2006
44.77 (43.99-45.55)
43.57 (41.58-45.56)
45.38(42.02-48.73)
46.74 (45.54-47.94)
49.12 (46.93-51.30)
53.48 (51.01-55.95)
22.8%($9.91) <0.001
a Weighting proportional to Queensland population size by each remoteness category
P 14
Table 3: Change in mean cost (95% CI) of baskets in the 47 stores surveyed from 2000 to 2006 by remoteness categorya,b
QLD($)(CI)
n=47
Major cities($)(CI)n=4
Inner regional($)(CI)
n=11
Outer regional($)(CI)
n=13
Remote($)(CI)
n=10
Very remote($)(CI)n=9
Cost of the Healthy FoodAccess Basket in 2000
304.01(289.79-309.25)
298.83(280.50-317.16)
309.59(303.41-315.77)
309.46(301.92-317.00)
347.29(327.01-367.57)
404.82(373.74-435.90)
Cost of the Healthy FoodAccess Basket in 2001
344.04(339.04-349.04)
339.56(324.10-355.02)
345.17(334.12-356.22)
353.59(341.76-365.42)
377.58(357.94-397.22)
425.29(398.13-452.45)
% ($) increase in mean cost 2000-2001
13.2%***($40.03)
13.6%($40.73)
11.5%($35.58)
14.3%($44.13)
8.7%***($30.29)
5.1%*($20.47)
Cost of the Healthy FoodAccess Basket in 2004
402.20(395.50-408.90)
398.28(366.97-429.59)
394.75(383.07-406.43)
417.24(406.77-427.71)
428.42(416.47-440.37)
504.36(479.72-529.00)
% ($) increase in mean cost 2001-2004
16.9%***($58.16)
17.3%($58.72)
14.4%($49.58)
18.0%($63.65)
13.5%($50.84)
18.6%**($79.07)
Cost of the Healthy FoodAccess Basket in 2006
452.88(445.34-460.42)
443.00(412.26-473.74)
462.75(452.09-473.41)
478.27(466.60-489.94)
480.56(456.55-504.57)
556.40(523.42-589.38)
% ($) increase in mean cost 2004-2006
12.6%***($50.68)
11.2%($44.72)
17.2%***($68.00)
14.6%***($61.03)
12.2%***($52.14)
10.3%**($52.04)
Cost of fruit, vegetables and legumes in 2000
113.11(109.44-116.78)
111.36(91.97-130.75)
114.24(107.72-120.76)
114.95(108.32-121.58)
130.43(120.17-140.69)
152.54(139.25-165.83)
Cost of fruit, vegetables and legumes in 2001
140.38(137.41-143.35)
138.15(129.05-147.25)
141.84(132.11-151.57)
146.65(137.58-155.72)
149.08(138.30-159.86)
162.59(146.50-178.68)
% ($) increase in mean cost 2000-2001
24.1%**($27.27)
24.1%($26.79)
24.2%($27.60)
27.6%($31.70)
14.3%*($18.65)
6.6%($10.05)
Cost of fruit, vegetables and legumes in 2004
174.45(169.21-179.69)
172.54(144.81-200.27)
169.57(159.36-179.78)
186.65(175.13-198.17)
175.62(162.81-188.43)
197.62(178.46-216.78)
% ($) increase in mean cost 2001-2004
24.3%**($34.07)
24.9%($34.39)
19.5%($27.73)
27.3%($40.00)
17.8%($26.54)
21.5%($35.03)
Cost of fruit, vegetables and legumes in 2006
204.96(200.15-209.77)
201.28(176.70-225.86)
205.10(194.13-216.07)
219.84(212.87-226.81)
207.97(195.70-220.24)
233.13(211.51-254.75)
% ($) increase in mean cost 2004-2006
17.4%***($30.51)
16.7%($28.74)
20.9%($35.53)
17.8%($33.19)
18.4%($32.35)
18.0%*($35.51)
Paired-Samples T-Tests: * = p<0.05; ** = p<0.01; *** = p<0.001 signifi cantly different from 2000, 2001, 2004 & 2006a Weighting proportional to Queensland population size by each remoteness categoryb Source: Healthy Food Access Basket Surveys 2000, 2001, 2004 & 2006

P 15
Results
Table 4: Annual percentage price change for selected food items (June Quarter 1997 to June Quarter 2006) in Brisbanea
Items 97-98%
98-99%
99-00%
00-01%
01-02%
02-03%
03-04%
04-05%
05-06%
00-06%
98-06%
CPI for food 2.8 2.4 2.2 7.3 4.8 4.1 1.5 2.7 8.7 32.5 38.8
Bread 3.4 6.5 2.2 8.4 3.4 2.9 -6.6 1.4 7.5 17.4 27.7
Bread and cereal products 1.9 2.3 1.8 5.7 3.9 5.4 -1.6 0.4 5.1 20.3 25.2
Dairy and related products 2.2 3.9 8.0 -1.2 7.3 3.8 0.8 4.5 3.9 20.5 35.3
Milk 2.2 3.4 11.5 -4.6 6.4 4.3 0.2 4.5 3.2 14.5 32.0
Fruit and vegetables 3.3 6.0 -0.8 11.4 0.7 9.0 2.6 -2.6 38.7 69.7 78.3
Fruit -8.1 25.8 -17.7 18.2 13.3 -8.6 10.2 -4.9 65.5 112.3 119.6
Vegetables 12.6 -8.4 15.9 6.5 -9.4 26.9 -3.0 -0.7 15.9 36.6 45.1
Meat and seafood 0.7 -0.1 4.5 8.4 10.7 0.7 1.9 6.0 2.8 34.0 39.9
Soft drinks, water and juices 6.3 -1.5 -1.6 -1.3 1.4 0.2 0.6 4.9 3.0 8.9 5.6
Take-away and fast foods 3.0 3.1 3.6 11.1 3.7 3.7 3.0 3.2 3.8 31.8 40.8
Snacks and confectionery 4.2 5.0 1.8 5.5 5.7 4.9 2.0 3.7 6.2 31.4 40.5
a Source: Australian Bureau of Statistics 8
Table 5: Vegetable and fruit variety and “better nutrition choices” checklistsa
Vegetables Fruit “Better nutrition choices”
Broccoli Apple Wholemeal bread
Cabbage Banana Dried fruit
Capsicum Grape Dry biscuits, low fatb
Carrot Kiwi fruit Tinned fruit, in natural juice
Caulifl ower Mango Monounsaturated oil like canola or olive
Cucumber Orange Fresh reduced fat milk
Green beans Other citrus fruit Yoghurt
Lettuce Other stone fruit Bottled water
Mushroom Pawpaw Baked beans
Onion Peach 100% Orange juice
Potato Pear Diet cordial
Pumpkin Pineapple Diet soft drink
Sweet corn Rock melon Lean meatc
Sweet potato Strawberry Other dried legumes e.g. lentils, split peas, chickpeas
Tomato Watermelon Poly/mono-unsaturated margarine
Red kidney beans
Tinned bean mix
a Source: The 2000 Healthy Food Access Basket (HFAB) Survey: Full Report 7
b Low fat dry biscuits are biscuits which have less than 10g of fat per 100g c Lean meat determined by visual inspection: lean meat if little visible fat

References
P 16
For more information or additional copies of this report contact: Dr Amanda Lee Manager, Nutrition and Physical Activity Health Promotion Unit Population Health Branch Queensland Health email: [email protected]
References 1 Department of Health and Ageing. Australian Guide to
Healthy Eating. Canberra: Department of Health and Ageing, 1998. http://www.health.gov.au/internet/wcms/Publishing.nsf/Content/health-pubhlth-strateg-food-guide-index.htm (accessed June 2007).
2 Cashel K, Jeffreson S. The Core Food Groups. Canberra: National Health and Medical Research Council, 1992. http://www.nhmrc.gov.au/publications/synopses/n16covr.htm (accessed June 2007).
3 Australian Bureau of Statistics. Information Paper: Outcomes of ABS views on Remoteness Consultation, Australia. Canberra: Australian Bureau of Statistics; July 2001. http://www.abs.gov.au/AUSSTATS/[email protected]/Lookup/1244.0.00.001Main+Features1Jun%202001?OpenDocument (accessed June 2007).
4 GISCA, University of Adelaide. ARIA+ Version 2 - Accessibility/Remoteness Index of Australia: Adelaide: University of Adelaide, 2004. http://www.gisca.adelaide.edu.au/products_services/ariav2.html (accessed June 2007).
5 Australian Bureau of Statistics. Census of Population and Housing: Selected Characteristics for Urban Centres and Localities, Queensland, 2001 (Cat. no 2016.3). http://www.abs.gov.au/AUSSTATS/[email protected]/DetailsPage/2016.32001?OpenDocument <http://www.abs.gov.au/AUSSTATS/[email protected]/DetailsPage/2016.32001?OpenDocument> (accessed June 2007).
6 Queensland Treasury. Offi ce of Economic and Statistical Research. Index of Retail Prices in Queensland Regional Centres, May 2006. http://www.oesr.qld.gov.au/queensland-by-theme/economic-performance/prices/regular-publications/index-retail-prices-reg-centres/index.shtml (accessed June 2007).
7 Queensland Health. The 2000 Healthy Food Access Basket (HFAB) Survey: Full Report. Brisbane: Queensland Health 2001. http://www.health.qld.gov.au/phs/documents/shpu/9137.pdf (accessed June 2007).
8 Australian Bureau of Statistics. Consumer Price Index, Australia, June 2006 (Cat. no 6401.0) and
Time Series Spreadsheets Table 13 CPI: Groups, Sub-groups and Expenditure Class, Index Numbers by Capital City. http://www.abs.gov.au/AUSSTATS/[email protected]/Lookup/6401.0Main+Features1Jun%202006?OpenDocument (accessed June 2007).
9 Microsoft. Access 2002 (10.4302.4219) SP – 2. Redmond, Silicon Valley, USA: Microsoft Inc 2001.
10 SPSS. SPSS 12.0.1 for Windows. Chicago, USA: SPSS Inc 2003.
11 Drewnowski, A., The Real Contribution of Added Sugars and Fats to Obesity. Epidemiologic Reviews, 2007. Advance Access published on June 24, 2007. http://epirev.oxfordjournals.org/cgi/content/abstract/mxm011v1?ct (accessed June 2007).
12 Queensland University of Technology and the Australian Institute of Health and Welfare. Health inequalities in Australia: mortality. QUT and AIHW, September 2004. http://www.aihw.gov.au/publications/index.cfm/title/10041 (accessed June 2007).
13 Queensland Health. The Health of Queenslanders 2006. Report of the Chief Health Offi cer, Queensland, Queensland Health. Brisbane 2006. http://www.health.qld.gov.au/cho_report/ (accessed June 2007).
14 World Health Organisation, Diet, nutrition and the prevention of chronic disease: report of a joint WHO/FAO expert consultation. Geneva: WHO 2003 (WHO Technical report series: 916) http://whqlibdoc.who.int/trs/WHO_TRS_916.pdf (accessed June 2007).
15 Drewnoski A, Darmon N. Food choices and Diet Costs: an Economic Analysis. The Journal of Nutrition 2005; 135: 900-904. http://jn.nutrition.org/cgi/content/full/135/4/900 (accessed June 2007).
16 Australian Competition and Consumer Commission. Report on ACCC Price Surveys: General Survey. Canberra: Australian Competition and Consumer Commission Publishing Unit, 2001. http://www.accc.gov.au/content/index.phtml/itemId/304257 (accessed June 2007).
17 Spencer S. Price Determination in the Australian Food Industry: A Report. Canberra: Australian Government Department of Agriculture, Fisheries and Forestry; 2004 http://www.daff.gov.au/agriculture-food/food/publications/price-determination (accessed June 2007).
18 Department of Primary Industries. Queenslanders’ Attitudes Towards Everyday Food Items Newsletter. Brisbane: Department of Primary Industries; March 2001. http://lists.dpi.qld.gov.au/dpi-info-sites-l.html (accessed June 2007).