the 1852 banda arc mega-thrust earthquake and tsunami in
TRANSCRIPT

Brigham Young University Brigham Young University
BYU ScholarsArchive BYU ScholarsArchive
Theses and Dissertations
2014-12-01
The 1852 Banda Arc Mega-thrust Earthquake and Tsunami in The 1852 Banda Arc Mega-thrust Earthquake and Tsunami in
Indonesia Indonesia
Tsz Man Fisher Brigham Young University - Provo
Follow this and additional works at: https://scholarsarchive.byu.edu/etd
Part of the Geology Commons
BYU ScholarsArchive Citation BYU ScholarsArchive Citation Fisher, Tsz Man, "The 1852 Banda Arc Mega-thrust Earthquake and Tsunami in Indonesia" (2014). Theses and Dissertations. 5674. https://scholarsarchive.byu.edu/etd/5674
This Thesis is brought to you for free and open access by BYU ScholarsArchive. It has been accepted for inclusion in Theses and Dissertations by an authorized administrator of BYU ScholarsArchive. For more information, please contact [email protected], [email protected].

The 1852 Banda Arc Mega-Thrust Earthquake and Tsunami in Indonesia
Tsz Man Lau Fisher
A thesis submitted to the faculty of Brigham Young University
in partial fulfillment of the requirements for the degree of
Master of Science
Ronald Albert Harris, Chair Summer Burton Rupper
Barry R. Bickmore
Department of Geological Sciences
Brigham Young University
December 2014
Copyright © 2014 Tsz Man Lau Fisher
All Rights Reserved

ABSTRACT
The 1852 Banda Arc Mega-Thrust Earthquake and Tsunami in Indonesia
Tsz Man Lau Fisher Department of Geological Sciences, BYU
Master of Science
In 1852, a five-minute long earthquake hit the Banda Arc region that was felt over most of Indonesia. It caused uplift of new islands and sent a tsunami across the Banda Sea that reached a height of 8 meters at Banda Neira and was also registered at Ambon, Saparua and other islands. Records of the 1852 earthquake at multiple locations provide the constraints needed to reconstruct the disastrous event through earthquake intensity analysis and numerical modeling of the tsunami. Using tsunami heights and arrival times as the major constraints, best fit numerical models of the tsunami were constructed using Clawpack. These models indicate that the earthquake was most likely a mega-thrust event along the Tanimbar Trough with a Mw of around 8.4. At least 10-15 meters of elastic strain energy has accumulated along the Tanimbar Through since the 1852 event, and the population in the region has increased exponentially. When another event occurs ≥ that in 1852, there will be many more people and treasure in harms way.
Keywords: megathrust earthquake, tsunami modeling, Eastern Indonesia, Banda arc, Tanimbar trough, historical earthquake, natural disaster mitigation

ACKNOWLEDGEMENTS
This project was funded in part by the National Science Foundation (grant EAR 0948386), and the Department of Geological Sciences at Brigham Young University.
I would like to thank my advisor, Dr. Ron Harris, for the patient mentoring he offered before my master enrollment and throughout the project. He has spent hours teaching and advising me even when I am out of the states. His enthusiasm towards the subject has been a great support to me. I also want to thank my committee members, Dr. Summer Rupper and Dr. Barry Bickmore, for their willingness to answer questions, advise and revise the manuscript. They were always ready to help. I need to express special gratitude to Breanyn MacInnes from University of Washington, who provided valuable technical support and advice on the Clawpack software.
Most importantly, I need to thank my family. Their support and love are the very foundations of my success. Bryce has been the greatest husband and companion to me. Notwithstanding his stress and many tasks at work, he took care of the family when I needed to work on my project. His insistance on the completion of this project has kept me on track during the past three years. My daughters, Claira and Bella are the greatest addition to the family in the process. They have been the source of happiness to me. My parents’ encouragement and love have been another source of relief and help. They are truly the best parents that I could ask for.

iv
TABLE OF CONTENT
ABSTRACT .................................................................................................................................... ii
ACKNOWLEDGEMENTS ........................................................................................................... iii
TABLE OF CONTENT ................................................................................................................. iv
LIST OF FIGURES ........................................................................................................................ v
LIST OF TABLES ......................................................................................................................... vi
1. INTRODUCTION ............................................................................................................... 7
2. TECTONIC SETTING ........................................................................................................ 8
3. HISTORIC EARTHQUAKES OF EASTERN INDONESIA ............................................. 9
3.1 Wichmann Catalog ........................................................................................................... 9
3.2 1852 Earthquake ............................................................................................................. 11
3.3 Modified Mercalli Intensity Map ................................................................................... 12
4. NUMERICAL MODEL..................................................................................................... 13
4.1 Bathymetry / Topography .............................................................................................. 14
4.2 Fault Parameters and Vertical Seafloor Deformation .................................................... 14
4.3 Amplification Factor ...................................................................................................... 15
5. ESTIMATES OF MOMENT MAGNITUDE ................................................................... 16
6. CONCLUSION .................................................................................................................. 18
7. REFERENCES .................................................................................................................. 19

v
LIST OF FIGURES
Figure 1 ........................................................................................................................................................................ 23
Figure 2. ....................................................................................................................................................................... 24
Figure 3 ........................................................................................................................................................................ 25
Figure 4 ........................................................................................................................................................................ 26
Figure 5 ........................................................................................................................................................................ 28
Figure 6. ....................................................................................................................................................................... 29
Figure 7 ........................................................................................................................................................................ 30
Figure 8 ........................................................................................................................................................................ 31

vi
LIST OF TABLES
Table 1 ......................................................................................................................................................................... 34
Table 2 ......................................................................................................................................................................... 36
Table 3 ......................................................................................................................................................................... 37
Table 4 ......................................................................................................................................................................... 38
Table 5 ......................................................................................................................................................................... 39
Table 6 ......................................................................................................................................................................... 40
Table 7 ......................................................................................................................................................................... 41

7
One of the greatest lessons we learn from the 2011 Tohoko Earthquake and tsunami is the
importance of incorporating historic records into hazard models. This devastating earthquake
struck in areas designated as low probability because historical and geological records of
previous events of similar size in the Tohoko region were ignored. The tsunami generated by the
earthquake inundated areas previously destroyed by historical tsunamis, such as the area of the
Fukishima nuclear reactor The hazard model for the Tohoko area was weighted too heavily on
previous earthquakes in instrumental records, which are only reliable for the past 50-70 years.
Mega-thrust earthquakes, such as the Tohoko event and several recent events in Indonesia,
reoccur at intervals of hundreds to thousands of years. If Japan had factored in historical
earthquake records to its probability estimates, Tohoko would have had one of the highest
probabilities (i.e. Kelleher et al., 1973).
Wichmann (1918) compiled an invaluable record of historic earthquakes and tsunami that
happened in the Indonesian region during most of the Dutch colonial period (1530-1877).
Because this record was only recently translated, from old German and Dutch into English
(Harris and Major, in press), few are aware of it, or that it documents frequent megathrust
earthquakes and tsunami in the region. Some of the major events that happened in the 1800’s in
western Indonesia have reoccurred in the last 10 years. The fault segments that ruptured are
nearly the same patches of the subduction interface as reconstructed from the Wichmann catalog
(NewComb and McCann, 1987).
Reconstruction of historic earthquake events in other parts of Indonesia is needed to more
accurately assess the disaster potential of large earthquakes and tsunamis. Numerical models of
some of these events is possible if both the arrival times after shaking and run-up heights of
1. INTRODUCTION

8
tsunamis they caused is recorded. With these data it is possible to reconstruct the likely source
region of the event and its moment magnitude. This approach has proven useful for discovering
previously unknown source regions of mega-thrust earthquakes in eastern Indonesia (Liu and
Harris, 2012).
The purpose of this paper is to reconstruct from historical accounts the 1852 Banda arc
earthquake and tsunami. This event was felt over a 2000 km wide area and created a wide-spread
tsunami across the Banda Sea. Numerical models of geophysical events like these provide a way
to determine the likely source region and fault parameters of the earthquake, and to assess the
impact a reoccurrence of the event will have on densely populated coastal communities. The
population in coastal regions of eastern Indonesia has increased ten-fold since 1852. During this
time of rapid growth there has not been a major earthquake or tsunami in the region. At strain
rates of 75-110 mm/year, up to 12-17 meters of elastic strain has likely accumulated along some
plate boundary segments.
Indonesia is at the heart of a three-way tectonic collision between the Australian, Asian and
Pacific Plates. It is located along the Southeast edge of the Eurasian plate, which is the upper
plate to two major subduction zones. The Sunda subduction system forms along the western and
southern edge of Indonesia (Figure 1) where the Australian plate is converging at a rate of 50-75
mm/year (Nugroho et al., 2009). Along the eastern side of Indonesia is a series of subduction
zones and transform faults that form the plate boundary with the Pacific Plate, which converges
at a rate of 100-110 mm/year (Rangin et al., 1999). The Banda Arc, where the lower plate is the
2. TECTONIC SETTING

9
northern Australian continental margin (Harris, 2011), connects the Sunda and eastern Indonesia
subduction systems through a bend of 180 (Figure 1).
The western part of the Sunda Arc has experienced several mega-thrust earthquakes over the
past decade. However, the eastern part of the Sunda Arc, Banda Arc and eastern subduction
zones remained relatively quiet over the past 150 years. GPS measurements throughout the
Banda Arc show that elastic strain is accumulating in a diffuse zone between the Timor Trough
and Sulawesi (Nugroho et al., 2009). Within this zone are the Wetar and Flores backarc thrust
systems (Figure 1). The Wetar backarc thrust is accommodating up to 60% of the plate
convergence (Harris, 1991). However, this thrust may not produce a long enough rupture for a
mega-thrust event. The most likely active faults to generate a mega-thrust earthquake and
regional tsunami are the Timor, Tanimbar and Seram Troughs of the Banda arc-continent
collision zone. At least 22 mm/year of strain is accumulating along these large plate boundary
segments in the Timor and Tanimbar region (Nugroho et al., 2009) and twice this in the Seram
region (Rangin et al., 1999).
Major geophysical events were recorded in Indonesia during the Dutch colonial era. These
observations were later compiled and published as “The Earthquakes of the Indian Archipelago”
by Arthur Wichmann (1918), known here as the Wichmann Catalog. This catalog documents 166
destructive earthquakes and 43 tsunamis between 1538 and 1877 (Wichmann, 1918). From 1600-
1877 at least 600 major and minor earthquakes and 21 tsunami were documented in the southern
Banda Sea region alone, namely in the Banda Islands, Ambon, Haruku, Saparua, Seram and
3. HISTORIC EARTHQUAKES OF EASTERN INDONESIA
3.1 Wichmann Catalog
10
Timor (Figure 2). The abundance of earthquakes in the region waxed and waned with peaks of
activity during 1629-1644, 1675-1711, 1754-1775, 1815-1846, and 1850-to the end of the record
(1877). The 1814-1846 cluster included the eruption of Tambora, which is Earth’s largest
historic eruption. The earthquake clusters are bounded by major events at the beginning and ends
of each period, and have temporal distribution tails that diminish with time, which is typical of
aftershock patterns. Major earthquake events with over two minutes of shaking commonly
damaged well-constructed buildings (government buildings). These events were also felt across
the region and were followed by weeks of aftershocks (Figure 2). Most of these events were also
accompanied by tsunamis.
From the first reliable account of earthquake damage in 1608 there have been at least 77
destructive earthquakes and 32 tsunami (Figure 3; Table 1) in the southern Banda Sea region
(Latief, 2000; Gempabumi, 2011; Sololief). During the 270 year period of the Wichmann
Catalog (1608-1877) there were 49 destructive earthquakes and 22 tsunamis. Since this time
(1878-2014) there have been 28 destructive earthquakes and 10 tsunamis. The rate of destructive
earthquakes for both time periods is one major event every 5 years. Destructive earthquakes
associated with tsunamis are a bit higher in the earlier time period (1608-1877) than the later one
(1878-2014), once in every 12 years versus once in every 14 years, respectively. The number of
destructive earthquakes has increased since 1975 most likely because of large increases in
population and urbanization and better reporting.
The earthquakes in the record cluster in time and space, which is consistent with a stress
contagion effect. While the rate of destructive earthquakes remained the same from 1600-2014,
the size of destructive earthquakes has largely decreased since 1877. A catastrophic earthquake
or tsunami is not documented in the southern Maluku region since 1899. The Banda Islands have

11
not experienced a tsunami higher than 5m since 1852, whereas it experienced 3 major tsunamis
in roughly the same amount of time previous to 1852. The reoccurrence of major earthquake
events, such as those that happened in 1629, 1765, 1852 and 1873 will devastate this region now
that it has much more to lose.
The gigantic earthquake of 1852, and the tsunami it produced, is perhaps the largest historic
event of its kind in eastern Indonesia (Table 2). The main shock of the earthquake took place
between 7 am and 8 am on November 26, 1852. Later that day, 9 aftershocks were felt. Likely
aftershocks happened daily for the next 8 days and occasionally in the following months and
years. The main shock involved 5 minutes of violent ground shaking as documented in Banda
Neira, Rosengain, Pulu Ai, Ambon, Saparua, Haruku, Buru and Seram. Movement was felt as far
as Madura Island and East Java (Figure 4; Table 2), which is 2000 km away from the Banda
Islands where most of the damage occurred. The buildings in Banda Neira (Figure 1) were
leveled during the first shock. Ambon (Figure 1) was rocked by ENE-WSW directional shaking.
On Huruku (Figure 1), Aborn Church and Fort Zeelandia were cracked as the result of shaking.
In Surabaya (Figure 1), Lake Grati was “set in motion” by a weak NW-SE shock.
Following the earthquake, islands in the Banda Sea were inundated by a tsunami (Figure 5).
The “flood wave”, as it is referred to in the historical account, arrived at Banda Neira within 15-
20 minutes. The account records that, “the bay was quickly filled with water, and then just as
quickly emptied, such that for a time it appeared to be nothing but a narrow river.” After the sea
withdrew tsunami waves crashed into the islands for over 2 hours until three big waves arrived at
Zonnegat and Lonthor Sound. These waves achieved 8m run-up heights at Fort Belgica on
3.2 1852 Earthquake

12
Banda Neira (Figure 5A) and completely inundated the coastal plain of Lonthor. The north coast
of Banda Neira and south coast of Lonthor were not inundated. On Pulu Ai, tsunami waves were
< 1 m high.
Ambon bay, which is 200 km from the Banda Islands, was invaded by “a rising of water,
which was followed by a fast out flow” shortly after the quake (Figure 5B). The first five
tsunami waves reached a run-up height of 1.8 m and the process continued for over 6 hours.
Tsunami waves penetrated the Bay of Saparua four times one hour after the quake and, “reached
a height of 3 m above the highest high water level” and inundated 127 m inland. The tsunami
was also noted on Haruku, Nasalaut, Buru and Seram (Figure 5B; Table 2). The record also
states that no tsunami was observed at Surabaya and Labuha. Other notable effects from the
earthquake were landslides on Banda Neira, Saparua and southeast Haruku, and the birth of at
least three new islands in the Kei archipelago. No magmatic activity was observed throughout
Indonesia during the event.
A speculative earthquake epicenter south of the Banda Islands is estimated for the 1852 event
by applying the modified Mercalli intensity (MMI) to reports of various types of damage and
shaking intensities in the historical records. The MMI contours are poorly constrained to east of
the area, but likely stretch NE-SW from East Java to Halmahera (Figure 4). Although land-level
changes are common closest to the epicenter of gigantic earthquakes, the new islands that
appeared fit the description of mud volcanoes and may have formed at some distance from the
epicenter. For example, a Mw = 7.7 earthquake in Pakistan on 24 September of 2013 formed
new mud volcano islands nearly 400 km from the epicenter of the event (USGS, 2013).
3.3 Modified Mercalli Intensity Map

13
We estimate the distance of the epicenter from various places where the tsunami was
observed by using the tsunami propagation equation in the open ocean:
𝑉 = √𝑔𝐷 = 𝑑/𝑡
where 𝑉 is velocity of tsunami propagation, 𝑔 is gravitational force, 𝐷 is water depth, 𝑑 is
distance between the tsunami source and the location it arrives at, and 𝑡 is the tsunami arrival
time. According to the arrival times of the tsunami noted in the Banda Islands a reasonable
distance to the source of the tsunami is 300-450km. The only known source for such a large
event at this distance is the Tanimbar Trough, which marks the subduction boundary between the
eastern Banda Arc upper plate and the underthrust Australian passive continental margin. There
are many relatively small (magnitude < 6) instrumental events along this plate boundary
indicating that it is active. Fault plane solutions for these events also provide a way to
reconstruct likely fault parameters of a much larger event.
We used a series of numerical models to reconstruct the tsunami associated with the 1852
Banda earthquake. Constraints for the models, such as tsunami arrival times, run-up heights and
wave-forms, are taken from historic accounts. The models were constructed using GeoClaw
from Clawpack (Conservation laws Package), which is designed to solve two-dimensional,
depth-averaged, shallow water equations (Berger et al., 2011; LeVeque, 2013). It uses high-
resolution shock-capturing finite volume methods, allowing adaptive mesh refinement for
efficient solutions of large-scale geophysical problems. Clawpack is an open source program
provided through the University of Washington and is used by the United States National
Tsunami Hazard Mitigation Program for tsunami modeling. GeoClaw is appropriate for
modeling large-scale tsunamis generated from mega-thrust earthquakes propagating over a large
4. NUMERICAL MODEL

14
area. Input parameters are limited to generate fault plane solutions and basic bathymetry data.
Adaptive mesh-grid refinement is available for detailed inundation and run-up modeling.
Clawpack was also used to investigate slip distributions in the 2011 Tohoku and 1952
Kamchatka earthquakes (MacInnes et al., 2007; MacInnes et al., 2013).
Bathymetric and topographic data in the model is primarily extracted from Digital Elevation
Models, ETOPO and Global Multi-Resolution Topography (Amante and Eakins, 2009; Ryan et
al., 2009). Throughout our modeling, grid resolution ranged between 3″ and 1°. The resolution
of initial vertical deformation files is 3'. During the simulation waves propagate in the Banda Sea
at a resolution of between 1° and 30″. Grid refinements are applied at Ambon, Banda Island and
Saparua at a maximum of 30″ for bathymetry and 3″ for topography.
Fault parameter estimates for reconstructing the 1852 earthquake are taken from fault plane
solutions of small instrumental events recorded along the subduction interface in the Tanimbar
Trough region. Co-seismic re-bound of the subduction interface at a shallow dip angle (< 15
degree) and shallow depth (<15 km) is a common cause of mega-thrust earthquakes. Rupture
length estimates of the Tanimbar Trough are based on the length of the straightest, uninterrupted
segment, which is 540 km long and strikes from 190 to 220 degree. This segment is truncated to
the north by the Tiera Aiduna transcurrent fault and at its southern end bends sharply to the west
(Figure 1). Scaling relationships for the length and width of the rupture zone are taken from
empirical relationships compiled from various types of faults and sizes of earthquakes by Wells
4.1 Bathymetry / Topography
4.2 Fault Parameters and Vertical Seafloor Deformation

15
and Coppersmiths (1994; Table 3). Models with rupture along two different segments are also
used to better fit the small curvature of the Tanimbar Trough (Table 4).
Modeling deformation of the seafloor applied a variety of viable fault parameters after Okada
(1985). However, poor constraints for shallow water bathymetry for the places where the
tsunami was observed, and no data from near the likely epicenter of the 1852 earthquake,
requires application of general rules for tsunami wave amplification as it approaches the shore.
Generally, tsunami amplification follows the ‘Plafker Rule of Thumb’, which states that the
maximum tsunami run-up locally does not exceed twice the height of the deformed seafloor
(Synolakis & Okal 2005). Local observations where the ‘rule’ can be applied are lacking for the
1852 event. The highest waves observed at Banda Neira are 250-350 km away from the likely
rupture zone.
We investigate a range of amplification factors, or amplification errors specifically by testing
our model against the 2011 Tohoku earthquake and tsunami, which is a mega-thrust earthquake
of similar size to the 1852 event. Tsunami run-up heights for 2011 event were measured from
over 5000 locations with maximum run-up heights up to 38.5m (Mori et al., 2011).
A two-segment model of the Tohoko event was constructed using the Wells and
Coppersmiths’ empirical equation (Wells and Coppersmith, 1994; Table 5). Tsunami run-up
height measurements were divided into 20 groups, each corresponding to an open ocean gauge
and a close to shore gauge. Our simulation of the 2011 Tohoku event simulates tsunami heights
at these 42 ocean gauges. Amplification factors are identified as the measured on-shore tsunami
heights over the corresponding simulated tsunami heights in the ocean (Table 6).
4.3 Amplification Factor

16
According to our results, the amplification factor has a range from 0.0006 to 12.6 (Figure 6).
The mean is 2.44, while mode and median are 2.04 and 3.14 respectively. The standard deviation
in this dataset is 0.93. The amplification ratio mean lies between 2.34 and 2.54 at a confidence
level of 95%.
In our study, we assume that the mode amplification factor of 2.04, which has the highest
frequency in the sampling data, is the most like amplification factor for the observations at
Ambon and Saparua. We apply an amplification factor of 2.04 for our run-up heights at Ambon
(gauge 7) and Saparua Bay (gauge 12), and to estimates of minimum moment magnitude of the
1852 earthquake.
Using the fault parameters and tsunami amplification factors discussed above yields a
minimum moment magnitude of 8.4 if the maximum slip occurs along the north or middle (how
can there be a middle segment when there are only 1 or 2 segments?) segment of Tanimbar
Trough, and 8.6 if the maximum slip occurs along the south segment of Tanimbar Trough
(Figure 7).
Nine models of various fault parameters are tested (Figure 7; Table 3). Model 1 and Model 2
simulates a one-segment rupture at the most northern part and middle part of Tanimbar Tough.
Model 3 simulates a one-segment rupture at southernmost part of Tanimbar Tough extending to
the tip of Timor. Model 1, 2 and 3 are the basis to identify the possible location of maximum
slip. Model 4 is a modification of model 2 with a two-segment rupture including the bend at
Tanimbar Islands. Models 5 and 6 use the same rupture area as Model 4 with simple varying slip
5. ESTIMATES OF MOMENT MAGNITUDE

17
distributions. Models 7 and 8 are modifications of Model 1, with alternative slip distributions.
Model 9 simulates rupture of the entire Tanimbar Tough.
Model 5, with a maximum slip of 7m at Kei Islands, produces the best fit between predicted
and observed tsunami heights (Table 7). Compared to all nine models, Model 5 generates the
highest tsunami run-up at Ambon, Banda Neira and Saparua with the lowest possible moment
magnitude. Based on this model, a 1.6 m high tsunami wave arrives at Ambon an hour after the
quake and at a 2.7m wave arrives at Saparua 50 minutes after the quake (Figure 7).
The record for Banda Neira does not indicate the height of the initial wave that, ‘crashed in’ a
quarter of an hour after the earthquake. It does document a dramatic withdrawl after this wave,
which is predicted by Model 5. The sea had to have dropped by at least 5 meters in order to
empty out the bay as reported, whereas model 5 shows a withdrawl of 0.8 meter. It was not until
two hours after the earthquake that the largest waves reaching 8 m arrived at Banda Neira
(Wichmann, 1918). Commonly the largest tsunami waves recorded are not the first waves to
arrive (Atwater, 2005). However, existing tsunami models rarely predict these waves (Geist,
2010), and presently are only reliable for the first wave height and arrival times. Also, the
accuracy of run-up height predictions is only as good as the accuracy of the earthquake source
parameters and bathymetry used in the models (MacInnes et al., 2013; Arcas and Titov, 2006).
The lack of instrumental data associated with the 1852 earthquake requires that we use simple
rupture scenarios and fault zone parameters. The distribution of slip we use is limited to uniform
slip on two fault segments of equal size, which is likely an over simplification. The bathymetry is
also poorly resolved in the coastal areas where the observations were made.

18
We varied fault parameters in our models to try to explain the discrepancy between observed
and predicted wave heights at Banda Neira, which indicates that that the most sensitive
parameter is slip. Increasing the fault dip angle from 10 to 15 degrees and the length and width
of the rupture zone to the maximum possible values changes the wave height by < 10%.
Eastern Indonesia is consistently struck by earthquakes, tsunamis and explosive volcanic
eruptions. Records we have compiled provide accounts of destructive geophysical events dating
back to 1608. While the rate of earthquakes has remained about the same throughout that time,
the size of earthquakes since 1878 in eastern Indonesia has decreased. No shallow earthquake
greater than magnitude 8 or tsunami higher than 5m has occurred since 1852.
The 1852 earthquake was felt across eastern Indonesia and sourced a tsunami that spread
throughout the Banda Sea with run-up heights as up to 8 m. Our numerical reconstructions of
this event indicate the tsunami was likely caused by at least a Mw 8.4 earthquake along the
Tanimbar Trough. With strain rates as high as 70-110 mm/a enough elastic strain energy has
already accumulated along the many plate boundary segments in the region to produce another
mega-thrust earthquake and tsunami. Since the 1852 earthquake at least 12-17 m of elastic strain
has accumulated along the Tanimbar Trough alone. The next 1852-like earthquake will affect a
very different Indonesia than in the past, one with 10 times more people mostly crowded into
urban centers.
6. CONCLUSION

19
Amante, C. and B. W. Eakins, ETOPO1 1 Arc-Minute Global Relief Model: Procedures, Data
Sources and Analysis. NOAA Technical Memorandum NESDIS NGDC-24, 19 pp,
March 2009.
Arcas, D., & Titov, V. (2006). Sumatra tsunami; lessons from modeling. Surveys in
Geophysics, 27(6), 679-705. doi:http://dx.doi.org/10.1007/s10712-006-9012-5
Atwater, Brain F., V., Marco Cisternas, Bourgeois, Joanne, Dudley, Walter C., Hendley II,
James W., Stauffer, Peter H. (2005). Surviving a Tsunami – Lessons from Chile, Hawaii
and Japan. USGS. Retrieved from
http://www.tsunamiready.noaa.gov/resources/USGSCircular_1187_rev2005_small.pdf
Berger, M. J., George, D. L., LeVeque, R. J., & Mandli, K. T. (2011). The GeoClaw software for
depth-averaged flows with adaptive refinement. Advances in Water Resources, 34(9),
1195-1206. doi: http://dx.doi.org/10.1016/j.advwatres.2011.02.016
Geist, Eric (2010). The Chilean Tsunami and Uncertainty in Tsunami Modeling. Sound Waves,
USGS. Retrieved from http://soundwaves.usgs.gov/2010/04/research2.html
Harris, R.A., 1991. Temporal distribution of strain in the active Banda orogen: a reconciliation
of rival hypotheses, in Orogenesis in Action, (eds. R. Hall, G. Nichols, and C. Rangin),
Spec. V. Journal of Asian Earth Sci., V. 6, N0. 3/4, p. 373-386.
Harris, R.A., 2011, The Nature of the Banda Arc–Continent Collision in the Timor Region, Arc-
Continent Collision, Springer Berlin Heidelberg, p. 163-211.
7. REFERENCES

20
Harris, R.A. and Major, J., in press, Waves of Destruction in the East Indies: The Wichmann
Catalog of Earthquakes and Tsunami in the Indonesian Region from 1538 to 1877, Geol.
Soc. London, Spec. Paper on Geological Hazards in Indonesia. Hidayat, D., Barker, J. S.,
& Satake, K. (1994). Modeling the seismic source and tsunami generation of the
december 12, 1992 flores island, indonesia, earthquake. Seismological Research
Letters, 65(1), 24. Retrieved from
http://search.proquest.com/docview/50112676?accountid=4488
Kelleher, J. A.Possible criteria for predicting earthquake locations and their application to major
plate boundaries of the pacific and the caribbean. (Doctoral, Possible Criteria for
Predicting Earthquake Locations and their Application to Major Plate Boundaries of the
Pacific and the Caribbean, . (52229483; 1977-007771)
Hamzah, L., Puspito, N. T., & Imamura, F. (2000). Tsunami catalog and zones in
indonesia. Journal of Natural Disaster Science,22(1), 25-43. Retrieved from
http://search.proquest.com/docview/51167018?accountid=4488
Liu, Z., Harris, R.A. (2012). Discovery of Possible Mega-Thrust Earthquake along the Seram
Trough from Records of 1629 Tsunami in Eastern Indonesian Region. Submitted to
Natural Hazard- SI Extreme Geohazards.
LeVeque, R. J. Berger, M. J. et. al., Clawpack Software 4.6.3, www.clawpack.org, <Mar 26,
2013>.
MacInnes, B., Weiss, R., Bourgeois, J., & Pinegina, T. (2007). Earthquake slip distribution from
tsunami deposits and tsunami simulations; the 1952 kamchatka event. Abstracts with

21
Programs - Geological Society of America, 39(6), 158. Retrieved from
http://search.proquest.com/docview/50524896?accountid=4488
MacInnes, B. T., Gusman, A. R., LeVeque, R. J., & Tanioka, Y. (2013). Comparison of
earthquake source models for the 2011 tohoku event using tsunami simulations and near-
field observations. Bulletin of the Seismological Society of America,103(2), 1256-1274.
doi:http://dx.doi.org/10.1785/0120120121
Mori, N., Takahashi, T., Yasuda, T., & Yanagisawa, H. (2011). Survey of 2011 tohoku
earthquake tsunami inundation and run-up.Geophysical Research Letters, 38(8), 0-
Citation L00G14. doi:http://dx.doi.org/10.1029/2011GL049210
Newcomb, K. R., & McCann, W. R. (1987). Seismic history and seismotectonics of the sunda
arc. Journal of Geophysical Research, 92, 421-439. doi:
http://dx.doi.org/10.1029/JB092iB01p00421
Nugroho, H., Harris, R., Lestariya, A. W., & Maruf, B. (2009). Plate boundary reorganization in
the active banda arc-continent collision: Insights from new GPS measurements.
Tectonophysics, 479(1-2), 52-65. doi: http://dx.doi.org/10.1016/j.tecto.2009.01.026
Okada, Y. (1985). Surface deformation due to shear and tensile faults in a half-space. Bulletin of
the Seismological Society of America, 75(4), 1135-1154. Retrieved from
http://search.proquest.com/docview/51292948?accountid=4488
Rangin, C., Le Pichon, X., Mazzotti, S., Pubellier, M., Chamot-Rooke, N., Aurelio, M., . . .
Quebral, R. (1999). Plate convergence measured by GPS across the Sundaland/Philippine

22
sea plate deformed boundary; the philippines and eastern indonesia.Geophysical Journal
International, 139(2), 296-316. Retrieved from
http://search.proquest.com/docview/52425886?accountid=4488
Ryan, W.B.F., S.M. Carbotte, J.O. Coplan, S. O'Hara, A. Melkonian, R. Arko, R.A. Weissel, V.
Ferrini, A. Goodwillie, F. Nitsche, J. Bonczkowski, and R. Zemsky (2009), Global Multi-
Resolution Topography synthesis, Geochem. Geophys. Geosyst., 10, Q03014,
doi: 10.1029/2008GC002332
Synolakis, C. E., & Okal, E. A. (2005). 1992-2002; perspective on a decade of post-tsunami
surveys. Advances in Natural and Technological Hazards Research, 23, 1-29. Retrieved
from http://search.proquest.com/docview/51615007?accountid=4488
Wells, D. L., & Coppersmith, K. J. (1994). New empirical relationships among magnitude,
rupture length, rupture width, rupture area, and surface displacement. Bulletin of the
Seismological Society of America, 84(4), 974-1002. Retrieved from
http://search.proquest.com/docview/50214476?accountid=4488
Wichmann, A. (1918). Die erdbeben des Indischen Archipels bis zum Jahre 1857 (Earthquakes
of the Indian Archipelago Until the Year 1857), in Afdeling Natuurkunde Nederlandse
Verhandelingen, 20 (1918): 193p.

23
Figure 1. Digital elevation model and Tectonic features of Eastern Indonesia. Red Triangles represent active volcanoes and black lines indicate major active faults along plate boundary segments. Plate motions are relative to the Asian Plate.

24
Figure 2. Major historical earthquakes (red), number of all historical earthquakes (black) and number of tsunamis (blue) in Maluku Region from 1600-1877 in Wichmann Catalog. Major earthquakes shake for > 2 minutes, damage well-constructed buildings, are felt across the Banda Sea are followed by over 8 days of aftershocks.

25
Figure 3. Major earthquakes (red), number of destructive earthquakes (black), and number of destructive tsunamis (blue) in Maluku Sea region from 1600-2014. Records are compiled from catalogs by Wichmann (1815), Latief (2000), Sololief () and BMG of Indonesia (2012). Blue numbers indicate the recorded run-up heights on Banda Islands in the 1629 and 1852 earthquakes.

26
Figure 4. Reconstructed modified Mercalli scale intensity map of the 1852 earthquake according to descriptions in the Wichmann Catalog. New islands created during the event are represented by red box (use ‘new islands’ label with an arrow pointing to location). Dashed rectangle is the most likely rapture zone.

27
A

28
B
Figure 5. A) Map of Banda Islands and Pulu Ai (see Figure 1). Observed run-up heights in 1852 earthquake according to the Wichmann Catalog are indicated by blue rectangles. Blue “X” represents no tsunami observation in the area. Locations of tidal gauges (gauge 1, 2 and 5) are indicated by black squares. B) Map of Uliassera islands (see Figure 1). Observed run-up heights (blue rectangles) from 1852 tsunami according to Wichmann Catalog. Other locations mentioned in the catalog with no observed tsunami are shown as open boxes. Locations of tidal gauges (gauge 6-19) are indicated as black squares.

29
Figure 6. Distribution of amplification factors from the modeling of 2011 Tohoku earthquake.

30
Figure 7. Various fault rupture models. M1 to M9 shows the fault parameters simulated in Model 1 to 9 respectively (Table 4).

31
Figure 8. Computed tide gauge records and tsunami waveform for Banda Neira, Ambon city and Saparua bay stations from Model 5.

32
YEAR MONTH DAY Latitude Longitude Magnitude (Mo)
Depth (km)
OBSERVED AREA Source
1629 8 1 - - - - Ambon, Banda Islands WM, LT, K
1630 - - - - - - Banda Islands LT
1644 5 12 - - - - Ambon WM
1644 5 17 - - - - Ambon, Haruku, Seram WM
1648 2 29 - - - - Ambon WM, LT, K
1649 - - - - - - Kei Islands WM
1659 12 - - - - Ambon, Buru, others WM,K
1671 10 17 - - - - Ambon, Haruku, Saparua
WM
1674 5 6 Ambon, Hitu LT
1675 2 17 - - - - Ambon, Uliassera WM, LT, K
1687 2 19 - - - - Ambon WM
1705 10 - - - - - Ambon WM
1708 11 28 - - - - Ambon WM
1710 3 6 - - - - Banda Islands WM, LT, K
1711 9 5 - - - - Ambon, Banda Islands, Haruku
WM, K
1743 - - - - - - Banda Islands WM
1750 5 10 - - - - Banda Islands WM
1754 8 18 - - - - Ambon, Uliassera WM, K
1763 9 12 - - - - Banda Islands, Pulu Ai WM, K
1775 4 19 - - - - Ambon WM, K
1777 3 30 - - - - Ambon WM, K
1802 8 25 - - - - Ambon, Banda Islands WM, LT, K
1814 - - - - - - Banda Islands, Kiser LT
1815 4 11 - - - - Ambon, Banda Islands WM, K
1816 4 11 - - - - Banda WM
1830 3 28 - - - - Ambon GP
1830 3 28 - - - - Ambon WM, LT
1835 11 1 - - - - Ambon, Banda Islands, Saparua
WM, GP
1836 9 16 - - - - Ambon WM
1837 1 21 - - - - Haruku, Nusalaut, Saparua
GP
1841 11 26 - - - - Banda Islands LT
1841 12 16 - - - - Ambon GP
1845 6 22 - - - - Ambon WM
1849 5 28 - - - - Ambon, Saparua WM
1851 11 20 - - - - Ambon, all WM

33
1852 11 26 - - - - Banda Islands, Uiassera WM, LT, K, GP
1854 12 - - - - - Banda Islands WM
1857 4 6 - - - - Banda Islands, Pulu Ai, Rosengain
WM
1857 5 13 - - - - Banda Sea, Timor, Dili LT
1858 11 9 - - - - Ambon LT, GP
1859 9 25 - - - - Banda Islands LT
1862 9 15 - - - - Banda Islands LT, GP
1862 10 15 - - - - Ambon; Banda Islands WM
1864 9 14 - - - - Banda Islands WM
1865 9 9 - - - - Banda Islands WM
1873 11 4 - - - - Ambon, Seram WM
1876 5 28 - - - - Ambon, Buru, Seram WM, LT, GP
1876 7 12 - - - - Ambon WM
1877 6 6 - - - - Banda Islands, Ambon WM
1882 10 10 - - - - Banda Islands K
1890 11 23 - - - - Banda Islands LT, GP
1891 6 20 - - - - Ambon, Banda Islands, Saparua
K
1898 1 17 - - - - Ambon LT, GP
1899 9 30 - - - - Seram K
1903 2 14 - - - - Banda Islands LT, GP
1920 5 10 - - - - Ambon, Banda Islands, Saumlaki
LT, GP
1932 9 9 -3.5 128.3 - - Seram, Tolehubay LT, GP
1938 2 1 - - - - Banda Islands, Banda Sea
LT
1938 2 2 -5 131.5 8.5 33 Banda Islands, Kei Islands
GP
1950 10 8 - - - - Ambon, Seram K
1975 1 15 -5 130 5.9 normal Banda Islands LT, GP
1980 8 17 -3.77 128.24 5.4 24 Ambon LT, GP
1982 3 12 - - - - Ambon LT
1983 3 12 -4.06 127.92 6.9 17 Ambon, Seram GP
1983 3 12 -4.04 127.89 5.8 33 Ambon LT, GP
1987 7 17 -5.58 130.79 6.8 67 Ambon, Banda Islands GP
1995 12 25 -6.903 129.151 7 142 Ambon, Saumlaki, Sorong
GP
1998 2 19 -4.476 129.082 6.5 33 Ambon GP
1998 11 9 -6.954 129.022 6.5 33 Ambon, Darwin GP
1998 11 9 -6.92 128.946 7 33 Ambon, Darwin GP
2000 8 28 -4.11 127.394 6.6 16 Ambon GP
2001 3 19 -4.03 128.02 6.5 33 Ambon GP
2004 1 28 -3.01 127.44 6.8 33 Ambon, Buru GP
34
2005 3 2 -6.527 129.933 7.1 202 Ambon, Darwin, Sumba, Sorong
GP
2006 1 27 -4.8 127.8 7.4 33 Ambon, Dili, Darwin, Makassar, Sorong
GP
2006 3 14 -3.7 127.4 6.4 33 Ambon, Buru GP
2009 10 24 -6.18 130.51 7.2 156 Ambon, Serui, Soroon GP
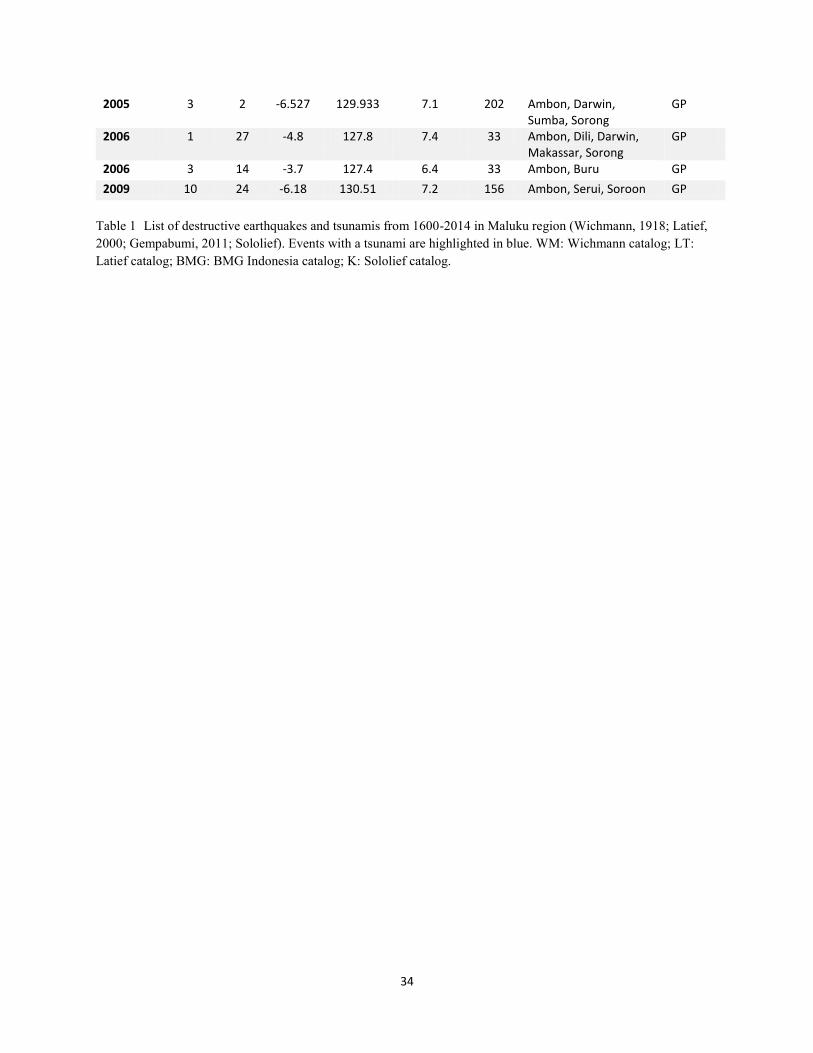
Table 1 List of destructive earthquakes and tsunamis from 1600-2014 in Maluku region (Wichmann, 1918; Latief, 2000; Gempabumi, 2011; Sololief). Events with a tsunami are highlighted in blue. WM: Wichmann catalog; LT: Latief catalog; BMG: BMG Indonesia catalog; K: Sololief catalog.

35
Region Locations Modified Mercalli Intensity
Original Historical Descriptions
Surabaya Semarang II “6.45am. A weak shock. Direction NW-SE. In Semarang, as well as in Pasuruan a weak shock was likewise felt. Danau Klinungan, as known as the Lake of Grati, in the district of Grati, Bureau and Locality of Pasuruan, was set in motion. Finally, a weak shock was observed also in Surnenep/Sumenep on the island of Madura.”
Pasuruan II
Lake of Grati III
Sumenep III
Labuha Labuha V “4.30, 7, 10, 10.30am and 6.30pm. Labuha, Island of Batjan. Each time a shtrong shock; the most powerful among them occurred on the days from the 25th- 28th. The flag pole and the trees swayed to and fro. A flood wave was not seen.”
Banda Islands
Banda Neira, Lonthor
IX
“7.50am. Powerful vertical shocks that, waxing in strength, soon transformed into a motion directed NW-SE, of 5 minute duration. Already at the first shock, the majority of the residences on Banda Neira were transformed to a rubble heap, but even those that reminded standing had become uninhabitable due to the numerous cracks. A part of Papenberg, upon which the signal station was located, fell away. All along the beach numerous fissures formed. Similar devastations were caused on Lonthor [Banda Major] as well. Barely had the ground been clam for a quarter of an hour when a flood wave crashed in. The bay was quickly filled with water, and then just as quickly emptied, such that for a time it appeared to be nothing but a narrow river. At 10 o’clock the tides increased in force and Banda Neira and Lonthor were thrice poured upon by breakers that had originated im Zonnegat and in the Lonthor Sound. The reached the hill upon which Fort Belgica is built on Banda Neira, and on Lonthor, the foot of the mountains. The difference between the highest and the lowest water level was 26 rh. Feet [8.16m]. On the north coast of Banda Neira, as well as on the south coast of Lonthor, no disturbances of the sea level were manifest. During the quake, a cannonade-like rumble was heard. In the course of the day, 9 further shocks occurred on Banda Neira, of which the first and the fifth were rather powerful.”
Rosengain IX “On the islands of Rosengain and Pulu Ai, the quake was also forcefully manifest. On the latter, the flood wave reached only a few feet above the usual water level. Gunung Api, which forms an island of the same name, did not show the slightest manifestation of volcanic activity.”
Pulu Ai IX
Ambon Ambon, Hila, Larike
IX “7.30am Violent, wave-formed quake. Duration 5 minutes. Direction ENE-WSW. Shortly after there came a rising of the water in the bay, which was followed by a fast out flow. The process repeated some twenty times until 2 o’clock in the afternoon. During the first 5 times, the sea (the low water level) climbed to 1.8m, a height that exceeded the highest high water level by 20 cm. The earthquake and seaquake were also observed in Hila and Larike, but without causing any damages there. ”

36
Saparua Saparua Bay, Tijau, Hatuana, Porto, Kulor, SiriSori, Boi
VII “7.30am. After the earthquake, a flood wave penetrated into the bay of Saparua four times between 8:30 and 11 a, and reached a height of 3 m above the highest high water level. In the environs of the localities Saparua and Tijau, it thrust itself 405 rh. Feet [127.11m) inland. Beginning at 11 in the morning and until the late evening hours, the high and low tide motions continued n turns, though in lesser amounts. On the northeast side, that of the beach area of Hatuana, as also at Porto on the west coast, at Kulor on the north coast, at the two villages of Siri-Sori that lie on the Bay of Saparua, only a week flood wave was observed. In Boi, located on the same bay, a cannonade-like rumble coming from the SE was heard.”
Haruku Aborn, Hulaliu, Oma, Wasu
VI “7.30pm. As a result of the vibrations, the walls of the Church of Aborn and the fort Zeelandia were cracked. A flood wave bear the localities Hulaliu, Oma, and Wasu was perceived; in the last-named village was at the same time a cannonade-like rumble.
Nasalaut Amet, Akoon, Leinitu
VI On the island of Nusalaut the earthquake had also been palpable and instances of flooding were noted at Amet, Akoon and Leinitu.
Buru V “From the island of Buru was reported merely the fact that an earthquake accompanied by a flood wave had occurred, but without having caused damages.”
Ceram Amabai, Wahai
VII “These phenomena manifest themselves in a violent manner on the island of Ceram, at least at the localities of Amabai and Wahai.”
Ternate II “8 am. Two shocks in quick succession.”
Kei Islands “In the vicinity of the island of Ut(5 35’S, 132 59.5’E), Kei lands. According to statements by the natives, islets had arisen as a result of the quake. It was shown through an investigation undertaken by Leut.a. See OUDRAAT on 15 May 1854, that one was almost circular and had a diameter of 250m. It consisted of clay and on the surface were found several stones and fragments of rioc ore and Manganerz with iron content.” “As R.D.M. VERBEEK visited the first mentioned island in 1899, its Durchmesser was then no more than circa 50m. It was at the time high tide, and at low tide rose circa .25m above the sea level.”
Table 2 Historical Observations with assigned Mercalli scales (Wichmann, 1918).

37
Mw = (5.08±0.10) + (1.16±0.07)*log (surface rupture length) Mw = (4.33±0.12) + (0.90±0.05)*log (rupture area) Table 3 Wells and Coppersmiths equations (1994).

38
Model Length (km) Width (km) Strike (degree) Dip (degree) Rake (degree) Slip (m)
1 270 80 190 15 90 7
2 270 80 200 15 90 8
3 270 80 220 15 90 12
4 270 80 190, 220 15 90 7
5 270 80 190, 220 15 90 7, 5
6 270 80 190, 220 15 90 6, 8
7 270 80 190 15 90 8, 6
8 270 80 190 15 90 6, 8
9 540 80 190, 220 15 90 12 Table 4 Fault Parameters used in Clawpack modeling.

39
Length (km) Width (km) Strike (degree) Dip (degree) Rake (degree) Slip (m)
270 120 190 15 90 30
270 120 210 15 90 30 Table 5 Two-fault model for 2011 Tohoku earthquake calculated from Wells and Coppersmiths’ empirical equation (1994).

40
Latitude of Survey locations
number of survey data
Close to shore gauge Open Ocean Gauge
Latitude Longitude Depth (m)
simulated tsunami height (m)
Latitude Longitude Depth (m)
simulated tsunami
height (m) 33.75-34.25 28 34 139.6 -810 0.9 34 141 -4003 0.8
34.25-34.75 11 34.5 139.5 -104 1.1 34.5 141 -5919 0.8
34.75-35.25 31 35 140.05 -77 2.4 35 141.5 -4540 1.3
35.25-35.75 104 35.5 140.5 -20 1.2 35.5 142 -4757 2.2
35.75-36.25 43 36 140.7 -25 2.2 36 142 -3186 6.0
36.25-36.75 125 36.5 140.65 -20 3.6 36.5 142.5 -4377 7.0
36.75-37.25 224 37 141 -40 6.0 37 142.5 -2888 5.0
37.25-37.75 16 37.5 141.2 -63 5.1 37.5 143 -3303 6.3
37.75-38.25 783 38 141 -31 3.0 38 143.5 -4349 9.3
38.25-38.75 1245 38.5 141.7 -154 5.0 38.5 143.5 -2839 6.6
38.75-39.25 916 39 141.9 -122 7.0 39 143.5 -2629 6.1
39.25-39.75 665 39.5 142.2 -286 6.0 39.5 143.5 -2836 6.0
39.75-40.25 347 40 142 -106 4.5 40 143.5 -1780 4.2
40.25-40.75 314 40.5 141.8 -88 1.4 40.5 144 -4246 2.1
40.75-41.25 28 41 141.5 -373 1.6 41 144 -4089 1.5
41.25-41.75 14 41.5 141.55 -101 1.2 41.5 145 -5523 0.8
41.75-42.25 109 42 143.4 -79 1.8 42 146 -5439 0.7
42.25-42.75 126 42.5 143.5 -16 1.4 42.5 147 -5613 0.6
42.75-43.25 48 43 145.15 -38 1.1 43 148 -7196 0.5
43.25-43.75 20 43.5 146.5 -74 1.0 43.5 148.5 -5728 0.4 Table 6 Gauge locations in simulation of 2011 Tohoku Earthquake using Clawpack.

41
Station Location Latitude
(degree S) Longitude (degree E)
Observed run-up heights (m)
Predicted tsunami heights from Model 5 with amplification factor of 2.04 (m)
1 Banda Neira: Fort Belgica -4.5320 129.8970 8.2 1.2 2 Lonthor: foot of mountains -4.5440 129.9080 8.2 1.3 3 Banda Neira: N coast -4.5066 129.8930 0 0.3 4 Lonthor: S coast -4.5601 129.8983 0 0.8 5 Pulu Ai -4.5162 129.7744 <1 0.5 6 Ambon: Ambon City -3.6900 128.1750 1.8 1.8 7 Ambon: Hila -3.7550 127.9250 <1 0.3 8 Ambon: Larike -3.5800 128.0000 <1 0.5 9 Saparua: SiriSori -3.6065 128.7060 <2 1.4 10 Saparua: Tijau/ Saparua Bay -3.5850 128.6650 3 3.0 11 Saparua: NE: Hatuana -3.5850 128.6907 <2 1.0 12 Saparua: W: Porto -3.4943 128.6200 <2 1.5 13 Saparua: N: Kulor -3.5030 128.5600 <2 2.0 14 Haruku: Hulaliu (NE) -3.5550 128.6000 <2 3.3 15 Haruku: Oma (S) -3.6500 128.4420 <2 0.6 16 Haruku: Wasu -3.6300 128.4930 <2 0.8 17 Nasalaut: Amet (N) -3.6453 128.8100 <2 1.2 18 Nasalaut: Akoon (SE) -3.6750 128.8200 <2 0.7 19 Nasalaut: Leinitu (NW) -3.6550 128.7500 <2 0.7 Table 7 Tsunami observations and tidal gauges in 1852 Earthquake.