the 17 annual newfoundland electrical and computer
TRANSCRIPT

Quidi Vidi LakeHydro Power Demonstration Project
Presented byEugene G. Manning, B. EngCandidate for Master of Engineering - CivilWorking withStephen E. Bruneau, PhD, P.EngProfessor, Civil Engineering
The 17th Annual Newfoundland Electrical and Computer Engineering Conference
Thursday, Nov. 8, 2007

Concept DescriptionA series of working and well displayed renewable energy generation sources on an urban walking trail
Comprised of a micro hydro generator a wind turbine and a solar array, metered and interpreted
This presentation describes the preliminary work on the micro hydro component of the installation
Primary attention paid to civil works, business and education plan
Page 1 of 15

Purpose of Proposed ProjectRaise public awareness of power generation options and consequences in light of heightened sensitivity to climate change
Display the potency of various renewable generation sources and describe the environmental impacts, new and offsetting
Demonstrate the potential for viable small scale initiatives in urban settings and in piggybacking on new or old infrastructure
Demonstrate synergistic approach to habitat renewal and improvement as part of a power generation project
Page 1 of 15

Concept BackgroundProponent has had commercial Non-Utility-Generation (NUG) interests over the previous decade, with niche interests in using existing infrastructure for low impact micro hydro generation.
Insurmountable Roadblocks: hydro power “moratorium”, lack of experience and will on behalf of utilities and regulators, no clear policy or initiatives to encourage green power in this Province.
There remains a need for public awareness and education so that informed choices can be made going forward.
In 2005 a water control structure failure at Quidi Vidi, prompted the idea for this demonstration project.
Page 1 of 15

Approximate watershed is 32 sq kms
(crosses over with City water supply, storm and
sewage systems)
Location of Quidi Vidi Site
City of St. John’s Aerial Photo Site

Quidi Vidi Aerial Photo
Grand Concourse Q.V. Trail
Location of Quidi Vidi
Project Site
Site

INDEXa Quidi Vidi Gutb Control structurec Bridged Quidi Vidi Lakee Quidi Vidi Riverf Stage areag Access roadh QV Village roadj Fish ladder
SiteIndex

Site PhotosControl Structure

Site PhotosRiver

Site PhotosLake/Flood

Project Boundaries
Project Boundaries

New Control Structure
As per CSJ
Hydro Penstock
New Fish Ladder
Fish Ladder Inlet
Fish Ladder Outlet
Hydro Turbine
Infrastructure Overview

Approximated Hydrology –Watershed Output and Lake Storage
Numbers from Acres, 1989
Figure from Natural Resources
Mean Runoff = 1.4 cms
*
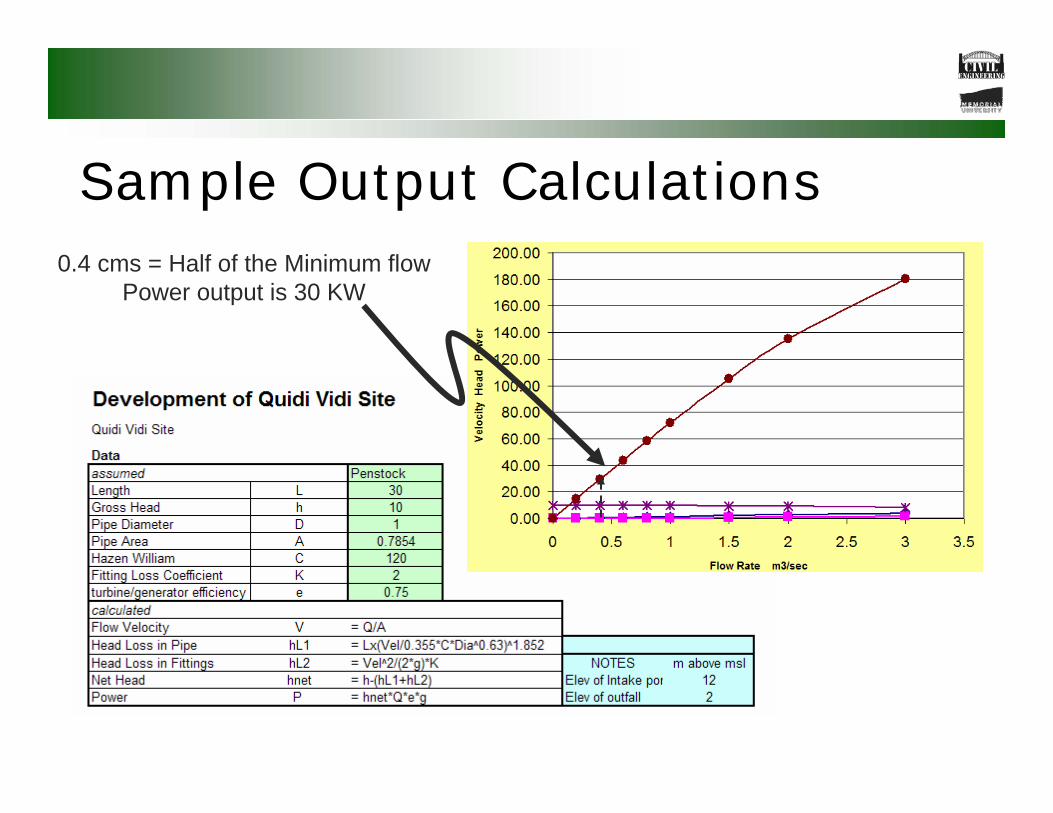
Sample Output Calculations0.4 cms = Half of the Minimum flow
Power output is 30 KW

Sample EconomicsHalf of Annual Mean Flow = 0.7 cmsPower output at 0.7 cms = 50 KW
ECONO Plant Capacity KW 50DATA Plant Capex CAD 150,000$
Plant Opex at 10% Revenue 15,000$ Energy Price / kWH 0.090$ Plant Capacity Factor 0.95Hours per year (capfac*hrs/yr) 8322Revenue CAD 37,449.00$ Interest rate NPV factor 7%
Year CAPEX OPEX Revenue Balance Cumulative Balance
2008 150,000$ 15,000$ 37,449$ (127,551)$ (127,551)$ 2009 -$ 15,000$ 37,449$ 22,449$ (105,102)$ 2010 -$ 15,000$ 37,449$ 22,449$ (82,653)$ 2011 -$ 15,000$ 37,449$ 22,449$ (60,204)$ 2012 -$ 15,000$ 37,449$ 22,449$ (37,755)$ 2013 -$ 15,000$ 37,449$ 22,449$ (15,306)$ 2014 -$ 15,000$ 37,449$ 22,449$ 7,143$ 2015 -$ 15,000$ 37,449$ 22,449$ 29,592$ 2016 -$ 15,000$ 37,449$ 22,449$ 52,041$ 2017 -$ 15,000$ 37,449$ 22,449$ 74,490$ 2018 -$ 15,000$ 37,449$ 22,449$ 96,939$ 2019 -$ 15,000$ 37,449$ 22,449$ 119,388$ 2020 -$ 15,000$ 37,449$ 22,449$ 141,837$ 2021 -$ 15,000$ 37,449$ 22,449$ 164,286$ 2022 -$ 15,000$ 37,449$ 22,449$ 186,735$ 2023 -$ 15,000$ 37,449$ 22,449$ 209,184$ 2024 -$ 15,000$ 37,449$ 22,449$ 231,633$ 2025 -$ 15,000$ 37,449$ 22,449$ 254,082$
150000 270000 674082 254082 16% irr$234,998.53 npv

T = Turbine IG = Induction Generator Mg.Ctt = Magnetic Contactor MCCB = Molded Circuit Breaker
Basic Grid Intertie, Conceptual ViewBased on Toshiba E-Kids* Units

GENERIC POWER HOUSE SKETCH
TURBINE AND GENERATOR SECTION
Power House, Generation UnitBased on Toshiba E-Kids* Units

Sample Equipment SpecificationsBased on Toshiba E-Kids* Units

Environmental Impact –Displaced CO2
Approximate Tons of Average Annual QV Output Hours per year Annual Energy Output Tons of CO2 DisplacedCO2 per MWhr MW hr MWhr tons
0.975 0.05 8760 438 427
Note also: tons
21 tonnes CO2 = 1 tonne CH4 20310 tonnes CO2 = 1 tonne N2O therefore 1

Quidi Vidi LakeHydro Power Demonstration Project
Stephen Bruneau, PhD, P.Eng