the 14n(p,α) reaction using a ge pettrace cyclotron
TRANSCRIPT

Air Force Institute of TechnologyAFIT Scholar
Theses and Dissertations Student Graduate Works
3-22-2019
Development of a Model for 11C Production viathe 14N(p,α) Reaction Using a GE PettraceCyclotronAmy C. Hall
Follow this and additional works at: https://scholar.afit.edu/etd
Part of the Atomic, Molecular and Optical Physics Commons, and the Plasma and Beam PhysicsCommons
This Thesis is brought to you for free and open access by the Student Graduate Works at AFIT Scholar. It has been accepted for inclusion in Theses andDissertations by an authorized administrator of AFIT Scholar. For more information, please contact [email protected].
Recommended CitationHall, Amy C., "Development of a Model for 11C Production via the 14N(p,α) Reaction Using a GE Pettrace Cyclotron" (2019). Thesesand Dissertations. 2201.https://scholar.afit.edu/etd/2201

DEVELOPMENT OF A MODEL FOR 11C PRODUCTION VIA THE 14N(p,α) REACTION USING A GE PETTRACE CYCLOTRON
THESIS
Amy C. Hall, Captain, USAF
AFIT-ENP-MS-19-M-080
DEPARTMENT OF THE AIR FORCE AIR UNIVERSITY
AIR FORCE INSTITUTE OF TECHNOLOGY
Wright-Patterson Air Force Base, Ohio
DISTRIBUTION STATEMENT A. APPROVED FOR PUBLIC RELEASE; DISTRIBUTION UNLIMITED.

The views expressed in this thesis are those of the author and do not reflect the official policy or position of the United States Air Force, Department of Defense, or the United States Government. This material is declared a work of the U.S. Government and is not subject to copyright protection in the United States.

AFIT-ENP-MS-19-M-080
DEVELOPMENT OF A MODEL FOR 11C PRODUCTION VIA THE 14N(p,α) REACTION USING A GE PETTRACE CYCLOTRON
THESIS
Presented to the Faculty
Department of Physics
Graduate School of Engineering and Management
Air Force Institute of Technology
Air University
Air Education and Training Command
In Partial Fulfillment of the Requirements for the
Degree of Master of Science in Nuclear Engineering
Amy C. Hall, BS
Captain, USAF
March 2019
DISTRIBUTION STATEMENT A. APPROVED FOR PUBLIC RELEASE; DISTRIBUTION UNLIMITED.

AFIT-ENP-MS-19-M-080
DEVELOPMENT OF A MODEL FOR 11C PRODUCTION VIA THE 14N(p,α) REACTION USING A GE PETTRACE CYCLOTRON
Amy C. Hall, BS
Captain, USAF
Committee Membership:
Capt. J. E. Bevins Chair
Dr. A. A. Bickley Member
Dr. R. Ferrieri Member
Dr. J. W. McClory Member
iv
AFIT-ENP-MS-19-M-080
Abstract
The GE PETtrace 800 Series cyclotron at the Missouri University Research Reactor
(MURR) facility is used extensively for medical and research radioisotope production.
However, no model exists of its radioisotope production performance, and the energy, full
intensity, and spatial profile of the cyclotron proton beam has never been measured. To
improve production planning for research and medical isotopes, a MCNP6 model of the
isotope production process was developed to maximize efficiency in target design and
better understand irradiation conditions. Since the cyclotron beam energy and profile has
a significant impact on the types of reactions that take place and the efficiency of
radioisotope production, the MURR cyclotron proton beam energy was measured via
activation of a high-purity copper foil stack. Phosphor plate imaging was used to
radiographically image the foil stacks in order to characterize the beam’s spatial and
intensity profile. The measured beam characteristics were used to define the source for a
MCNP6 model of the production of 11C, an important research radioisotope used for
medical and plant research. The model was compared to experimental 11C production data
obtained using ion chamber measurements of 11C production cycles at varying beam
currents. Finally, the 11C production target model was used to analyze inefficiencies present
in the current design and operating characteristics.

v
To My Husband, Mom, Dad, and Sister

vi
Acknowledgments
I would like to express my sincerest appreciation to my thesis advisor, Captain Bevins.
This effort would not have been possible without his guidance and support. I would, also,
like to sincerely thank my committee, Dr. Bickley, Dr. Ferrieri, and Dr. McClory for their
expertise and support throughout the course this research. Finally, I would like to thank
Dr. Brockman, Dr. Schueller and Dr. Wilder for their technical expertise and assistance
during my experimental work and analysis.
Amy C. Hall
vii
Table of Contents
Page
Abstract .............................................................................................................................. iv
Table of Contents .............................................................................................................. vii
List of Figures .................................................................................................................... ix
List of Tables ..................................................................................................................... xi
I. Introduction .....................................................................................................................1
1.1 Motivation ..............................................................................................................1
1.2 Background.............................................................................................................2
1.3 Problem Statement..................................................................................................4
1.4 Methodology...........................................................................................................4
1.5 Assumptions and Limitations .................................................................................5
II. Literature Review ............................................................................................................8
2.1 MURR Radioisotope Production ............................................................................9
2.2 Nuclear Reactions .................................................................................................14
2.3 Nuclear Data .........................................................................................................15
2.4 Stacked Foil Technique ........................................................................................18
2.5 Foil Activation Analysis .......................................................................................19
2.6 Radiography .........................................................................................................20
2.7 Ion Chambers........................................................................................................21
2.8 Gas Density Reduction .........................................................................................21
2.9 Summary...............................................................................................................22
III. Simulation and Experimental Methodologies ..............................................................23
3.1 Proton Beam Characterization ..............................................................................23

viii
3.2 11C Production Simulation ....................................................................................27
3.3 Ion Chamber Measurements .................................................................................28
3.4 11C Production Target Optimization .....................................................................29
3.5 Statistical Tests .....................................................................................................30
IV. Analysis and Results ....................................................................................................31
4.1 Proton Beam Energy Measurement Results .........................................................31
4.2 11C Production Simulation in MCNP6 Results ....................................................40
4.3 Ion Chamber and Experimental Validation Results .............................................42
4.4 11C Production Target Optimization Results ........................................................47
V. Conclusions ..................................................................................................................50
5.1 Summary...............................................................................................................50
5.2 Simulation Capabilities and Limitations ..............................................................50
5.3 Recommendations for Future Research................................................................51
Appendix A: MURR HPGe Specifications........................................................................55
Appendix B: 11C Production Target Schematics .............................................................555
Appendix C: GitHub Repository .....................................................................................558
Bibliography ....................................................................................................................599
ix
List of Figures
Page
Figure 1. MURR GE® standard cyclotron radioisotope production target ........................ 9
Figure 2. Internal view of 13N and 11C production target ................................................ 10
Figure 3. 11C production target Havar® foil window. ...................................................... 11
Figure 4. MURR PETtrace 800 Series cyclotron showing six ports ............................... 11
Figure 5. 14N(p,α)11C reaction cross section data ............................................................ 16
Figure 6. 63Cu(p,2n)62Zn reaction cross section data ....................................................... 17
Figure 7. 65Cu(p,n)65Zn reaction cross section data ........................................................ 18
Figure 8. Normalized 62Zn activity from MCNP6 Simulation. ....................................... 24
Figure 9. Normalized 65Zn activity from MCNP6 Simulation ........................................ 25
Figure 10. Foil stack Diagram ......................................................................................... 25
Figure 11. Radiographic images of irradiated foils ......................................................... 27
Figure 12. 11C production target model in MCNP6 .......................................................... 28
Figure 13. Normalized 62Zn experimental results versus MCNP6 simulation results
................................................................................... Error! Bookmark not defined.4
Figure 14. 62Zn χ2 values versus beam energy of simulation .......... Error! Bookmark not
defined.5
Figure 15. Normalized 65Zn experimental results versus MCNP6 simulation results
.......................................................................................... Error! Bookmark not defined.6
Figure 16. 65Zn χ2 values versus beam energy of simulation .......... Error! Bookmark not
defined.7
Figure 17. Peak-Matching 65Zn χ2 analysis..................... Error! Bookmark not defined.8
x
Figure 18. Peak-Matching 65Zn experimental results vs simulation results ............. Error!
Bookmark not defined.9
Figure 19. Cyclotron beam intensity profile based on foil #1 ......................................... 41
Figure 20. 11C production ion chamber measurements .................................................... 43
Figure 21. 11C production ion chamber measurements .................................................... 45
Figure 22. Mesh tally plot for 11C simulation .................................................................. 48

xi
List of Tables
Page
Table 1. 11C production model tally results ...................................................................... 41
Table 2. 11C production simulation results for each cross-section data source ................ 42
Table 3. Half-life calculations for 11C results ................................................................... 44
Table 4. 11C ion chamber experimental results versus production model results ............. 46
Table 5. Comparison of A0 based on simulation results ................................................... 47
Table 6. Optimization mesh tally results .......................................................................... 48

1
DEVELOPMENT OF A MODEL FOR 11C PRODUCTION VIA THE 14N(p,α) REACTION USING A GE PETTRACE CYCLOTRON
I. Introduction
1.1 Motivation
The production of radioisotopes is extremely important for a wide variety of
applications. Radioisotopes are used within the medical field to treat diseases such as
cancer and hyperthyroidism and provide a means for tracking Alzheimer’s, tumors, and
bone injuries using positron emission tomography (PET) scans and other nuclear imaging
technology [1]. Radioisotopes are also used extensively in research applications. For
example, plant scientists use radioisotope tracers to track plant nutrient activity [2], and
medical scientists use radio-tracers with animals to analyze disease progression and
research treatment options [3]. Many radioisotopes have been used for decades, and their
production is generally well established. However, radioisotope production can be costly,
and as new radioisotopes are implemented for medical and research purposes, it is
important to ensure that their production is efficient.
At the Missouri University Research Reactor (MURR), radioisotopes are produced
daily for distribution to local hospitals and used on location to perform research studies.
MURR employs the PETtrace800 series cyclotron as one of its radioisotope production
tools. The cyclotron is used to produce 18F (t1/2 = 109.8 min) from the 18O(p,n) reaction. 18F is used in fluorodeoxyglucose, a tracer for positron emission tomography (PET) scans.
PET scans are used for a wide variety of diagnostic imaging procedures to include cancer
diagnosis and treatment [4].
MURR also uses radioisotopes produced by their cyclotron for important research
applications related to biochemistry, nuclear engineering, and agriculture. Nuclear imaging
can be used in plant bodies to provide information about the internal chemical interactions
in a manner similar to the use of radio-tracers in humans. At MURR, a growing research
area utilizing radioisotopes is sustainable cropping. The estimated population of the world
in the year 2050 is around 9.1 billion people. Based on this estimate, it is projected that
food production must become roughly 50% more efficient [5]. Nuclear imaging can be

2
used to gain a better understanding of plant behavior allowing for improvements in crop
environments and crop yield to support a growing world population [5]. Optimizing the
production of important research isotopes through a better understanding of the processes
involved will allow the sustainable agriculture research to progress.
1.2 Background
John H. Lawrence is widely considered the “father of nuclear medicine.”
Lawrence’s research focused on the production of artificial radioactive isotopes, which he
believed could be used widely in medicine. John Lawrence did the majority of his
radioisotope research at his brother Ernest’s laboratory [6]. Many of the currently most
widely used medical isotopes were discovered by Lawrence while working at the
laboratory. Lawrence performed the first radiation therapy treatment on a patient with
leukemia using a phosphorous-32 source in 1936 [7]. In addition to cancer treatment, early
nuclear medicine capabilities were also used to treat decompression sickness for fighter
pilots in World War II. After World War II, researchers began looking into using medical
isotopes as tracers for medical imaging [6].
Large-scale medical isotopes are primarily produced in nuclear reactors in only a
few countries including the United States, Canada, Australia, and South Africa [8].
However, radioisotopes with short half-lives must be produced on location, or at least very
close to where they will be used. Such isotopes are generally produced in small batches
with cyclotrons such as the MURR’s PETtrace800 series cyclotron [4]. The PETtrace
cyclotron is specifically designed for the production of radioactive PET tracers. In addition
to radioisotope production for medical purposes, MURR also utilizes the cyclotron to
produce research radioisotopes, such as 11C and 13N [4]. The reaction 14N(𝑝𝑝,𝛼𝛼)11C is used
to produce 11C at MURR and 14N(𝑝𝑝,𝑝𝑝𝑝𝑝)13N is used to produce 13N. The targets that MURR
uses for radioisotope production are standard General Electric (GE®) targets that are made
from aluminum with stainless steel fixtures and contain gas fill of the desired target nucleus
[4].
The short-lived nature of radio-tracer isotopes is one of their most important
characteristics. Tracer isotopes decay rapidly by emitting gamma rays which can be tracked

3
with radiation detectors. The tracer isotopes are placed within human, animal, or plant
bodies in such a way that they will be transported and accumulate in regions of interest
based on the desired treatment or research effort.
11C is also used in biomedical research including PET research with adult female
baboons. For this research 11C was in the form of 11C-reclopride, a dopamine-specific
radio-tracer that binds to dopamine in the brain, allowing for the dopamine to be tracked
in vivo (inside a living organism). 11C-raclopride imaging was used to study Huntington’s
disease, which degrades dopamine receptors within the brain [3].
The plant science group at MURR regularly produces radioisotopes for plant
studies and other chemical and biological research. A key area of interest for the plant
science group is nitrogen fixation in plants which is involved in plant metabolism [9].
Plants metabolize extremely quickly and are able to uptake nutrients and minerals,
including the nitrogen, within minutes of introduction. During the nitrogen fixation
process, bacteria within the root system of plants produce nitrogen compounds. This
process benefits the plants by helping them grow more quickly, an important consideration
in improving the efficiency of food production [9].
Another area of research at MURR is the behavior of plants under duress due to
herbivory. Herbivory refers to the attack and damage of plants by insects and other
herbivores. When plants are attacked, they react in a variety of chemical and physiological
ways to defend themselves and protect the resources they possess. For example, they have
the ability to allocate chemicals within their stems and leaves to their roots to prevent them
from being lost. Radio-tracer isotopes such as 11C and 13N can be used to observe this
behavior through the use of radiation detectors [2].
In order to better understand and operate the cyclotron to enable research in these
areas, characterization of the proton beam and production is desired. This research
develops an experimentally informed model to characterize the 11C production and explore
improvements in radioisotope production efficiency.

4
1.3 Problem Statement
Radioisotope production is costly, so efficiency is often a significant concern.
Radiation transport simulations are one method that can be used to study the efficiency of
production targets. While simulations provide many advantages such as increasing the pace
of research, lowering the cost, and studying difficult to measure phenomena, it can be
difficult to capture all of the physics and geometry considerations for complex production
environments. For example, the MURR cyclotron proton beam has not been characterized
in terms of profile and energy, and the radiation transport does not capture the heat transfer
dynamics that affect gas target density profiles.
The primary objective for this research is to develop an experimentally-informed
model of 11C production using the MURR cyclotron to enable the improvement of
radioisotope production efficiency. This overall goal was sub-divided into the following
objectives and sub-objectives:
1. Characterize the proton beam
a. Measure the precise beam energy
b. Characterize the beam profile and intensity
2. Perform ion chamber measurements and analysis of 11C production to
quantify 11C production as a function of beam current
3. Develop a 11C production simulation in Monte Carlo Neutral Particle 6.1
(MCNP6) [10]
a. Incorporate an accurate proton beam
b. Benchmark model against experimental measurements
c. Assess the performance of available nuclear data libraries
4. Characterize 11C production target inefficiencies
1.4 Methodology
The MURR cyclotron beam energy was characterized using isotopically natural
copper foils placed directly behind the cyclotron proton beam window. The proton
reactions within the copper foils produced 62Zn and 65Zn via the 63Cu(p,2n) and 65Cu(p,n)
reactions, respectively. The activities of each isotope were characterized using gamma

5
spectroscopy. The beam energy was determined from the relative measured activity profile
of each Zn isotope for each activated foil and an MCNP6 simulation of the foil activation
experiment. To obtain the energy of the proton beam, the foil experimental results were
compared to the simulation results at varying proton beam energy levels using Chi-squared
minimization.
Additionally, the irradiated foils were radiographically imaged in order to
characterize the beam spatial and intensity profile. The beam profile was characterized
based on the size of the image on the first foil in the stack and the stated resolution of the
film, which was cross validated using the aperture visible in the last film in the foil stack.
The beam intensity was measured in a histogram format based on a pixel mesh to
characterize the intensity with respect to location. The results were implemented in the
MCNP6 11C simulation.
The MURR cyclotron 11C production was modeled using MCNP6. The production
simulation included the measured cyclotron proton beam source, the GE 11C production
target, and the pressurized helium filled cooling window encapsulated by Havar® foils.
Additionally, the model was used to compare the two source definitions (mono-directional
16.5 MeV protons vs. the experimentally measured profile and energy). In order to
benchmark the 11C target simulation, an ion chamber was used to measure the amount of 11C produced at varying proton beam currents.
Finally, the MCNP6 11C production model was further analyzed using a mesh tally
within the target region. The mesh tally was used to characterize the production within the
target and identify apparent inefficiencies in the design of the target.
1.5 Assumptions and Limitations
One limitation associated with this research is the nuclear data required to model
the 11C production target. The reactions of interest for these simulations cannot be
effectively modeled in MCNP6 without introducing additional nuclear data not contained
in the standard libraries. For example, the 11C production simulation requires the specific 14N(p,α)11C reaction to be modeled and tallied, but the standard MCNP6 cross-section
libraries will tally all 14N(p,xα)11C reactions. For this research, data was pulled from the

6
TALYS-based Evaluated Nuclear Data Library (TENDL) [11], the Japanese Evaluated
Nuclear Data Library (JENDL) [12], the Proton Activation Data File (PADF) [13], and the
Evaluated Nuclear Data File (ENDF) [14]. These additional data libraries did not always
follow consistent formatting and details, such as units, and are not always particularly well
documented. The choice of which libraries to include was informed by how well the
evaluated data matched the measured cross-section data from the literature, and
experimental data was included as well if the evaluations were found to differ significantly.
Another limitation with the 11C production model is uncertainty in the beam
characteristics during the irradiation runs. Specifically, the PETtrace 800 Series cyclotron
has relatively large timing and beam current uncertainties. The cyclotron is designed to run
with a specific beam current, irradiation time, and target. However, there is roughly a
±1 𝜇𝜇𝜇𝜇 uncertainty in the beam current and a ±30 𝑠𝑠 time uncertainty at the start and stop
of irradiation as the cyclotron tunes up and tunes down.
The cyclotron target design results in additional uncertainty. Production efficiency
within the target likely is diminished due to the beam within the target interacting with
target walls and a target that sags at the cyclotron beam port location. As the proton beam
travels through the target it spreads out and likely interacts with the sides and the end of
the target. As a result, less 11C will be produced than would be expected based upon the
cyclotron input characteristics. While characterizing the beam profile will help capture
some of this behavior, no direct measurement was made to experimentally characterize
these effects.
As the cyclotron beam current increases, the gas is heated resulting in gas density
reduction. This effect was characterized indirectly, but due to the high uncertainty in the
beam current, no experimental run was performed where the effect was thought to be
negligible. The gas density reduction impacts the behavior of the gas within the target and
consequently the 11C production. This phenomenon is very difficult to model within
MCNP6 since it would require coupled radiation and multiphysics simulation. The pressure
gauge that characterizes the pressure of the target under irradiation was not working during
the experimental run, further limiting the ability to incorporate the gas density reduction

7
effects in the model. Due to these facts, incorporation of gas density reduction effects was
not accomplished in this research.
Finally, an additional limitation with the foil activation experiment was that only
one high-purity germanium detector was used to measure the activated foils. If additional
detectors were available and could be used to count foils simultaneously, a stack of all 25
μm foils could have been used. This would have allowed for finer resolution in the beam
characterization measurements and limited the number and types of correction factors that
needed to be applied in the analysis. An MCNP6 model was used to determine the best
placement of each thickness of foil in order to attempt to overcome this limitation.
8
II. Literature Review
Radioisotopes can be used for a wide-range of purposes including medical
applications and research [8]. This research concerns the production of radioisotopes that
are intended to be used in medical and plant research, primarily as PET tracers. The PET
tracer research performed with 11C and 13N at MURR can be used for developing
sustainable agriculture and mental health treatments. Sustainable agriculture research
attempts to improve plant performance and hardiness in order to allow for more food
production and decreased risk [5]. The production of radioisotopes at MURR and some of
the important applications are discussed in Section 2.1.
This research required an understanding of nuclear reactions and how to implement
the evaluated nuclear data into the MCNP6 models. Each of the MCNP6 simulations used
in this research necessitated the use of alternate nuclear cross-section data, which allowed
for specific reactions of interest to be defined. Available cross-section evaluations were
considered, and the best options were chosen based on how well they represented the data
[15]. An overview of the nuclear reactions and data relevant to this research is explored in
Sections 2.2 and 2.3.
In order to measure the precise cyclotron energy of the MURR cyclotron beam,
previous foil activation experiments were researched [16-18]. These previous experiments,
described in Section 2.4 and 2.5, were used as a baseline to design the experiments
performed in this research.
The radiography and ion chamber tools used to perform the beam characterization
and 11C production measurements, respectively, are described in Sections 2.6 and 2.7. The
ion chamber was also used to explore gas density reduction, a major factor with gaseous
target radioisotope production. Gas density reduction can occur when the cyclotron beam
heats the target gas and the heat is not dissipated properly which, in turn, results in
inefficient radioisotope production [19]. This process is described in Section 2.8.

9
2.1 MURR Radioisotope Production
At MURR and other small facilities, radioisotopes are produced using specialized
cyclotrons that accelerate particles to high energies to elicit nuclear reactions with target
nuclei [4]. MURR employs a PETtrace800 series cyclotron specifically designed to
produce radioisotopes utilized as tracers [4]. They produce 18F (t1/2 = 109.8 min) from the
reaction 18O(p,n) every night to make the medical isotope fluorodeoxyglucose, a tracer
used for PET scans [4].
The target used for 11C and 13N production is a standard GE® radioisotope
production target, depicted in Figure 1, made of aluminum with stainless steel fixtures (See
target schematics in Appendix B). For 11C, the target is filled with 14N gas; for 13N
production, CO2 fill gas is used. After irradiation, the gas is pumped out of the cyclotron
target and through tubes under the floor. The gas is pulled into an ion chamber containing
a carbon trap where it is analyzed to determine the amount of radioisotope produced.
Figure 1: MURR GE® standard cyclotron radioisotope production target.
In addition to the internal gas region where the target gas is pumped in and the
radioisotope rich gas is pumped out, there are also ports for helium and water to cool the
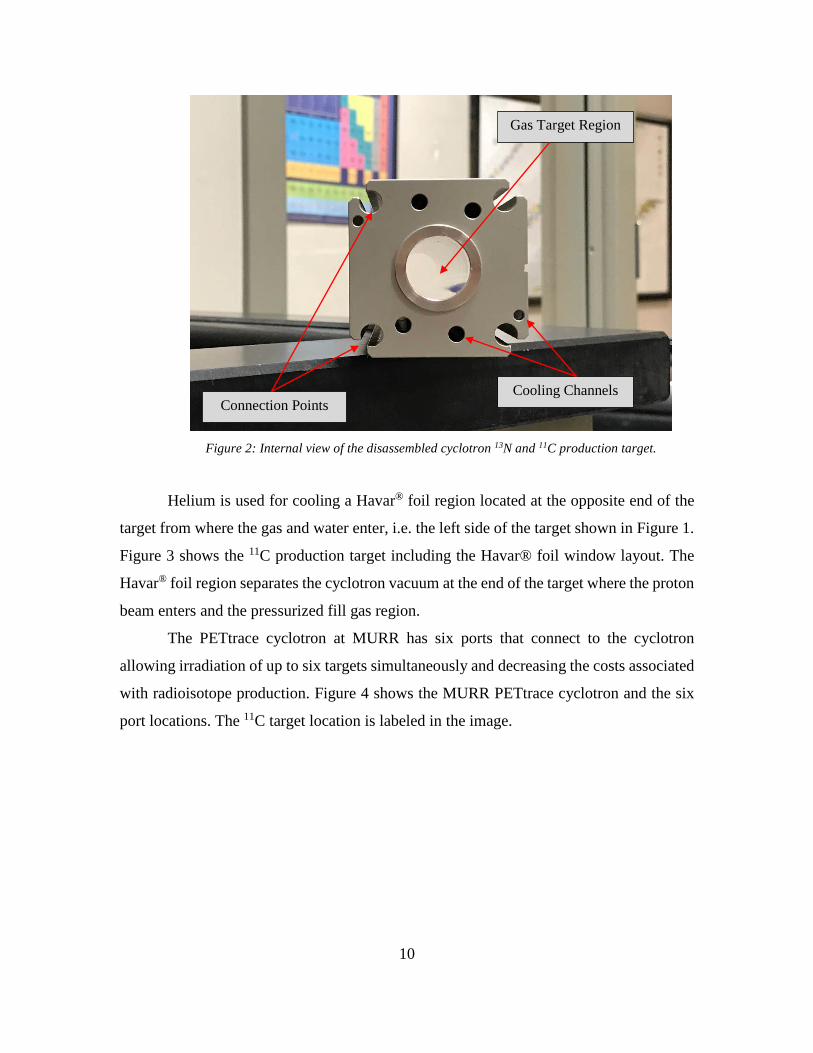
target during the production process. Figure 2 shows the internal components of the target.
The center interior cylinder is the gas region where the target gas is filled and irradiated.
The 6 other tubes shown are where water is pumped through the target for cooling.
10
Figure 2: Internal view of the disassembled cyclotron 13N and 11C production target.
Helium is used for cooling a Havar® foil region located at the opposite end of the
target from where the gas and water enter, i.e. the left side of the target shown in Figure 1.
Figure 3 shows the 11C production target including the Havar® foil window layout. The
Havar® foil region separates the cyclotron vacuum at the end of the target where the proton
beam enters and the pressurized fill gas region.
The PETtrace cyclotron at MURR has six ports that connect to the cyclotron
allowing irradiation of up to six targets simultaneously and decreasing the costs associated
with radioisotope production. Figure 4 shows the MURR PETtrace cyclotron and the six
port locations. The 11C target location is labeled in the image.
Gas Target Region
Connection Points Cooling Channels

11
Figure 3: 11C production target Havar® foil window.
Figure 4: MURR PETtrace 800 Series cyclotron showing six ports and the 11C target marked in the
uppermost position.
11C Production
Target
Cyclotron and Containment
6 Connection Ports
Havar Foil Locations
Helium Cooling Window

12
2.1.1 Plant Science Research and Sustainable Cropping
Radioisotope use at MURR has applications including plant and sustainable
cropping research. The implications of the sustainable cropping research have the potential
to be significant world-wide. Increasing the sustainability and hardiness of plants means
that droughts will be less catastrophic for crops and wide-spread world hunger could be
decreased. A better understanding of the MURR cyclotron and the efficiency of the
radioisotope production target will allow MURR to increase the amount of research that
they can conduct, while decreasing the associated costs.
Plants are complex living organisms that can respond to a variety of stimuli
including situations where they are in distress and at risk of being damaged or destroyed.
When plants are stimulated in a threatening manner, they are able to react to defend
themselves. One defense mechanism for plants is to produce chemicals intended to weaken
their attacker. For example, tobacco plants produce nicotine, which is a neurotoxin for
many herbivores. However, specialized caterpillars have adapted to build up nicotine in
their system following tobacco leaf ingestion and, in turn, they use this as a defense against
their own predators. This allows their population to increase and can lead to complete
defoliation (removal of all the leaves on a plant leading to its death) of tobacco plants [2].
Therefore, chemical compound production is often not a sufficient defense for plants.
Since nitrogen and carbon are required for plant growth and reproduction, it is
vital to plant well-being that they maintain healthy stores of these nutrients. Another
method of plant defense is through reallocation of their critical resources in response to
herbivory. If plants are attacked, it is generally their leaves that are most vulnerable to
damage. For that reason, plants that are under attack will often reallocate important
resources to their root systems for protection.
MURR personnel have been researching this type of nutrient reallocation through
the simulation of herbivorous attacks on tomato plants. Prior to simulating an attack on the
plants, 11C and 13N were administered to the leaves of tomato plants. A p-intrinsic-n (PIN)
diode radiation detector was placed near the center of the leaves of the plant. A sodium-
iodide scintillation detector was placed at the apex of the leaves and at the roots of the
plant. As the radioisotopes decayed by positron emission, the detectors could observe the
13
emitted gamma-rays and observe the transport of nitrogen and carbon throughout the plant.
To simulate plant herbivory, the plant science department uses methyl jasmonate (MeJA),
which elicits similar defensive responses in plants. MeJA was misted over the leaves of the
plants to simulate an attack on the leafy plant parts. As hypothesized, the plants were
observed to transport the radioactive carbon and nitrogen to their root system for
protection. Additionally, once the MeJA had worn off, the plants returned nutrients to their
leaves. In a real attack, plants would do this to provide the carbon and nitrogen to their
damaged leaves to aid in the regrowth of leaves compromised during the herbivory [2].
Similar behavior was observed in poplar tree research. 11C was once again used
as a tracer for the trees to observe nutrient reallocation in a similar experiment to those
with the tomato plants [20]. Additional general research was done with 11C that was used
to determine the transport time of carbon through plant leaves and stems [2].
Population projections estimate that in less than 30 years the world population
will increase by over 1.5 billion. In order to accommodate this growth, agriculture needs
to progress with the surging population to ensure that sufficient food is available [5]. The 11C and 13N research at MURR is applicable to understanding the mutually beneficial
relationship that exists between plants and microbes [5]. Microbiome in soil can exchange
carbon and nitrogen with plants through the plant roots [5]. As a result, plants are able to
grow more extensive root systems that help them to become hardened against drought and
nutrient deficiency. In addition, plants would require less water and fertilization. MURR
continues to research how this could be achieved through fostering a beneficial
environment for rhizobacteria in the soil which will result in more efficient plant growth
[5].
2.1.2 Biomedical Research
11C can also be used for medical research. MURR personnel have previously
performed research studies to determine the effect of certain drugs on brain function [3].
Certain medications can affect production of dopamine and other chemicals within the
brain. Research was done using baboons as subjects to determine whether 11C-raclopride
can be effectively used as a PET tracer to observe neurotransmitters [3]. The reported
results have shown promising signs that this is an effective and that it may be able to be

14
used for humans as well to analyze the effects of drugs on human cerebral dopamine
transmitters [3].
2.2 Nuclear Reactions
Nuclear reactions occur when a nucleus of an atom interacts with another nucleus
or subatomic particle. The general form of a nuclear reaction is
𝑎𝑎 + 𝑋𝑋 → 𝑌𝑌 + 𝑏𝑏, (1)
where X is the target nucleus, 𝑎𝑎 is a sub-atomic or composite sub-atomic particle interacting
with the nucleus, and b and Y represent the resultant products of the reaction. Another way
to write the equation for this reaction is
𝑋𝑋(𝑎𝑎, 𝑏𝑏)𝑌𝑌. (2)
There are numerous types of nuclear reactions including fusion reactions, fission
reactions, and spallation reactions. More generally, nuclear reactions can be classified as
direct or compound reactions. In a direct nuclear reaction, the incoming reactants interact
and directly produce the outgoing products. In compound nuclear reactions, the initial
reactants interact and produce an intermediate nuclide, which is in an excited state and then
decays into the final reaction products [21].
The type of nuclear reaction that will occur depends on multiple conditions
including the identity of the nucleus and the energy and type of incoming particle. The
likelihood that a given reaction will occur in a given scenario is described by the reaction
cross section. A larger cross section for a reaction corresponds to a higher likelihood of
occurrence.
The nuclear primary reactions of interest for this research are 14N(p,α)11C, 65Cu(p,n)65Zn, and 63Cu(p,2n)62Zn. In the case of the 14N(p,α)11C reaction, protons are
accelerated into a region of 14N gas where they interact with 14N target nuclei to produce 11C and an α particle. The 65Cu(p,n)65Zn and 63Cu(p,2n)62Zn reactions are used to
characterize the proton beam. For these reactions, the proton beam is accelerated into a
stack of copper foils. The relative intensity of activation products in each foil provides
information about the energy of the beam incident on that foil [16].

15
The radioactive zinc isotopes produced within the foils decay primarily through
emission of gammas of known energy. The reactions of interest that were chosen had
gamma peaks that do not overlap with other gamma peaks which allows them to be
identified and measured independently. Another reason these reactions of interest and
associated gamma peaks were chosen is based on the cross section associated with their
production is greater with respect to the other reactions that occur. This means that the
peaks for the gamma peaks of interest will be larger and more discernable than for the
minor reactions.
2.3 Nuclear Data
The simulations for this research required the use of evaluated nuclear data libraries
that incorporate specific reaction channel cross sections. Standard nuclear cross-section
libraries available in MCNP6 only allows for all possible multiplicities of a reactions to be
tallied. For example, this means that any α producing reaction that takes place would be
included in the resultant activity output by the simulation. However, the purpose of the
simulations was to account for specific radioisotope production. Therefore, in order to
measure the amount of a specific radioisotope, the MCNP6 simulations required
incorporating alternate evaluated data that provided the energy dependent cross sections
for the specific reaction of interest. The Java-based Nuclear Data Information System
(JANIS) provided by the Nuclear Energy Agency (NEA) was used to obtain this nuclear
data [15]. Figures 5-7 represent the nuclear data that is available for each reaction of interest
compared to the evaluated nuclear data selected for this research.
The Figure 5(a) shows the nuclear data for the reaction of interest in the 11C
production model, 14N(p,α)11C, pulled from JANIS [15]. Figure 5(b) shows the
representative cross sections that were used for this research. In this case, the experimental
data, labeled as S. Takacs+ 2003 [22] and P.D. Ingalls+ 1976 [23] in Figure 5(a), had
features near the threshold energy and higher energy resonances that the models did not
capture. The two sets of experimental nuclear data were combined and used as one set of
cross section data for the 11C production simulation. The Ingalls data was used for the first
three points and then the Takacs data was used for the remainder. The ENDF, TENDL and
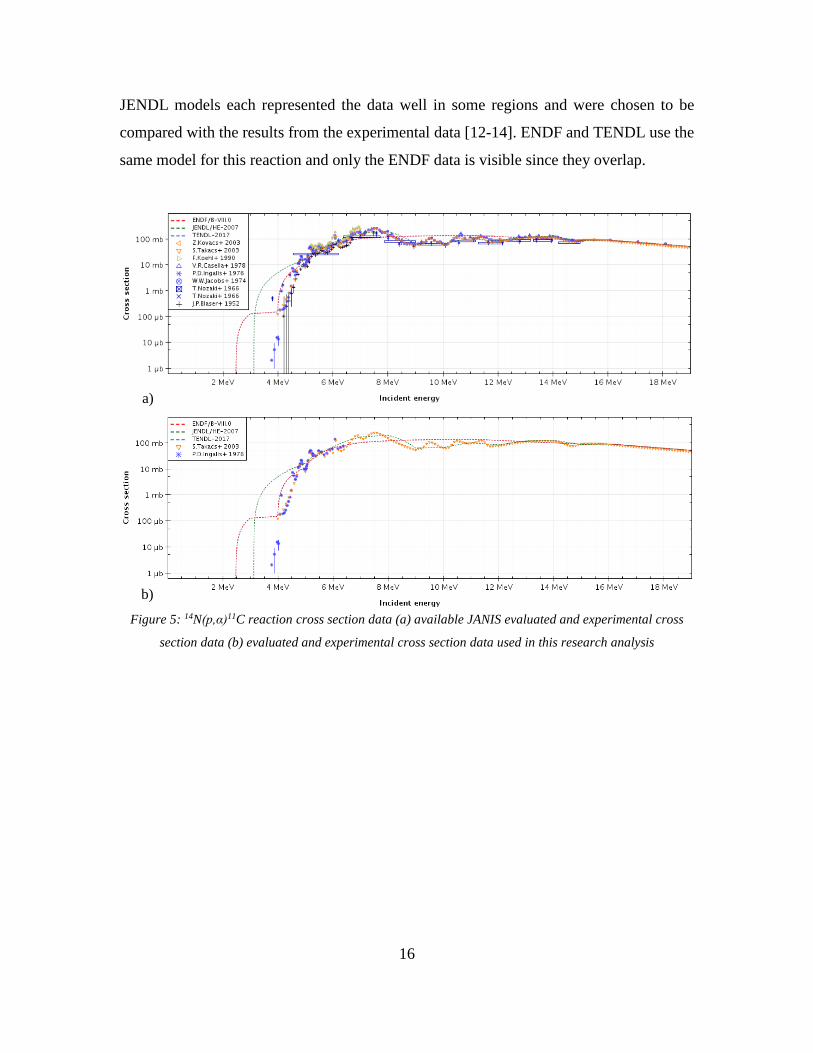
16
JENDL models each represented the data well in some regions and were chosen to be
compared with the results from the experimental data [12-14]. ENDF and TENDL use the
same model for this reaction and only the ENDF data is visible since they overlap.
Figure 5: 14N(p,α)11C reaction cross section data (a) available JANIS evaluated and experimental cross
section data (b) evaluated and experimental cross section data used in this research analysis
a)
b)
17
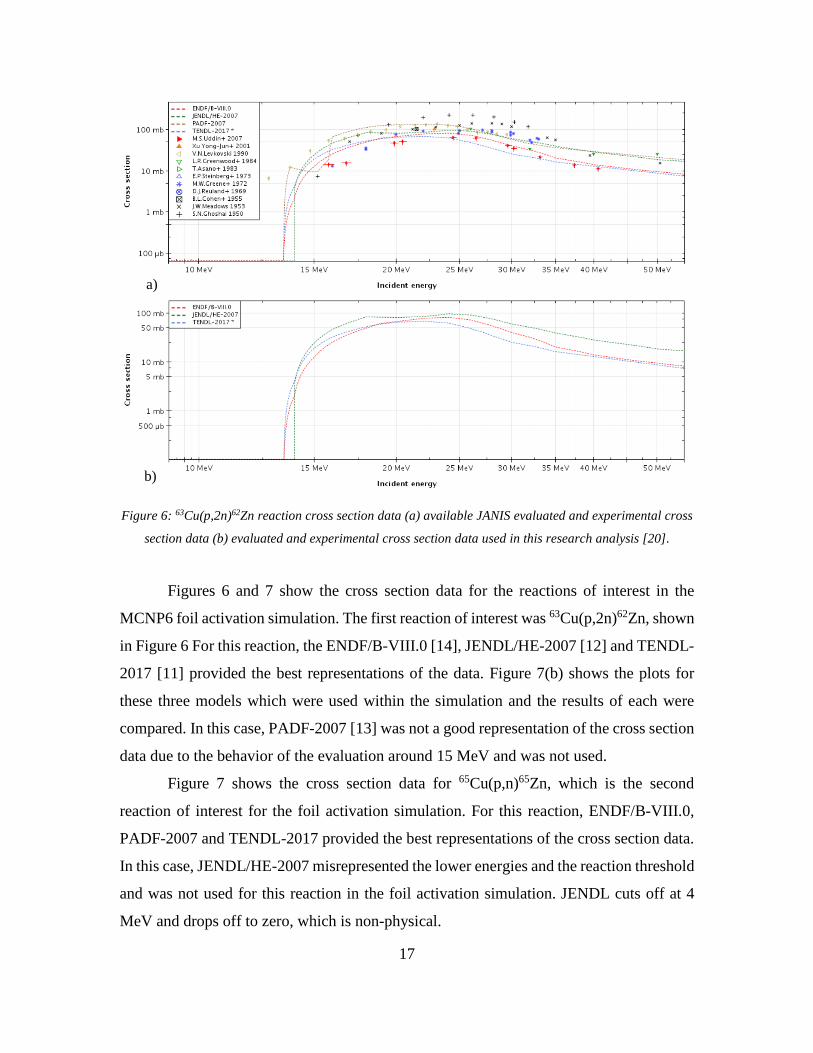
Figure 6: 63Cu(p,2n)62Zn reaction cross section data (a) available JANIS evaluated and experimental cross
section data (b) evaluated and experimental cross section data used in this research analysis [20].
Figures 6 and 7 show the cross section data for the reactions of interest in the
MCNP6 foil activation simulation. The first reaction of interest was 63Cu(p,2n)62Zn, shown
in Figure 6 For this reaction, the ENDF/B-VIII.0 [14], JENDL/HE-2007 [12] and TENDL-
2017 [11] provided the best representations of the data. Figure 7(b) shows the plots for
these three models which were used within the simulation and the results of each were
compared. In this case, PADF-2007 [13] was not a good representation of the cross section
data due to the behavior of the evaluation around 15 MeV and was not used.
Figure 7 shows the cross section data for 65Cu(p,n)65Zn, which is the second
reaction of interest for the foil activation simulation. For this reaction, ENDF/B-VIII.0,
PADF-2007 and TENDL-2017 provided the best representations of the cross section data.
In this case, JENDL/HE-2007 misrepresented the lower energies and the reaction threshold
and was not used for this reaction in the foil activation simulation. JENDL cuts off at 4
MeV and drops off to zero, which is non-physical.
a)
b)

18
Figure 7: 65Cu(p,n)65Zn reaction cross section data (a) available JANIS evaluated and experimental cross
section data (b) evaluated and experimental cross section data used in this research analysis [20].
2.4 Stacked Foil Technique
By knowing the precise energy of a cyclotron beam, operators can better understand
the accurate excitation functions for radioisotope production [18]. Additionally, precise
characterization of the beam allows for increased production yield efficiency through better
target design [18].
One method of characterizing a cyclotron beam energy is through stacked foil
activation [16]. The Department of Radiopharmaceuticals at the Nuclear Research Institute
in Czechoslovakia used high-purity copper stacked foils to characterize their cyclotron
proton beam. The reactions of interests for their experiments were 63Cu(p,2n)62Zn, 65Cu(p,n)65Zn, and 63Cu(p,pnα)58Co [16]. The foils were activated via irradiation from the
cyclotron proton beam and measured. Based on the results, they compared excitation
a)
b)

19
functions and data from literature for each reaction of interest. Also, reference functions
were used with ratios of 62Zn/65Zn, 58Co/65Zn, and 58Co/62Zn in order to characterize the
results [16]. The proton beam was monitored over the energy range of 13-33 MeV [16].
Australian researchers used a stack of high-purity 0.1 mm thick copper foils to
measure their medical cyclotron [17]. They determined that their cyclotron beam has a
precise energy of 17.49 ± 0.04 MeV. The Korean Institute of Radiological and Medical
Sciences (KIRAMS) also used stacked high-purity copper foils to characterize the precise
beam energy of their MC-50 cyclotron which was found to be 35 MeV [18]. For their foil
activation, KIRAMS used natural copper foils and were interested in the natCu(p,xn)62Zn
and natCu(p,xn)65Zn reactions [18].
Based on this research, it was determined that high-purity stacked copper foil
activation could be used to measure the MURR PETtrace cyclotron proton beam. Multiple
experiments were completed on medical cyclotrons with energies between 13-35 MeV,
including two experiments that covered the anticipated energy range of the MURR
cyclotron which is around 16.4 MeV [16-18].
2.5 Foil Activation Analysis
After foils are activated by radioactive beam sources, they can be analyzed by
measuring them with a high-purity germanium detector (HPGe). The foils are measured
individually with the HPGe detector to obtain the number of counts produced at gamma
energies of interest. The radioisotopes that are produced within the foils decay by emitting
gamma-rays of specific energies, which can be observed using the HPGe. In general, the
foils are counted until the gamma peaks of interest have 10,000 counts or more to ensure
that the statistical error associated with these energy peaks is less than 1% as the statistical
error in a counting experiment is taken as the √𝑁𝑁.
The number of counts associated with the gamma peaks of interest are used to
obtain the time-zero activity of the foils, the initial activity of the foils at the end of the
irradiation. This value is important because it indicates the activity that is produced during
the irradiation. However, between the end of irradiation and measuring the foils, the initial
20
activity decays and is less intense at the time of measurement. The time-zero activity of the
foils was calculated as
𝜇𝜇0 = 𝐶𝐶𝐶𝐶𝑒𝑒𝜆𝜆Δ𝑡𝑡𝑗𝑗
�1−𝑒𝑒−𝜆𝜆Δ𝑡𝑡𝑐𝑐�𝜖𝜖�𝐸𝐸𝛾𝛾�𝑓𝑓𝑙𝑙𝐼𝐼𝛾𝛾, (3)
where
𝜇𝜇0 is the time-zero activity,
𝐶𝐶 is the number of counts measured on the HPGe detector in the full energy peak
of a given gamma peak of interest,
𝜆𝜆 is the decay constant of the radioisotope of interest,
𝑡𝑡𝑗𝑗 is time between the end of irradiation and the beginning of measurement, ±30 s
due to uncertainty,
𝑡𝑡𝑐𝑐 is the count time for the measurement,
𝜖𝜖�𝐸𝐸𝛾𝛾� is the efficiency of the HPGe detector for the gamma peak of interest,
𝑓𝑓𝑙𝑙 is the live time fraction for the detector,
and 𝐼𝐼𝛾𝛾 is the gamma intensity [21].
The HPGe detector for this experiment had previously been calibrated for the
efficiency at each gamma peak of interest and stand-off distance. As a result, the HPGe
software, Genie™ 2000 [24], included the correction efficiency for each foil. Therefore,
the 𝜖𝜖�𝐸𝐸𝛾𝛾� term in Equation 3 was removed since it was already accounted for in the Genie
2000 reported counts.
2.6 Radiography
Radiography is a method for imaging radioactive sources. One method of computed
radiography is phosphor plate imaging where phosphor plates are placed over the
radioactive source to image regions of activity [25]. For this research, GE phosphor plate
computed radiographic images with 100 μm resolution were used to characterize the proton
beam intensity and shape. The location of the radioactive materials that result from the
irradiation are visible with the radiographic images. This shows the shape and spread of

21
the activity and can be in turn analyzed to determine the relative intensity and shape of the
beam throughout its profile.
2.7 Ion Chambers
Ionization, or ion, chambers are the simplest form of gaseous detector. They
measure the effects of particles interacting in the detector gas to determine the activity of
a radioactive source. The detector has an electric field that separates the charged particles
created from the radiation allowing them to be collected to measure the source activity.
Incident radiation within the electric field of the ion chamber directly forms ion pairs which
are then measured as an electric current as they travel through the electric field of the
chamber. Secondary electrons also indirectly form ion pairs. The magnitude of the source
activity is proportional to the induced current [26].
A common application for ion chambers is their use to measure radioactive gases
[26]. For this research, a Capintec CRC 712M ion chamber was used to measure the amount
of 11C that was produced in mCi during a cyclotron irradiation cycle.
2.8 Gas Density Reduction
A major operating concern in gaseous cyclotron targets is ensuring that the heat
produced during irradiation is properly dissipated [19]. When the heat within the gaseous
target cannot be effectively dissipated it leads to gas expansion and subsequently
inconsistent density within the target. This results in less efficient operation of the
production target. When cyclotrons can be operated with a higher beam current, more
radioisotopes can be produced due to the increased number of interactions that can occur
per unit time [19]. However, higher beam currents also lead to higher temperatures within
the production target and can lead to target malfunction at high beam currents.
Another related inefficiency that can occur with gaseous radioisotope targets results
from gas density reduction [19]. When the gas within the target heats up, the density goes
down and the gas spreads out away from the heat source, which is generally at the center
of the gas region. This results in more dense gas regions at the edges of the target which
will have decreased contact with the cyclotron beam source and will decrease the overall

22
efficiency of radioisotope production [19]. It has been noted that convective flow occurs
within the target that dissipates heat toward the walls of the target and leads to additional
density reduction effects [19]. Overall, the heating and density inconsistencies throughout
the target results in uneven distribution of the gas and production within the target. As a
result, the radioisotope production within the target is less efficient as the beam current
increases [19].
2.9 Summary
The research associated with this project required an understanding of nuclear
reactions and how to specify particular nuclear reactions in MCNP6 simulations. Nuclear
data was one of the key concerns for producing characteristic simulations. Another concern
with these measurements was gas density reduction and beam shaping throughout the
length of the production target which can affect the efficiency of production. Ion chambers
can be used to measure the actual amount of 11C produced which can provide experimental
validation for production simulations and allow for an analysis of gas density reduction
effects.

23
III. Simulation and Experimental Methodologies
This chapter utilizes the theory described in Chapter 2 to develop the methodologies
used to characterize the proton beam, measure the 11C production, and built the MCNP6
models. Section 3.1 describes the techniques used to characterize the proton beam’s
energy, spatial profile, and intensity profile. In Section 3.2, the development of the target
model in MCNP6 is discussed. Section 3.3 discusses the ion chamber measurements used
to determine the amount of 11C produced during cyclotron target irradiation. In section 3.4,
the target production optimization analysis methodology is described. Finally, section 3.5
discusses the statistical tests used to compare the experimental and simulation 11C
production results.
3.1 Proton Beam Characterization
3.1.1 Beam Energy Measurement
Stacked foil activation analysis was used to determine the energy of the cyclotron
proton beam at MURR. High-purity copper foils were used for this analysis because they
provide multiple reaction channels with gamma-rays that can be measured using an HPGe.
The reaction channels of interest and their corresponding gamma-ray energies are: 63Cu(p,2n) 62Zn with 𝐸𝐸𝛾𝛾 = 548.35 keV and 𝐸𝐸𝛾𝛾 = 596.97 keV, 65Cu(p,n) 65Zn with 𝐸𝐸𝛾𝛾 =
1115.5 keV, and 63Cu(p,n) 63Zn with 𝐸𝐸𝛾𝛾 = 669.6 keV and 𝐸𝐸𝛾𝛾 = 962.69 keV. The 63Zn
peaks were not considered in the original experiment pre-planning and modeling. However,
an additional foil stack irradiation was added to obtain a measurement of them during the
experiment.
The design of the foil stack was determined by a foil activation simulation in
MCNP6. The simulation consisted of a 16.5 MeV pencil beam source and a stack of copper
foils. The foil material in MCNP6 was defined as natural copper with 69.15% 63Cu and
30.85% 65Cu.
The simulation was run separately with a stack of all 25 μm foils and a stack of all
100 μm foils. With the 25 μm foil stack, the full range of the beam was not captured in the
foil stack. More foils could have been added, but during the physical experiment this would
24
have been impractical due to the time constraints associated with the execution of the HPGe
counting. The simulation was also run with all 100 μm foils. However, this configuration
did not capture the 62Zn in more than the first foil.
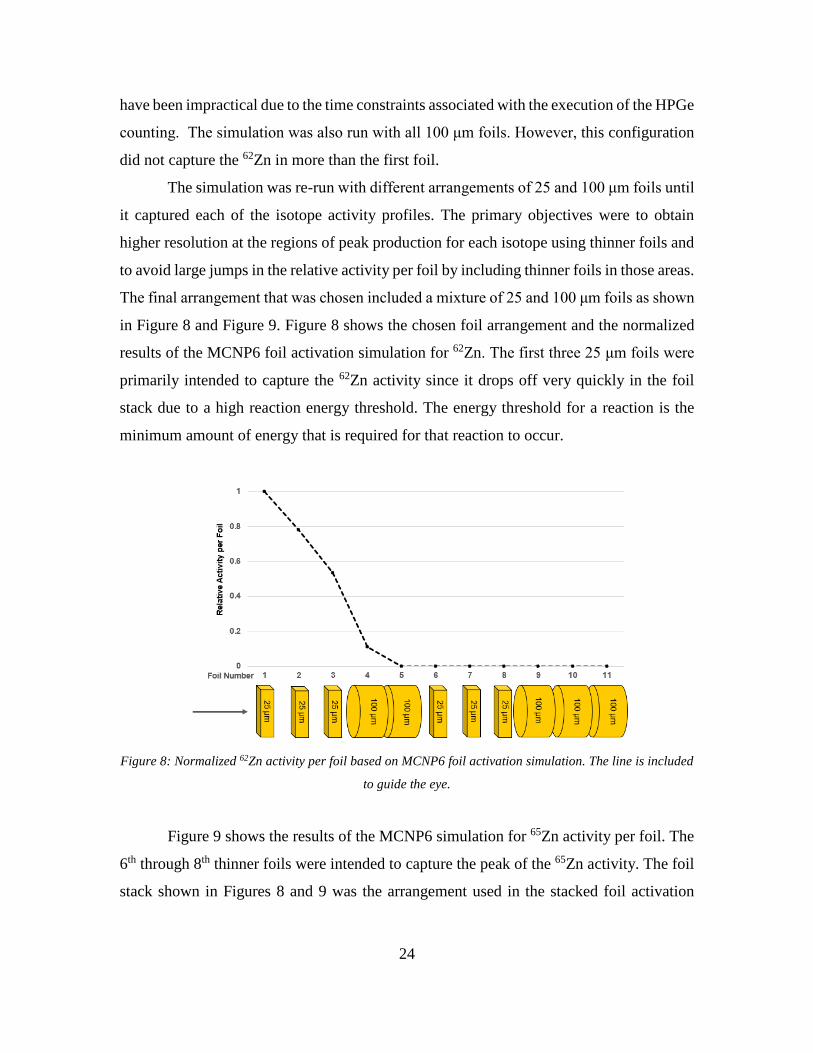
The simulation was re-run with different arrangements of 25 and 100 μm foils until
it captured each of the isotope activity profiles. The primary objectives were to obtain
higher resolution at the regions of peak production for each isotope using thinner foils and
to avoid large jumps in the relative activity per foil by including thinner foils in those areas.
The final arrangement that was chosen included a mixture of 25 and 100 μm foils as shown
in Figure 8 and Figure 9. Figure 8 shows the chosen foil arrangement and the normalized
results of the MCNP6 foil activation simulation for 62Zn. The first three 25 μm foils were
primarily intended to capture the 62Zn activity since it drops off very quickly in the foil
stack due to a high reaction energy threshold. The energy threshold for a reaction is the
minimum amount of energy that is required for that reaction to occur.
Figure 8: Normalized 62Zn activity per foil based on MCNP6 foil activation simulation. The line is included
to guide the eye.
Figure 9 shows the results of the MCNP6 simulation for 65Zn activity per foil. The
6th through 8th thinner foils were intended to capture the peak of the 65Zn activity. The foil
stack shown in Figures 8 and 9 was the arrangement used in the stacked foil activation
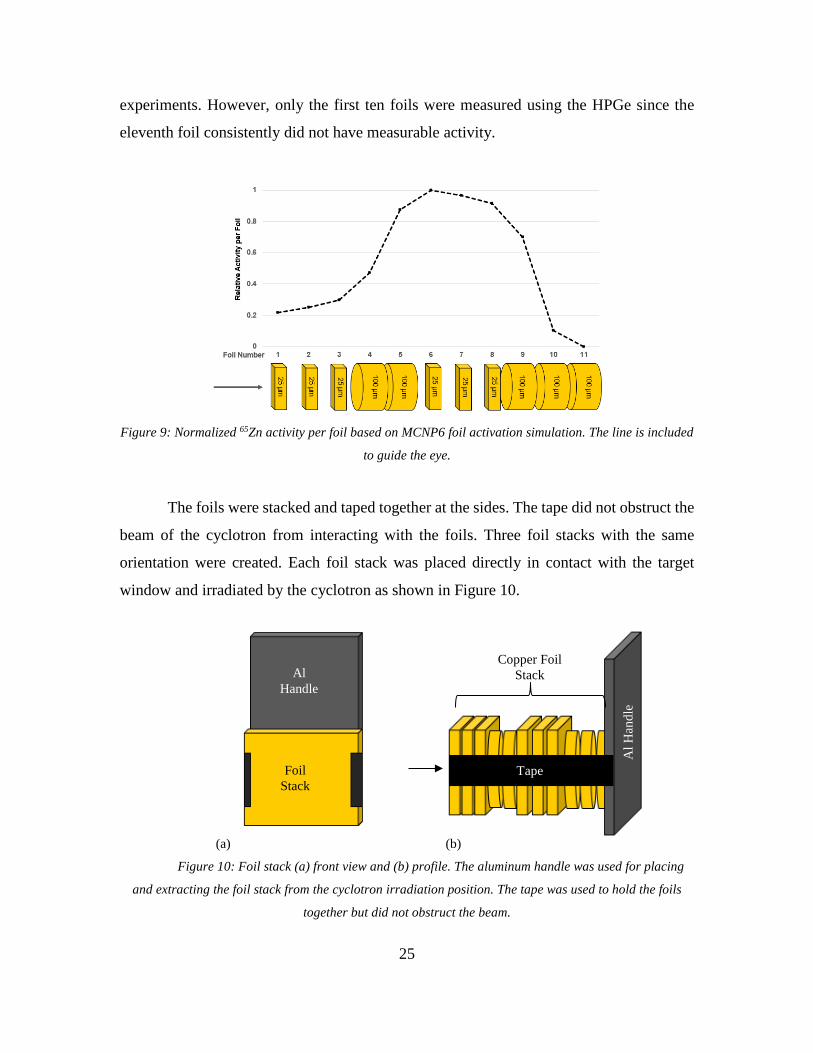
25
experiments. However, only the first ten foils were measured using the HPGe since the
eleventh foil consistently did not have measurable activity.
Figure 9: Normalized 65Zn activity per foil based on MCNP6 foil activation simulation. The line is included
to guide the eye.
The foils were stacked and taped together at the sides. The tape did not obstruct the
beam of the cyclotron from interacting with the foils. Three foil stacks with the same
orientation were created. Each foil stack was placed directly in contact with the target
window and irradiated by the cyclotron as shown in Figure 10.
Figure 10: Foil stack (a) front view and (b) profile. The aluminum handle was used for placing
and extracting the foil stack from the cyclotron irradiation position. The tape was used to hold the foils
together but did not obstruct the beam.
(a) (b)
Copper Foil Stack
Foil Stack
Al Handle
Tape
Al H
andl
e

26
The first and third foil stacks were each irradiated for 30 s with a cyclotron beam
of 5 μA. The second foil stack was irradiated for 30 min with a cyclotron beam of 5 μA.
The first foil stack was used as a test case and measured with an ion chamber to get an
estimate of the activity in each foil.
The goal for the 30 min irradiation was to produce larger amounts of 65Zn within
the foils. 65Zn has a half-life of 243.66 days and takes longer to reach saturation activity
within the foils. A 30 min irradiation does not reach saturation but ensured that an
appreciable amount of 65Zn was produced. The drawback to the longer irradiation was that
it was more highly radioactive and required approximately 6-10 hours of additional cooling
time prior to measurement. The cooling time was necessary to count the foils with a
reasonable detector dead time, <10%. 62Zn and 63Zn have short half-lives, (9.186 h and
38.47 min, respectively) and decayed significantly during the cooling time of the foils. The
30 s irradiation captured the shorter-lived isotopes by allowing for the foils to be counted
with less cooling time.
After the foils were irradiated, they were allowed to decay for approximately 20
hours for the 30 min irradiation and 1.5 hours for the 30 s irradiation. The decay time was
based on a variety of factors including some limitations based on safety considerations and
MURR operating procedures. The activity of the foils was measured by MURR personnel
to ensure it was safe to be transported from the cyclotron to the HPGe laboratory. The
HPGe specifications can be found in Appendix A.
Each foil was counted until the gamma-ray lines of interest had 10,000 counts in
the full energy peak. The counting times per foil ranged from approximately 15 min to 3
hours. In the case of the 30 s irradiation, the foil measurements had to be performed quickly
in order to prevent all of the activity from decaying away before they could be measured.
Therefore, in some cases, only 5000 counts were obtained in some of the full energy peaks
for 63Zn.
3.1.2 Beam Profile Measurement
After the foil HPGe measurements were complete, the first foil stack that was
irradiated for 30 min was imaged using a General Electric Imaging Plate Unit (IPU)
radiographic system to determine the beam spread and intensity profile. The radiographic

27
images were taken by placing a phosphor plate over the spread-out foils. Figure 11 shows
the radiographic images obtained. In Figure 11, the arrow on the top diagram represents
the proton beam direction of flow through the stack. A diagram of the foil stack
arrangement showing the thickness and shape for each foil for comparison with the
radiographic images is also included in Figure 11.
Figure 11: Radiographic images of the 30 min irradiated foils with a diagram of the foil thicknesses and
shapes for comparison.
The foil stack was allowed to decay for approximately 3 days prior to taking these
images. The short-lived isotopes, primarily 62Zn and 63Zn, produced in the foils resulted in
the images becoming over-exposed if the images were taken too quickly post-irradiation.
After a few days, the short-lived isotopes had decayed away enough to successfully image
the foils. The exposure time was adjusted between the foils in order to get consistent images
that could be compared.
3.2 11C Production Simulation
The MURR 11C production was simulated in MCNP6 and compared with
experimental results. The updated beam profile and beam energy of 14.7 MeV based on
experimental data were included in the production simulation.
The 11C target was modeled in accordance with GE specifications as shown in
Figure 12. Only the gas rear flange head piece, target body, and gas region were modeled
as these are the only components where the proton beam would interact. The base of the
target was modeled as an aluminum rectangle with a cylindrical hole in the center. The
head piece was also modeled as an aluminum rectangle connected to the base at one end.

28
The other end of the base is connected to a Havar® foil window. Havar® foils are cobalt-
based alloy foils designed to be used in high temperature environments The Havar® foil
window consisted of one 25 μm thick Havar® foil on either side of a 1.5 cm thick region
of helium used for cooling the foils.
Figure 12: 11C production target model in MCNP6 shown in Visual Editor (VISED). The components are
transparent in the image with the exception of the Havar® foil window to show the interior target geometry.
The pressure in the He cooling region was 50 psi. The foil window is designed to
allow the beam to pass through while maintaining the desired high pressure required within
the target fill gas and the vacuum in the cyclotron. The pressure of the 14N fill gas was set
to 165 psi for 11C production.
3.3 Ion Chamber Measurements
In order to benchmark the 11C production simulation, 11C production was measured
with a Capintec Radioisotope Calibrator (CRC-712MV) ion chamber. Production cycles
were run with the following beam currents: 5 μA, 10 μA, 20 μA, 30 μA, and 40 μA. The
beam current strength has an approximately ±1 μA uncertainty. The irradiation time was
set for 5 min for each of the cycles; however, the cyclotron tunes during that time as well.
The target gas was filled to an initial pressure of 165 psi with a gas density of 0.0131 g/cc.
There is uncertainty associated with the tune time and the precise amount of time that the
29
cyclotron runs following the tuning period. Therefore, the run time for each production
cycle was approximated as 4.75 ± 0.25 min.
Once each production cycle was run, the gas in the target was evacuated to a 5 Å
Ascarite II NaOH coated SiO2 chemical trap which collects CO2. The chemical trap had an
efficiency of greater than 0.99 for collecting CO2. The carbon that is collected by the
chemical trap includes the 11C, which is the product of interest. 13N, 14O, and 15O are also
trapped in the chemical trap. MURR personnel indicated that the trapping efficiency is
relatively low for 13N, but it is higher for the oxygen isotopes. The specific activity,
reported in mCi by the ion chamber, was measured beginning 1 min after the end of
irradiation through 45 min post-irradiation. For the first 10 min, the specific activity was
observed every minute; between 10-45 min, measurements were taken every 5 min.
Multiple measurements were taken in order to observe the radioactive decay of the isotopes
produced and to determine the activity at the end of irradiation.
3.4 11C Production Target Optimization
The 11C production target at MURR is a standard GE target and is designed
generally for radioisotope production but not specifically for 11C production. One concern
with production efficiency is related to beam spreading that occurs with the cyclotron
beam. As the beam is directed down the gas region of the target it spreads out. Prior to this
research MURR personnel hypothesized that by the end of the target it likely reaches a
width that exceeds that of the target gas region leading to energy from the beam being lost
to irradiation of the metal sides of the target.
In order to analyze the effects of the beam-spread within the production target, a
mesh tally was employed in the MCNP6 simulation. The mesh tally enables accounting of
the proton beam flux to be observed throughout the length and width of the production
target to determine where the beam hits the target walls and whether the target gas fully
stops the beam. The mesh tally extends into the sides and the far end of the target to
determine whether beam interactions occur within the target walls. If the proton beam
interacts with the walls or the back of the target, efficiency is lost. Analyzing the production

30
within the 11C target and identifying any inefficiencies is important to understanding what
an optimal production target looks like and determining the ideal operating conditions.
3.5 Statistical Tests
Experimental and computational results can be statistically compared using chi-
squared and Kolmogorov-Smirnov (KS) statistics [27] [28]. Both of these tests help to
determine how well the computational results match the experimental results in order to
experimentally validate the simulations.
The KS statistic is used to determine whether two sample sets come from the same
distribution [27]. The test calculates a KS statistic and a p-value which determine whether
the null hypothesis, that the two samples come from the same distribution, can be rejected
or not [27]. When the p-value is high it means that the null hypothesis fails to be rejected
[27].
One limitation to this test is that it does not have a high-discrimination index. The
test can result in high p-values and identical p-values for different sample sets. Therefore,
the test does not always give a definite result when comparing different sample sets.
The chi-squared statistic is another form of hypothesis testing which determines
whether there are considerable differences between two sample sets. In this case, the chi-
squared result must be small in order to indicate that the two sample sets are alike [28].
Equation 3 is the equation to calculate the chi-squared statistic,
𝜒𝜒2 = ∑ (𝐸𝐸𝐸𝐸𝐸𝐸−𝑂𝑂𝑂𝑂𝑂𝑂)2
𝐸𝐸𝐸𝐸𝐸𝐸, (4)
where Exp are the experimental results, Obs are the observed, experimental values. This
equation outputs a number rather than a p-value and the objective is to get the lowest
number [28]. By using the 𝜒𝜒2 value rather than the p-value associated with it, the test is
more discriminating and can give a definite result about the likenesses between the sample
sets.

31
IV. Analysis and Results
This chapter utilizes the methodology described in Chapter 3 to characterize the
cyclotron proton beam, to analyze its effects on simulation results, and to compare
experimental and simulation results for the 11C production. In section 4.1, the results of the
proton beam characterization are reported. In Section 4.2, the results of the target model in
MCNP6 are discussed. Section 4.3 discusses the 11C ion chamber results and compares
those results to the MCNP6 simulation results. Finally, in section 4.4, the target production
optimization analysis is discussed.
4.1 Proton Beam Energy Measurement Results
The MURR cyclotron beam energy was measured using stacked foil activation as
described in Section 3.1.1. Each foil’s activity was measured with an HPGe detector. The
resulting gamma-ray pulse height spectra were analyzed to calculate the time-zero activity,
defined as the initial activity of the foils at the end of the irradiation. This value is the value
that will be directly compared to the modeling results. Equation 3 from section 2.5 was
used to calculate the time-zero activity.
The copper foils used to measure the cyclotron beam energy produced zinc isotopes
when irradiated with the proton beam. The zinc isotopes of interest for this project were 62Zn, 63Zn, and 65Zn. However, the 63Zn results ended up being rejected due to significant
coincidence summing concerns. This isotope has a large number of coincident gammas
associated with each of their primary gamma energies. As such, there is a considerable
amount of uncertainty in the results of these measurements. 63Zn has a half-life of 38.47
min, so the foil stacks required being counted quickly after the irradiation in order observe
the 63Zn. In order to increase the efficiency of the foil counting to accommodate this, the
foils were counted as close to the HPGe detector as possible while keeping the dead time
within reasonable limits. The issue with this methodology is that it exacerbates coincidence
summing issues. Coincidence summing effects increase based on the inverse square of the
distance between the detector and the source being measured. Therefore, at close distances
the counts lost to coincidence summing increase drastically.

32
The HPGe had a plastic stand that fit over the crystal with detection positions from
1 to 10 cm above the detector face. Locations 1-3, 5, and 10 were all calibrated by MURR
personnel 3 days before the experiments and were used throughout the measurements. To
minimize dead time and efficiently measure all of the foils before considerable activity
decayed away, the detection location was adjusted throughout the measurements. This
required an additional factor to be included in the calculations to account for the solid angle
of the foils. The foils were analyzed as if they were point sources, but closer detection
locations cannot be accurately considered point sources. The point and volume source solid
angle were compared for each of the measurement locations. Although the largest
difference was seen at the closest locations, there was a difference between point and
volume source solid angles even at 10 cm. The point source solid angle was calculated as
Ω ≅ 𝑁𝑁 𝜋𝜋𝑎𝑎2
𝑑𝑑2 , (5)
where N is the number of counts, d is the distance from the detector and a is the detector
radius [9]. If the source cannot be considered a point source, then Equations 6 through 10
must be used, where s is the source radius [9].
𝛼𝛼 = �𝑎𝑎𝑑𝑑�2 (6)
𝛽𝛽 = �𝑂𝑂𝑑𝑑�2 (7)
F1 = 516
𝛽𝛽(1+𝛽𝛽)7 2⁄ − 35
16𝛽𝛽2
(1+𝛽𝛽)9 2⁄ (8)
F2 = 35128
𝛽𝛽(1+𝛽𝛽)9 2⁄ − 315
256𝛽𝛽2
(1+𝛽𝛽)11 2⁄ + 11551024
𝛽𝛽2
(1+𝛽𝛽)13 2⁄ (9)
Ω ≅ 2𝜋𝜋 �1 − 1(1+𝛽𝛽)1 2⁄ − 3
8𝛼𝛼𝛽𝛽
(1+𝛽𝛽)5 2⁄ + 𝛼𝛼2[𝐹𝐹1] − 𝛼𝛼3[𝐹𝐹2]� (10)
The point source solid angles were divided by the volume source solid angles for
each of the detection positions and the corresponding factors were multiplied by each of
the time-zero activities.
The relative intensity for the foil stack was reported based on averaging the
intensities of the experimental results for each foil, normalizing the averaged data, and
reporting the single average relative intensity for each foil position in the overall stack.
These results were compared to the relative intensities of each foil modeled with the foil
33
activation MCNP6 simulation. The simulation was run with cross section data from
TENDL, ENDF, and JENDL for the 62Zn analysis and TENDL, ENDF, and PADF for the 65Zn analysis. Tabular cross section data from each library was pulled from JANIS [15].
To compare the simulation and experimental results, a Kolmogorov-Smirnov (KS)
statistic and a chi-squared (𝜒𝜒2) statistic were both used [27]. The goal of each of these
statistics is to determine whether the experimental and simulation results came from the
same distribution [28]. A Python 3.6 code was used to iterate the statistical analyses over
a range of simulated beam energies to determine the most likely beam energy.
The MCNP6 foil model was run with varying beam energy values from 13.5 to 16.9
MeV to generate activity profiles for 62Zn and 65Zn with cross section data from each of
the given libraries. Next, the modeled results were compared to the experimental results
using the KS and 𝜒𝜒2 statistics. The code was iterated at each beam current until the best
solution was reached for each of the cross-section libraries for 62Zn and 65Zn.
The results for the KS statistic were consistent; however, they indicated that the KS
statistic does not have a high discrimination index since there is a wide range of energy
values that give the same or very similar p-values. Therefore, only 𝜒𝜒2, Equation 4, was
used in the final analysis since it provided more discrimination between the beam energy
values. For the 𝜒𝜒2 statistic, the objective is to get the lowest number.
Figure 13 shows the plots for 62Zn based on the simulated beam energy that gave
the best chi-squared results when comparing the experimental results to the simulation
results with TENDL, ENDF, and JENDL cross section data. The vertical error bars are less
than 0.3% for each of these measurements. The foil depth location of each point represents
the midpoint depth of the foil and the horizontal error bars show the thickness of the foil.

34
Figure 13: Normalized 62Zn experimental compared to MCNP6 activity results using (a) TENDL cross-
section data and beam energy of 14.8 MeV, (b) ENDF cross section data and beam energy of 14.8 MeV,
and (c) JENDL cross section data and beam energy of 15.1 MeV.
0.0
0.2
0.4
0.6
0.8
1.0
1.2
0 20 40 60 80 100 120 140
Nor
mal
ized
Act
ivity
Foil Depth [μm]
(a) TENDL, Ebeam = 14.8 MeVExperiment
MCNP
0.0
0.2
0.4
0.6
0.8
1.0
1.2
0 20 40 60 80 100 120 140
Nor
mal
ized
Act
ivity
Foil Depth [μm]
(b) ENDF, Ebeam = 14.8 MeV
Experiment
MCNP
0.0
0.2
0.4
0.6
0.8
1.0
1.2
0 20 40 60 80 100 120 140
Nor
mal
ized
Act
ivity
Foil Depth [μm]
(c) JENDL, Ebeam = 15.1 MeV Experiment
MCNP

35
Figure 14 shows a comparison of the 𝜒𝜒2 values obtained comparing the 62Zn
experimental and simulated results for the model incident beam energies.
Figure 14: χ2 values comparing 62Zn experimental and MCNP6 results versus beam energy of simulation.
Each of the cross section result sets have a well-defined valley which represents the
most likely energy value for the beam. The ENDF and TENDL results match up very
closely and agree the most likely energy for the cyclotron beam is 14.8 MeV. The JENDL
data do not match up with the other two and predicts a value of 15.1 MeV. The reason for
the plateau for the JENDL data is because of an anomaly at the threshold energy. As shown
in Figure 6, the JENDL cross section data for 62Zn production drops down to zero suddenly,
which is not realistic cross-section behavior. Additionally, the reaction threshold was
calculated to be 13.48 MeV using the National Nuclear Data Center Q-value calculation
tool [34]. The ENDF and TENDL cross section library thresholds agree with this calculated
value. JENDL does not agree with this and instead has a reaction threshold of 14.0 MeV.
Although this is a small difference in the threshold energy, it has a large impact in this case.
The cyclotron beam energy is not much greater than this threshold energy so even a small
increase in the threshold energy has a large effect on which foils are expected to have 62Zn
produced within them based on the simulation. Based on this, the JENDL results were
rejected since they did not represent the threshold as well. The 62Zn results, excluding the
JENDL results, were averaged and the standard deviation was calculated to determine that
the beam energy is 14.8 MeV.
Figure 15 shows the plots for 65Zn based on the 𝜒𝜒2 minimization comparing the
experimental to the simulation results cross-section data.
0
5
10
15
20
25
30
35
40
14.1 14.3 14.5 14.7 14.9 15.1 15.3 15.5
χ2
Beam Energy [MeV]
TENDLENDFJENDL

36
Figure 15: Normalized 65Zn experimental compared to MCNP6 simulation results using (a) TENDL cross
section data with beam energy of 13.7 MeV, (b) ENDF cross section data with a beam energy of 13.8 MeV,
(c) PADF cross section data with a beam energy of 13.9 MeV.
0.0
0.2
0.4
0.6
0.8
1.0
1.2
0 100 200 300 400 500 600
Nor
mai
lzed
Act
ivity
Foil Depth [μm]
(a) TENDL, Ebeam = 13.7 MeV
Experiment
MCNP
0.0
0.2
0.4
0.6
0.8
1.0
1.2
0 100 200 300 400 500 600
Nor
mal
ized
Act
ivity
Foil Depth [μm]
(b) ENDF, Ebeam = 13.8 MeV
Experiment
MCNP
0.0
0.2
0.4
0.6
0.8
1.0
1.2
0 100 200 300 400 500 600
Nor
mal
ized
Act
ivity
Foil Depth [μm]
(c) PADF, Ebeam = 13.9 MeV
Experiment
MCNP
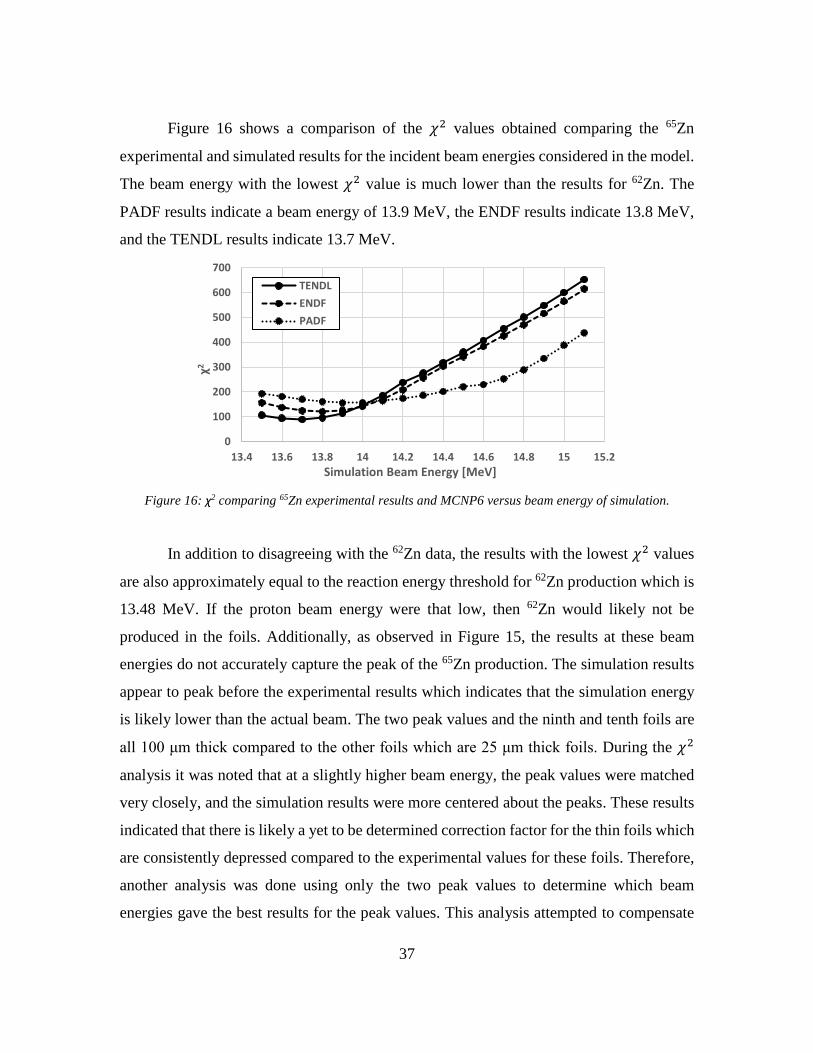
37
Figure 16 shows a comparison of the 𝜒𝜒2 values obtained comparing the 65Zn
experimental and simulated results for the incident beam energies considered in the model.
The beam energy with the lowest 𝜒𝜒2 value is much lower than the results for 62Zn. The
PADF results indicate a beam energy of 13.9 MeV, the ENDF results indicate 13.8 MeV,
and the TENDL results indicate 13.7 MeV.
Figure 16: χ2 comparing 65Zn experimental results and MCNP6 versus beam energy of simulation.
In addition to disagreeing with the 62Zn data, the results with the lowest 𝜒𝜒2 values
are also approximately equal to the reaction energy threshold for 62Zn production which is
13.48 MeV. If the proton beam energy were that low, then 62Zn would likely not be
produced in the foils. Additionally, as observed in Figure 15, the results at these beam
energies do not accurately capture the peak of the 65Zn production. The simulation results
appear to peak before the experimental results which indicates that the simulation energy
is likely lower than the actual beam. The two peak values and the ninth and tenth foils are
all 100 μm thick compared to the other foils which are 25 μm thick foils. During the 𝜒𝜒2
analysis it was noted that at a slightly higher beam energy, the peak values were matched
very closely, and the simulation results were more centered about the peaks. These results
indicated that there is likely a yet to be determined correction factor for the thin foils which
are consistently depressed compared to the experimental values for these foils. Therefore,
another analysis was done using only the two peak values to determine which beam
energies gave the best results for the peak values. This analysis attempted to compensate
0
100
200
300
400
500
600
700
13.4 13.6 13.8 14 14.2 14.4 14.6 14.8 15 15.2
χ2
Simulation Beam Energy [MeV]
TENDLENDFPADF

38
for the depressed activity in the small foils. Figures 17 shows the 𝜒𝜒2 minimization results
for the peak analysis for 65Zn.
Figure 17: χ2 comparing 65Zn peak experimental and MCNP6 results versus beam energy of simulation.
Figure 18 shows the best simulated energy results for each cross section library
compared to the experimental results based on the peak 𝜒𝜒2 minimization analysis.
020406080
100120140160180
13.4 13.6 13.8 14 14.2 14.4 14.6 14.8 15 15.2
χ2
Simulated Beam Energy [MeV]
TENDLENDFPADF
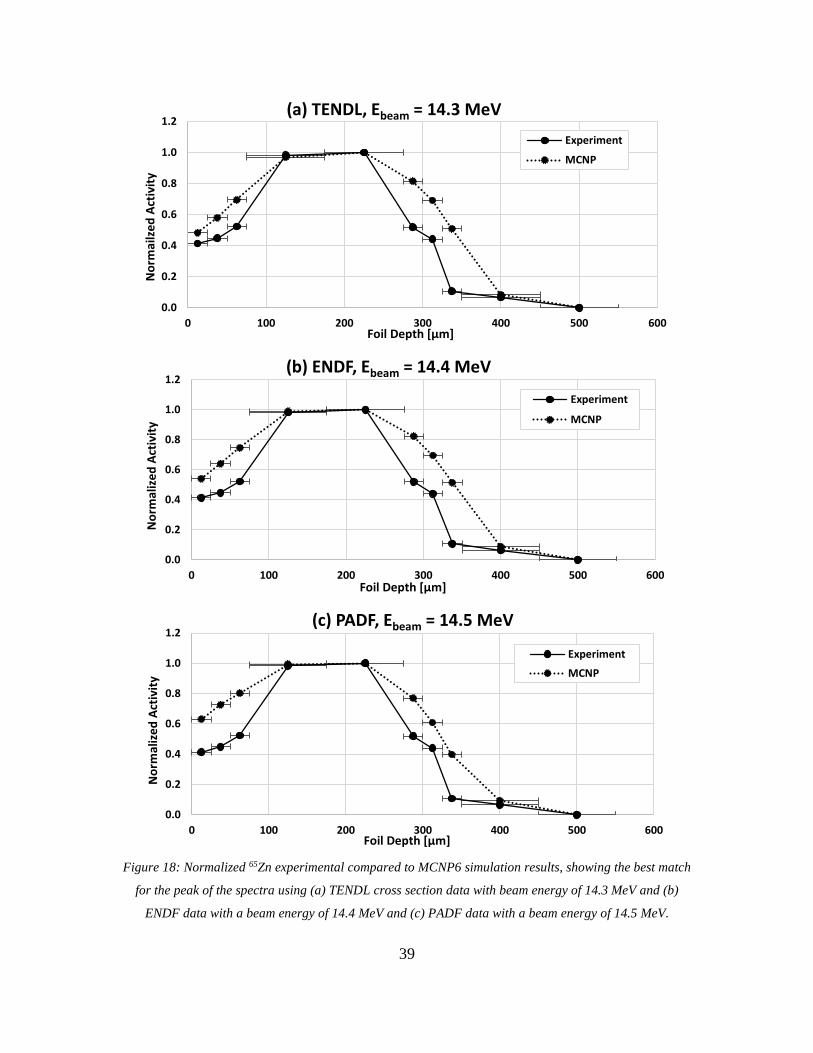
39
Figure 18: Normalized 65Zn experimental compared to MCNP6 simulation results, showing the best match
for the peak of the spectra using (a) TENDL cross section data with beam energy of 14.3 MeV and (b)
ENDF data with a beam energy of 14.4 MeV and (c) PADF data with a beam energy of 14.5 MeV.
0.0
0.2
0.4
0.6
0.8
1.0
1.2
0 100 200 300 400 500 600
Nor
mai
lzed
Act
ivity
Foil Depth [μm]
(a) TENDL, Ebeam = 14.3 MeV Experiment
MCNP
0.0
0.2
0.4
0.6
0.8
1.0
1.2
0 100 200 300 400 500 600
Nor
mal
ized
Act
ivity
Foil Depth [μm]
(b) ENDF, Ebeam = 14.4 MeV
Experiment
MCNP
0.0
0.2
0.4
0.6
0.8
1.0
1.2
0 100 200 300 400 500 600
Nor
mal
ized
Act
ivity
Foil Depth [μm]
(c) PADF, Ebeam = 14.5 MeV
Experiment
MCNP

40
The peak 𝜒𝜒2 analysis for 65Zn, which leads to Figure 17, only compared the two
peak foil values for the experimental compared to the simulation results. Rather than trying
to match the value for every foil, this analysis only calculated the 𝜒𝜒2 value based on
comparing the amount of 65Zn in the two foils with the peak values. Figure 18 demonstrates
that the given beam energies represent the data very well at the peak values and the last
two foils which are all 100 μm foils. Whereas for the other foils, which are 25 μm foils,
there is a consistent offset from the experimental values. These results agree more closely
with the 62Zn results and are in better agreement with the observed 62Zn and the energy
threshold for the reaction.
One possible reason for the misalignment with the 𝜒𝜒2 minimization results is that
the foils that represent the peak values for the experimental results were both 100 μm foils,
whereas the ones on either side are 25 μm foils. The 25 μm foil results (1-3 and 6-8) are
consistently lower compared to the simulated results while the 100 μm foil results (4, 5, 9,
and 10) match well. There is evidence to indicate that the 25 μm foils may have a correction
factor that has been neglected or miscalculated. One possible explanation for this
discrepancy is that the thin and thick foils have different relative contributions from hot
ion recoil from neighboring foils. The product nuclei (62Zn or 65Zn) can recoil from one
foil into another neighboring foil. This has a larger impact in thinner foils where the relative
amount of the product nuclei loss is increased. This phenomenon was not explored further
in this research, but it provides a possible explanation for the discrepancies between the 25
and 100 μm foils.
Overall, the 62Zn result indicate that the beam energy is 14.8 MeV. Considering the
peak analysis for the 65Zn results, the beam energy is most likely 14.4 MeV. The beam
energy of the cyclotron has therefore been determined to be 14.6 ± 0.2 MeV by averaging
the most representative two 62Zn results (TENDL, ENDF) and three 65Zn results (TENDL,
ENDF, PADF) and taking the standard deviation.
4.2 11C Production Simulation in MCNP6 Results
MURR 11C production was simulated in MCNP6 with ENDF, JENDL and
experimental cross section data obtained from JANIS [15]. Results using each of the cross

41
section libraries were tallied and compared. The initial tally values were given in reactions
per source particle per unit volume. The simulation was initially run with both a mono-
directional point source proton beam and then run with an updated beam energy and
intensity profile obtained from the analysis of the activated foil analysis.
The beam profile was determined based upon stacked foil radiographic images.
Figure 19 shows a histogram of the beam intensity profile. The beam intensity profile was
included in the final MCNP6 simulation using intensity bins.
Figure 19: Beam intensity profile obtained from the analysis of foil 1. (Left) shows the first foil
radiographic image and (right) shows the beam intensity profile that was produced from the left image.
To determine the effect of updating the beam definition, the simulation was run
with the original 16.4 MeV mono-directional point source and the updated 14.6 MeV beam
profile source. Table 1 shows the tally results for each set of cross section data with the
two source definitions.
Table 1: 11C production model results based for each set of cross section data and source definition.
The average difference between the old and updated source profile results was
approximately 15.8%. The simulated irradiation 14N gas conditions were based on nominal
density at a pressure of 165 psi and temperature of 20°C.
Cross-Section Data Source
16.4 MeV Mono-directional Point Beam Source � 𝑟𝑟𝐸𝐸
𝑂𝑂𝑟𝑟𝑐𝑐−𝑐𝑐𝑐𝑐3� 14.6 MeV Characterized
Beam Source � 𝑟𝑟𝐸𝐸𝑂𝑂𝑟𝑟𝑐𝑐−𝑐𝑐𝑐𝑐3�
Tabulated Experimental Library 1.36 × 10⁻² 1.14 × 10⁻²
ENDF 1.50 × 10⁻² 1.29 × 10⁻² JENDL 1.42 × 10⁻² 1.18 × 10⁻²

42
The tally output from the MCNP6 simulation was in reactions per source particle,
per volume. The results were then converted to mCi to compare the simulation results with
the experimental results using Equation 11. Equation 12 was used to convert the reaction
rate from the simulation tally to the time zero activity [21].
�̇�𝑅 = 𝑡𝑡𝑐𝑐𝐼𝐼𝑂𝑂𝑒𝑒𝑎𝑎𝑐𝑐1𝑄𝑄𝑝𝑝𝑉𝑉𝑡𝑡 (11)
𝜇𝜇0 = �̇�𝑅�1 − 𝑒𝑒−𝐶𝐶0𝑡𝑡� (12)
In Equations 11 and 12, �̇�𝑅 is the reaction rate, 𝑡𝑡𝑐𝑐 is the MCNP6 tally result, 𝐼𝐼𝑂𝑂𝑒𝑒𝑎𝑎𝑐𝑐
is the beam current, 𝑄𝑄𝐸𝐸 is the proton charge, 𝑉𝑉𝑡𝑡 is the target gas region volume, 𝜇𝜇0 is the
initial activity of 11C produced in the target, 𝜆𝜆0 is the 11C decay constant, and t is the
irradiation time. The irradiation time was taken from the experimental procedures in order
to replicate what was obtained in the experimental data to allow for comparison between
the values. The results were then normalized by irradiation time and beam current to obtain
an activity per unit charge. Table 2 shows the time-zero activity (A0) results of the 11C
production simulation.
Table 2: 11C production simulation results for each cross-section data set.
4.3 Ion Chamber and Experimental Validation Results
The amount of 11C produced with the MURR cyclotron was measured using an ion
chamber. Production cycles were run with 5 μA, 10 μA, 20 μA, 30 μA, and 40 μA beam
currents with an uncertainty ± 1 μA for each. Each production run was for 4.75 ± 0.25
min. After the irradiation was complete, the activity was obtained from the ion chamber
every 1 min for the first 10 min and every 5 min after that out to 45 min. Figure 20 displays
the natural log of the measured activity from the ion chamber measurements versus the
time for the 10 μA production cycle.
Cross-Section Data Source A0 [mCi/(μA-s)] Tabulated Experimental Library 1.67
ENDF 1.90 JENDL 1.73

43
Figure 20: 11C production ion chamber activity measurements. The dashed line is intended to guide the eye.
The natural log of radioisotope activity is expected to be linearly decreasing with
time, and the slope is equal to half-life of the radioisotope. As observed in the plot in Figure
20, the first data points do not follow the expected linear relationship. This is due to 11C
not being the only radioisotope that is produced during proton irradiation of 14N gas. In
addition to 11C, 13N, 14O, and 15O are also produced.
Of the radioisotopes that are produced, 11C is the longest-lived with a half-life of
20.334 min. 13N has a half-life of 9.965 min, 14O has a half-life of 122.24 s, and 15O has a
half-life of 70.598 s. The Ascarite chemical trap in the ion chamber collects 11C in the form
of CO2 very effectively with an efficiency of approximately 99.9%. 14O and 15O are also
collected in the trap in the CO2. 13N is not collected as efficiently. In order to only account
for the activity produced by the 11C, only the data beginning at 20 min was used in the
production analysis. By 20 min, the 15O and 14O have decayed through roughly 10 and 20
half-lives, respectively, which means that they are effectively absent from the data. The 13N has decayed through roughly two half-lives. Given that it also was not collected as
effectively by the ion chamber trap, its effects on the measured activity are minimized.
To demonstrate the effect of only using the data after 20 min, an analysis was done
on the half-life calculated for the data sets for each of the beam currents. The results of the
2.5
3.0
3.5
4.0
4.5
5.0
0 10 20 30 40 50
Ln(A
[mCi
])
Time (min)

44
half-life calculations are shown in Table 3 comparing calculations done with all the data
versus only the data after 20 min.
Table 3: Half-life calculations for 11C results for each beam current data set, comparing
calculations used with all the results versus the corrected data sets using results from 20-45 min.
In Table 3, the values in parentheses are the proportion between the calculated 11C
half-lives and the actual half-life. These results demonstrate the effectiveness of amending
the data sets to only include the measurements after 20 min. These results also demonstrate
that the higher beam currents require additional time post-irradiation for the other
contaminant radioisotopes to decay away as more total contaminate radioisotopes are
produced at higher beam currents. Overall these results indicate that it would have been
beneficial to take measurements for longer than 45 min post-irradiation, particularly at the
higher beam currents. However, even with the given results, the corrected data set half-life
calculations improve the half-life calculations by 6-10% and indicates that the activity
measured between 20-45min is approximately equal to the amount of 11C that is present
with minimal contaminant radioisotopes.
The 11C results for each beam current from 20-45 min after the end of irradiation
was used to determine the time-zero activity of the 11C. The results from each beam current
data set were normalized by μA of beam current and by time of irradiation. The normalized
results for 20-45 min were then averaged for each data set. Figure 21 shows these 11C
activity per unit charge produced at different beam currents.

45
Figure 21: 11C production ion chamber measurements. The results are shown for each beam current data
set normalized by μA of beam current and by time (5 min).
It is important to note that the beam current and its uncertainty is accounted for in
both the x and y components; however, this representation of the results was the best option
for comparing the normalized production with respect to beam current to highlight the
effect of gas density reduction. The uncertainty in beam current is approximately ±1 μA
which means that at 5 μA the relative uncertainty is large and decreases as the beam current
increases. Additional uncertainty in the normalized activity is primarily from the
uncertainty in target irradiation time.
Figure 22 demonstrates that the amount of 11C produced per unit charge decreases
as the beam current increases. Although more total 11C is produced at higher beam currents,
the production is less efficient. This is likely due to gas density reduction effects. It is also
important to note that the loss of efficiency has a large effect at first between approximately
5 to 20 μA and then appears to plateau after that. Between roughly 20 and 40 μA the
production efficiency remains approximately the same and differences are within
measurement uncertainty.
The ion chamber measurement results were also used to experimentally validate the 11C production simulation. Table 4 shows the normalized experimental results for 5 μA
beam current compared to the normalized 11C production simulation results using data from
each cross section library.
0.035
0.029
0.0200.016 0.018
0
0.01
0.02
0.03
0.04
0.05
0 10 20 30 40 50
Nor
mal
ized
A0
[mCi
/μA-
s]
Beam Current [μA]
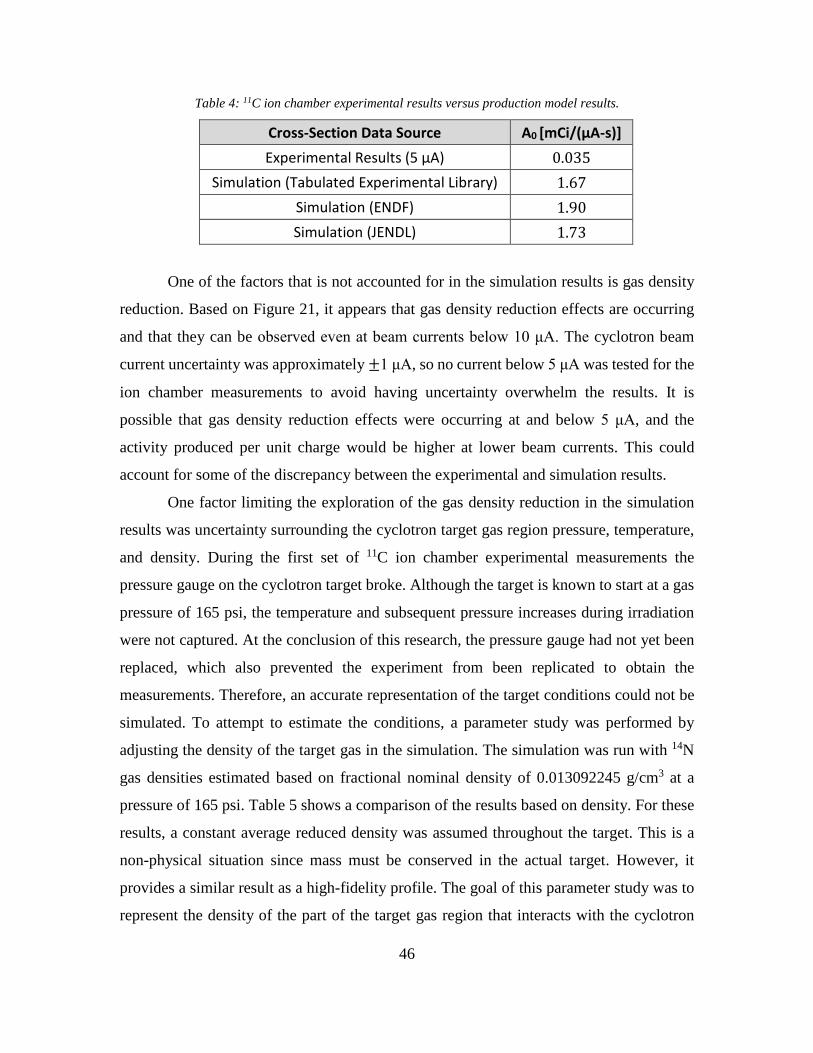
46
Table 4: 11C ion chamber experimental results versus production model results.
One of the factors that is not accounted for in the simulation results is gas density
reduction. Based on Figure 21, it appears that gas density reduction effects are occurring
and that they can be observed even at beam currents below 10 μA. The cyclotron beam
current uncertainty was approximately ±1 μA, so no current below 5 μA was tested for the
ion chamber measurements to avoid having uncertainty overwhelm the results. It is
possible that gas density reduction effects were occurring at and below 5 μA, and the
activity produced per unit charge would be higher at lower beam currents. This could
account for some of the discrepancy between the experimental and simulation results.
One factor limiting the exploration of the gas density reduction in the simulation
results was uncertainty surrounding the cyclotron target gas region pressure, temperature,
and density. During the first set of 11C ion chamber experimental measurements the
pressure gauge on the cyclotron target broke. Although the target is known to start at a gas
pressure of 165 psi, the temperature and subsequent pressure increases during irradiation
were not captured. At the conclusion of this research, the pressure gauge had not yet been
replaced, which also prevented the experiment from been replicated to obtain the
measurements. Therefore, an accurate representation of the target conditions could not be
simulated. To attempt to estimate the conditions, a parameter study was performed by
adjusting the density of the target gas in the simulation. The simulation was run with 14N
gas densities estimated based on fractional nominal density of 0.013092245 g/cm3 at a
pressure of 165 psi. Table 5 shows a comparison of the results based on density. For these
results, a constant average reduced density was assumed throughout the target. This is a
non-physical situation since mass must be conserved in the actual target. However, it
provides a similar result as a high-fidelity profile. The goal of this parameter study was to
represent the density of the part of the target gas region that interacts with the cyclotron
Cross-Section Data Source A0 [mCi/(μA-s)] Experimental Results (5 μA) 0.035
Simulation (Tabulated Experimental Library) 1.67 Simulation (ENDF) 1.90 Simulation (JENDL) 1.73

47
beam. In the actual target, the density of the gas interacting with the beam will decrease
and the density of the gas that is not interacting with the beam will increase. The regions
of higher density are not interacting with the beam and can be ignored for this simulation.
Table 5: Comparison of A0 simulated results based on temperature and corresponding density, and
pressure of 11C production target gas.
Simulation Cross Section Data
Source
A0 �𝒎𝒎𝒎𝒎𝒎𝒎𝝁𝝁𝝁𝝁−𝒔𝒔
� 𝝆𝝆 = 𝝆𝝆𝟎𝟎
A0 �𝒎𝒎𝒎𝒎𝒎𝒎𝝁𝝁𝝁𝝁−𝒔𝒔
� 𝝆𝝆 = 𝟏𝟏 𝟐𝟐⁄ 𝝆𝝆𝟎𝟎
A0 �𝒎𝒎𝒎𝒎𝒎𝒎𝝁𝝁𝝁𝝁−𝒔𝒔
� 𝝆𝝆 = 𝟏𝟏 𝟒𝟒⁄ 𝝆𝝆𝟎𝟎
A0 �𝒎𝒎𝒎𝒎𝒎𝒎𝝁𝝁𝝁𝝁−𝒔𝒔
� 𝝆𝝆 = 𝟏𝟏 𝟓𝟓⁄ 𝝆𝝆𝟎𝟎
A0 �𝒎𝒎𝒎𝒎𝒎𝒎𝝁𝝁𝝁𝝁−𝒔𝒔
� 𝝆𝝆 = 𝟏𝟏 𝟏𝟏𝟎𝟎⁄ 𝝆𝝆𝟎𝟎
Experimental Data 1.67 × 100 1.22 × 10⁻¹ 7.29 × 10⁻² 6.19 × 10⁻² 5.26 × 10⁻²
ENDF 1.90 × 100 1.43 × 10⁻¹ 8.56 × 10⁻² 7.02 × 10⁻² 4.99 × 10⁻²
JENDL 1.73 × 100 1.26 × 10⁻¹ 7.45 × 10⁻² 6.49 × 10⁻² 5.54 × 10⁻²
As shown in Table 4, the experimental results at 5 μA were 3.5 × 10⁻² mCi/(μA-
s). The A0 values at 1 10⁄ 𝜌𝜌0 represent the closest agreement with the experimental results
and provide the best representation of the MURR 11C production.
4.4 11C Production Target Optimization Results
To analyze the production of 11C within the target, a “FMESH” cylindrical mesh
control card was added in the gaseous region of the target. The mesh tally measured the
flux in each mesh location. The objective of using a mesh tally was to observe beam
spreading within the target gas region and determine whether the beam spreads out to the
point where it interacts with the target walls. Additionally, the mesh tally allows for the
determination of whether the 165 psi nitrogen gas acts as a “thick” target and fully stops
the beam within the gas volume.
The results from the mesh tally are shown in Figure 22 and they indicate that the
beam does interact with the sides of the target which means that 11C production efficiency
is reduced.

48
Figure 22: Mesh tally plot for the flux produced in the 11C simulation based on radius and z position in
target gas region. Target wall is located at approximately 1.16 cm. The “Distance from Src [cm]”
indicates the location along the length of the target with respect to the window where the beam enters.
When the beam begins interacting with the target wall at approximately 1.16 cm,
the flux drops off more quickly. This is the expected result since the target walls are solid
aluminum. If the target were redesigned in order to accommodate the beam-spreading, then
the efficiency of production would be improved. 11C is not produced by proton interaction
with Al. Although there is a flux produced in the target walls by proton beam interaction,
there is not 11C produced within the walls of the target in the simulation which confirms
that that aspect of the code is working as expected.
Table 6 shows the fraction of proton beam energy that interacts with the 14N gas
versus the fraction that interacts with the sides of the production target at different gas
densities with respect to nominal gas density at 165 psi.
Table 6: The particle flux above the 14N(p,α)11C reaction threshold at varying density relative to nominal
density that interacts with the 14N gas versus the amount that interacts with the target walls.
Interaction Region Flux % 𝝆𝝆 = 𝝆𝝆𝟎𝟎
Flux % 𝝆𝝆 = 𝟏𝟏 𝟐𝟐⁄ 𝝆𝝆𝟎𝟎
Flux % 𝝆𝝆 = 𝟏𝟏 𝟒𝟒⁄ 𝝆𝝆𝟎𝟎
Flux % 𝝆𝝆 = 𝟏𝟏 𝟓𝟓⁄ 𝝆𝝆𝟎𝟎
Flux % 𝝆𝝆 = 𝟏𝟏 𝟏𝟏𝟎𝟎⁄ 𝝆𝝆𝟎𝟎
Gas 99.9% 99.24% 90.18% 90.17% 90.16%
Target walls 0.1% 0.76% 9.82% 9.83% 9.84%

49
The values obtained in Table 6 were found by summing the flux values for all of
the mesh tally locations. Next, the mesh locations were separated into the locations within
the gas region of the target and the locations within the target walls. The flux values for
each region were summed and the relative amount of the total in each region is reported.
Table 6 demonstrates that although the beam interacts with the target walls, the percentage
of the flux that is lost in this way is small compared to the amount that interacts within the
gas at higher density. As the density of the target fill gas decreases, the flux fraction that
interacts within the target walls increases to roughly 10% at the lowest density values.
Based on Table 5, the lowest gas density gives results that are the closest to experimental
results. This indicates that the flux efficiency fraction for
1 10⁄ 𝜌𝜌0 is the most likely and therefore, approximately 10% of the flux is lost to the walls
of the target. Another concern associated with the proton beam interacting with the walls
is that this can negatively impact the specific activity of the 11C that is produced. Specific
activity refers to the relative amount of one isotope to another and is an important quality
factor that is used with radioisotopes. The proton beam interacting with the walls of the
target can result in other isotopes being produced and detrimentally affect the 11C specific
activity. Additional research could be used to explore the impact of redesigning the target
to combat this situation.

50
V. Conclusions
5.1 Summary
This research provides an experimental and computational proof-of-concept for 11C
production at MURR. Previous research had demonstrated that stacked foil activation can
be used to measure cyclotron beam energy, and radiography could be used to characterize
the beam profile. However, these characterization techniques had not been performed for
the cyclotron at MURR previously, nor had a model of the production targets been
developed. This research improved the ability to model MURR radioisotope production
process using MCNP6 to highlight potential areas for target and efficiency improvements
in future research.
The proton beam energy was characterized using a stacked foil technique and
MCNP6 simulations with ENDF, TENDL, JENDL, and PADF evaluated nuclear data sets.
The beam energy was found to be 14.6 ± 0.2 MeV. Additionally, the cyclotron beam was
further analyzed through phosphor plate radiography of the cyclotron activated foils. The
cyclotron beam profile and intensity were obtained from the radiographic images.
The beam energy, profile, and intensity were then used in the 11C production
simulation to model the amount of 11C produced during a MURR production cycle. Ion
chamber measurements were obtained and compared to the simulation results in order to
experimentally validate the simulation. The 11C production experimental results indicated
that the time-zero activity of 11C at a 5 μA beam current is 0.035 mCi/(μA-s). The
simulation results for time-zero activity using the constant average density associated with
1/10 nominal density and experimentally determined cross section data was 5.26 × 10⁻²
mCi/(μA-s), 4.99 × 10⁻² mCi/(μA-s) using ENDF cross section data, and 5.54 × 10⁻²
mCi/(μA-s) using PADF cross section data.
5.2 Simulation Capabilities and Limitations
The 11C production simulation from this project is capable of predicting the amount
of 11C that is produced under ideal irradiation conditions. The simulation utilizes an
accurate model of the beam energy, profile, and intensity. Additionally, multiple nuclear

51
cross section data models for the 14N(p,α)11C reaction were incorporated to model the
amount of 11C produced.
However, there are several limitations associated with the model that should be
stated. During cyclotron irradiation the pressure of the gas in the radioisotope production
targets increases due to the heat produced by the beam. The pressure that the target gas
reached during irradiation could not be measured due to equipment malfunction, and this
factor was not incorporated into the model. Similarly, gas density reduction was not
characterized or incorporated. Therefore, the production simulation was limited in its
absolute accuracy since the accurate pressure, temperature, and density of the experimental
measurements were unknown.
An additional limitation associated with this project was the cyclotron has relatively
large uncertainties associated with the irradiation timing and beam current. As a result, the
experimental data has a large uncertainty at short irradiation times and low beam currents,
which happens to be the ideal conditions to minimize gas density reduction effects. Despite
the greater than ideal uncertainty, this research progressed the overall understanding of the
MURR cyclotron and radioisotope production.
5.3 Recommendations for Future Research
This project improved the understanding of the MURR cyclotron and radioisotope
production. The scope of this research provided an innovative method of integrating
experimental and computational methodology to analyze the cyclotron at MURR and the
associated production of the radioisotope 11C. The primary achievements of this project
are:
• Measurement of the MURR cyclotron proton beam energy
• Characterization of the beam profile and intensity
• Development of a 11C production target simulation
• Analysis of ion chamber measurements to experimentally benchmark the
model and explore gas density reduction for 11C production
• Identification of preliminary target design inefficiencies for 11C production

52
There are additional aspects of the cyclotron and other radioisotope production
cycles that could be analyzed which would continue to increase overall understanding of
the system. Potential follow-on research includes:
• Conduct additional optimization research of the MURR 11C production target to
include specific suggestions for improvement. Adjustments to the target could be
simulated to demonstrate increased efficiency in order to make specific
suggestions for improvements to the target.
• Incorporate the gas density reduction effects in the 11C production simulation that
were determined to be present during radioisotope production with this target.
• Phosphor imaging with sufficient resolution to capture the natural angular
divergence of the cyclotron beam.
• Extend this research to the MURR cyclotron deuteron beam: Measure the precise
energy of the MURR cyclotron deuteron beam. Similar methodology could be
used but it would require a separate analysis of the ideal stacked foil material and
arrangement that could be used. Conduct phosphor plate radiographic imaging of
the deuteron beam irradiated foils could be used to analyze the beam shape and
intensity. Simulate MURR 13N production via the 12C(d,n)13N reaction. This would
include modeling the production target and experimentally validating the model.
Perform an optimization analysis of the MURR 13N production target using the 13N
production model.

53
Appendix A. MURR HPGe Specifications

54

55
Appendix B. 11C Production Target Schematics
Full Target Diagram with Specification Chart
Rear Gas Flange

56
11C Target Body
Helium Cooling Flange
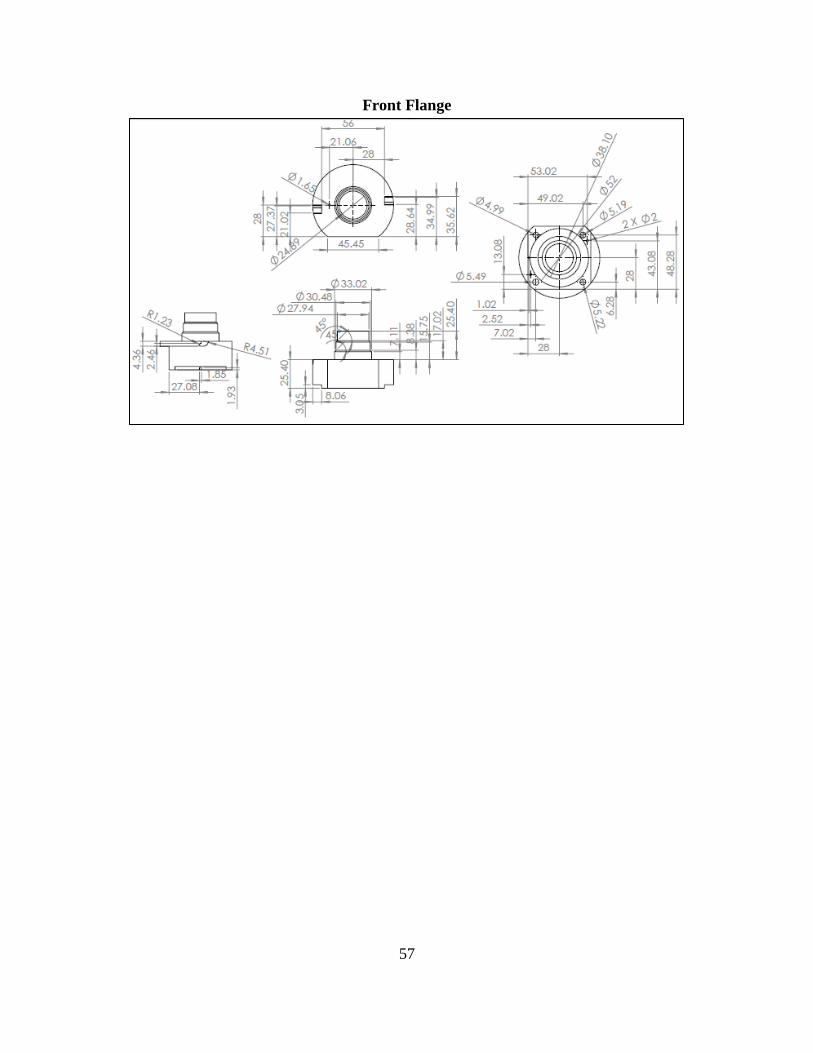
57
Front Flange

58
Appendix C. GitHub Repository
The simulation input files and Python codes for this research described above are
provided in a private online repository on GitHub at the following location:
https://github.com/Bevins-Research-Group/N13_Project/Research_Models. For access
to this repository, please contact the author.
The Research Models directory contains the following sub-directories:
• Activation Foils: This subdirectory contains the stacked foil activation simulation
and a solid angle calculator for foils.
• 11C Production Model: This subdirectory contains the final 11C production
simulation for this research and the previous version which contains the original
proton beam characterization.
• Mesh Tally Analysis: This subdirectory contains the final 11C production
simulation including the mesh tally and two MATLAB codes that read the outputs
of the mesh tally.
• Additional Files: This subdirectory contains TENDL cross section information
for isotopes included in the 11C production simulations.

59
Bibliography
[1] American Nuclear Society Medical Use of Radioisotopes Center for Nuclear Science and Technology Information, 2014.
[2] Gómez, Sara, et al. “Methyl Jasmonate Elicits Rapid Changes in Carbon and Nitrogen Dynamics in Tomato.” New Phytologist, vol. 188, no. 3, 2010, pp. 835–844., doi:10.1111/j.1469-8137.2010.03414.x.
[3] Dewey, Sl, et al. “GABAergic Inhibition of Endogenous Dopamine Release Measured in Vivo with 11C-Raclopride and Positron Emission Tomography.” The Journal of Neuroscience, vol. 12, no. 10, 1992, pp. 3773–3780., doi:10.1523/jneurosci.12-10-03773.1992.
[4] Jeffries, Bradley Characterization of Fast Neutron Irradiation Positions at a 16.5 MeV PET-Trace Cyclotron Missouri University Research Reactor, 1513 Research Park Drive, Columbia, Missouri 65211.
[5] “Richard Ferrieri Biography.” Richard Ferrieri – University of Missouri (MURR) Chemistry, 2018, https://chemistry.missouri.edu/people/ferrieri
[6] Jeffrey E. Williams. Donner Laboratory: The Birthplace of Nuclear Medicine. Journal of Nuclear Medicine, 1 January 1999, jnm.snmjournals.org/content/40/1/16N.citation.
[7] Health Effects of Project SHAD Chemical Agent: Phosphorous-32. The Center for Research Information, Inc., 2004, Health Effects of Project SHAD Chemical Agent: Phosphorous-32, www.nationalacademies.org/hmd/~/media/Files/Report%20Files/2007/Long-Term-Health-Effects-of-Participation-in-Project-SHAD-Shipboard-Hazard-and-Defense/PHOSPHORUS32.pdf.
[8] Tollefson, Jeff. Reactor Shutdown Threatens World's Medical-Isotope Supply. Nature News, Nature Publishing Group, 12 September 2016, www.nature.com/news/reactor-shutdown-threatens-world-s-medical-isotope-supply-1.20577.
[9] Pankievicz, Vânia C. S., et al. “Robust Biological Nitrogen Fixation in a Model Grass-Bacterial Association.” The Plant Journal, vol. 81, no. 6, 2015, pp. 907–919., doi:10.1111/tpj.12777.
[10] Los Alamos National Laboratory, “LA-CP-13-00634: MCNP6 User's Manual,” May 2013.
[11] TALYS-Based Evaluated Nuclear Data Library. TENDL-2015 Nuclear Data Library https://tendl.web.psi.ch/tendl2015/tendl2015.html

60
[12] “JENDL-4.0.” Nuclear Data Center - Japan Atomic Energy Center, 2014, wwwndc.jaea.go.jp/jendl/j40/j40.html.
[13] “The Proton Activation Data File PADF-2007 in ENDF-6 Format.” IAEA Nuclear Data Services, 2007, www-nds.iaea.org/padf/.
[14] “Evaluated Nuclear Data File (ENDF).” IAEA Nuclear Data Services, www-nds.iaea.org/exfor/endf.htm.
[15] “JANIS.” Executive Summary -Chernobyl: Assessment of Radiological and Health Impact, Nuclear Energy Agency (NEA), www.oecd-nea.org/janisweb/.
[16] Kopecký, Petr. “Proton Beam Monitoring via the Cu(p, x)58Co, 63Cu(p, 2n)62Zn and 65Cu(p, n) 65Zn Reactions in Copper.” The International Journal of Applied Radiation and Isotopes, vol. 36, no. 8, 1985, pp. 657–661., doi:10.1016/0020-708x(85)90008-0.
[17] Burrage, J. W., et al. “A Simple Method to Measure Proton Beam Energy in a Standard Medical Cyclotron.” Australasian Physics & Engineering Sciences in Medicine, vol. 32, no. 2, 2009, pp. 92–97., doi:10.1007/bf03178634.
[18] Khandaker, Mayeen Uddin, et al. “1. Investigations of Proton Beam Energy of the MC-50 Cyclotron at KIRAMS.” International Journal of Physical Sciences, vol. 6, no. 13, 31 July 2011, pp. 3168–317., doi:76248E821725.
[19] “Cyclotron Produced Radionuclides: Operation and Maintenance of Gas and Liquid Targets.” IAEA Radioisotopes and Radiopharmaceuticals Series Publications, Ch. 5, International Atomic Energy Agency, 2012, www-pub.iaea.org/MTCD/Publications/PDF /Pub1563_web.pdf.
[20] Ferrieri, Richard A., et al. “Use of Carbon-11 in Populus Shows That Exogenous Jasmonic Acid Increases Biosynthesis of Isoprene from Recently Fixed Carbon.” Plant, Cell and Environment, vol. 28, no. 5, 2005, pp. 591–602., doi:10.1111/j.1365-3040.2004.01303.x.
[21] Krane, Kenneth S. Introductory Nuclear Physics. Wiley, 1988.
[22] Takács, S., et al. “Validation and Upgrading of the Recommended Cross Section Data of Charged Particle Monitor Reactions.” Nd2007, 2007, doi:10.1051/ndata:07349.
[23] Ingalls, P. D., et al. “14N(p,Alpha) Cross Sections from 3.8 to 6.4 MeV.” Physical Review, vol. 13, Feb. 1976. Nuclear Physics, doi:J,PR/C,13,524,197602.20
[24] Canberra Industries, Inc. Genie™ 2000 Spectroscopy Software Operations. Genie™ 2000 Spectroscopy Software Operations, 2006.

61
[25] General Electric (GE) Company. Phosphor Imaging Plates - Computed Radiography. Phosphor Imaging Plates - Computed Radiography, 2010.
[26] Radiation Detection and Measurement, by Glenn F. Knoll, 4th ed., John Wiley & Sons, Inc., 2010, pp. 131–158.
[27] “Scipy.stats.ks_2samp.” Scipy.stats.trim_mean - SciPy v1.1.0 Reference Guide, Scipy.org, docs.scipy.org/doc/scipy/reference/generated/scipy.stats.ks_2samp.html.
[28] “Scipy.stats.chisquare.” SciPy v1.1.0 Reference Guide, docs.scipy.org/doc/scipy/reference/generated/scipy.stats.chisquare.html.
[29] General Electric (GE). “PETtrace 800 Cyclotron Series Data Sheet.” GE Healthcare, www3.gehealthcare.com/~/media/downloads/us/product/product-categories/moleculer%20imaging/pet%20radiopharmacy/cyclotrons/pt800%20cyclotron%20system%20data%20sheet%20rev3.pdf?Parent=%7B442067E1-C933-4B8E-8D5B-1DBC294ECE21%7D.
[30] “Relationship between Density, Pressure, and Temperature.” Chapter 1. Stony Brook University. http://msrc.sunysb.edu/~chang/atm205/Notes/Chapter_1_txtb.pdf.
[31] Nam, S.k., and K.b. Kim. “Transverse Profile Measurement of Proton Beam Using the Beam Induced Fluorescence Monitor in KIRAMS-13 Cyclotron.” Journal of the Korean Vacuum Society, vol. 18, no. 6, 2009, pp. 418–425., doi:10.5757/jkvs.2009.18.6.418.
[32] “Hypothesis Testing and Model-Fitting.” Swinburne Astronomy Online. http://astronomy.swin.edu.au/~cblake/StatsLecture3.pdf.
[33] Schlyer, David J. “Heat Transfer in Cyclotron Targets.” Brookhaven Science Associates U.S. Department of Energy.
[34] Q-Value Calculator (QCalc), www.nndc.bnl.gov/qcalc/.